Article

Synergistic Effects of Pea Protein on the Viscoelastic Properties of Sodium Alginate Gels: Findings from Fourier Transform Infrared and Large-Amplitude Oscillatory Shear Analysis

by
Won Byong Yoon
1,2,
Hwabin Jung
1,2 and
Timilehin Martins Oyinloye
1,2,*
1
Department of Food Science and Biotechnology, College of Agriculture and Life Sciences, Kangwon National University, Chuncheon 24341, Gangwon, Republic of Korea
2
Elder-Friendly Food Research Center, Agriculture and Life Science Research Institute, Kangwon National University, Chuncheon 24341, Gangwon, Republic of Korea
*
Author to whom correspondence should be addressed.
Processes 2024, 12(8), 1638; https://doi.org/10.3390/pr12081638
Submission received: 19 June 2024 / Revised: 29 July 2024 / Accepted: 1 August 2024 / Published: 3 August 2024
(This article belongs to the Special Issue Feature Papers in the "Food Process Engineering" Section)

Abstract

:
The rheological characteristics of pea protein (PP100%) and alginate (AG100%) as pure and mixed gels with different levels of pea protein (AP90:10, AP80:20, and AP70:30) were investigated via large-amplitude oscillatory shear (LAOS) and Fourier transform infrared (FTIR). Small-angle oscillatory shear (SAOS) was carried out for the samples, and a slight frequency dependence of the storage modulus (G′) and the loss modulus (G″) was observed for the pastes and gels, indicating the formation of a weak network, which is crucial for understanding the gel’s mechanical stability under small levels of deformation. Elastic and viscous Lissajous curves from the LAOS measurement at different levels of strain (1 to 1000%) elucidated that the mixed gels formed a strong network, which showed breakdown at high deformation (>100% strain). The synergistic strengthening of the network of the mixture was noticeable in the Fourier transform and Chevyshev harmonic analyses. This analysis indicated that the nonlinearity of e3/e1 and v3/v1 started at higher levels of strain for the mixed gels. The FTIR spectra revealed that there was no strong interconnection by crosslinking between pea protein and sodium alginate, indicating that the synergistic effect mainly came from electrostatic interactions. These findings suggest that combining alginate with pea protein can enhance the mechanical properties of gels, making them suitable for various food applications.

1. Introduction

The demand for protein globally is anticipated to increase significantly in the upcoming years due to the growing population, which is expected to reach approximately 9.7 billion by 2050 [1]. At present, approximately one billion people worldwide lack access to a diet with adequate protein and energy [2]. To meet this demand, efforts are being made to boost the production of high-quality, functional, affordable, and sustainable protein sources, which can serve as partial substitutes for animal-derived proteins. Plant-based proteins, including pea, soy, and wheat proteins, are emerging as promising alternatives, supported by numerous recent studies highlighting their nutritional benefits and functionality. These benefits include being rich in essential amino acids, low in saturated fats, and free from cholesterol. Additionally, they have been shown to support muscle growth, aid in weight management, and reduce the risk of chronic diseases [3,4,5,6].
Pea proteins stand out among the plant-based proteins as a consumer-friendly alternative due to the extensive cultivation and consumption of peas globally [7]. These proteins are effective replacements for allergenic and animal-derived ingredients. Researchers have focused on pea proteins for their utility in forming emulsions and gels, which interact beneficially with other food components such as polysaccharides, including sodium alginate and starch. This is attributed to their low gelation temperature, ease of expansion, strong moisture absorption, excellent processability, and high moisture retention capabilities [8]. These properties make pea protein gels and emulsions suitable for a variety of food products, including plant-based meat substitutes, dairy-free yogurts, and protein bars [3,5].
Pea protein and sodium alginate mixtures have gained interest due to their application to form a gel with the ability to retain their proper shape. Sodium alginate is a naturally occurring linear anionic copolymer, consisting of 1,4-linked α-L guluronic (G-block) and β-D mannuronic acid (M-block) residues [9]. The carboxyl groups (-COO) in sodium alginate rapidly interact electrostatically with cations under mild conditions, forming a robust gel characterized by egg-box-like structures [9]. The gelation of a pea protein and sodium alginate mixture occurs through the addition of bivalent cations (Ca2+). This process involves denaturation of the protein and dimerization of the alginate by Ca2+, as well as electrostatic interactions between pea protein and sodium alginate [10,11]. This mechanism allows for the creation of pea protein–alginate gels using various gelling methods, such as double-network hydrogels formed with enzymes and ions [12], and cold-set gels [10]. Notably, mixtures of pea protein and alginate solutions with ions can be used as materials for 3D printing and as meat substitutes [11,13]. This application holds significant relevance in the food industry, as it can be engineered to mimic the texture and mouthfeel of meat, providing a compelling option for vegetarians, vegans, and those looking to reduce meat consumption for health or environmental reasons. Additionally, these blends are utilized in creating customized nutritional profiles and aesthetically appealing shapes through 3D printing technology. This allows us to produce intricate food designs that are difficult to achieve with traditional methods, enhancing both the visual and textural appeal of plant-based meat products.
When proteins and polysaccharides coexist in the same system, they can engage in intermolecular interactions. These interactions influence the macroscopic and functional characteristics of food, such as its rheological properties (i.e., viscosity, elasticity, and flow behavior) [14,15]. The structure and properties of the resulting products are typically determined by phase separation and/or the formation of protein networks [16]. For example, these interactions can enhance the creaminess and mouthfeel of dairy alternatives and improve the gel strength and elasticity of meat substitutes. Therefore, studying the interactions between proteins and polysaccharides, and the conditions that affect their phase behavior offers opportunities for product diversification.
Traditionally, the rheological properties of food gels have been measured using small-amplitude oscillatory shear (SAOS) tests within the linear regime. This method provides a solid theoretical foundation for accurately analyzing the materials’ rheological behavior by observing changes in the storage (G′) and loss (G″) modulus. However, SAOS tests are limited in capturing the nonlinear rheological behaviors that often occur during food processing and chewing. To address this, large-amplitude oscillatory shear (LAOS) tests have become increasingly popular for studying these nonlinear behaviors and structural changes in food materials. Foods often consist of complex ingredients, leading to different behaviors in their nonlinear viscoelastic properties, even if they appear to be similar in the linear viscoelastic region. For instance, Fourier transform rheology (FT rheology) analysis of LAOS data has proven more sensitive than linear viscoelastic data for detecting intricate and specific structures, such as fibrillar networks, microphase separated domains in block copolymers, and network structures in biopolymer mixtures [17]. Consequently, the LAOS method is more effective than SAOS for understanding subtle microstructural differences and distinguishing fragile interactions. In LAOS, various mathematical methods are used to characterize the distorted response curves (stress or strain), with Lissajous curves and Chebyshev coefficients being commonly applied for their sensitivity, visualization, and physical explanation [18,19].
Therefore, this study aimed to investigate the frequency dependence of the G′ and G″ using SAOS measurements to assess the networks’ strength and analyze the nonlinear rheological properties with LAOS to evaluate the development of networks in mixed gels compared with pure alginate and pea protein gels. Additionally, the study aimed to calculate harmonics and Chebyshev coefficients to identify strain stiffening and shear thickening behaviors, particularly with a higher pea protein content. Furthermore, Fourier transform infrared (FTIR) spectroscopy was used to detect characteristic peaks of pure components within the mixed gels, identifying the weak noncovalent interactions contributing to enhanced gel elasticity. The study’s findings provide insights for practical applications in processes such as mixing, extrusion, and 3D printing by understanding the rheological properties and interactions between pea protein and sodium alginate.

2. Materials and Methods

2.1. Sample Preparation

Commercially available dehydrated pea protein powder with a moisture content of 9.87%, an ash content of 4.98%, a fat content of 1.36%, and a crude protein content of 82% (Food Inc. Ltd., Shanghai, China), along with sodium alginate powder (purity > 99%, Bright Moon Seaweed Group Co., Ltd., Qingdao, China) and calcium chloride (Hannaeum Co., Ltd., Asan, Republic of Korea), were used to prepare the gels. Alginate solutions form a gel at room temperature upon cooling [20], whereas the gelation of pea protein begins at approximately 45 °C upon heating, as determined from preliminary experiments. Therefore, regulating the gelation rate of alginate was necessary. The gelation rate of alginate and calcium ions was controlled using sodium phosphate (Daejung Chemicals and Metals Co., Ltd., Siheung-si, Republic of Korea), based on the method described by Oyinloye and Yoon [11]. Five different pastes, composed of pure pea protein, pure alginate, and their mixtures, were prepared. The formulation ratios, provided in Table 1 and Table 2, were chosen to systematically investigate the impact of varying concentrations of pea protein on the rheological properties and gel network structure of alginate. To prevent the alginate from gelling prematurely, the pure and mixed pastes were maintained at 45 °C in a thermostatic water bath until further analysis [11].

2.2. Small-Amplitude Oscillation Shear Measurements

The rheological experiments were performed using a Discovery Hybrid Rheometer HR-3 (TA Instruments Inc., New Castle, DE, USA) with a geometry of a parallel plate with a 40 mm diameter. To prevent the sample’s slippage, coarse-grit (50 grit) sandpaper was attached to both the parallel plate and the Peltier plate. The five different pastes, consisting of pure pea protein, pure alginate, and their mixtures, were placed between the plates at 25 °C with a 1 mm gap. The temperature of the pastes was equilibrated for 5 min, then they were heated to 85 °C and subsequently cooled to 25 °C at a rate of 2 °C per minute. After equilibration at 25 °C for another 5 min, the experiments were conducted according to the method described in [11]. A solvent trap was used to prevent water evaporating during the measurements. Strain sweeps were performed in the range of 0.1 to 1000% at a frequency of 1 Hz to determine the linear viscoelastic region (LVR) for the gels. Frequency sweeps was also conducted in the range of 0.1 to 100 Hz at a strain amplitude of 1% to investigate the frequency dependence of the mixed pea protein and sodium alginate gels with different mixing ratios, ensuring the strain amplitude was within the LVR.

2.3. Large-Amplitude Oscillatory Shear Measurements

2.3.1. Experimental Procedure of LAOS

Strain sweeps for the LAOS analysis were carried out at a strain amplitude ranging from 1% to 1000% at a frequency of 1 Hz, maintaining a temperature of 25 °C. All obtained waveform data were analyzed to obtain the Lissajous curves and Chebyshev coefficients using the MITlaos program (MITlaos beta).

2.3.2. Processing LAOS Data

Fourier transform (FT) rheology is widely used for quantifying LAOS, representing stress response to sinusoidal strain input through Fourier series in two forms: elastic and viscous scaling. These series are articulated as follows:
σ t ; ω , γ 0 = γ 0 n : o d d { G n ω , γ 0 sin n ω t + G n ω , γ 0 cos n ω t }   ,
σ t ; ω , γ 0 = γ ˙ 0 n : o d d { η n ω , γ 0 sin n ω t + η n ω , γ 0 cos n ω t }   ,
where ω denotes the imposed oscillation frequency; γ 0 represents the amplitude of strain, γ ˙ 0 represents the resulting strain rate; t indicates the time, G n and G n denote the Fourier moduli for storage and loss (nth harmonic), respectively; and η n and η n represent the Fourier viscosities for storage and loss (nth harmonic), respectively.
In the nonlinear regime, the stress response deviates from a sinusoidal waveform at large amplitudes, rendering the linear viscoelastic parameters G′ and G″ inadequate for characterizing a material’s behavior. Cho et al. [21] suggested decomposing the nonlinear viscoelastic stress response into elastic and viscous stress contributions, potentially involving higher-order coefficients. Consequently, the storage modulus and loss modulus in the nonlinear region should vary with the amplitude of strain and the applied frequency. Cho et al. [21] used a geometric interpretation of viscoelasticity to analyze the nonlinear response, which was further extended by Ewoldt et al. [18] for a detailed interpretation of LAOS data.
The nonlinear stress response to periodic sinusoidal input can be expressed as σ t = σ x + σ y , decomposed into elastic stress σ e ( x ) and viscous stress σ v ( y )
σ e x σ γ , γ ˙ σ γ , γ ˙ 2 = γ 0 n : o d d G n ω , γ 0 sin n ω t ,  
σ v y σ γ , γ ˙ σ γ , γ ˙ 2 = γ 0 n : o d d G n ω , γ 0 cos n ω t
where x and y represent the normalized strain and strain rate, respectively, with x = γ / γ 0 = sin ( ω t ) and y = γ ˙ / γ ˙ 0 = cos ( ω t ) . Ewoldt et al. [18] suggested fitting σ e ( x ) and σ v y to a set of Chebyshev polynomials of the first kind, offering another means of describing nonlinear viscous and elastic stresses. These polynomials, which are symmetric about x = 0 and orthogonal on the domain [−1, 1], can be readily related to the Fourier coefficients.
The relationships between the Chebyshev coefficients in the strain or strain rate domain and the Fourier coefficients in the time domain are given by:
σ e x = γ 0 n : o d d e n ω , γ 0   T n ( x ) ,
σ v y = γ ˙ 0 n : o d d v n ω , γ 0   T n ( y )
Steady-state LAOS responses can be illustrated as parametric curves (Lissajous–Bowditch loops) in a 3D space with strain, strain rate, and stress as the coordinate axes, denoted as γ t ,   γ ˙ t , and σ ( t ) , respectively. Ewoldt et al. [18] distinguished between “elastic Lissajous–Bowditch curves” and “viscous Lissajous–Bowditch curves” to depict the oscillatory response curves, highlighting the material’s rheological behavior. In the linear region, the Lissajous graph typically exhibits an elliptical shape, while for purely viscous or purely elastic materials, it takes on a circular or linear shape, respectively. Conversely, in the nonlinear region, a deformed parallelogram is observed, the shape of which is influenced by the applied strain and frequency during the deformation process [18].
Understanding the deviation from linearity and calculating local measures of nonlinearity can be achieved through the analysis of third-order Chebyshev coefficients (e3, v3). These coefficients’ signs provide insights into the nature of the elastic and viscous nonlinearities, aiding in the classification of materials’ behaviors into various categories on the basis of intracycle phenomena such as stiffening/softening and thickening/thinning. Only the signs of the third-harmonic Chebyshev coefficients are needed to interpret the nature of elastic and viscous nonlinearities [18]. It has been reported that on the basis of the signs of the third-harmonic Chebyshev coefficients, the nonlinear behavior of the materials and their interpretation of intracycle stiffening/softening and thickening/thinning can be classified into six categories as shown in Equations (7) and (8) [18]
e 3 = G * 3 c o s   δ 3 > 0    strain stiffening = 0    linear   elastic            < 0    strain softening
v 3 = G * 3 ω s i n   δ 3 > 0    shear thickening = 0    linear   viscous            < 0    shear thinning     
Two other ratios, i.e., the stiffening ratio (S) and the thickening ratio (T), have been further used to describe the result of LAOS analyses and they have physical significance, as defined by Equations (9) and (10) [22]
S = G L G M G L 4 e 3 4 e 5 + 8 e 7 + e 1 + e 3 + e 5 + e 7 +
T = η L η M η L 4 v 3 4 v 5 + 8 v 7 + v 1 + v 3 + v 5 + v 7 +
where G M signifies the dynamic modulus at γ = 0 (i.e., the maximum shear rate), G L denotes the dynamic modulus at γ = ± γ 0 (i.e., the maximum imposed strain), η L denotes the nonlinear viscosity at the fundamental frequency (i.e., first harmonic), and η M denotes the nonlinear viscosity accounting for the contributions of higher-order harmonics (i.e., third, fifth, seventh, etc.). These ratios (i.e., S and T) are adept at capturing the nonlinear behaviors of materials. Specifically, positive S values indicate stiffening of the strain, while negative values suggest softening. Likewise, positive T values signify intracycle shear thickening, while negative values indicate thinning [18].

2.4. Fourier Transform Infrared

The FTIR spectra of the pea protein and sodium alginate as pure and mixed gels were obtained using a Frontier FTIR spectrometer (Frontier IR/NIR systems, PerkinElmer Ltd., Beaconfield, UK) controlled with Spectrum 10.4.2 software (PerkinElmer Ltd., Beaconfield, UK). The samples (25 mg) were placed on the top of the attenuated crystal total reflection device; the FTIR bands were obtained at a typical range (400–4000 cm−1) close to an appropriate resolution of 4 cm−1, thus adding 32 scans.

2.5. Statistical Analysis

An analysis of variance (ANOVA) was conducted to evaluate the significant differences (p < 0.05) among the results, followed by Tukey’s multiple comparison test. A significant difference test was performed using IBM SPSS Statistics 21 software (IBM Corp., New York, NY, USA). Each analysis was repeated a minimum of three times to ensure the consistency and reliability of the results.

3. Results and Discussion

3.1. Thermal Gelation Behavior of Alginate and Pea Protein Paste Mixtures

The variations in the storage modulus (G′) and loss modulus (G″) of alginate and pea protein paste mixtures as a function of temperature (both heating and cooling phases) at a rate of 2 °C/min are shown in Figure 1. PP100% exhibited a high G′ and G″ due to its dense protein network, which formed through hydrophobic interactions, hydrogen bonding, and disulfide bonding, predominantly during the cooling phase, when molecular order was achieved [23,24]. Initially, PP100% showed a reduction in G′ and G″ as the temperature increased, attributed to thermal denaturation and structural unfolding of the protein, leading to a decrease in the storage modulus (Figure 1(ai)). This decline was caused by the disruption of the native protein structure, breaking down the intermolecular forces and weakening the network. However, once the temperature exceeded the gelation point (48 °C), new protein–protein interactions facilitated the formation of a gel network, resulting in an increase in both G′ and G″ [24] (Figure 1(ai)). The observed behavior of PP100% aligns with the findings of Tanger et al. [25] and Ren et al. [26], who noted that thermal denaturation and the subsequent gelation of pea protein are crucial for the formation of its networks.
AG100% exhibited a nearly constant but slightly decreasing G′ during the heating phase (Figure 1(aii)), indicating that the elastic properties of alginate were lost during the heating process, unlike other hydrocolloids such as gelatin that experience an increase in elasticity [27]. The nearly constant G′ of AG100% during heating corroborates Khalil et al. [28], who emphasized alginate’s temperature-independent gelation. In mixtures of alginate and pea protein (i.e., AP70:30, AP80:20, and AP90:10), both G′ and G″ decreased during the heating phase (Figure 1(bi,bii)). This can be attributed to the thermal denaturation and destabilization of the proteins’ structure, disrupting the existing intermolecular bonds, and because alginate, which forms a gel only in cold temperatures, had a higher concentration (i.e., ≥70% of the mixed concentration). As the temperature surpasses the gelation point of pea protein, these new interactions became predominant, forming a protein gel network. Upon cooling, the alginate, which remains relatively inactive at high temperatures due to disrupted ionic crosslinks, began to form its gel network, stabilizing the overall mixture (Figure 1(bi,bii)). The increase in G′ and G″ during the cooling phase for the alginate and pea protein mixtures was due to the reformation of ionic crosslinks in the alginate and the stabilization of the gel network [29]. The Ca2+ interacted with the protein molecules, resulting in increased covalent bonding and a more stable network structure [10]. This dual gelation process, where pea protein formed a gel at higher temperatures and alginate formed a gel upon cooling, ensured that the mixtures transitioned from a less structured state to a well-defined gel. This transition highlights the complementary roles of both components in the final structure of the gel.
The behaviors of the mixed gels were also consistent with the report by Roopa and Bhattacharya [29], indicating that alginate–pea protein interactions lead to complex gelation dynamics, where each component contributes distinctively at different thermal stages. Additionally, the enhanced strength of gelation upon cooling, due to increased hydrogen bonding, reflected the findings of O’Kane et al. [30], highlighting the significance of cooling in the stabilization of gel networks. This understanding of the thermal gelation dynamics is essential for optimizing alginate–pea protein mixtures in food applications, ensuring the desired texture and stability.

3.2. Linear Viscoelastic Properties of Pea Protein and Alginate Gel

The linear viscoelastic properties of the mixed pea protein and alginate gels are shown in Figure 2. The gels showed an apparent viscosity that had a dependency on the shear rate and the concentration of pea protein (Figure 2a,b). PP100% exhibited consistently higher viscosity across all strain rates; similarly, AG100% had lower viscosity compared with the mixed gel, suggesting that alginate formed a more viscous gel structure than pea protein under these conditions, likely due to differences in the molecular weight, structure, and interactions with water. As the proportion of pea protein increased in the mixed gels, the viscosity of the mixture tended to increase, indicating that pea protein improved the viscosity-enhancing effects of alginate (Figure 2b).
The frequency dependency of the mixed gel is shown in Figure 2c–g. The G′ and G″ provide insights into the viscoelastic behavior of different gel formulations. We observed that the G′ values of all the samples were higher than the G″ values, indicating the solid-like characteristics of the gel. The G′ of PP100% was higher than that of the mixed gels (AP70:30, AP80:20, AP90:10), and that of the mixed gel was higher than that of the pure alginate gel (AG100%), suggesting that the interaction between alginate and pea protein led to a more rigid and more elastic network structure (Figure 2g). The enhancement in the mechanical properties can be attributed to several factors. Pea protein likely improved the structural integrity of the alginate network by introducing additional interactions such as hydrogen bonds and hydrophobic interactions, which supplemented the ionic crosslinking of alginate [29]. These protein–protein interactions, combined with the alginate matrix, create a more cohesive and resilient gel network. This aligns with the findings of Wang et al. [12], where the addition of sodium alginate to pea protein resulted in a denser and more interconnected network structure, enhancing the gel’s mechanical strength. Moreover, the presence of pea protein may have facilitated more effective crosslinking by providing additional sites for interaction, which can enhance the overall strength and elasticity of the gel. Consequently, the combination of alginate and pea protein resulted in a synergistic effect, where the composite gel exhibited improved mechanical properties compared with the individual components alone.
As the concentration of pea protein increased in the mixed gels (i.e., AP90:10, AP80:20 and AP70:30), the values of G′ slightly increased, implying the formation of a stronger hydrogel with higher crosslinking density (Figure 2h). This indicates that higher concentrations of pea protein enhanced the structural integrity of the mixed gel to some extent. However, the values of G′ and G″ remained lower compared with the pure pea protein gels (Figure 2c). This suggests that while pea protein can contribute to the gel network, it did not achieve the same level of structural cohesion as the pure pea protein gels. Similar results were reported by Ortiz et al. [31], who investigated the viscoelastic properties of soy protein and isolate–carrageenan mixtures and found that the addition of soy protein enhanced the gel’s strength and the elasticity of the carrageenan network. Another study by Panaras et al. [32] explored the mechanical properties of mixtures of whey protein and xanthan gum, reporting that protein interactions significantly improved the network’s rigidity and viscoelasticity. These studies support our observation that incorporating proteins into polysaccharide gels can enhance their mechanical properties through synergistic interactions.
While small-amplitude oscillatory shear (SAOS) tests provide valuable insights into the linear viscoelastic properties of gels, they may not fully capture the complex behavior of mixtures of pea protein and alginate. SAOS measures the properties under small levels of deformation, which are useful for understanding the material’s response in the linear viscoelastic region. However, the interactions between pea protein and alginate, particularly those leading to an enhanced network structure, may involve nonlinear phenomena that are not apparent under small levels of deformation. Large-amplitude oscillatory shear (LAOS) tests, on the other hand, subject the material to larger levels of deformation and can reveal nonlinear viscoelastic behavior, such as strain stiffening or strain softening, and provide a more comprehensive understanding of the gel’s mechanical properties. LAOS can better elucidate the breakdown and reformation of the network’s structure under stress, which is critical for understanding the practical applications and performance of these gels in real-world conditions. Thus, while SAOS offers a baseline characterization, LAOS maybe more suited to describe the viscoelastic properties of mixtures of pea protein and alginate, capturing the full extent of their mechanical behavior and interactions.

3.3. Nonlinear Viscoelastic Properties: Lissajous–Bowditch Curves

The transition of rheological behavior from linear to nonlinear regimes can be effectively visualized through Lissajous–Bowditch curves [33,34]. Figure 3 and Figure 4 illustrates these curves, distinguishing between elastic Lissajous curves (stress vs. strain) and viscous Lissajous curves (stress response vs. strain rate). Within the LVR regime, both the elastic and viscous moduli are independent of the strain’s amplitude, the oscillatory stress response is sinusoidal, and the Lissajous curve is elliptical. On the other hand, the viscoelastic moduli in the nonlinear domain are primarily dependent on the applied strain, and the presence of higher harmonics in the stress response leads to nonsinusoidal, deformed shear stress waveforms [35]. At a low strain of 1–10% (within the LVR), the pure alginate and pea protein gels showed perfectly elliptical shaped Lissajous curves, indicating a linear viscoelastic solid-like behavior (mostly elastic) with high stiffness. With increasing strain, nonlinearities were observed as distortions from the elliptical shape, and the degree of distortion increased with increased strain (Figure 3). It has been reported that the distinct shape distortions of the Lissajous curves are associated with different microstructural characteristics and material reactions to massive deformations [36].
The broader elliptical Lissajous curves in the mixed gels (AP70:30, AP80:20, AP90:10), which expanded with increasing strain, indicated that viscous dissipation increased during intracycle deformation and that there was a shift in behavior from elastic to viscous, which was more prominent at higher levels of strain (Figure 3). The area of the elastic Lissajous loops expanded with increased addition of pea protein, signifying higher energy consumption to complete the oscillatory shear, thus demonstrating the enhanced mechanical properties of the mixed gel systems [37]. The inclusion of pea protein contributed to this expansion by reinforcing the gel network through additional protein–protein interactions, increasing the gel’s resistance to deformation and enhancing its ability to store and dissipate energy under stress.
The viscous Lissajous curves showed a gradual change in the shear stress–strain rate loops from an elliptical to a near S-shape (Figure 4) This suggested highly nonlinear viscoelastic behavior with strong shear thinning at higher strain rates. At strains greater than 500%, the viscous Lissajous curves of the mixed gels exhibited a distorted shape, indicating viscous dissipation due to structural breakdown. The strong networks in the mixed gels, formed by the aggregation of proteins and protein–polysaccharide interactions and further reinforced by cooling, led to the breakdown of a rigid network structure [12]. Notably, only PP100% exhibited a secondary loop at strains greater than 500%, whereas the pure alginate and mixed gels showed a reduced area of viscous Lissajous curves (Figure 4). The secondary loop typically appears when the time scale for rearrangements of the microstructure is shorter than the time scale of deformation [20]. The reduced area of the curves with increasing levels of strain for the mixed and alginate gels implied increased viscous dissipation during intracycle deformation. The enclosed area was lower for higher concentrations of pea protein, further indicating a more elastic response during large levels of deformation. This behavior can be further understood by examining the microstructural analysis provided in the study of Wang et al. [12] for sodium alginate and pea protein gel. They observed that the addition of sodium alginate to pea protein significantly altered the microstructure of the gel. This transformation in the microstructure was attributed to an increase in the crosslinking density. The higher crosslinking density resulted from the formation of additional coordination bonds between sodium alginate and Ca2+. These microstructural changes supported the viscoelastic behavior observed in the Lissajous curves, where the higher crosslinking density in the mixed gels contributed to the strong network structures and the pronounced shear thinning and viscous dissipation at high strain rates. The shift from an elliptical to an S-shape in the Lissajous curves corresponded to the transition in the microstructure, reflecting the enhanced rigidity and elastic response of the gel network under large levels of deformation. A study on mixtures of k-carrageenan and gelatin revealed similar trends [38]. The Lissajous curves for carrageenan–gelatin gels also showed a transition from elastic to viscous dominance with increasing amplitudes of strain.

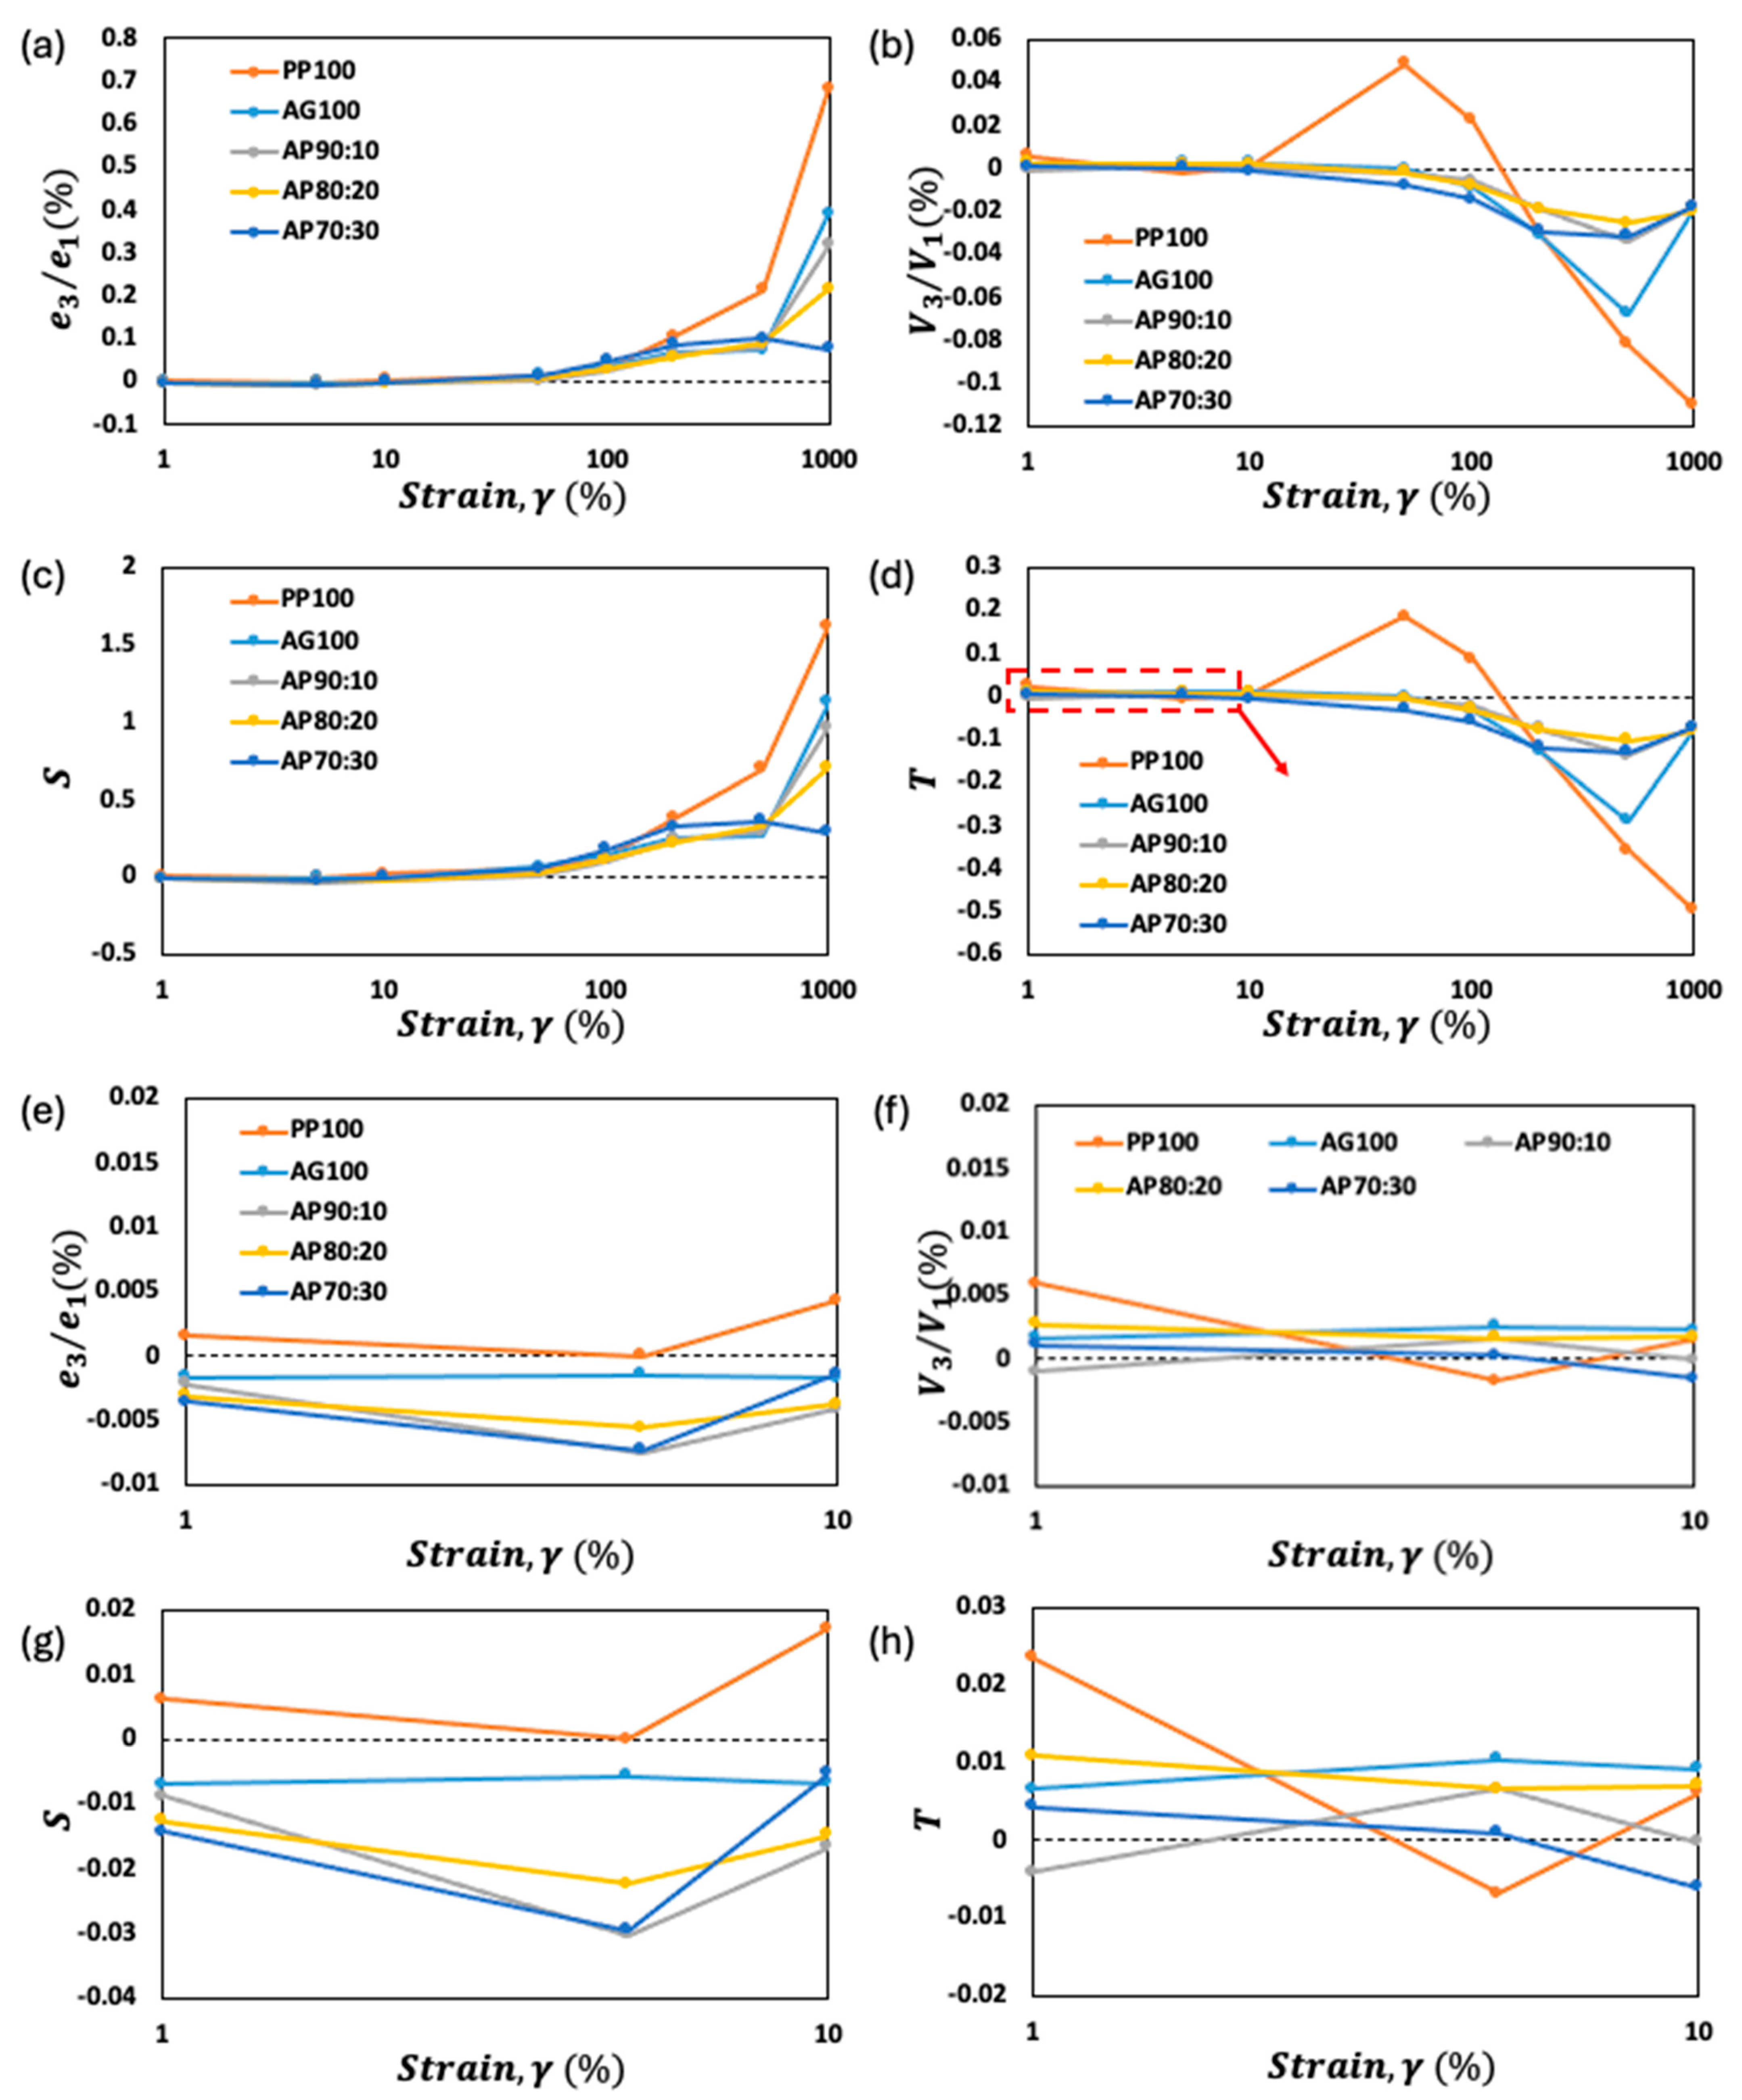
3.4. Analysis of Chebyshev Coefficients for Mixed Pea Protein and Alginate Gel

The Chebyshev stress decomposition method can be used to analyze the viscoelastic properties of mixed pea protein and alginate gels under large levels of deformation. The elastic and viscous indicators of nonlinearity (e3/e1 and v3/v1, S, and T) plotted in Figure 5a–d were all dependent on both the strain (%) and the gels’ composition. Both pure and mixed gels showed a similar trend, where the e3/e1 values were near zero initially, followed by a rapid rise to a positive peak, indicating the onset of nonlinear elastic behavior (Figure 5a). This trend was more pronounced at higher levels of strain, highlighting the material’s response to significant deformation. A comparable pattern was observed for the v3/v1 values, which increased quickly to positive maxima and then sharply decreased to negative values, indicating a transition from shear thickening to shear thinning behaviors [33].
The Chebyshev coefficients play a crucial role in determining the degree of nonlinearity for pea protein and alginate gels. These coefficients are essential for comprehending nonlinearity, as they quantify the relative contributions of elastic and viscous responses under large levels of deformation, providing insights into the complex viscoelastic behavior of the gels. Notably, higher concentrations of pea protein in the mixed gels corresponded to lower v3/v1 values. The distinct nonlinear viscoelastic behaviors observed in the Chebyshev coefficients of the mixed alginate and pea protein gels can be attributed to their chemical interactions, molecular structures, and bonding characteristics. Alginate, a polysaccharide, forms gels through ionic crosslinking, primarily involving calcium ions that bridge the guluronic acid residue of alginate chains. This ionic crosslinking creates a relatively rigid network that exhibits elasticity at low levels of strain and significant nonlinearity at higher levels of strain as the network deforms [39]. In contrast, pea protein gels form through protein–protein interactions, including hydrogen bonding, hydrophobic interactions, and disulfide bonds. These interactions led to a more flexible and less rigid network compared with alginate. At low levels of strain, the network deformed more easily, resulting in positive e3/e1 values indicative of more viscous behavior. As the strain increased, the protein network’s ability to resist deformation and store energy increased, leading to higher nonlinearity.
When alginate and pea protein were mixed, their interactions created a composite network with intermediate properties. At low concentrations of pea protein (i.e., AP90:10), the ionic crosslinking of alginate dominated, leading to initial negative e3/e1 values and a gradual transition to nonlinearity as the protein component began to influence the network’s structure. As the pea protein content increased (i.e., AP80:20 and AP70:30), protein–protein interactions became more prominent, contributing to the gel’s viscoelastic properties and resulting in positive e3/e1 values. Similar patterns have been reported for mixtures of xanthan gum and locust bean gum, which showed transitions from shear thickening to shear thinning behavior, depending on the ratios of the components, mirroring the trends seen with pea protein and alginate gels [40].
The strain stiffening ratio (S) of the pea protein and alginate gel showed a correlation with the e3/e1 values at all levels of strain, while a similar correlation was observed for the shear thickening ratio (T) and the v3/v1 values (Figure 5c,d). An increase in the S values correlated with enhanced strain stiffening tendencies. This suggests that as the gel experienced greater deformation, its resistance to further strain amplified. Such behavior can be attributed to the intricate interplay between molecular reorganization and structural rearrangements within the mixed pea protein and alginate gels. The thickening ratio (T) provides insights into strain thickening or thinning behavior exhibited by viscoelastic materials subjected to large levels of deformation [24]. The observed positive T values (in PP100%) until 100% strain suggested a predominance of elastic behavior, wherein the material tended to resist flow and maintain its structure. This indicated that at lower to moderate levels of strain (within the LVR), the gel exhibited a propensity for strain thickening behavior, wherein it became stiffer and more resistant to deformation. The negative T values which were found at lower levels of strain in alginate and mixed gels suggested a prevalence of viscous behavior, where dissipation of energy and flow dominated over elastic recovery. This could be attributed to differences in the molecular mobility and intermolecular interactions within the gel matrix, leading to a more pronounced tendency for shear thinning. Tang et al. [41] studied the interactions between sodium caseinate and polysaccharides with locust bean gum (LBG) and κ-carrageenan. They found that the S values of the mixtures remained at around zero within the linear viscoelastic (LVE) region. However, as the strain increased to 100, all mixtures exhibited strain softening behavior (S < 0). In a similar study, Liu et al. [42] explored the structural evolution of waxy maize starch and observed that the S values for starch paste were positive and increased with strain, indicating the strong shear stiffening behavior typical of many soft biological materials.
Overall, these findings emphasized the distinct chemical interactions and bonding mechanisms of alginate and pea protein, which contributed to the mechanical properties of the composite gels. The interplay between the ionic crosslinking in alginate and the protein–protein interactions in pea protein resulted in a range of viscoelastic behaviors. By adjusting the mixtures’ ratios, these properties can be fine-tuned, providing valuable insights for the design of gels with specific mechanical characteristics for various applications.

3.5. Fourier Transform Infrared Spectroscopy

FTIR spectroscopy was used to analyze the interactions between pea protein and sodium alginate within their gel networks, which was crucial for understanding the rheological properties of these mixed gels. The FTIR spectrum of AG100% exhibited characteristic peaks at 1594 cm−1 and 1413 cm−1, corresponding to the asymmetric and symmetric stretching vibrations of carboxylate anions (COO-), respectively. These findings aligned with those reported by Liu et al. [43]. Additionally, sodium alginate displayed broad O-H stretching vibrations at 3431 cm−1 and 3361 cm−1, indicative of the hydroxyl groups typically found in polysaccharides. Peaks at 3059 cm−1 were associated with C-H stretching vibrations, while those at 1297 cm−1, 1034 cm−1, and 944 cm−1 were, respectively, related to the C-O-C stretching, C-O stretching, and bending vibrations characteristic of the polysaccharide backbone (Figure 6) [44].
The FTIR spectrum of PP100% showed prominent peaks at 1634 cm−1 (the amide I band) and 1550 cm−1 (the amide II band), which corresponded to C = O stretching vibrations and N-H bending deformations, respectively. These results are consistent with the findings of Moreno et al. [45]. The broad peak at 3275 cm−1 was attributed to O-H contraction vibrations, while peaks at 3468 cm−1 indicated N-H stretching vibrations (amide A). Furthermore, the peaks at 3060 cm−1 and 2962 cm−1 were assigned to C-H stretching vibrations, and those at 1454 cm−1 and 1083 cm−1 were attributed to C-H bending and C-O stretching, respectively.
In the mixed samples (AP90:10, AP80:20, AP70:30), the FTIR spectra were dominated by peaks from sodium alginate due to its higher content. The intensity of peaks at 3431 cm−1, the amide I band, and the amide II band gradually decreased with increasing pea protein content, indicating weak noncovalent interactions between the two biopolymers. No new characteristic peaks were observed, suggesting the absence of covalent bonds between pea protein and sodium alginate. This lack of strong interconnections might have contributed to the enhanced elasticity observed in the resulting gels. For instance, the spectrum of AP90:10 showed broad O-H and N-H stretching vibrations at 3440 cm−1 and carboxylate anion stretching at 1594 cm−1, with peaks related to polysaccharide structures, reflecting minor contributions of the protein. As the pea protein content increased in AP80:20 and AP70:30, the spectra revealed more pronounced influences of protein alongside features of polysaccharides. These results are consistent with previous studies by Liu et al. [43] and Moreno et al. [45], confirming the characteristic peaks of sodium alginate and pea protein. The gradual decrease in the peaks’ intensity with an increasing pea protein content indicated the formation of weak noncovalent interactions without the formation of new covalent bonds. This finding suggested that the pea protein and sodium alginate interacted primarily through physical entanglements and hydrogen bonding rather than chemical crosslinking, which could have enhanced the mixture’s flexibility and deformability.

4. Conclusions

In this study, the gel properties of five different pea protein and alginate mixtures were evaluated under large levels of deformation. Prior to the measurement of LAOS, SAOS tests were conducted to observe the frequency dependence of G′ and G″. The results revealed that all samples exhibited weak networks but demonstrated a solid-like behavior. The nonlinear rheological properties of the gels revealed that a relatively strong network was developed for the mixed gels, whereas the pure alginate and pea protein (AG100% and PP100%) gels showed weaker networks compared with the mixtures, which can have paste-like properties under large-amplitude oscillatory shear flow. The calculated harmonics and Chebyshev coefficients also showed that the gels had strain stiffening and shear thickening behavior until breakage, and the network was stronger with higher amounts of pea proteins in the mixtures. FTIR spectroscopy revealed that the characteristic peaks of AG100% and PP100% were present in the mixed gels, indicating the retention of their molecular structures. The absence of new characteristic peaks in the mixtures’ spectra suggested that no covalent bonds were formed between the two components. However, a gradual decrease in the peaks’ intensity at 3431 cm−1, as well as in the amide I and II bands, pointed to weak noncovalent interactions between the pea protein and sodium alginate. These interactions contributed to the improved elasticity of the gels, as indicated by the enhanced G′ values in the rheological analysis. The results from this study enabled a better understanding of the rheological properties of pea protein and sodium alginate, and provided useful information for its further application in realistic processing conditions including mixing, extrusion and 3D printing. Future research should focus on exploring the effects of different environmental conditions, such as pH and ionic strength, on the gelation behavior and network strength of pea protein and alginate mixtures.

Author Contributions

Conceptualization, T.M.O., H.J., and W.B.Y.; methodology, T.M.O., H.J., and W.B.Y.; investigation, T.M.O. and H.J.; writing—original draft preparation, T.M.O. and H.J.; writing—review and editing, T.M.O. and W.B.Y.; supervision, W.B.Y.; project administration, W.B.Y. All authors have read and agreed to the published version of the manuscript.

Funding

This research was supported by the Basic Science Research Program through the National Research Foundation of Korea (NRF), funded by the Ministry of Education (NRF2018R1D1A3B06042501). Following are results of a study on the “Leaders in INdustry-university Cooperation 3.0” Project, supported by the Ministry of Education and National Research Foundation of Korea.

Data Availability Statement

The data presented in this study are available on request from the corresponding author. The data are not publicly available due to restrictions in the agreement with the funding organization.

Acknowledgments

All authors would like to express their gratitude to Randy H. Ewoldt from the University of Illinois at Urbana-Champaign for providing free access to the MITLaos software (MITlaos Version 2.1 Beta).

Conflicts of Interest

The authors declare no conflict of interest.

References

  1. Dorling, D. World population prospects at the UN: Our numbers are not our problem? In The Struggle for Social Sustainability; Policy Press: Bristol, UK, 2021; pp. 129–154. [Google Scholar]
  2. Wu, G.; Fanzo, J.; Miller, D.D.; Pingali, P.; Post, M.; Steiner, J.L.; Thalacker-Mercer, A.E. Production and supply of high-quality food protein for human consumption: Sustainability, challenges, and innovations. Ann. New York Acad. Sci. 2014, 1321, 1–19. [Google Scholar] [CrossRef] [PubMed]
  3. Lu, Z.X.; He, J.F.; Zhang, Y.C.; Bing, D.J. Composition, physicochemical properties of pea protein and its application in functional foods. Crit. Rev. Food Sci. Nutr. 2020, 60, 2593–2605. [Google Scholar] [CrossRef] [PubMed]
  4. Davies, R.W.; Jakeman, P.M. Separating the wheat from the chaff: Nutritional value of plant proteins and their potential contribution to human health. Nutrients 2020, 12, 2410. [Google Scholar] [CrossRef] [PubMed]
  5. Estell, M.; Hughes, J.; Grafenauer, S. Plant protein and plant-based meat alternatives: Consumer and nutrition professional attitudes and perceptions. Sustainability 2021, 13, 1478. [Google Scholar] [CrossRef]
  6. Qin, P.; Wang, T.; Luo, Y. A review on plant-based proteins from soybean: Health benefits and soy product development. J. Agric. Food Res. 2022, 7, 100265. [Google Scholar] [CrossRef]
  7. Burger, T.G.; Zhang, Y. Recent progress in the utilization of pea protein as an emulsifier for food applications. Trends Food Sci. Technol. 2019, 86, 25–33. [Google Scholar] [CrossRef]
  8. Carvajal-Piñero, J.M.; Ramos, M.; Jiménez-Rosado, M.; Perez-Puyana, V.; Romero, A. Development of pea protein bioplastics by a thermomoulding process: Effect of the mixing stage. J. Polym. Environ. 2019, 27, 968–978. [Google Scholar] [CrossRef]
  9. Hecht, H.; Srebnik, S. Structural characterization of sodium alginate and calcium alginate. Biomacromolecules 2016, 17, 2160–2167. [Google Scholar] [CrossRef]
  10. Mession, J.L.; Blanchard, C.; Mint-Dah, F.V.; Lafarge, C.; Assifaoui, A.; Saurel, R. The effects of sodium alginate and calcium levels on pea proteins cold-set gelation. Food Hydrocoll. 2013, 31, 446–457. [Google Scholar] [CrossRef]
  11. Oyinloye, T.M.; Yoon, W.B. Stability of 3D printing using a mixture of pea protein and alginate: Precision and application of additive layer manufacturing simulation approach for stress distribution. J. Food Eng. 2021, 288, 110127. [Google Scholar] [CrossRef]
  12. Wang, Y.; Jiao, A.; Qiu, C.; Liu, Q.; Yang, Y.; Bian, S.; Zeng, F.; Jin, Z. A combined enzymatic and ionic cross-linking strategy for pea protein/sodium alginate double-network hydrogel with excellent mechanical properties and freeze-thaw stability. Food Hydrocoll. 2022, 131, 107737. [Google Scholar] [CrossRef]
  13. Leelapunnawut, S.; Ngamwonglumlert, L.; Devahastin, S.; Derossi, A.; Caporizzi, R.; Chiewchan, N. Effects of texture modifiers on physicochemical properties of 3D-printed meat mimics from pea protein isolate-alginate gel mixture. Foods 2022, 11, 3947. [Google Scholar] [CrossRef]
  14. Le, X.T.; Rioux, L.E.; Turgeon, S.L. Formation and functional properties of protein–polysaccharide electrostatic hydrogels in comparison to protein or polysaccharide hydrogels. Adv. Colloid Interface Sci. 2017, 239, 127–135. [Google Scholar] [CrossRef]
  15. Razi, S.M.; Motamedzadegan, A.; Shahidi, A.; Rashidinejad, A. The effect of basil seed gum (BSG) on the rheological and physicochemical properties of heat-induced egg albumin gels. Food Hydrocoll. 2018, 82, 268–277. [Google Scholar] [CrossRef]
  16. López, D.N.; Galante, M.; Alvarez, E.M.; Risso, P.H.; Boeris, V. Effect of the espina corona gum on caseinate acid-induced gels. LWT-Food Sci. Technol. 2017, 85, 121–128. [Google Scholar] [CrossRef]
  17. Sun, W.; Yang, Y.; Wang, T.; Liu, X.; Wang, C.; Tong, Z. Large amplitude oscillatory shear rheology for nonlinear viscoelasticity in hectorite suspensions containing poly (ethylene glycol). Polymer 2011, 52, 1402–1409. [Google Scholar] [CrossRef]
  18. Ewoldt, R.H.; Hosoi, A.E.; McKinley, G.H. New measures for characterizing nonlinear viscoelasticity in large amplitude oscillatory shear. J. Rheol. 2008, 52, 1427–1458. [Google Scholar] [CrossRef]
  19. Precha-Atsawanan, S.; Uttapap, D.; Sagis, L.M. Linear and nonlinear rheological behavior of native and debranched waxy rice starch gels. Food Hydrocoll. 2018, 85, 1–9. [Google Scholar] [CrossRef]
  20. Helgerud, T.; Gåserød, O.; Fjæreide, T.; Andersen, P.O.; Larsen, C.K. Alginates. In Food Stabilisers, Thickeners and Gelling Agents; John Wiley & Son: Hoboken, NJ, USA, 2009; pp. 50–72. [Google Scholar]
  21. Cho, K.S.; Hyun, K.; Ahn, K.H.; Lee, S.J. A geometrical interpretation of large amplitude oscillatory shear response. J. Rheol. 2005, 49, 747–758. [Google Scholar] [CrossRef]
  22. Joyner, H.S. Nonlinear (large-amplitude oscillatory shear) rheological properties and their impact on food processing and quality. Annu. Rev. Food Sci. Technol. 2021, 12, 591–609. [Google Scholar] [CrossRef]
  23. Sun, X.D.; Arntfield, S.D. Molecular forces involved in heat-induced pea protein gelation: Effects of various reagents on the rheological properties of salt-extracted pea protein gels. Food Hydrocoll. 2012, 28, 325–332. [Google Scholar] [CrossRef]
  24. Shen, Y.; Du, Z.; Wu, X.; Li, Y. Modulating molecular interactions in pea protein to improve its functional properties. J. Agric. Food Res. 2022, 8, 100313. [Google Scholar] [CrossRef]
  25. Tanger, C.; Müller, M.; Andlinger, D.; Kulozik, U. Influence of pH and ionic strength on the thermal gelation behaviour of pea protein. Food Hydrocoll. 2022, 123, 106903. [Google Scholar] [CrossRef]
  26. Ren, W.; Xia, W.; Gunes, D.Z.; Ahrné, L. Heat-induced gels from pea protein soluble colloidal aggregates: Effect of calcium addition or pH adjustment on gelation behavior and rheological properties. Food Hydrocoll. 2024, 147, 109417. [Google Scholar] [CrossRef]
  27. Donati, I.; Holtan, S.; Mørch, Y.A.; Borgogna, M.; Dentini, M.; Skjåk-Bræk, G. New hypothesis on the role of alternating sequences in calcium− alginate gels. Biomacromolecules 2005, 6, 1031–1040. [Google Scholar] [CrossRef] [PubMed]
  28. Khalil HP, S.A.; Tye, Y.Y.; Saurabh, C.K.; Leh, C.P.; Lai, T.K.; Chong EW, N.; Syakir, M.I. Biodegradable polymer films from seaweed polysaccharides: A review on cellulose as a reinforcement material. Express Polym. Lett. 2017, 11, 244–265. [Google Scholar] [CrossRef]
  29. Roopa, B.S.; Bhattacharya, S. Alginate gels: II. Stability at different Processing conditions. J. Food Process Eng. 2010, 33, 466–480. [Google Scholar] [CrossRef]
  30. O’Kane, F.E.; Vereijken, J.M.; Gruppen, H.; Van Boekel, M.A. Gelation behavior of protein isolates extracted from 5 cultivars of Pisum sativum L. J. Food Sci. 2005, 70, C132–C137. [Google Scholar] [CrossRef]
  31. Ortiz, S.M.; Puppo, M.C.; Wagner, J.R. Relationship between structural changes and functional properties of soy protein isolates–carrageenan systems. Food Hydrocoll. 2004, 18, 1045–1105. [Google Scholar] [CrossRef]
  32. Panaras, G.; Moatsou, G.; Yanniotis, S.; Mandala, I. The influence of functional properties of different whey protein concentrates on the rheological and emulsification capacity of blends with xanthan gum. Carbohydr. Polym. 2011, 86, 433–440. [Google Scholar] [CrossRef]
  33. Ma, Y.; Su, D.; Wang, Y.; Li, D.; Wang, L. Effects of concentration and NaCl on rheological behaviors of konjac glucomannan solution under large amplitude oscillatory shear (LAOS). LWT 2020, 128, 109466. [Google Scholar] [CrossRef]
  34. Sagis, L.M.; Fischer, P. Nonlinear rheology of complex fluid–fluid interfaces. Curr. Opin. Colloid Interface Sci. 2014, 19, 520–529. [Google Scholar] [CrossRef]
  35. Qu, R.J.; Wang, Y.; Li, D.; Wang, L.J. Rheological behavior of nanocellulose gels at various calcium chloride concentrations. Carbohydr. Polym. 2021, 274, 118660. [Google Scholar] [CrossRef] [PubMed]
  36. Yu, J.; Wang, Y.; Li, D.; Wang, L.J. Freeze-thaw stability and rheological properties of soy protein isolate emulsion gels induced by NaCl. Food Hydrocoll. 2022, 123, 107113. [Google Scholar] [CrossRef]
  37. Ptaszek, P.; Kabziński, M.; Ptaszek, A.; Kaczmarczyk, K.; Kruk, J.; Bieńczak, A. The analysis of the influence of xanthan gum and apple pectins on egg white protein foams using the large amplitude oscillatory shear method. Food Hydrocoll. 2016, 54, 293–301. [Google Scholar] [CrossRef]
  38. Derkach, S.R.; Ilyin, S.O.; Maklakova, A.A.; Kulichikhin, V.G.; Malkin, A.Y. The rheology of gelatin hydrogels modified by κ-carrageenan. LWT-Food Sci. Technol. 2015, 63, 612–619. [Google Scholar] [CrossRef]
  39. Duceac, I.A.; Stanciu, M.C.; Nechifor, M.; Tanasă, F.; Teacă, C.A. Insights on some polysaccharide gel type materials and their structural peculiarities. Gels 2022, 8, 771. [Google Scholar] [CrossRef] [PubMed]
  40. Ozmen, D.; Toker, O.S. Large-amplitude oscillatory shear behavior of xanthan gum/locust bean gum mixture: Effect of preparation methods on synergistic interaction. J. Food Process Eng. 2022, 45, e14073. [Google Scholar] [CrossRef]
  41. Tang, M.X.; Lei, Y.C.; Wang, Y.; Li, D.; Wang, L.J. Rheological and structural properties of sodium caseinate as influenced by locust bean gum and κ-carrageenan. Food Hydrocoll. 2021, 112, 106251. [Google Scholar] [CrossRef]
  42. Liu, Z.; Chen, L.; Bie, P.; Xie, F.; Zheng, B. An insight into the structural evolution of waxy maize starch chains during growth based on nonlinear rheology. Food Hydrocoll. 2021, 116, 106655. [Google Scholar] [CrossRef]
  43. Liu, S.; Li, Y.; Li, L. Enhanced stability and mechanical strength of sodium alginate composite films. Carbohydr. Polym. 2017, 160, 62–70. [Google Scholar] [CrossRef] [PubMed]
  44. Carpentier, J.; Conforto, E.; Chaigneau, C.; Vendeville, J.E.; Maugard, T. Complex coacervation of pea protein isolate and tragacanth gum: Comparative study with commercial polysaccharides. Innov. Food Sci. Emerg. Technol. 2021, 69, 102641. [Google Scholar] [CrossRef]
  45. Moreno, H.M.; Dominguez-Timon, F.; Díaz, M.T.; Pedrosa, M.M.; Borderías, A.J.; Tovar, C.A. Evaluation of gels made with different commercial pea protein isolate: Rheological, structural and functional properties. Food Hydrocoll. 2020, 99, 105375. [Google Scholar] [CrossRef]
Figure 1. (a) Temperature-dependent variations in the storage modulus (G′) and loss modulus (G″) of pea protein paste during the heating and cooling phases at 2 °C/min; (i) G′ and G″ of PP100%, (ii) G′ and G″ of AG100%, and (iiiv) G′ and G″ of mixed pea protein and alginate gels. (b) Temperature-dependent variations of mixed pea protein and alginate pastes during the heating and cooling phases at 2 °C/min combined in the same figure; (bi) storage modulus (G′) and (bii) loss modulus (G″).
Processes 12 01638 g001aProcesses 12 01638 g001b
Figure 2. Linear viscoelastic properties of mixed alginate and pea protein gels. (a) Viscosity of PP100%; (b) viscosity of mixed gels and alginate; (cg) G′ and G″ for PP100%, AG100%, AP90:10, AP80:20, and AP70:30, respectively, and (h,i) G′ and G″ for AG100%, AP90:10, AP80:20, and AP70:30 combined in the same figure.
Processes 12 01638 g002
Figure 3. Elastic Lissajous curves of pea protein and alginate as pure and mixed gels with different ratios.
Processes 12 01638 g003
Figure 4. Viscous Lissajous curves of pea protein and alginate as pure and mixed gels with different ratios.
Processes 12 01638 g004
Figure 5. Quantitative analysis of the nonlinear response of mixed pea protein and alginate gel: (a) third Chebyshev coefficients e3/e1, (b) third viscous Chebyshev coefficients v3/v1, (c) the strain stiffening ratio S, (d) the shear thickening ratio T, and (eh) the Chebyshev coefficient of e3/e1, v3/v1, S, and T, respectively at lower strain 1 to 10%.
Processes 12 01638 g005
Figure 6. FTIR spectra of pea protein and sodium alginate as pure and mixed pastes, and pea protein and sodium alginate as pure and mixed gels.
Processes 12 01638 g006
Table 1. Specification and composition of the materials.
IngredientConcentrations of Constituting Components (%W/W) ConcentrationPaste Material
Pea protein Pea powder20100Pea protein paste
Distilled water80
AlginateSodium phosphate102.5Alginate gel solution
Calcium chloride10
Sodium alginate80
Distilled waterDistilled water10097.5
Table 2. Ratios of the gel mixtures.
GelRatio of the Mixture (%) Code Name of the Sample
Pea protein gel100PP100
Alginate gel100AG100
Alginate and pea protein mixtures90:10AP90:10
80:20AP80:20
70:30AP70:30
Disclaimer/Publisher’s Note: The statements, opinions and data contained in all publications are solely those of the individual author(s) and contributor(s) and not of MDPI and/or the editor(s). MDPI and/or the editor(s) disclaim responsibility for any injury to people or property resulting from any ideas, methods, instructions or products referred to in the content.

