Abstract
Uniform air distribution is the basic condition for the stable operation of circulating fluidized beds and closely related to the hole layout of nozzles and the air outlet conditions. In this paper, CAD modeling software is used to establish different opening types for nozzles and the corresponding gasifier models, and Fluent simulation software for numerical simulations (k-ε model) is introduced to the hydrodynamic behavior of the upper opening, the side opening and the combined opening types of nozzles, as well as the corresponding single-nozzle fluidized bed gasifiers. The flow field distribution under the above opening modes is obtained, including the velocity distribution, static pressure distribution, and total pressure distribution, and the influence of the boundary conditions, including the inlet gas velocity and outlet pressure, on the flow field distribution inside the nozzle and in the single-nozzle fluidized bed gasifier is also investigated. The simulation results show that the suitable optimal operating conditions for the coal gasifier can be achieved with an inlet velocity of 30 m/s and an outlet pressure of 25 kPaG. Under the above conditions, the local fluidization dead zone at the elbow and top of the nozzle is narrower, the uniformity of the wind velocity can be improved, the pressure drop of the inner core tube of the nozzle is gentle, and the pressure distribution tends to be stable. Theoretically, the anti-slag performance of the nozzle is improved, which will enhance the stability and reliability of the operation of the gasification unit.
1. Introduction
In China’s energy utilization structure, coal resources play an important role because of their rich reserves and wide distribution; the transformation and utilization of coal is also the focus of this research. The Zhundong Coalfield is located east of the Zhunger Basin, Xinjiang Province, China, with a predicted reserve of 390 Gt. At present, the accumulative proven coal reserves total 213.6 Gt, and the coalfield area is 1.4 × 10⁴ km2, making it the largest integrated coalfield in China [1]. Zhundong coal is suitable for coal gasification, presenting the characteristics of an extremely low ash content, extremely low sulfur content, high calorific value, and low metamorphism, and it is an excellent power coal [2]. Due to its historical origin and geographical location, the contents of alkali metals and alkaline earth metals in Zhundong coal is particularly high [3], and the sodium content is the highest in Chinese coal. A high alkali metal content is conducive to reducing the ignition temperature of pulverized coal and improving combustion characteristics and efficiency; however, it will also cause slag and ash to accumulate at the bottom of the coal gasifier, seriously affecting the normal operation of the equipment [4].
Coal gasification technology is the core of clean coal technology [5]. Although China’s modern coal gasification technology was established only recently, it has made remarkable progress in the last 30 years. In order to comply with the implementation of the “dual carbon” policy, reduce energy consumption, and improve gasification efficiency, it is urgent to upgrade and optimize the coal gasification technology [6]. Therefore, the circulating fluidized bed (CFB) coal gasification process came into being. Due to the advantages of wide coal adaptability, a high combustion efficiency, and low pollution levels [7], this process has become one of the most commercialized clean coal combustion and gasification technologies [8]. However, ensuring sufficient fluidization of the feeds in the gasifier is the basic condition for its stable operation, which not only depends on the characteristics of the feeds, but also has a strong relationship with the effect of air distribution [9].
Different from fixed bed technology, fluidized bed gasification technology has the advantages of a low combustion temperature, uniform furnace temperature, long combustion residence time, and strong fuel adaptability [10]. In 1979, the Ahlstrom Company in Finland developed the first commercial CFB unit and put it into operation. After that, due to the continuous optimization of Western countries, such as France and the United States, circulating fluidized bed technology has become more and more mature and has received more and more international attention. The research institutes and universities in China have also increased their research on circulating fluidized bed coal gasification technology and have achieved many remarkable results, becoming the most active country in the development of fluidized bed technology in the last 50 years. At first, the research mainly introduced technologies; for example, the 270 t/h circulating fluidized bed technology developed by the Lurgi Company in Germany in the 1980s. A series of circulating fluidized beds below 220 t/h were independently developed with the support of the government. By the beginning of this century, 100–135 MW circulating fluidized bed technology from the United States was introduced, as well as 300 MW sub-critical circulating fluidized bed technology from France. Due to the unremitting efforts of relevant researchers, all aspects of domestic circulating fluidized bed technology are becoming more perfect and mature. In April 2013, a 600 MW circulating fluidized bed was successfully put into operation in Baima, Sichuan, which means that China’s circulating fluidized bed technology has reached a high global level [11].
There are three main air-distribution devices for CFB gasification technology, namely perforated plates, nozzles, and scattering tubes, among which the nozzle structure has the longest service history and the most stable operation [12]. However, the long-term hot operation of nozzles changes their resistance characteristics, resulting in ash deposition, serious material leakage, and uneven air distribution, as well as a reduced cycle rate and reduced thermal efficiency [13]. The state of the nozzle at the bottom of the CFB gasifier is an important factor affecting its normal operation. The role of the nozzle is mainly to distribute the gasification agent (containing air, oxygen, steam, etc.) from the inlet tube at the bottom of the furnace, so the particles can be uniformly fluidized in the bed. Research on fluidized bed nozzles was first conducted in 1965, and has developed rapidly in recent decades. Pawel Mirek et al. [14] found that the temperature distribution formed in the space of the large circulating fluidized bed and the intensity of mixing process are closely related to the structure of the nozzle. Based on the study of Pawel Mirek, Marcin Klajny et al. [15] put forward a reasonable nozzle structure that is conducive to reducing pressure drops. By increasing the orifice outlet velocity, the uniformity of air distribution can be enhanced to reduce energy consumption and improve energy utilization efficiency. However, at present, the analysis and optimization of the nozzle’s geometric structure is still very limited [12].
With the emergence of various forms of simulation software, this scientific research method has been rapidly and widely applied. Additionally, related simulation research on the flow fields of large equipment in chemical plants based on Fluent software has attracted widespread attention. Dai Zhenghua et al. [16] conducted a numerical simulation and experimental study on the four-nozzle coal gasifier with the simulated medium of air and the turbulence type of a realizable k-ε model. The results showed that the velocity distribution of the simulated axis agreed well with the experimental value, which verified the correctness of the turbulence model. Wu Yuxin et al. [17] used computational fluid software (Fluent) to simulate the gas phase flow field in a three-channel nozzle and a single-channel nozzle in the case of a free jet and a confined jet, respectively. A comparison of the two types of nozzles in the free and confined jet flow fields showed that the flow fields are very similar, except for a significantly different velocity distribution closer to the nozzle outlet. Jiang Huawei [18] studied the relationship between the nozzle pressure fluctuation characteristics and the gas–solid fluidization characteristics in the CFB with the help of a CFB cold test device and found that the pressure in the nozzle and the apparent gas velocity at the inlet of the nozzle presented significant effects on the gas–solid fluidization characteristics. Zhao Xian [19] investigated the flow characteristics of the distributor plate with CFD by experimental research and numerical simulation. Based on the cold modeling test, Fluent software was used to simulate the flow field of the single nozzle and the distributor system. It was found that the resistance value obtained by the numerical simulation by the RNG k-ε turbulence model was basically consistent with the test value. When the nozzle opening has a certain angle, it is more conducive to the fluidization of the feeds. Fan Jinlong [20], using CFB numerical simulation combined with a cold experiment, concluded that the nozzle resistance is greatly affected by the rotation angle and downdip angle of the inner core hole, and the resistance coefficient of the air distribution system decreases with the increase in the number of nozzles.
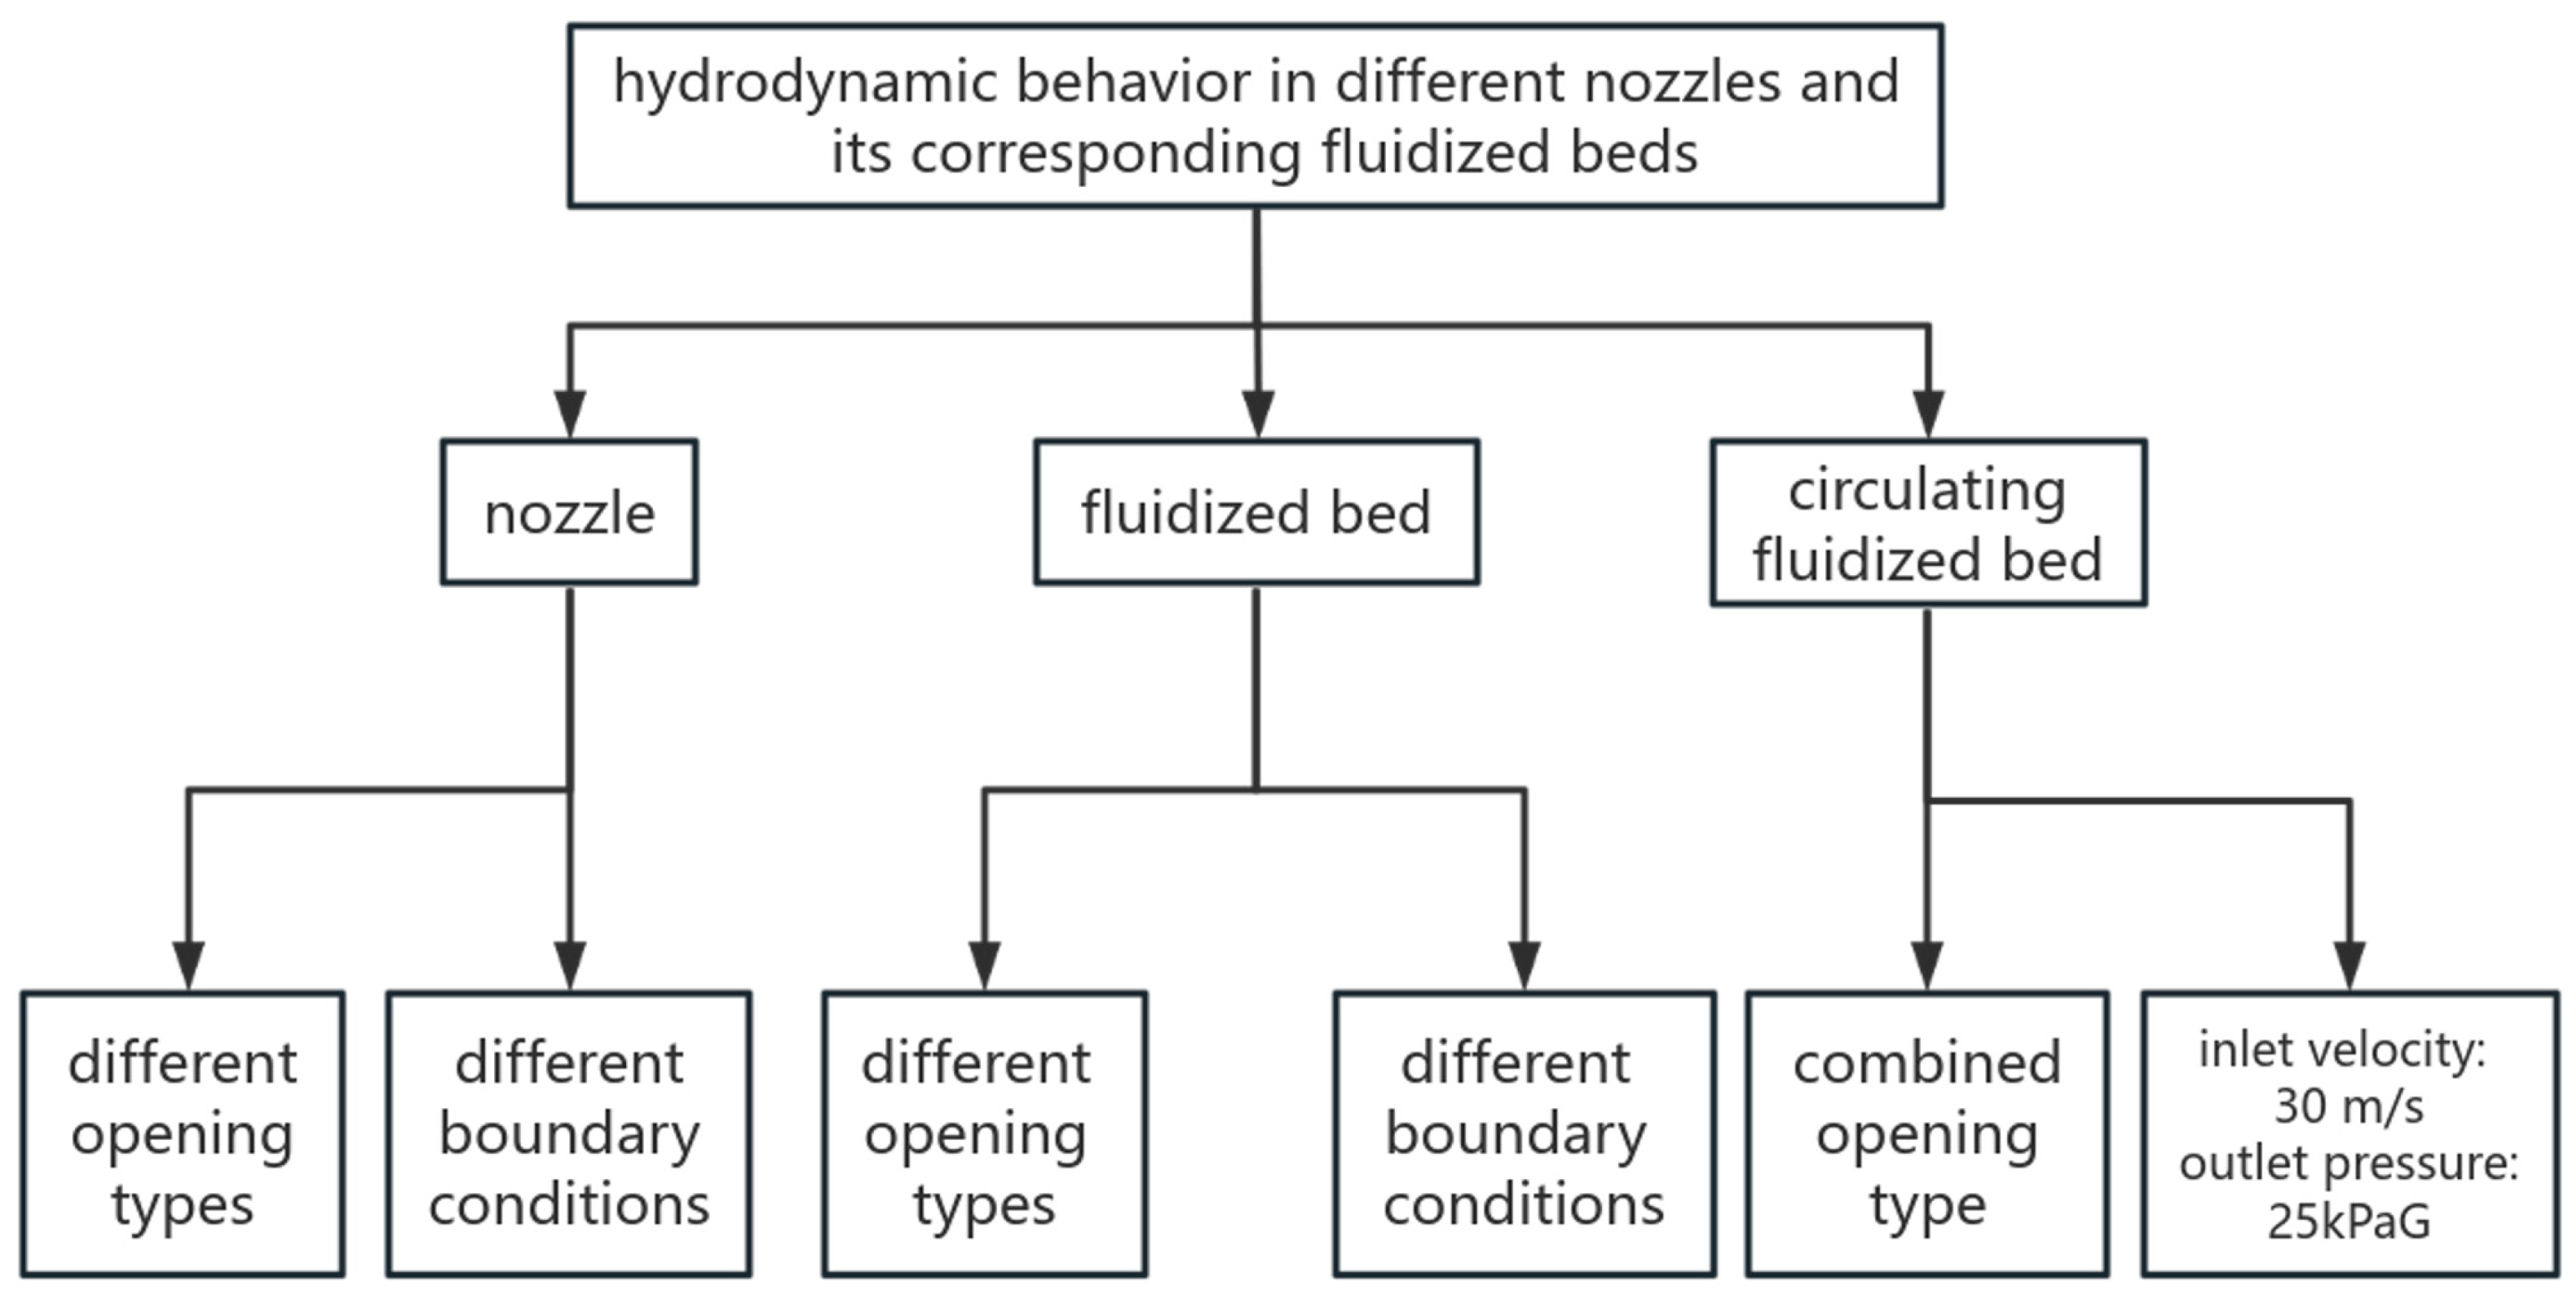
With the help of Fluent simulation software, this paper discusses the hydrodynamic behavior of the nozzles with different opening types—the top opening type, side opening type, and combined opening type (both top and side opening)—and the corresponding fluidized bed gasifier. A conceptual drawing of the modeling process is shown in Figure 1.
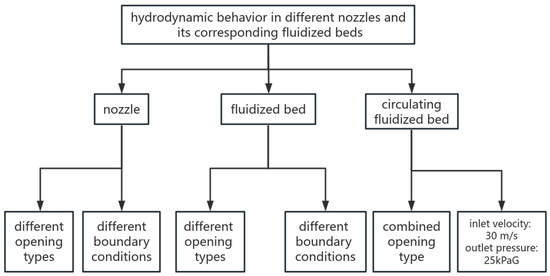
Figure 1.
A conceptual drawing of the modeling process.
2. Model Construction
2.1. Gasification Process of Circulating Fluidized Beds
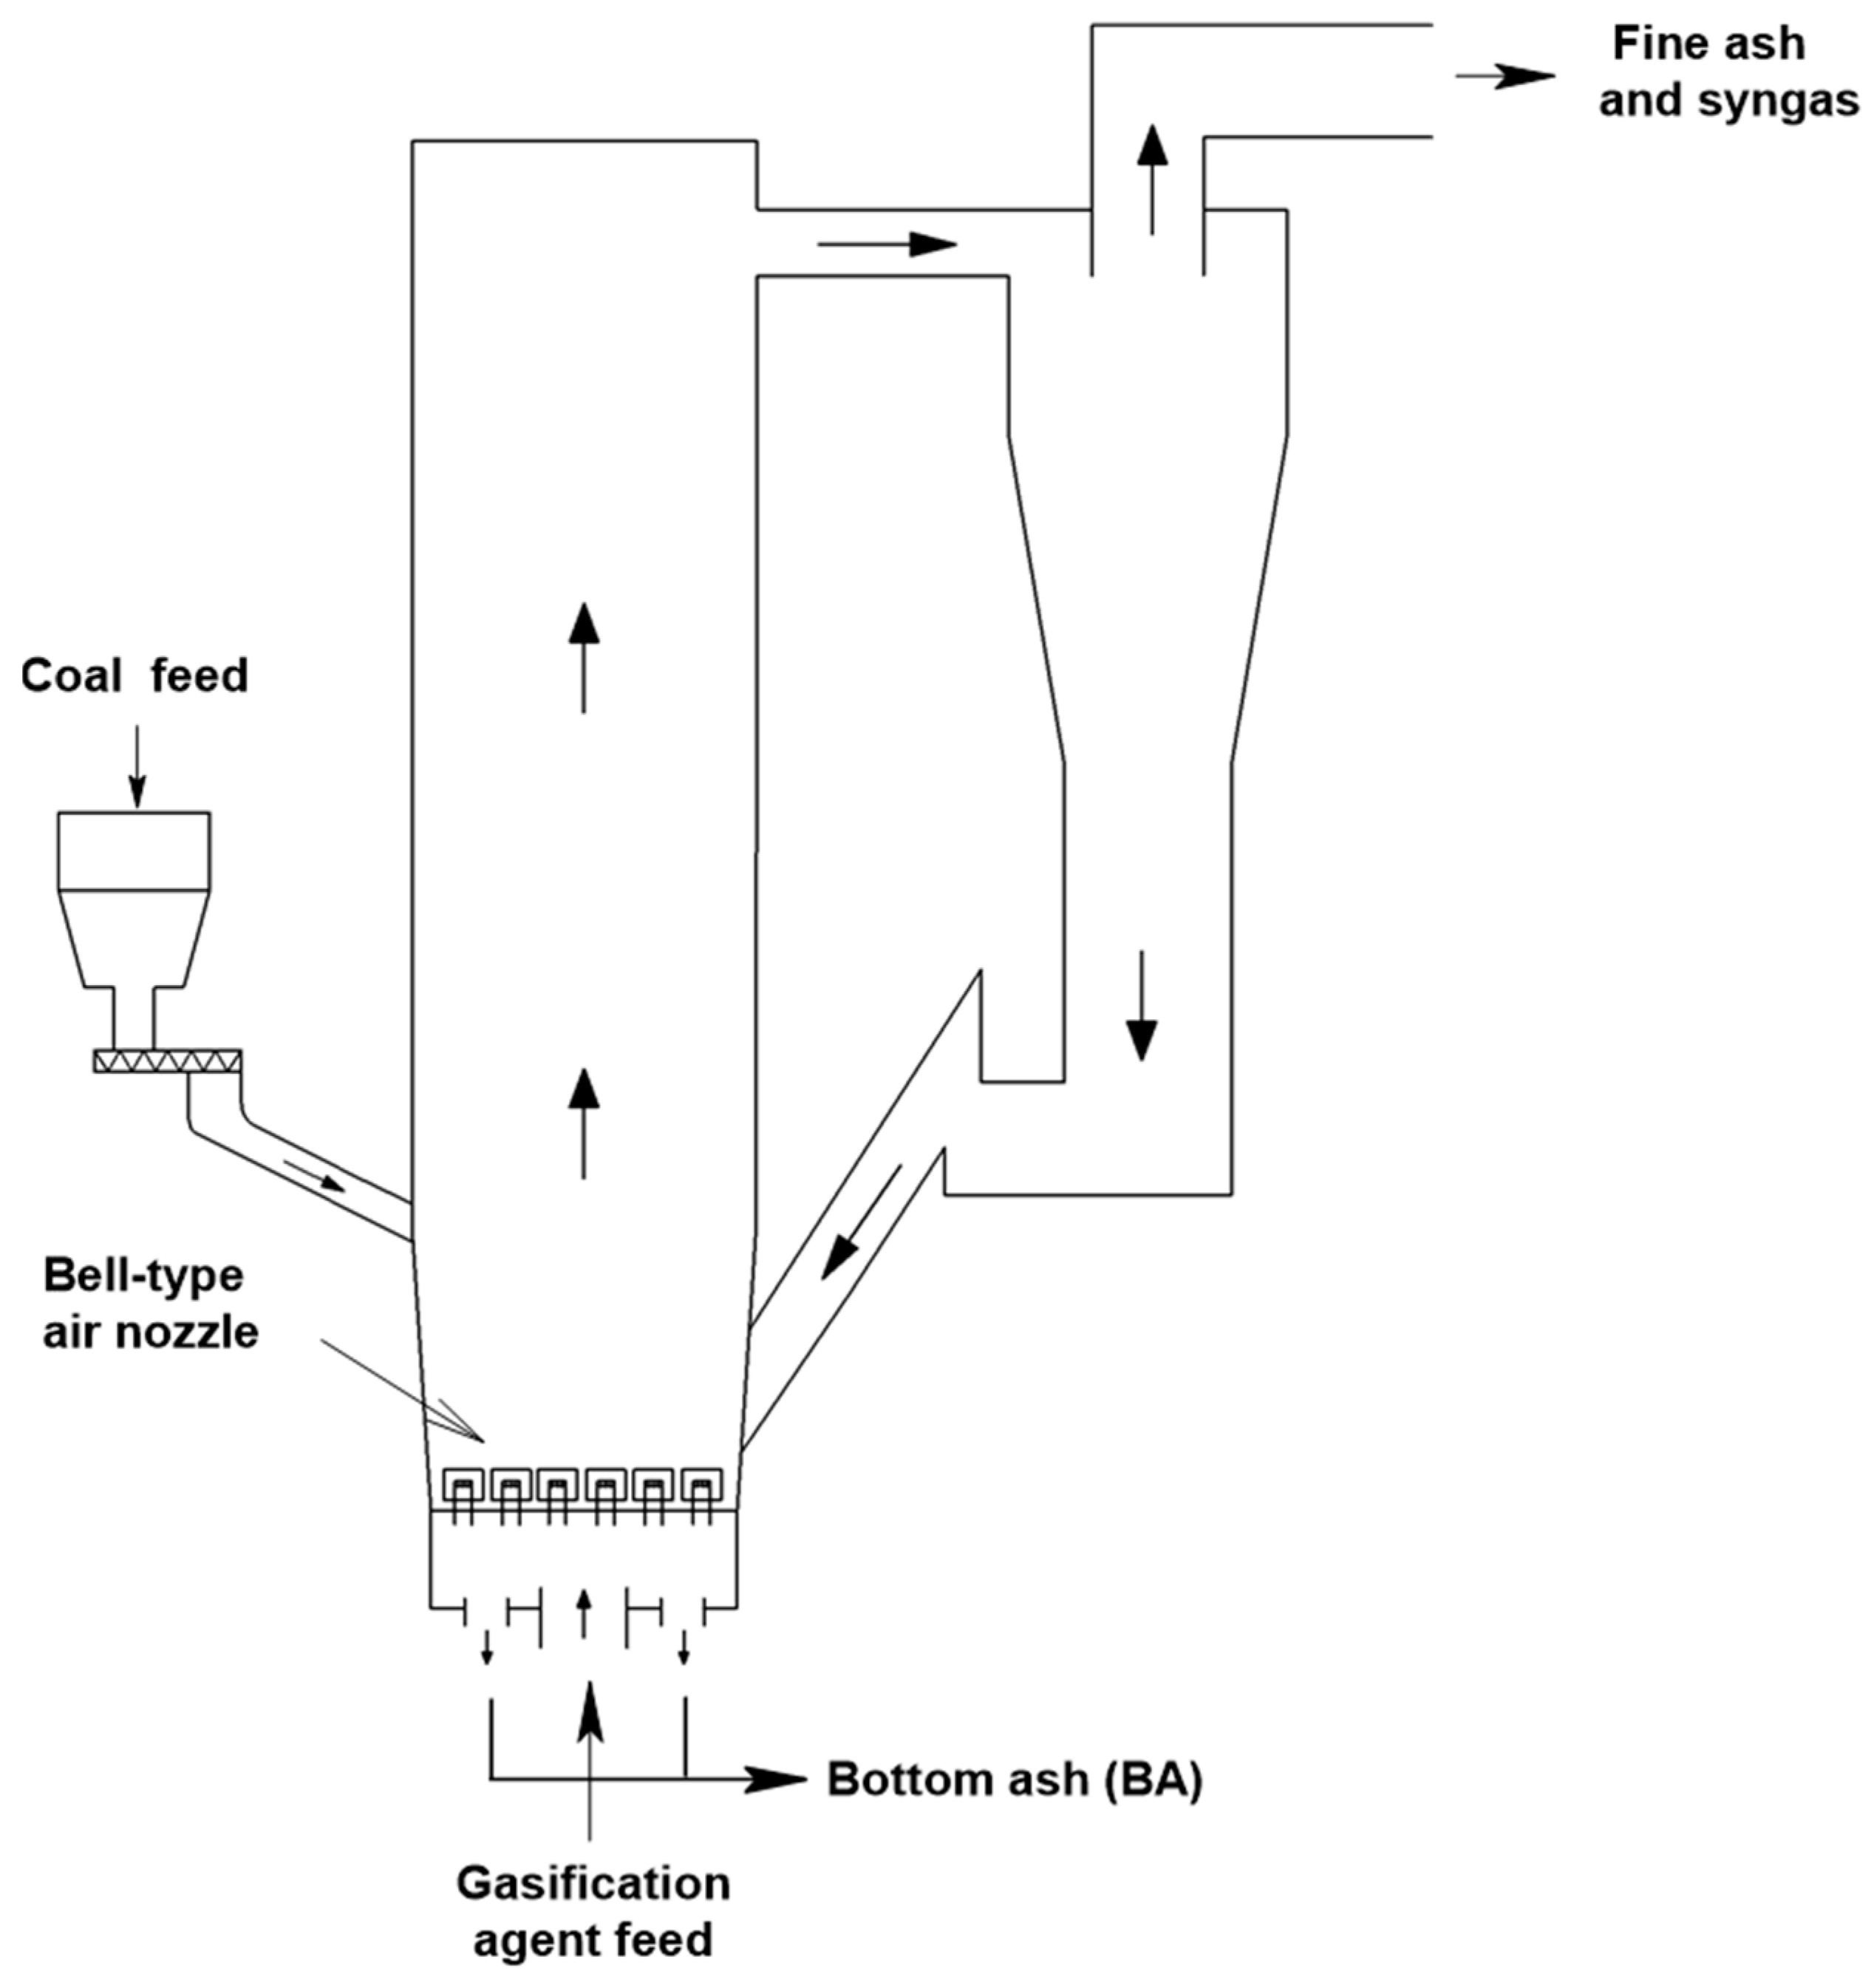
CFB gasifiers mainly consist of an air distribution system at the bottom of the furnace, a gasification area, a cyclone separator at the top of the furnace, and a return device, as shown in Figure 2. Coal particles are added to the gasifier from the feed port, and the agent is distributed through the nozzle, evenly entering the bottom area of the furnace and coming into countercurrent contact with the coal particles from the top. Because the gasification agent has a certain pressure and flow rate, the coal particles are in the fluidization state. In general, coal goes through four stages in the gasification process: drying, pyrolysis, combustion, and gasification. Some of the ash residue after the gasification reaction is dense and discharged from the slag outlet at the bottom of the gasifier as bottom ash (BA) [10]. At the same time, another portion of the less dense particles are carried out by the crude syngas produced by the gasification process. After passing through the cyclone separator, most of the particles are returned to the bottom of the gasifier to participate in the gasification process again, and the finer particles (fly ash, FA) enter into the subsequent separation process.

Figure 2.
Circulating fluidized bed coal gasifier—gasification process (arrows represent the direction of the used materials) [21].
2.2. Slagging and Clogging of the Nozzle
Nozzles play an important role in the process of circulating fluidized bed gasifiers. The contents of alkali and alkaline earth metal elements in the raw coal are usually high, which easily cause slag formation in the furnace during gasification and even clog the nozzle, resulting in failure of the normal operation of the gasification device and even stopping the furnace. Figure 3 shows a picture of the wear of the nozzle and the blockage of the outlet channel after the nozzle operated for a period of time by a company in Zhundong, Xinjiang, China. During the operation of gasifiers, with the deposition of ash and slag, the thermal resistance increases, and the temperature difference between the wall and the tube center increases. At the same time, with the continuous accumulation of blockages, the surface temperature gradually increases. When the temperature rises to the melting point of the deposited ash and slag or above, melting will occur, resulting in complete blockage [21]. Therefore, the quality of the nozzle and the operating environment will directly affect the safe and stable operation of the fluidized bed gasifier.
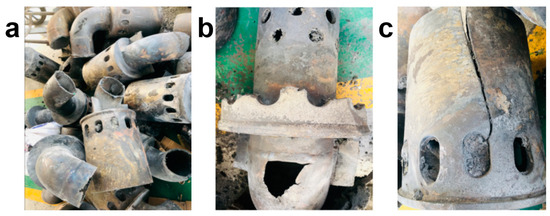
Figure 3.
Wear and blockage of a nozzle. (a) The damaged nozzle of a company’s gasifier. (b) Worn-out nozzle duct. (c) Block back nozzle—the exit channel.
2.3. Physical Model Construction
Figure 4 shows the on-site bell-type nozzle being installed by a company. The bell-type nozzle is composed of two parts: an inner core tube and an outer cover. The inner core tube is connected to the nozzle duct, and the outer cover is located at the bottom of the bed. The inner core tube of the nozzle is generally provided with round holes on the top, while the side wall of the cover is generally provided with oval holes (Figure 5). The gasification agent enters the primary duct in 10 ways through the inlet, and then enters the secondary duct in 3 ways. After that, it enters the annular gap between the inner core tube and the cover, entering into the furnace through the oval hole baffle of the cover. This design can effectively reduce the problem of ash leakage. However, sometimes due to the manufacturing process, installation, and other problems, the holes between adjacent nozzles cannot be effectively blown through, so the air flow of a hole will directly blow into the outer wall of the adjacent nozzles, which easily causes wear of the nozzles [22].
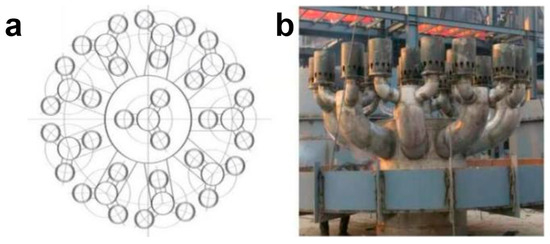
Figure 4.
A bell-shaped nozzle installed by a company. (a) Nozzle arrangement; (b) actual layout.
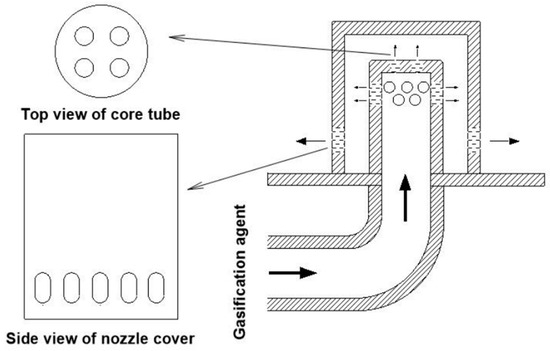
Figure 5.
Structure diagram of bell-shaped nozzle (arrows represent the direction of the gasification agent) [21].
The structure of a bell-type nozzle at the bottom of a gasifier is shown in Figure 5. The upper part of the nozzle comprises a cover and an inner core tube, and the lower part is connected to a secondary air duct. There are four round holes at the top of the inner core tube, while two rows of round holes are opened around the side of the tube (eight holes in each row, evenly staggered). The lower side of the cover has a row of square holes, which are the final outlet of the gasification agent through the nozzle, as shown in Figure 5. In the nozzle, the gasification agent is ejected from the secondary air duct through the hole of the inner core tube. Then, after ejecting, it is deflected into the bottom of the gasifier through the square hole at the lower part of the cover [23].
2.4. Physical Model Simplification and Mesh Division
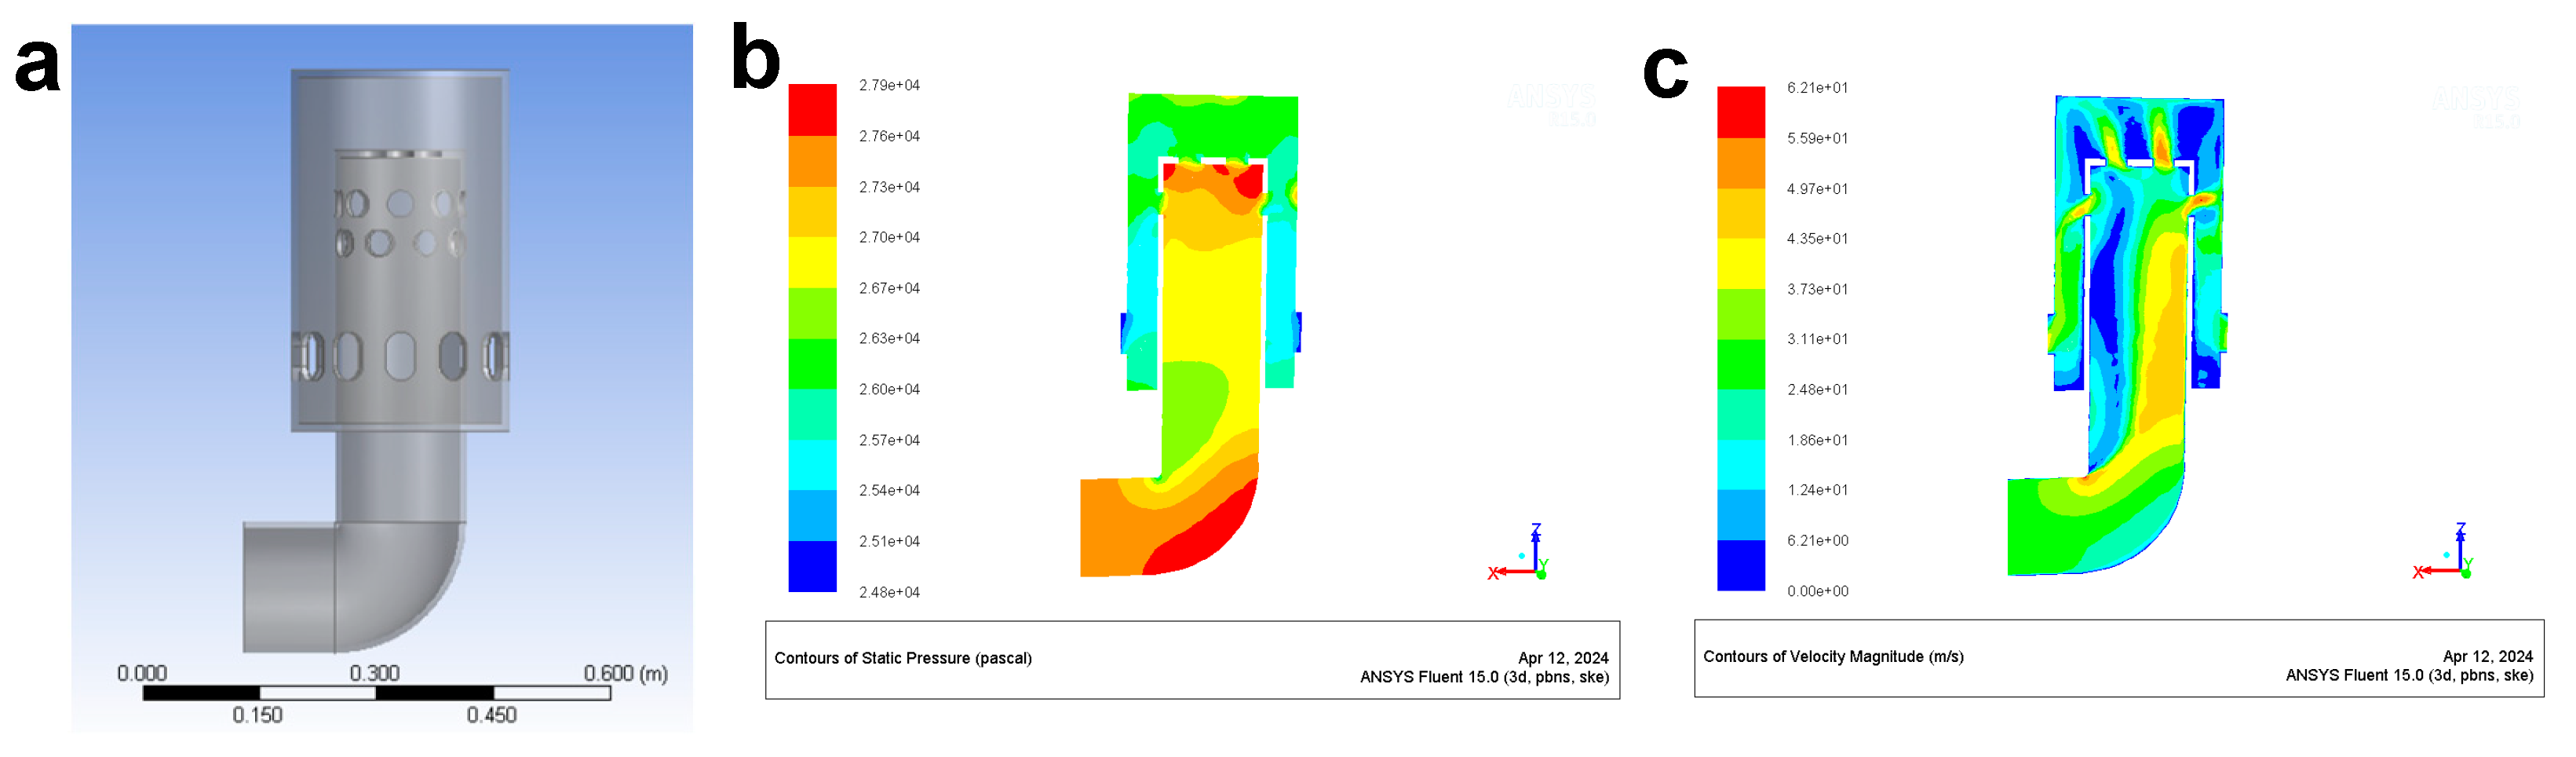
Figure 6 shows the bell-type nozzle model in the workbench and the static pressure contour and velocity contour of the nozzle simulated with 30 m/s of inlet air velocity and 25 kPaG (gage pressure) of outlet pressure as the boundary conditions.
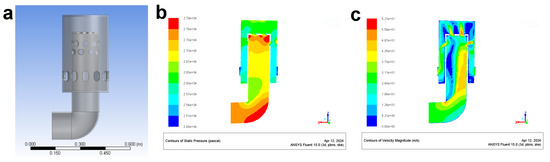
Figure 6.
Bell nozzle model and contours. (a) Three-dimensional model; (b) cross-section static pressure contour; (c) cross-section velocity contour.
As shown in Figure 6a, the bell-type nozzle is mainly composed of an inner core tube and a cover. To observe the distribution of static pressure and velocity inside the nozzle more clearly, especially in the inner core tube, the cross-section (in the three-dimensional coordinates of “X”-0, “Y”-1, and “Z”-0) of the bell-shaped nozzle was simulated. In the static pressure contour in Figure 6b, red indicates areas with high pressure, and blue indicates areas with low pressure. It can be seen that the areas where the pressure of the bell-shaped nozzle is high are near the feed port of the nozzle and the exit of the inner core tube, and coking and blockage easily form in these two places. The color meanings of the velocity contour are the same as those of the static pressure contour. It can be seen in Figure 6c that when the air flow enters the duct, it has a high gas velocity and reaches its peak value when it passes through the nozzle elbow. After flowing out through the inner core tube outlet, the flow velocity near the nozzle cover drops to an extremely low point. It can also be seen in the figure that both the pressure and velocity in the annular gap are low.
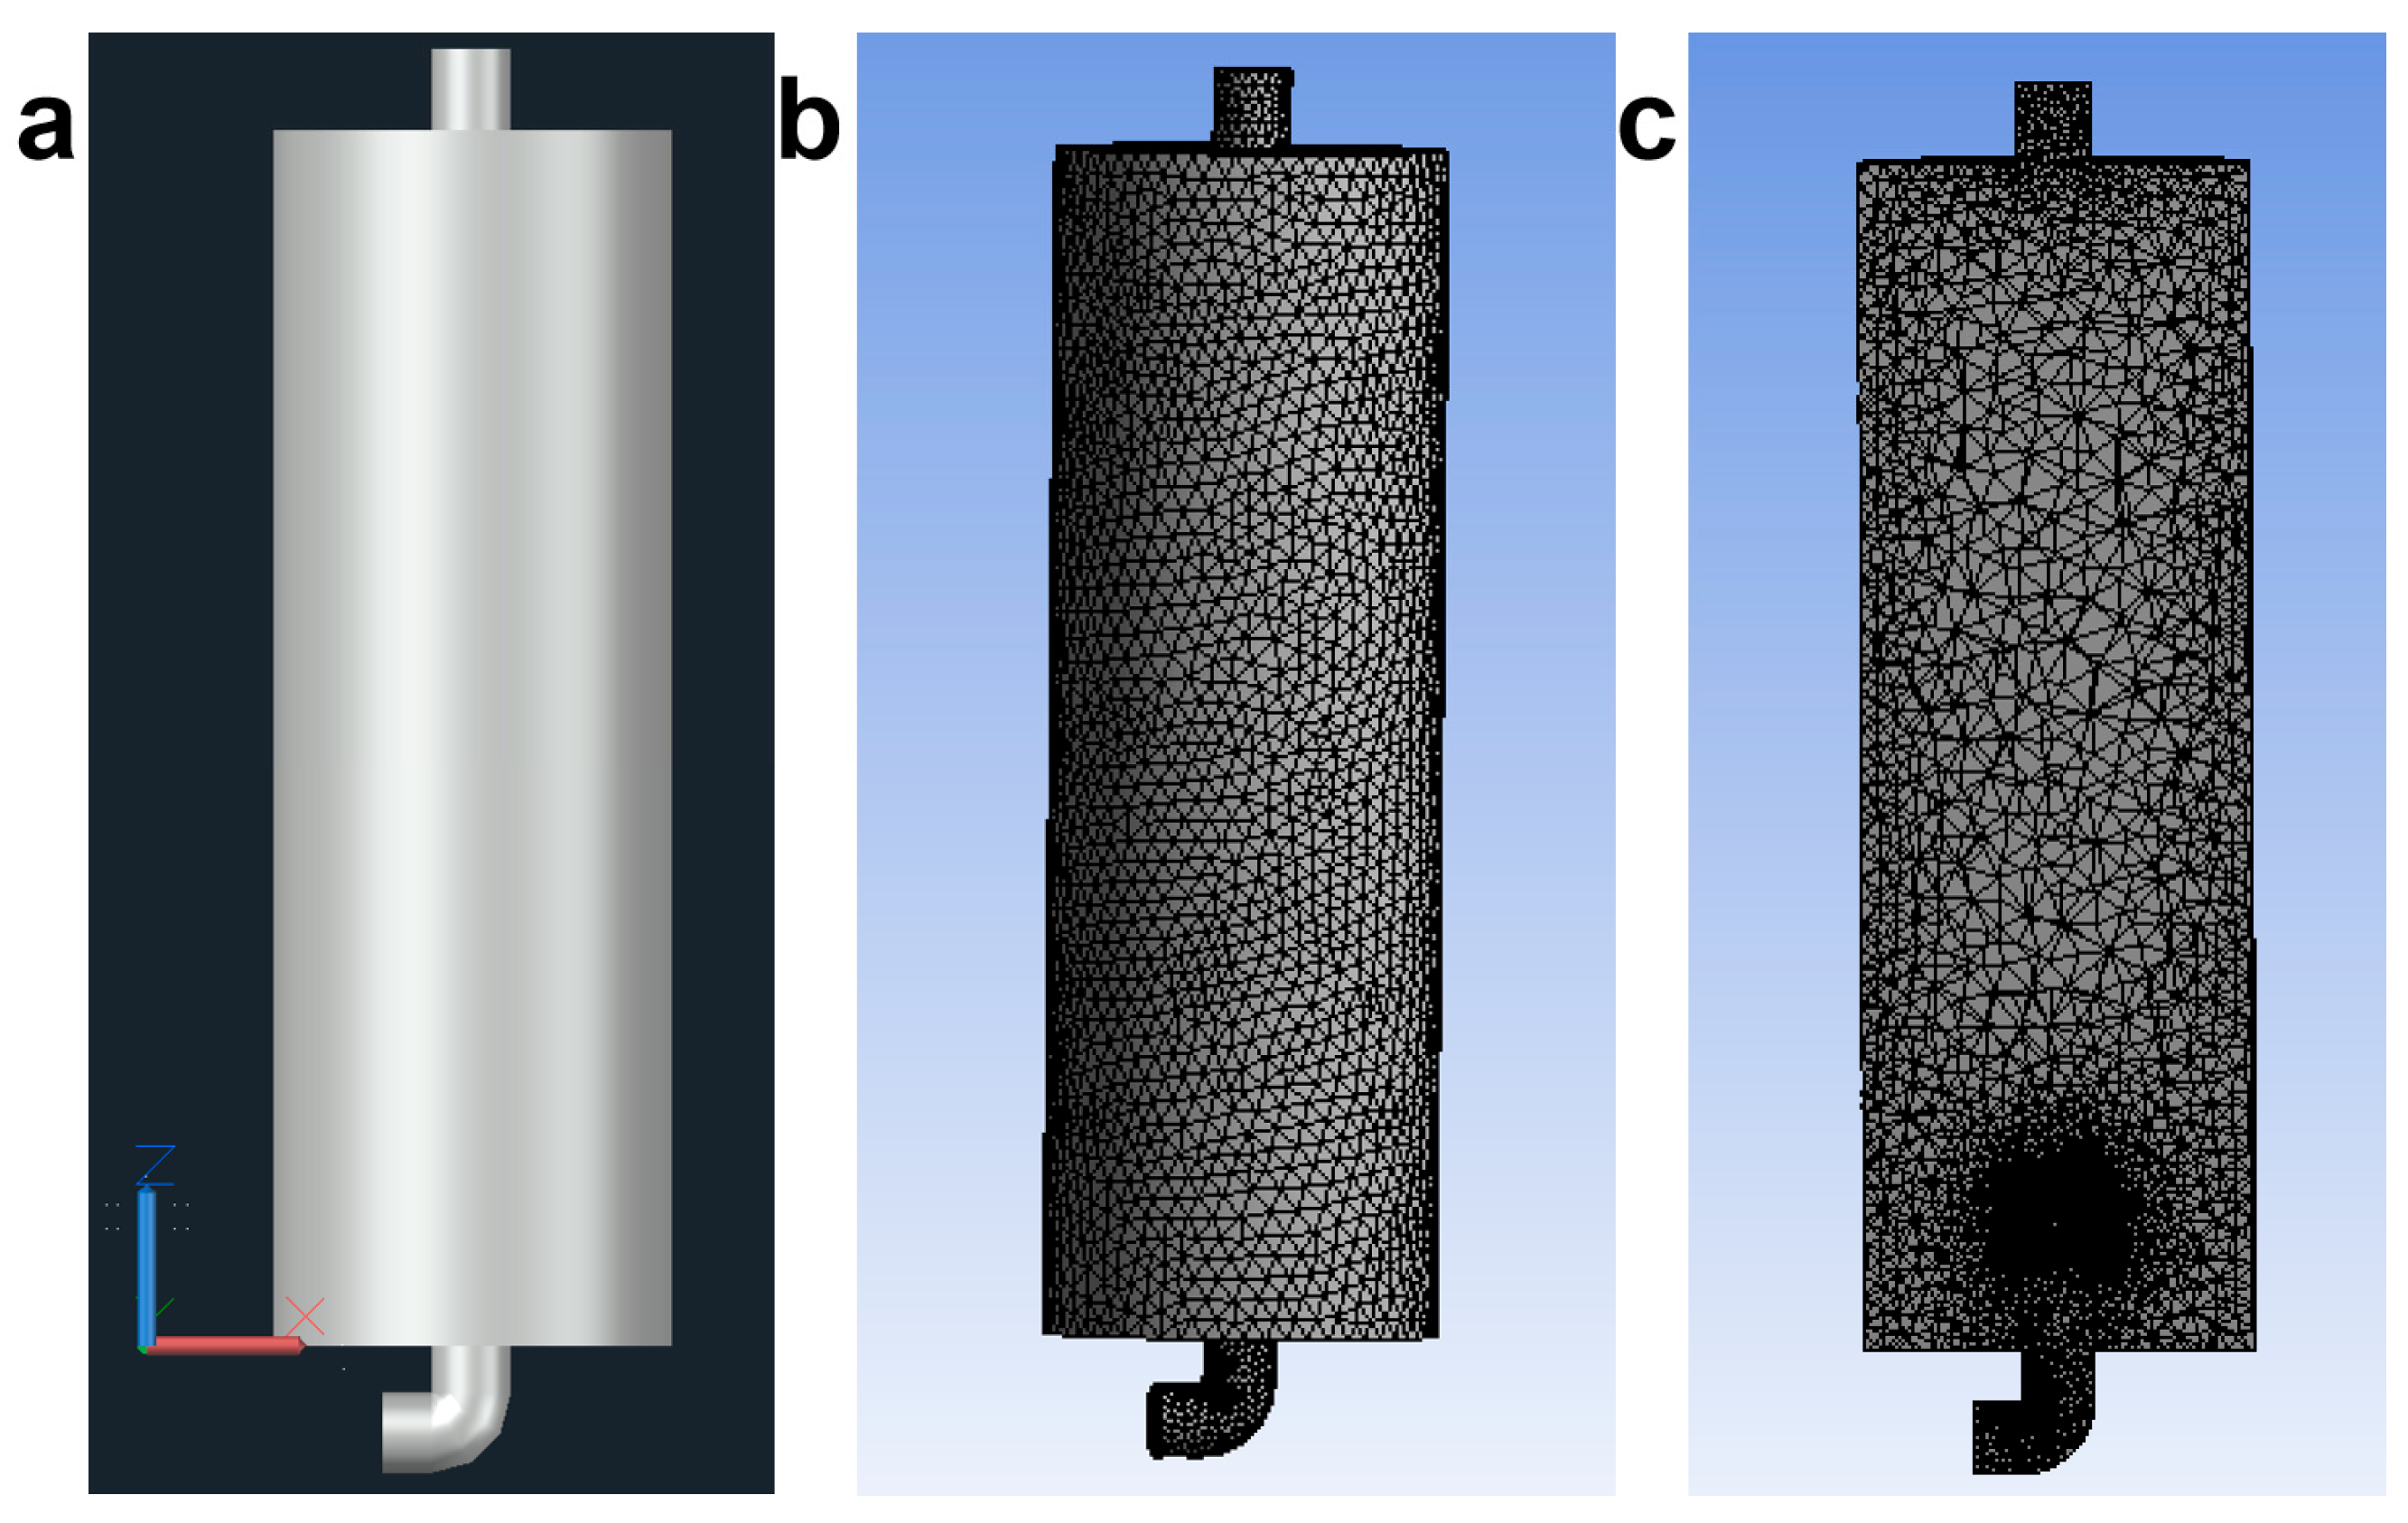
To sum up, most of the pressure and velocity in the bell-type nozzle are concentrated in the inner core tube, and the gap between the cover and tube only accounts for a small part. To reduce the amount of calculation, improve the simulation efficiency, and facilitate the subsequent simulation of more complex models, the simulation object was simplified into only an inner core tube model, as shown in Figure 7a, and its dimensions are shown in Table 1. In particular, the subsequent simulation objects were a simplified nozzle model, gasifier model, and circulating fluidized bed model.
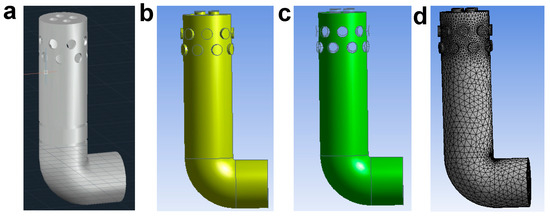
Figure 7.
Physical simplification model of nozzle and its meshing. (a) Three-dimensional model diagram; (b) imported ANSYS workbench; (c) wall setting; (d) meshing.

Table 1.
Nozzle dimensions.
Figure 7 presents a single-nozzle CAD (3D) model, its fluid domain settings, inlet and outlet, wall settings, and meshing diagram with a combination opening type (top and side openings). The mesh was automatically divided by the workbench mesh, and five layers of expansion layers were set. Considering that it is complex at the elbow of the nozzle and near the opening, mesh refinement was applied to both areas. Since the nozzle model has the structure of an elbow, which is more suitable to calculate in the RNG k-ε model, its equations are Equations (1) and (2) [20]. The difference between the realizable k-ε model and the standard and RNG k-ε models is that, regarding the turbulent viscosity balance, the coefficient of Cμ is variable, not constant. The software code automatically calculates Cμ by sensitizing it to the mean flow and the turbulence of k-ε to ensure realizability that is the positivity of the normal stresses and Schwarz inequality for shear stresses [12].
where
(C1 = , η0 = 4.377, β = 0.012, η = , S = , Sij = , µt = , C2 = 1.68, Cµ = 0.085, σk = 0.085, σε = 0.7179).
The default values for the other parameters were selected.
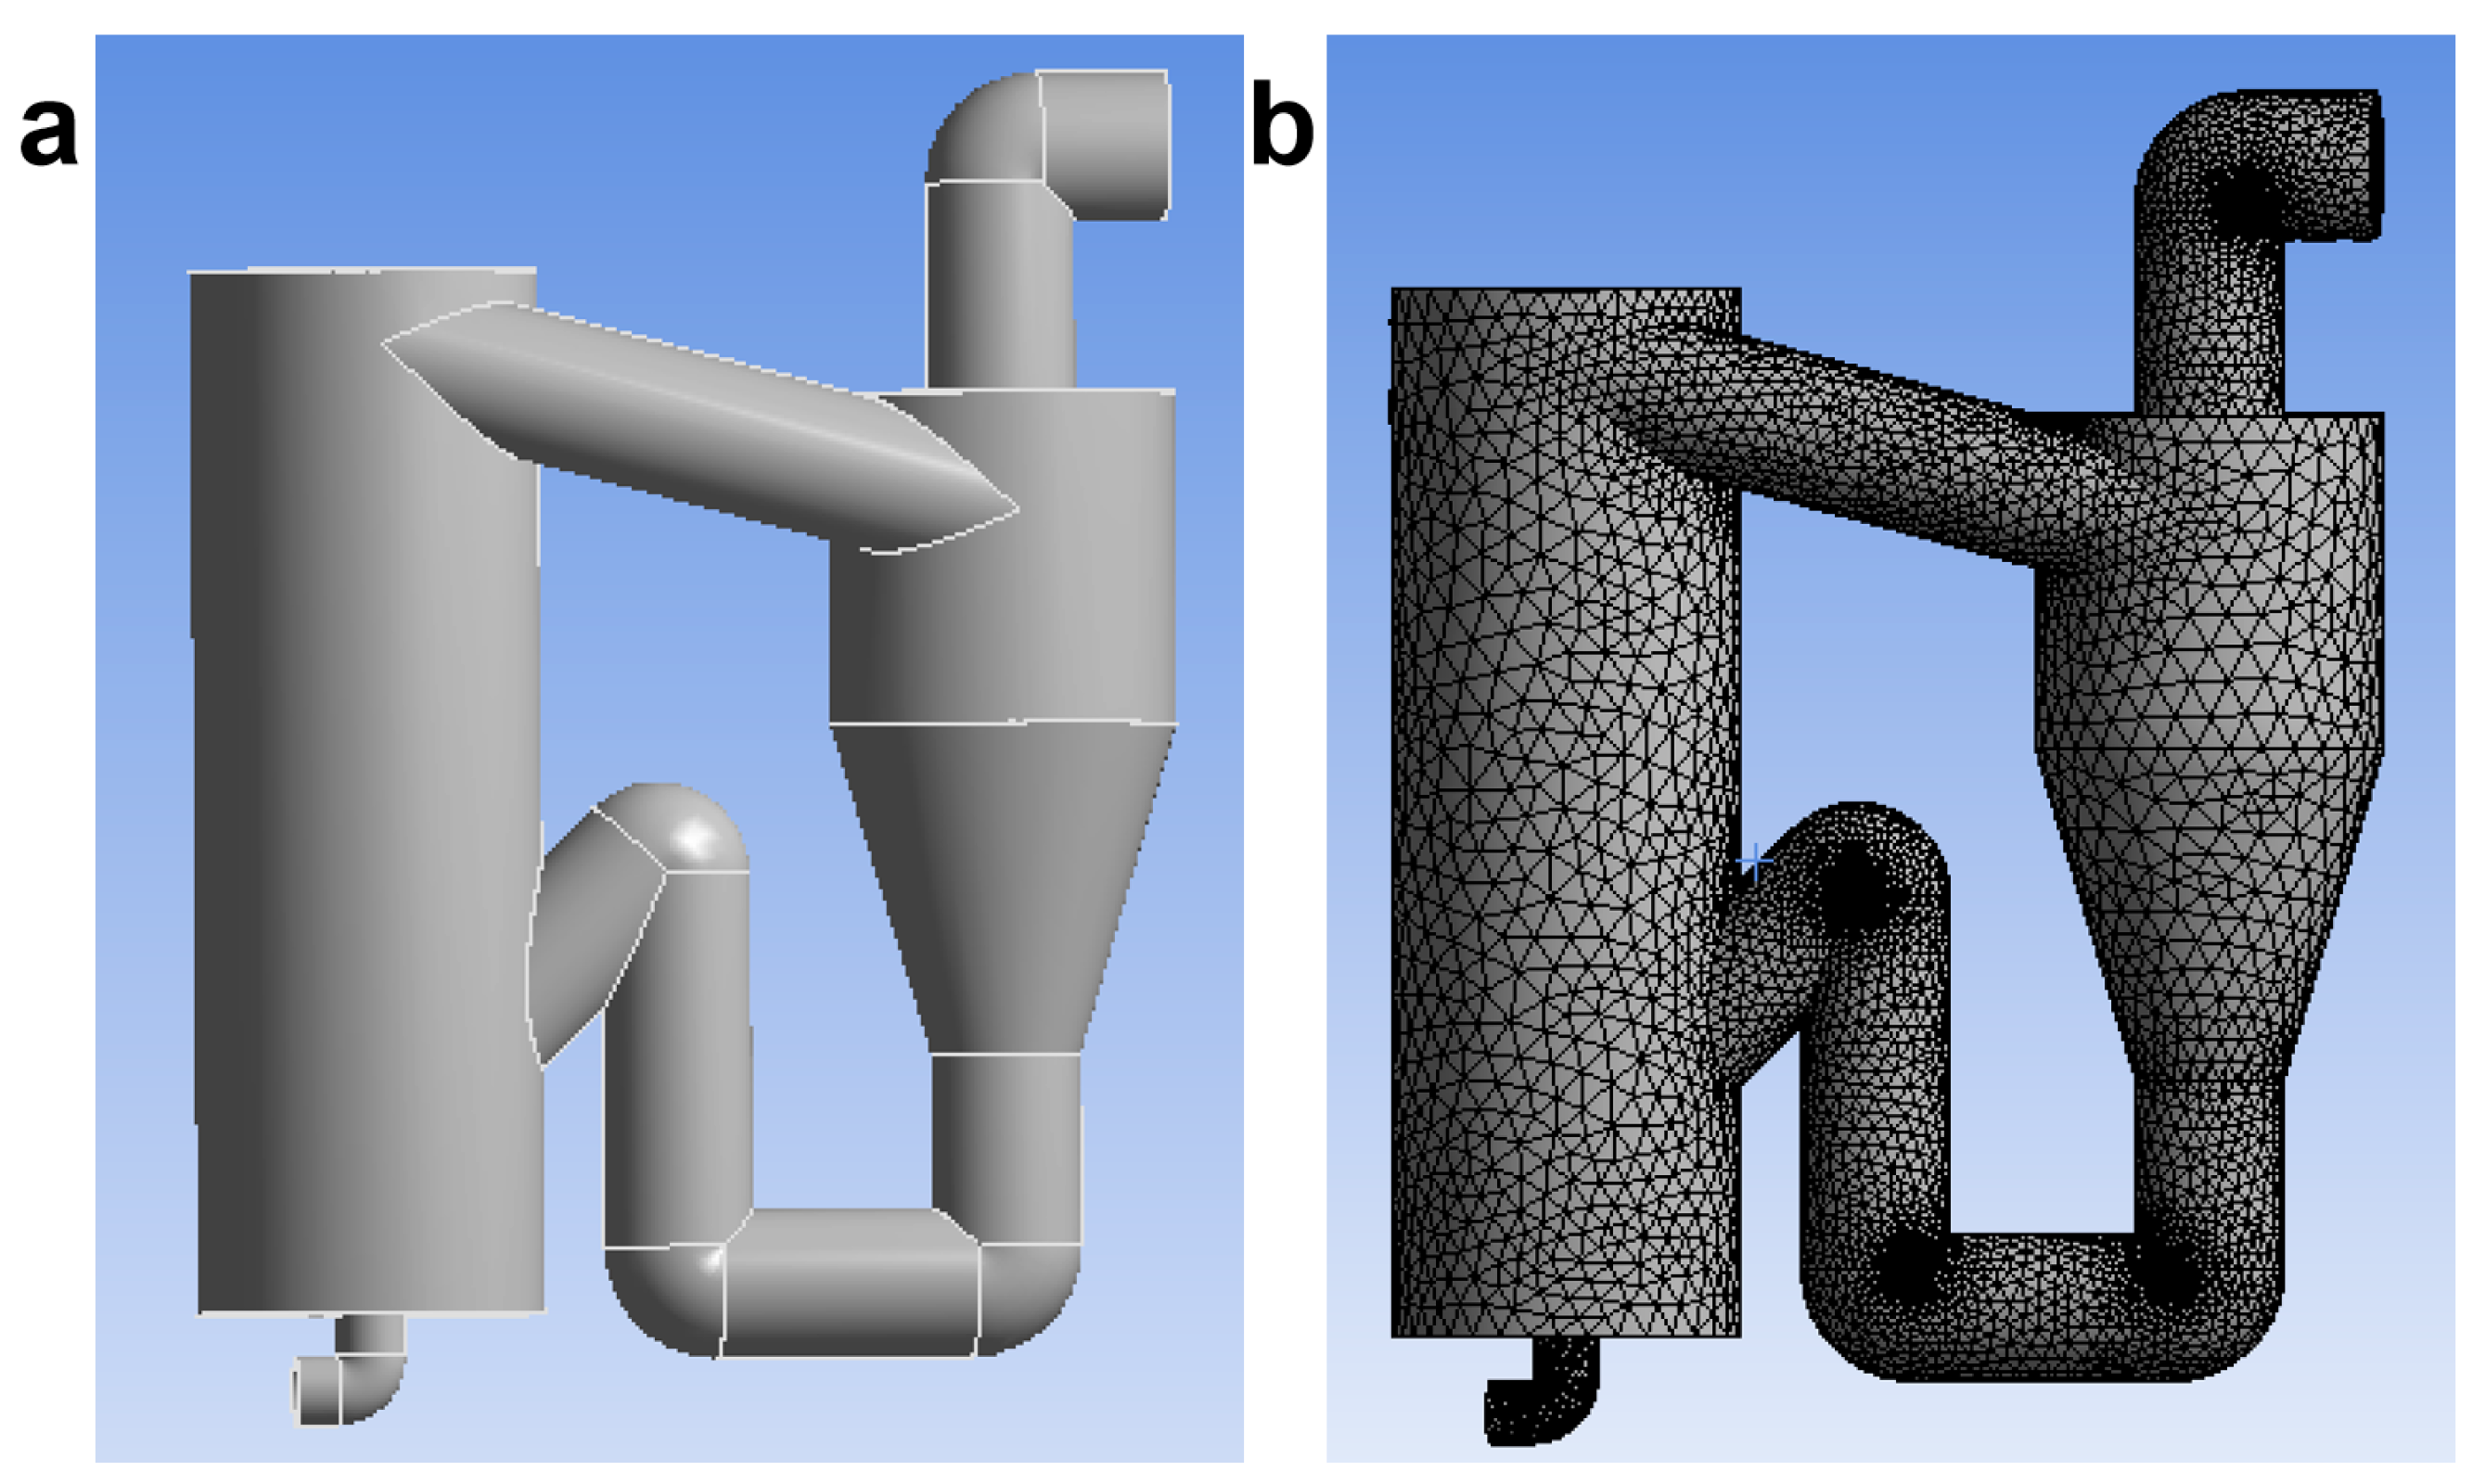
Figure 8 presents a CAD (3D) model and meshing diagram of a single-nozzle gasifier with a combined opening type. Unstructured tetrahedral mesh was used to divide the gasifier. This paper adopted a relative spare mesh division for the main body of the gasifier and a local mesh refinement method for the nozzle to improve the overall mesh quality and ensure the accuracy of the calculation results. The calculation model adopted the standard k-ε model, and its equation is formally equivalent to the RNG k-ε [20] (where, C1 = 1.44, C2 = 1.92, Cµ = 0.09, σk = 1.0, and σε = 1.3). The reason for this might be that although the model is large, the changes that need to be paid attention are the same as that of the single nozzle. So, the standard k-ε calculation model, which is more easily convergent, was chosen to reduce the calculation amount and time.
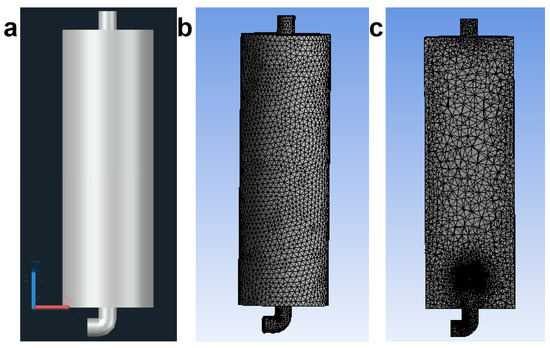
Figure 8.
Physical simplification model of gasifier and its meshing. (a) Three-dimensional model diagram; (b) meshing; (c) meshing of cross-section.
Figure 9 shows the simplified CFB gasifier and the corresponding meshing diagram. The model was composed of a nozzle, main body of the gasifier, and a cyclone separator. The overall entrance was set as the nozzle feed port (gasification agent), and the overall exit was set as the exit of separator. In the meshing process, the whole CFB gasifier was automatically divided by mesh, and a local mesh refinement method for the nozzle, elbow, and cyclone separator was applied. The realizable k-ε model was selected as the calculation model. Its equation is more complex [20] because it includes more details in the flow process, especially for circulating fluidized beds with a cyclone separator, and the calculation results are more accurate than those of the k-ε model.
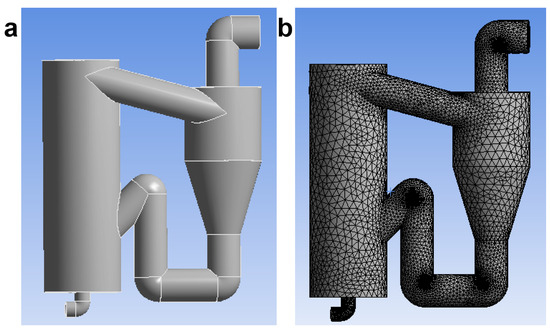
Figure 9.
Model simplification and meshing of circulating fluidized bed gasifier. (a) Three-dimensional model diagram; (b) meshing.
Before the simulation calculation, the system unit was changed to mm, and the value of the gravity field in the Z-axis direction was set to −9.81 m/s2. The boundary condition at the inlet of the nozzle was set to the inlet velocity, and the outlet boundary condition was set to the outlet pressure. The wall surface was set to be stable and non-slip. The coupling method of SIMPLEC for the velocity and pressure was chosen not only because of its good stability but also for the relaxation factor, which can be properly amplified in the calculation. The initialization calculation method is standard initialization, as shown in Table 2.
Table 2.
Parameters and method settings.
3. Results and Discussion
3.1. Simulation of Hydrodynamic Behavior in a Single Nozzle
3.1.1. Simulation of Hydrodynamic Behavior in Nozzles with Different Opening Types
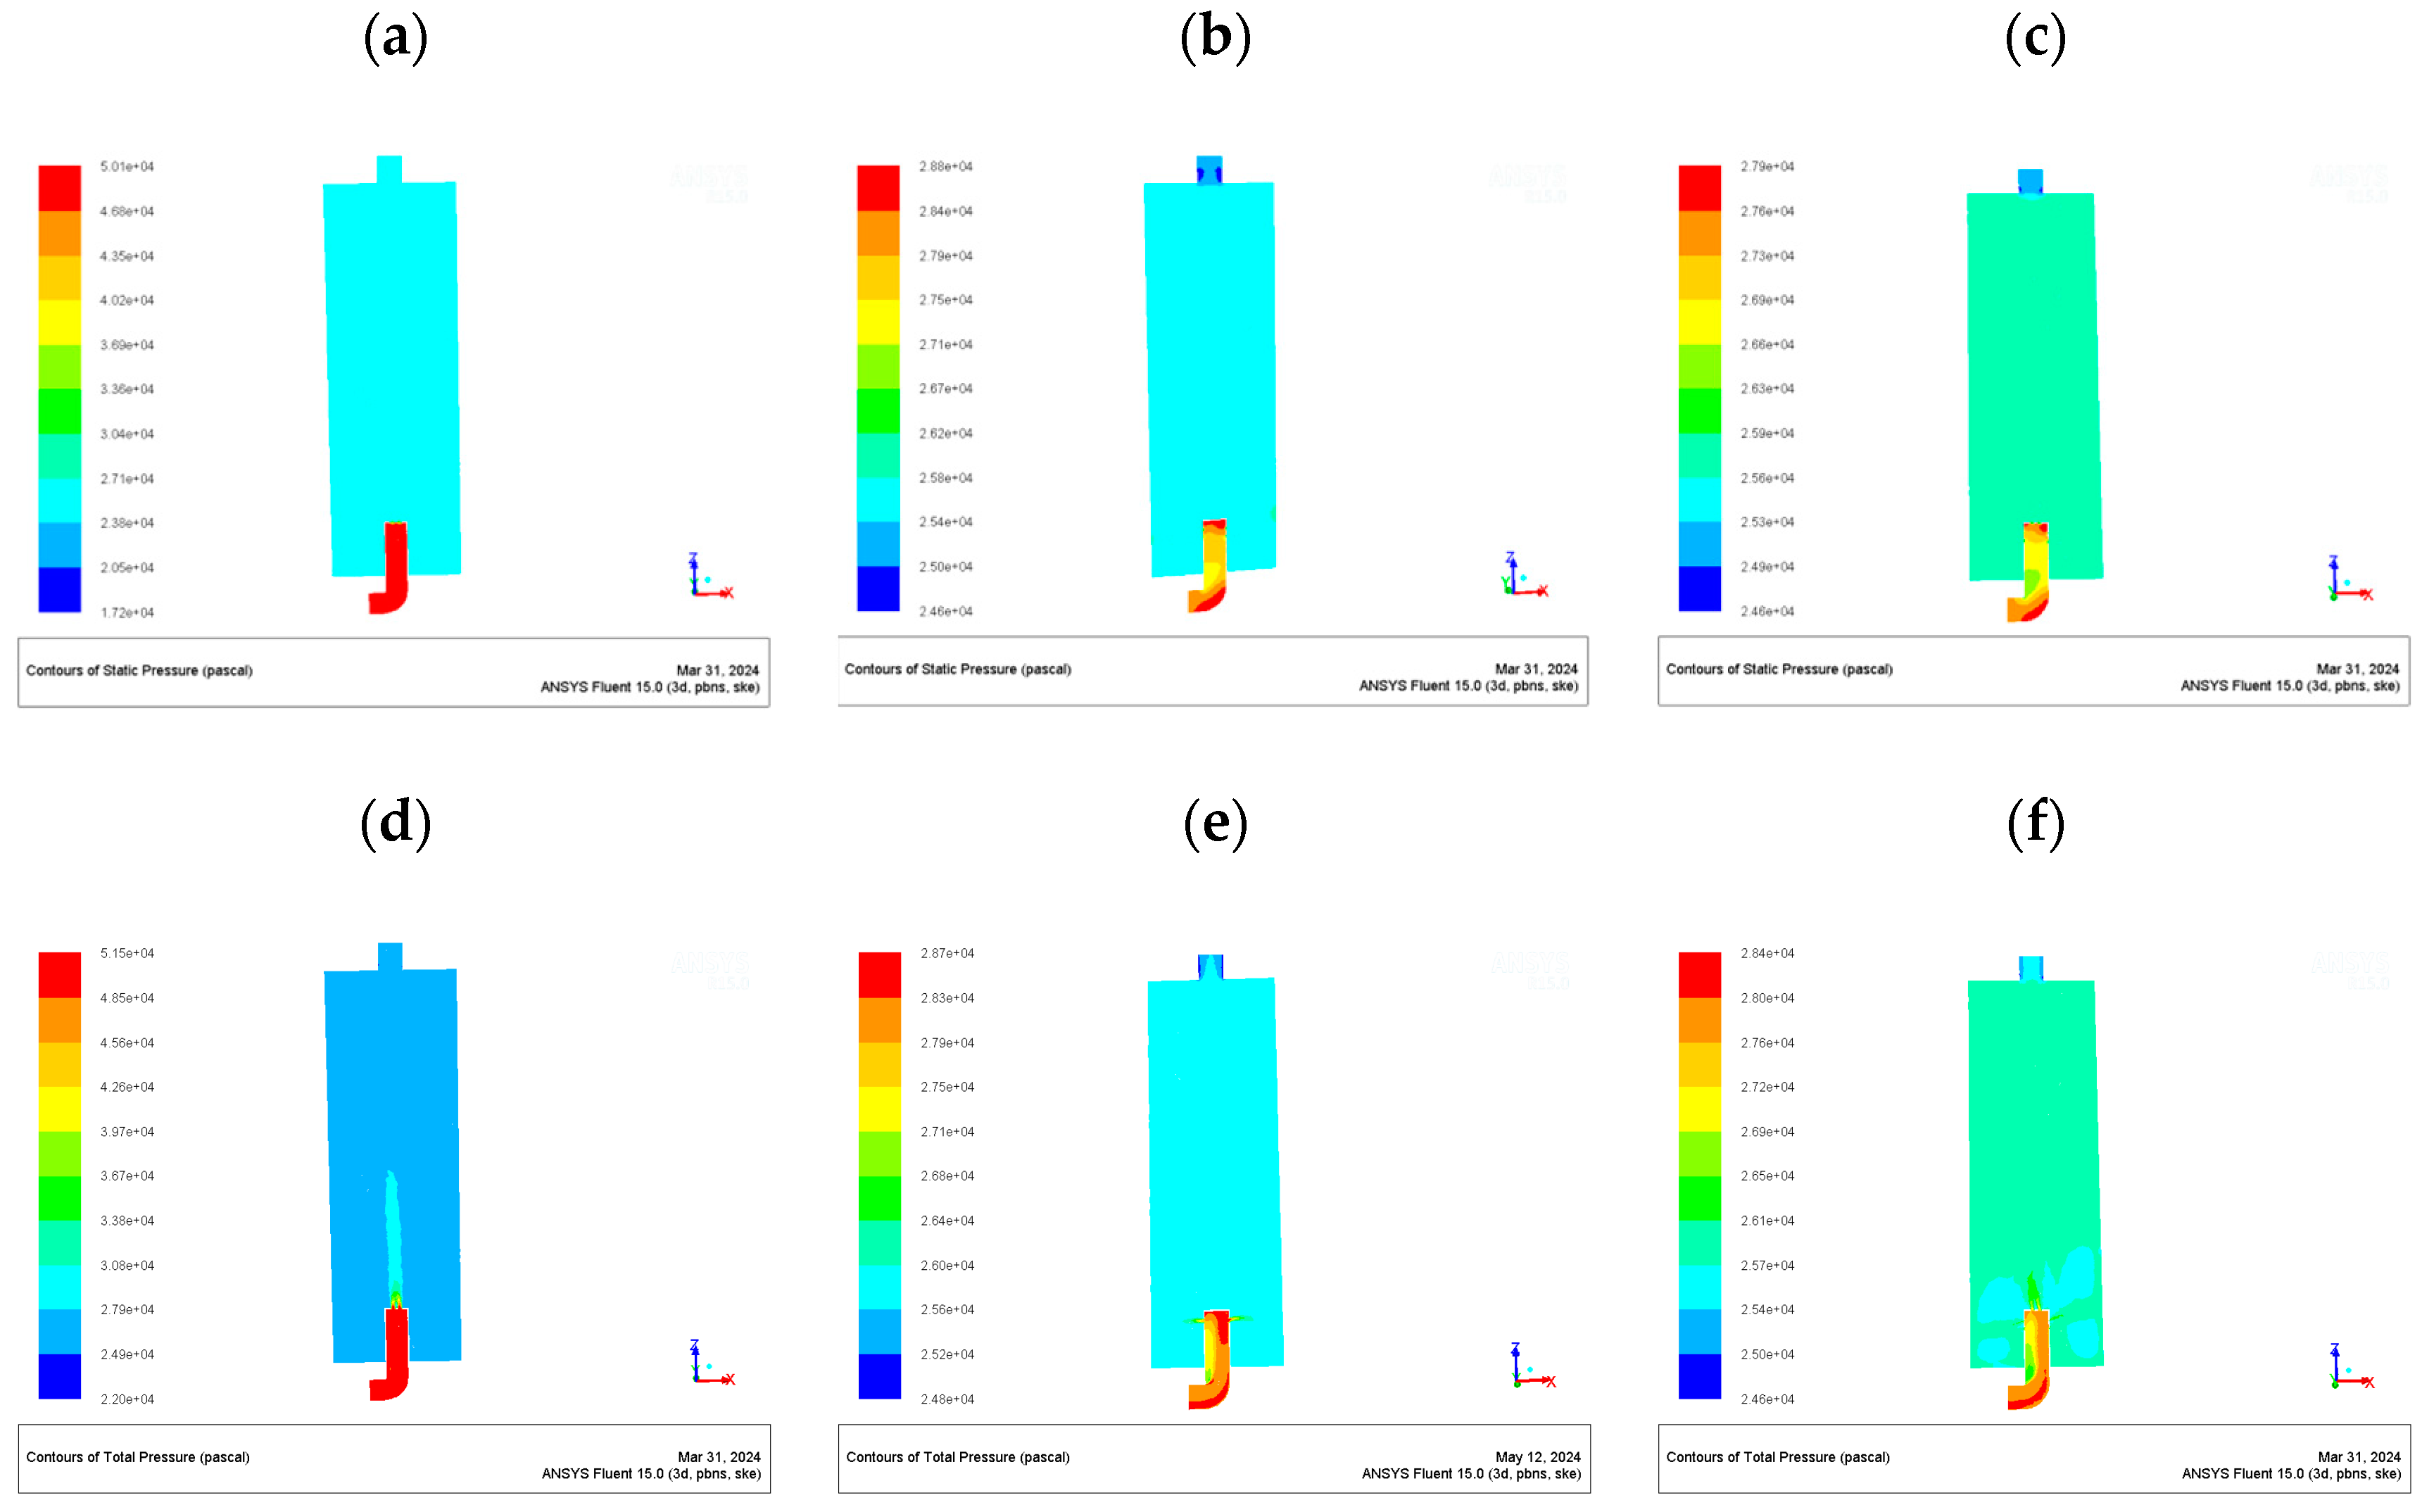
First, the opening type was investigated. There are three opening types: a top opening only, a side opening only, and combination opening (both top and side openings). The boundary conditions of an inlet velocity of 30 m/s and an outlet pressure of 25 kPaG were simulated, as shown in Figure 10 and Figure 11, giving the simulation results of the static pressure, total pressure, and velocity distribution. (Since speed and pressure were mainly considered in this paper, it was only necessary to ensure that the residual error was less than 10−3 in the simulation calculation, and the energy simulation required less than 10−6).
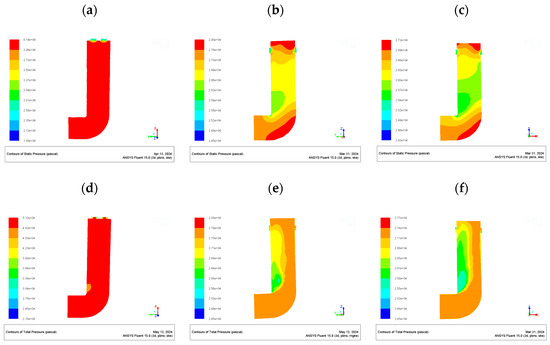
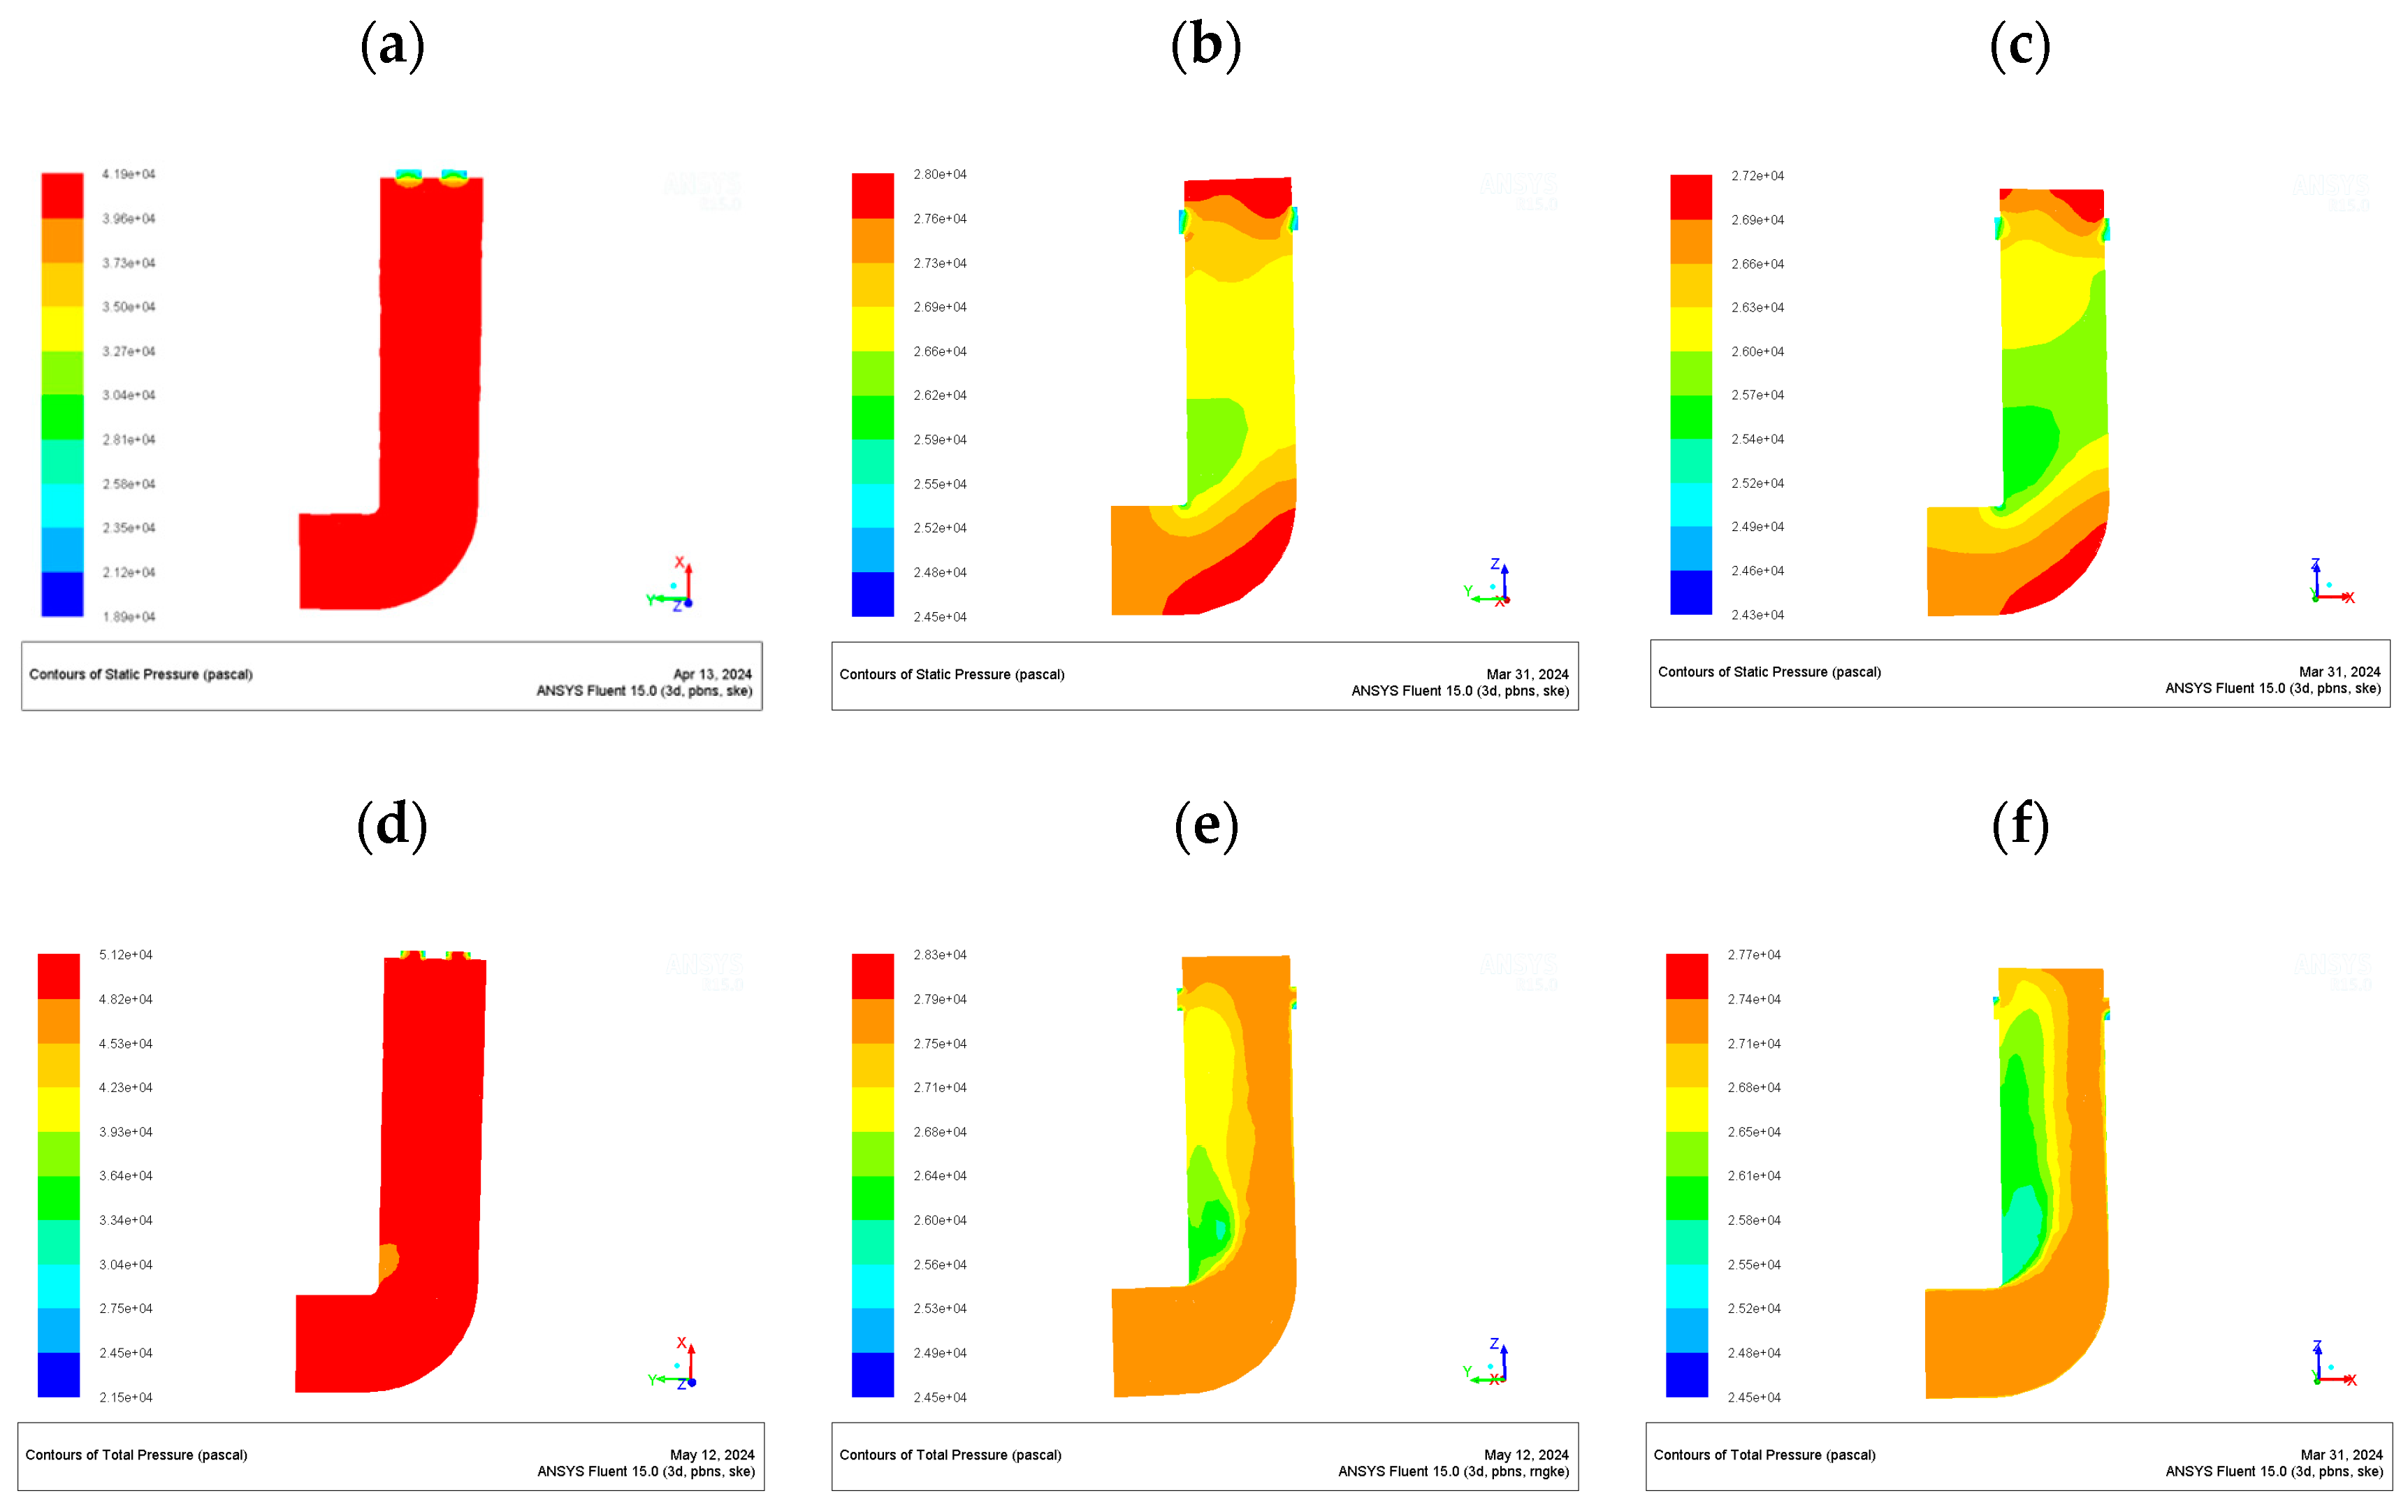
Figure 10.
Contours of static pressure and total pressure. (a) Top opening only, (b) side opening only, and (c) combined opening for static pressure. (d) Top opening only, (e) side opening only, and (f) combined opening for total pressure.

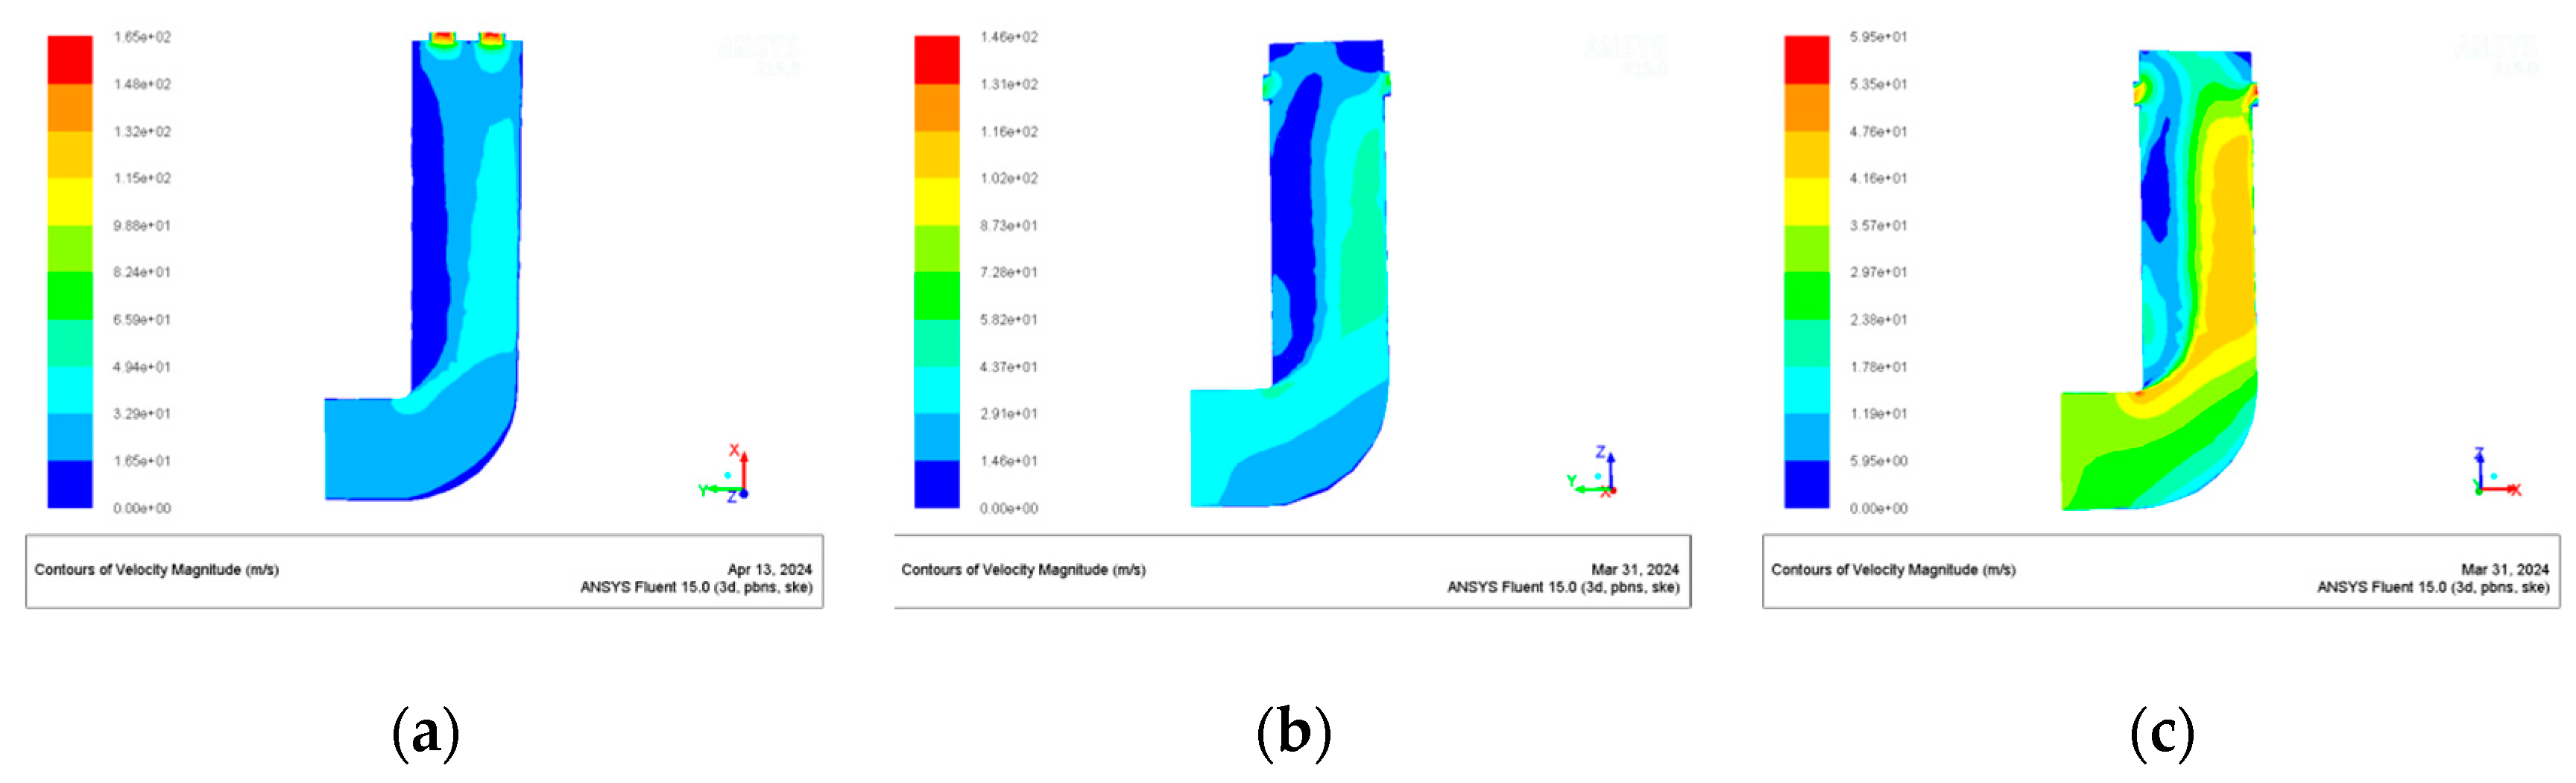
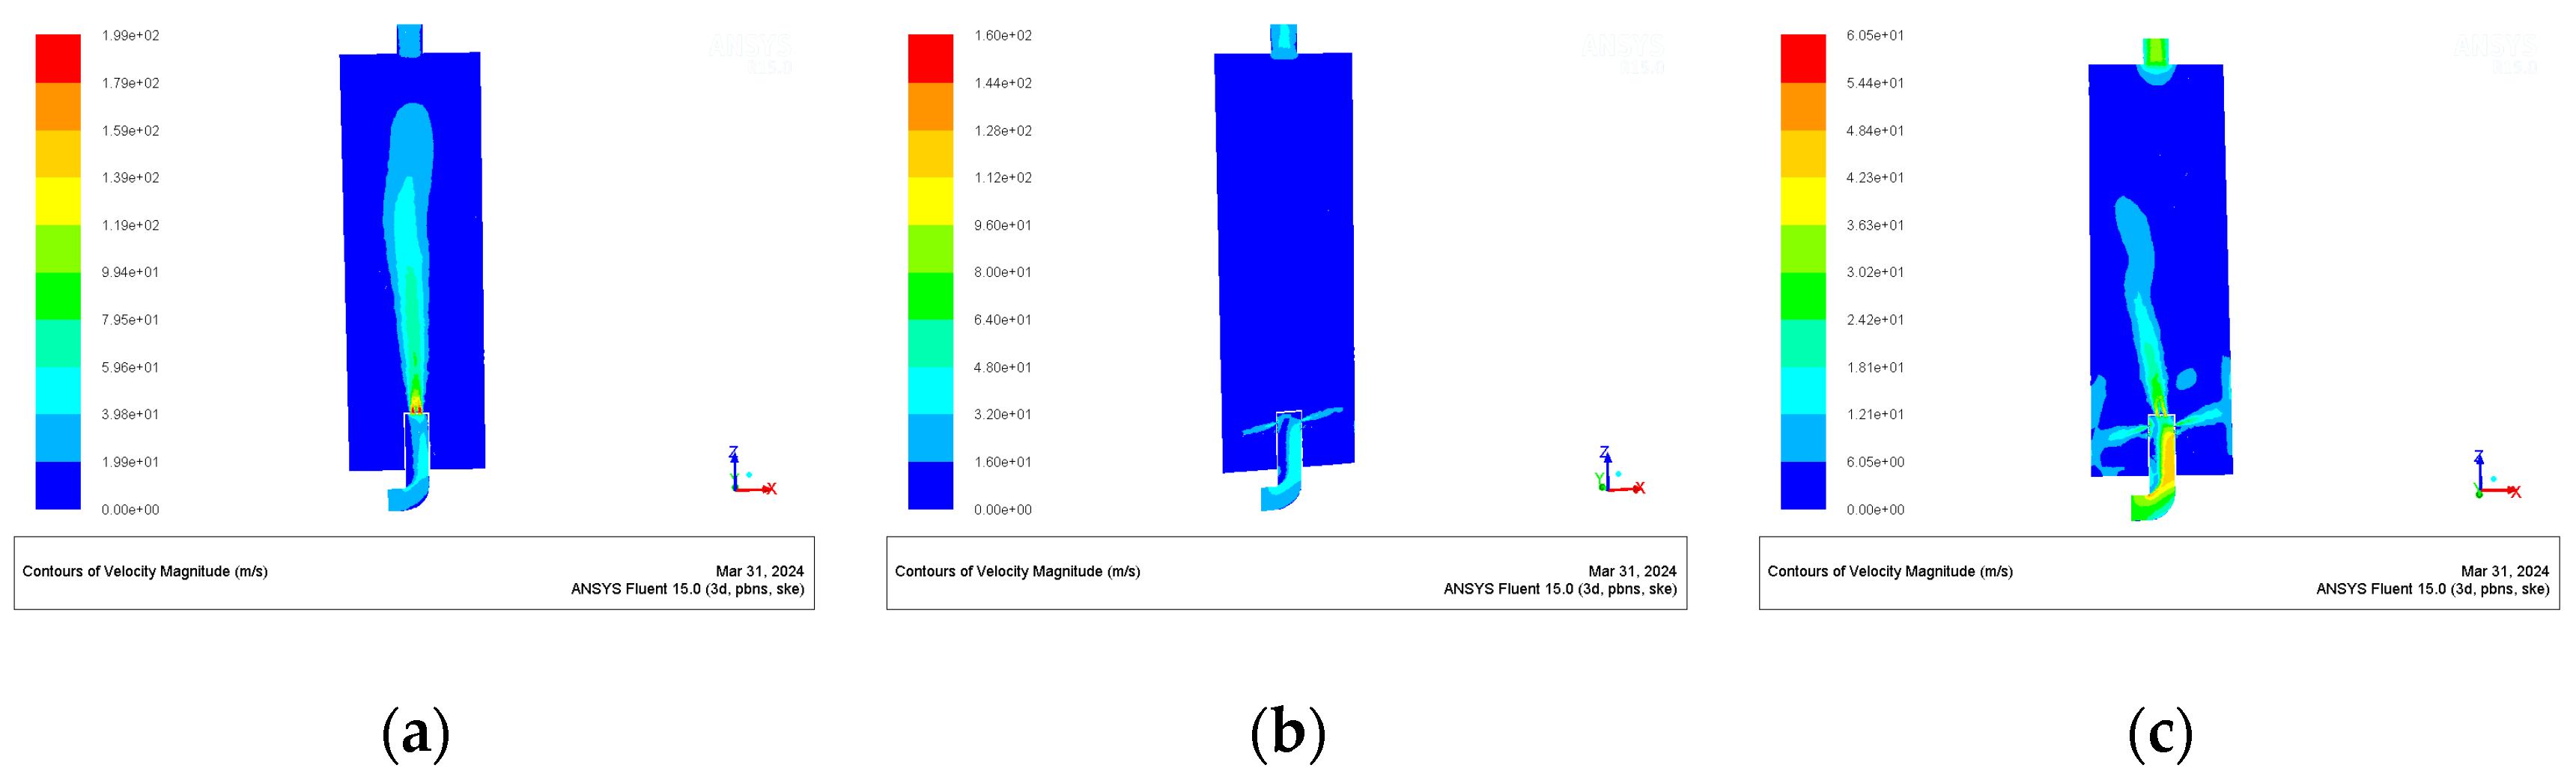
Figure 11.
Contours of velocity. (a) Top opening only; (b) side opening only; (c) combined opening.
It can be seen in Figure 10 that when only the top opening and only the side opening were selected, the colors in the contours are obviously darker than those for the combined opening nozzle, indicating that the pressure inside the nozzle of the former was much higher than that of the latter. Especially in the combined opening nozzle, the pressure at the elbow and top of the nozzle was lower than that of the other two types. And this trend can be more clearly observed in the total pressure contour. In theory, reducing the pressure inside the nozzle can ease wear around the nozzle elbow and top.
As can be seen in Figure 11, the pressure in the nozzle with the combined opening was significantly higher than that of the other two types, indicating that the velocity changed greatly. This phenomenon was particularly obvious near the hole of the core tube at the top of the nozzle. In theory, high velocity is conducive to enhancing the disturbance of particles in the top region, effectively alleviating the formation of deposition and blockage and reducing the dead zone area, thus preventing furnace slag particles from entering the core tube and strengthening the anti-leakage slag performance of the nozzle.
To sum up, we chose the combined opening type of nozzle for the subsequent simulation.
3.1.2. Simulation of Different Inlet Velocities with Combined Opening Type
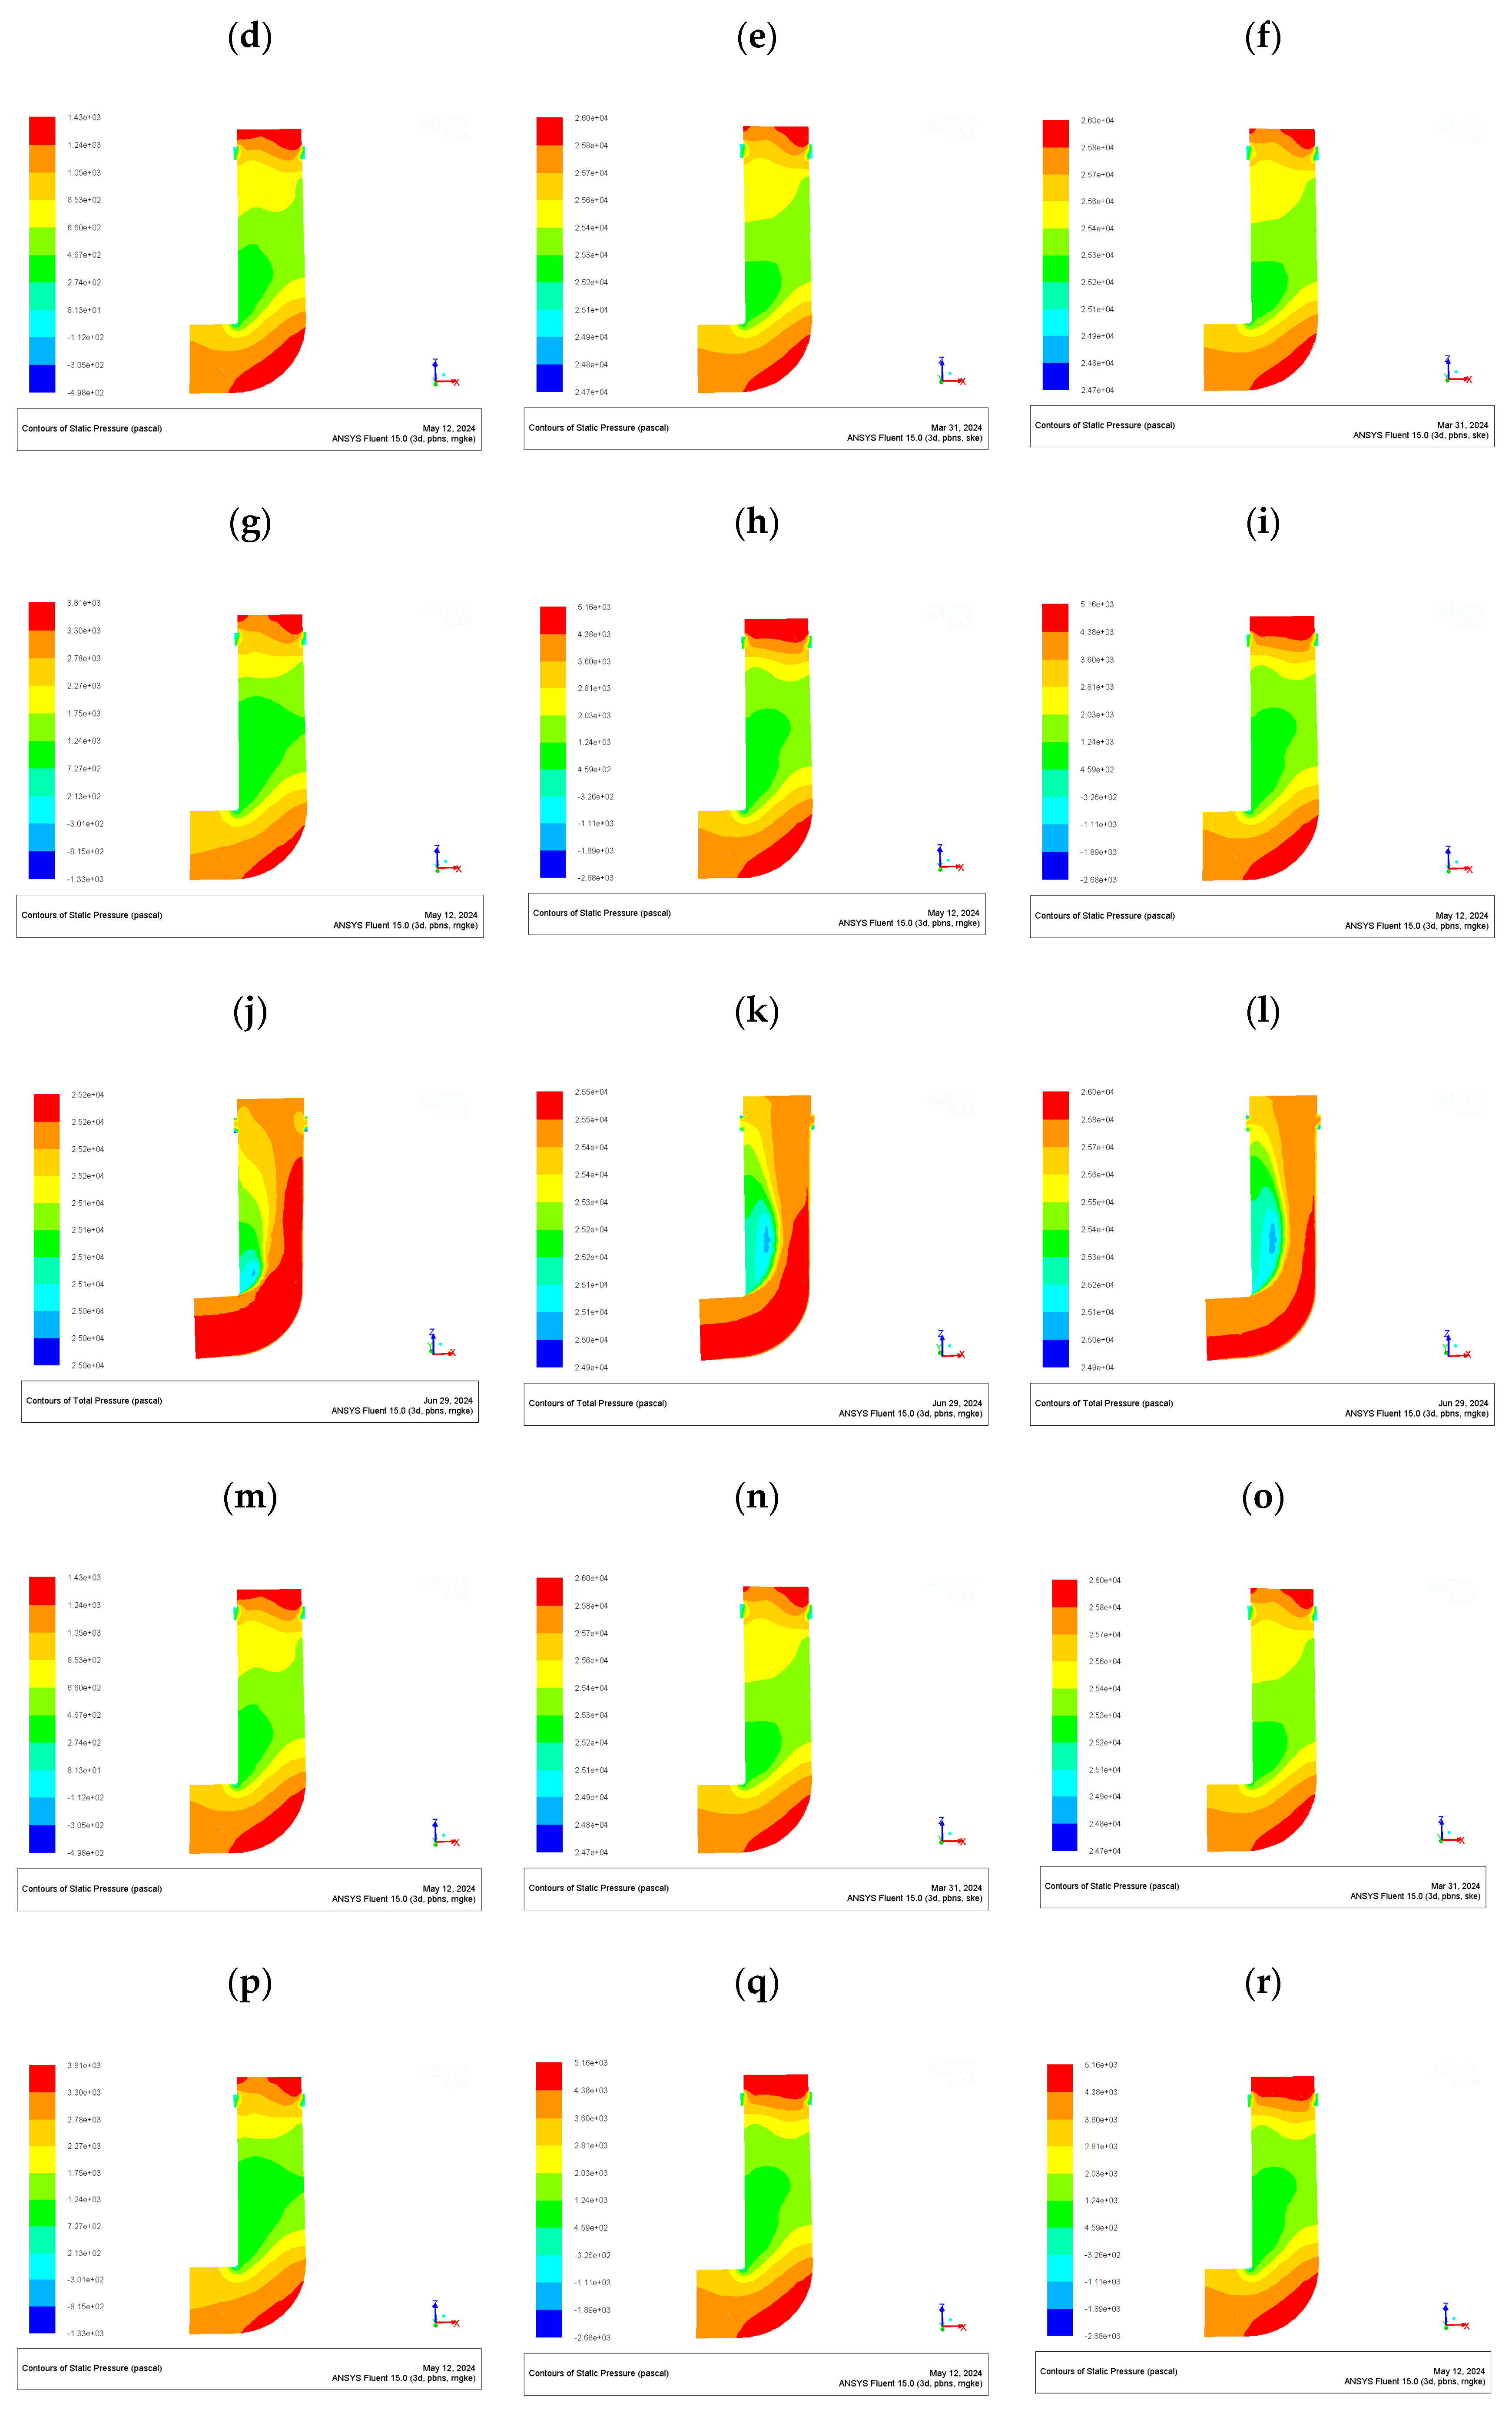
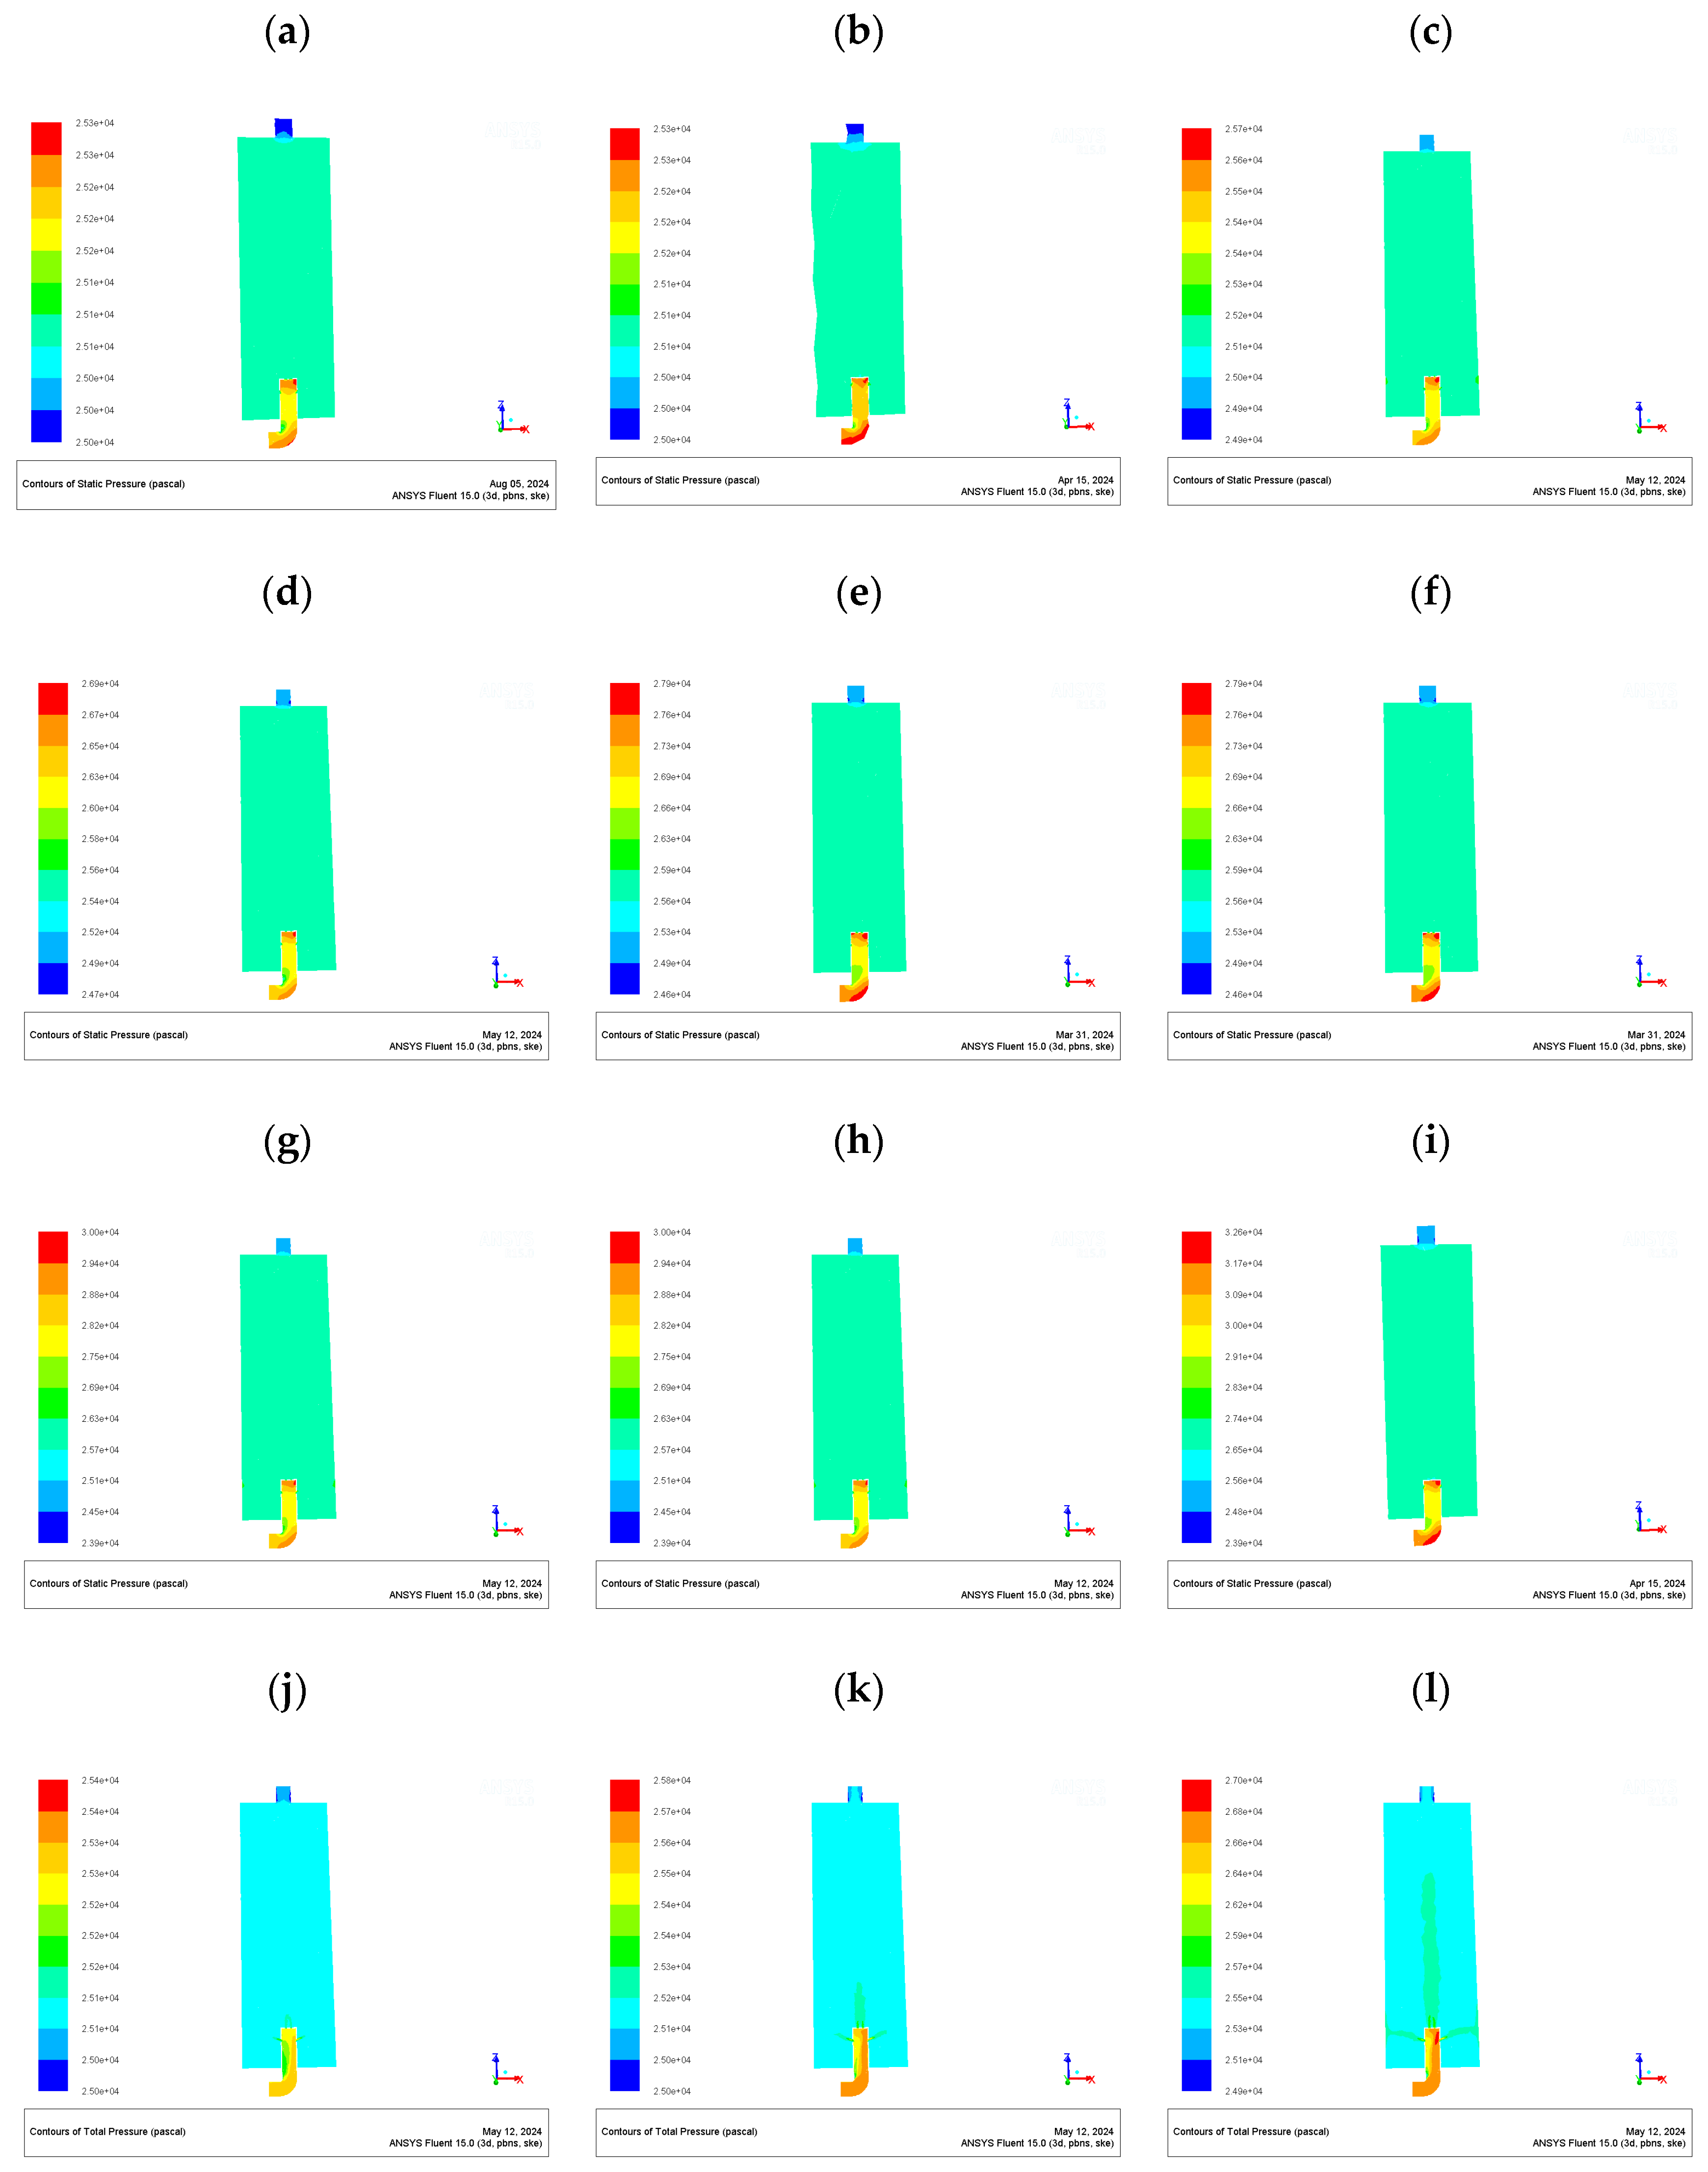
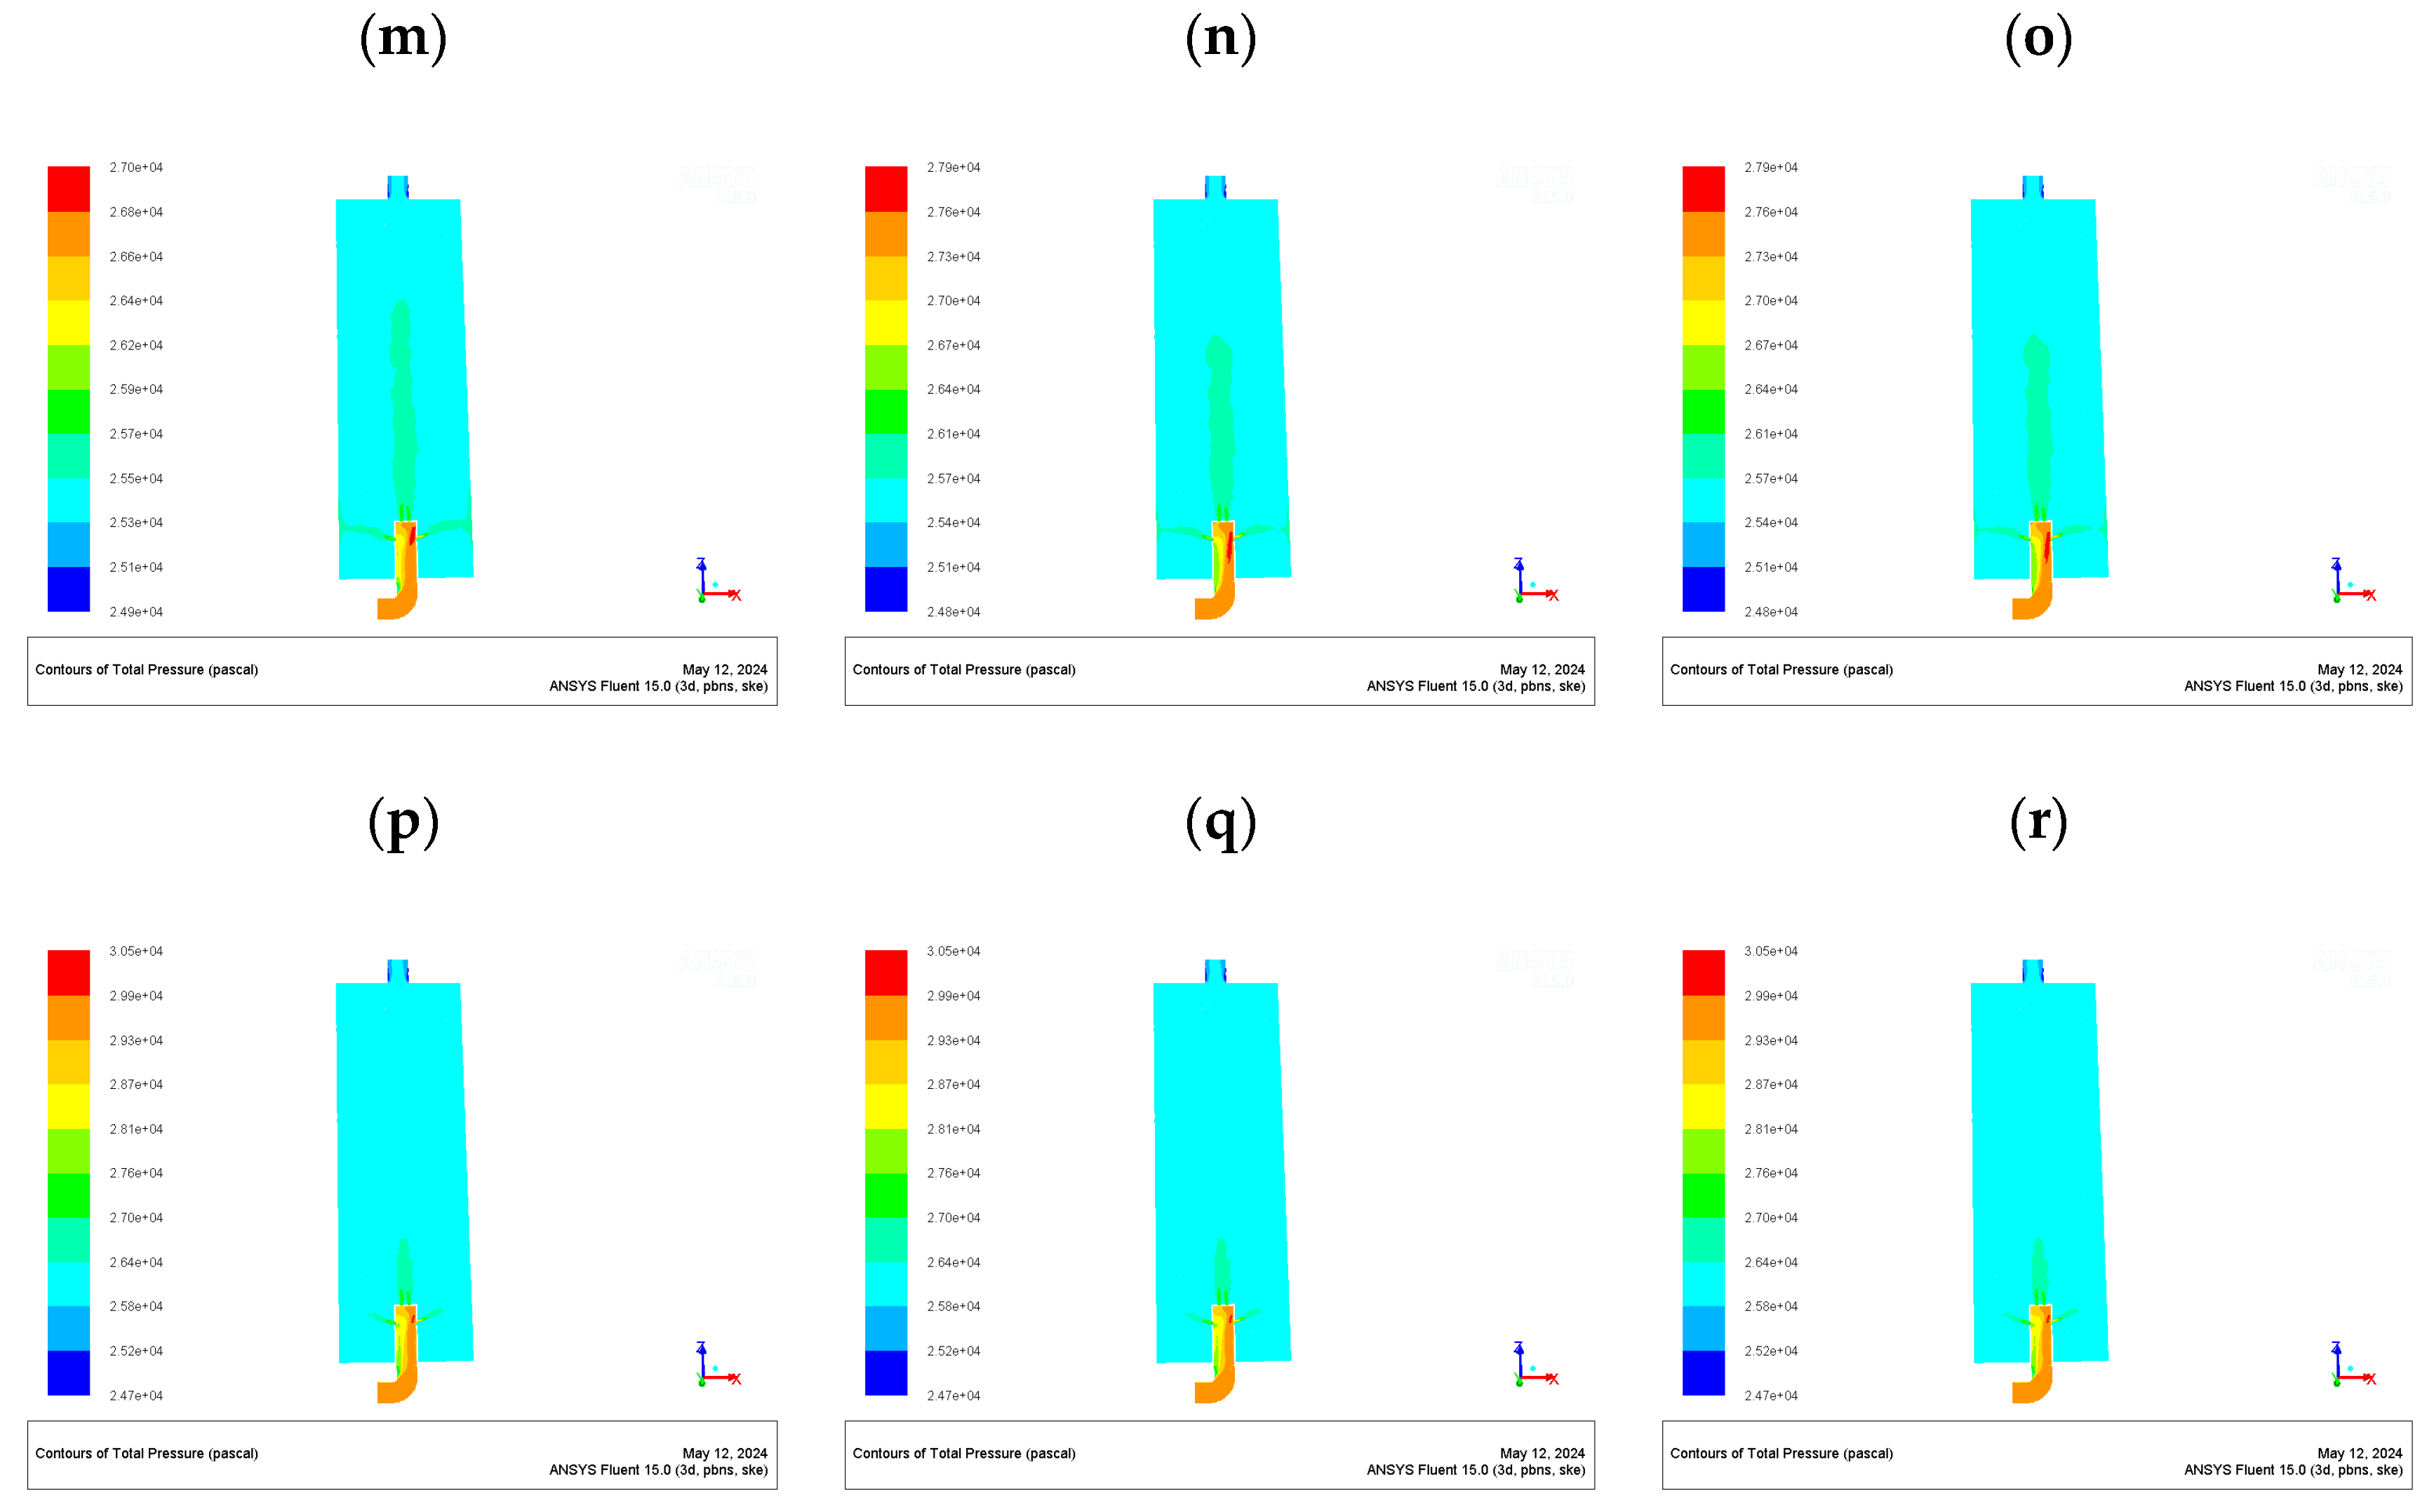
First, with the combined opening type, this study investigated the pressure and velocity distribution at inlet velocities of 10, 15, 20, 25, 30, 35, 40, 45, and 50 m/s, and the obtained contours of the static pressure, total pressure, and velocity are shown in Figure 12 and Figure 13, respectively.
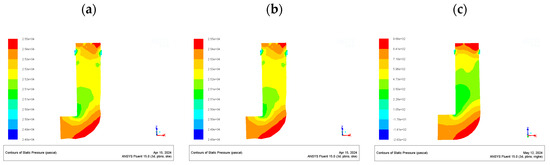
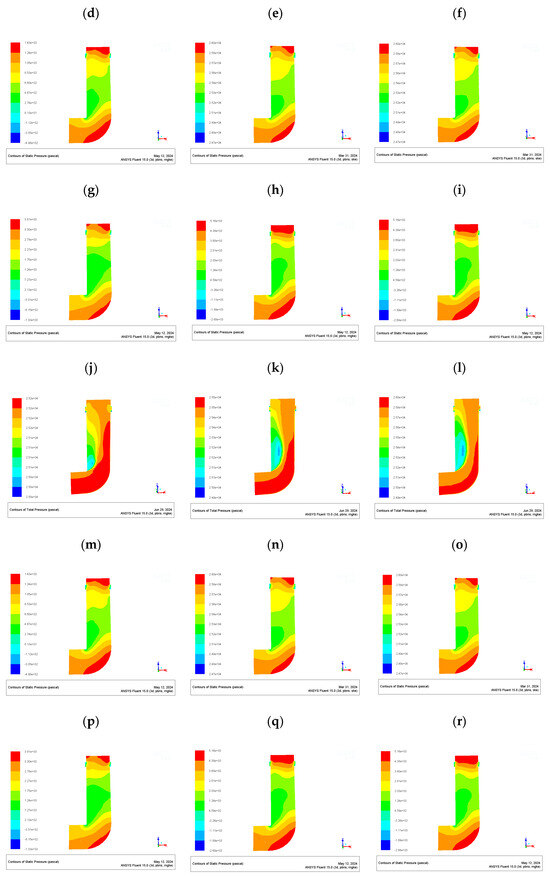
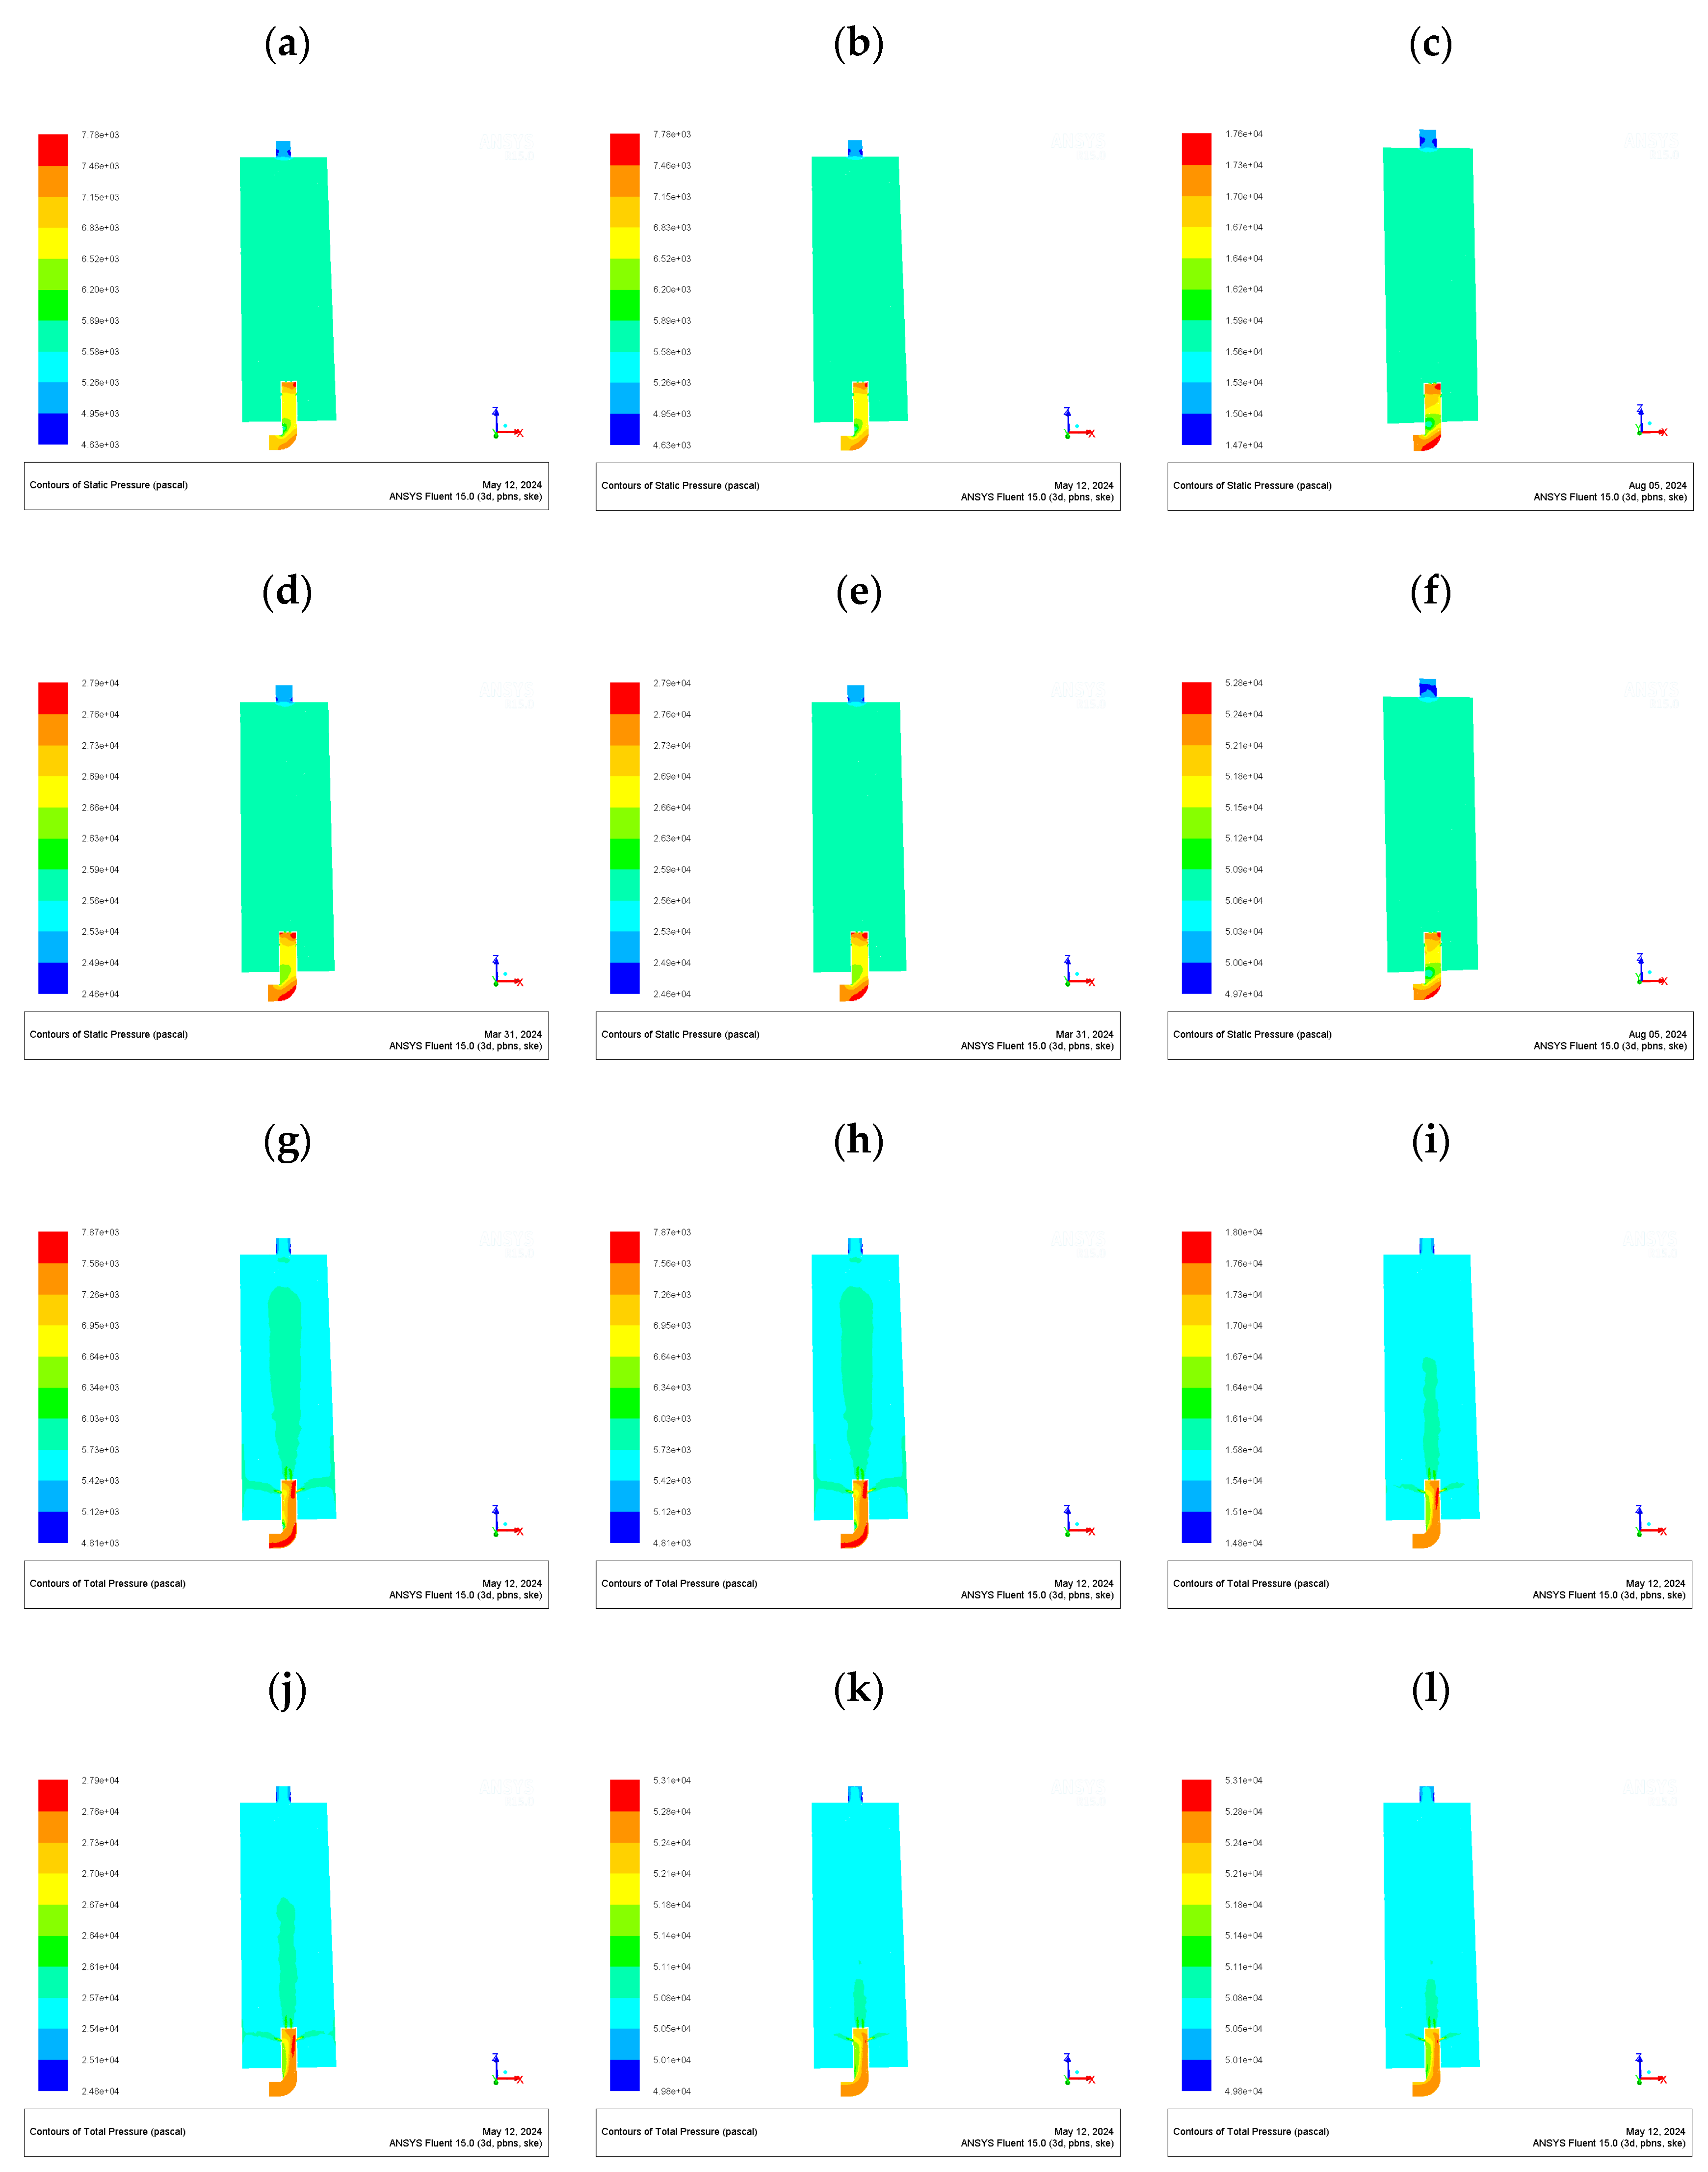
Figure 12.
Contours of static pressure and total pressure: (a–i) 10, 15, 20, 25, 30, 35, 40, 45, and 50 m/s for static pressure; (j–r) 10, 15, 20, 25, 30, 35, 40, 45, and 50 m/s for total pressure.
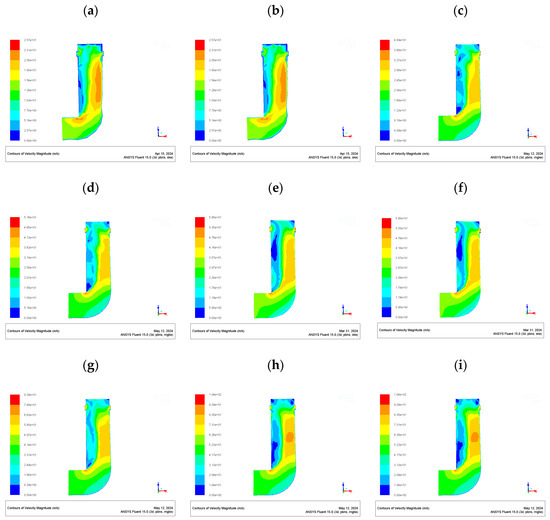
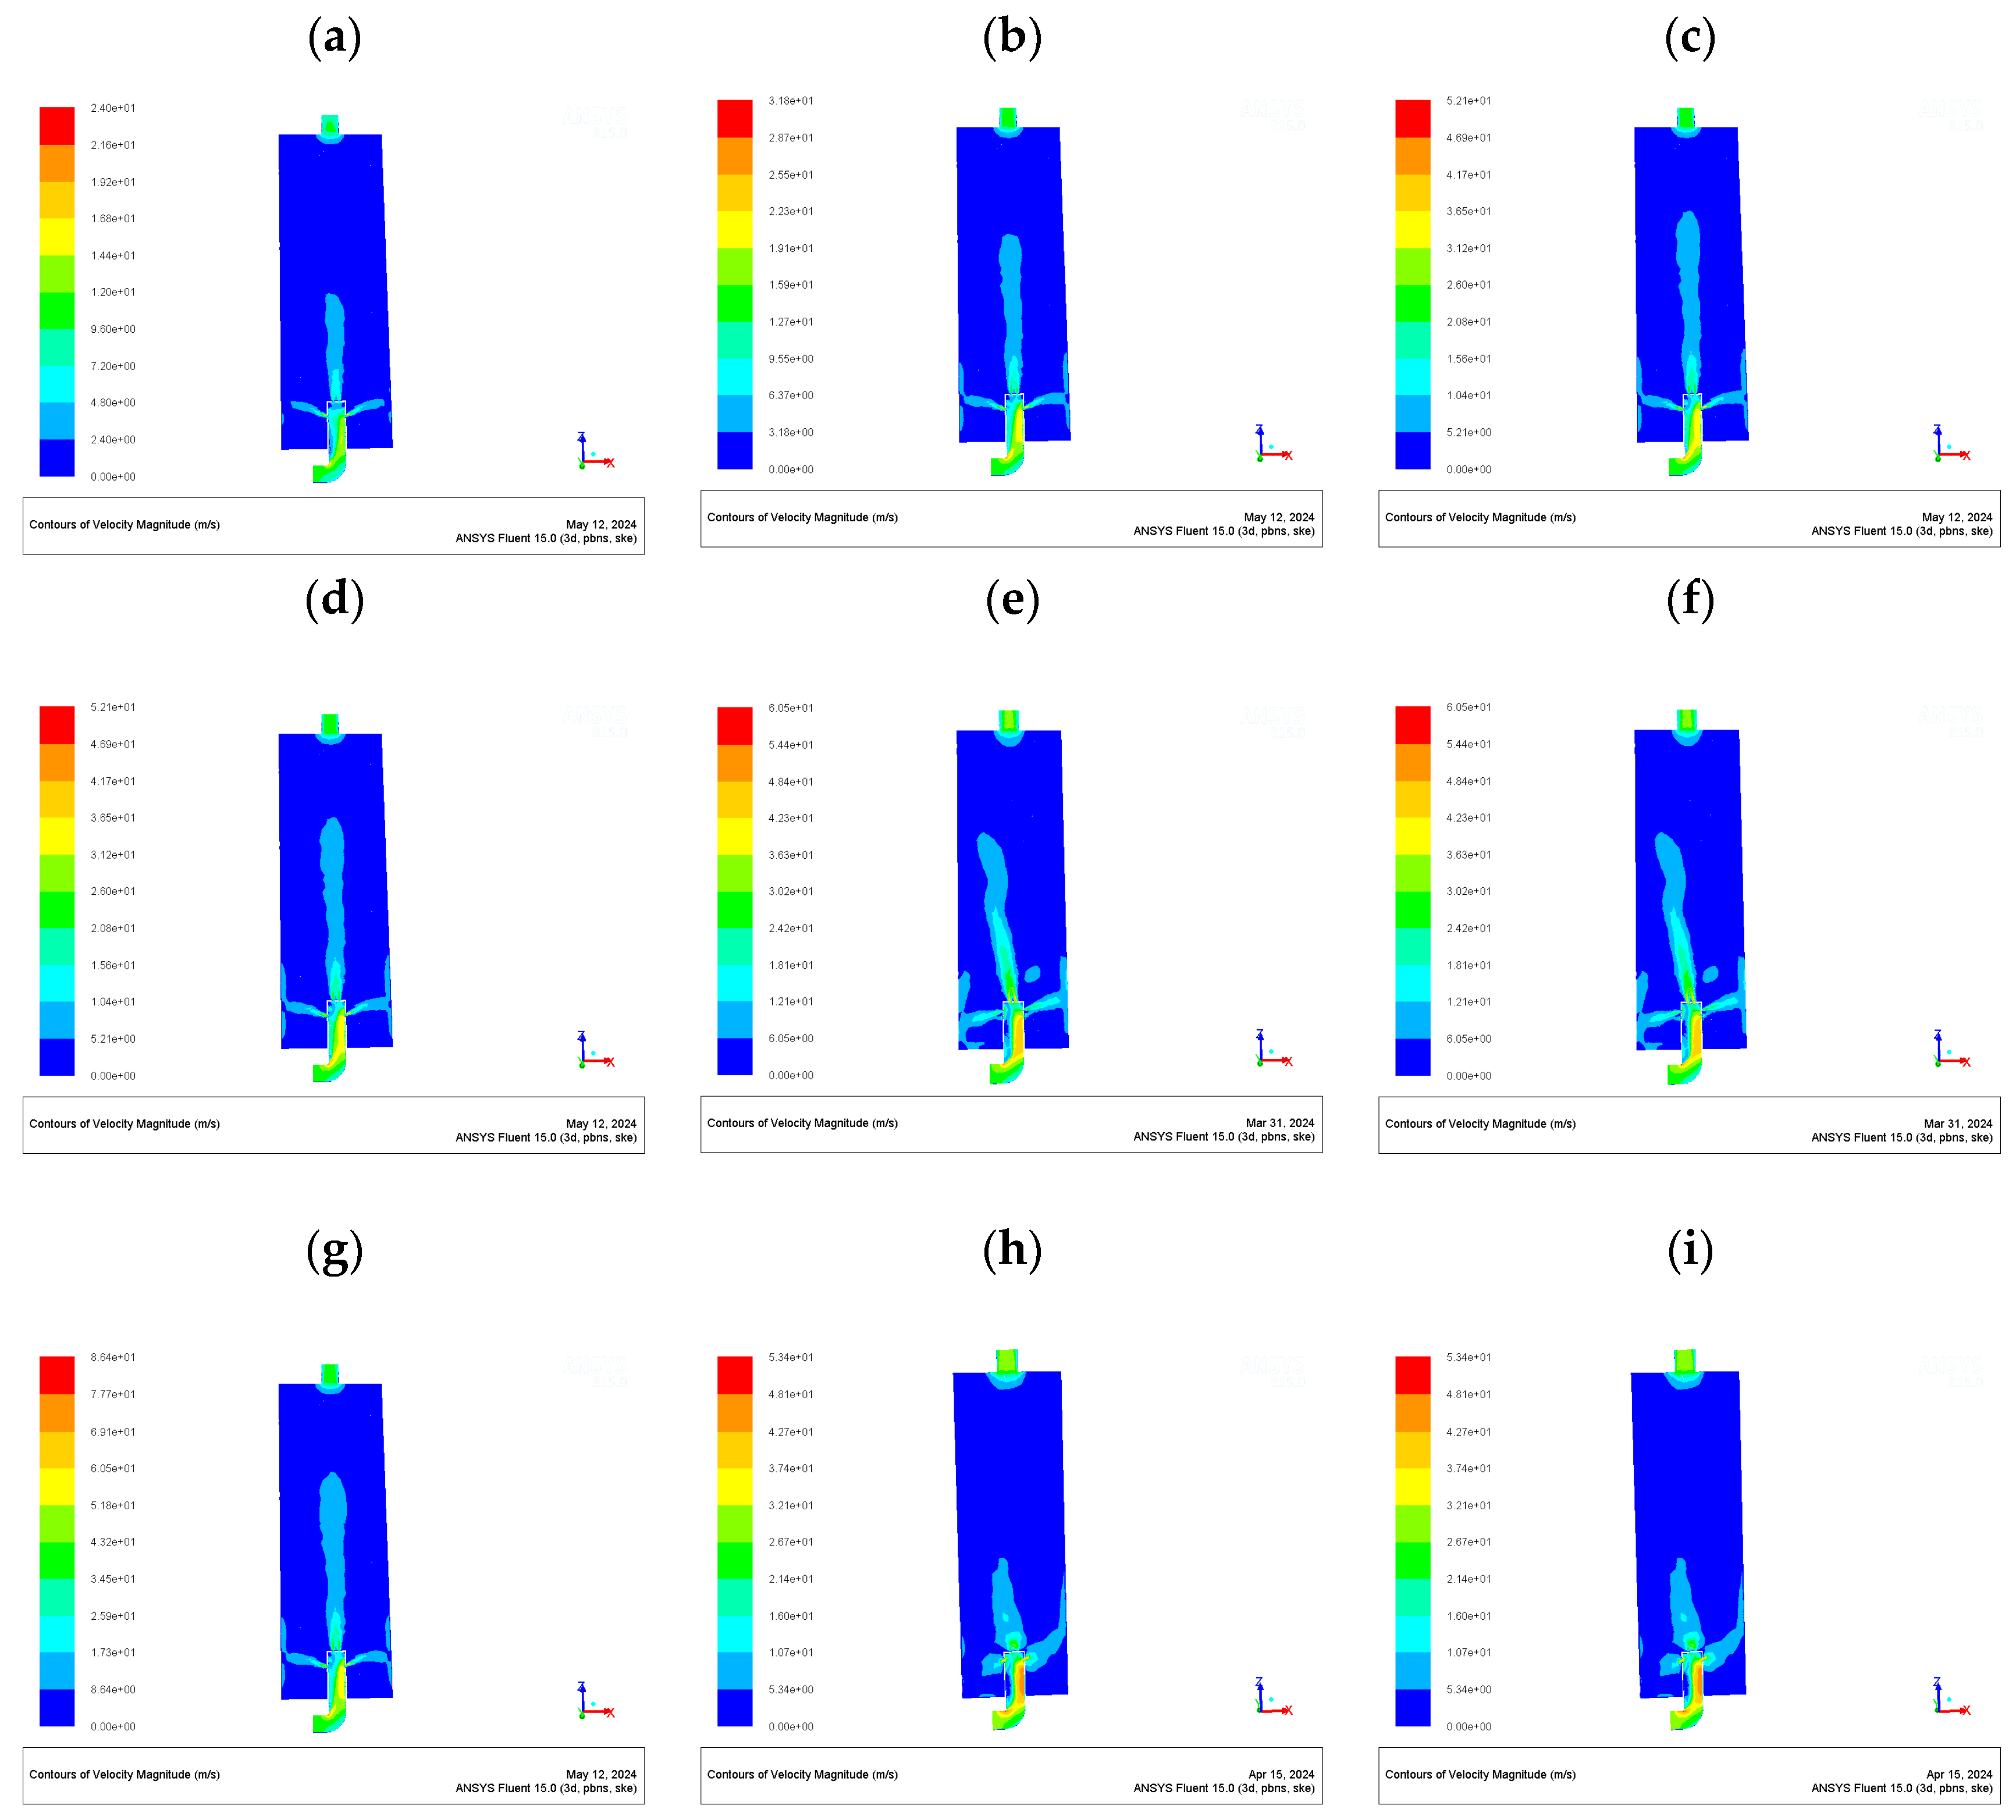
Figure 13.
Contours of velocity: (a–i) 10, 15, 20, 25, 30, 35, 40, 45, and 50 m/s.
It can be seen in Figure 12 that the pressure near the inlet and outlet of the nozzle was higher, and the pressure at the elbow was lower. As the inlet velocity continued to increase to 30 m/s, the pressure near the inlet of the nozzle, the elbow, and the above parts presented a decreasing trend, which theoretically can alleviate the phenomenon of the coking of particles deposited at the bottom of the nozzle due to high pressure. When the velocity exceeded 30 m/s, the contour hardly changed, which means that the pressure in the nozzle no longer decreased, and even increased. This may be because the excessive velocity in the nozzle intensified the wear on the nozzle wall, resulting in the formation of a dead zone where the fluidizing wind hardly flowed, thus increasing the static pressure in the area, which is not conducive to the safe and stable operation of the device.
It can be seen in Figure 13 that the velocity of the air flow in the nozzle increased continuously from the inlet to the nozzle elbow and upward, and the velocity was lower at the top and side exits of the nozzle. When the inlet air velocity reached 30 m/s and higher, the outlet velocity at the bottom and top of the nozzle reached the maximum. Theoretically, this is conducive to enhancing the disturbance of free particles at the top, alleviating the phenomenon of decreased air distribution caused by particle coking. Meanwhile, with the high temperature of the nozzle in actual production, the high-velocity air flow at the top can also play a cooling role. Thus, the operation stability of the device is enhanced, and the service life of the device can be extended. Therefore, an inlet velocity of 30 m/s was selected in this research.
3.1.3. Simulation of Different Outlet Pressures with Combined Opening Type
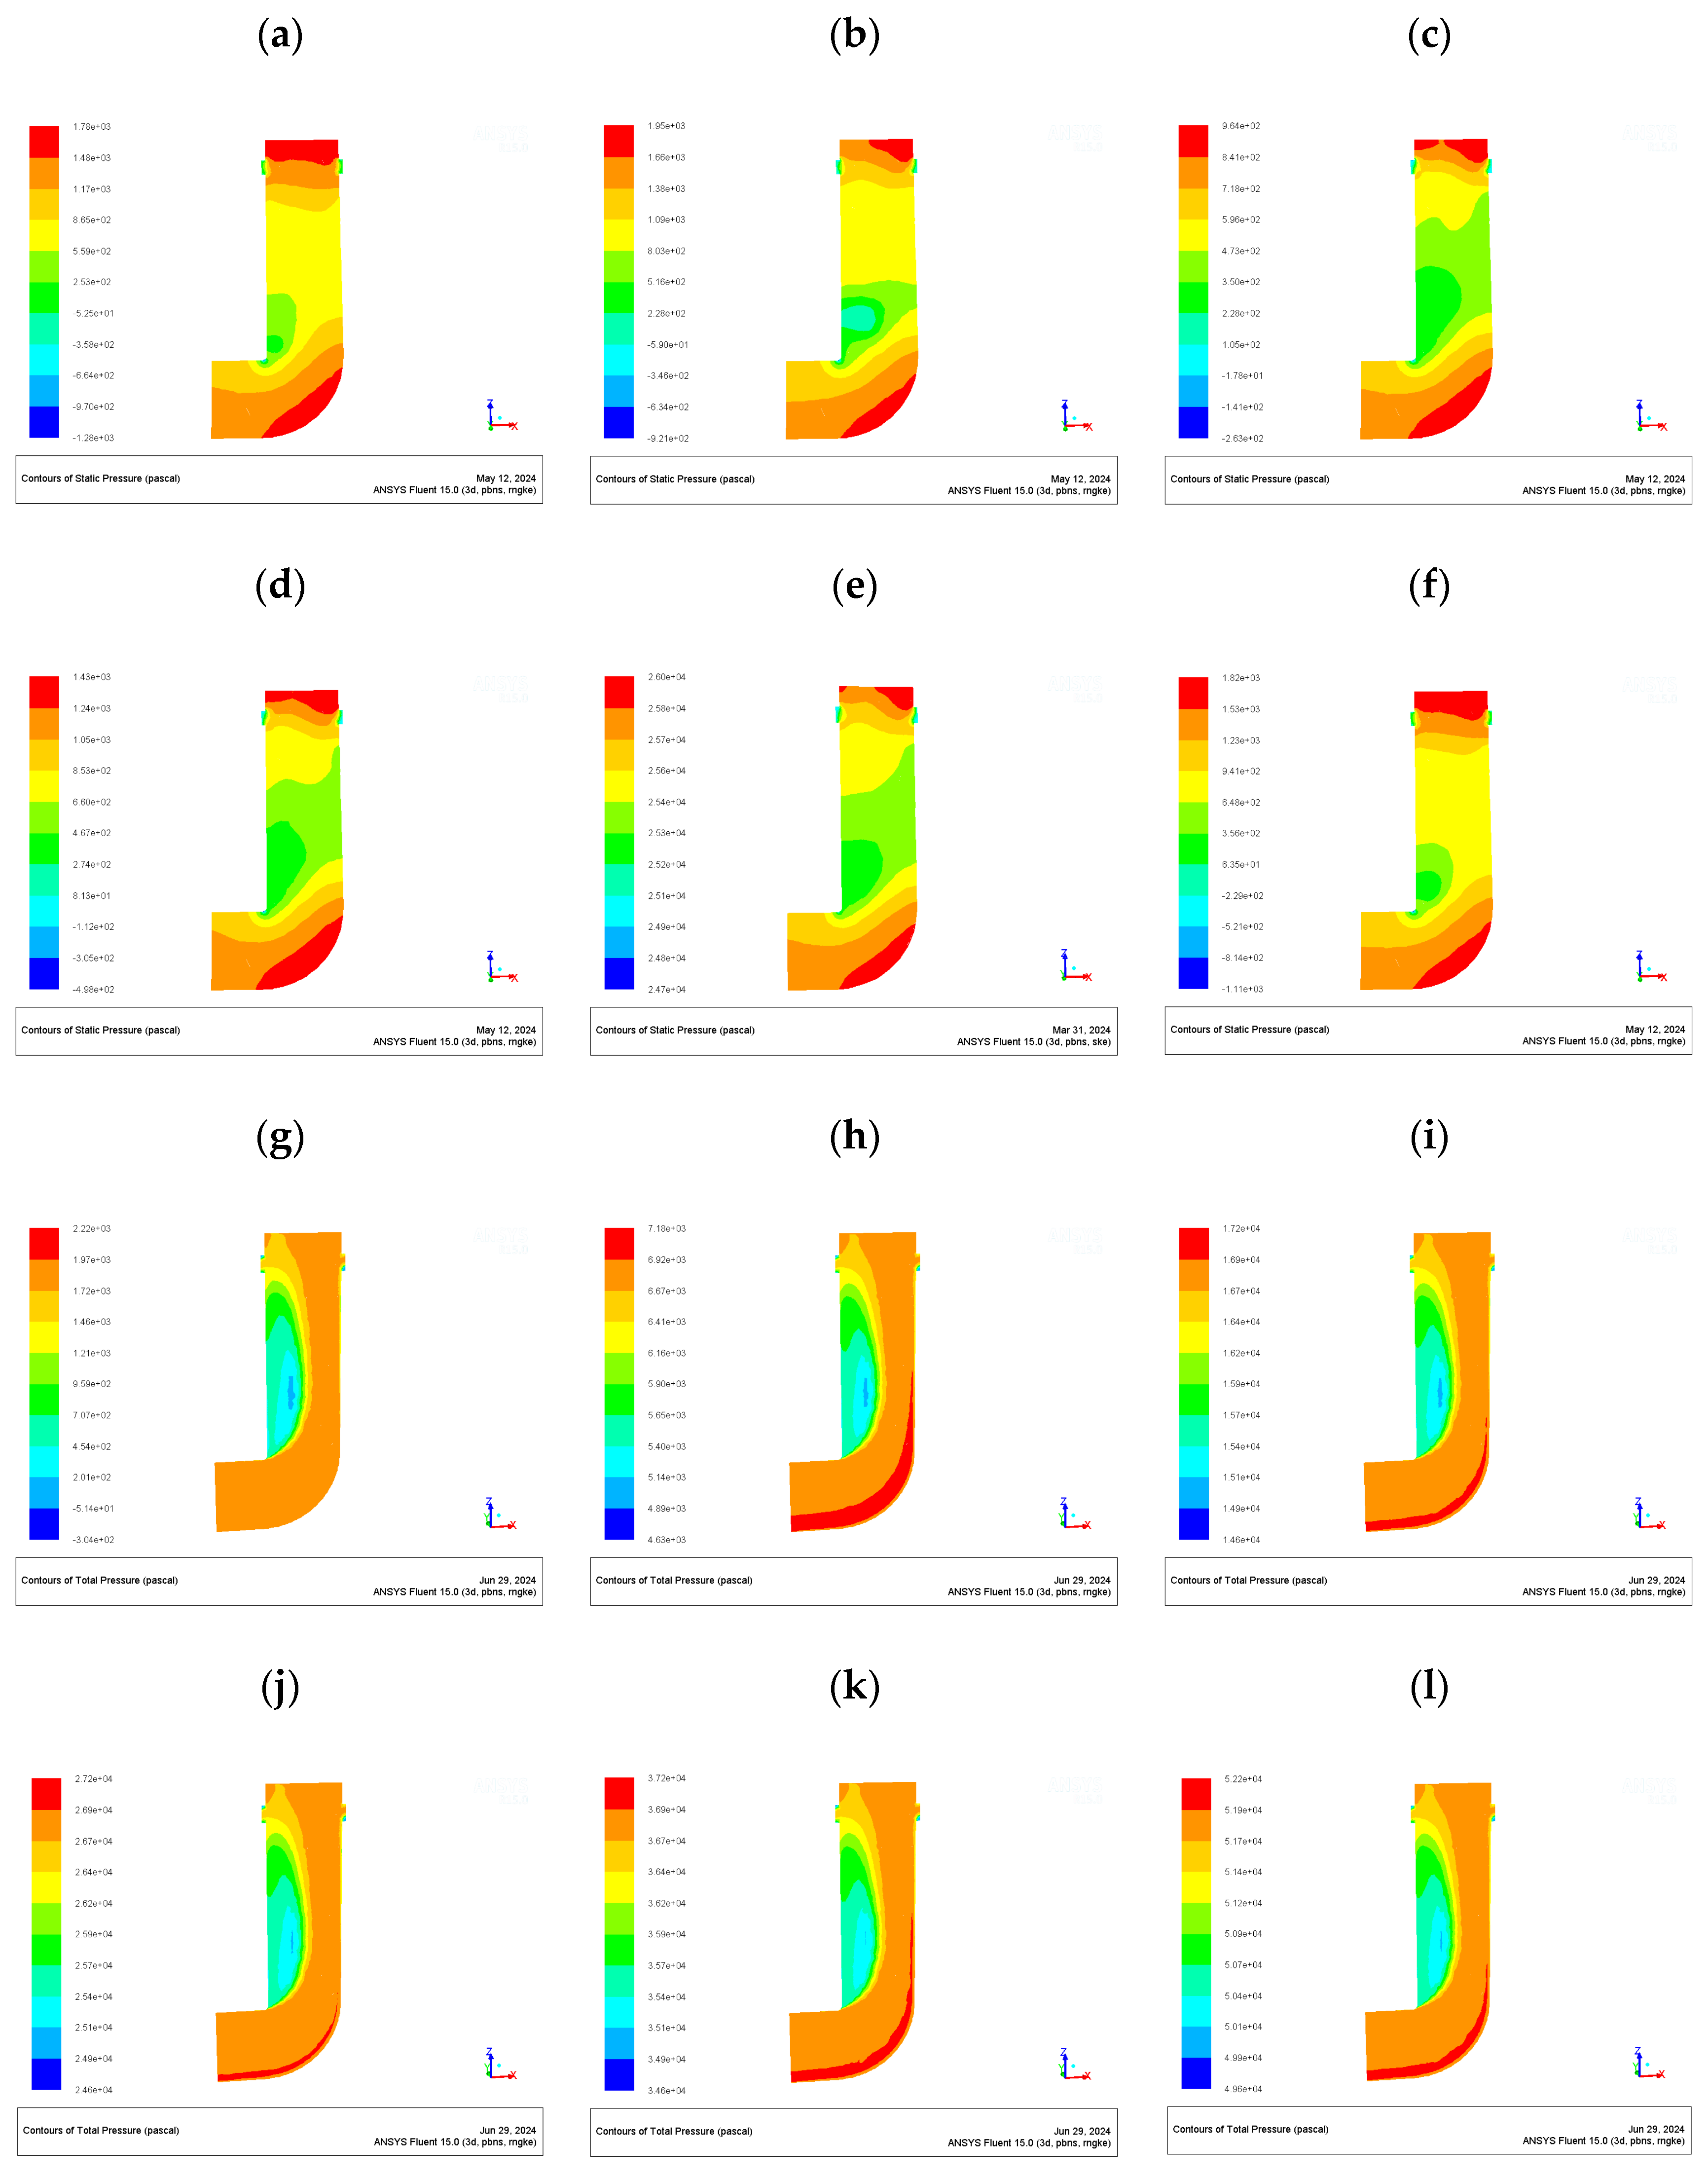
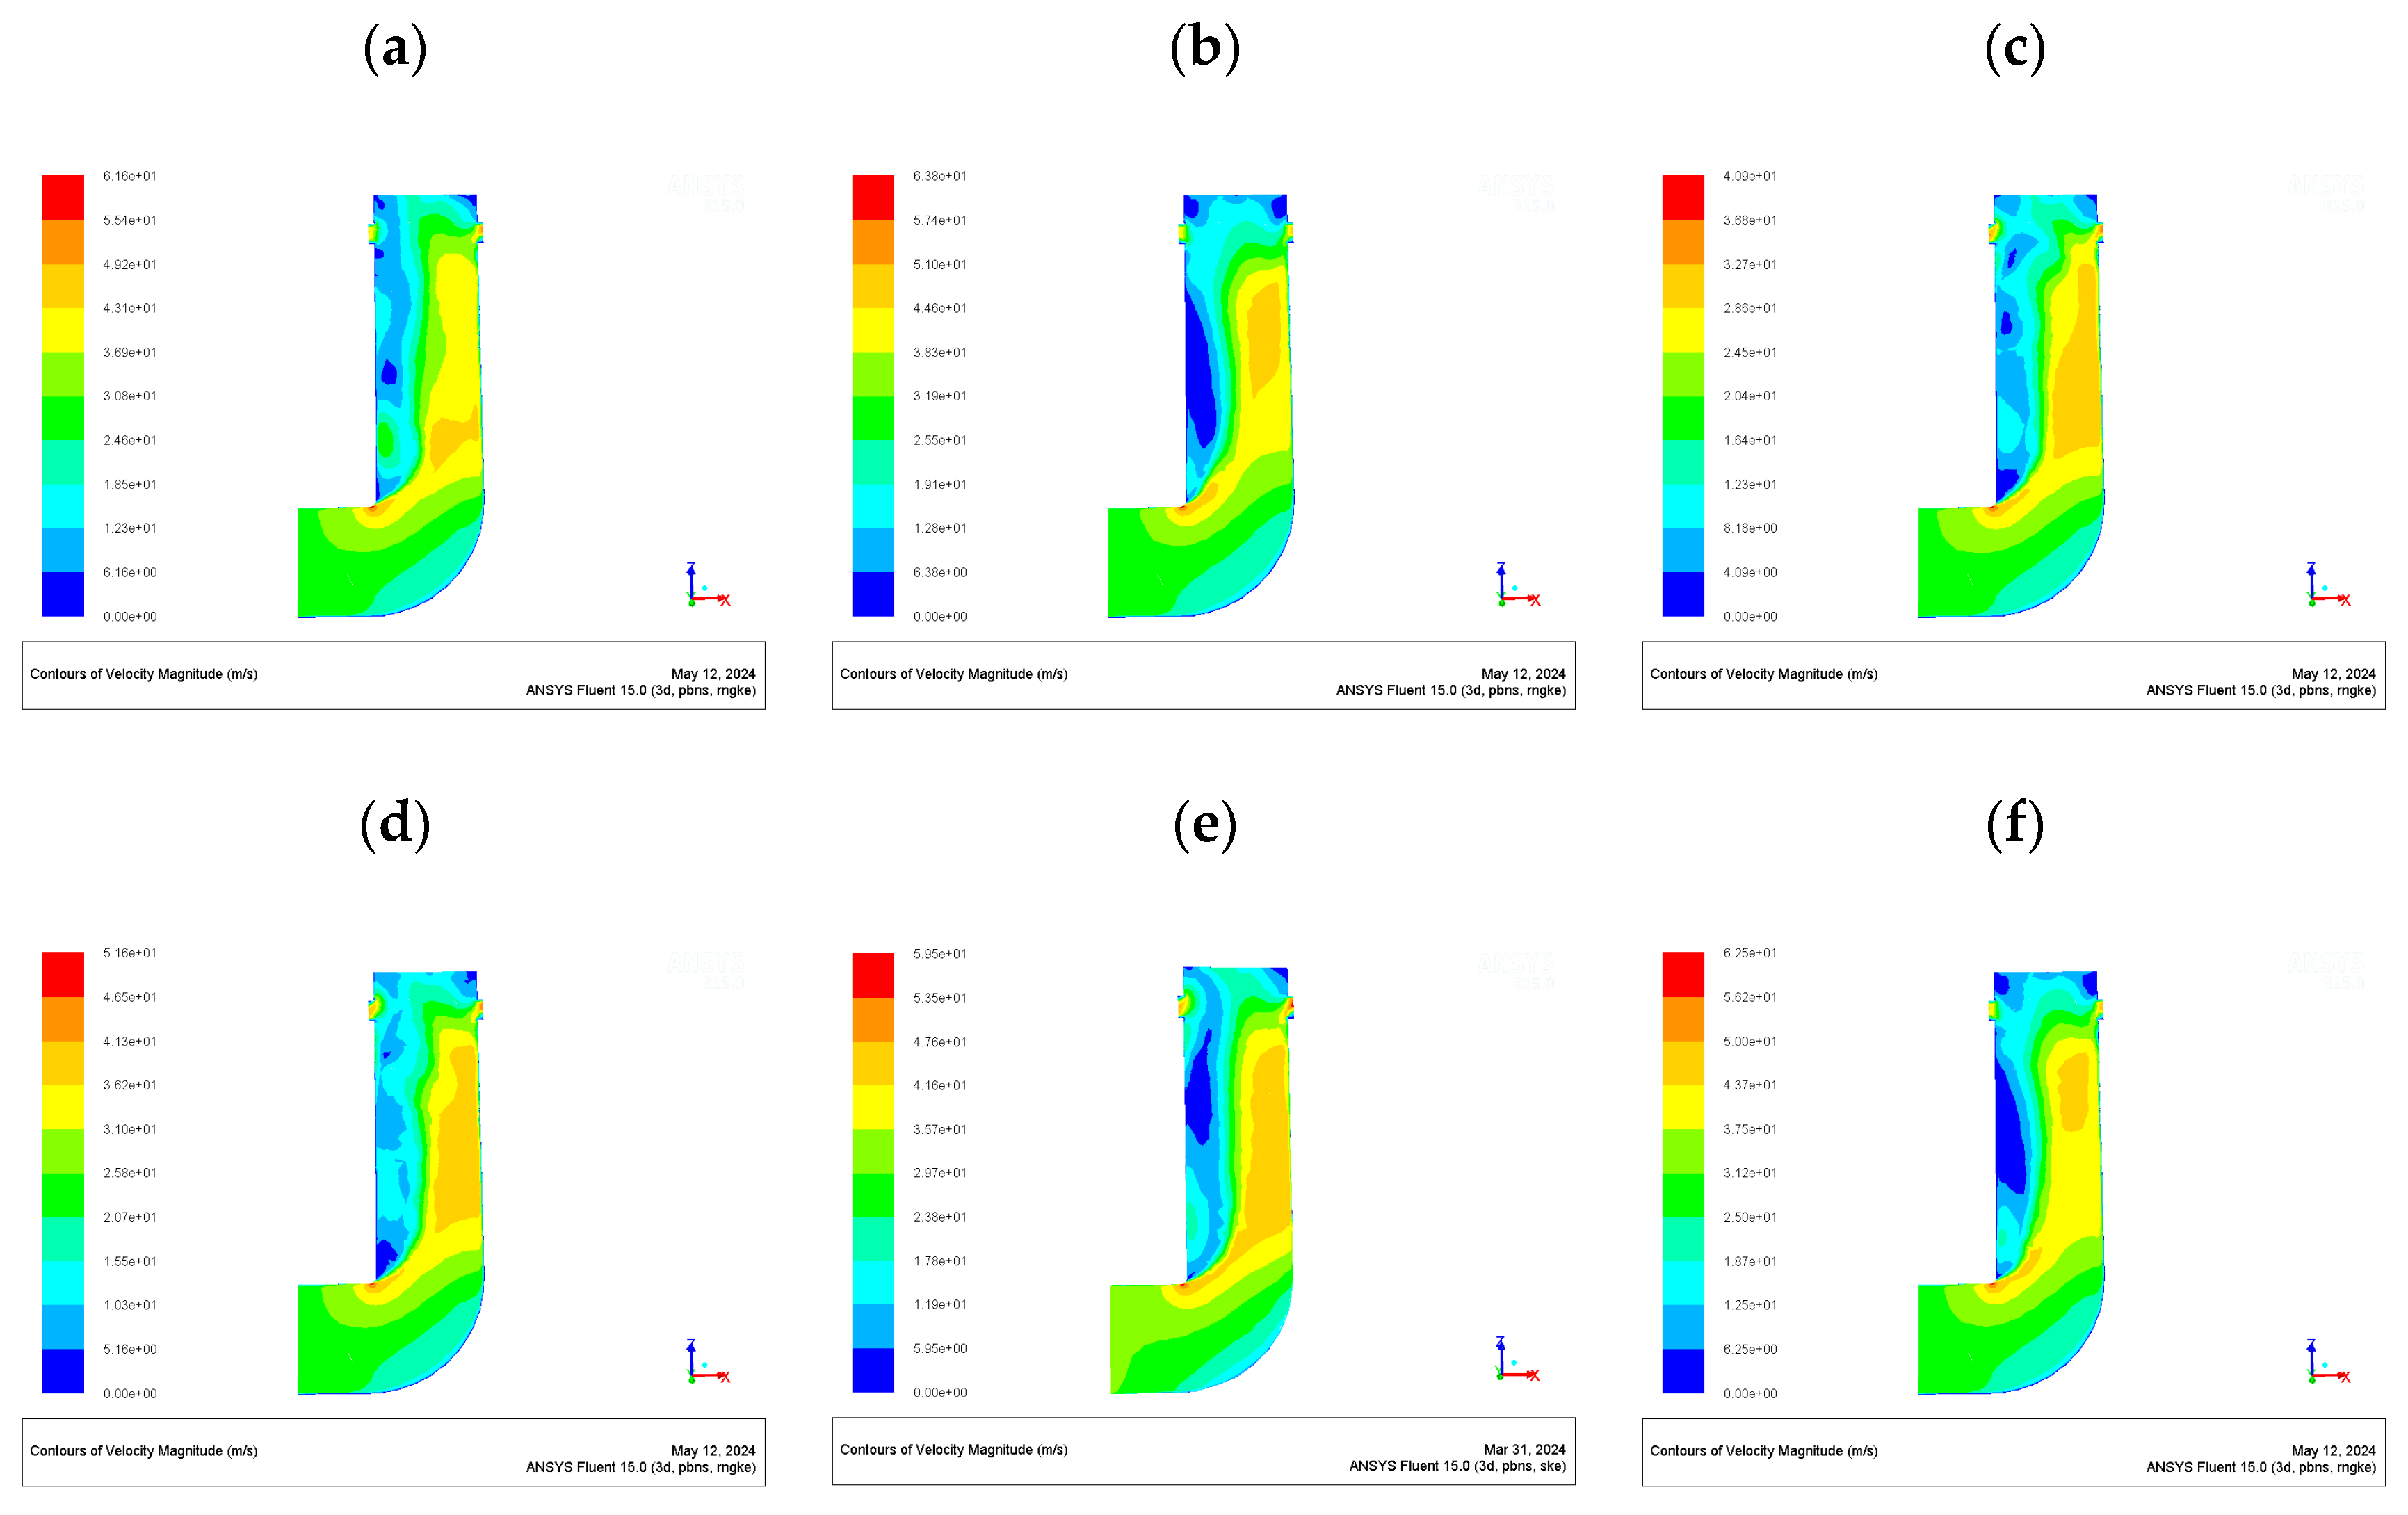
The contours of the static pressure, total pressure, and velocity of the nozzle at outlet pressures of 0, 5, 15, 25, 35, and 50 kPaG were investigated, as shown in Figure 14 and Figure 15.
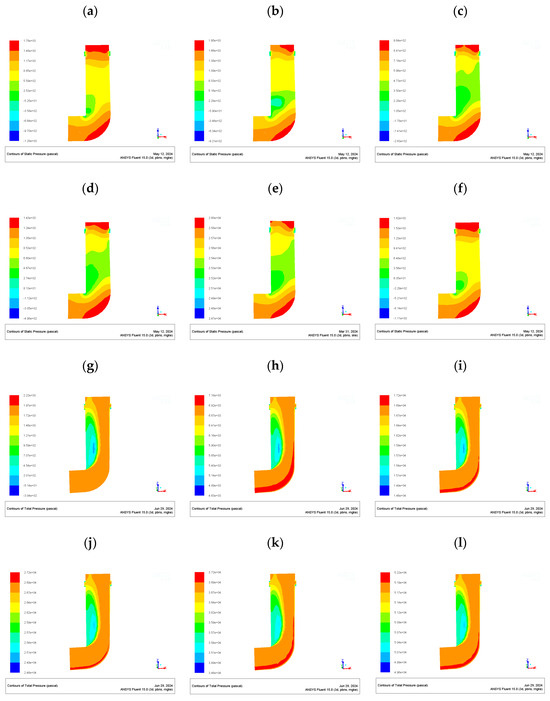
Figure 14.
Contours of static pressure and total pressure: (a–f) 0, 5, 15, 25, 35, and 50 kPaG for static pressure; (g–l) 0, 5, 15, 25, 35, and 50 kPaG for total pressure.
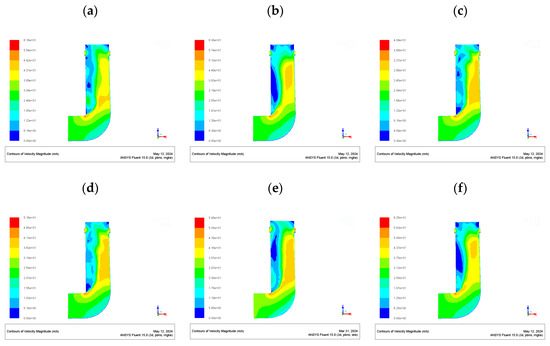
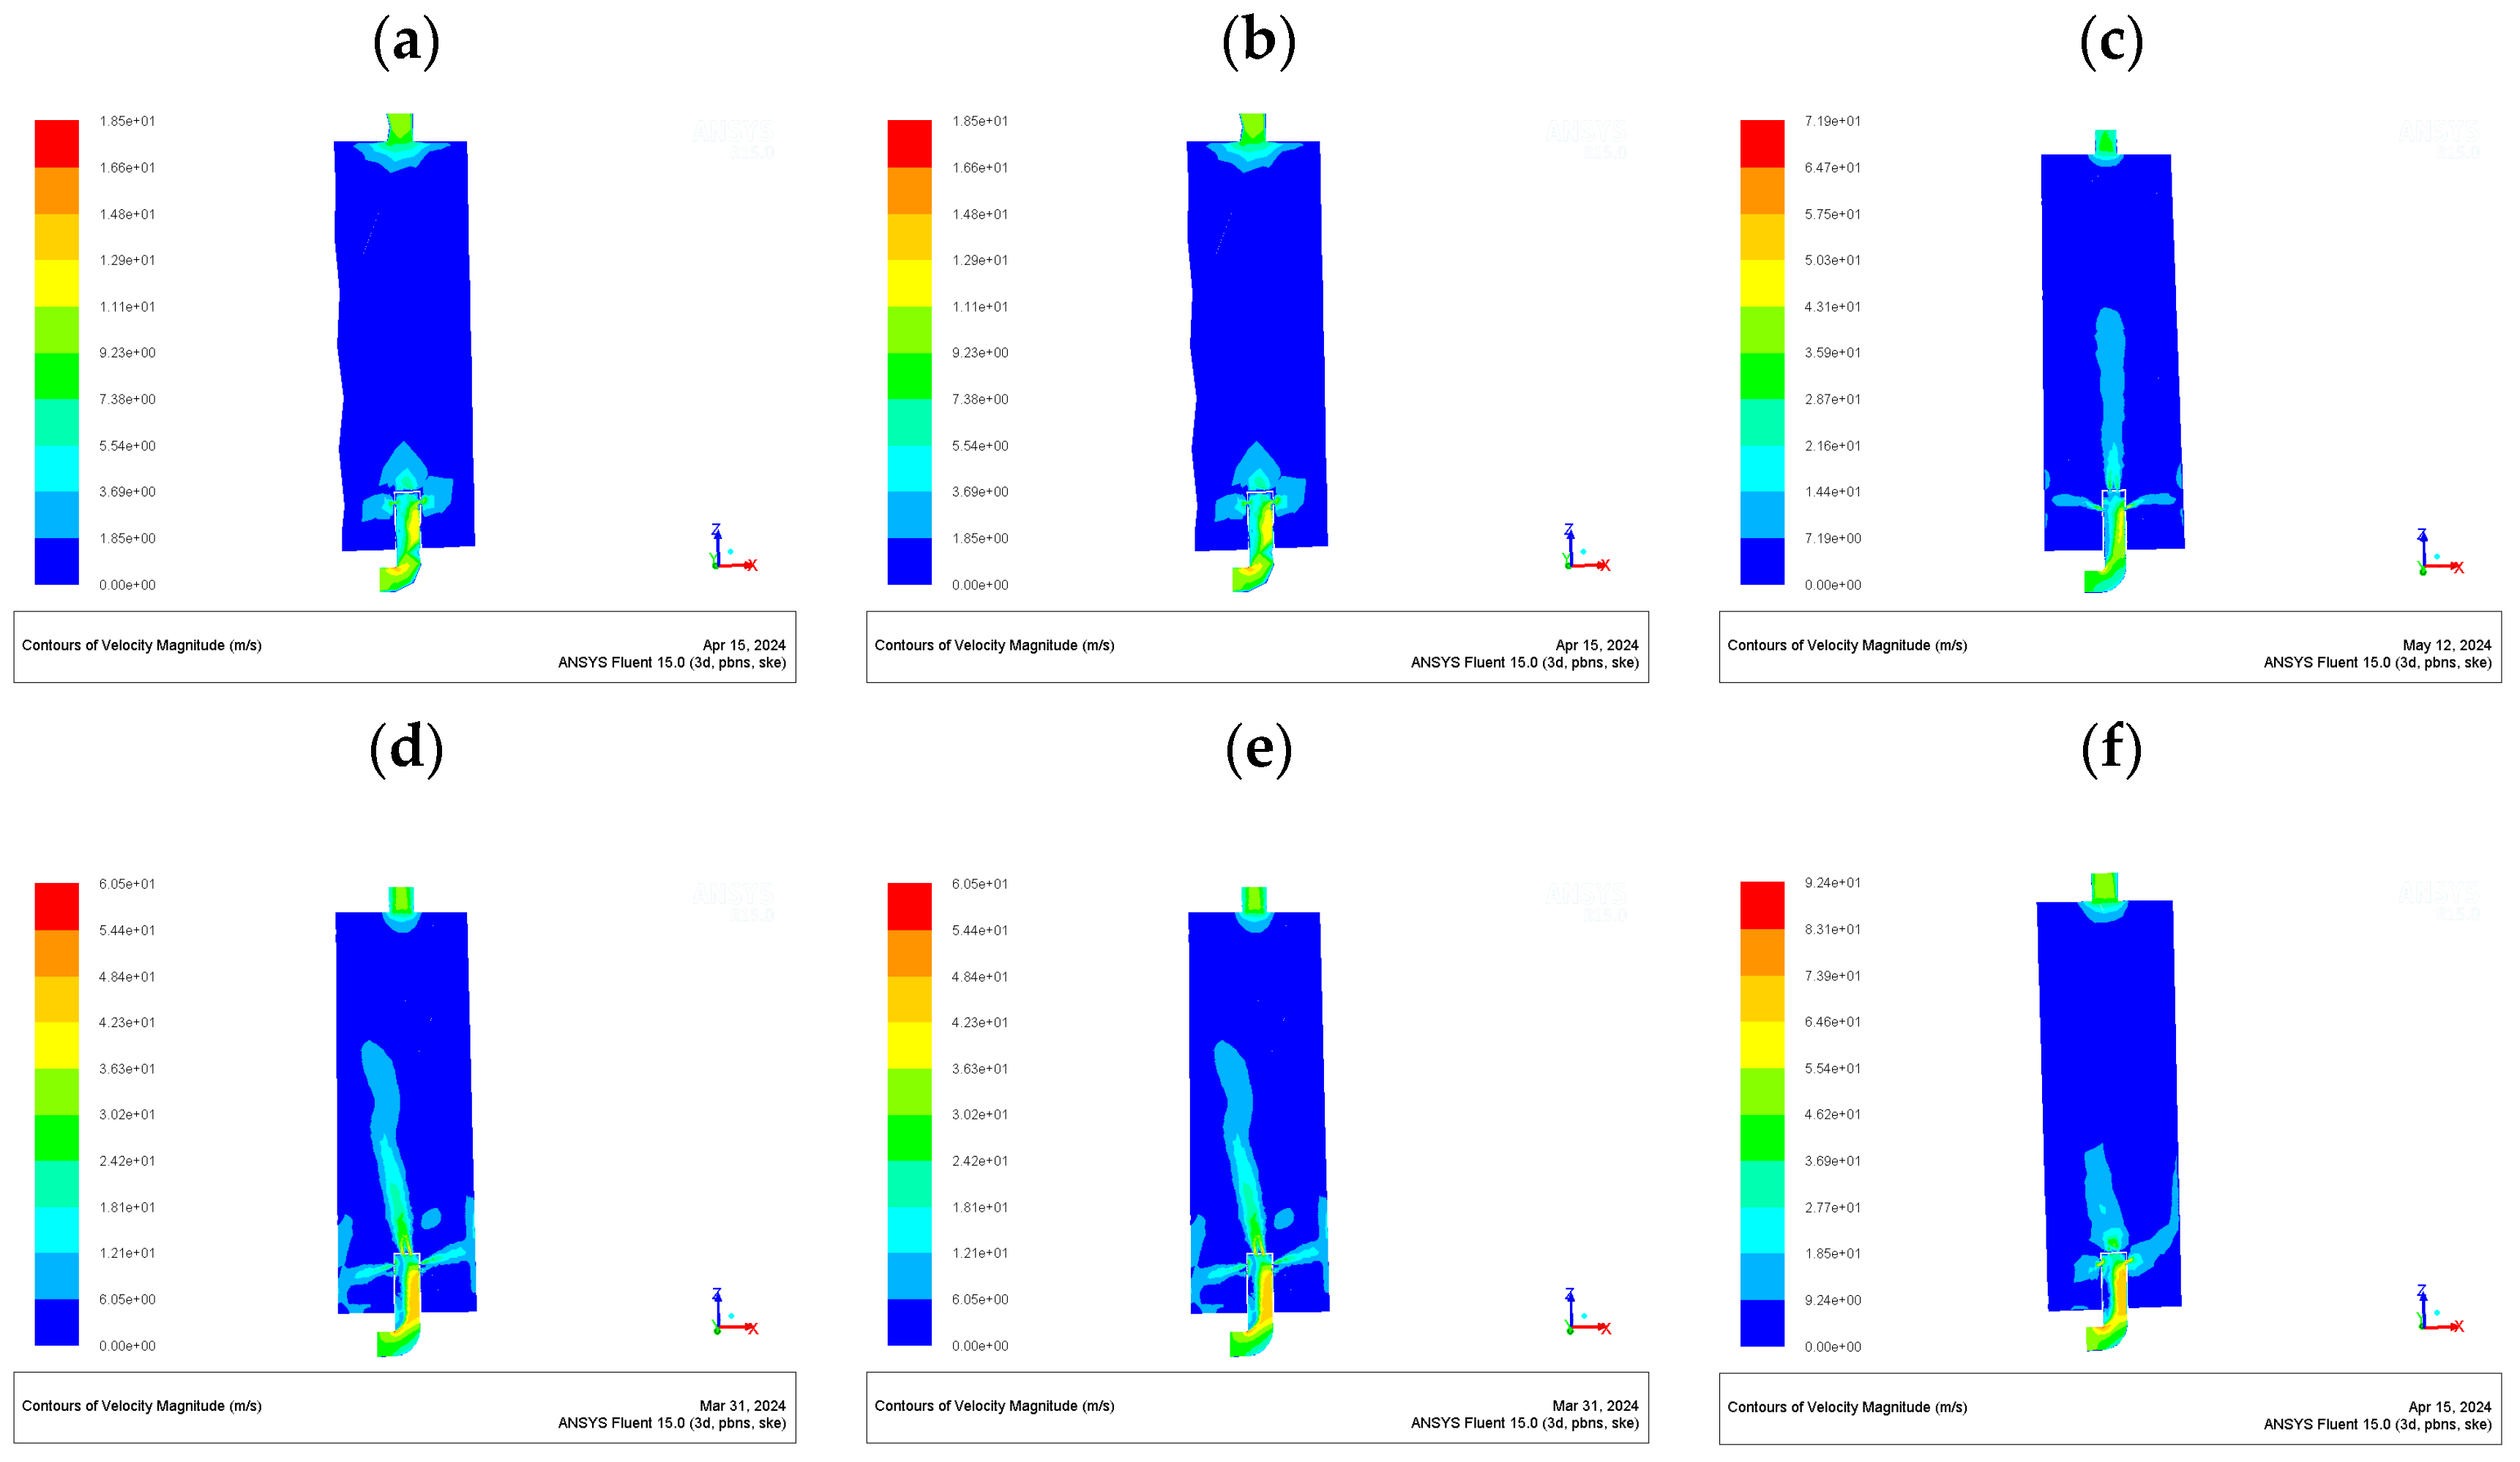
Figure 15.
Contours of velocity: (a–f) 0, 5, 15, 25, 35, and 50 kPaG.
It can be seen in Figure 14 that the pressure near the inlet/outlet and at/above the elbow of the nozzle was higher, while the pressure in other areas of the inner core tube was low. It can be inferred that in the actual production process, the main areas that are blocked due to coking under high pressure are the space near the nozzle elbow and the inlet and outlet. It can also be seen in the figure that as the inlet velocity continued to increase to 30 m/s, the pressure near the inlet of the nozzle, the elbow, and the outlet present a decreasing trend, which may prevent particles from accumulating at the bottom of the nozzle due to high pressure. This is theoretically conducive to the stable operation of the device.
It can be seen in Figure 15 that with the increase in the outlet pressure, the velocity distribution in the nozzle mainly changed in two stages. When the outlet pressure increased from 0 kPaG to 25 kPaG, the velocity near the nozzle elbow and the top was significantly increased, which is conducive to washing out the particles deposited at the wall, alleviating the phenomenon of coking and clogging. At the same time, the velocity at the top of the nozzle gradually increased, the local fluidization dead zone gradually decreased, and the uniformity of fluidization was improved to some extent. When the outlet pressure exceeded 25 kPaG, the outlet velocity decreased instead, which may have led to more serious wear on the nozzle wall, and which is not conducive to extending the service life of the nozzle. Therefore, a boundary condition with an outlet pressure of 25 kPaG was chosen in this paper.
3.2. Simulation of Hydrodynamic Behavior in Gasifiers
We investigated the influence of the nozzle opening type on the hydrodynamic behavior of the fluidized bed furnace, and in this section, discuss the flow field distribution in the furnace under different boundary conditions.
3.2.1. Simulation of Hydrodynamic Behavior in Gasifiers with Different Opening Types
There are three types of gasifiers with different inner nozzles: a top opening only, a side opening only, and combined opening. An inlet velocity of 25 m/s and an outlet pressure of 25 kPaG were selected to conduct a simulation, and the resulting contours of the static pressure, total pressure, and velocity are shown in Figure 16 and Figure 17.
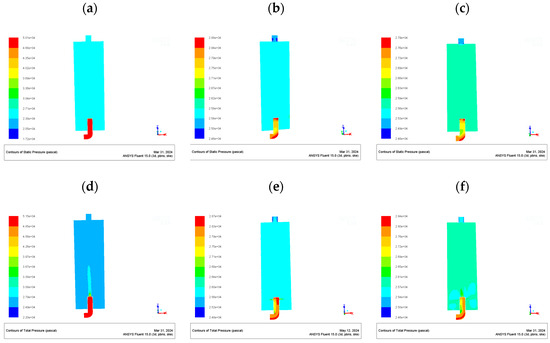
Figure 16.
Contours of static pressure and total pressure. (a) Top opening only, (b) side opening only, and (c) combined opening for static pressure. (d) Top opening only, (e) side opening only, and (f) combined opening for total pressure.
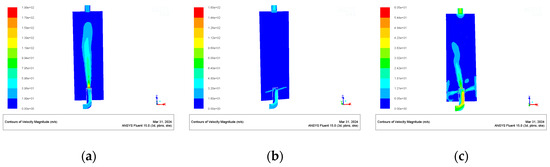
Figure 17.
Contours of velocity. (a) Top opening only; (b) side opening only; (c) combined opening.
It can be seen in Figure 16 that the pressure in the combined opening type nozzle, especially at the elbow, was obviously lower than that in the other two types. During the operation of the gasifier, the particles produced will be concentrated near the elbow due to the action of the gravity field, and these deposited particles easily produce coking and blockage under high pressure and temperature. Therefore, the selection of a combined opening type is conducive to not only reducing the wear of the nozzle but also alleviating the problem of coking blockage under high pressure.
In Figure 17, it can be seen that when the nozzle type in the gasifier was selected to the combined opening one, the velocity distribution in the gasifier, especially at the bottom, was more abundant, which is conducive to the uniformity of material fluidization and can improve the gasification efficiency in the furnace. At the same time, when the operation process was in the high-temperature condition, the combined opening type gasifier easily forms a more uniform velocity distribution, which can enhance the stability of the device.
Therefore, the combined opening type was selected as the opening type of the nozzle in the gasifier.
3.2.2. Simulation of Different Inlet Velocity in Combined Opening-Type Gasifier
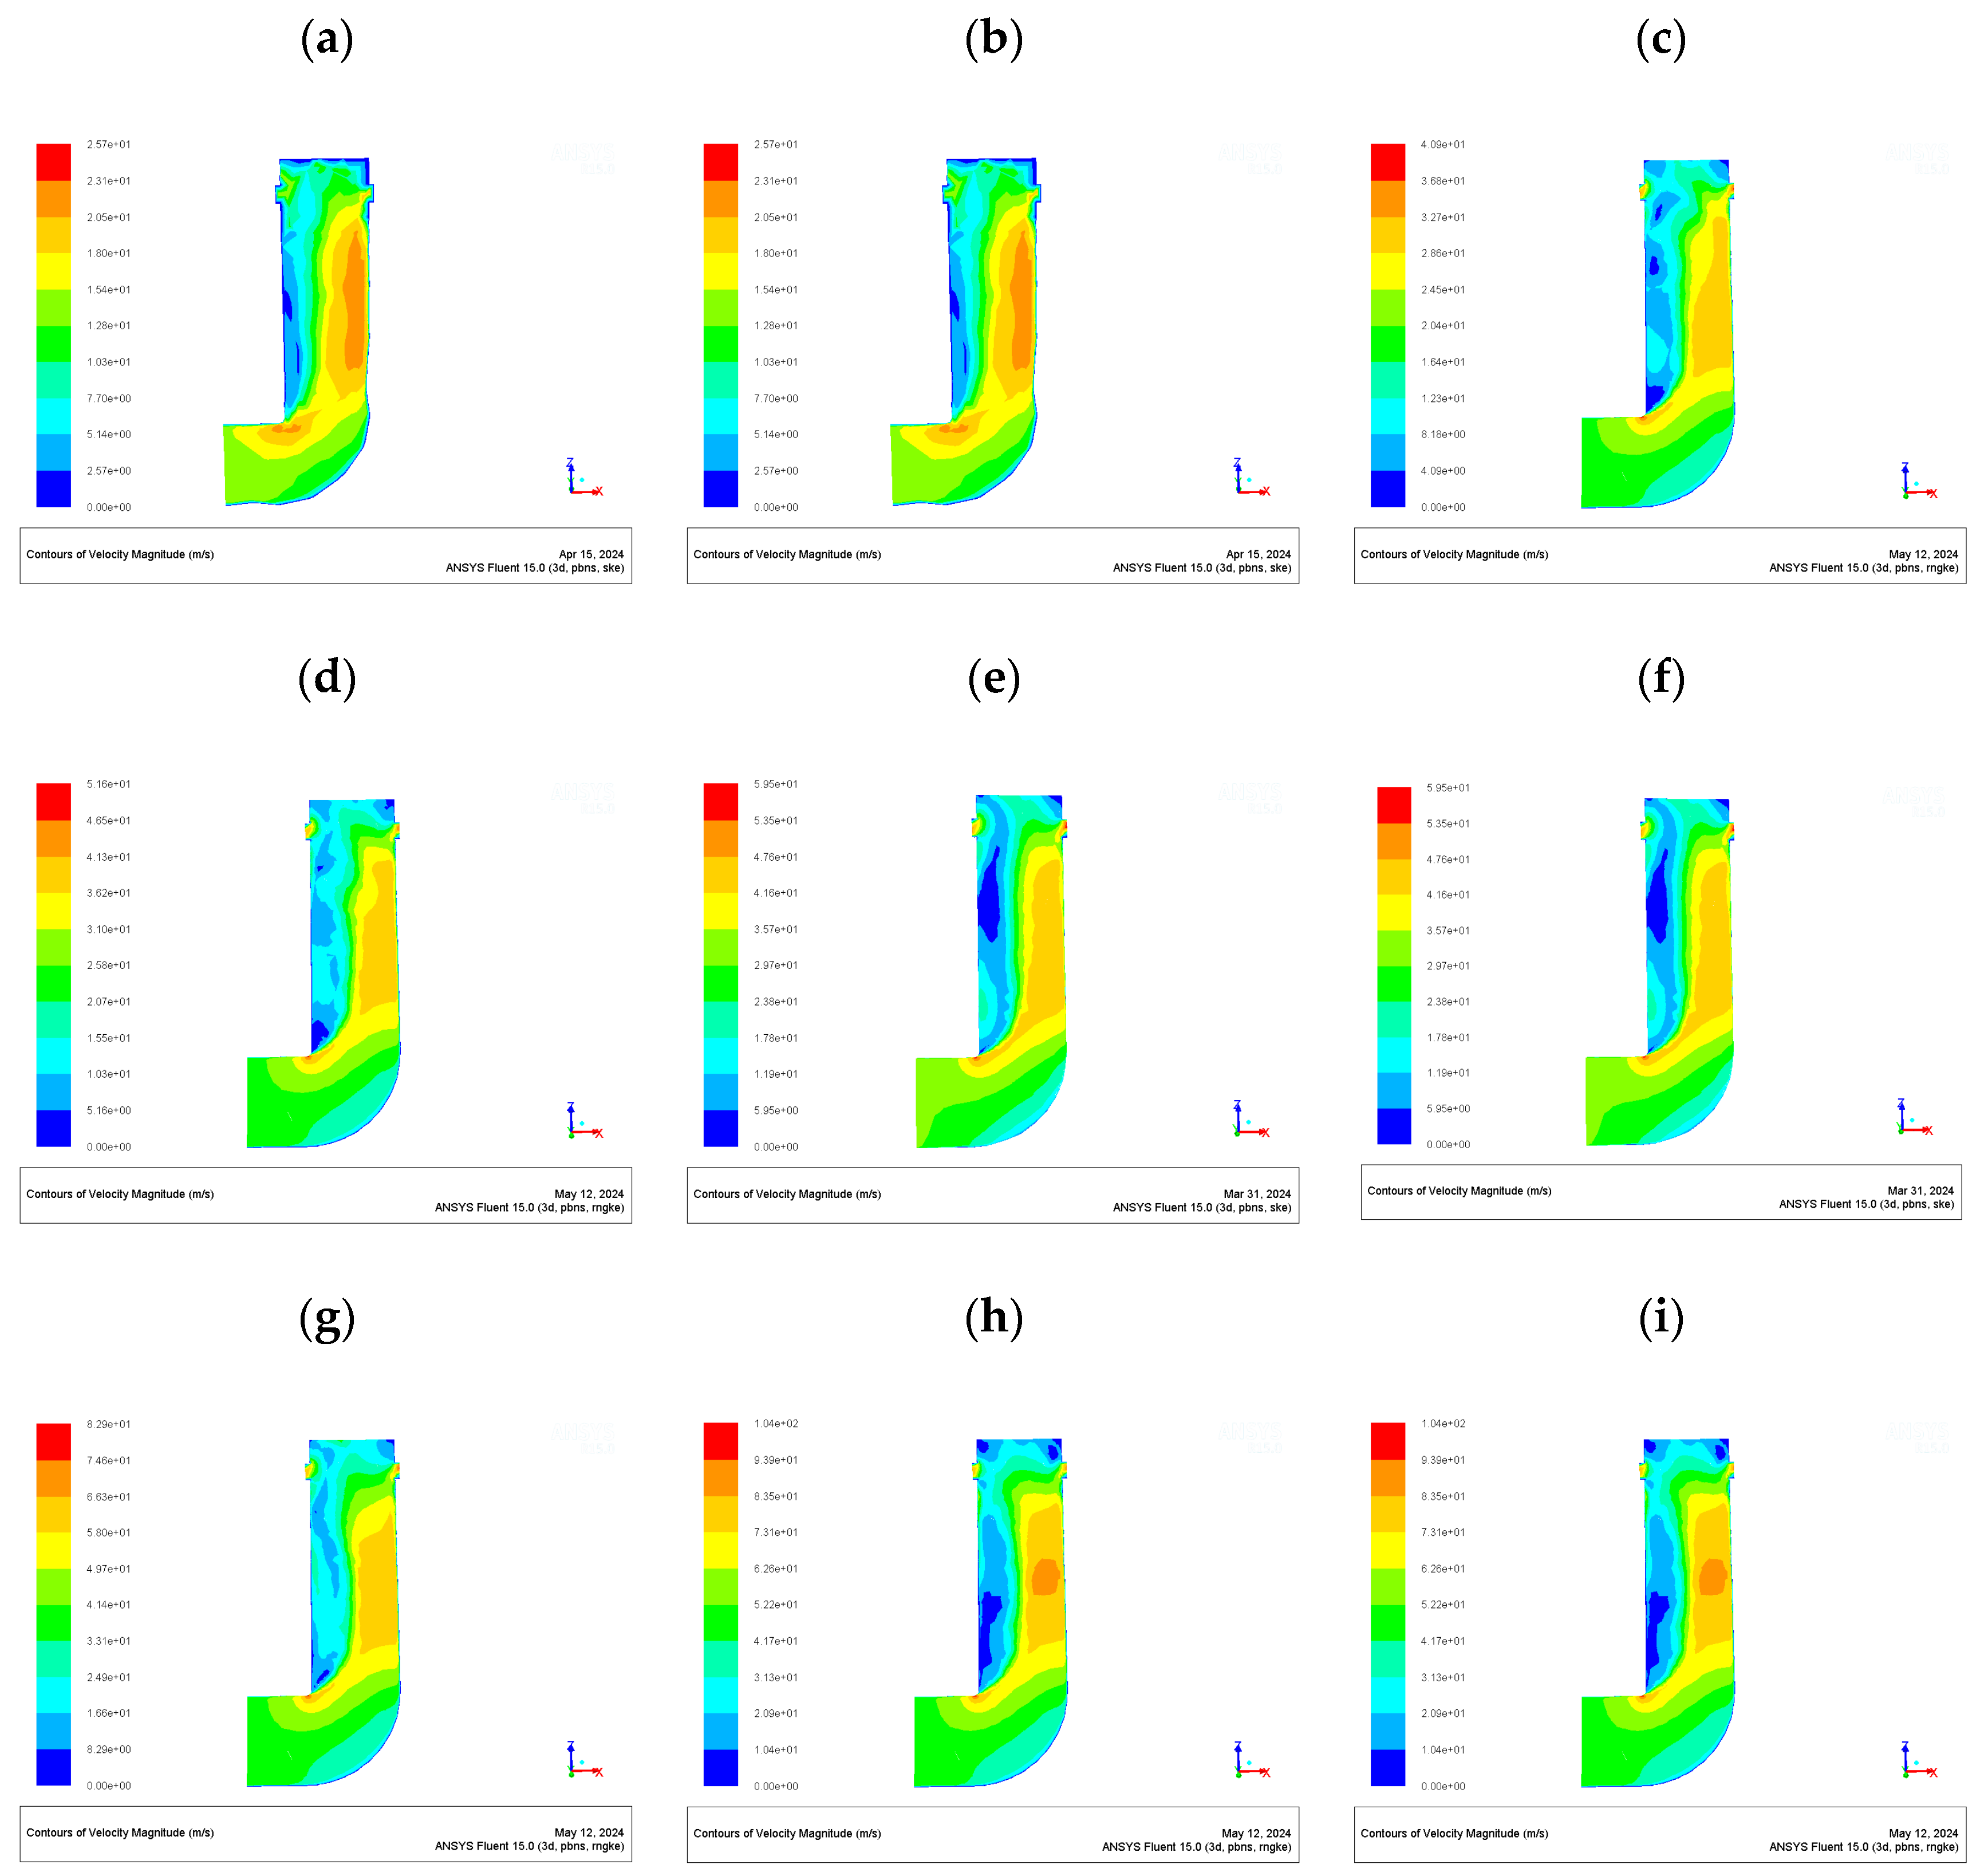
Nine sets of data, for 10, 15, 20, 25, 30, 35, 40, 45, and 50 m/s, were investigated for the inlet air velocity of the gasifier. The corresponding contours of the static pressure, total pressure, and velocity are shown in Figure 18 and Figure 19, respectively.
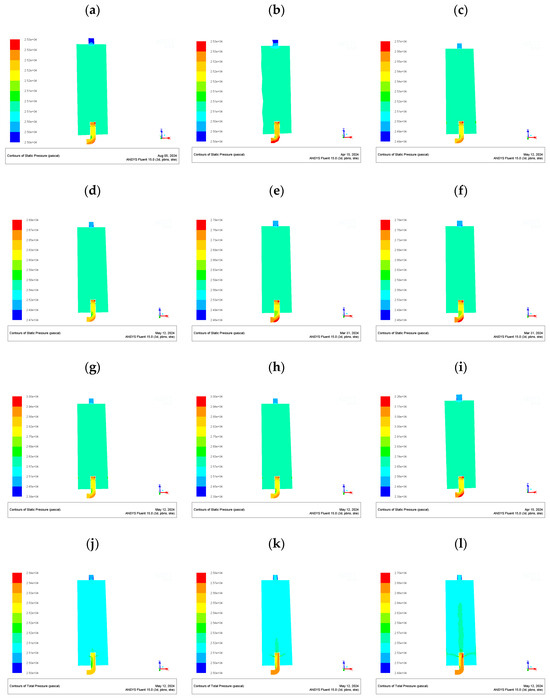
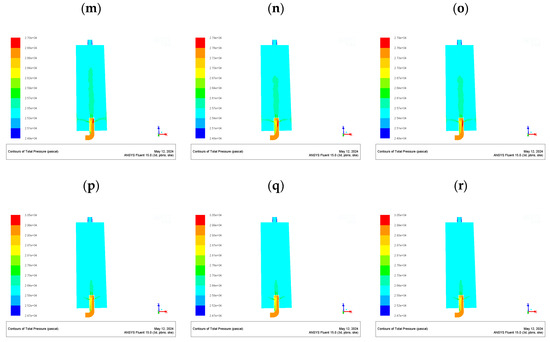
Figure 18.
Contours of static pressure and total pressure: (a–i) 10, 15, 20, 25, 30, 35, 40, 45, and 50 m/s for static pressure; (j–r) 10, 15, 20, 25, 30, 35, 40, 45, and 50 m/s for total pressure.
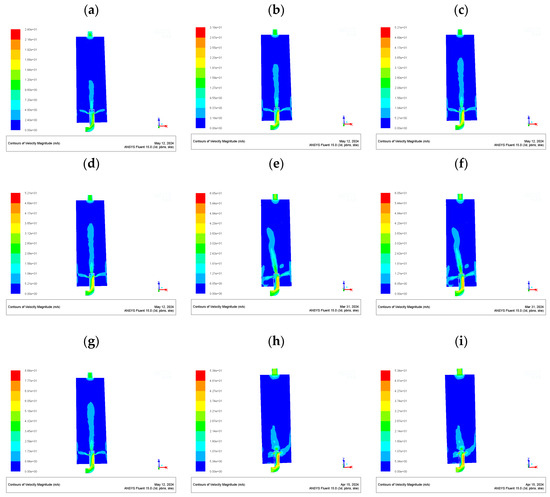
Figure 19.
Contours of velocity: (a–i) 10, 15, 20, 25, 30, 35, 40, 45, and 50 m/s.
In Figure 18, it was found that with the increase in the inlet velocity, the pressure distribution inside the nozzle mainly changed in two stages. During the period as the inlet air velocity increased from 10 m/s to 30 m/s, the pressure near the inlet of the nozzle and the elbow presented an obvious trend of decline. When the velocity exceeded 30 m/s, the pressure no longer decreased, and conversely, began to rise, which caused the particles to be deposited at the bottom elbow of the nozzle, affecting the normal and stable operation of the device.
It can be seen in Figure 19 that when the inlet velocity was low, the flow rate in the whole gasifier was low, especially at the top of the nozzle, where there was almost no fluidizing wind passing through. As the inlet velocity increased to 30 m/s, the flow rate in the gasifier increased obviously, which is conducive to the fluidization of materials in the gasifier, and strengthens the disturbance of particles in the furnace. As the gas velocity exceeded 30 m/s, especially when it reached 50 m/s, the velocity distribution uniformity in the gasifier was greatly reduced, and the gas velocity in the nozzle and at the top of the gasifier was also decreased, which affected the normal operation of the device. This may be because the inlet velocity was too high, resulting in uneven air distribution and aggravating the back-mixing phenomenon of materials in the gasifier, which is not conducive to the long-term stable operation of the device.
Therefore, an inlet air velocity of 30 m/s was selected in this study.
3.2.3. Simulation of Different Outlet Pressures in Combined Opening Type of Gasifier
Six sets of outlet pressure of 0, 5, 15, 25, 35, and 50 kPaG, were investigated for the gasifier. The corresponding contours of the static pressure, total pressure, and velocity are shown in Figure 20 and Figure 21, respectively.
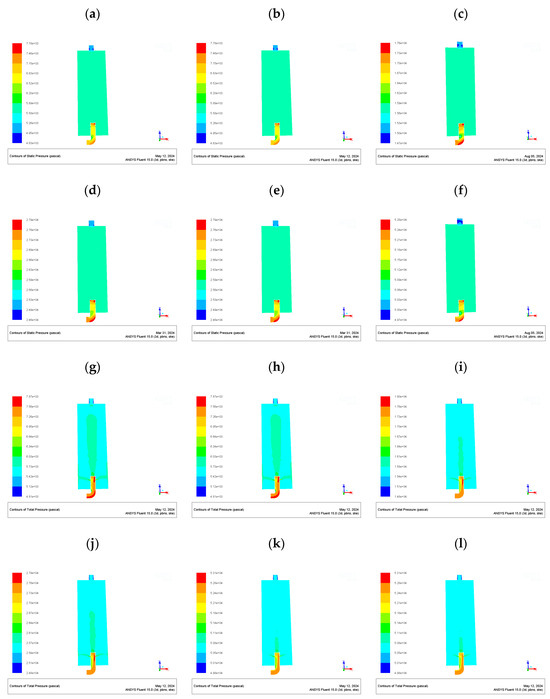
Figure 20.
Contours of static pressure and total pressure: (a–f) 0, 5, 15, 25, 35, and 50 kPaG for static pressure; (g–l) 0, 5, 15, 25, 35, and 50 kPaG for total pressure.
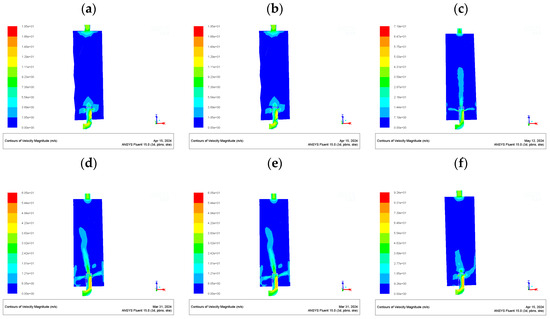
Figure 21.
Contours of velocity: (a–f) 0, 5, 15, 25, 35, and 50 kPaG.
It can be seen in Figure 20 that under different outlet pressure values, the overall pressure distribution in the gasifier changed a little. The pressure change was mainly concentrated in the nozzle. When the outlet pressure was low, the pressure near the lower elbow of the nozzle and the top outlet was high, so coking and blocking easily occurred at the nozzle elbow. With the increase in the outlet pressure, the pressure at the elbow decreased, and the coking phenomenon was alleviated.
In Figure 21, with the increase in the outlet pressure, the velocity distribution in the gasifier mainly changed in two stages. When the pressure increased from 0 kPaG to 25 kPaG, the velocity in the nozzle in the gasifier increased significantly, which is conducive to washing away the particles deposited near the outlet hole of the nozzle, thus alleviating the coking and blockage phenomenon. At the same time, the air velocity at the top of the nozzle also gradually increased, which can play a cooling role. However, when the outlet pressure exceeded 25 kPaG, the gas velocity in the gasifier decreased somewhat, and the wear of the gasifier wall was intensified, which is not conducive to the safe and stable operation of the gasifier.
Thus, an outlet pressure of 25 kPaG was selected in this research.
3.3. Hydrodynamic Behavior in a Circulating Fluidized Bed Gasifier
Based on the above research findings, the operating conditions for the coal gasifier were achieved with an inlet velocity of 30 m/s and an outlet pressure of 25 kPaG. Figure 22 shows the simulation results of a CFB coal gasifier.

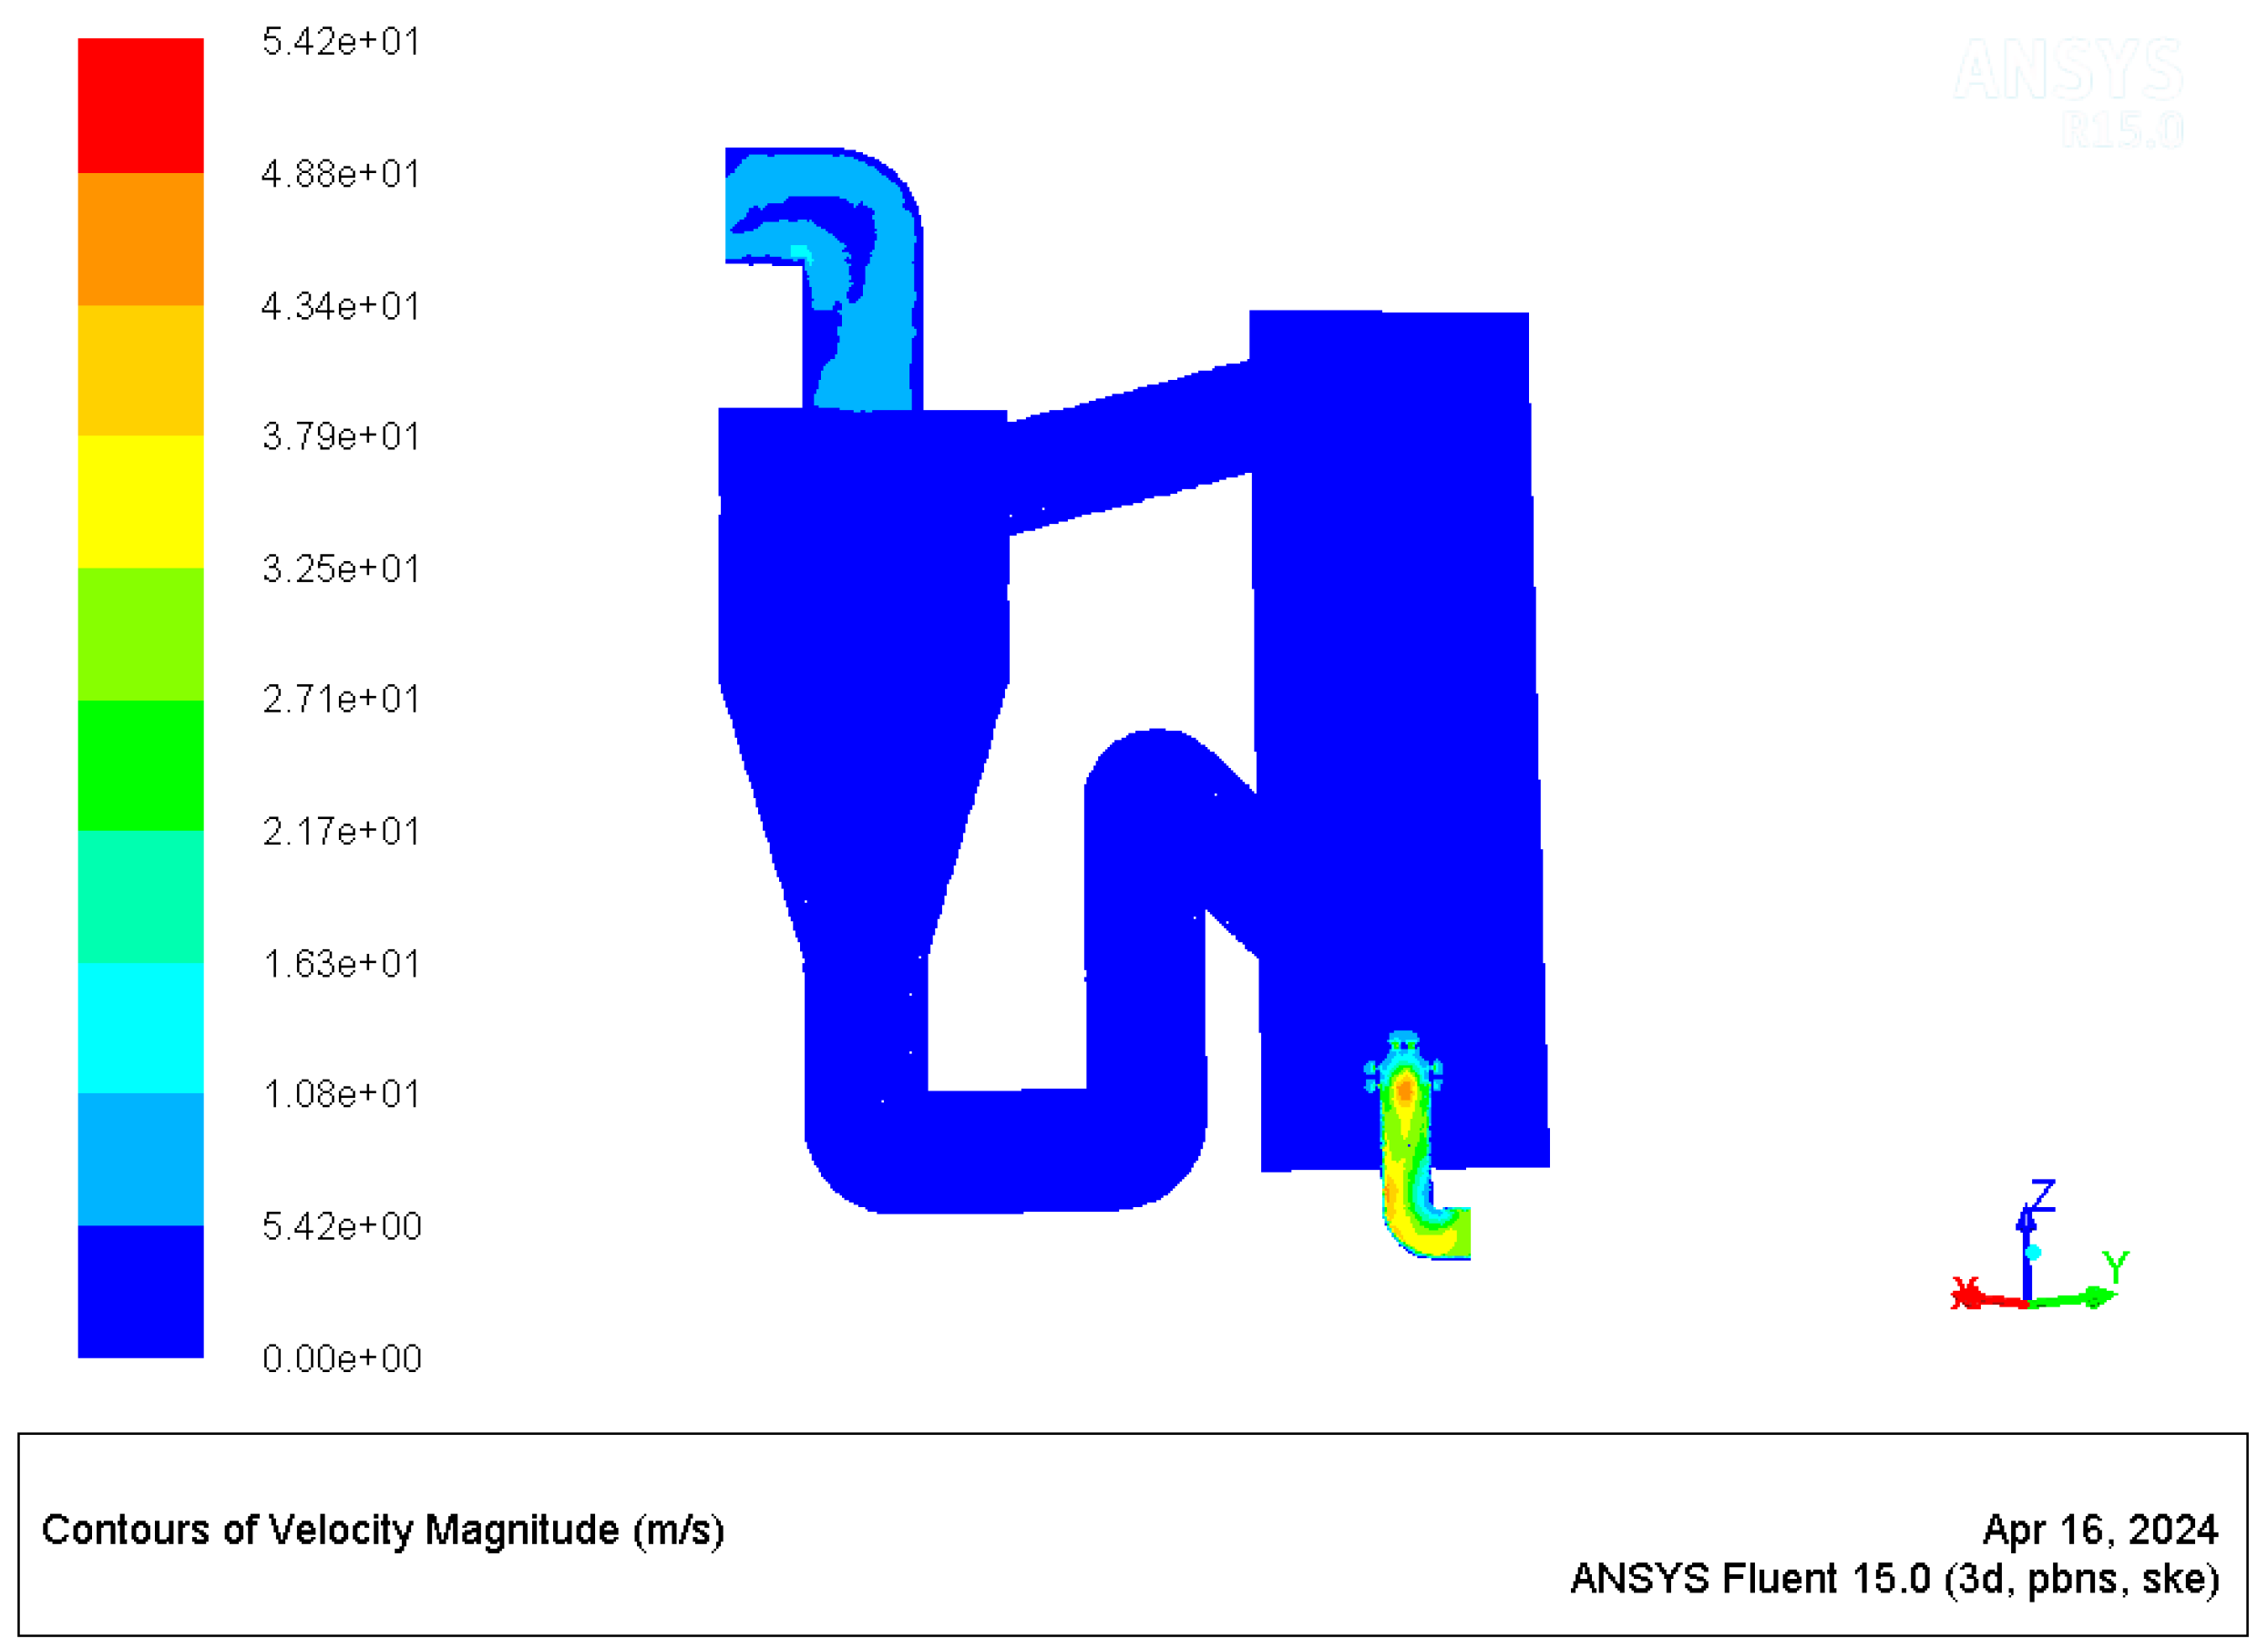
Figure 22.
Contour of velocity.
Figure 22 shows the velocity contour of the CFB coal gasifier. As can be seen in the figure, when the air flows from the inlet through the elbow and continues to flow upward through the inner core tube, the air flow velocity at the nozzle is higher and evenly distributed, which can fully disturb the particles near the elbow. Meanwhile, the velocity at the top of the nozzle is also high, which can play a good cooling effect while disturbing the falling particles. The local fluidizing dead zone at the top of the nozzle is also small, which can effectively alleviate the phenomenon of slag formation and blockage, and is conducive to extending the service life of the nozzle and promoting the safe and stable operation of the gasification plant.
In summary, the optimization of the nozzle in this paper can realize the uniform distribution of air in CFB gasifiers, improve the uniformity and stability of particle fluidization, alleviate the phenomenon of slag formation and blockage in the nozzle, and promote heat transfer, combustion, and gasification processes in the furnace. This research provides a theoretical reference for the long-term stable operation of CFB coal gasifiers.
4. Conclusions
Based on the actual production process of a company in Zhundong, Xinjiang, China, this paper simulated the fluid dynamics behavior in a nozzle, fluidized gasifier, and CFB. The contours of the pressure and velocity distribution in the nozzle and gasifier were obtained. The results show that the resistance (pressure drop) generated by the fluid passing through the inner bell-shaped nozzle is high and drops sharply after flowing out of the hole from the inner nozzle. That is, the pressure of the bell nozzle is distributed very densely in the inner core tube, while the distribution of the outer nozzle is sparse.
For the simple system of the inner core tube, when only the upper hole is opened, the pressure in the entire nozzle is high, which is not conducive to extending the service life of the nozzle and easing the coking and blockage. In contrast, the combined open-pass nozzle can not only reduce the pressure, especially at the elbow, but also makes the material flow in the nozzle and pass the gasifier uniformly. It was found that when the inlet velocity was selected as 30 m/s, the pressure at the elbow and top of the nozzle was relatively low and the velocity was high, which can indicate that the local fluidizing dead zone at the top of the nozzle was small, improving the velocity distribution, and moderately decreasing the pressure in the inner core tube.
By setting the inlet air velocity to 30 m/s, as the outlet pressure reached 25 kPaG, the relative reduction in the pressure of the elbow and its top can be inferred to relieve the phenomenon of particle accumulation and slagging, and it is beneficial to prolong the service life of the gasifier.
Author Contributions
Conceptualization and methodology, W.M. and X.Y.; software, M.T. and J.L. validation, formal analysis, and investigation, M.T. and K.J.; resources, J.L.; data curation, K.J.; writing—original draft preparation, M.T.; writing—review and editing, W.M. and W.P.; visualization, W.P.; supervision, X.Y.; project administration, X.Y. and S.Z. All authors have read and agreed to the published version of the manuscript.
Funding
This research was funded by the National Natural Science Foundation of China (22368045), High Quality Development Special Project for Science and Technology Supporting Industry from the Changji prefecture, Xinjiang, China (2022Z04). And the APC was funded by (22368045).
Data Availability Statement
The original contributions presented in the study are included in the article, further inquiries can be directed to the corresponding authors.
Conflicts of Interest
Author Shupei Zhang was employed by the company Xinjiang Yihua Chemical Industry Co., Ltd. The remaining authors declare that the research was conducted in the absence of any commercial or financial relationships that could be construed as a potential conflict of interest.
References
- Wang, C.; Luo, M.; Xiong, R.; Zhang, J.; Zhao, L.; Feng, P.; Che, D. Effect of CO2-water washing on Na/Ca removal performance of Zhundong high-alkali coal. J. China Coal Soc. 2023, 48, 996–1005. [Google Scholar]
- Meng, Q.S.; Wu, C.G. 320 t/h design and operation of a new circulating fluidized bed boiler for pure burning Zhundong coal. Energy Conserv. 2022, 41, 34–36. [Google Scholar]
- Yuan, Y. Characteristics of Tar and Combustible Gas Generation during Co Gasification of Zhundong Coal and Pine Sawdust in a Fluidized Bed Reactor; Qingdao University: Shangdao, China, 2023. [Google Scholar]
- Guo, D.; Zhou, C.C.; Ge, Z.W.; Yu, P.F.; H, Z.Y. Influence of alkali metals and alkaline earth metals on the utilization of Xinjiang Zhundong Coal. Cal Process. Compr. Util. 2023, 09, 60–66. [Google Scholar]
- Wang, F.C. Coal gasification technologies in China: Review and prospect. Clean Coal Technol. 2021, 27, 1–33. [Google Scholar]
- Cheng, Q.B. Development and prospect of coal background of “Carbon Gasification Peaking and Technology in China under the Carbon Neutrality”. Zhejiang Chem. Ind. 2023, 54, 38–44. [Google Scholar]
- Liu, X.M.; Zhang, M.J.; Zhang, T.; Yuan, T.L.; Li, H.Y.C.; Yang, K.; Wang, C.A.; Che, D.F. A review of coal-fired fluidized bed boiler coupled with carbon-containing waste combustion technology. Clean Coal Technol. 2024, 04, 1–15. [Google Scholar]
- Wang, C.; Song, G.L.; Lv, Q.G. Research progress on ultra-low NOx and SOx emission control technology for CFB boilers. Clean Coal Technol. 2021, 27, 17–25. [Google Scholar]
- Song, C.-Z.; Li, R.-Y.; Li, S.-X. Numerical simulation and reconstruction of air caps for 220t/h circulating fluidized bed. Energy Conserv. 2018, 37, 75–79. [Google Scholar]
- Hu, X.-B.; Yang, X.-Q.; Mo, W.-L.; Zhang, S.-P.; Ji, G.; Wei, X.-Y.; Fan, X. Structural characteristics and thermal conversion performance of ash and slag from circulating fluidized bed gasifier. J. Fuel Chem. Technol. 2022, 50, 1361–1371. [Google Scholar] [CrossRef]
- Shao, Z.M.; Yuan, S.M.; Guo, X.R.; Wang, F. Development and application research of circulating fluidized bed boiler technology. Power Syst. Eng. 2023, 39, 31–32. [Google Scholar]
- Çam, M.M.; Soyhan, H.S.; Qubeissi, M.A.; Al Qubeissi, M.; Çelik, C. Designing a new bell-type primary air nozzle for large-scale circulating fluidized bed boilers. Fuel 2023, 335, 127065. [Google Scholar] [CrossRef]
- Yao, H.T. Overview of fluidized bed boiler wind cap technology. Technol. Innov. Appl. 2016, 15, 135. [Google Scholar]
- Mirek, P. Designing of primary air nozzles for large-scale CFB boilers in a combined numerical-experimental approach. Chem. Eng. Process. Process Intensif. 2011, 50, 694–701. [Google Scholar] [CrossRef]
- Mirek, P.; Klajny, M. Air nozzle design criteria for protection against the backflow of solids in CFB boilers. Appl. Therm. Eng. 2018, 141, 503–515. [Google Scholar] [CrossRef]
- Dai, Z.-H.; Liu, H.-F.; Yu, G.-S.; Gong, X.; Yu, Z.-H. Numeric Simulation of the Flow Field in Four Opposed Impinging Jets. J. East China Univ. Sci. Technol. 2004, 01, 65–68. [Google Scholar]
- Wu, Y.; Zhang, J.; Yue, G.; Lu, J. Numerical simulation of the gas flow field from a triple channel coal-water slurry gasifier nozzle. J. Tsinghua Univ. Sci. Technol. 2006, 05, 691–695. [Google Scholar]
- Jiang, H.W.; Chen, H.K.; Gao, J.Q.; Wang, Y.; Wu, Z.X. Research on effects of primary air velocity on gas-solid fluidization characteristics of circulating fluidized beds based on pressure fluctuations in wind caps. Proc. CSEE 2014, 34, 2784–2793. [Google Scholar]
- Zhao, X.; Bao, S.L.; He, J. Experiments and numerical simulation on the resistance characteristics of the cap with inner tube and down flow. Boil. Technol. 2005, 36, 32–37. [Google Scholar]
- Fan, J.L. Study on Resistance Characteristics of Air Caps and Maldistribution of Distributor in Lame Fluidized Bed; University of Chinese Academy of Sciences: Huairou, China, 2016. [Google Scholar]
- Jiao, K.-P.; Mo, W.-L.; Zhao, Z.-T.; Li, J.-Q.; Yang, X.-Q.; Zhang, S.-P.; Wei, X.-Y.; Fan, X. Characteristics of the blockage from air nozzle guide duct in circulating the fluidized-bed coal gasifier and its formation mechanism. ACS Omega 2024, 9, 6924–6931. [Google Scholar] [CrossRef]
- Jiang, H.W. Research on Gas-Solid Fluidization Characteristics of Fluidized Beds Based on Pressure Fluctuations in Wind Caps; North China Electric Power University: Beijing, China, 2013. [Google Scholar]
- Huang, Z.; Zhang, S.G. Optimization of large-diameter bell-type air cap in CFB boiler. Electr. Power Constr. 2014, 35, 84–87. [Google Scholar]


Disclaimer/Publisher’s Note: The statements, opinions and data contained in all publications are solely those of the individual author(s) and contributor(s) and not of MDPI and/or the editor(s). MDPI and/or the editor(s) disclaim responsibility for any injury to people or property resulting from any ideas, methods, instructions or products referred to in the content. |
© 2024 by the authors. Licensee MDPI, Basel, Switzerland. This article is an open access article distributed under the terms and conditions of the Creative Commons Attribution (CC BY) license (https://creativecommons.org/licenses/by/4.0/).