Article

Applicability of a Fractal Model for Sandstone Pore-Fracture Structure Heterogeneity by Using High-Pressure Mercury Intrusion Tests

1
College of Earth Sciences & Engineering, Shandong University of Science and Technology, Qingdao 266590, China
2
The First Exploration Team of Shandong Coalfield Geologic Bureau, Qingdao 266427, China
3
Shandong Engineering Research Center of Mine Gas Disaster Prevention, Qingdao 266427, China
4
Shandong Provincial GEO-Mineral Engineering Co., Ltd., Jinan 205200, China
5
Institute of Geology and Paleontology, Linyi University, Linyi 276000, China
*
Author to whom correspondence should be addressed.
Processes 2024, 12(8), 1658; https://doi.org/10.3390/pr12081658
Submission received: 23 June 2024 / Revised: 10 July 2024 / Accepted: 16 July 2024 / Published: 7 August 2024
(This article belongs to the Section Chemical Processes and Systems)

Abstract

:
Pore structure heterogeneity affects the porosity and permeability variation of tight sandstone, thereby restricting sandstone gas production. In total, 11 sandstone samples were taken as a target in the northwest margin of the Junggar Basin. Then, scanning electron microscope and high-pressure mercury injection tests are used to study the distribution of a pore and fracture system in the target sandstone. On this basis, single and multifractal models are used to quantitatively characterize the heterogeneity of pore structure, and the applicability of the classification model in characterizing the heterogeneity of the pore-fracture structure is explored. The results are as follows. (1) The target samples are divided into two types, with the mercury removal efficiency of type A samples ranging from 44.6 to 51.8%, pore size mainly distributed between 100 and 1000 nm, and pore volume percentage ranging from 43 to 69%. The mercury removal efficiency of type B samples ranges from 14 to 28%, and pore diameter distribution is relatively uniform. (2) Different fractal models represent different physical meanings. The calculation results of sponge and thermodynamic fractal models indicate that the heterogeneity of pore structure distribution in the type B sample is significantly stronger than that in type A, which is inconsistent with the conclusions of the Sierpinski model. This is because the aforementioned two models characterize the complexity of pore surface area, while the Sierpinski model characterizes the roughness of pore volume. The comparison shows that there is a significant correlation between the thermal dimensionality value DT and the volume percentage of macropores and mesopores. Therefore, the thermodynamic model can better quantitatively characterize the heterogeneity of macropore and mesoporous pore distribution. (3) The results indicate that higher pore volume range is mainly influenced by mesopores and macropores. From the relationship curve between mercury removal efficiency and single fractal dimension, it can be seen that mercury removal efficiency is greatly affected by distribution heterogeneity of the lower value area of pore volume, and it has no obvious relationship with distribution heterogeneity in the lower value area of the pore volume.

1. Introduction

China is rich in (tight) sandstone and natural gas resources, and the development potential is great. However, tight sandstone’s low porosity and low permeability have become the key problem in limiting natural gas extraction in China. The relevant literature shows that the heterogeneity of sandstone pore structure restricts the tight gas seepage process, which leads to a decrease in natural gas production and ultimate recovery efficiency. Therefore, the oil and gas productivity constrained by the pore structure of sandstone reservoirs has become one of the current research hotspots [1,2,3,4].
At present, a number of testing techniques have been used to study the pore structure of sandstone, such as low-temperature liquid nitrogen tests (LPN2GA), nuclear magnetic resonance technology (LF-NMR), high-pressure mercury injection tests (HPMI), CT scanning experiments (FE-SEM), etc. [5,6,7,8]. Among them, the high-pressure mercury test has become one of the most used methods to test sandstone pore structure parameters because of its advantages of rapidity, simplicity, and convenience, large pore range, and low cost [9,10,11]. Li et al. (2022) tested the pore structure of sandstone samples through low-temperature nitrogen adsorption and low-temperature carbon dioxide adsorption methods [9]. They found that inkpot-shaped pores were developed in sandstone, and the pore volume of sandstone was provided by mesoporous pores. Zhuo et al. (2022) believe that the pore volume of sandstone comes from large pores and small pores, the specific surface area comes from small pores and micropores, and most of them are intergranular pores [10]. Huang et al. (2023) show that sandstone has low porosity and low permeability, and the reservoir space has intergranular pores and secondary solution pores [11]. In summary, the pore distribution of sandstone is uneven, the pore shape is more complex, and it has few pores and low permeability. The pore volume comes from macropores and micropores, the specific surface area comes from small pores and micropores, and the storage space is composed of intergranular pores and secondary pores. However, due to the frequent alternation of macropores and small pores, fluid seepage resistance increases, and the permeability of tight sandstone gas reservoirs is poor in general.
Based on this, to quantitatively characterize the pore structure, relevant scholars have started to use fractal theory. Currently, the classification models include single fractal models (such as the sponge model and thermodynamic model) and multifractal models [2,8,12]. Luo et al. (2023) studied the fractal variation of the pore throat of sandstone reservoirs by using SEM, X-ray, high-pressure mercury tests, and other experiments [13]. It was found that the fractal dimension of the larynx decreased with the increase in mercury intrusion saturation and mercury removal efficiency. Wei et al. (2023) found that the total pore-specific surface area of coal is positively correlated with the comprehensive fractal dimension of coal pores [14]. However, the multifractal model is more accurate than the single fractal model to quantitatively characterize the heterogeneity of pore structure [15,16,17,18,19]. Jiang et al. (2018) showed that the number of multifractal fractal intervals is positively correlated with heterogeneity, while its number is negatively correlated with reservoir porosity and permeability conditions [20]. Yan et al. (2017) studied that the multifractal parameter values differ with different pore structure types [12]. Therefore, in this paper, 11 samples from the northwest margin of Junggar Basin are taken as examples, using scanning electron microscopy and high-pressure mercury tests to determine the distribution of the target sandstone pores and fractures. Sample types were divided by pressed mercury pore space parameters. On this basis, the single and multifractal models are used to quantitatively characterize the heterogeneity of pore structure, and the applicability of the fractal model to characterize the heterogeneity of pore and fracture structure distribution is discussed. In this paper, the Hodot reservoir pore classification scheme is adopted, and the pores are divided into small pores (<100 nm), mesopores (100–1000 nm), macropores, and micro-fractures (>1000 nm).

2. Sample Preparation and Experimental Testing

2.1. Sample Collection

The research area is located in the northwest margin of Junggar Basin, and the overall distribution is NE–SW. It is bordered by the Xiayan and Dabasong bulges in the southeast, the Yingxi and Shiyingtan depressions in the northeast, the eastern edge of the Zhongqian Bulge and the Kepai Fracture Zone in the west, and the Wuxia Fracture Zone in the north. The study area is relatively simpler, with an overall monolithic structure that slopes to the southeast. The main structure is relatively flatter, and the local area has a smaller amplitude of nasal structure [21,22,23]. The sample frame is the Permian Fengcheng Formation (Figure 1).
The tight sandstone samples collected in this experiment are all from Well x, and the basic information of the samples is shown in Table 1.

2.2. Experimental Methods

Regarding the FE-SEM tests, a small square piece of the experimental sample was cut out and the surface of the sample was cleared of impurities with nitrogen, and then the sample was polished using an argon ion beam. After the sample was prepared, a Quanta 250 scanning electron microscope was used for the testing and identification of the sample surface topography in the high-resolution SEM photographs using PCAS software 2456-1 [24,25].
Regarding the HPMI tests, firstly, the samples were polished and placed to dry at 60 °C for 48 h, and the pore rupture experiments were carried out on the samples by using a AutoPore IV 9500, Mike Corporation in the United States with a maximum experimental pressure of 21 MP, a pore size measurement range of 0.069–144 μm, and a testing temperature of room temperature. The pore size distribution and specific surface of the sandstone samples were obtained by varying the pressure [26,27,28].

2.3. Computational Theory

The Menger model (M-model) is shown in Equation (1) [29]:
l g ( d v / d p ) ( D 4 ) l g ( p )
where DM is a fractal dimension and dimensionless; P is the intrusion pressure, MPa; and V is the total intrusion volume, cm3·g−1.
The Sierpinski model (S-model) is shown in Equation (2) [30]:
l g ( d v / d p ) ( D 4 ) l g ( p )
where V is the volume of mercury injected into the sample, mL; P is the intrusion pressure, Mpa; Pt is the threshold pressure, Mpa; DS is the fractal dimension; and a is a constant.
The thermodynamic model is shown in Equation (3):
l n w / r 2 = D l n v 1 / 3 / r + C
q~D(q) is a set of basic languages to describe the local features of multifractals, and the formula for calculating D(q) is the following:
D q = τ ( q ) q 1
where τ(q) is the mass index function and q is the statistical order of moments [11].

3. Results and Discussion

3.1. Sample Classification Based on Pressed Mercury Basis Testing

Based on the basic information of the sample and experimental parameters of the high-pressure mercury test, the percentage of pore volume and mercury removal efficiency were used as the basis for classifying the sample types. This is because the mercury removal efficiency reflects the uniformity of the pore throat distribution, and the pore volume reflects the degree of pore development. The division scheme based on the two-parameter pore volume percentage–mercury removal efficiency divides the samples into two types. Among them, Type A belongs to the samples with high mercury removal efficiency, which shows that the mercury removal efficiency is more than 40%, and the pore volume percentage of small pores is between 14 and 20%. While Type B belongs to the samples with lower mercury removal efficiency, all of them have less than 30% mercury removal efficiency, and the percentage of the pore volume of the macropores ranged from 15 to 24% (Figure 2 and Figure 3).
The debris is coarse to medium in size, with moderate sorting. It is rounded to a sub-angular to sub-circular shape, and the particles are in contact with each other. Illitization of impurities occurs, as does the filling and replacement of particles with calcite cement. The particles are composed of quartz, feldspar (plagioclase, sericite), flint, and various other rock fragments. Biotite can precipitate iron and undergo fading, while phyllite and mica undergo strong deformation, forming a false matrix. Holes and seams are rare.

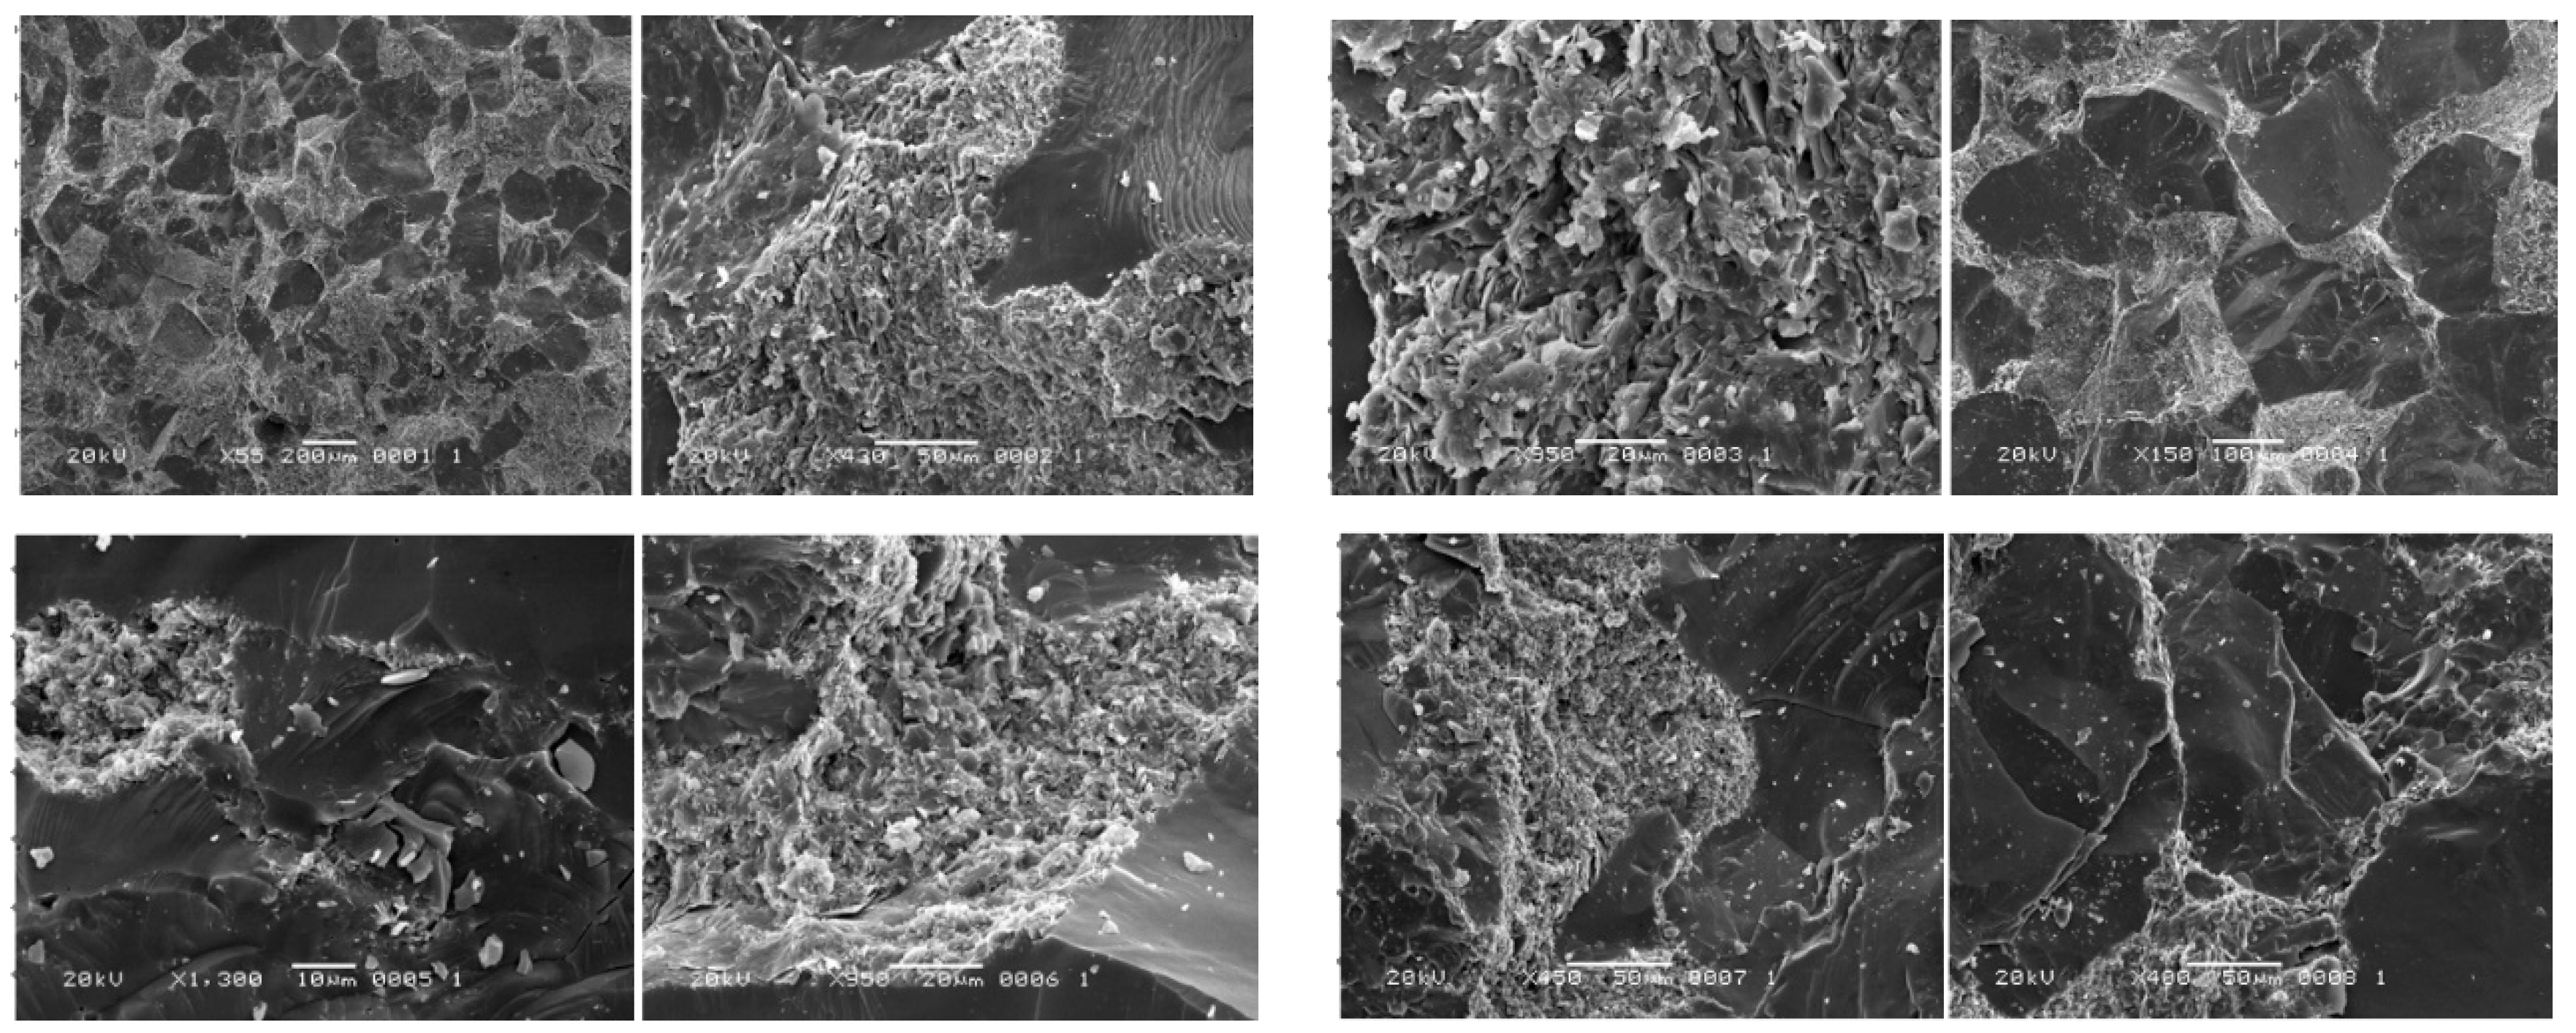
SEM Images of Test Samples

SEM results shows that the characteristics of the photos under the sample microscope are consistent. Overall, the structure is dense, with embedded contact between debris particles and filamentous illite filling between the particles. Filamentous illite aggregates are filled between debris particles. From a microscopic perspective, filamentous illite aggregates are filled between debris particles. The quartz particles are in a sub-circular shape, with a clean surface and embedded contact between them. The filamentous illite aggregate is filled between debris particles in a scaly structure.
On this basis, the two types of samples were divided in detail by the high-pressure mercury test curves. From the mercury intrusion and removal curves, the mercury intrusion pressure is distributed in the range of 0.01~21 MP. The mercury removal efficiency ranged from 44.6 to 51.8% for Type A samples and from 14 to 28% for Type B samples. Based on the graphs of pore size and stage mercury intrusion volume, it can be seen that the pore sizes of Type A samples were mainly distributed between 100 and 1000 nm, and the percentage of pore volume ranged from 43 to 69%, while the pore sizes of Type B samples were uniformly distributed (Figure 4).
Figure 5a shows that the percentage of pore volume of macropores of Type A samples ranged from 20% to 40% and that of Type B samples ranged from 25% to 50%, and in comparison, the macropores of Type B samples were more developed than those of Type A. The results of this study are summarized in Figure 5a. Figure 5b shows that the pore volume percentage of mesopores in sandstone samples of Type A is concentrated in the range of 40–50%, and the pore volume percentage of mesopores in Type B samples is concentrated in the range of 23–54%, which shows that the mesopores of Type A samples are more developed than those of Type B. Figure 5c shows that the pore volume percentage of small pores of Type A samples is mainly concentrated in the range of 14% to 18%, and the pore volume percentage of small pores of Type B samples is mainly concentrated in the range of 16% to 22%. Therefore, comparing the two types of samples, it can be found that the small pores of the Type B samples are more developed than the Type A. Overall, it can be seen that the mesopore porosity is more developed in the sandstone samples of Type A, and the small and macropores porosity is more developed in the sandstone of Type B.

3.2. Quantitative Characterization of Heterogeneity of Pore Distribution Based on Different Fractal Models

The DM value can be calculated using the sponge model. The fractal curves can reflect a linear negative correlation between logp and log(dv/dp), indicating that the fractal variations of the samples can be reflected by the model. The linear fit of the samples in Type A ranged from 0.86 to 0.98, and the DM values ranged from 3.1 to 3.4; the linear fit of the samples in Type B ranged from 0.74 to 0.97, and the DM values ranged from 2.9 to 3.1 (Figure 6). By comparison, the DM value of Type A is higher than that of Type B samples, indicating that the heterogeneity of pore structure distribution of Type A samples is stronger than that of Type B samples.
The DS value is calculated using the Sierpinski model. The fractal curve can reflect that there is a linear positive correlation between lnp and lnv, which indicates that the fractal variations of samples can be reflected by the model. Among them, the linear fit of Type A samples ranged from 0.75 to 0.94, and the DS value ranged from 2 to 2.4. The linear fit of Type B samples ranged from 0.63 to 0.93, and DS values ranged from 2.1 to 2.4 (Figure 7). By comparison, the DS value of Type B is higher than that of Type A, indicating that the heterogeneity of pore structure distribution of Type B samples is stronger than that of Type A samples. The results of this model are inconsistent with those of the sponge model, because the sponge model represents the complexity of the rock’s surface area, while the Sierpinski model represents the roughness of the rock’s pore volume.
The DT values were calculated based on the thermodynamic model. The results show that the fractal curves can reflect a linear positive correlation between ln(V1/3/r) and ln (W/r2), indicating that the model can reflect the fractal variations of the samples. The linear fit was close to 1 for both Type A and Type B samples, with Type A DT values ranging from 2.7 to 2.8 and Type B DT values ranging from 2.6 to 2.8 (Figure 8). By comparison, the DT values of Type A are larger than those of Type B samples, indicating that the heterogeneity of the distribution of the pore structure of Type A samples is stronger than that of Type B samples. It can be seen that the model’s calculations are consistent with those of the sponge model.
Figure 9a,b show that the q~D(q) spectra of all the samples show an inverse S model, indicating that the pore size distribution of the sandstone samples is characterized by multiple fractals, and reflecting the heterogeneity of the pore structure of the sandstone samples. The range of D−10–D0 for Type A samples is 1.1 to 1.7, and the range of D0–D10 is 0.71 to 0.87. The range of D−10–D0 for Type B samples is 1.2 to 1.47, and the range of D0–D10 is 0.4 to 0.85. Relevant papers show that the left spectral width represents the heterogeneity in the low-value pore volume region, and the right spectral width represents the heterogeneity in the high-value pore volume region. The curve on the left side of Type A is larger than that of Type B, indicating that the distribution of small pores in Type A is more heterogeneous. The curve on the right side of Type B is larger than that of Type A, indicating that the distribution of macropores in Type B is more heterogeneous [17,31].
The D−10–D0 of Type A samples range from 0.2 to 0.7, and the D−10–D0 of Type B samples ranges from 0.2 to 0.5, which indicates that Type A sandstone samples have a strong heterogeneity of small- and medium-sized pore sizes, which is consistent with the results in Figure 10. The D0–D10 range of Type A samples is 0.12~0.27, and the D0–D10 range of class B samples is 0.15~0.6, which indicates that the large-aperture heterogeneity of Type B sandstone samples is relatively more significant, which is also consistent with the results in Figure 9.
Figure 11 shows that DS has a significant negative correlation with DM and DT, while DM has a linear positive correlation with DT, which indicates that the three single models have a linear correlation in the characterization of sandstone pore structure. However, the relationship between the sponge model and the thermodynamic model is more significant because they have the highest linear fit of 0.82. In addition, the results of multifractal calculation show that D−10–D0 is negatively correlated with D0–D10, D0–D10 is positively correlated with D−10–D10, and the relationship between D0–D10 and D−10–D10 is more significant, while there is no linear relationship between D−10–D0 and D−10–D10.
Figure 12a shows that the total pore volume is independent of DM, DS, and DT. Figure 10b shows that the percentage of the pore volume of small pores is independent of DM, DS, and DT, which indicates that the three single fractal models do not reflect the heterogeneity of the distribution of small pores. Figure 12c shows that the pore volume percentage of mesopores is linearly positively correlated with DM and DT and linearly negatively correlated with DS, and the correlation with DT is more significant, which suggests that the DT model can better characterize the heterogeneity of mesopore distribution. Figure 11d shows that the pore volume percentage of macropores has a linear negative correlation with DM and DT, and a linear positive correlation with DS. In contrast, the M models and T model can better reflect the heterogeneity of macropore distribution than the S model, indicating that the heterogeneity of macropore distribution can be characterized by the M model or T model. In summary, DT has a significant relationship with both macroporous and mesoporous pore volume percentages, and thus the T model is better able to quantitatively characterize the heterogeneity of macroporous and mesoporous pore distributions.
The total pore volume is not related to D−10–D0, D0–D10, and D−10–D10. The percentage of pore volume of small pores is also not related to D−10–D0, D0–D10, and D−10–D10, which shows that the multifractal model does not reflect the heterogeneity of the distribution of small pores. The pore volume percentages of mesopores and macropores showed a linear relationship with D0–D10 and none with D−10–D0 and D−10–D10, indicating that the high pore volume areas of the samples were influenced by mesopores and macropores (Figure 13).
Figure 14a shows that the mercury removal efficiency has no relationship with DM, DS, and DT, indicating that the single model cannot reflect the mercury removal efficiency of the samples. Figure 12b shows a linear negative correlation between mercury removal efficiency and D0–D10 and D−10–D10, with no relationship with D−10–D0, and it indicates that mercury removal efficiency is influenced by the low-value zone of the pore space, and it has no relationship with the high-value zone of the pore space.

4. Conclusions

Based on 11 sandstone samples from the northwest margin of Junggar Basin, Xinjiang Province, using scanning electron microscopy, high-pressure mercury test, and other testing techniques, on the basis of clear pore and fracture structure of the target samples, the fractal calculation of the target sandstone samples was carried out by using the singled-multifractal theory, and the correlation between singled multifractal parameters, pore structure parameters, and mercury intrusion test parameters was discussed. The conclusions reached are as follows.
(1) Based on the basic information of the samples and the high-pressure mercury test curve, the target samples can be divided into two types, A and B. Among them, the mercury removal efficiency of Type A samples ranges from 44.6 to 51.8%, the pore size ranges from 100 to 1000 nm, and the percentage of pore volume ranges from 43 to 69%. The mercury removal efficiency of Type B samples ranges from 14 to 28%, and the pore size distribution is relatively more uniform, which is mesopore and macropore.
(2) DT is related to both macropore and mesopore volume percentages, so the T model can better quantitatively characterize the heterogeneity of macropore and mesopore pore distribution. The pore volume percentages of mesopores and macropores were linearly related to D0–D10, and there was no relationship with D−10–D0 and D−10–D10, so the heterogeneity of pore volume distribution in the high-value region of the samples was affected by mesopores and macropores. From the relationship curve between the mercury removal efficiency and the single fractal dimension, it can be seen that the mercury removal efficiency is affected by the low-value zone of the pore volume, and there is no relationship with the heterogeneity of the distribution of the high-value zone of the pore volume.

Author Contributions

Methodology, S.Z.; Software, M.S.; Validation, Y.C.; Formal analysis. Q.L.; Investigation, X.C. and J.Z.; Resources, G.R. All authors have read and agreed to the published version of the manuscript.

Funding

This research was sponsored by Research Fund of Shandong Coalffeld Geological Bureau (2022-004), the Natural Scientifific Foundation of Shandong Province (ZR2023MD110), the State Key Laboratory of Palaeobiology and Stratigraphy (Nanjing Institute of Geology and Palaeontology, CAS) (NO. 223122), and the Ningxia Hui Autonomous Region Science and Technology Department (2022CGSF0069ZKT).

Data Availability Statement

Data are contained within the article.

Conflicts of Interest

Author Mingyuan Sun was employed by the company Shandong Provincial GEO-Mineral Engineering Co., Ltd. The remaining authors declare that the research was conducted in the absence of any commercial or financial relationships that could be construed as a potential conflict of interest.

Abbreviations

TermSignificance
DFractal dimension
DTFractal dimension by using Thermodynamics
DSFractal dimension by using the Sierpinski model
D−10–D0The fractal dimension value of the pore structure with a lower pore volume
D0–D10The fractal dimension value of the pore structure with a larger pore volume
D−10–D10The fractal dimension value of the pore structure with a total pore volume

References

  1. Lai, J.; Wang, G.W. Fractal analysis of tight gas sandstones using high-pressure mercury intrusion techniques. J. Nat. Gas Sci. Eng. 2015, 24, 185–196. [Google Scholar] [CrossRef]
  2. Lai, J.; Wang, G.; Wang, Z.; Chen, J.; Pang, X.; Wang, S.; Zhou, Z.; He, Z.; Qin, Z.; Fan, X. A review on pore structure characterization in tight sandstones. Earth-Sci. Rev. 2018, 177, 436–457. [Google Scholar] [CrossRef]
  3. Liu, J.; Zhang, C.; Jiang, Y.; Hou, S. Investigation on pore structure characteristics of ultra-tight sandstone reservoirs in the upper Triassic Xujiahe Formation of the northern Sichuan Basin, China. Mar. Pet. Geol. 2022, 138, 105552. [Google Scholar] [CrossRef]
  4. Jia, A.; Wei, Y.; Guo, Z.; Wang, G.; Meng, D.; Huang, S. Development status and prospect of tight sandstone gas in China. Nat. Gas Ind. 2022, 42, 83–92. (In Chinese) [Google Scholar] [CrossRef]
  5. Yang, Q.; Xue, J.; Li, W.; Du, X.; Ma, Q.; Zhan, K.; Chen, Z. Comprehensive evaluation and interpretation of mercury intrusion porosimetry data of coals based on fractal theory, Tait equation, and matrix compressibility. Fuel 2021, 298, 120823. [Google Scholar] [CrossRef]
  6. Zhang, J.; Qin, Z.; Han, Y.; Wang, H.; Hou, M.; Yan, G.; Feng, G.; Zhang, X.; Yin, T.; Zhang, H.; et al. Pore-fracture distribution heterogeneity of shale reservoirs determined by using HPMI and LPN2 GA tests. Acta Geol. Sin.-Engl. Ed. 2022, 96, 1659–1672. [Google Scholar] [CrossRef]
  7. Liu, H.; Qiao, Y.; He, M.; Shen, R.; Gu, Z.; Cheng, T.; Xiao, Y.; Tang, J. Effect of water saturation on dynamic behavior of sandstone after wetting-drying cycles. Eng. Geol. 2023, 319, 107105. [Google Scholar] [CrossRef]
  8. Lu, Z.; Li, K.; Liu, X.; Zhao, P.; Liu, J. Low-field NMR application in the characterization of CO2 geological storage and utilization related to shale gas reservoirs: A brief review. Front. Earth Sci. 2023, 17, 739–751. [Google Scholar] [CrossRef]
  9. Zhang, J.; Hu, Y. Comparative evaluation of pore structure heterogeneity in low-permeability tight sandstones using different fractal models based on NMR technology: A Case study of Benxi formation in the central Ordos Basin. Energy Fuels 2020, 34, 13924–13942. [Google Scholar]
  10. Zhuo, J.Y.; Liu, W.Y.; Wang, X.Y. Analysis of mineral composition and pore structure of sandstone and mudstone. Heilongjiang Sci. 2022, 13, 22–25. (In Chinese) [Google Scholar]
  11. Huang, D.J.; Li, X.H.; Liu, Y.; Zhang, H. Characteristics of dense sandstone reservoirs in the Benxi Formation in the east-central Ordos Basin and the selection of favorable layer sections. J. Xi’an Univ. Sci. Technol. 2023, 43, 109–118. (In Chinese) [Google Scholar]
  12. Yan, J.-P.; He, X.; Geng, B.; Hu, Q.-H.; Feng, C.-Z.; Kou, X.-P.; Li, X.-W. Nuclear magnetic resonance T 2 spectrum: Multifractal characteristics and pore structure evaluation. Appl. Geophys. 2017, 14, 205–215. [Google Scholar] [CrossRef]
  13. Luo, B.; Tao, R.; Cui, X.; Xin, H.; Dan, W. Fractal characterization of pore-throat structure in dense sandstone reservoirs in the Wuji-Zhidan area of the Ordos Basin, Chang 8 section. Nat. Gas Geosci. 2023, 34, 1305–1315. (In Chinese) [Google Scholar]
  14. Wei, L.; Wang, D.K.; Chen, X.; Shen, J.T.; Gong, J.P.; Yan, X. Fractal characterization of the pore structure of coal. Technol. Innov. Appl. 2023, 13, 53–56. (In Chinese) [Google Scholar]
  15. Zuo, R.; Wang, J. Fractal/multifractal modeling of geochemical data: A review. J. Geochem. Explor. 2016, 164, 33–41. [Google Scholar] [CrossRef]
  16. Sun, Y.F.; Zhao, Y.X.; Yuan, L. Quantifying nano-pore heterogeneity and anisotropy in gas shale by synchrotron radiation nano-CT. Microporous Mesoporous Mater. 2018, 258, 8–16. [Google Scholar] [CrossRef]
  17. Zhao, H.T.; Guo, Y.H.; Du, X.W.; Hu, Y.B.; Kang, R.; Shangguan, J.W. Multiple fractal characterization of micropore space in sandstone reservoirs of Benxi Formation, Gaoqiao area, Ordos Basin. Geol. Sci. Technol. Inf. 2020, 39, 175–184. (In Chinese) [Google Scholar]
  18. Meng, Q.; Qin, Q.; Yang, H.; Zhou, H.; Wu, K.; Wang, L. Fractal Characteristics of the Pore Structure of Coral Powder-Cement Slurry under Different Fractal Models. Fractal Fract. 2022, 6, 145. [Google Scholar] [CrossRef]
  19. Wang, M.; Li, Z.; Liang, Z.; Jiang, Z.; Wu, W. Method Selection for Analyzing the Mesopore Structure of Shale-Using a Combination of Multifractal Theory and Low-Pressure Gas Adsorption. Energies 2023, 16, 2464. [Google Scholar] [CrossRef]
  20. Jiang, P.; Jia, H.M.; Ma, S.Z. Quantitative characterization of multiple fractal features of pore structure in dense sandstone reservoirs. J. Petrochem. Univ. 2018, 31, 69–73. (In Chinese) [Google Scholar]
  21. Tang, W.; Zhang, Y.; Pe-Piper, G.; Piper, D.J.W.; Guo, Z.; Li, W. Soft-sediment deformation structures in alkaline lake deposits of Lower Permian Fengcheng Formation, Junggar Basin, NW China: Implications for syn-sedimentary tectonic activity. Sediment. Geol. 2020, 406, 105719. [Google Scholar] [CrossRef]
  22. Xiao, M.; Wu, S.; Yuan, X.; Xie, Z. Conglomerate Reservoir Pore Evolution Characteristics and Favorable Area Prediction: A Case Study of the Lower Triassic Baikouquan Formation in the Northwest Margin of the Junggar Basin, China. J. Earth Sci. 2021, 32, 998–1010. [Google Scholar] [CrossRef]
  23. Zhi, D.; Liu, M.; Chen, X.; Said, N.; Tang, W.; Hu, C.; Qin, Z.; Zou, H.; Gong, D. Stratigraphic Characteristics and Sediment-Filling Process of the Early Permian Fengcheng Formation in the Northwestern Margin of the Junggar Basin, Northwest China. Front. Earth Sci. 2022, 10, 945563. [Google Scholar] [CrossRef]
  24. Yang, F.; Ning, Z.; Wang, Q.; Zhang, R.; Krooss, B.M. Pore structure characteristics of lower Silurian shales in the southern Sichuan Basin, China: Insights to pore development and gas storage mechanism. Int. J. Coal Geol. 2016, 156, 12–24. [Google Scholar] [CrossRef]
  25. Chen, F.Y.; Zhou, Y.; Yang, D.J.; Wang, H.F. Study on pore structure of tight sandstone reservoirs based on fractal theory: A case study of Chang 7 Member of Yanchang Formation in Qingcheng Area, Ordos Basin. J. China Univ. Min. Technol. 2022, 51, 941–955. (In Chinese) [Google Scholar]
  26. Lai, J.; Wang, G.; Fan, Z.; Chen, J.; Wang, S.; Zhou, Z.; Fan, X. Insight into the Pore Structure of Tight Sandstones Using NMR and HPMI Measurements. Energy Fuels 2016, 30, 10200–10214. [Google Scholar] [CrossRef]
  27. Zhang, F.; Jiang, Z.; Sun, W.; Li, Y.; Zhang, X.; Zhu, L.; Wen, M. A multiscale comprehensive study on pore structure of tight sandstone reservoir realized by nuclear magnetic resonance, high pressure mercury injection and constant-rate mercury injection penetration test. Mar. Pet. Geol. 2019, 109, 208–222. [Google Scholar] [CrossRef]
  28. Wang, Y.J.; Zhao, X.D.; Zhou, B.Y.; Li, Q.; Liu, Z.L.; Li, L.; Li, X.S.; Ji, X.B. Evaluation of pore structure in low-permeability sandstone reservoirs based on high-pressure mercury pressure-constant velocity mercury pressure. Fault Block Oil Gas Field 2022, 29, 824–830. (In Chinese) [Google Scholar]
  29. Zhang, J.J. Study on the pore and fracture structure of middle and high-order coal reservoirs and the pore seepage dynamics of multi-layer combined mining. China Univ. Min. Technol. 2020. (In Chinese) [Google Scholar]
  30. Zhang, M.; Duan, C.; Li, G.; Fu, X.; Zhong, Q.; Liu, H.; Dong, Z. Determinations of the multifractal characteristics of the pore structures of low-, middle-, and high-rank coal using high-pressure mercury injection. J. Pet. Sci. Eng. 2021, 203, 108656. [Google Scholar] [CrossRef]
  31. Zhou, F.; Chen, Z.; Rahman, S. Effect of hydraulic fracture extension into sandstone on coalbed methane production. J. Nat. Gas Sci. Eng. 2015, 22, 459–467. [Google Scholar] [CrossRef]
Figure 1. Stratigraphic column of the study area.
Processes 12 01658 g001
Figure 2. Parametric sub-sample results of high-pressure mercury testing.
Processes 12 01658 g002
Figure 3. SEM Image analysis of thin sections.
Processes 12 01658 g003
Figure 4. Different types of high-pressure mercury pressure curves and pore distribution. (a) High pressure mercury injection curve of type A; (b) Pore size distribution of type A sample; (c) High pressure mercury injection curve of type B; (d) Pore size distribution of type B sample.
Processes 12 01658 g004aProcesses 12 01658 g004b
Figure 5. Comparison of pore structure parameters of different types of samples. (a) The percentage of pore volume between 1000~10,000 in type A and type B samples; (b) The percentage of pore volume between 100~1000 in type A and type B samples; (c) The percentage of pore size less than 100 pore volume in type A and type B samples; (d) The pore volume percentage of total pore volume in type A and type B samples.
Processes 12 01658 g005
Figure 6. Fractal dimension of the M model. (a) Single fractal dimension of type A sample M model; (b) Single fractal dimension of type B sample M model; (c) Single fractal dimension.
Processes 12 01658 g006
Figure 7. Fractal dimension of the S model (log (dv/dp)) is the logarithm of mercury-injected volume per unit pressure; D is fractal dimension, dimensionless. (a) Single fractal dimension of type A sample S model; (b) Single fractal dimension of type B sample S model; (c) Single fractal dimension.
Processes 12 01658 g007
Figure 8. Fractal dimension of the T model. (a) Single fractal dimension of type A sample T model; (b) Single fractal dimension of type B sample T model; (c) Single fractal dimension.
Processes 12 01658 g008
Figure 9. Multifractal dimension of the pores of different types of samples. (a) Multifractal characterization of lg(ɛ) and lg[μ1(q, ɛ)]; (b) Multifractal characterization of pores in type A samples; (c) Multifractal characterization of pores in type B samples.
Processes 12 01658 g009
Figure 10. Comparison of multifractal variations of different lithofacies. (a) Comparison of pore low value distinguishing shape dimension; (b) Comparison of pore high value distinguishing shape dimension; (c) Multiple fractal dimension.
Processes 12 01658 g010
Figure 11. Relationship between fractal dimension values calculated using different fractal models. (a) S model diversion values DS ~ Sponge model dimension values; (b) S model diversion values DS ~ Fractal dimension value of thermodynamic model DT; (c) Fractal dimension of sponge model DM; (d) Relationship between D0–D10 and D–10–D0; (e) Relationship between D–10–D10 and D–10–D0; (f) Relationship between D–10–D10 and D0–D–10.
Processes 12 01658 g011
Figure 12. Relationship between pore volume and single fractal dimension at different stages of the process. (a) Total pore volume percentage; (b) The pore volume percentage is <1000 nm; (c) The pore volume percentage is between 100~1000 nm; (d) The pore volume percentage is >1000 nm.
Processes 12 01658 g012
Figure 13. Relationship between pore volume and multifractal dimension at different stages of the process. (a) Total pore volume percentage; (b) The pore volume percentage is <1000 nm; (c) The pore volume percentage is between 100~1000 nm; (d) The pore volume percentage is >1000 nm.
Processes 12 01658 g013aProcesses 12 01658 g013b
Figure 14. Mercury removal efficiency as a function of single and multiple fractal dimension. (a) Relationship between Mercury removal efficiency and Fractal dimension D; (b) Relationship between Mercury removal efficiency and Multifractal dimension D.
Processes 12 01658 g014
Table 1. Sample base information summary Table.
Sample No.Pore Volume (cm3·g−1)Porosity (%)Permeability (mD)Mercury Removal Efficiency (%)
10.87686513.01.2744.59
21.290822614.15.7851.79
31.276213414.06.5949.04
40.94797312.00.80446.66
50.1650324.50.03821.58
60.999350112.70.72926.63
70.598340410.631.014.08
80.737784212.07.5219.22
91.097611213.413.228.32
100.714582210.02.2722.27
110.16321083.72.7515.68
Disclaimer/Publisher’s Note: The statements, opinions and data contained in all publications are solely those of the individual author(s) and contributor(s) and not of MDPI and/or the editor(s). MDPI and/or the editor(s) disclaim responsibility for any injury to people or property resulting from any ideas, methods, instructions or products referred to in the content.

