Abstract
The absorption heat exchanger with a large temperature difference has a higher heat transfer superiority than the other heat exchangers (including plate heat exchanger), which is more suitable for long-distance heating. To improve its system performance, parameter collaborative optimization (including building accurate predictive models) has become an effective method because it does not require too much investment. In this study, a heat exchange station was chosen as a case study, and a model of a long short-term memory (LSTM) neural network was used to predict the temperatures of primary return water and secondary return water. Accordingly, the reliability of the fitting result based on the model was confirmed through a contrastive analysis with the prediction results of a support vector machine (SVM) model, a random forest (RF) model, and an extreme gradient boosting (XGBoost) model. In addition, the algorithm of particle swarm optimization was used to optimize the flow rate of primary supply water. The results showed that the temperature of primary-side return water decreased from 29.6 °C to 28.2 °C, the temperature of secondary-side return water decreased from 39.8 °C to 38.6 °C, and the flow rate of primary-side supply water decreased from 39 t/h to 35.2 t/h after the optimization of the flow rate of primary supply water. The sensibility assessment emerged that the secondary-side flow rate to the secondary-side supply water temperature was about 7 times more sensitive than the primary-side supply water temperature, and concretely, the lower the temperature, the higher the sensibility. In summary, the accuracy of the proposed prediction model was validated and the optimization direction was pointed out, which can be used to provide guidance for designing and planning absorption heat exchange stations with large temperature differences.
1. Introduction
Up to now, China has basically eliminated coal-fired heating boilers for the purpose of improving the atmospheric environment, and meanwhile, the demand for heating is also rising. To reduce the energy losses caused by the transmission of heat media, long-distance heat supply has become the main feature of heating in north China []. Consensually, the flow rate of heat medium and the temperature difference (between supply water and return water) are two main factors in meeting the increased heating requirements. Among them, increasing the flow rate of the heat medium would add the complexity of pipelines. Hence, improving the temperature difference has become the best choice.
Taking into account the efficiency and quality of energy utilization, reducing the return water temperature is a more feasible choice than increasing the supply water temperature to solve the current bottleneck problem. Therefore, absorption heat exchangers with large temperature differences are gradually becoming the key equipment used by heating enterprises in northern China because of their high heat transmission capacities []. From the optimization of thermodynamic theory, the upper limit of system optimization can be accurately obtained [], particularly for the recycling of low-grade energy []. The absorption heat pump is the main part of an absorption heat exchanger system. The heat exchange scheme involving the heat pump can provide cold water in the temperature range of 20–35 °C, the deep heat exchange of which then occurs with industrial waste gas of more than 100 °C. This process greatly reduces the latent heat loss of industrial waste gas [], and the absorption heat pump can also use other high-temperature thermal mediums as driving heat sources, such as steam, fuel oil, combustible gas, flue gas, etc. Analogously, Feng Li et al. [] proposed a new technology based on an absorption heat pump and a heat exchanger to solve the deep recovery of waste heat (from flue gas). At the same time, heat pump systems can also influence the design of building systems. Jingyu Gao et al. [] commented on the application of multifarious heat pump systems and gradually paid more attention to new energy embedments.
Scholars have engaged in a significant amount of useful exploration on the performance of absorption heat pumps, including air-source heat pump design [] and control strategy research and development [], heat transfer performance of water-source heat pump [] and its cascade parameter influence [], simulation optimization of sludge source heat pump with large temperature difference [], etc. Correspondingly, parameter design [] and economic evaluation [] of heat pump systems are important aspects to be considered, which can provide a basis [] for optimization of internal flow transitivity. Xianwang Fan et al. [] optimized the transfer of mass and energy for the heat pump system, providing a reference for the parameter design of the heat pump system. The application of absorption heat pumps has been considered to be helpful to improve the power adjustment capacity of cogeneration units, which benefit the grid-connected wind power generation with random fluctuations in winter. Wu et al. [] built a model of a cogeneration system containing an absorption heat pump and evaluated the system based on a 300 MW water-cooled steam turbine. Through the simulation based on this model, it was found that the power regulation of the system could range from 148 to 304 MW, the storage efficiency was 60.2%, the electric efficiency was 26.9%, and the total thermal efficiency of the system had a high value of 87.3%. Xie et al. [] built a theoretical model for analyzing the basic performance of an absorption heat pump and called it the temperature lift factor model, which was identified. The temperature parameters of the four main components were established, and the temperature lift factor and coefficient of performance (COP) were used to identify the performance of the absorption heat pump. Seasonal fluctuations are also an important aspect of heat pump system research. Yufan Li et al. [] studied the coupling relationship between solar energy and a ground-source heat pump and explored their matching through a simulation platform. Xueyou Zhang et al. [] evaluated and predicted the performance of a heat pump system by using a variety of machine learning models and verified the reliability of the prediction model.
To sum up, the existing modeling research mainly focuses on the analysis of the efficiency and performance of certain absorption heat pump systems, but has not modeled or optimized the global operating conditions of absorption heat exchange units with large temperature differences. In light of this reason, a prediction model of a long short-term memory (LSTM) neural network is established in this work, which is based on the operation characteristics analysis of an absorption heat exchange unit in the whole heating season. In this model, the return water temperatures of a primary network and a secondary network were predicted, and the operation of the absorption heat exchange unit was optimized. On the basis of the prediction model as a simulation, further exploration of parameter optimization can be more targeted and referential. Further, the sensitivities of engineering parameters were evaluated, which may provide guidance and reference for the application of related heat pump technology.
2. Absorption Heat Exchanger System
2.1. Operating Parameters
The energy transfer diagram of the station before and after the transformation is shown in Figure 1. Before the transformation, the heat station used the conventional plate heat exchanger, and the heat transfer temperature difference was large. According to the second law of thermodynamics, heat can spontaneously transfer from a high temperature to a low temperature, a process in which exergy goes down in entropy, and the greater the temperature difference of heat exchange, the greater the irreversible loss []. Therefore, the common heat exchange station has a large irreversible loss, resulting in a large amount of usable energy waste.
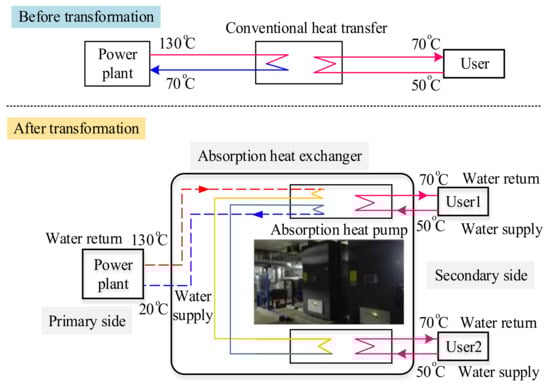
Figure 1.
Diagram of heat exchange process of absorption heat exchange station.
There are many kinds of absorption heat exchange systems. Figure 1 demonstrates a schematic diagram of the heat exchange process in an absorption heat exchange station with a large temperature difference, as well as a picture of the absorption heat exchange unit at the operation site. The basic principle is that the absorption heat exchange system is installed at a heat exchange station and a large temperature difference between the primary heating network and the secondary heating network is utilized to drive a heating-only absorption heat pump (HOAHP), significantly reducing the return water temperature in the primary heating network without changing the supply water temperature or return water temperature. The advantage of absorption heat exchange lies in the cascade utilization of the heat from the water in the primary network, and the heat exchange process is split into two parts. The specific process is that the high-temperature water in the primary network can firstly serve as the driving heat source of the absorption heat pump, and then the lower-temperature water continues to serve as the low-temperature heat source of the heat exchanger. Finally, the return water generated after full heat exchange is returned to the thermal power plant system, and the energy waste in the heat exchange of the primary network can be effectively reduced. In addition, the final temperature of the return water in the primary network can be much lower than the temperature of the return water in the secondary network, which can significantly increase the temperature difference between the supply water and return water of the primary pipe network []. Through this program, the heat exchange capacity of the heat exchange station can be significantly increased to meet the demand for a larger heat load with the constant water flow of the primary side. Delightedly, it has been confirmed that reducing the return water temperature of the primary pipe network can utilize the waste heat from the turbine exhaust steam for heating, which can increase the heating capacity by more than 30% []. The operating parameters of an absorption heat exchange station with a large temperature difference are shown in Table 1. The water supply temperature, return water temperature, and flow rate of the primary and secondary heat exchange stations are listed. In this station, the heating parameters on the primary side and secondary side were both stable, and the return water temperature of the primary side was less than 30 °C.

Table 1.
Operating parameters of absorption heat exchange station with large temperature difference.
2.2. Operating Characteristics
The change trends of several parameters, such as the flow rates and the temperatures of supply water and return water on the primary side and secondary side, were monitored, which was based on the operation data of an entire heating season. Compared to the flow rate of the primary side, the flow rate of the secondary side had less variation. Figure 2a shows that the flow rate (Qpwf) of the primary heat supply network was not exactly consistent with that (Qswf) of the secondary heat supply network. The flow rate of the secondary side changed in the range of 200~299 t/h and was mainly distributed in the range of 240~299 t/h. However, the change in the water flow rate (Qpwf) on the primary side showed an inverted U-shaped change trend in the range of 20~60 t/h.
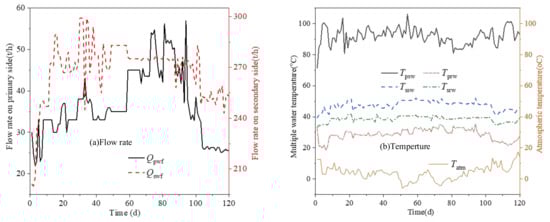
Figure 2.
Variations in key parameters for an absorption heat exchange unit with large temperature difference in a single heating season. (a) Variations in water flow rate and (b) variations of supply water temperature and return water temperature on the primary side and the secondary side.
As shown in Figure 2b, the change in atmospheric temperature (Tatm) showed a U-shaped change trend in the range of −10~20 °C. In the same temperature environment, flow data of different values were obtained, which was attributed to the fact that the heat exchange affecting the building envelope was not only related to the atmospheric temperature, but also had a greater relationship with the wind speed. The fluctuations in supply water temperature (Tpsw) and return water temperature (Tprw) on the primary side, as well as the fluctuations in supply water temperature (Tssw) and return water temperature (Tsrw) on the secondary side, were relatively stable, indicating that the absorption heat exchanger with large temperature difference can adapt well to an operation with variable working conditions.
3. Modelling
The modeling steps in this study are as follows: Firstly, a model is constructed according to the existing operational data, and the constructed model can accurately predict the energy transfer process of the system. On this basis, the model of the system design is further optimized, and the sensitivity of its parameters is analyzed.
3.1. Prediction Model
The return water temperatures in the primary network and the secondary network are the important parameters for establishing a thermodynamic system. Thus, a model of a long short-term memory (LSTM) neural network based on operation historical data was built to accurately predict the temperatures of primary return water and secondary return water, which can provide the guidance for operation optimization.
As a typical forecasting model, the long short-term memory neural network (LSTM) has good performance, and it can ensure continuous optimization of network parameters []. The model is developed from the standard recurrent neural networks []. Compared with a vanishing gradient and difficulty in continuously optimizing network parameters, which easily occur in the process of back-propagation by using the recurrent neural network model, the LSTM model can effectively solve the vanishing gradient problem by selecting the value of the forget gate as between zero and one. And meanwhile, it adds a gate cell to control the impact of instant information on historical information, which enables the network model to save and transfer information for a long time.
Generally, an LSTM model cell can be regarded as a memory cell for long-term storage of information, which is protected by forget gate, input gate, and output gate. Thus, it can realize the updating and utilization of effective information. Figure 3 shows the cell structure, where the calculation methods of three activation gates are given by Equations (1)–(3).
where xt is the sequence input of time t; ht-1 denotes the output of the LSTM cell at the moment t − 1; Wxf, Wxi, and Wxo represent the weight matrices of the forget gate, input gate, and output gate to the input of time series, respectively; Whf, Whi, and Who are, respectively, weighted matrices of the forget gate, input gate, and output gate to the output at the time t − 1. bf, bi, and bo denote bias terms of the forget gate, input gate, and output gate, respectively. ft, it, and ot represent the states of the forget gate, input gate, and output gate, respectively. gf, gi, and go are the input information for the activation functions of forget gate, input gate, and output gate, respectively. σ represents the sigmoid activation function.
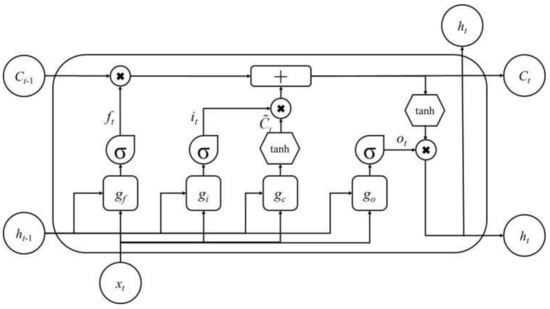
Figure 3.
LSTM cell structure diagram.
The design parameters in Figure 1 are the starting parameters of the prediction model. The training process of this model is based on the data in Figure 2. The temperature of each equipment unit is taken as the input variable, and the flow rate is taken as the output result. The mathematical correlation between parameters is constructed, and the highest model accuracy is taken as the optimal solution for analysis.
The calculation of the output ht of the LSTM cell can be performed as follows:
where is the temporary state input at time t, Ct is the current cell state, tanh( ) represents the tanh activation function, and ht denotes the output of the current cell.
The structure of the LSTM is equivalent to adding a cell state C to each cell of a recurrent neural network (RNN) so that the output of the previous moment is transmitted. Thus, all the information of each previous moment is filtered and transmitted, and the output of the next moment can take into account the information of the current moment []. The expansion plot of the LSTM network model over time is shown in Figure 4.
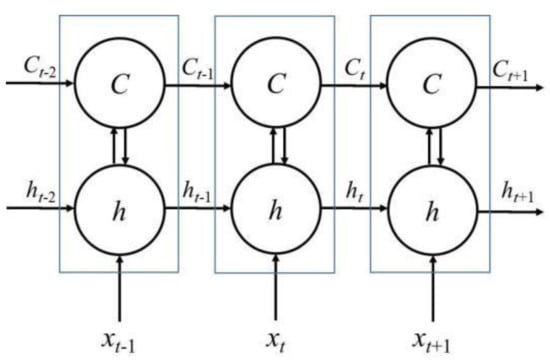
Figure 4.
Expansion plot of the LSTM network model.
3.2. Model Optimization
Regulating the supply water flow on the primary side of the pipe network was the main regulation mode for the heat exchange system. Therefore, the particle swarm optimization (PSO) algorithm was selected to optimize the supply water flow on the primary side for the purpose of further improving the operational economy and safety. The algorithm for the optimal solution to the practical problem was originally designed to graphically simulate the unpredictable movements of birds []. Specifically, the algorithm initializes random particles (potential optimal solution) in the search space and seeks the optimal solution through random particle iteration. Characteristic parameters include position, velocity, and fitness value. After each iteration, the corresponding fitness value is updated, comparing it to the individual extreme and global extreme, respectively, and the velocities and positions of the particles can thus be updated. The specific implementation steps of this algorithm have been described in literatures [,].
For a variety of equipment parameters involved in this study, the research method randomly sets the value of each parameter within a reasonable range and further improves the optimization process by recording the comparative optimization process. In the process of optimizing the supply water flow on the primary side, the optimization objective needs to be set. In this work, the highest secondary supply water temperature and the lowest primary supply water temperature were taken as optimization objectives. When multiple objectives are optimized simultaneously, the optimization objectives often contradict each other; in other words, when one objective reaches the optimal value, the other objective may not reach the optimal value. In this case, the multi-objective optimization problem can be transformed into a single objective optimization problem according to the importance of the optimization objectives provided by the decision maker. Its mathematical description can be written as:
where f1(x), f2(x), and fm(x) are the objective functions to be optimized and ω1, ω2, and ωm denote the objective function weights.
3.3. Evaluation Criteria
By analyzing the data of the secondary side, the actual area heat index q of the secondary side is calculated, as shown in Formula (8).
where: is the secondary water supply temperature, is the secondary return water temperature, and is the measured flow of the secondary flowmeter. A is the heating area of the heat station.
The building, training, and testing of the model in this study were all based on the Keras framework under a Tensorflow environment. And the return water temperature of the primary side and the return water temperature of the secondary side were set as model outputs. Multivariate input was taken using the LSTM model because of its good time series prediction characteristics. Some key parameters, which include the time series of primary return water temperature and secondary return water temperature, the ambient air temperature, the primary supply water temperature, the primary flow rate, the secondary supply water temperature, and the secondary flow rate, were taken as input variables. It should be pointed out that the above parameter data are from the previous three days as input.
A total of 235 groups of the above operating parameters were collected for two consecutive heating seasons, of which the first 80% were used as the training set and the last 20% were used as the testing set.
Due to the different value ranges of input parameters and output parameters for the prediction model and the large value span of some parameters, the prediction accuracy would be reduced. In order to ensure the prediction accuracy, each parameter should be normalized before the model construction, and the values were normalized to the interval [0, 1]. The normalization is described in Formula (9).
where x is the normalized value of certain variable, X represents the original value of the variable, Xmin denotes the smallest value of the variable, and Xmax is the maximum value of the variable.
In this study, the root mean square error (RMSE), mean absolute error (MAE), and mean absolute percentage error (MAPE) were taken as evaluating indices to evaluate the performance of proposed model. The calculation formulas of three evaluating indices are shown as follows:
The sensitivity assessment was carried out to illustrate the reliability of the optimization model proposed in this work and its universality in multiple cases. The change in the supply water flow rate of the primary side was obtained after the model optimization by setting the supply water temperature range of the primary side and the supply water temperature range of the secondary side. The sensitivity analysis added into this paper was intended to further obtain the correlation between parameter variables through mathematical methods. However, due to the limitation of many factors in the actual modeling process, the result will not be completely linear. Through this sensitivity analysis, we can further understand the degree of influence of multiple factors in the model.
4. Results and Discussion
4.1. Scheme Contrast
The actual thermal index calculation results of the secondary side of the large temperature difference heat exchange station and the ordinary heat exchange station are shown in Figure 5. The actual thermal index q of the secondary side of the two thermal stations decreased with the increase in temperature. Among them, the actual heat index of the ordinary heat exchange station was basically below 30 W/m2, which is less than the theoretical heat index, so the heating effect was poor. The actual heat index of the large-temperature-difference heat exchange station was significantly improved compared with the ordinary heat exchange station, and it nearly doubled under some temperatures, basically reaching the theoretical heat index and effectively improving the heating effect of the user side.
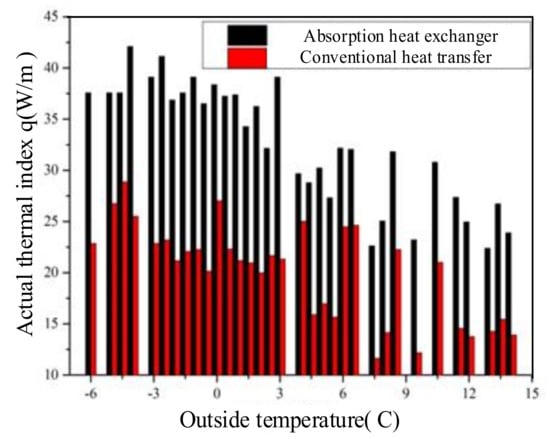
Figure 5.
Actual thermal index of secondary side of heat exchange station under different outdoor temperatures.
4.2. Performance Indices of Predictive Model
When the LSTM model was used for prediction, the parameters related to the model were set as follows: The LSTM cell contained fifty nodes. Mean absolute error (MAE) was selected as the loss function, and adaptive moment estimation was selected as the optimizer. To verify the accuracy of this model, the support vector machine (SVM) model, the random forest (RF) model, and the extreme gradient boosting (XGBoost) model were contrasted. The predicted performance indices of these models are shown in Table 2.
Table 2.
Predicted performance indices of four models.
As listed in Table 2, compared to the performance indices of predictions for the return water temperature of the primary side and the secondary side based on the SVM model, RF model, and XGboost model, the LSTM model improved the accuracy of the model obviously. The basic reason should be derived from the model characteristics. Compared with the SVM model, RF model, and Xgboost model, the LSTM model adopted a multivariable input, which not only considered the effects of atmospheric temperature, supply water temperature of the primary side, water flow rate of the primary side and the correlation of operating parameters, but also took the temporal change as a model input and made the output comprehensively reflect the effects of these factors. Finally, it distinctly improved the prediction performance on the return water temperatures of the primary side and the secondary side. Therefore, the LSTM model had a better fitting and generalization capability than the other models. In addition, the higher performance of the SVM model, compared with other two validation models, was attributed to the adoption of splitting plane spacing. Thus, it avoided the dependence on data scale and data distribution based on the empirical risk minimization principle, and had obvious advantages in handling small sample data. It should be noted that the best prediction model obtained in this study was based on the variable memory length. Compared with other prediction models, it achieved a better prediction effect by increasing variables. This method has no particular advantage if the influence of parameters is relatively uniform within a certain interval.
4.3. Analysis of Prediction Results
Three performance indices of the prediction by the LSTM model were relatively small (as shown in Table 2), indicating that the LSTM prediction model had better accuracy. Comparing the prediction performance indices of primary return water temperature and secondary return water temperature, it can be found that the prediction performance index of the secondary side was better than that of the primary side. In particular, the MAPE value for predicting the return water temperature of the secondary side was 1.85%, which was significantly less than the 2.89% of the primary side. The differences between the primary side and secondary side for the RMSE value and MAE value were both relatively small.
Figure 6a,b, respectively, show the predicted values of primary return water temperature (Tprw) and secondary return water temperature (Tsrw). The prediction results of primary return water temperature and secondary return water temperature both agreed well with the actual data. However, large differences appeared in individual samples, and these differences were reflected in the predicted data of primary return water temperature and secondary return water temperature. Due to the correlation between the primary return water temperature and secondary return water temperature, it was shown that the model had good reliability.
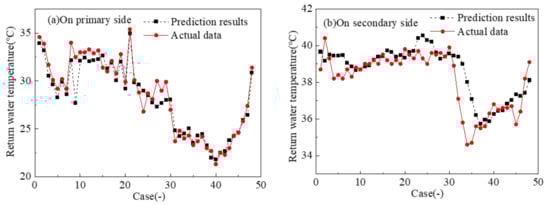
Figure 6.
LSTM predicted value of primary (a) and secondary (b) return water temperature and actual temperature change.
Comparing Figure 6a with Figure 6b, the return water temperature of the primary side was larger than that of secondary side. The reason is that the return water parameters of the primary side were affected by the heat source, while the return water parameters of the secondary side were affected by the heat consumers. The heat source fluctuated greatly with the heating demand change, which caused the primary return water temperature to change obviously. And the enclosure structure of the heat consumer side had thermal inertia, which caused the return water temperature of the secondary side to have a smaller fluctuation. In addition, considering the limited number of samples, with the increase in sample data, the prediction performance indices will decrease and tend to be similar between primary return water temperature and secondary return water temperature, and the prediction based on the LSTM model for an absorption heat exchange unit with a large temperature difference will have higher accuracy.
4.4. Analysis of Optimization Results
The flow rate of primary supply water was optimized, taking the minimum primary return water temperature and the minimum secondary return water temperature as the objective functions. The sampled data were all the input operating parameters mentioned in Section 3.3. According to the LSTM prediction model based on the obtained input variables and the objective functions, the PSO algorithm was utilized as an optimization pathway.
Sampled data under different operating conditions were randomly selected to optimize the target variables, which included the supply water temperatures of the first side and second side. In the input data, the primary water flow rate and secondary water flow rate were the decision variables, and the other input variables were set as fixed values. First, an accurate predictive model of target variables was built according to the LSTM model. Secondly, the multi-objective optimization method was used to obtain the constraint conditions of the optimized target variables and decision variables. Finally, the PSO algorithm was used to realize the optimization of the decision variables. The original data of certain operating conditions were compared with the optimized results, as listed in Table 3.
Table 3.
Comparison of original data of certain operating condition with optimized results.
Table 3 shows that both the primary return water temperature and the secondary return water temperature decreased to a certain extent after optimization. The return water temperature of the primary side decreased from 29.6 °C to 28.2 °C, while the return water temperature of the secondary side decreased from 39.8 °C to 38.6 °C, which verified that the heat utilization efficiency of the heating station system can be improved. At the same time, the water flow rate of the primary side was reduced from 39 t/h to 35.2 t/h. This indicates that the adjustment of the water flow rate of primary side could reduce the primary return water temperature and the secondary return water temperature according to the optimization results of the decision variable. The optimization results provided a reference for adjusting the water flow rate of the primary side and the optimal operation of the heat exchange station system.
4.5. Sensitivity Assessment
In order to further verify the reliability of the optimization model and the practicality for the varying operating conditions, sensitivity assessments of the water flow rate (Qswf) of the secondary side to the supply water temperature (Tpsw) of the primary side or the supply water temperature (Tssw) of the secondary side were carried out. The sensitivity assessment results are illustrated in Figure 7.
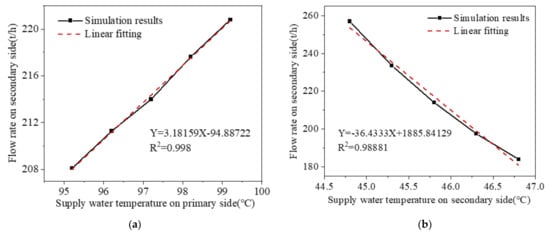
Figure 7.
(a) Variation in water flow rate of secondary side with supply water temperature of primary side. (b) Variation in water flow rate of secondary side with supply water temperature of secondary side.
The operating parameters in Table 3 were selected as a group of contrasting data, and the single-variable method was used to optimize the working conditions. Either the supply water temperature of the primary side changed in the range of 95.2~99.2 °C or the supply water temperature of the secondary side changed in the range of 44.8~46.8 °C.
As shown in Figure 7a, the relationship between the water flow rate (Qswf) of the secondary side and the supply water temperature (Tpsw) of the primary side was close to linear, and for every 1 °C increase in the Tpsw value in the temperature range of 95.2~99.2 °C, the Qswf value increased by about 3.18 t/h. The linear fitting degree of the relationship between the water flow rate (Qswf) of the secondary side and the supply water temperature (Tssw) of the secondary side was lower. In the temperature range of 44.8~46.8 °C, for every 1 °C increase in the Tssw value, the Qswf value decreased by about 36.43 t/h, and its variation amplitude was more than eleven times the variation amplitude with a varying Tpsw value. Furthermore, the lower the supply water temperature (Tssw) of the secondary side, the larger variation in the Qswf value changed with varying Tssw value.
4.6. Large Temperature Difference Heat Exchange Station Running Vacuum
To ensure its normal operation, the vacuum guarantee degree of the unit is particularly critical, and directly affects the operation performance of the unit. In the general requirements of steam and hot-water-type lithium bromide absorption chillers, the air tightness of the absorption unit is required: the leakage rate of the whole unit should not be greater than 2.03 × 10⁻⁶ Pa*m3/s. The vacuum leakage rate of the modular absorption heat exchange units used in the transformation of the terminal thermal station is ensured by a helium test before leaving the factory. At the beginning of heating, the unit completes the preparation work, such as vacuuming. In order to discharge the non-condensible gas generated in the operation during the heating season, to ensure that the operating pressure of the unit evaporator is 3.5~5 KPa, the unit is equipped with a vacuum pump and a gas storage device. The unit automatically detects the pressure in the collecting box to control the start and stop of the vacuum pump. When the pressure in the collecting box reaches a certain value, the vacuum pump starts to vacuum and stops when it is lower than a certain value.
In order to explain the dust removal cycle of the heat exchanger with a large temperature difference, dust removal monitoring was carried out during the period of 15 November to 15 March of the next year for a specific engineering application equipment. The vacuum statistics of the modular-absorption, large-temperature-difference heat exchange unit in the whole heating season are shown in Table 4. Since the unit started to vacuum, it has been running for nearly 97 days. At the end of the operation, the non-condensing gas increased, and the vacuum pump started to discharge the non-condensing gas, ensuring normal operation for nearly 23 days in the later period. From the point of view of the start-up times of the vacuum pump, the multi-stage, parallel, modular-absorption, large-temperature-difference heat exchange unit runs well in the whole heating season, and there are no problems such as downtime.
Table 4.
Statistics on the number of vacuuming cycles of large-temperature-difference heat exchangers.
5. Conclusions
In this study, the prediction model and parameter optimization were investigated on the basis of the engineering data of an absorption heat exchanger with a large temperature difference. A model predicting the temperatures of primary return water and secondary return water was built based on a long short-term memory (LSTM) neural network. Then, the particle swarm optimization algorithm was used to optimize the supply water flow on the primary side. The main conclusions are summarized as follows.
- (1)
- Compared to the performance indices of predictions for the return water temperatures of the primary side and secondary side based on the SVM model, RF model, and XGboost model, the values of three performance indices evaluated for the LSTM model were the smallest, and the LSTM model had a better fitting and generalization capability than the other models, indicating that the LSTM model could accurately simulate the operating conditions of an absorption heat exchange unit.
- (2)
- After the optimization, the return water temperature of the primary side decreased from 29.6 °C to 28.2 °C, while the return water temperature of the secondary side decreased from 39.8 °C to 38.6 °C, and the water flow rate of primary side was reduced from 39 t/h to 35.2 t/h.
- (3)
- The relationship between the water flow rate of secondary side and the supply water temperature of the primary side was close to linear, and for every 1 °C increase in the latter, the former increased by about 3.18 t/h. The linear fitting degree of the relationship between the water flow rate of the secondary side and the supply water temperature of the secondary side was a little lower; for every 1 °C increase in the latter, the former decreased by about 36.43 t/h, and the variation amplitude was much larger.
Author Contributions
Resources, J.W.; Data curation, J.C.; Writing—original draft, J.C.; Writing—review & editing, J.W., H.J., X.Y., X.Z. and M.Y.; Visualization, J.C. All authors have read and agreed to the published version of the manuscript.
Funding
This research was funded by Research Project of Science and Technology Department of Henan Province (242102240093), Key Scientific Research Project of Education Department of Henan Province (24B480015), and Research Project of Zhengzhou Electric Power College (ZEPCKY2021-14;ZEPCKY2024-3). Supported by: Youth Fund of Natural Science Foundation of Hebei Province (E2020502007); General Project Funding of Central University Fund Project (2020MS103).
Data Availability Statement
Data is contained within the article.
Conflicts of Interest
The authors declare no conflict of interest.
Abbreviation
| LSTM | Long short-term memory; |
| SVM | Support vector machine; |
| RF | Random forest; |
| XGBoost | Extreme gradient boosting; |
| COP | Coefficient of performance; |
| RNN | Recurrent neural network; |
| PSO | Particle swarm optimization; |
| RMSE | Root mean square error; |
| MAE | Mean absolute error; |
| MAPE | Mean absolute percentage error; |
| Qpwf | Flow rate of primary heat supply network; |
| Qswf | Flow rate of secondary heat supply network; |
| Tatm | Atmospheric temperature; |
| Tprw | Return water temperature on primary side; |
| Tpsw | Supply water temperature on primary side; |
| Tssw | Supply water temperature on secondary side; |
| Tsrw | Return water temperature on secondary side. |
References
- Wang, Y.; Wang, X.; Zheng, L.; Gao, X.; Wang, Z.; You, S.; Zhang, H.; Wei, S. Thermo-hydraulic coupled analysis of long-distance district heating systems based on a fully-dynamic model. Appl. Therm. Eng. 2023, 222, 119912. [Google Scholar] [CrossRef]
- Li, Y.; Wang, L.; Xu, K.; Zhang, S.; Zheng, H.; Dong, X. Optimization study of a novel district heating system based on large temperature-difference heat exchange. Energy Convers. Manag. 2022, 258, 115517. [Google Scholar] [CrossRef]
- Cao, F.; Wang, Y.; Ye, Z. Theoretical analysis of internal heat exchanger in transcritical CO2 heat pump systems and its experimental verification. Int. J. Refrig. 2019, 106, 506–516. [Google Scholar] [CrossRef]
- Ramadan, M.; Murr, R.; Khaled, M.; Olabi, A.G. Mixed numerical—Experimental approach to enhance the heat pump performance by drain water heat recovery. Energy 2018, 149, 1010–1021. [Google Scholar] [CrossRef]
- Wang, J.; Hua, J.; Fu, L.; Wang, Z.; Zhang, S. A theoretical fundamental investigation on boilers equipped with vapor-pump system for Flue-Gas Heat and Moisture Recovery. Energy 2019, 171, 956–970. [Google Scholar] [CrossRef]
- Li, F.; Duanmu, L.; Fu, L.; Zhao, X. Application of absorption heat pump and direct-contact total heat exchanger to advanced-recovery flue-gas waste heat for gas boiler. Sci. Technol. Built Environ. 2019, 25, 149–155. [Google Scholar] [CrossRef]
- Cao, J.; Zheng, L.; Peng, J.; Wang, W.; Leung, M.K.; Zheng, Z.; Hu, M.; Wang, Q.; Cai, J.; Pei, G.; et al. Advances in coupled use of renewable energy sources for performance enhancement of vapour compression heat pump: A systematic review of applications to buildings. Appl. Energy 2023, 332, 120571. [Google Scholar] [CrossRef]
- Song, M.; Deng, S.; Dang, C.; Mao, N.; Wang, Z. Review on improvement for air source heat pump units during frosting and Defrosting. Appl. Energy 2018, 211, 1150–1170. [Google Scholar] [CrossRef]
- Qu, M.; Fan, Y.; Chen, J.; Li, T.; Li, Z.; Li, H. Experimental study of a control strategy for a cascade air source heat pump water heater. Appl. Therm. Eng. 2017, 110, 835–843. [Google Scholar] [CrossRef]
- Mao, N.; Hao, J.; He, T.; Xu, Y.; Song, M.; Tang, J. Unsteady heat transfer properties of spray falling over a horizontal tube in an oily sewage source heat pump. Appl. Therm. Eng. 2020, 179, 115675. [Google Scholar] [CrossRef]
- Ma, L.; Ren, T.; Zhang, T.; Zhao, T.; Zhang, J. Experimental study on effect of operating parameters on performance of serially cascaded wastewater source heat pump. J. Build. Eng. 2020, 32, 101458. [Google Scholar] [CrossRef]
- Ma, L.; Zhen, X.; Zhang, J. The Performance Simulation Analysis of the Sewage-source Heat Pump Heater Unit Dealing with Large Temperature Difference. Procedia Eng. 2017, 205, 1769–1776. [Google Scholar] [CrossRef]
- Wang, W.; Li, Y.; Cao, F. Extremum seeking control for efficient operation of an air-source heat pump water heater with internal heat exchanger cycle vapor injection. Int. J. Refrig. 2019, 99, 153–165. [Google Scholar] [CrossRef]
- Dai, B.; Qi, H.; Liu, S.; Ma, M.; Zhong, Z.; Li, H.; Sun, Z. Evaluation of transcritical CO2 heat pump system integrated with mechanical subcooling by utilizing energy, exergy and economic methodologies for residential heating. Energy Convers. Manag. 2019, 192, 202–220. [Google Scholar] [CrossRef]
- Amir, F.M.; Yusoff, M.Z.; Abu Hassan, S.H. Fluid film characteristics over horizontal multi-faceted tube and the augmentation of thermal performance. Appl. Therm. Eng. 2022, 201, 117795. [Google Scholar] [CrossRef]
- Fan, X.; Pu, J.; Wu, Z.; Wang, Y.; You, S.; Zhang, H.; Liu, J.; Jiang, Y.; Liu, S.; Wan, Z. Thermodynamic performance and heat and mass transfer analysis of air source absorption heat pump for heating. J. Build. Eng. 2023, 76, 107390. [Google Scholar] [CrossRef]
- Wu, Y.; Fu, L.; Zhang, S.; Tang, D. Study on a novel co-operated heat and power system for improving energy efficiency and flexibility of cogeneration plants. Appl. Therm. Eng. 2019, 163, 114429. [Google Scholar] [CrossRef]
- Xie, X.; Yi, Y.; Zhang, H.; Jiang, Y. Theoretical model of absorption heat pump from ideal solution to real solution: Temperature lift factor model. Energy Convers. Manag. 2022, 271, 116328. [Google Scholar] [CrossRef]
- Li, Y.; Bi, Y.; Lin, Y.; Wang, H.; Sun, R. Analysis of the soil heat balance of a solar-ground source absorption heat pump with the soil-based energy storage in the transition season. Energy 2023, 264, 126394. [Google Scholar] [CrossRef]
- Zhang, X.; Wang, E.; Liu, L.; Qi, C. Machine learning-based performance prediction for ground source heat pump systems. Geothermics 2022, 105, 102509. [Google Scholar] [CrossRef]
- Song, Z. Reexamining CO generation from the Perspective of Sustainable Development. Proc. CSEE 1998, 18, 225–230. [Google Scholar]
- Sun, F.; Zhao, X.; Chen, X.; Fu, L.; Liu, L. New configurations of district heating system based on natural gas and deep geothermal energy for higher energy efficiency in northern China. Appl. Therm. Eng. 2019, 151, 439–450. [Google Scholar] [CrossRef]
- Fu, L.; Li, Y.; Wu, Y.; Wang, X.; Jiang, Y. Low carbon district heating in China in 2025- a district heating mode with low grade waste heat as heat source. Energy 2021, 230, 120765. [Google Scholar] [CrossRef]
- Yu, Y.; Si, X.; Hu, C.; Zhang, J. A Review of Recurrent Neural Networks: LSTM Cells and Network Architectures. Neural Comput. 2019, 31, 1235–1270. [Google Scholar] [CrossRef] [PubMed]
- Sherstinsky, A. Fundamentals of Recurrent Neural Network (RNN) and Long Short-Term Memory (LSTM) Network. Phys. D Nonlinear Phenom. 2020, 404, 132306. [Google Scholar] [CrossRef]
- Nasouri, M.; Bidhendi, G.N.; Hoveidi, H.; Amiri, M.J. Parametric study and performance-based multi-criteria optimization of the indirect-expansion solar-assisted heat pump through the integration of Analytic Network process (ANP) decision-making with MOPSO algorithm. Sol. Energy 2021, 225, 814–830. [Google Scholar] [CrossRef]
- Qian, J.; Sun, X.; Zhong, X.; Zeng, J.; Xu, F.; Zhou, T.; Shi, K.; Li, Q. Multi-objective optimization design of the wind-to-heat system blades based on the Particle Swarm Optimization algorithm. Appl. Energy 2024, 355, 122186. [Google Scholar] [CrossRef]
- Wang, W.; Wu, L.; Zhang, H.; Li, J. Optimal Dispatch of Water Source Heat Pump Regional Energy Systems Based on Neighborhood Adaptive Particle Swarm Optimization. Energy Technol. 2022, 10, 2200049. [Google Scholar] [CrossRef]
- Wang, Z.; Chen, H.; Sun, X.; Lu, H.; Wang, T. Optimizing the solar-air hybrid source heat pump heating system based on the particle swarm algorithm. Energy Rep. 2022, 8, 379–393. [Google Scholar] [CrossRef]
Disclaimer/Publisher’s Note: The statements, opinions and data contained in all publications are solely those of the individual author(s) and contributor(s) and not of MDPI and/or the editor(s). MDPI and/or the editor(s) disclaim responsibility for any injury to people or property resulting from any ideas, methods, instructions or products referred to in the content. |
© 2024 by the authors. Licensee MDPI, Basel, Switzerland. This article is an open access article distributed under the terms and conditions of the Creative Commons Attribution (CC BY) license (https://creativecommons.org/licenses/by/4.0/).