Article

Hydrothermal Carbonization of Residual Biomass from Agricultural and Agro-Industrial Sector

Department of Agricultural, Food and Environmental Sciences, Marche Polytechnic University, Via Brecce Bianche, 60131 Ancona, Italy
*
Authors to whom correspondence should be addressed.
Processes 2024, 12(8), 1673; https://doi.org/10.3390/pr12081673 (registering DOI)
Submission received: 22 July 2024 / Revised: 2 August 2024 / Accepted: 7 August 2024 / Published: 9 August 2024
(This article belongs to the Special Issue Integrated Process Design and Development of Biorefinery)

Abstract

:
Hydrothermal carbonization (HTC) is a promising method for the conversion of agricultural and agro-industrial residues into valuable products. HTC processes biomass through chemical reactions that produce hydrochar, a carbon-rich solid similar to lignite. Unlike other thermochemical processes, HTC can handle high-moisture biomass without pre-drying. This article evaluates the efficiency of HTC on wood chips, wheat straw, and grape pomace, examining their chemical and structural characteristics and critical operational parameters such as the temperature, pressure, biomass/water ratio, and reaction time. The obtained results highlight that the two key process parameters are the temperature and the ratio between the solid biomass and liquid phase. Increasing the first parameter increases the energy content by 20% and increases the carbon concentration by up to 50%, while reducing the oxygen content by 30% in the hydrochar. Varying the second parameter leads to the alternating reduction of the ash content but simultaneously reduces the energy content. The reaction time seems to have a limited influence on the quality parameters of the biochar produced. Lastly, HTC appears to successfully enhance the overall quality of widely available agricultural wastes, such as grape pomace.

Graphical Abstract

1. Introduction

Given the increasing concern for climate change and environmental sustainability, the search for alternative energies and waste valorization processes has become a priority, including in the agricultural sector. Biomass, as abundant and renewable energy source, can offer the possibility of reducing the net greenhouse gas emissions by substituting fossil fuels [1,2]. In Italy, the abundance of forests and agricultural land provides an important source of biomass. According to the latest census conducted by the Italian National Institute of Statistics, over 83 thousand hectares were found to be covered by forested land for timber production, along with an astonishing 12 million hectares devoted to agriculture [3]. Specifically, in Italy, during 2023, two of the most prevalent crops were winter cereals (wheat and barley) and grapevines for wine production, occupying a total of 2.16 million and 691 thousand hectares, respectively [4]. Furthermore, between 2015 and 2023, Italy was one of the few European countries to witness an expansion in the hectares devoted to vine cultivation, with an increase of 57.5%. Similarly, the surface area devoted to winter grains expanded by 1.44% when compared to 2015 [4,5]. Maize and wheat are the main grown cereals, accounting together for 78.6% of the total harvested area and 80.9% of the total cereal production. Maize and common wheat are cultivated mainly in Northern Italy (Po Valley), while durum wheat is more widespread in Southern Italy and the islands (65.6%) [6].
The aforementioned information suggests the significant abundance of residual biomass generated by forest and agricultural management. Among the three systems discussed (forestry, agricultural cereals, and viticulture), the main products and waste materials are wood chips, straw, and pomace. Specifically, approximately 20–30% of the production per hectare in vineyards constitutes grape pomace, which is the residue from grape processing [7]. Indeed, the agricultural sector is moving towards the valorization of agro-forestry residues, with particular attention being paid to viticultural residues [8,9]. Despite their potential abundance, agricultural, agro-industrial, and forestry residues are scattered across the national territory and often present qualitative characteristics that discourage their use, such as high moisture content and ash content and a low bulk density [10,11]. Moreover, the non-optimal quality of the residues leads to higher CO production during combustion, which can pose significant hurdles to effectively harnessing energy from waste biomass [12]. Several studies propose different technologies to enhance the quality of waste biomass, such as the blending of grape pomace with wood [13].
Hydrothermal carbonization (HTC) is a promising technology for the conversion of residual biomass from the agricultural and agro-industrial sectors into biofuels. During HTC, biomass, such as hardwood and softwood chips and other lignocellulosic residues, is subjected to a series of chemical reactions, such as hydrolysis, dehydration, decarboxylation, and polymerization, resulting in a solid product called hydrochar, which has high carbon content and a physical and chemical structure similar to lignite or coal [14,15]. Furthermore, HTC leads to the removal of alkali and alkaline metals from lignocellulosic biomass [16]. Thus, the HTC process is suitable for woody biomass with high moisture content as it can be processed without pre-drying, unlike other thermochemical processes, such as pyrolysis, gasification, and combustion [14,17,18]. HTC has long been widely used for the energy enhancement of various types of crop waste [19]. This article aims to assess the efficiency of HTC applied to less frequently energy-valorized residues from the agricultural and agro-industrial sectors, such as grape pomace, highly abundant in European countries [20]. Thus, the chemical and physical characteristics influencing the HTC process of two residual biomass types (wheat straw and grape pomace) are assessed and compared to those of standard wood chips. The critical operating parameters of the process, such as the temperature, pressure, biomass-to-water ratio, and reaction time, and their impacts on the yield and properties of the final product, are also analyzed [16,21]. This study highlights the potential of HTC in improving the characteristics of raw agro-forestry residues, focusing on grape pomace, wheat straw, and wood chips, in order to obtain enhanced biofuels and improve the overall sustainability of the production chain.

2. Materials and Methods

The following section describes the materials and methods used to assess the impact of HTC on the quality of three types of solid biomass.

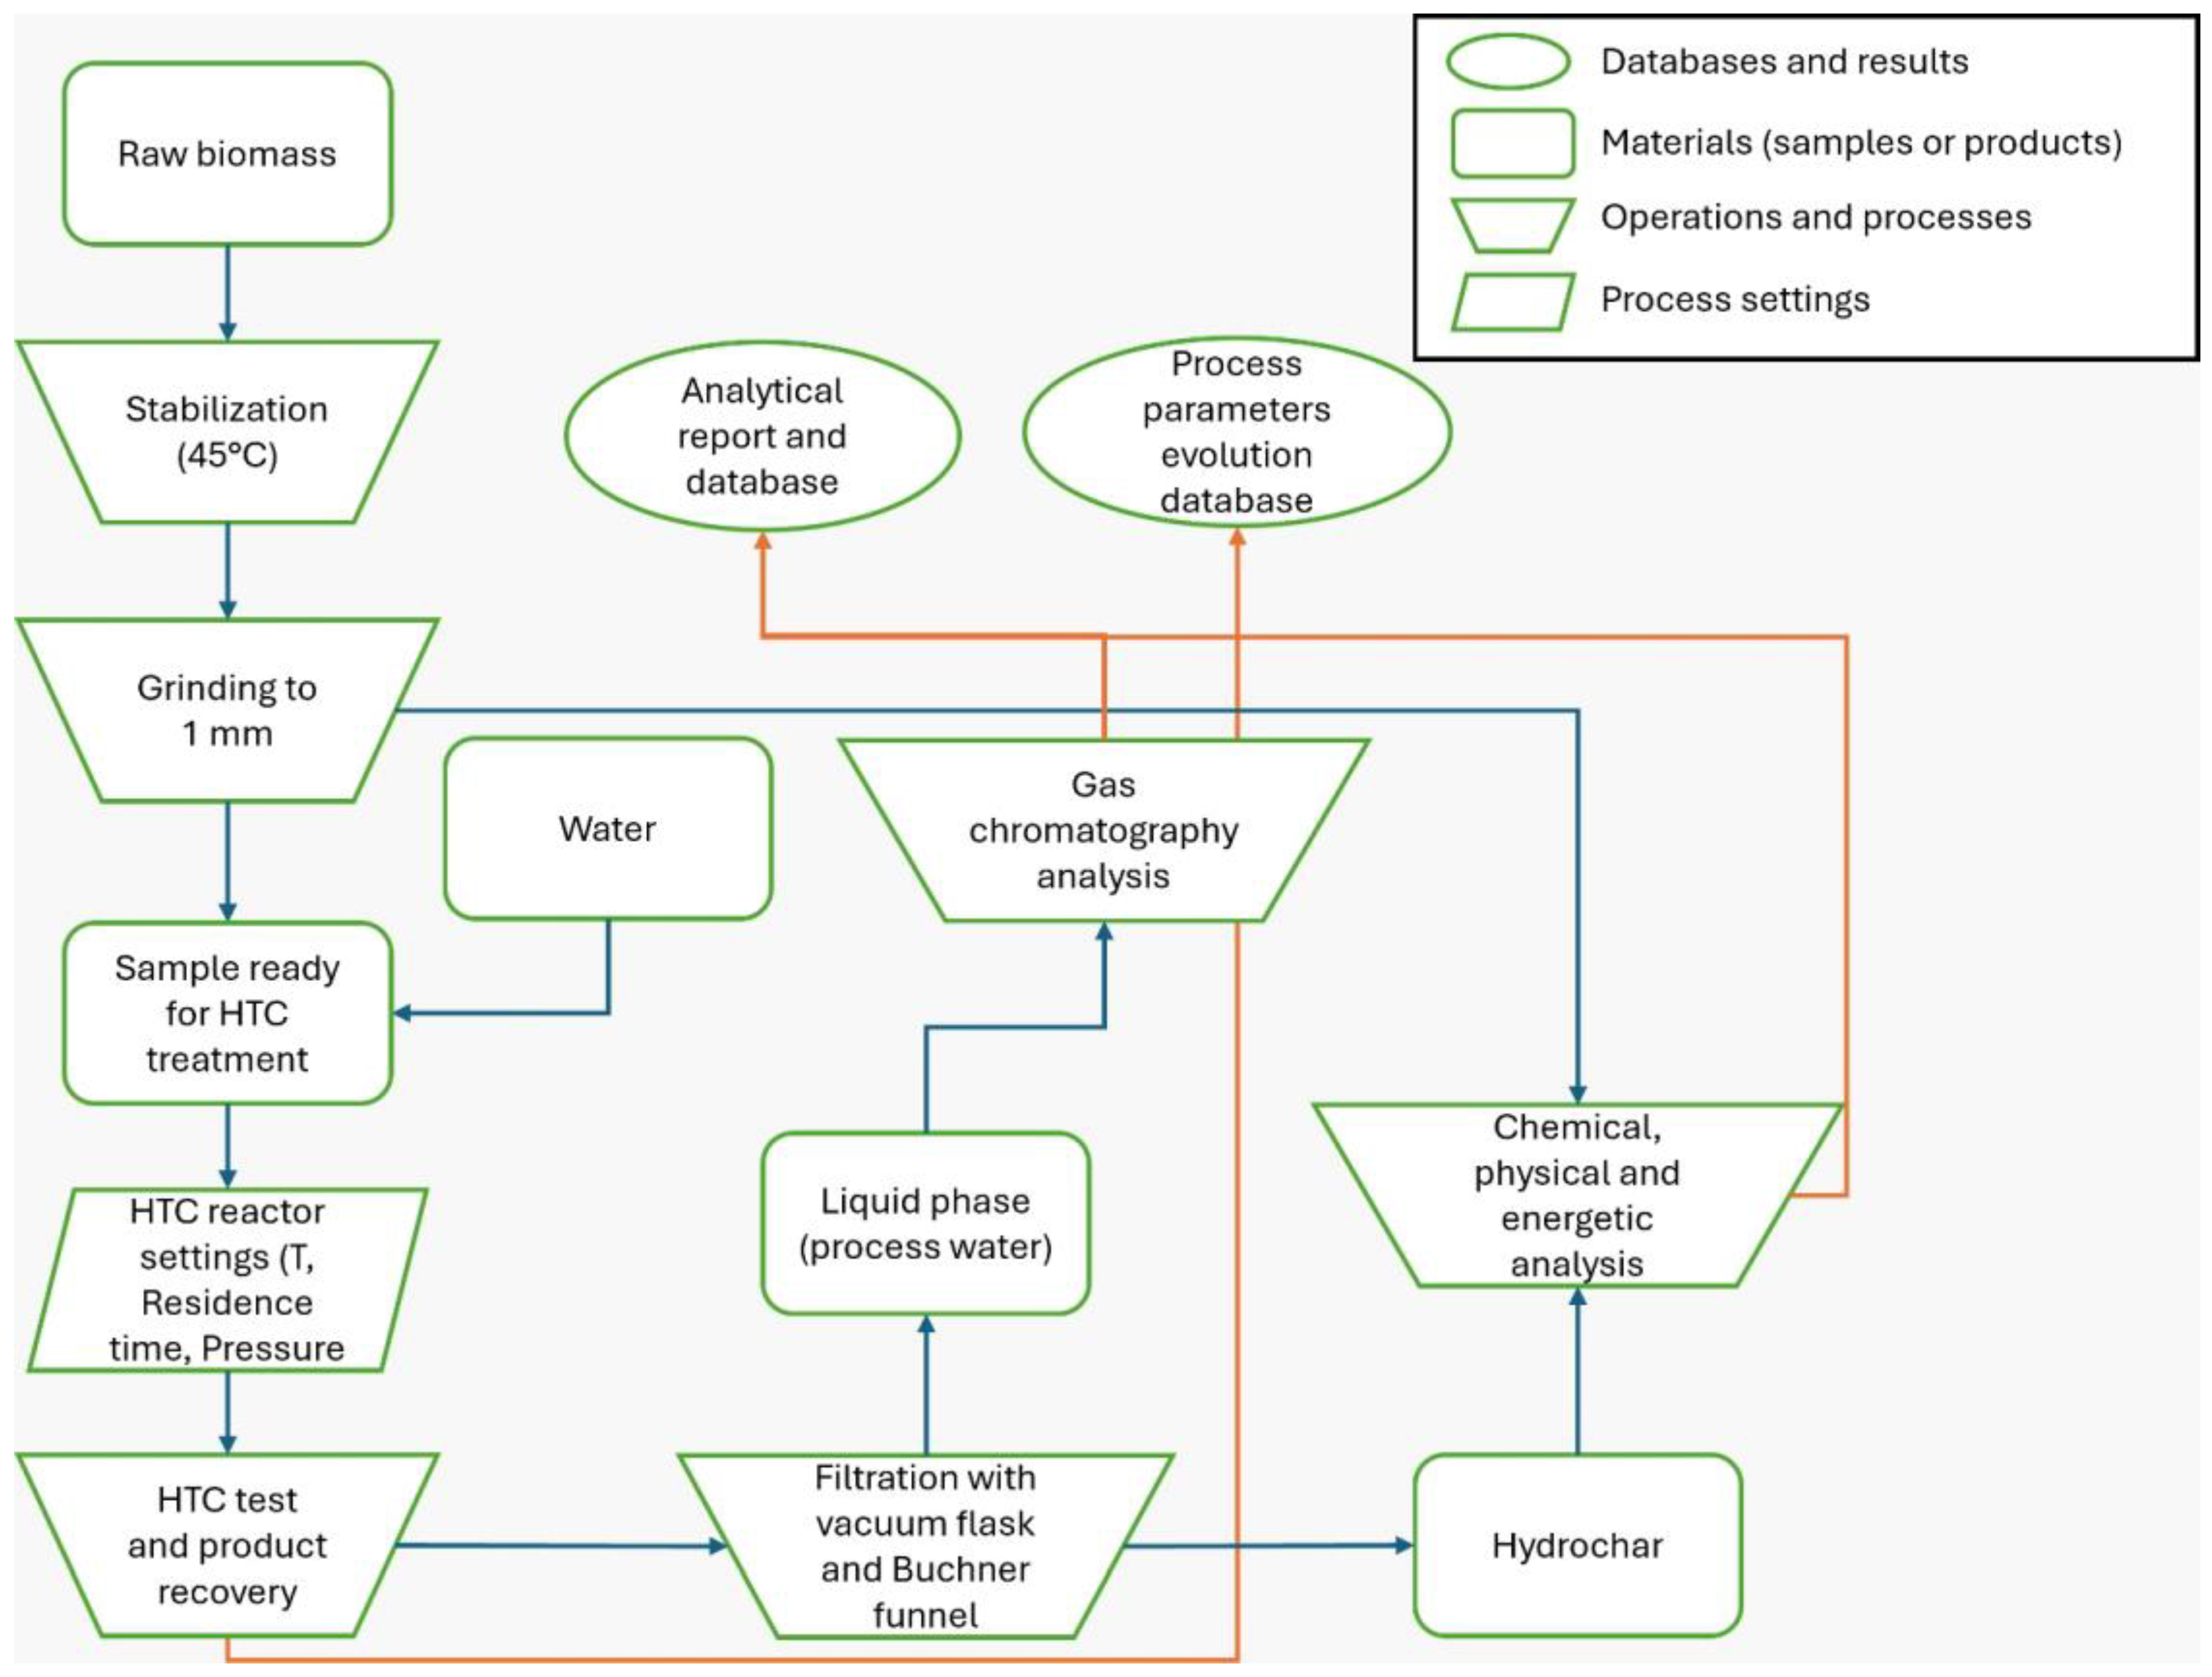
2.1. Overall Workflow

This study focused on residual biomass from the agricultural sector with the potential for thermal treatment to enhance specific quality properties. Wheat straw (WS), grape pomace (GP), and wood chips (WC) were selected and obtained from Italian suppliers. Approximately 2 kg of each biomass was stabilized in an oven at 45 °C and subsequently ground to 1 mm via an SM 300 mill (produced by Retsch, Haan, Germany). The ground WS, GP, and WC were homogenized, quartered, and subjected to qualitative characterization and HTC treatment. The qualitative characterization was carried out on both the raw materials and HTC solid products. Specifically, the characterization included assessing the ash content; heating value (gross, GHV, and lower, LHV); and C, H and N, content. The ash content was assessed by thermogravimetric analysis using a TGA701 (manufactured by LECO, St. Joseph, MI, USA) following ISO 18122 [22]. The calorific value was determined using an IKA C2000 Basic calorimeter (manufactured by IKA, Staufen, Germany) in accordance with ISO 18125 [23]. Finally, the C, H, and N content analysis was carried out using a TruSpec CHN (manufactured by LECO, St. Joseph, MI, USA), according to ISO 16948 [24]. The HTC process on ground WS, GP, and WC was carried out via a benchtop reactor system named Parr 4575A-HP/HT (Parr Instrument Company, Moline, IL, USA). This system can reach temperatures of up to 500 °C and pressure of up to 345 bar. The temperature and pressure were controlled with the Parr 4848 Reactor Controller. The entire workflow is shown in Figure 1.

2.2. HTC Preliminary Test and Experimental Plan

Before the experimental plan, five HTC tests were performed on various biomass types (wheat straw, grape pomace, vine pruning, Arundo donax, and digestate from organic fraction of municipal solid waste (OFMSW)), applying the same treatment parameters (220 °C maximum temperature, 60 min residence time, and a water-to-biomass ratio of 15). The solid fraction was characterized in terms of the parameters highlighted in Section 2.1. The liquid fraction was also analyzed for 5-hydroxymethyl furfurol (HMF), furfurol, total polyphenols (as (+)-catechin), meso-inositol (MI), levoglucosan + arabitol, glycerol, scillo-inositol, xylitol, erythritol, sorbitol, trehalose, mannitol, galactose, xylose, glucose, and arabinose.
HTC on WS, GP, and WC was carried out by varying three process settings, according to the literature [16,21], namely (i) the process temperature; (ii) the residence time; and (iii) the water-to-biomass ratio (WTB; the higher the value, the smaller the amount of sample used compared to process water). Only the temperature and WTB were varied for the WS sample following the preliminary tests, whereas all parameters were varied for GP and WC. Each parameter was combined with the others until we obtained, in the experimental plan, 6 combinations for the tests on straw, 12 combinations for the tests on pomace, and 12 combinations for the tests on wood chips. Each combination was repeated twice (replicates), resulting in 60 tests on the HTC tester (Table 1). Each test lasted approximately 5 h (between preparation, the actual test, and recovery) for 300 h of overall treatment.
The HTC tests consisted of the following steps: (i) weighing the sample according to the chosen WTB and weighing the process water to be added to the sample—the amount of process water was constant (300 mL) for all tests except for the WS tests, with a WTB of 60 (420 mL); (ii) loading the sample into the Parr 4575A-HP/HT’s vessel and setting the maximum temperature; (iii) Initializing the test; (iv) ending the test and collecting the HTC products; (v) separating the solid and liquid products via filtering (Figure 2) and the qualitative characterization of the solid products (Figure 3); (vi) performing a mass yield (MY) (1) and energetic yield (EY) (2) assessment on the HTC solid products.
M Y   % = S o l i d   p r o d u c t   m a s s I n i t i a l   s a m p l e   m a s s × 100
E Y   % = L H V × S o l i d   p r o d u c t   m a s s L H V × I n i t i a l   s a m p l e   m a s s × 100
With respect to the operating pressure of the torrefaction tests, this was not considered as a factor in the experimental plan since it was not possible to keep it stable during the treatment (the reactor was not equipped with a pressure switch). However, the instantaneous pressure was manually recorded every 5 min, starting from the beginning of the tests until the cooling and release of the pressure generated through a needle valve. Table 2 shows the average values of the pressure within the residence time of the biomass in the treatment, i.e., in the phase in which the material was being treated at the maximum set temperature. The pressure for all tests increased from a zero value to the maximum values, which were strictly related to the temperature. In fact, the pressure appeared to be directly proportional to the temperature, with maximum average values that oscillated around zero up to 90 °C (temperature below boiling point) to reach 1–4 bar between 120 and 160 °C, to reach up to 7–9 bar at 180 °C, and finally to reach over 23 bar at 230 °C. The W/B ratio, residence time, and biomass did not seem to influence the pressure in a statistically significant way, probably because this was mainly due to the vapor generated by the liquid fraction and to a lesser extent by the volatile substances (which largely solubilized in the same liquid fraction).
Once the two phases (solid and liquid) of the torrefaction tests were separated, the dried solid fraction was subjected to chemical–physical characterization for the same parameters analyzed on the raw biomass.

3. Results and Discussion

This section compares the quantitative and qualitative characteristics of WS, WC, GP, and their respective solid products obtained through different HTC process conditions.

3.1. Results of Preliminary Tests

The treatment results in the preliminary tests, necessary for developing the subsequent experimental plan, generally showed a reduction in the ash content and mass of the sample and an increase in the energy content for almost all of the samples tested. The only exception was the fresh solid digestate, which showed the concentration of the ash content (also confirmed by the ash yield parameter reported in Table 3) and a slight reduction in the energy content, while the mass of the treated product was reduced compared to the raw sample. The anomalous behavior of the digestate, which was closest to the phenomenon of classic dry roasting, could be explained by the fact that the digestate was a product that had already undergone a biochemical transformation, which had probably mainly affected the most volatile fraction of the OFMSW organic substance in which the ash was concentrated, as they did not participate in the phenomenon of anaerobic digestion. In the HTC, the digestate ash was already very high (39.2% d.m.) and was concentrated instead of leaching into the liquid fraction.
Concerning the digestate, the reduction in the energy yield (Table 4) probably depends on two factors: the high ash content, which does not contribute to the energy content of the sample, and the stability of the residual organic substance (deriving from the anaerobic digestion process).
The analysis of the liquid fraction derived from the preliminary tests is reported in Table 5. From the results, the liquid fraction from the treatment of the lignocellulosic biomass (straw, Arundo, and vine prunings) has a larger quantity of carbohydrates than the pomace and digestate. The same phenomenon occurs in relation to the alcohols analyzed and, in particular, the total polyphenols, which, in the lignocellulosic biomass, show practically identical concentrations. The digestate shows lower levels of organic compounds than all other biomass types as the starting biomass is derived from previous degradation processes, which have reduced its organic load, making it more stable under chemical, physical, and biological degradation. Moreover, for the digestate, the high ash content (inorganic fraction) contributes to reducing the organic component on which the physical processes of the degradation of the HTC depend.
As regards the pomace, the only interesting point concerns the glycerol content, which has a concentration 10 times higher than that of the other biomass types, probably due to the presence of oils in the seeds (about 10–17%), which are released during the heat treatment, starting from triglyceride molecules, and enter the solution given its water-soluble properties. Among the other compounds found in the liquid fraction of the preliminary tests, furfural and total polyphenols stand out. In the case of furfural, this is derived from the hydrolysis processes of the hemicelluloses (typical of HTC processes), which release xylose due to this, and then the temperature acts, creating dehydration and reduction to furfural. Polyphenols are more abundant in the woody or herbaceous samples than the pomace and digestate, possibly due to the higher lignin content, of which polyphenolic substances are the basic constituents. The higher inositol content in the pomace represents another interesting result. In this case, a possible explanation lies in the fact that this molecule binds, especially in seeds, to phosphorus and represents the most widespread system for the storage of inorganic phosphorus in plant species [25].

3.2. Mass and Energetic Yield
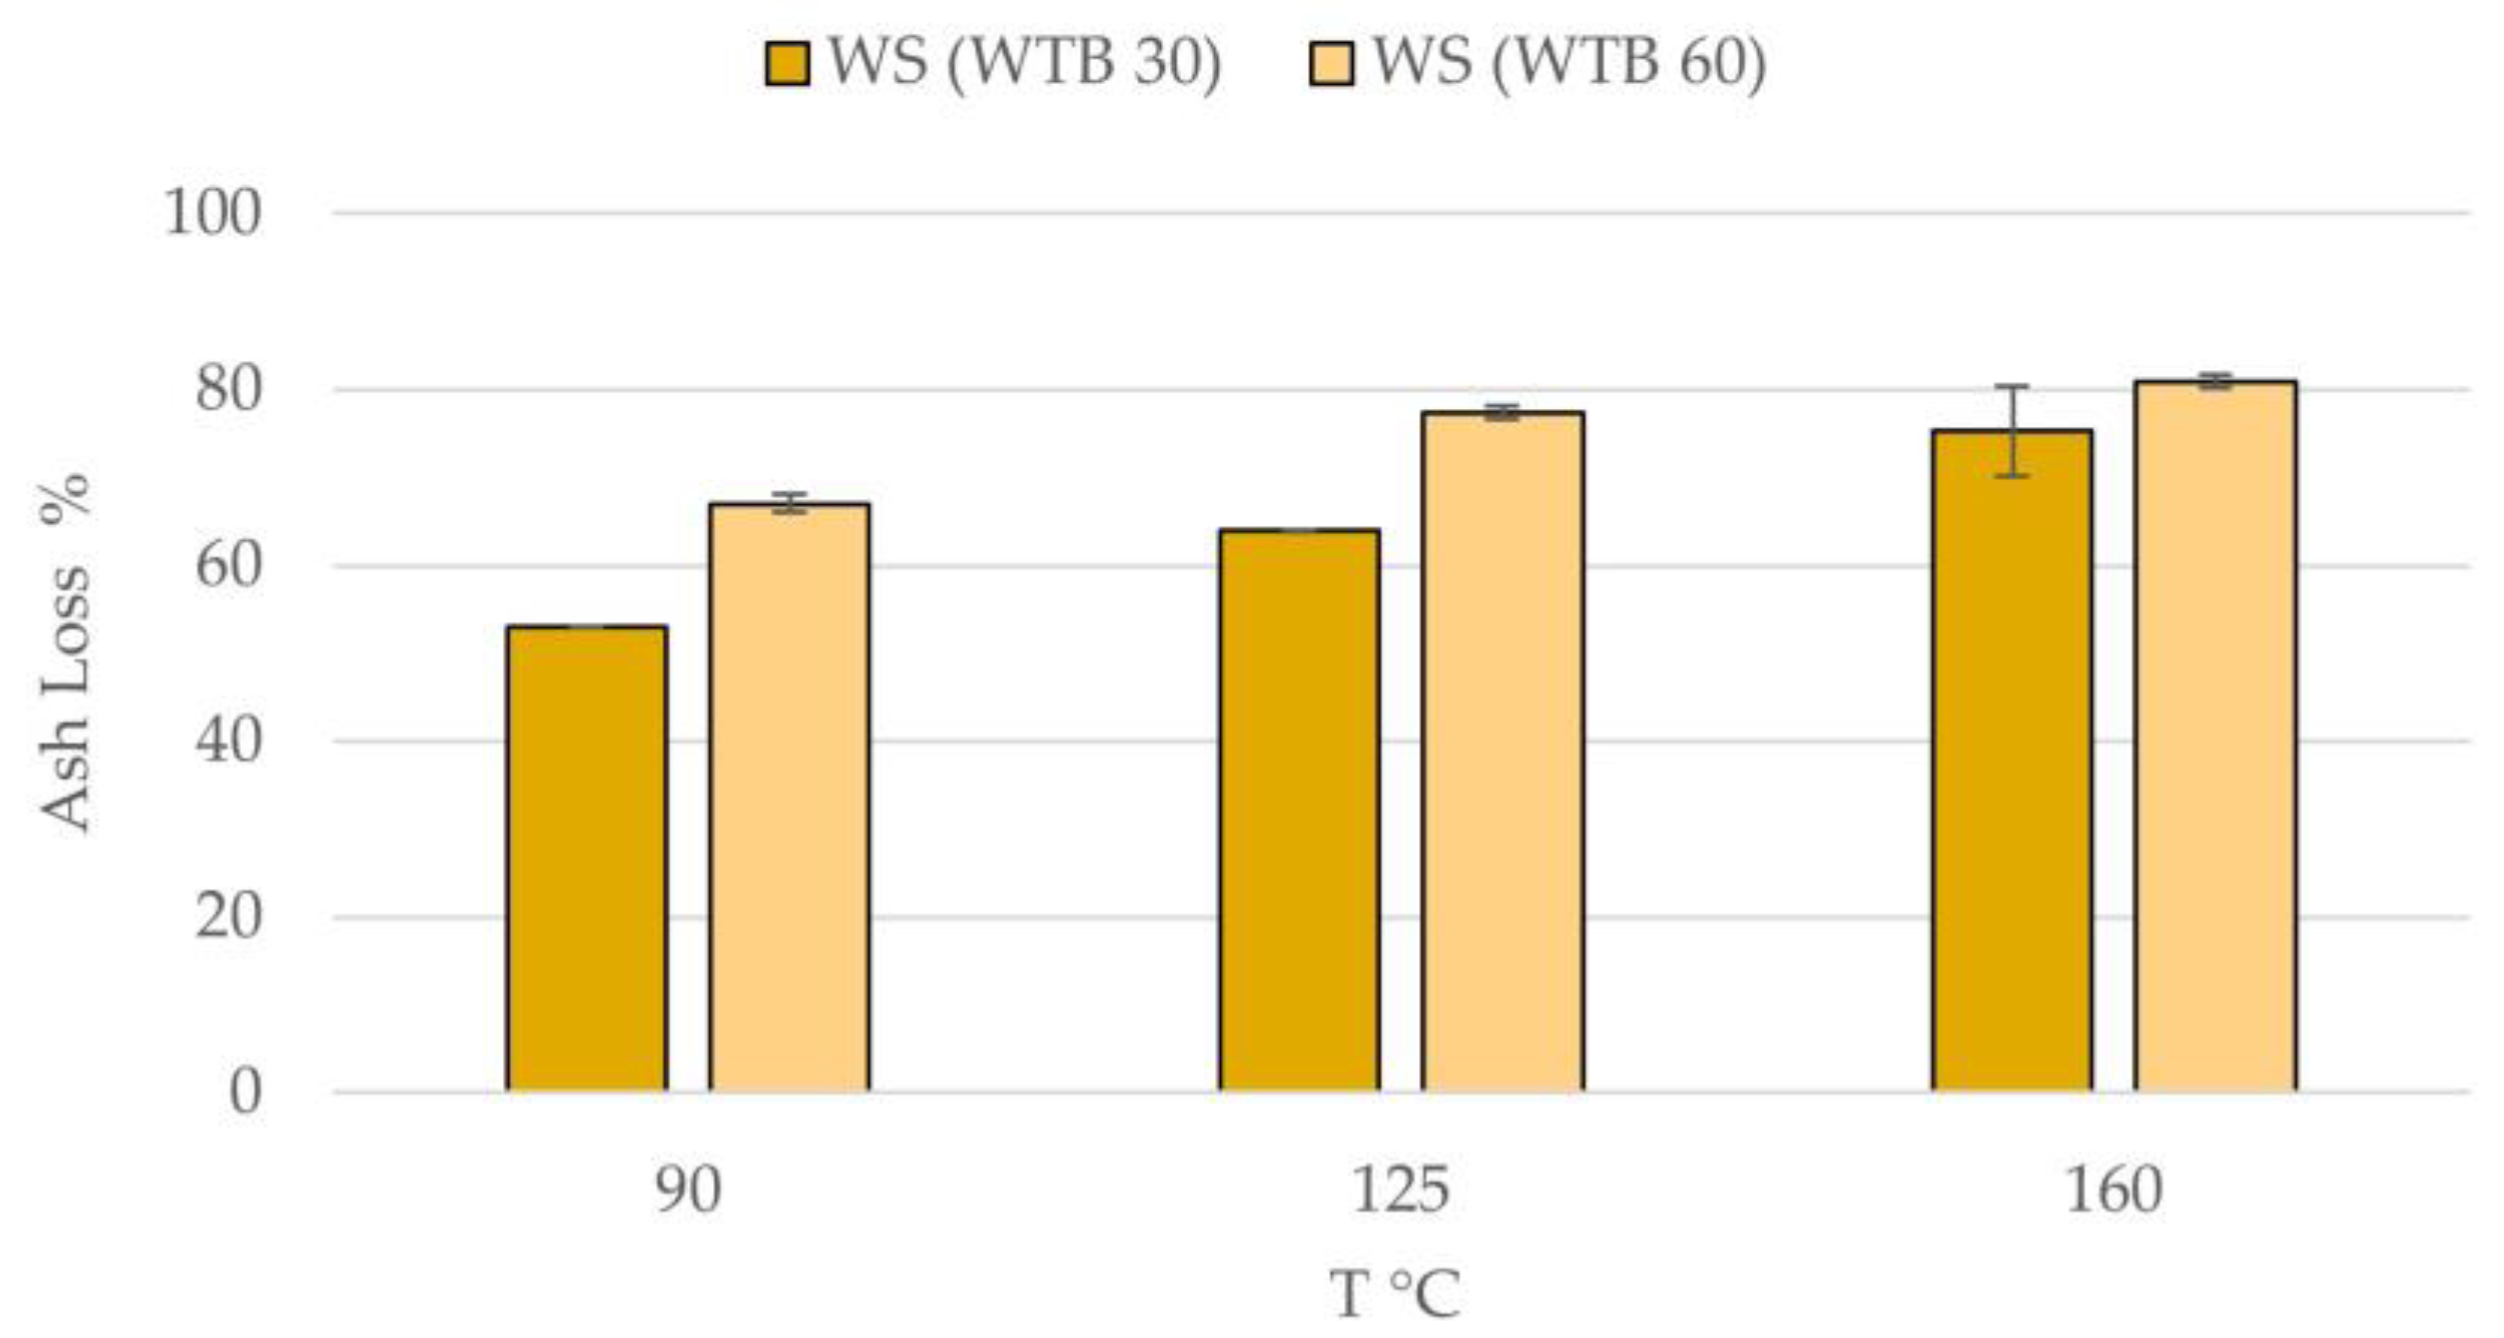
WS’s HTC led to a negative relation between the process temperature and the MY and EY. Increasing the temperature from 90 °C to 160 °C resulted in a reduction greater than 20% for both the MY and EY [19,20,26]. Furthermore, varying the WTB for the WS samples appeared to have little influence on both the MY and EY. Specifically, the increase in the WTB resulted in limited average variations in the MY and EY, with decreases of 4.5% for the former and 3.6% for the latter.
For WC, the increase in the treatment temperature resulted in an overall reduction in yield [16,19]. In fact, regardless of the WTB, the increase in the temperature from 130 to 230 °C resulted in an average reduction in the MY of approximately 35% [20]. For both WTBs, increasing the residence time from 60 to 120 min had a minor impact on the yields, except for a reduction of 7% in the MY at 230 °C and a higher WTB. As with WS, the EY follows a similar trend to the MY, the only difference being that the reduction in the EY with increased process severity appears to be smaller than the reduction in the MY. This could indicate that the organic matter extracted during HTC has low energy content or that the decrease in the MY corresponds to a loss due to the solubilization of the inorganic fraction.
In the case of GP, the MY showed a similar pattern to the other samples, with consistently lower values even at reduced temperatures [16,27]. The MY at 70 °C amounted to 77%, with minimal variation observed when the residence time and WTB were varied. As with the other samples, GP showed a decrease in EY that followed the decrease in the corresponding MY, with the differences with WS and WC being that the decrease between the two yields was already observed at low temperatures, with a decrease of up to 12.4% at higher temperatures. The results relating to the mass and energetic yield for the various tests (with relative standard deviations) are reported in Table 6.

3.3. Ash Content

Starting from ash content of 7.2% (on a dry basis), WS samples showed a reduction in ash content due to HTC between 53% and 80% (Figure 4). The decrease in the ash content could be related to the loss of inorganic matter in the liquid fraction, leading to a lower ash concentration in the solid fraction [28,29,30]. It was observed that, with increased test severity, the loss of the inorganic component from the biomass to the liquid phase also increased [8]. Specifically, increasing temperatures appeared to have an influence on the ash reduction (R2 = 0.9), differing by 10.6% between 90° and 125° and 7.4% between 125° and 160°. Varying the WTB from 30 to 60 led to a difference in ash reduction of 11% in favor of the higher WTB.
The same trend was observed for WC. However, as the ash content of the raw WC was lower (2.2% ash content on a dry basis), the percentages of ash reduction were more limited, ranging from 13.6% to 43.3%. Additionally, doubling the residence time increased the ash reduction by 5.5%. Furthermore, the correlation between the ash, WTB, and temperature appeared to be lower in both residence time cases (R2 = 0.7 and R2 = 0.3), suggesting that ash reduction may be due to non-linear and complex relationships among several factors [25].
HTC on GP (9.9% ash content on a dry basis) led to significant ash reductions, ranging from 75% to 80%. However, raising the temperature of the process resulted in only a small decrease in ash (2%). Increasing the WTB resulted in a slightly larger ash loss, with an average increase of 1.1%. Finally, a stronger correlation was found between the ash content, temperature, and WTB at shorter residence times (R2 = 0.6) compared to longer residence times (R2 = 0.3) (Figure 5).

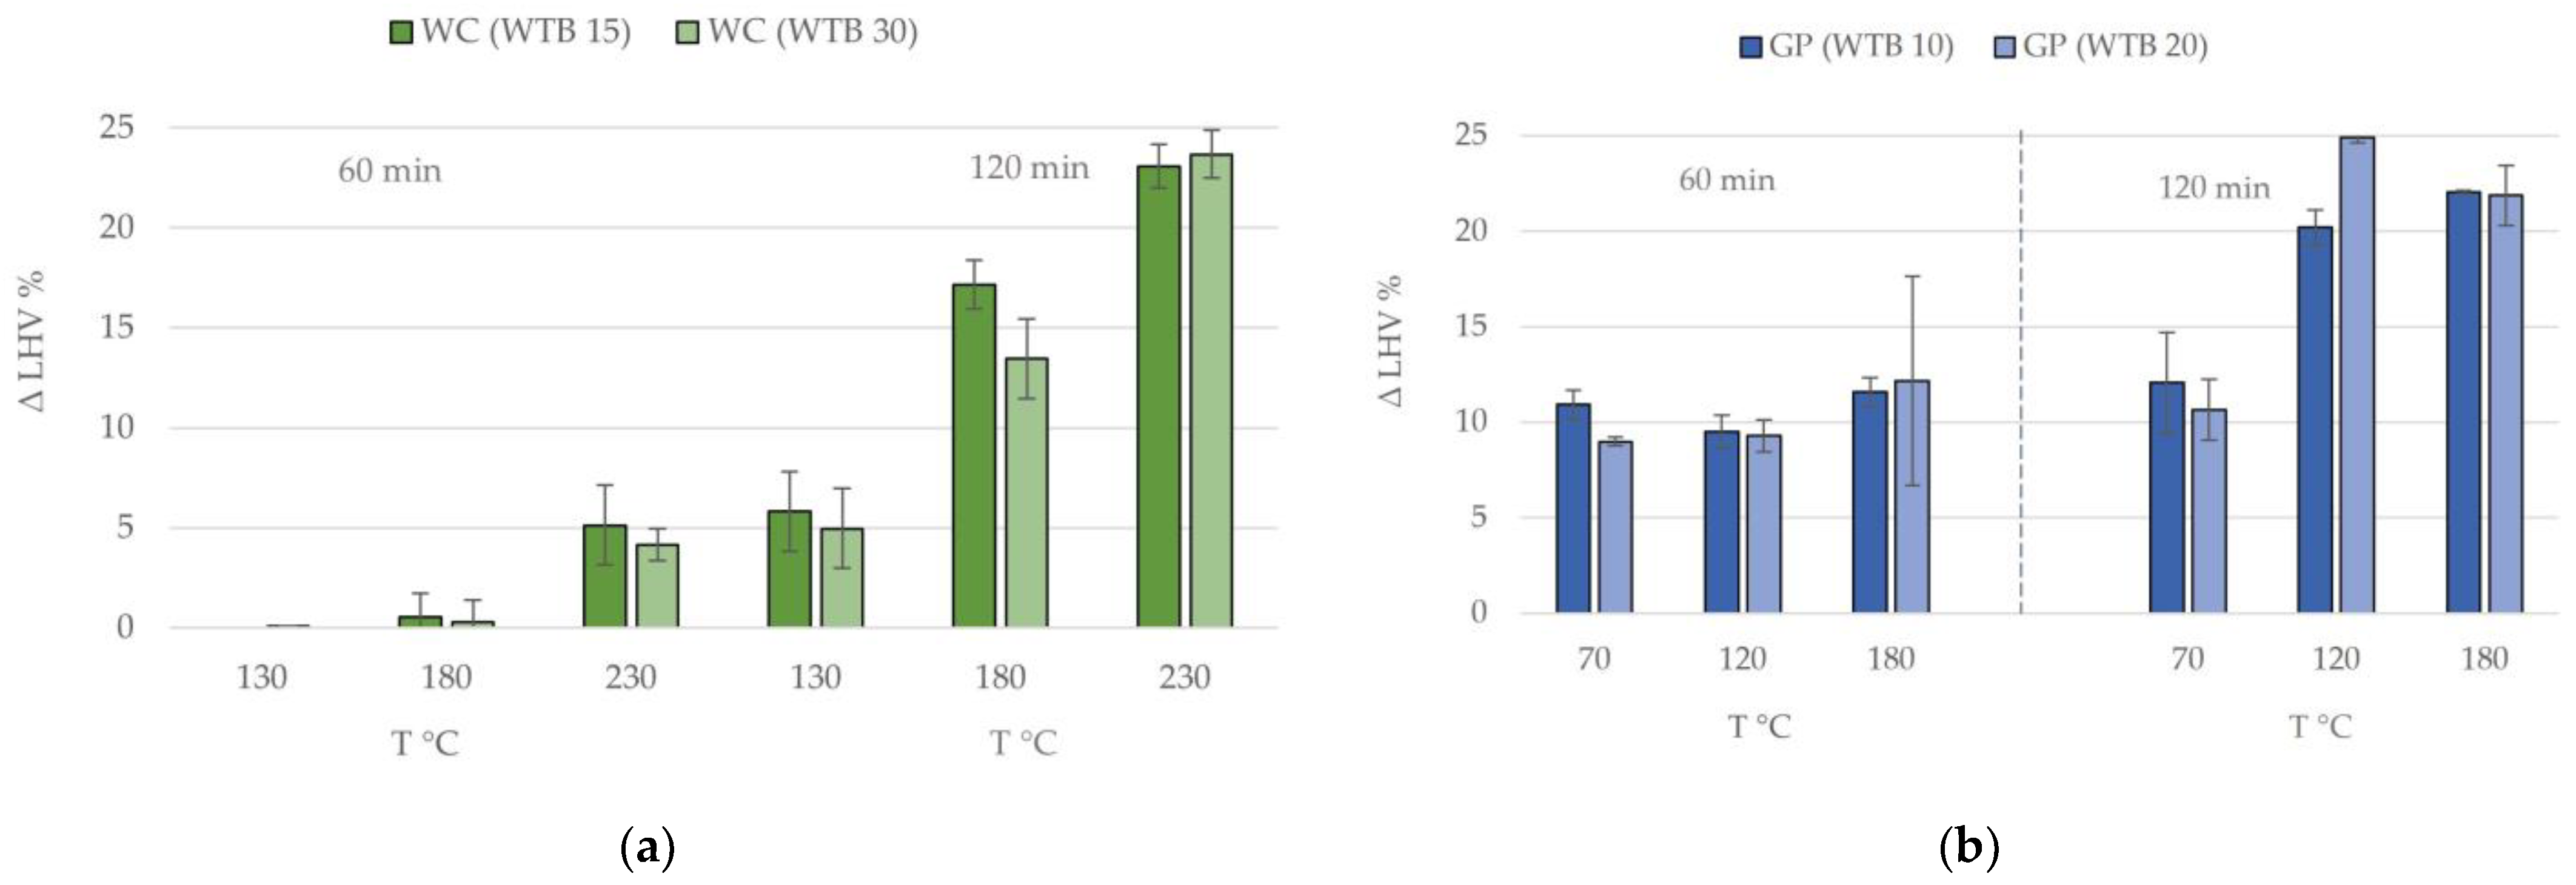
3.4. Lower Heating Value

Starting from an LHV of 17,370 kJ/kg, the HTC process on WS increased the LHV of WS’s solid products by up to 4.8% [31,32,33] (Figure 6). Most likely, the relatively low temperatures used during the HTC on WS had a minimal effect on the organic fraction, so the limited increase in the LHV might have been due to the discrete reduction of the inorganic component (ashes) rather than changes in the organic structure [32]. Increasing the WTB from 30 to 60 led to slightly larger increases in the LHV, even at lower temperatures [32].
HTC on WC yielded different results depending on the severity of the process, with WC starting from an LHV of 18,458 kJ/kg. The average increase in the LHV varied by 0.2% for tests at 130 °C, increasing to around 5% at 180 °C and up to almost 20% at 230 °C, confirming the correlation between the HTC temperature and LHV [17,25,28]. Increasing the residence time had a positive effect on the increase in the LHV. Increasing the WTB had only a minor influence on the variation in the energy content of the solid products, but it appeared that increasing the WTB caused a slight reduction in the LHV, probably due to the greater loss of organic matter in the liquid products [34].
The increase in the LHV was more significant for GP, which had an initial LHV of 19,733 kJ/kg. For instance, at 180 °C, the increase was about 11% for GP compared to 0.5% for WC. Furthermore, the main difference from WC is that, for GP, the effect of the temperature increase on the increase in the LHV seems more significant than the variation in the residence time and WTB, as shown in several articles [30,31,35,36,37] (Figure 7).

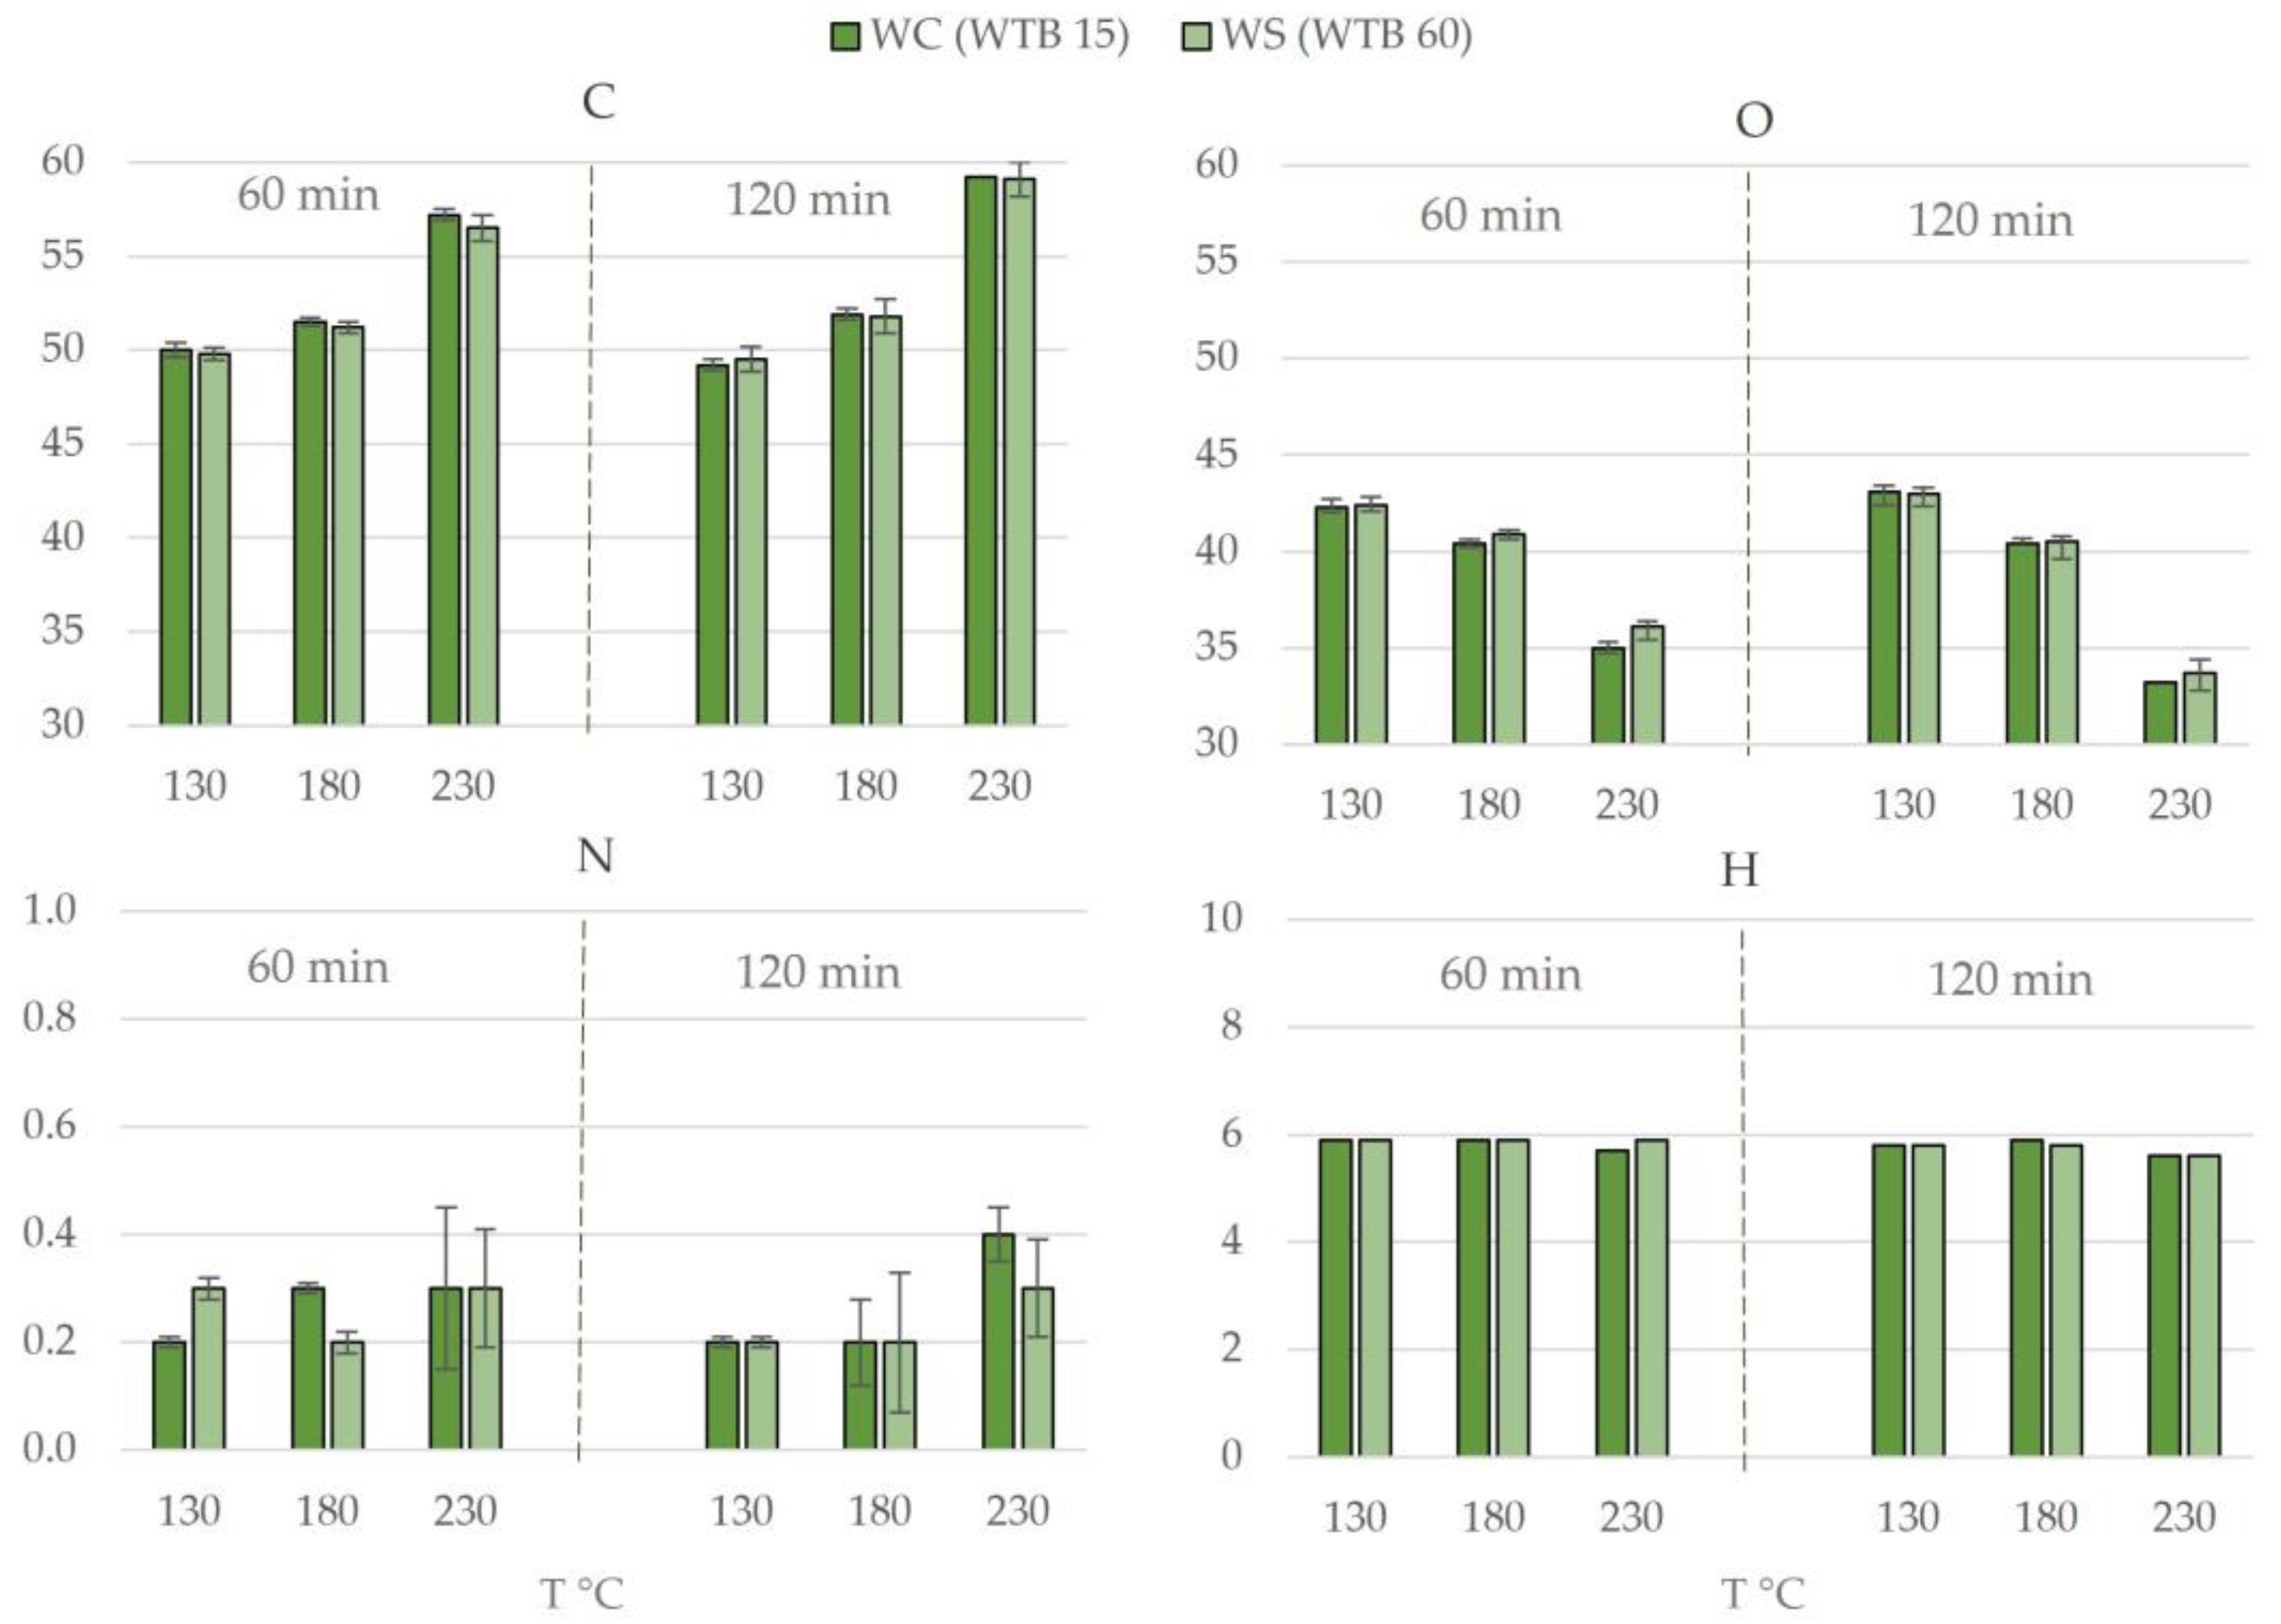
3.5. Elemental Composition

The CHN analysis on the WS raw sample led to the following results (reported on a dry basis): 45.8% C, 4.8% H, 0.5% N, and 41.8% O. HTC at 90 °C and 125 °C on WS resulted in an increase of about 1.7% in the C content [31,34,36,37,38]. The increase was 3.3% for the 160 °C treatment, with less than 0.5% differences between the WTBs. Additionally, the H content increased by approximately 1.1% for all temperatures, with almost no differences between the WTBs. The N content decreased by 0.2% for the 90 and 160 °C treatments, while the O content increased by 1.7–1.3% for the 90 and 160 °C treatments and 2.3% for the 125 °C treatment, with a variation of 1.2% between the WTBs (Figure 8).
The analysis of raw WC led to the following results: 50.1% C, 5.5% H, 2.2% N, and 39.9% H. Unlike WS, the tests carried out on WC resulted in more significant effects. The concentration of C did not vary at lower temperatures, likely because the low temperatures did not cause significant changes in the organic matter. From 180 °C, however, it varied from a concentration of 50% to a maximum of approximately 60% at the highest processing temperature [31,34,36,37,38]. A significant variation (up to a maximum of 8.4%) was thus observed between the lowest and highest treatment temperatures, while the residence time and WTB appeared to create only a slight or no difference. The H concentration increased uniformly by 0.1–0.4% during each test. N was reduced significantly at lower temperatures. The oxygen concentration was higher in the less severe tests and then tended to decrease in the more severe tests. This behavior may be due to the loss of inert or oxygen-poor mass at the beginning (ash leaching), followed by a consistent reduction in the same due to the degradation of oxygen-rich chemical compounds (such as hemicelluloses) at high temperatures (Figure 9).
The raw GP elemental composition analysis led to the following data: 50.2% C, 5.8% H, 1.9% N, and 32.1% O. Compared to WS and WC, GP’s solid products showed a significant increase in the C concentration from the first test. At the mildest conditions, the C detected reached a concentration of 54% compared to about 50% in the raw biomass, while, at the highest conditions, the C content reached 61.8%. This immediate effect of the C concentration can be explained by the considerable extraction of the inorganic matter, which is also confirmed by the increased concentrations of the other elements (H, N, O) [29,30]. H showed homogeneous concentrations in all treatment products, as observed for WC. Assuming the solubilization of ash, we can explain both the increase in C and the observed increase in the N content, from 2.4% to 3.5% in the less severe tests back to concentrations similar to those of the raw biomass in the more severe tests, which suggests that the reduction of N at higher temperatures is caused by thermal degradation and solubilization into the liquid product of the N compounds during HTC processes (Figure 10).

4. Conclusions

By varying the three fundamental process variables of hydrothermal treatment, namely the temperature, residence time, and WTB, it is possible to induce improvements in the chemical–physical and energetic properties of the residual biomass. In other words, it is a treatment that helps to upgrade the biomass and thus promotes its conversion into standardized biofuels. However, these findings, confirmed by the trials conducted in this paper, are prone to a degree of variability in the treatment responses between different biomass types. The same combinations of variables used for the process affect the quality parameters differently.
The process temperature is a key variable in HTC. Specifically, it positively influences (i) the energy content in WC and GP, with increases of up to 20%; (ii) the elemental composition for WC and GP, with an increase in the carbon concentration ranging from 50% to 58% in WC and 50% to 60% in GP; and (iii) a reduction in O from 32% to an average of 28% for higher-temperature treatments. For the residence time, an increase in this variable contributes slightly to the improvement of the energy content of the WC—barely 3%—and to an even lesser extent to the reduction of the ash content in the WC. Increasing the WTB reduces the ash content in WS and WC, resulting in a 75% and 31.5% decrease, respectively. Furthermore, there was a positive but limited effect on the reduction of ash in GP. An increase in the LHV also occurred in WS. In contrast, the increase in the WTB seemed to worsen the energy content in WC.
Despite the positive results found, some aspects remain uncertain, such as the valorization of the condensable fraction of the gases dissolved in the liquid phase of the process. In this case, the relatively large quantity of polyphenols and furfural makes it interesting as a matrix for the extraction of these chemical compounds or as liquid smoke to be used to replace normal food smoking processes, after having dehydrated it. The concentrations of other organic compounds, such as sugars or glycerol, could make this solution also usable in biochemical conversion processes for the production of energy in anaerobic or aerobic fermentative systems. Thus, despite the certain amount of energy expenditure for the process [39,40], HTC has proven to be a valuable technique to enhance biomass’ overall quality [41].

Author Contributions

Conceptualization, C.D.F., A.I. and G.T.; methodology, D.D. and G.T.; validation, D.D. and G.T.; formal analysis, A.I.; data curation, A.I., T.G. and C.D.F.; writing—original draft preparation, C.D.F. and T.G.; writing—review and editing, C.D.F. and T.G.; visualization, T.G. and C.D.F.; supervision, A.I. All authors have read and agreed to the published version of the manuscript.

Funding

This research received no external funding.

Data Availability Statement

Data are contained within the article. The data presented in this study are available on request from the corresponding authors.

Conflicts of Interest

The authors declare no conflicts of interest.

References

  1. Lago, C.; Herrera, I.; Caldés, N.; Lechón, Y. Nexus Bioenergy–Bioeconomy. In The Role of Bioenergy in the Emerging Bioeconomy: Resources, Technologies, Sustainability and Policy; Academic Press: Cambridge, MA, USA, 2019; pp. 3–24. [Google Scholar] [CrossRef]
  2. Scarlat, N.; Dallemand, J.F.; Monforti-Ferrario, F.; Nita, V. The Role of Biomass and Bioenergy in a Future Bioeconomy: Policies and Facts. Environ. Dev. 2015, 15, 3–34. [Google Scholar] [CrossRef]
  3. Istat Istat—7th Agricultural Census. Available online: https://esploradati.istat.it (accessed on 29 April 2024).
  4. Eurostat Eurostat Data Browser—Wine-Grower Holdings by Production. Available online: https://ec.europa.eu (accessed on 29 April 2024).
  5. Toscano, G.; Riva, G.; Duca, D.; Pedretti, E.F.; Corinaldesi, F.; Rossini, G. Analysis of the Characteristics of the Residues of the Wine Production Chain Finalized to Their Industrial and Energy Recovery. Biomass Bioenergy 2013, 55, 260–267. [Google Scholar] [CrossRef]
  6. Mereu, V.; Gallo, A.; Trabucco, A.; Carboni, G.; Spano, D. Modeling High-Resolution Climate Change Impacts on Wheat and Maize in Italy. Clim. Risk Manag. 2021, 33, 100339. [Google Scholar] [CrossRef]
  7. Malaťák, J.; Velebil, J.; Malaťáková, J.; Passian, L.; Bradna, J.; Tamelová, B.; Gendek, A.; Aniszewska, M. Reducing Emissions from Combustion of Grape Residues in Mixtures with Herbaceous Biomass. Materials 2022, 15, 7288. [Google Scholar] [CrossRef]
  8. Fernando, A.L.; Costa, J.; Cocchi, M.; Boulday, D. Identification of EU Success Factors for Sustainable Wood Waste Valorization. In Proceedings of the European Biomass Conference and Exhibition Proceedings, Copenhagen, Denmark, 14–17 May 2018; pp. 175–179. [Google Scholar] [CrossRef]
  9. Teoh, R.H.; Mahajan, A.S.; Moharir, S.R.; Abdul Manaf, N.; Shi, S.; Thangalazhy-Gopakumar, S. A Review on Hydrothermal Treatments for Solid, Liquid and Gaseous Fuel Production from Biomass. Energy Nexus 2024, 14, 100301. [Google Scholar] [CrossRef]
  10. Mancini, M.; Toscano, G.; Feliciangeli, G.; Leoni, E.; Duca, D. Investigation on Woodchip Quality with Respect to ISO Standards and Relationship among Quality Parameters. Fuel 2020, 279, 118559. [Google Scholar] [CrossRef]
  11. Toscano, G.; De Francesco, C.; Gasperini, T.; Fabrizi, S.; Duca, D.; Ilari, A. Quality Assessment and Classification of Feedstock for Bioenergy Applications Considering ISO 17225 Standard on Solid Biofuels. Resources 2023, 12, 69. [Google Scholar] [CrossRef]
  12. Botelho, T.; Costa, M.; Wilk, M.; Magdziarz, A. Evaluation of the Combustion Characteristics of Raw and Torrefied Grape Pomace in a Thermogravimetric Analyzer and in a Drop Tube Furnace. Fuel 2018, 212, 95–100. [Google Scholar] [CrossRef]
  13. Miranda, T.; Román, S.; Montero, I.; Nogales-Delgado, S.; Arranz, J.I.; Rojas, C.V.; González, J.F. Study of the Emissions and Kinetic Parameters during Combustion of Grape Pomace: Dilution as an Effective Way to Reduce Pollution. Fuel Process. Technol. 2012, 103, 160–165. [Google Scholar] [CrossRef]
  14. Puccini, M.; Stefanelli, E.; Hiltz, M.; Seggiani, M.; Vitolo, S. Activated Carbon from Hydrochar Produced by Hydrothermal Carbonization of Wastes. Chem. Eng. Trans. 2017, 57, 169–174. [Google Scholar] [CrossRef]
  15. Shi, N.; Liu, Q.; He, X.; Wang, G.; Chen, N.; Peng, J.; Ma, L. Molecular Structure and Formation Mechanism of Hydrochar from Hydrothermal Carbonization of Carbohydrates. Energy Fuels 2019, 33, 9904–9915. [Google Scholar] [CrossRef]
  16. Mendoza Martinez, C.L.; Sermyagina, E.; Saari, J.; Silva de Jesus, M.; Cardoso, M.; Matheus de Almeida, G.; Vakkilainen, E. Hydrothermal Carbonization of Lignocellulosic Agro-Forest Based Biomass Residues. Biomass Bioenergy 2021, 147, 106004. [Google Scholar] [CrossRef]
  17. Peterson, A.A.; Vogel, F.; Lachance, R.P.; Fröling, M.; Antal, M.J.; Tester, J.W. Thermochemical Biofuel Production in Hydrothermal Media: A Review of Sub- and Supercritical Water Technologies. Energy Environ. Sci. 2008, 1, 32–65. [Google Scholar] [CrossRef]
  18. Pavkov, I.; Radojčin, M.; Stamenković, Z.; Bikić, S.; Tomić, M.; Bukurov, M.; Despotović, B. Hydrothermal Carbonization of Agricultural Biomass: Characterization of Hydrochar for Energy Production. Solid Fuel Chem. 2022, 56, 225–235. [Google Scholar] [CrossRef]
  19. Moliner, C.; Arato, E.; Marchelli, F. Current Status of Energy Production from Solid Biomass in Southern Italy. Energies 2021, 14, 2576. [Google Scholar] [CrossRef]
  20. Beres, C.; Costa, G.N.S.; Cabezudo, I.; da Silva-James, N.K.; Teles, A.S.C.; Cruz, A.P.G.; Mellinger-Silva, C.; Tonon, R.V.; Cabral, L.M.C.; Freitas, S.P. Towards Integral Utilization of Grape Pomace from Winemaking Process: A Review. Waste Manag. 2017, 68, 581–594. [Google Scholar] [CrossRef] [PubMed]
  21. Gallifuoco, A.; Taglieri, L.; Scimia, F.; Papa, A.A.; Di Giacomo, G. Hydrothermal Carbonization of Biomass: New Experimental Procedures for Improving the Industrial Processes. Bioresour. Technol. 2017, 244, 160–165. [Google Scholar] [CrossRef] [PubMed]
  22. ISO 18122; Solid Biofuels-Determination of Ash Content. ISO: Geneva, Switzerland, 2015.
  23. ISO 18125; Solid Biofuels-Determination of Calorific Value. ISO: Geneva, Switzerland, 2017; ISBN 9780580893261.
  24. ISO 16948; Solid Biofuels-Determination of Total Content of Carbon, Hydrogen and Nitrogen. ISO: Geneva, Switzerland, 2015.
  25. Council, N.R. Nutrient Requirements of Poultry: Sixth Revised Edition; Nutrient Requirements of Poultry 1AD; The National Academies Press: Washington, DC, USA, 1971. [Google Scholar] [CrossRef]
  26. Moliner, C.; Marchelli, F.; Arato, E. Current Status of Energy Production from Solid Biomass in North-West Italy. Energies 2020, 13, 4390. [Google Scholar] [CrossRef]
  27. Krysanova, K.; Krylova, A.; Zaichenko, V. Properties of Biochar Obtained by Hydrothermal Carbonization and Torrefaction of Peat. Fuel 2019, 256, 115929. [Google Scholar] [CrossRef]
  28. Reza, M.T.; Mumme, J.; Ebert, A. Characterization of Hydrochar Obtained from Hydrothermal Carbonization of Wheat Straw Digestate. Biomass Convers. Biorefinery 2015, 5, 425–435. [Google Scholar] [CrossRef]
  29. Cheng, C.; He, Q.; Ismail, T.M.; Mosqueda, A.; Ding, L.; Yu, J.; Yu, G. Hydrothermal Carbonization of Rape Straw: Effect of Reaction Parameters on Hydrochar and Migration of AAEMs. Chemosphere 2022, 291, 132785. [Google Scholar] [CrossRef] [PubMed]
  30. Ma, Q.; Han, L.; Huang, G. Effect of Water-Washing of Wheat Straw and Hydrothermal Temperature on Its Hydrochar Evolution and Combustion Properties. Bioresour. Technol. 2018, 269, 96–103. [Google Scholar] [CrossRef] [PubMed]
  31. Güler, B.; Aydın Temel, F. Investigation of Value-Added Charcoal Production from Full-Scale Hydrothermal Carbonization of Hazelnut Husk and Wood Waste. Biomass Convers. Biorefinery 2023, 14, 15119–15127. [Google Scholar] [CrossRef]
  32. Broch, A.; Jena, U.; Hoekman, S.K.; Langford, J. Analysis of Solid and Aqueous Phase Products from Hydrothermal Carbonization of Whole and Lipid-Extracted Algae. Energies 2014, 7, 62–79. [Google Scholar] [CrossRef]
  33. Saha, S.; Islam, M.T.; Calhoun, J.; Reza, T. Effect of Hydrothermal Carbonization on Fuel and Combustion Properties of Shrimp Shell Waste. Energies 2023, 16, 5534. [Google Scholar] [CrossRef]
  34. Heidari, M.; Salaudeen, S.; Dutta, A.; Acharya, B. Effects of Process Water Recycling and Particle Sizes on Hydrothermal Carbonization of Biomass. Energy Fuels 2018, 32, 11576–11586. [Google Scholar] [CrossRef]
  35. Barbanera, M.; Cardarelli, A.; Carota, E.; Castellini, M.; Giannoni, T.; Ubertini, S. Valorization of Winery and Distillery By-Products by Hydrothermal Carbonization. Sci. Rep. 2021, 11, 1–16. [Google Scholar] [CrossRef]
  36. Ulbrich, M.; Preßl, D.; Fendt, S.; Gaderer, M.; Spliethoff, H. Impact of HTC Reaction Conditions on the Hydrochar Properties and CO2 Gasification Properties of Spent Grains. Fuel Process. Technol. 2017, 167, 663–669. [Google Scholar] [CrossRef]
  37. Sobek, S.; Tran, Q.K.; Junga, R.; Werle, S. Hydrothermal Carbonization of the Waste Straw: A Study of the Biomass Transient Heating Behavior and Solid Products Combustion Kinetics. Fuel 2022, 314, 122725. [Google Scholar] [CrossRef]
  38. Toufiq Reza, M.; Poulson, S.R.; Román, S.; Coronella, C.J. Behavior of Stable Carbon and Stable Nitrogen Isotopes during Hydrothermal Carbonization of Biomass. J. Anal. Appl. Pyrolysis 2018, 131, 85–92. [Google Scholar] [CrossRef]
  39. González-Arias, J.; Sánchez, M.E.; Cara-Jiménez, J.; Baena-Moreno, F.M.; Zhang, Z. Hydrothermal Carbonization of Biomass and Waste: A Review. Environ. Chem. Lett. 2022, 20, 211–221. [Google Scholar] [CrossRef]
  40. Lachos-Perez, D.; César Torres-Mayanga, P.; Abaide, E.R.; Zabot, G.L.; De Castilhos, F. Hydrothermal Carbonization and Liquefaction: Differences, Progress, Challenges, and Opportunities. Bioresour Technol. 2022, 343, 126084. [Google Scholar] [CrossRef] [PubMed]
  41. Petrović, J.; Ercegović, M.; Simić, M.; Koprivica, M.; Dimitrijević, J.; Jovanović, A.; Janković Pantić, J. Hydrothermal Carbonization of Waste Biomass: A Review of Hydrochar Preparation and Environmental Application. Processes 2024, 12, 207. [Google Scholar] [CrossRef]
Figure 1. Overall workflow relative to raw biomass processing and analysis before HTC treatment and product (hydrochar and process water) characterization. The blue lines refer to material flows (biomass, biochar and water). The orange lines concern data flows.
Processes 12 01673 g001
Figure 2. Hydrothermal carbonization test workflow. From above: sample (a), process water (b), and washing water (c) weighing; empty vessel (d), vessel filled with dry sample (e), vessel with biomass sample and process water (f); vessel loaded on the reactor (g) and fixed with flange and heating jacket (h); setting maximum treatment temperature and other parameters (i); opening of the system (j), recovery of liquid and solid fractions through washing with RO water (k), and separation of fractions with filter paper, Buchner funnel, and vacuum flask (l); storage of post-treatment process water and washing water (m) and recovery of treated sample after drying in an oven at 105 ± 2 °C (n,o).
Processes 12 01673 g002
Figure 3. Comparison between the three “raw” biomass samples tested (three images above, from the left: grape pomace, wood chips, and straw) and examples of the respective torrefied products (three images below).
Processes 12 01673 g003
Figure 4. Wheat straw ash loss at different temperatures and different WTBs.
Processes 12 01673 g004
Figure 5. Ash loss at different temperatures and WTB in wood chips (a) and in grape pomace (b).
Processes 12 01673 g005
Figure 6. Variation in LHV at different temperatures and different WTB ratios in WS.
Processes 12 01673 g006
Figure 7. Variation in LHV at different temperatures, WTB ratios, and times in wood chips (a) and grape pomace (b).
Processes 12 01673 g007
Figure 8. CHN elemental composition at different temperatures and WTB ratios in wheat straw’s hydrochar.
Processes 12 01673 g008
Figure 9. Elemental composition at different temperatures, WTB ratios, and residence times in wood chips’ hydrochar.
Processes 12 01673 g009
Figure 10. Elemental composition at different temperatures, WTB ratios, and residence times in grape pomace’s hydrochar.
Processes 12 01673 g010
Table 1. Operating conditions for WS, GP, and WC during HTC.
WS (6 Combinations)WC (12 Combinations)GP (12 Combinations)
T
(°C)
WTB
(mL/g)
Time (min)T
(°C)
WTB
(mL/g)
Time
(min)
T
(°C)
WTB
(mL/g)
Time
(min)
90301201301560701060
12560/1803012012020120
160//230//180//
Table 2. Average pressure (bar) at maximum treatment temperature (the value was determined by measuring the instantaneous pressure every 5 min during the entire residence time). Standard deviation is reported in brackets.
SampleWTB (mL/g)t (min)T (°C)P (bar)WTB (mL/g)t (min)T (°C)P (bar)
WS30 900.1 (0.1)60 900.3 (0.2)
1201251.2 (0.1)1201250.9 (0.1)
1604.4 (0.2) 1603.6 (0.4)
WC15 1301.2 (0.1)30 1301.3 (0.1)
601808.2 (1.3)601808.4 (1.1)
23023.3 (5.2) 23026.9 (1.0)
1301.3 (0.1) 1301.4 (0.1)
1201807.7 (0.8)1201808.7 (0.5)
23027.2 (0.5) 23027.1 (0.8)
GP10 700.0 (0.1)20 700.0 (0.1)
601200.8 (0.2)601200.7 (0.3)
1808.8 (0.5) 1808.8 (0.4)
700.0 (0.1) 700.0 (0.1)
1201200.9 (0.2)1201201.0 (0.2)
1809.0 (0.3) 1808.8 (0.6)
Table 3. Chemical, physical, and energy characterization of samples for preliminary tests (results are reported on a dry basis, or, for LHV, also as dry and ash-free).
Treated BiomassAsh (%)HHV (MJ/kg)LHV (MJ/kg)LHV (d.af) (MJ/kg)C (%)H (%)N (%)O (%)Mass (g)
Straw11.317.516.218.344.55.70.438.119.0
Treated straw9.619.718.520.550.65.60.433.910.3
Grape pomace9.820.719.521.650.45.91.931.919.3
Treated grape pomace2.326.825.526.263.66.21.426.610.6
Vine pruning3.319.318.018.749.45.70.840.818.3
Treated vine pruning1.522.821.622.056.65.60.635.69.9
Arundo donax chips4.119.217.918.849.15.90.540.418.9
Treated Arundo donax chips1.423.021.722.157.36.10.534.610.2
OFMSW solid digestate39.211.510.917.929.63.11.526.618.7
Treated OFMSW solid digestate46.910.49.818.528.02.80.721.513.2
Table 4. Mass, energy, and ash yield for preliminary HTC tests on various biomass types.
Treated BiomassMass Yield 1 %d.m.Energy Yield 2 %d.m.Ash Yield 3 %d.m.
Straw54.662.185.3
Grape pomace54.971.923.7
Vine pruning54.264.947.0
Arundo donax chips54.265.434.9
OFMSW solid digestate70.30.3119.7
Note: 1 Final solid product mass/starting biomass mass; 2 Total energy of the final solid product/total energy of the initial biomass; 3 Percentage of ash in the final solid product/percentage of ash in the initial biomass.
Table 5. Chemical characterization of process water for preliminary tests; all results are expressed as mg/L.
Treated BiomassStrawGrape PomaceVine PruningArundo donax ChipsOFMSW Solid Digestate
5-hydroxymethyl furfurol37963.36999097.3
Furfurol106552.3794150422.1
Total polyphenols (as (+)-catechin)138192813731318847
Meso-inositol7.1183.656.89.75.4
Levoglucosan + arabitol37.32.812.3470.8
Glycerol44.7379.135.532.220.7
Scillo-inositol0.67.111.40.40.9
Xylitol10.46.85.87.36.8
Erythritol2.75.61.410.60.2
Sorbitol12.515.65.341.1
Trehalose5.92.11.61.44.6
Mannitol52.1511.526.31.7
Galactose1.3<0.11.31.5<0.1
Xylose20.9<0.14.4<0.1
Glucose82.914.295.5182.42.3
Arabinose2.90.83.95.30.4
Table 6. Average mass and energetic yield table for each operating condition for wheat straw, wood chips, and grape pomace. Standard deviation is indicated in brackets.
SampleWTB (mL/g)t (min)T (°C)MY (%)EY (%)WTB (mL/g)t (min)T (°C)MY (%)EY (%)
WS30 9082.5 (0.3)83.9 (0.8)60 9083 (0.6)86.6 (2.7)
12012580.9 (1.0)81.8 (0.0)12012569.2 (14.6)70.8 (14.1)
16058.9 (1.1)61.8 (2.6) 16056.5 (0.6)59.1 (0.9)
WC15 13087.2 (6.0)86.7 (5.7)30 13089.4 (0.6)89.4 (0.7)
6018068.1 (1.4)71.6 (0.6)6018064.4 (0.3)67 (0.4)
23055.6 (1.4)65.1 (1.1) 23052.8 (1.0)59.9 (0.9)
13088.7 (0.1)89.2 (1.1) 13088.6 (0.1)88.8 (0.8)
12018066.8 (1.2)70.7 (0.0)12018062.9 (1.6)66.1 (1.7)
23050.5 (1.4)62.1 (0.8) 23045.5 (1.2)56 (0.8)
GP10 7077.4 (0.4)85.9 (1.0)20 7074.8 (1.2)81.5 (1.4)
6012070.9 (1.0)79.1 (1.6)6012068.1 (1.7)76.4 (2.3)
18060.6 (0.7)72.8 (1.2) 18057.2 (0.3)71.4 (2.9)
7076.8 (0.5)84.1 (2.4) 7076.5 (0.6)83.6 (0.5)
12012068.0 (2.9)76.2 (3.6)12012068.1 (1.6)75.3 (0.8)
18060.7 (0.6)74.1 (1.5) 18056.7 (0.4)69.1 (0.3)
Disclaimer/Publisher’s Note: The statements, opinions and data contained in all publications are solely those of the individual author(s) and contributor(s) and not of MDPI and/or the editor(s). MDPI and/or the editor(s) disclaim responsibility for any injury to people or property resulting from any ideas, methods, instructions or products referred to in the content.

