Article

Compensation Mechanism of Controllable Load Shifting during Peak-Down Period Based on Revenue Balance Method

1
School of Mechanical and Electrical Engineering, China University of Mining and Technology, Beijing 102206, China
2
Electric Power Research Institute, State Grid Gansu Electric Power Co., Lanzhou 730070, China
*
Author to whom correspondence should be addressed.
Processes 2024, 12(8), 1692; https://doi.org/10.3390/pr12081692
Submission received: 22 June 2024 / Revised: 8 August 2024 / Accepted: 9 August 2024 / Published: 13 August 2024

Abstract

:
With the large-scale integration of new energy, the obstruction of new energy consumption is prone to occur often during peak-down periods with a low load and high output of new energy. It is urgent to mobilize controllable load shifting through compensation mechanisms to achieve the goals of peak shaving, valley filling, and promotion of new energy consumption. This study constructs a framework of auxiliary service market and compensation mechanism for power shift between new energy power generation enterprises and controllable load enterprises. Secondly, aiming to achieve the principle of revenue balance between new energy power generation enterprises and controllable load enterprises, a quantity and price compensation model based on the particle swarm optimization algorithm is proposed. Then, under the principle of determining the compensation order of different controllable load enterprises through comprehensive evaluation and formulating differentiated compensation prices one by one, a compensation method and process for controllable load enterprises to shift have been established. Finally, through a case analysis, compensation prices for five types of controllable loads were formulated, with values ranging from 99.36 to 197.41 CNY/MWh. This increased the compensation for controllable loads on the basis of the original peak-valley price, verifying the feasibility of the method described in this study.

1. Introduction

The construction of a power grid, the development of conventional power sources, and the increase in load are relatively slow, resulting in the power system’s peak capacity having difficulties meeting the peak demand of large-scale new energy integration, especially during the peak-down period when the load is low and new energy generation is at its peak. In Gansu Province, for example, the maximum peak shaving capacity in 2022 was about 7300 MW, while the actual demand for peak shaving in the province was 8500–10,500 MW. At the end of the ‘14th Five-Year Plan’, Gansu’s installed new energy capacity is expected to reach 8000 MW, and there will be greater peak demand by then. With the continuous increase in new energy integration, the challenge of new energy consumption will further worsen [1]. Researching how to increase the wind power consumption capacity and ensure the active power balance of the grid during peak-down periods is crucial for optimizing new energy utilization. It is urgent to explore the adjustable potential of loads to enhance the consumption capacity of new energy.
Controllable load is characterized by its flexible operation mode and widespread spatial distribution [2]. This kind of load can adjust its power consumption and active period in a day according to the needs of peak shaving, shifting the power consumption of controllable load from the low generation period of new energy to the high generation period of new energy, so as to achieve the purpose of peak shaving and valley filling and promote new energy consumption [3,4]. Although the shift control of controllable load is technically feasible, additional operating costs will be generated during shift control. The existing time-of-use electricity price mechanism faces challenges in incentivizing controllable load to engage in shift control. It is urgent to study the incentive mechanism and method for controllable load shifting during peak-down period on this basis, so as to promote the enthusiasm and initiative of controllable load to participate in the consumption new energy.
More and more studies have begun to pay attention to the participation of controllable loads in power grid regulation and control, and play an active role in economic operation, wind and photovoltaic (PV) power consumption, peak shaving, and valley filling [5,6,7]. By constructing the optimal scheduling model of day-ahead and reserve markets, reference [8] proposed a method that involves constructing an optimized scheduling model for day-ahead and reserve markets to maximize grid revenue while increasing the overall revenue of controllable load users. Time-price elasticity coefficient is introduced in reference [9] to establish a demand response system model aiming at maximizing the comprehensive income of electricity retailer and customers. Reference [10] verified the scientific validity and effectiveness of the multi-objective optimization load distribution model for power grid with controllable load access. At present, price leverage [11,12] is often used to incentivize controllable load to change their way of consuming electricity. Reference [13] used NeuralBandit algorithm, which uses a neural network that learns the context and the associated reward to encourage the consumers to change their power consumption pattern. Reference [14] utilizes a long short-term memory (LSTM) neural network-based model for forecasting the electricity settlement price. Reference [15] presented a novel taxonomy for battery optimization and lower charging cost in a microgrid with renewable energy sources. The time-of-use electricity pricing strategy is formulated [16], and the day-ahead scheduling model is established [17]. Reference [18] proposed a peak shaving strategy of electric vehicle to use electricity to meet the goal for new energy consumption. Reference [19] proposed a co-optimization algorithm to find the minimum incentives that result in the renewable energy source penetration in energy supply chain and optimal distribution of power to achieve the maximum consumption. At present, the mechanism of controllable load participating in regulation and control needs further improvement in terms of policy and economics, and is still in the exploration stage. Therefore, studying the incentive mechanism and method of controllable load shifting during the peak-down period from the source-load side [20,21,22] is of urgent importance. In summary, when deciding price compensation for controllable loads, there are three major challenges: Firstly, when multiple controllable load enterprises participate in shift control simultaneously, determining the priority order is a challenge. Secondly, the demand for shifting varies across different time periods, making it challenging to adjust the compensation strategy according to the varying demand for new energy consumption at different times. Thirdly, the shifting costs of different controllable loads vary, and it is challenging to achieve fairness and differentiation in compensation prices in a many-to-one supply-demand market.
In response to these challenges, this study intends to design a framework of auxiliary service market and compensation mechanism for controllable loads to participate in shift control during the peak-down period. The specific content and innovations are as follows:
  • A comprehensive evaluation index that reflects the shiftable capacity and regulation costs has been established. The priority order for controllable loads to participate in shift control is determined based on this index.
  • Compensation is provided on a time-of-use basis, with adjustable penalties for abandoning wind or solar power. The compensation amount and price are adjusted according to the varying levels of obstruction at different times.
  • Controllable load enterprise engages in negotiations individually, so as to determine differentiated compensation prices. The equal revenue principle is utilized when the new energy generation enterprise negotiates with each controllable enterprises to ensure fairness.

2. Construction of Trading Market and Compensation Mechanism of Controllable Load Participating in Shift Control during Peak-Down Period

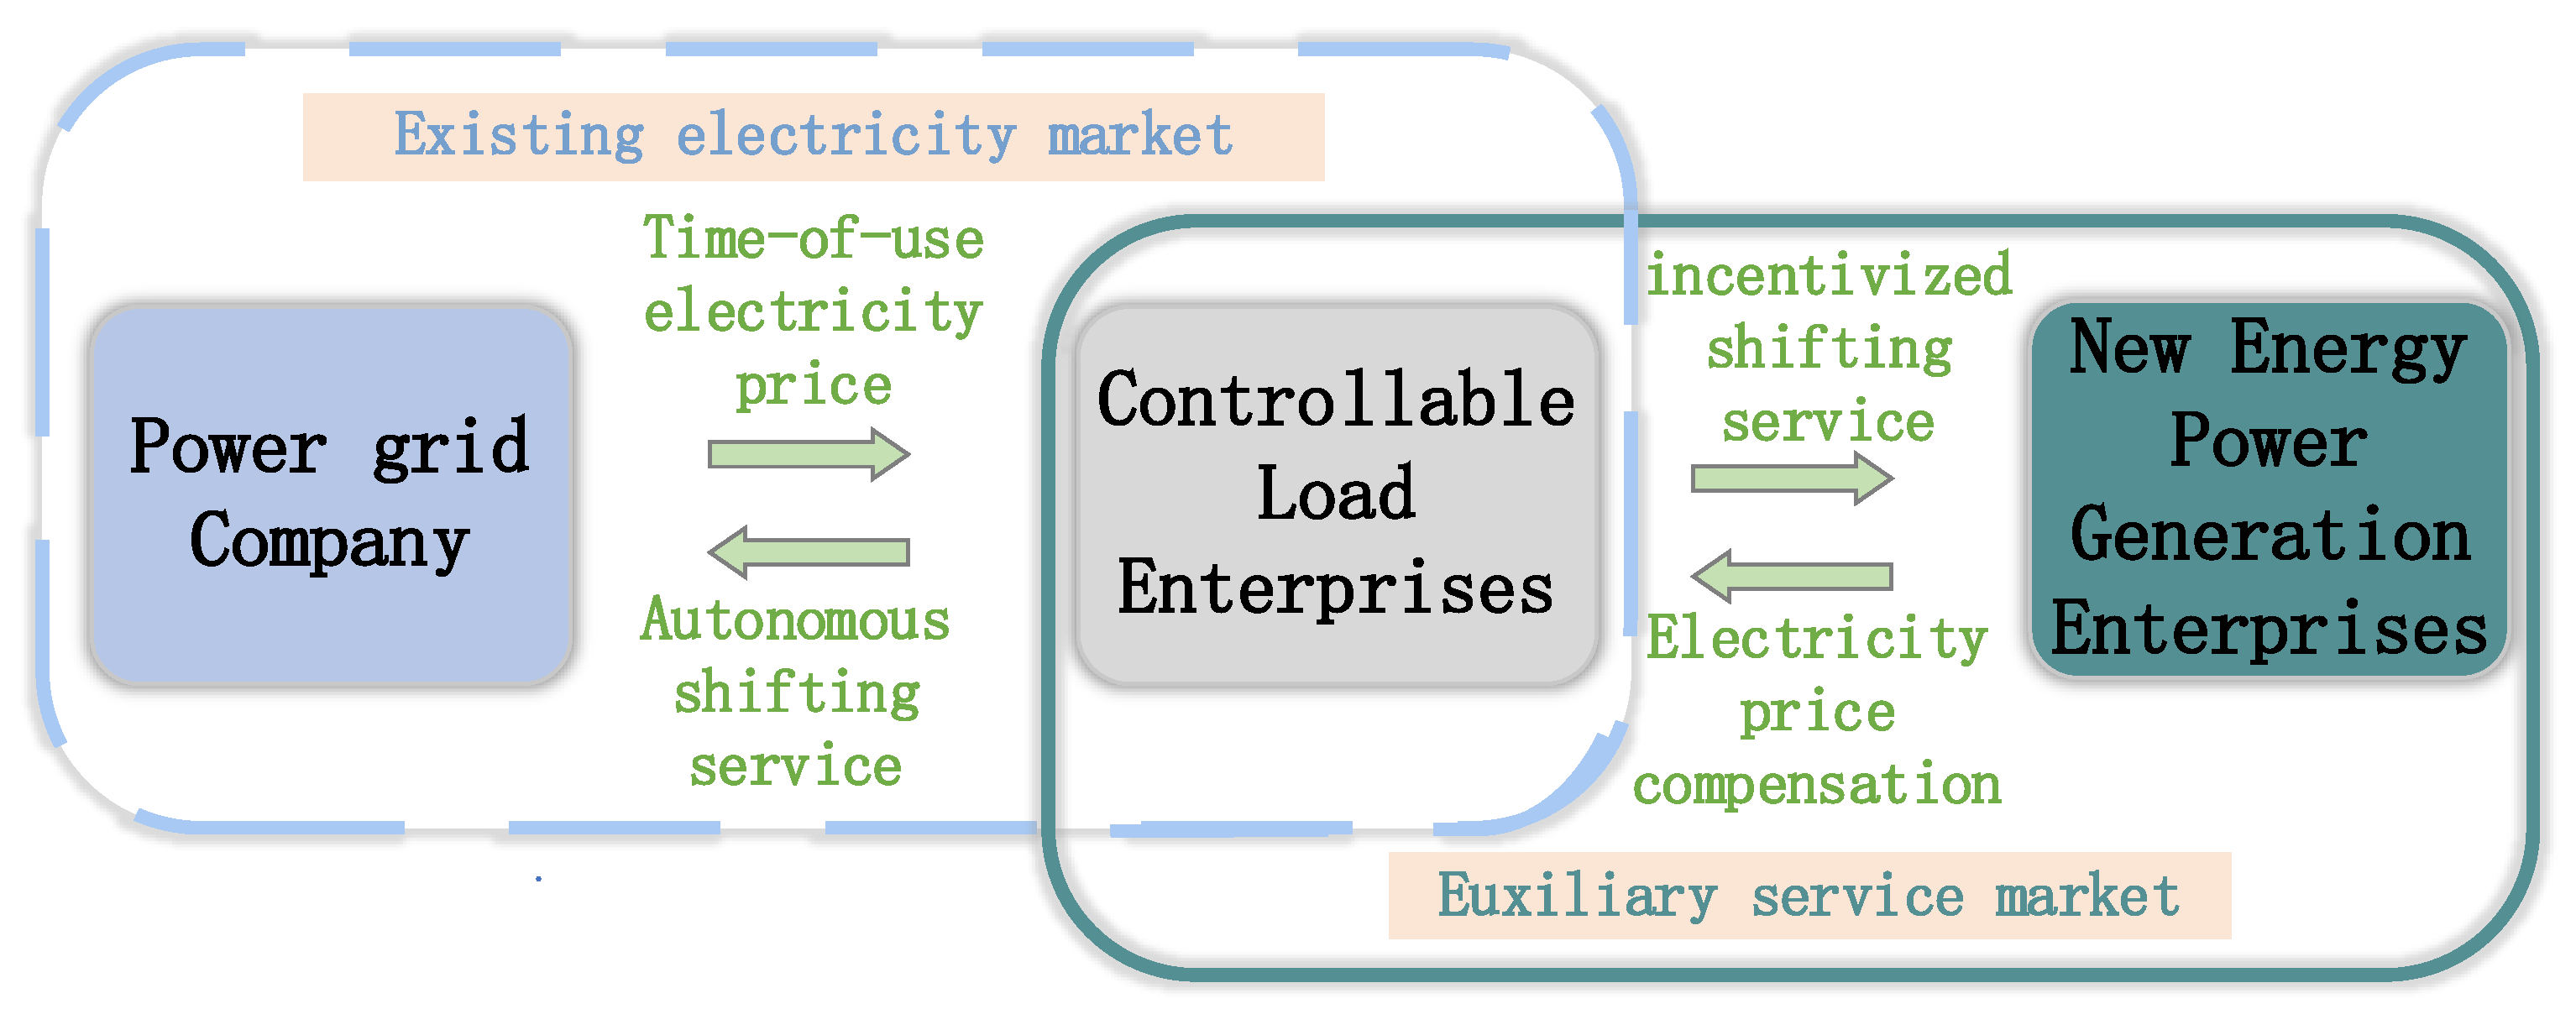
2.1. Design of Auxiliary Service Market

In order to incentivize the controllable load shifting, aiming to resolve the problem that the new energy consumption is blocked during the peak-down period, the auxiliary service market between the new energy power generation enterprise and the controllable load enterprise is designed, as shown in Figure 1.
As shown in Figure 1, in the existing electricity market, the power grid company provides price compensation to the controllable load enterprises participating in the shift control through the regulation of a time-of-use electricity price, playing a certain guiding role in the utilization of controllable loads. The auxiliary service market is designed on the basis of the existing electricity market. In the auxiliary market, controllable load enterprises act as service providers, while new energy power generation enterprises serve as the demand side. During the service process, new energy enterprises can sell excess electricity that was previously unavailable for consumption. This electricity is then utilized by controllable load enterprises. Therefore, new energy power generation enterprises are the main beneficiaries of the auxiliary market. Following the principle of reciprocal benefits, new energy power generation enterprises are to pay compensation price to controllable load enterprises.

2.2. Design of Compensation Mechanism Framework

When designing the compensation mechanism, the following principles are considered:
  • Equal revenue principle:
In the process of controllable load shifting, there is a trade-off between the new energy power generation enterprises and the controllable load enterprises about the compensation price. Adhering to the principle of fairness, this study formulates the compensation price based on minimizing the difference between new energy power generation enterprises and controllable load enterprises. The common method nowadays is to maximize the total revenue of new energy power generation enterprises and controllable load enterprises, which may lead to an unequal distribution of revenue between the supply and demand sides. Therefore, this study adopts the principle of equal revenue.
2.
Non-uniform compensation principle:
Considering the different shift costs of different types of controllable loads, the time period, and the amount of electricity that can be shifted may also differ, controllable load enterprises will bargain with the new energy enterprises one by one. As shown in Figure 2, according to the recent consumption blocking situation of electricity generated by new energy enterprises on the next day, the controllable load enterprises submit the parameters of available shiftable load, and negotiate one by one with the new energy enterprises according to the principle of equal revenue. Then, the price compensation and shifted load for each controllable load enterprise can be decided through the optimization algorithms.
3.
The principle of determining the compensation order through comprehensive evaluation:
In the bargaining process, the controllable loads’ bargaining order will affect the bargaining result. It is necessary to comprehensively consider factors such as shiftable time period and shifting cost of the controllable load, so as to determine a proper bargaining order. The bargaining order is heavily influenced by the quantity and cost of the shifted load, in order to comprehensively consider the shiftable period and shift cost, a comprehensive index is introduced y i , and orderly bargaining will be performed according to the value of the comprehensive index.

3. Calculation Model for Compensation Quantity and Price

3.1. Objective Function
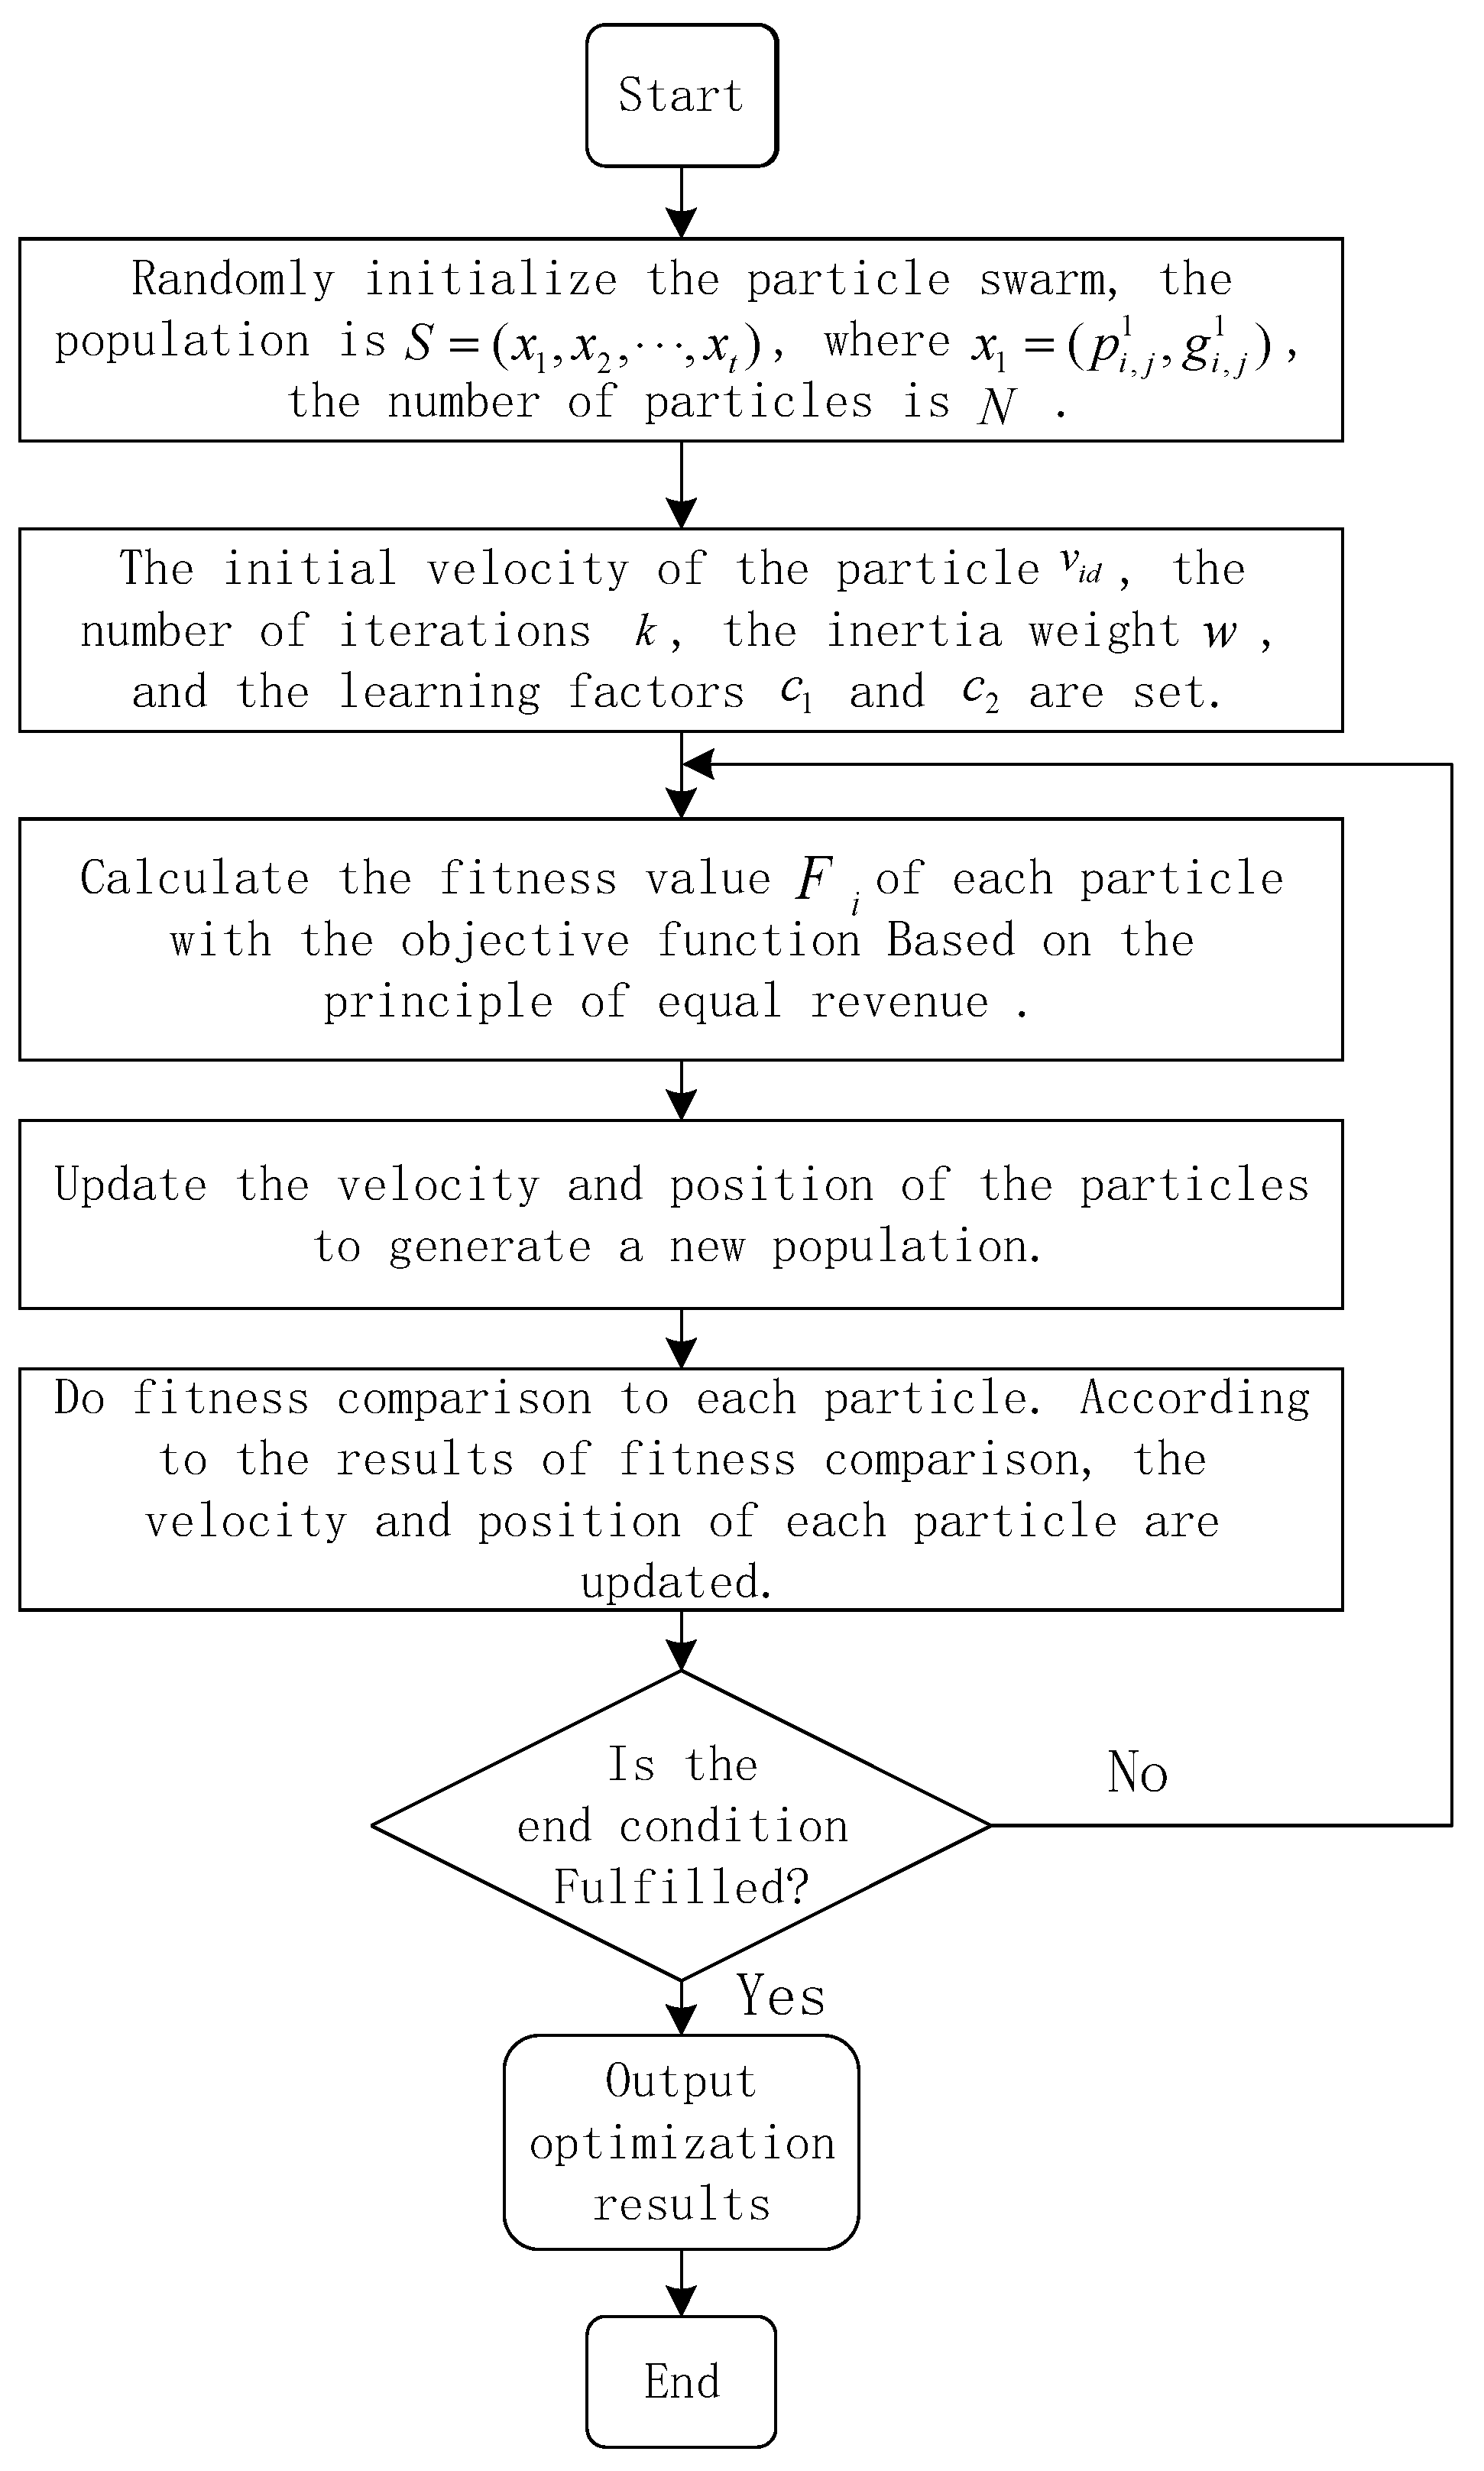
According to the equal revenue principle, this study establishes a compensation price optimization model, and aims to minimize the absolute value of the revenue difference between the new energy power generation enterprises and the controllable load enterprises. The objective function is represented by Equation (1).
F = min | F n e w F l o a d |
The revenue of controllable load enterprises is calculated as follows.
F l o a d = Δ P × Δ T × ( e a e b + e 0 ) C R C
C R C = C l × n p e × Δ T + ( C E + C M ) Δ P × Δ T
In Equations (2) and (3), e a is the time-of-use electricity price for controllable load enterprises during the shiftable period if they do not participate in shift control, e b is the time-of-use electricity price when they participate in the shifting, e a e b is the price difference compensation of the power grid company to the controllable load enterprises, and e 0 is the compensation price from new energy generation enterprises to controllable load enterprises of the controllable load shifting. C R C is the cost of controllable load enterprises in order to adjust and schedule the controllable loads in the scheduling period Δ T , C l is the unit labor cost, n p e is the amount of additional labor required by the controllable load enterprises to perform load shifting, C E is the unit energy consumption cost of the controllable load, C M is the unit material cost of for controllable loads shifting, and Δ P is the shiftable capacity in the period Δ T .
The revenue of new energy power generation enterprises F n e w is calculated as follows:
F n e w = ( e n e 0 ) × Δ P × Δ T + λ Δ P × Δ T C n e w × Δ P × Δ T C R C
In Equation (4), e n is the on-grid electricity price for new energy power generation enterprises in the shift period, C n e w is the power generation cost per unit time, λ is the penalty coefficient of wind and solar energy curtailment, and λ Δ P Δ T is the equivalent benefit of avoiding penalty.
Electric energy is a commodity, and its trading volume will fluctuate with the price, which is different from the demand price elasticity coefficient, which indicates the sensitivity of electricity consumption to price. In this study, the supply price elasticity refers to the sensitivity of the amount of shifted power to the change in compensation price, as shown in Equation (5).
ε = Δ E / E Δ e / e
In the formula, E and e are electricity quantity and electricity price, and Δ E and Δ e are the relative increments of E and e .

3.2. Model Solution

The quantity and price compensation model this study aims to establish is a nonlinear model, which is commonly solved by algorithms such as particle swarm optimization. Inspired by the foraging behavior of birds, Eberhart and Kennedy proposed particle swarm optimization (PSO) in 1995. The core formula is shown as Equations (6) and (7):
v i d k + 1 = ω v i d k + c 1 r 1 ( P i d x i d ) + c 2 r 2 ( G i d x i d )
x i d k + 1 = x i d k + v i d k
In the formulas above, ω is the inertia weight; c 1 and c 2 are random numbers between [0, 1]; r 1 and r 2 are the velocity and position of particle i in dimension d ; and P i d and G i d are the individual extremum and group extremum of particle i in dimension d . k is the number of iterations. The steps are as follows:
Step 1: Set the number of particles to N. Initialize the particle swarm, the motion range of the compensation price parameter particle i, the learning factors c 1 and c 2 , and the maximum evolution algebra G ; and the random position x i d and speed v i d are set in this step.
Step 2: Calculate the particle fitness value F (that is, the objective function of the calculation model for compensation quantity and price) to obtain the individual extreme value P i d and the group extreme value G i d . Then, record the position of each particle and the corresponding fitness value.
Step 3: Update the velocity and position of the particles to generate a new population.
Step 4: For each particle, compare its current fitness value with the fitness value corresponding to its individual historical best position P best . If the current fitness value is lower, the value of P b e s t will be set as the current fitness value. Otherwise, no change will be made to the value of P b e s t .
Step 5: For each particle, compare its current fitness value with the fitness value corresponding to the global optimal position G b e s t . If the current fitness value is lower, the value of G b e s t will be set as the current fitness value. Otherwise, no change will be made to the value of G b e s t .
Step 6: Update the velocity and position of each particle according to the formula. If the end condition is not met, step 2 is returned until the maximum number of cycles is reached. Output the optimization results, including the absolute value of the profit difference between the controllable load enterprises and the new energy power generation enterprises, the compensation price, and the shift quantity of the controllable load enterprises. This algorithm can be applied to solve the compensation price for each time period one by one.
According to the steps above, the model solving flow chart is show as in Figure 3.

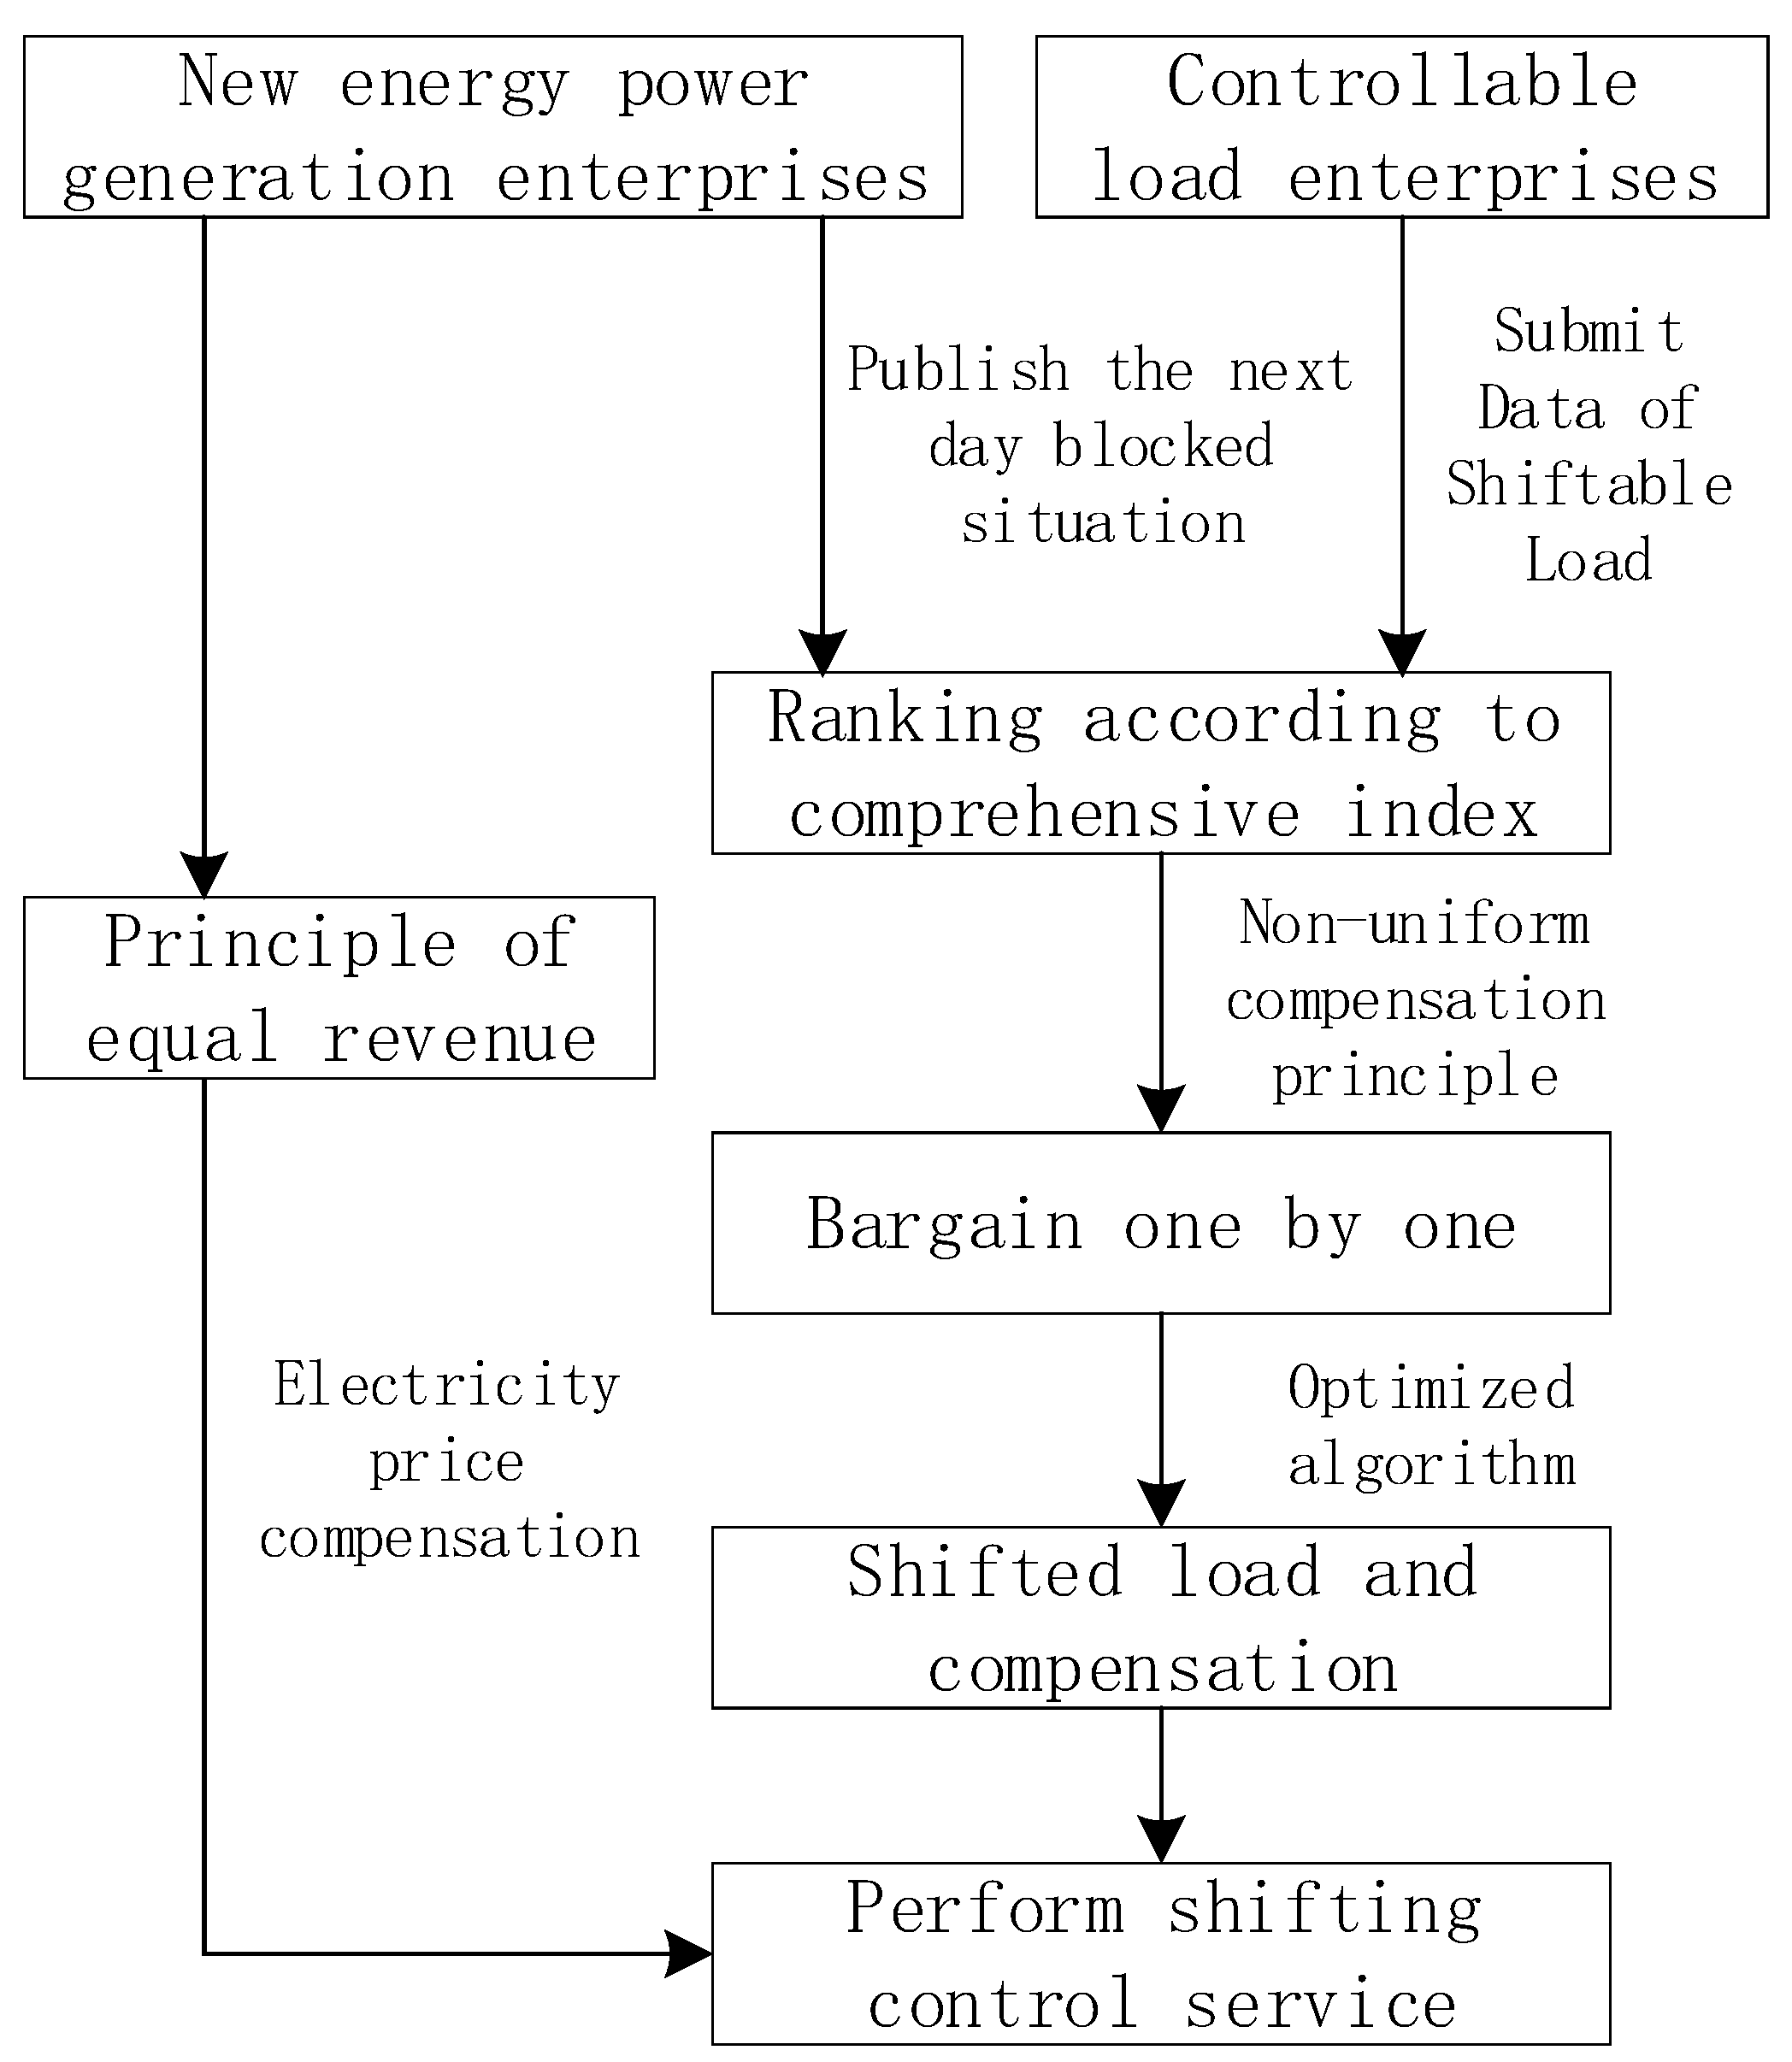
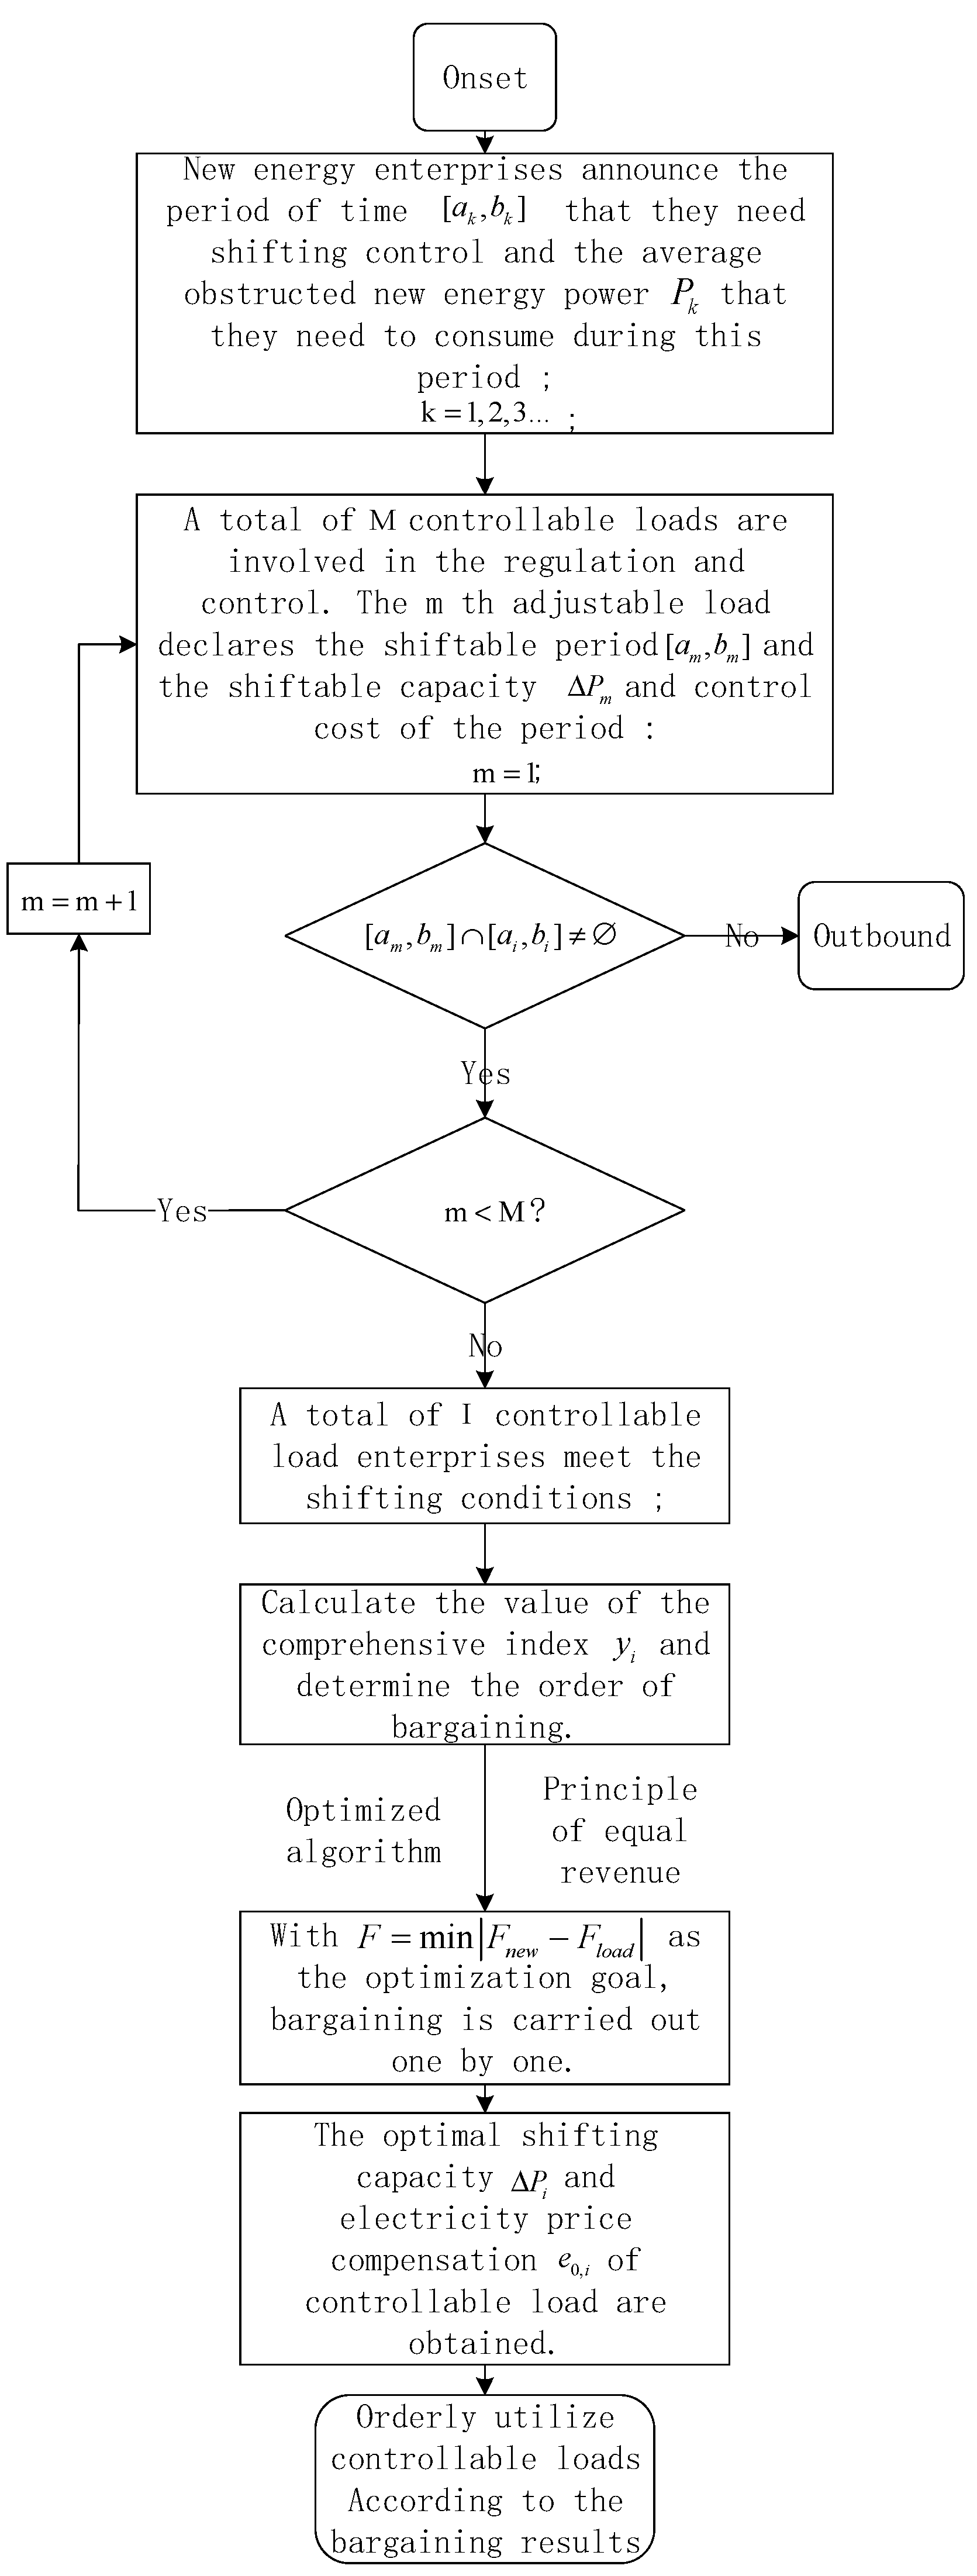
4. Controllable Load Shifting Control Compensation Method

Step 1: Publish the next day’s new energy consumption obstruction, which also is the demand for load shifting. On the previous day, new energy enterprises announce the period [ a k , b k ] they need to shift and the average amount of load that needs to be shifted during this period.
Step 2: Submit the controllable load. The mth controllable load enterprises submit its shiftable period [ a m , b m ] , shiftable capacity Δ P m in this period, unit labor cost C l and unit energy consumption cost C E . If [ a m , b m ] [ a i , b i ] , proceed on to step 3, otherwise the mth enterprise is out.
Step 3: Determine the bargaining order. The order of controllable load shifting is important, and it is necessary to consider the shiftable time period and shift cost. The shiftable capacity of the ith controllable load is Δ E i , the control cost is C T R , i , and the standardized comprehensive index y i is shown in Equation (8). The comprehensive index y i of each shiftable load is calculated and sequenced in the descending order, and the enterprises get to bargain in the corresponding order.
y i = β Δ E i Δ E i , max + ( 1 β ) 1 / C T R , i 1 / C T R , i , m i n
In the formula, β is the weight coefficient.
Step 4: Bargain one by one. In the initial setting of i = 1 , the ith shiftable load is bargained on the principle of equal revenue between new energy and controllable load enterprise. Through the particle swarm optimization algorithm, the optimal shift capacity and price compensation for the ith shiftable load enterprise are obtained. Then, i = i + 1 , and the bargaining process above will be repeated until the trading quantity and price of each shiftable load are formulated.
Step 5: Conduct shifting and settle compensation. New energy enterprises will notify the controllable load for shifting service n hours before the call. Controllable load must execute on time, and the compensation cost can be cleared daily and settled monthly.
The process is shown as in Figure 4.

5. Example Analysis

5.1. Parameter Settings

The installed capacity of wind power in a regional power grid is 23,215 MW. Considering the regulation constraint characteristics of controllable load, the regulation step size will be set to 4 h, and the data of new energy are shown in Table 1.
The peak and valley time division and tariff of electricity consumption of controllable load in the region are shown in Table 2. The base price for electricity consumption before the implementation of time-of-use electricity price is 546.9 CNY/MWh, the base supply price elasticity coefficient of shifting users from the peak time to the valley time is 0.92, and the base supply price elasticity coefficient of shifting users from the peak time to the usual time is 0.36. The average power consumption obstruction of new energy power generation enterprises that need to be consumed is Δ P m ; when Δ P m < 100 MW, the penalty coefficient of wind and solar energy curtailment is λ = 400 CNY/MWh; when 100 Δ P m < 500 MW, the penalty coefficient of wind and solar energy curtailment is λ = 400 × 1.2 = 480 CNY/MWh; and when Δ P m > 500 MW, the penalty coefficient of wind and solar energy curtailment is λ = 400 × 1.5 = 600 CNY/MWh. Meanwhile, the on-grid electricity price of new energy power e n is 0.28 CNY/kWh, the cost of power generation per unit time C n e w is 190 CNY/MWh, and n = 5 h. This study takes the controllable loads on 1 kV voltage level as an example, and when other voltage levels are involved in this method, adjustments of base price should be made according to the regulations.

5.2. Load Submission

In the day-ahead market, according to the data released by new energy enterprises, controllable load enterprises have sufficient time to make production plans in advance, rationally plan their electricity consumption, and declare shiftable capacity and shiftable time range, as shown in Table 3:

5.3. Bargaining One by One

According to the shifting cost and shiftable capacity submitted by the controllable load enterprise, the comprehensive index is calculated. As shown in Table 4, β = 0.5 , and according to the time sequence and to the comprehensive index, from large to small, the price is negotiated orderly one by one in each time period.

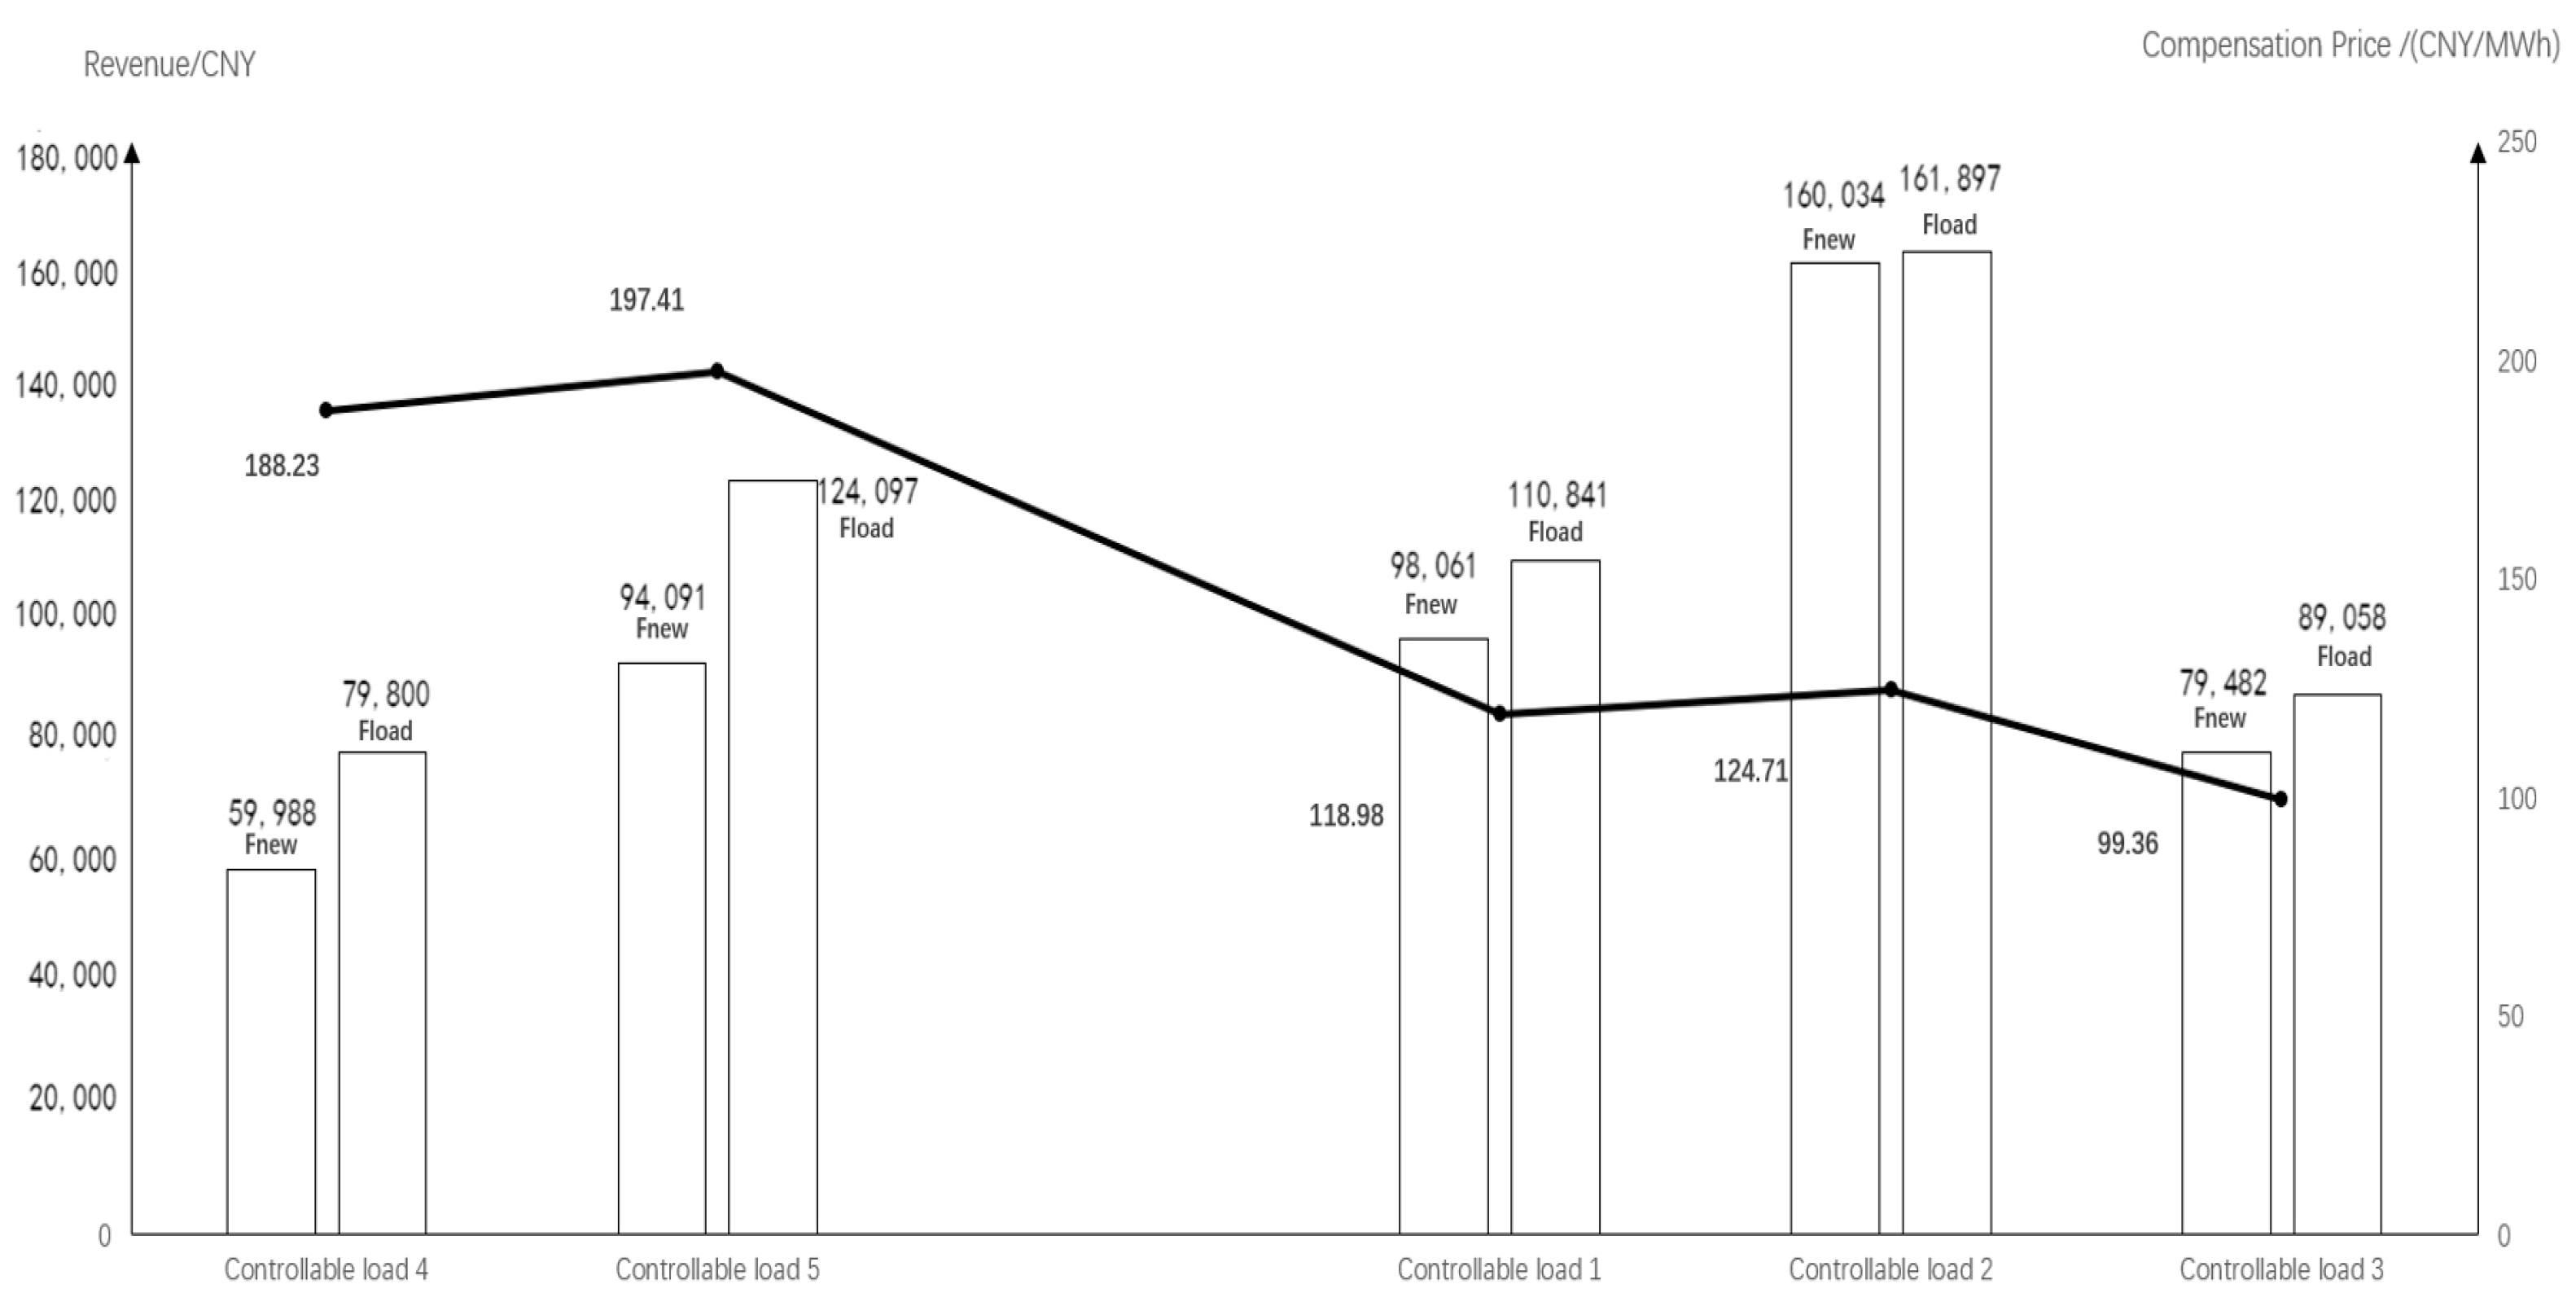
5.4. Bargaining Results

The particle swarm optimization algorithm is used to solve the model. The solution results are as shown in Table 5. During the period of 0:00–2:00, the average obstructed power needed to be consumed is greater than 500 MW before controllable load 5 participates in the shift control, and the penalty coefficient is 0.6. However, in the bargaining process, the average obstructed power needed to be consumed changed from greater than 500 MW to less than 500 MW, where the penalty coefficient is 0.48. Combining the two penalty coefficients, the average compensation price is taken as the compensation price at this time. The average obstructed power needed to be consumed during the bargaining process of controllable load 4 is less than 500 MW, and the penalty coefficient is 0.48; similarly, during the period of 2: 00–4: 00, the average obstructed power that is needed to be consumed by controllable load 2 is greater than 500 MW, and the penalty coefficient is 0.6. The average power to be consumed by the controllable load 1 before it participates in the bargaining is greater than 500 MW, and the penalty coefficient is 0.6. However, during the bargaining process, the average obstructed power to be consumed by controllable load 2 decreased from greater than 500 MW to less than 500 MW, and the penalty coefficient is 0.48. Combine the two penalty coefficients together, the compensation price at this time will be taken as the average compensation price, and the average obstructed power to be consumed by controllable load 3 is less than 500 MW, and the penalty coefficient is 0.48.
Based on the calculation results, draw compensation effect diagrams for different time periods as shown in Figure 5 and Figure 6.
According to the model solution of the example, after the controllable load participate in the shifting, the reduced obstructed power during the period of 0:00–2:00 is as follows:
270 × 2 − 239.65 − 157.13 = 143.18(MWh)
The reduced obstructed power during the period of 2:00–4:00 is as follows:
430 × 2 − 283.1 − 196.9 − 168.8 = 211.2(MWh)
The peak-valley time-of-use price compensation is 244 CNY/MWh and 488 CNY/MWh. The price compensation of controllable load enterprises participating in shift control is between 99.36 CNY/MWh and 197.41 CNY/MWh, which is an order of magnitude with the peak-valley price difference compensation, and has a great influence on the enthusiasm of controllable load enterprises shifting.
According to the bargaining results, new energy enterprises will notify the controllable load for shifting service 5 h before the call. The controllable load needs to perform the shift on time, and the electricity price compensation can be cleared daily and settled monthly.

6. Conclusions

In view of the obstruction of new energy consumption during the peak-down period of new energy power generation, this study proposes a compensation mechanism and method for controllable load enterprises to participate in shift control, so as to achieve peak shaving and valley filling, thus promoting new energy consumption.
Based on the compensation mechanism framework designed in this study, firstly, the principle of equal revenue is used to determine the electricity price compensation and shifting quantity of controllable load enterprises. Secondly, the bargaining order is determined according to the shiftable power and control cost of controllable load enterprises. The procedures above will maximize the fairness of the mechanism.
The example shows that the compensation mechanism of shift control provided by controllable load enterprises can effectively reduce the degree of obstruction of new energy consumption. On the basis of the conventional time-of-use electricity price mechanism, the new energy power generation enterprises and the controllable load enterprises can establish a direct electricity price compensation channel, so that the two sides can balance the revenue, increase the compensation for the controllable load enterprises, and promote the enthusiasm and initiative of the controllable load enterprises for shifting. In the future, a compensation price for controllable load can be formulated based on game theory.

Author Contributions

Conceptualization, Y.L. (Yalong Li) and W.D.; methodology, Y.L. (Yalong Li), W.D., and C.L.; validation, W.D. and C.L.; investigation, Y.L. (Yaxin Li); resources, Y.L. (Yaxin Li) and C.L.; data curation, Y.X.; writing—original draft preparation, Y.L. (Yalong Li) and W.D.; writing—review and editing, W.D., Y.X. and Y.L. (Yalong Li); All authors have read and agreed to the published version of the manuscript.

Funding

This research was funded by the technology projects at the headquarters of State Grid Corporation under grant number 52272223003C.

Data Availability Statement

The data presented in this research are available in this article.

Conflicts of Interest

Authors Chen Liang and Yaxin Li were employed by the company State Grid Gansu Electric Power Co. The remaining authors declare that the research was conducted in the absence of any commercial or financial relationship that could be construed as a potential conflict of interest.

References

  1. Han, X.; Chen, X.; McElroy, M.B.; Liao, S.; Nielsen, C.P.; Wen, J. Modeling Formulation and Validation for Accelerated Simulation and Flexibility Assessment on Large Scale Power Systems under Higher Renewable Penetrations. Appl. Energy 2019, 237, 145–154. [Google Scholar] [CrossRef]
  2. Cheng, D.; Zhang, W.; Liu, Y. Aggregate Modeling and Analysis of Air Conditioning Load Using Coupled Fokker–Planck Equations. J. Mod. Power Syst. Clean Energy 2018, 6, 1277–1290. [Google Scholar] [CrossRef]
  3. Avramidis, I.I.; Capitanescu, F.; Deconinck, G. Practical Approximations and Heuristic Approaches for Managing Shiftable Loads in the Multi-Period Optimal Power Flow Framework. Electr. Power Syst. Res. 2021, 190, 106864. [Google Scholar] [CrossRef]
  4. Golpîra, H.; Bahramara, S. Internet-of-Things-Based Optimal Smart City Energy Management Considering Shiftable Loads and Energy Storage. J. Clean. Prod. 2020, 264, 121620. [Google Scholar] [CrossRef]
  5. Anwar, M.B.; Qazi, H.W.; Burke, D.J.; Riaz, M.Y.; Hameed, R.; Fang, H. Harnessing the Flexibility of Demand-Side Resources. IEEE Trans. Smart Grid 2019, 10, 4151–4163. [Google Scholar] [CrossRef]
  6. Azeem, M.; Malik, T.N.; Muqeet, H.A.; Hussain, M.M.; Ali, A.; Khan, B.; Rehman, A.U. Combined Economic Emission Dispatch in Presence of Renewable Energy Resources Using CISSA in a Smart Grid Environment. Electronics 2023, 12, 715. [Google Scholar] [CrossRef]
  7. Palma, A.L.; Notte, L.L.; Landi, G.; Pietra, B.D. Application of a demand-response-optimized electrical load profile to a plant supplying an energy micro-community. In Proceedings of the 2022 Workshop on Blockchain for Renewables Integration (BLORIN), Palermo, Italy, 2–3 September 2022; pp. 97–101. Available online: https://ieeexplore.ieee.org/document/10028501 (accessed on 1 August 2024).
  8. Alahyari, A.; Ehsan, M.; Mousavizadeh, M.S. A Hybrid Storage-Wind Virtual Power Plant (VPP) Participation in the Electricity Markets: A Self-Scheduling Optimization Considering Price, Renewable Generation, and Electric Vehicles Uncertainties. J. Energy Storage 2019, 25, 100812. [Google Scholar] [CrossRef]
  9. Liu, G.; Yang, D.; Li, B. Demand Response Dynamic Pricing and Economic Scheduling Considering Energy Consumption Characteristics. In Proceedings of the 2022 Asian Conference on Frontiers of Power and Energy (ACFPE), Chengdu, China, 21–23 October 2022. [Google Scholar] [CrossRef]
  10. Lu, X.; Zhou, K.; Yang, S.; Wang, C.; Chen, Y. Multi-Objective Optimal Load Dispatch of Microgrid with Stochastic Access of Electric Vehicles. J. Clean. Prod. 2018, 195, 187–199. [Google Scholar] [CrossRef]
  11. Huang, Y.; Ip, R.K.F.; Gao, F. Optimization Model on Peak-Valley Time Electricity Consumption. In Proceedings of the IEEE International Conference on Industrial Engineering and Engineering Management (IEEM), Macao, China, 15–18 December 2019. [Google Scholar] [CrossRef]
  12. Majidi, M.; Mohammadi-Ivatloo, B.; Anvari-Moghaddam, A. Optimal Robust Operation of Combined Heat and Power Systems with Demand Response Programs. Appl. Therm. Eng. 2019, 149, 1359–1369. [Google Scholar] [CrossRef]
  13. Bagherpour, R.; Mozayani, N.; Badnava, B. Optimizing Dynamic Pricing Demand Response Algorithm Using Reinforcement Learning in Smart Grid. In Proceedings of the 2020 25th International Computer Conference, Computer Society of Iran (CSICC), Tehran, Iran, 1–2 January 2020. [Google Scholar] [CrossRef]
  14. Gaber, I.; Ibrahim, R. Hourly Electricity Price Prediction Applying Deep Learning for Electricity Market Management. In Proceedings of the 2023 IEEE International Conference on Environment and Electrical Engineering and 2023 IEEE Industrial and Commercial Power Systems Europe (EEEIC/I&CPS Europe), Madrid, Spain, 6–9 June 2023; pp. 1–5. [Google Scholar] [CrossRef]
  15. Colucci, R.; Mahgou, I.; Al-Najada, H.; Mahgoub, I. Survey of Strategies to Optimize Battery Operation to Minimize the Electricity Cost in a Microgrid with Renewable Energy Sources and Electric Vehicles. IEEE Access 2024, 12, 8246–8261. [Google Scholar] [CrossRef]
  16. Karn, H.; Kumari, S.; Varshney, L.; Garg, L. Energy Management Strategy for Prosumers under Time of Use Pricing. In Proceedings of the 2020 IEEE International Students’ Conference on Electrical, Electronics and Computer Science (SCEECS), Bhopal, India, 22–23 February 2020. [Google Scholar]
  17. Dong, J.; Nie, S.; Huang, H.; Yang, P.; Fu, A.; Lin, J. Research on Economic Operation Strategy of CHP Microgrid Considering Renewable Energy Sources and Integrated Energy Demand Response. Sustainability 2019, 11, 4825. [Google Scholar] [CrossRef]
  18. Zhu, Y.; Xu, Q.; Liu, V. Peak Shaving Strategy of Electric Vehicle in Industrial Park Considering Differentiated Subjective Willingness. In Proceedings of the 2024 IEEE 7th International Electrical and Energy Conference (CIEEC), Harbin, China, 10–12 May 2024; pp. 4004–4009. [Google Scholar] [CrossRef]
  19. Zalzar, S.; Bompard, E.F. An Incentive-Based Settlement Mechanism for Participation of Flexible Demands in Day-Ahead Markets. In Proceedings of the 2019 International Conference on Smart Energy Systems and Technologies (SEST), Porto, Portugal, 9–11 September 2019. [Google Scholar] [CrossRef]
  20. Muhssin, M.T.; Cipcigan, L.M.; Sami, S.S.; Flynn, D.; Abeysekera, M. Potential of Demand Side Response Aggregation for the Stabilization of the Grid’s Frequency. Appl. Energy 2018, 220, 643–656. [Google Scholar] [CrossRef]
  21. Liu, L.; Zhang, J.; He, L.; Jiang, Q.; Hu, Y. Ancillary Market Mechanism for Load Participation in Peak Load Shifting of Power System with High Penetration of Renewable Energy. In Proceedings of the 2022 IEEE International Conference on Energy Internet (ICEI), Stavanger, Norway, 28–29 December 2022. [Google Scholar] [CrossRef]
  22. Sheng, M.; Gao, H. Peaking Control Strategy of Stackelberg Game for Buildings Based on Cluster Classification Incentive. In Proceedings of the 2023 China Automation Congress (CAC), Chongqing, China, 17–19 November 2023; pp. 4662–4667. [Google Scholar] [CrossRef]
Figure 1. Diagram of auxiliary service market for controllable load shifting during peak-down period.
Processes 12 01692 g001
Figure 2. Compensation mechanism framework.
Processes 12 01692 g002
Figure 3. Model solving flow chart.
Processes 12 01692 g003
Figure 4. Overall flow chart.
Processes 12 01692 g004
Figure 5. Schematic diagram of compensation effect.
Processes 12 01692 g005
Figure 6. Schematic diagram of compensation price and revenue.
Processes 12 01692 g006
Table 1. Data of the new energy consumption obstruction the next day.
The Obstruction Period That Needs Load ShiftingThe Average Obstructed Power That Needs to Be Absorbed (MW)
0:00–2:00270
2:00–4:00430
Table 2. Peak-valley time price division table.
Period CharacteristicsTime PeriodElectricity Price (CNY/MWh)
Peak hours7:00–9:00, 18:00–24:00744
Usual hoursTime other than peak hours and valley hours500
Valley hours2:00–4:00, 11:00–17:00256
Table 3. Controllable load submission information.
Controllable Load EnterprisesShiftable PeriodShiftable Capacity (MW)Unit Labor Cost (CNY/h)Labor QuantityUnit Energy Consumption Cost (CNY/MWh)Material Cost (CNY/MWh)
Controllable load17:00–9:00→2:00–4:00250500345200
Controllable load27:00–9:00→2:00–4:00350300340150
Controllable load37:00–9:00→2:00–4:00200700664300
Controllable load47:00–9:00→0:00–2:00180600325200
Controllable load57:00–9:00→0:00–2:00300300320150
Table 4. Bargaining order.
Controllable Load EnterprisesShifting PeriodShiftable Power IndexShift Control Cost IndexComprehensive Index
Controllable load 50:00–2:0010.8150.907
Controllable load 40:00–2:000.610.8
Controllable load 22:00–4:0010.9310.966
Controllable load 12:00–4:000.71400.857
Controllable load 32:00–4:000.5710.8150.693
Table 5. Solution results of compensation price model.
Controllable Load EnterprisesFnew/CNYFload/CNYF/CNYCompensation Price/(CNY/MWh)Electricity Price after Compensation (CNY/MWh)Shifted Electricity/MWh
Controllable load 594,091124,09730,006197.41302.59239.65
Controllable load 459,98879,40019,412188.23311.77157.13
Controllable load 2160,034161,8971863124.71131.29283.1
Controllable load 198,061110,84112,780118.98137.02196.96
Controllable load 379,48289,058957799.36156.64168.88
Disclaimer/Publisher’s Note: The statements, opinions and data contained in all publications are solely those of the individual author(s) and contributor(s) and not of MDPI and/or the editor(s). MDPI and/or the editor(s) disclaim responsibility for any injury to people or property resulting from any ideas, methods, instructions or products referred to in the content.

