Article

Flow and Heat Transfer of Shale Oil Reservoir during CO2 Enhanced Pyrolysis: A Pore-Scale Modeling

1
PetroChina Research Institute of Petroleum Exploration and Development, Beijing 100083, China
2
College of Petroleum Engineering, China University of Petroleum (Beijing), Beijing 102249, China
*
Author to whom correspondence should be addressed.
Processes 2024, 12(8), 1694; https://doi.org/10.3390/pr12081694
Submission received: 30 June 2024 / Revised: 23 July 2024 / Accepted: 24 July 2024 / Published: 13 August 2024
(This article belongs to the Special Issue Advanced Fracturing Technology for Oil and Gas Reservoir Stimulation)

Abstract

:
This study extensively investigates the influence of different pyrolysis temperatures and organic matter contents on the fluid flow and heat transfer properties in oil shale samples. Utilizing CT images to generate three-dimensional digital rock, coupled simulations of CO 2 flow and heat transfer were conducted, analyzing parameters such as velocity fields, permeability, temperature fields, average temperatures, and heat transfer coefficients. The results reveal that, for relatively homogeneous oil shale samples, the permeability exhibits a monotonous increase with rising pyrolysis temperature. While the effect of pyrolysis temperature on the distribution characteristics of velocity and temperature fields is minimal, it significantly impacts the heat transfer coefficients. Specifically, the heat transfer coefficients increase significantly in the direction perpendicular to the bedding plane, while they decrease or remain unchanged parallel to it. Additionally, the organic matter content significantly influences the fluid flow and heat transfer properties of shale samples. After undergoing heat treatment, the heterogeneity of pore structures in shale samples varies significantly, affecting the characteristics of fluid flow and heat transfer. The influence of organic matter content and pyrolysis temperature on fluid flow and heat transfer in shale primarily stems from the effect of organic matter pyrolysis on the original pore structure. The development and connectivity of pore networks are closely related to the distribution characteristics of the original organic matter and are not directly correlated with the organic matter content. These findings provide essential theoretical guidance and technical support for the development and utilization of oil shale resources, while also offering valuable references and insights for future research.

1. Introduction

In the field of oil and gas exploration and development, China has achieved a leap from conventional to unconventional oil and gas, with unconventional oil and gas accounting for 41% of the country’s cumulative proven oil and gas reserves [1,2,3,4]. Unconventional oil and gas are important strategic replacement resources for China. Oil shale, as a typical unconventional oil and gas resource, has low oil and gas maturity. Its development and utilization must rely on high temperatures to mature and crack the kerogen within the rock, thereby producing extractable oil and gas [5]. China is rich in oil shale resources, which are relatively concentrated in distribution. According to geological survey data, China’s proven oil shale reserves are approximately 972.32 billion tons [6,7]. Therefore, accelerating the efficient development and utilization of oil shale resources has significant political and economic implications for meeting China’s energy needs, optimizing its energy structure, and ensuring energy security.
Fluid flow and heat transfer are two closely related physical processes during the pyrolysis of oil shale [8]. Fluid flow not only dictates mass transport within oil shale but also influences the distribution and yield of reaction products. Simultaneously, heat transfer directly affects the rate and efficiency of pyrolysis reactions. Therefore, delving into the mechanisms of fluid flow and heat transfer in oil shale during pyrolysis holds significant importance for optimizing reaction conditions, enhancing oil shale extraction efficiency, and mitigating environmental impacts [9,10,11]. Current research on heat transfer and fluid flow in oil shale spans several aspects. At the macroscopic scale, researchers utilize porous media models and continuum assumptions to explore mass transfer and heat transfer behaviors during oil shale pyrolysis. These models consider factors such as rock pore structure, porosity, and permeability to evaluate the rate and efficiency of pyrolysis reactions under different conditions. Additionally, through experimental and computational methods, in-depth investigations have been conducted into oil shale’s pore structure, pore distribution, and pore connectivity to reveal fluid flow patterns and permeation behavior within rock pores [12,13,14,15,16,17]. On the other hand, at the microscopic scale, researchers employ simulation methods based on pore network models, such as computational fluid dynamics (CFD) simulations and molecular dynamics simulations [18,19,20,21,22], to simulate fluid flow and heat transfer processes within oil shale pores. These studies provide insights into the impact of pore structure on fluid flow and heat transfer performance from a microscopic perspective, offering new insights into understanding the pyrolysis process of oil shale. Furthermore, some studies focus on utilizing advanced imaging techniques, such as X-ray CT scanning and electron microscopy, to reconstruct and characterize the three-dimensional pore structure of oil shale samples [23,24,25,26,27,28,29], aiming to obtain more realistic and accurate pore geometry information for precise simulation and prediction of heat transfer and fluid flow behavior in oil shale. These endeavors provide important experimental and theoretical foundations for a more comprehensive understanding of heat transfer and fluid flow mechanisms during oil shale pyrolysis.
This paper aims to investigate the fluid flow and conjugate heat transfer mechanisms in oil shale during pyrolysis through pore-scale modeling. Utilizing X-ray CT scan images of oil shale samples treated at various pyrolysis temperatures and with different organic matter contents, we convert these images into three-dimensional digital rock cores. Employing CFD methods, we analyze the flow patterns of supercritical CO 2 along the X, Y, and Z directions in various rock samples and study the fluid–solid heat transfer during these flow processes. This research seeks to elucidate the impact of pyrolysis temperature and organic matter content on the fluid heat transfer mechanisms within oil shale. By conducting this study, we aim to provide new perspectives and methodologies for a deeper understanding of the oil shale pyrolysis process. The insights gained will offer a scientific foundation for the development and utilization of oil shale resources, promoting sustainable development in the energy sector.

2. Model Description

2.1. Governing Equations

The Navier–Stokes equations are the basic equations to solver the flow of liquid. When the flow state is steady laminar and the fluid can be regarded as imcompressible Newtonian fluid, the Navier–Stokes equations are as follows:
· u = 0
· ( u u ) = p + ν 2 u
where u ( m / s ) is the velocity, p ( m 2 / s 2 ) is the kinematic pressure, ν ( m 2 / s ) is kinematic viscosity. The energy equations in the fluid region Ω f and solid region Ω s can be written in term of temperature:
· ( c f T f u ) = · κ f T f
· κ s T s = 0
where c f and c s ( kJ / m 3 / K ) are the fluid and solid heat capacity, respectively, T f and T s ( K ) are the temperatures in the fluid and solid, respectively, κ f and κ s ( kW / m / K ) are the fluid and solid thermal conductivity, respectively.
The micro-continuum approach was used to calculate the heat transfer between fluids and oil shale rocks. The micro-continuum approach is a method that uses volume-averaging of the flow equations over a control volume in the presence of solid material. The heat and mass transport are solved in terms of the volume-averaged properties:
u ¯ = 1 V V f u d V
p ¯ = 1 V f V f p d V
T f ¯ = 1 V f V f T f d V
T s ¯ = 1 V s V s T f d V
where V f and V s are the volume of fluid and solid in a control volume, respectively, and V = V f + V s . Then, combined with the Darcy–Stokes–Brinkman equation over the whole region Ω :
· u ¯ = 0
1 ϵ f ( u ϵ f u ) = P f ¯ + ν ϵ f 2 u ¯ ν K 1 u ¯
where K is the permeability of the control volume, ν K 1 u ¯ is the Darcy resistance. ϵ f is the local permeability porosity of fluid. The permeability K is solved by the Kozeny–Carman equation:
K 1 = 180 h 2 ( 1 ϵ f ) 2 ϵ f 3
where h is the mesh resolution. More equation details can be found in the literature [30].

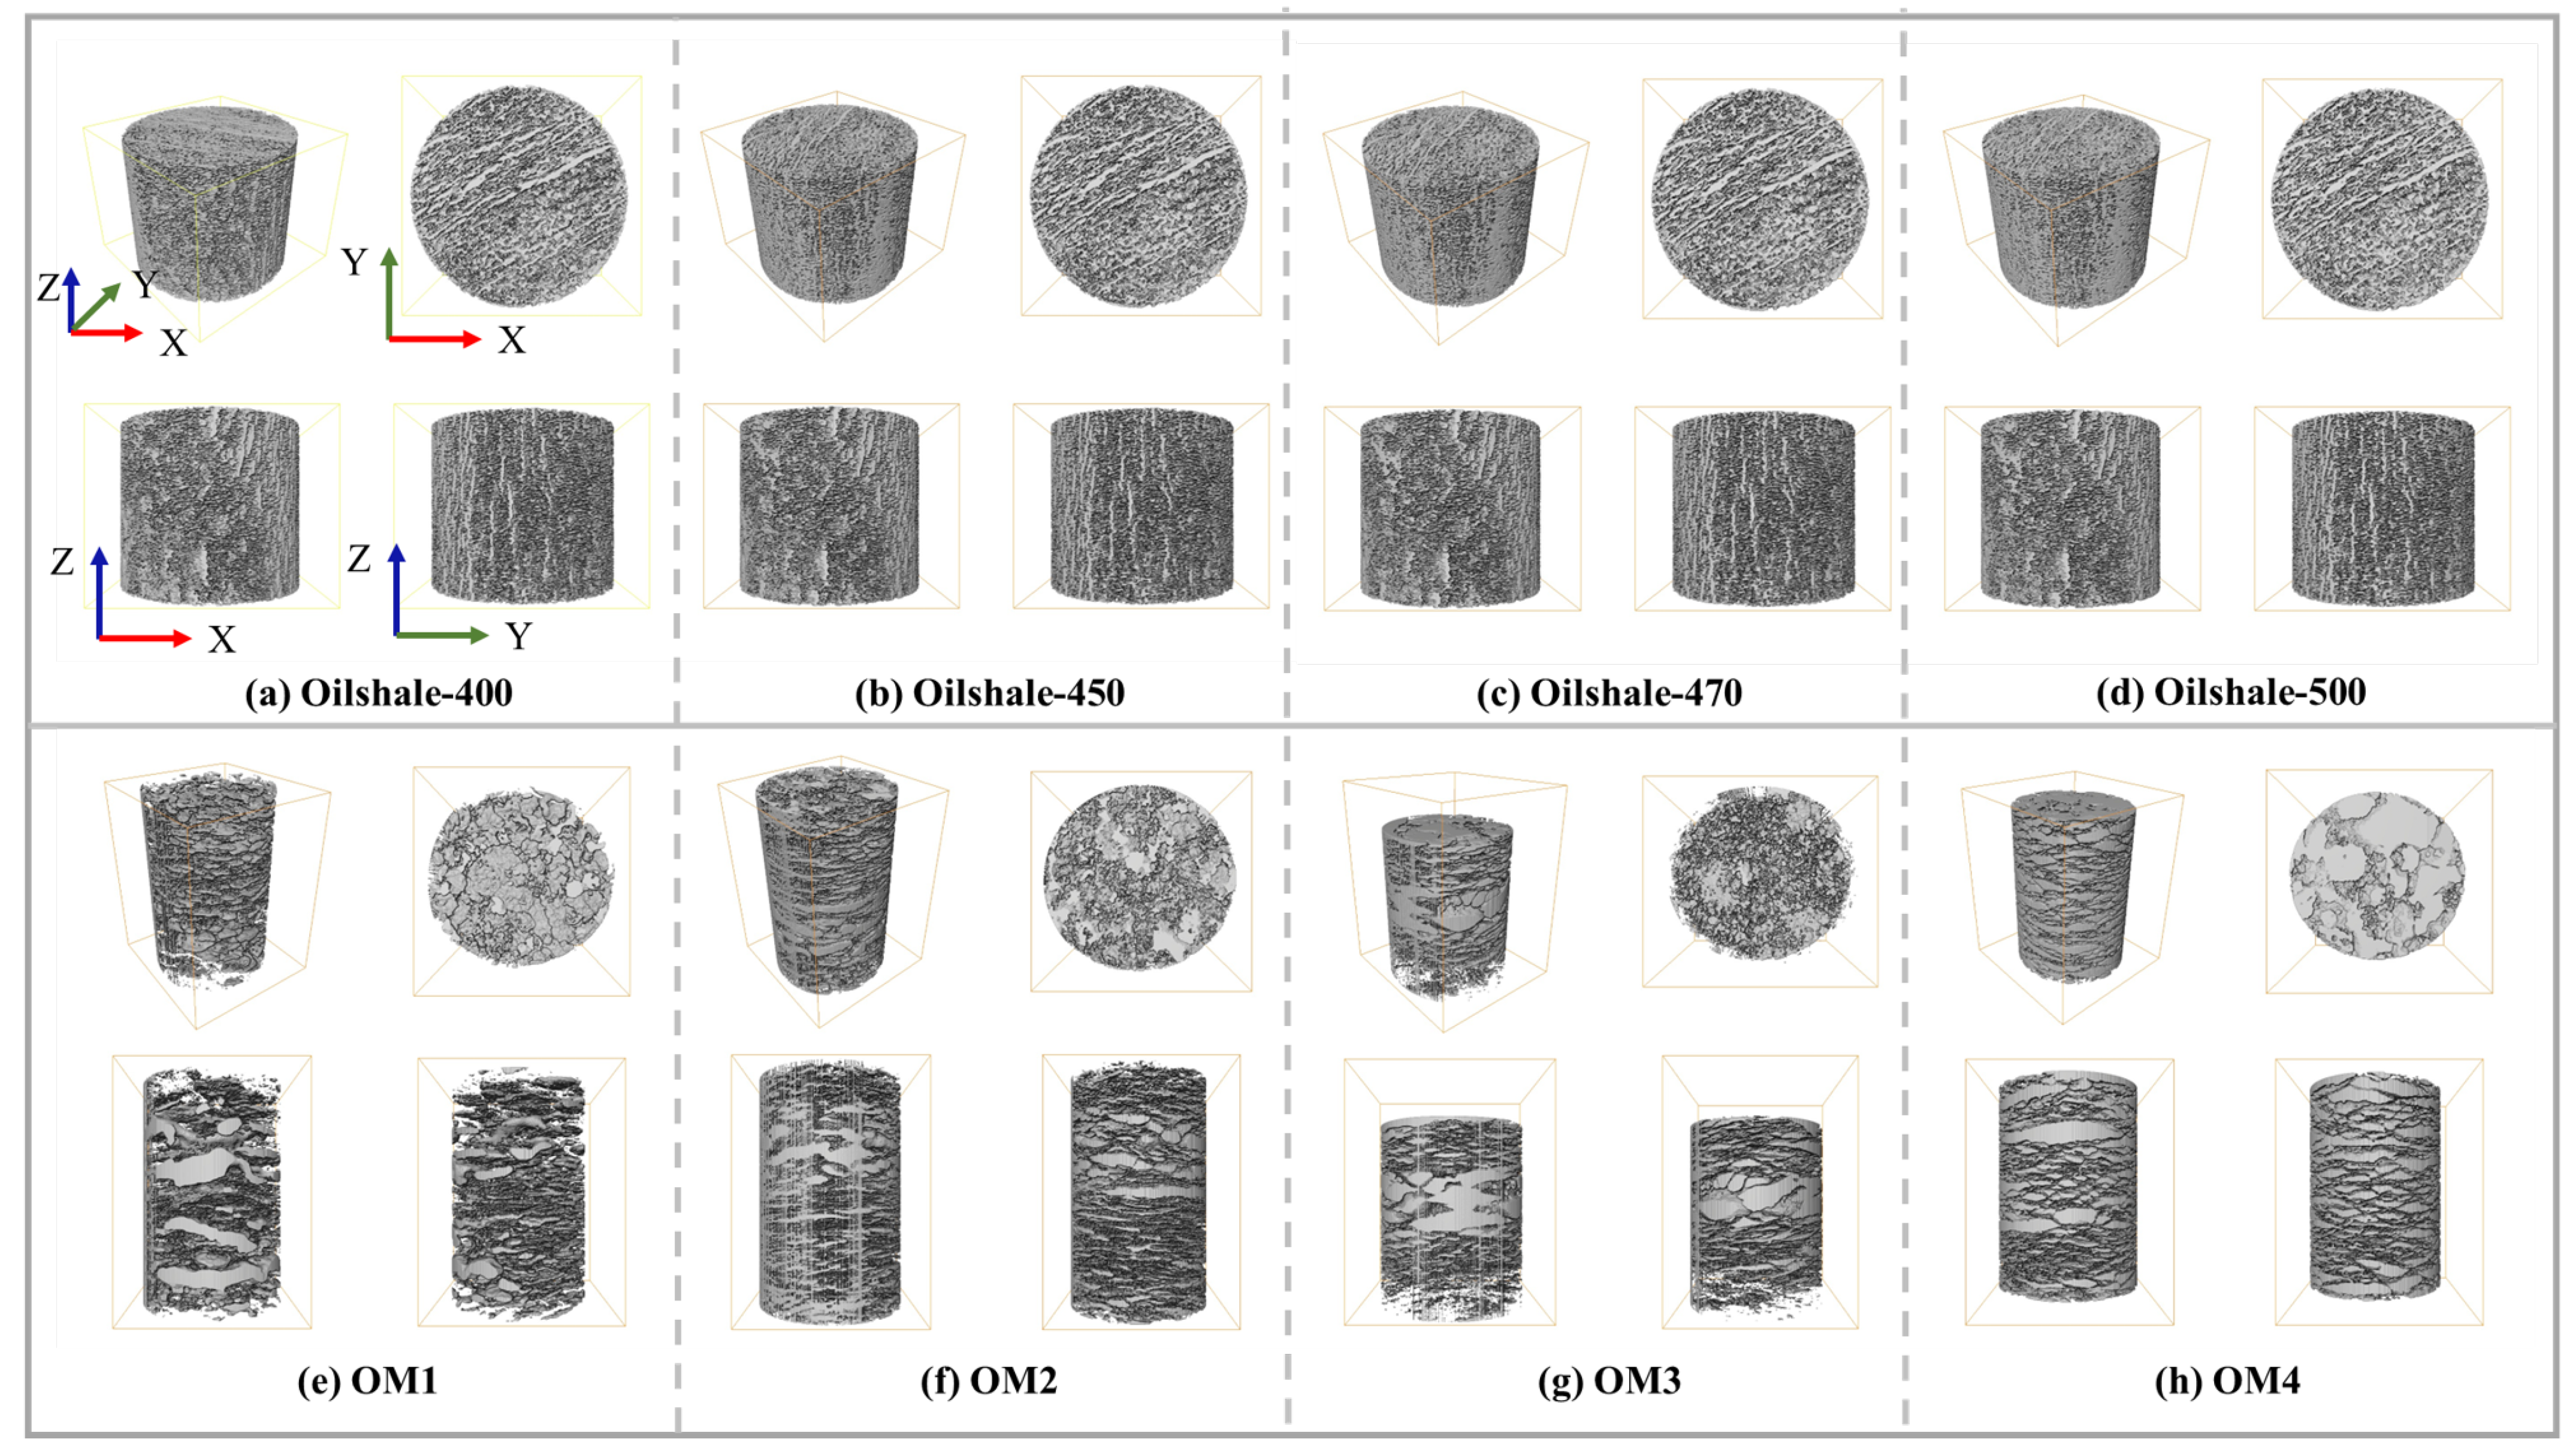
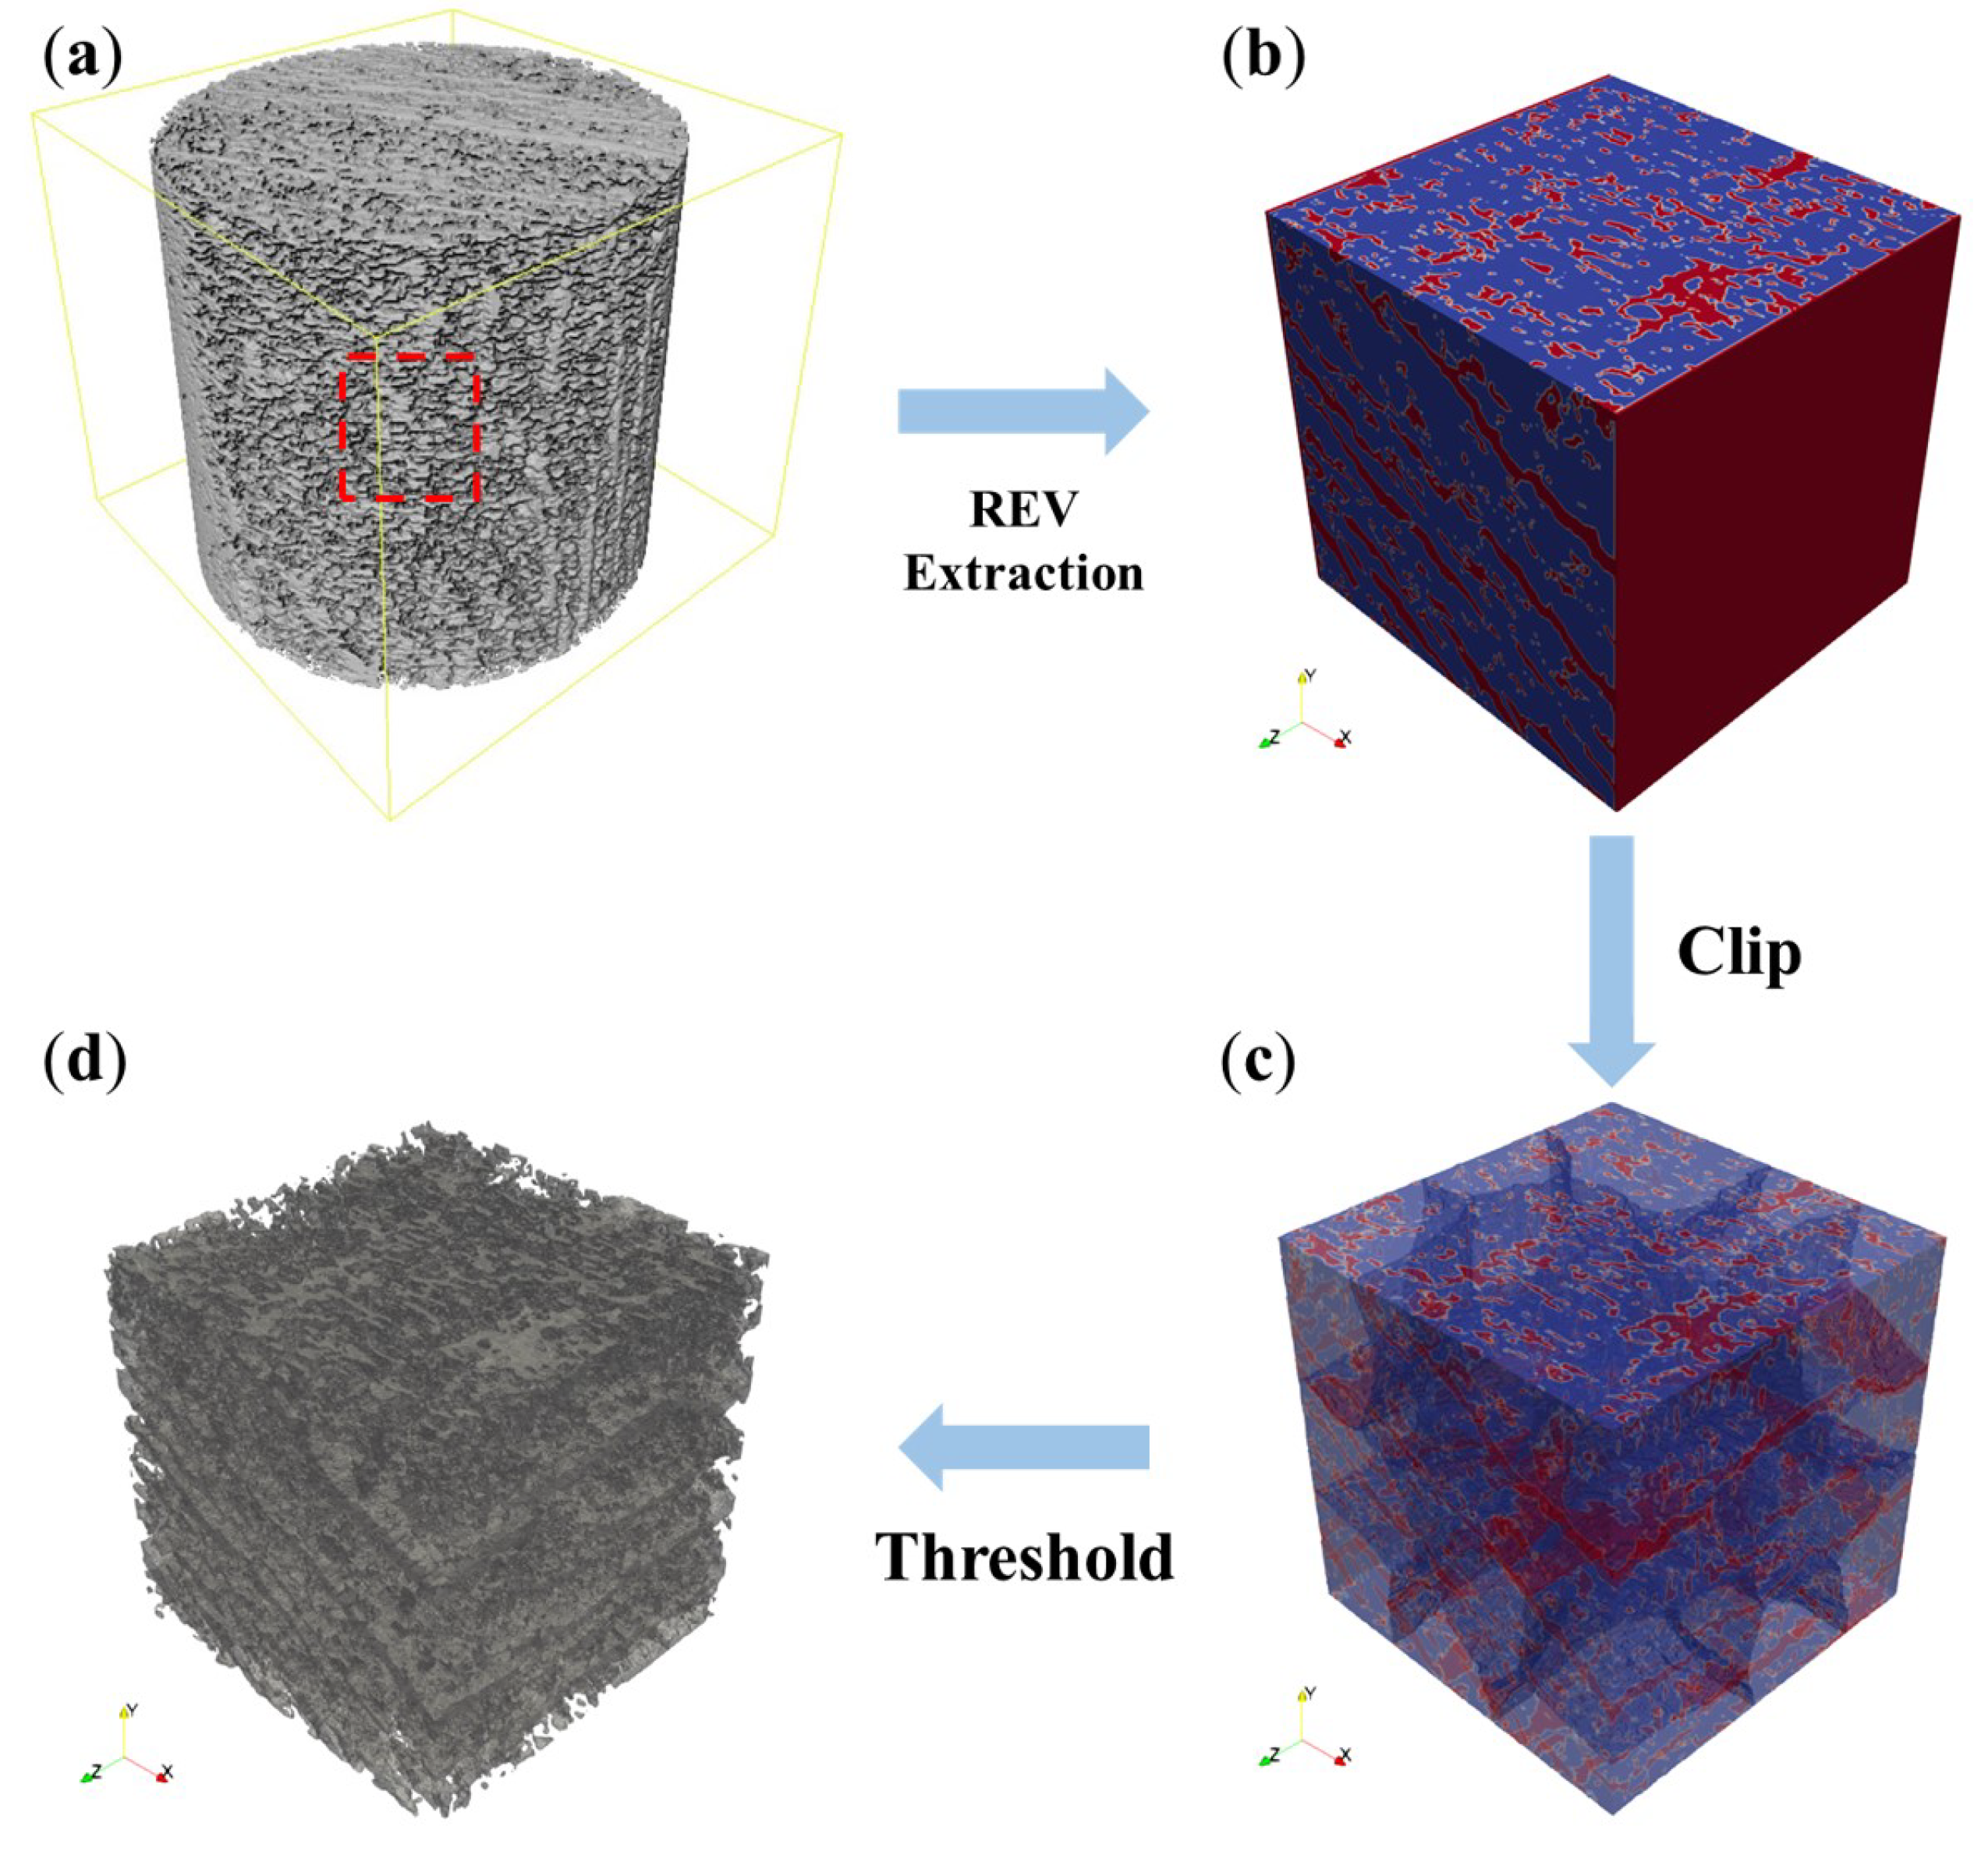
2.2. Oil Shale Model and REV Selection

The CT scanner takes a series of 2D images of the rock samples from multiple angles. By stacking the 2D pictures, the 3D CT data of rock samples can be obtained and the fine 3D visualization of rock pore structure can be realized. In the paper, eight sets of open source oil shale CT data [31,32] were used to analyze the effects of pyrolysis temperature and organic matter content on physical properties of oil shale and heat transfer between supercritical CO 2 and oil shale.
The open source data of different pyrolysis temperatures were obtained from the same oil shale sample (i.e., Oil shale) heated from 20 °C to 500 °C by a customized heating furnace under the absolute pressure of 0.1 kPa. During the pyrolysis process, synchrotron radiation real-time CT scanning with a resolution of 2 μm was carried out with the diamond light source I13-2 beam, as shown in Figure 1. For the different organic matter content cases, the CT data of four groups of samples with different organic matter contents (i.e., OM1, OM2, OM3, OM4) were analyzed after pyrolysis at 0.1 KPa and 500 °C. The organic matter content in the four samples is ranked as: OM4 > OM3 > OM2 > OM1. The porosity and size information can be seen in Table 1 and the three-dimensional geometry is shown in Figure 2, respectively.
Due to the limitations of computers, it is almost impossible to simulate the entire model region. Moreover, it is not necessary to solve for the entire region, and usually, the Representative Elementary Volume (REV) is used for the calculation. However, it is difficult to find the REV that can fully characterize rock microstructure, especially for oil shale with strong heterogeneity. Based on the performance of the computer, in this study, the cubic consisting of 400 × 400 × 400 voxels was selected for the REV. The specific process of graphics processing and model construction is illustrated in Figure 3. Firstly, the target region is determined. Subsequently, the target region’s pores and solid areas are distinguished using a binarized image, thus enabling the construction of the required digital oil shale core model. For ease of result observation, any additional pads and surrounding walls can be trimmed, followed by the threshold setting to obtain pore spaces and solid spaces within the model.
Then the porosity of the REV was calculated by GeoChemFoam-5.0 software. GeoChemFoam is an OpenFOAM-based package developed to perform reactive multiphase transport simulation at the micro-scale [30]. For oil shale samples with different pyrolysis temperatures, the central part was chosen as the REV because this region has similar porosity to the whole sample, as shown in Figure 4. The error is 7.17%, 7.61%, 7.26% and 1.12%, respectively, indicating that this calculation method is effective. It has to be mentioned that, the porosity agreement is only the preliminary criteria in the fluid flow and heat transfer studies [33]. Notably, for samples with varying organic matter content, the pyrolysis of organic matter transforms the volume it originally occupied into pore volume, resulting in a highly heterogeneous nature of the rock samples. This high heterogeneity makes it challenging for the selection of REV units to accurately reflect the true physical properties of the rock samples. However, this selection method of the REV does not affect the analysis of the impact patterns of organic matter.

2.3. Simulation Parameters

To reveal the effects of the pyrolysis temperature on the physical properties of the oil shale and the heat transfer between CO 2 and the oil shale, we calculated the porosity, permeability and heat transfer coefficient between CO 2 and oil shale in the X, Y, and Z directions for each rock sample. Because the size of the REV is 400 3 voxels with a resolution of 2 μm, its real physical size is 800 μ m 3 . The REV was first meshed with a 100 3 cells uniform cartesian mesh, then we selected two-level refinement, which means there are 64 million cells in the whole region and the mesh resolution is also 2 μ m. At the same time, we set the porosity in the solid region to 0.0001, which indicates there is only heat conduction within the solid domain and no fluid flow. A buffer of length 10 μ m was added to the inlet to facilitate the injection at constant velocity.
CO 2 was injected from the inlet boundary at constant velocity u C O 2 and constant temperature T i n l e t = T C O 2 = 333 K . The wall boundaries were also constant temperature T w a l l s = 393 K and no-flow condition. The outlet boundary was set to no temperature gradient and constant pressure P = 0 . The specific boundary conditions can be found in Figure 5. Under conditions of 10 MPa pressure and 333 K temperature, the properties of CO 2 were considered constant and specific parameter values can be obtained from the https://webbook.nist.gov/chemistry/ (accessed on 21 May 2024). Numerous studies have demonstrated that, in the case of oil shale, the physical and thermal properties are primarily influenced by many factors such as sand content, mineral composition, temperature, and others [34,35,36,37]. The thermal conductivity of rock exhibits anisotropy, with significant variations observed between directions perpendicular and parallel to the bedding plane. The thermal conductivity of the shale samples in the literature [34] is mainly distributed between 1.00 and 2.50 W/m/K. The specific heat capacity of oil shale, calculated to be 1.36 kJ/g/K, was derived using the formula C = 1.54 e 8 T 3 1.30 e 5 T 2 + 4.35 e 3 T + 1.00 as stated in the literature [37] and the density can be obtained from https://www.aqua-calc.com/page/density-table/substance/shale-coma-and-blank-solid (accessed on 21 May 2024). The specific parameters of the physical and thermal properties are shown in Table 2.
In this study, the simpleDBSFoam and heatTransportFoam solvers developed by Maes et al. [30] were used to solve the flow and heat transfer equations in GeoChemFoam software (latest v. 5.0). To mimic laminar flow within the reservoir, we regulated the injection velocity ( u C O 2 = 1 × 10 9   m 3 /s) to ensure that the Reynolds number ( R e ) remains below 1. The time step was 2 × 10 4 s and the total simulation time was 1.5 s, which proved sufficient to reach steady state temperature.

3. Results and Discussion

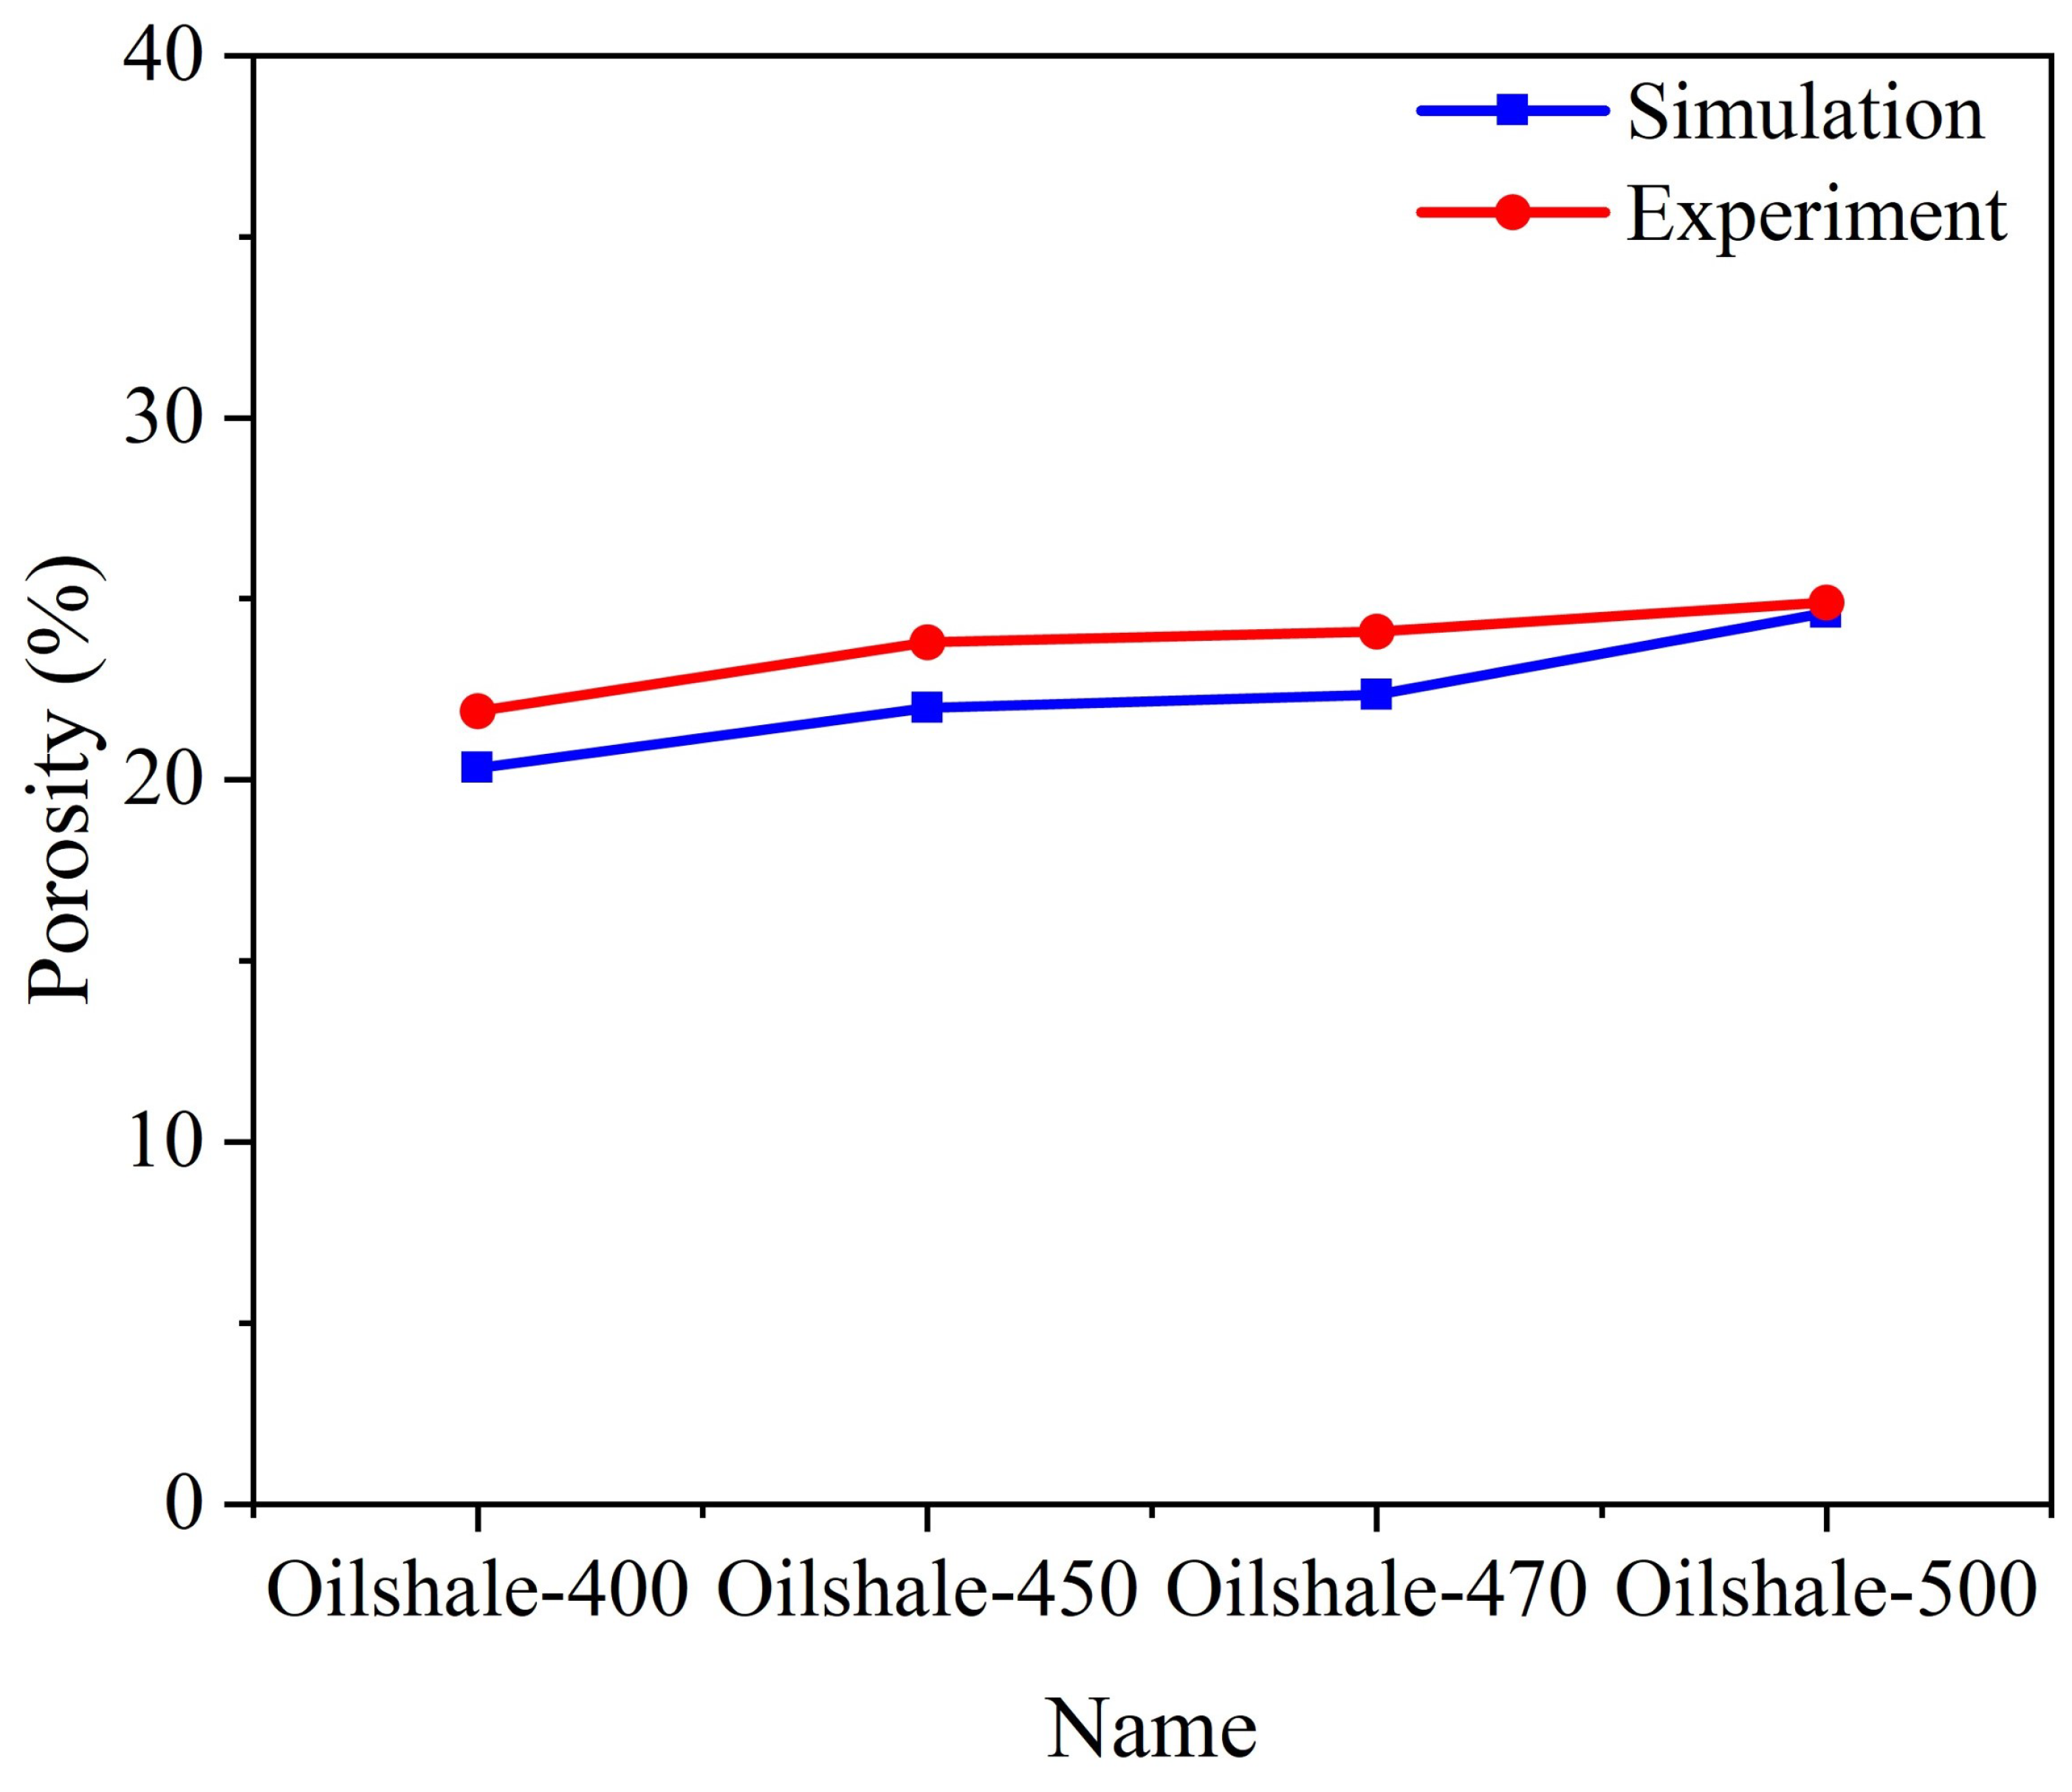
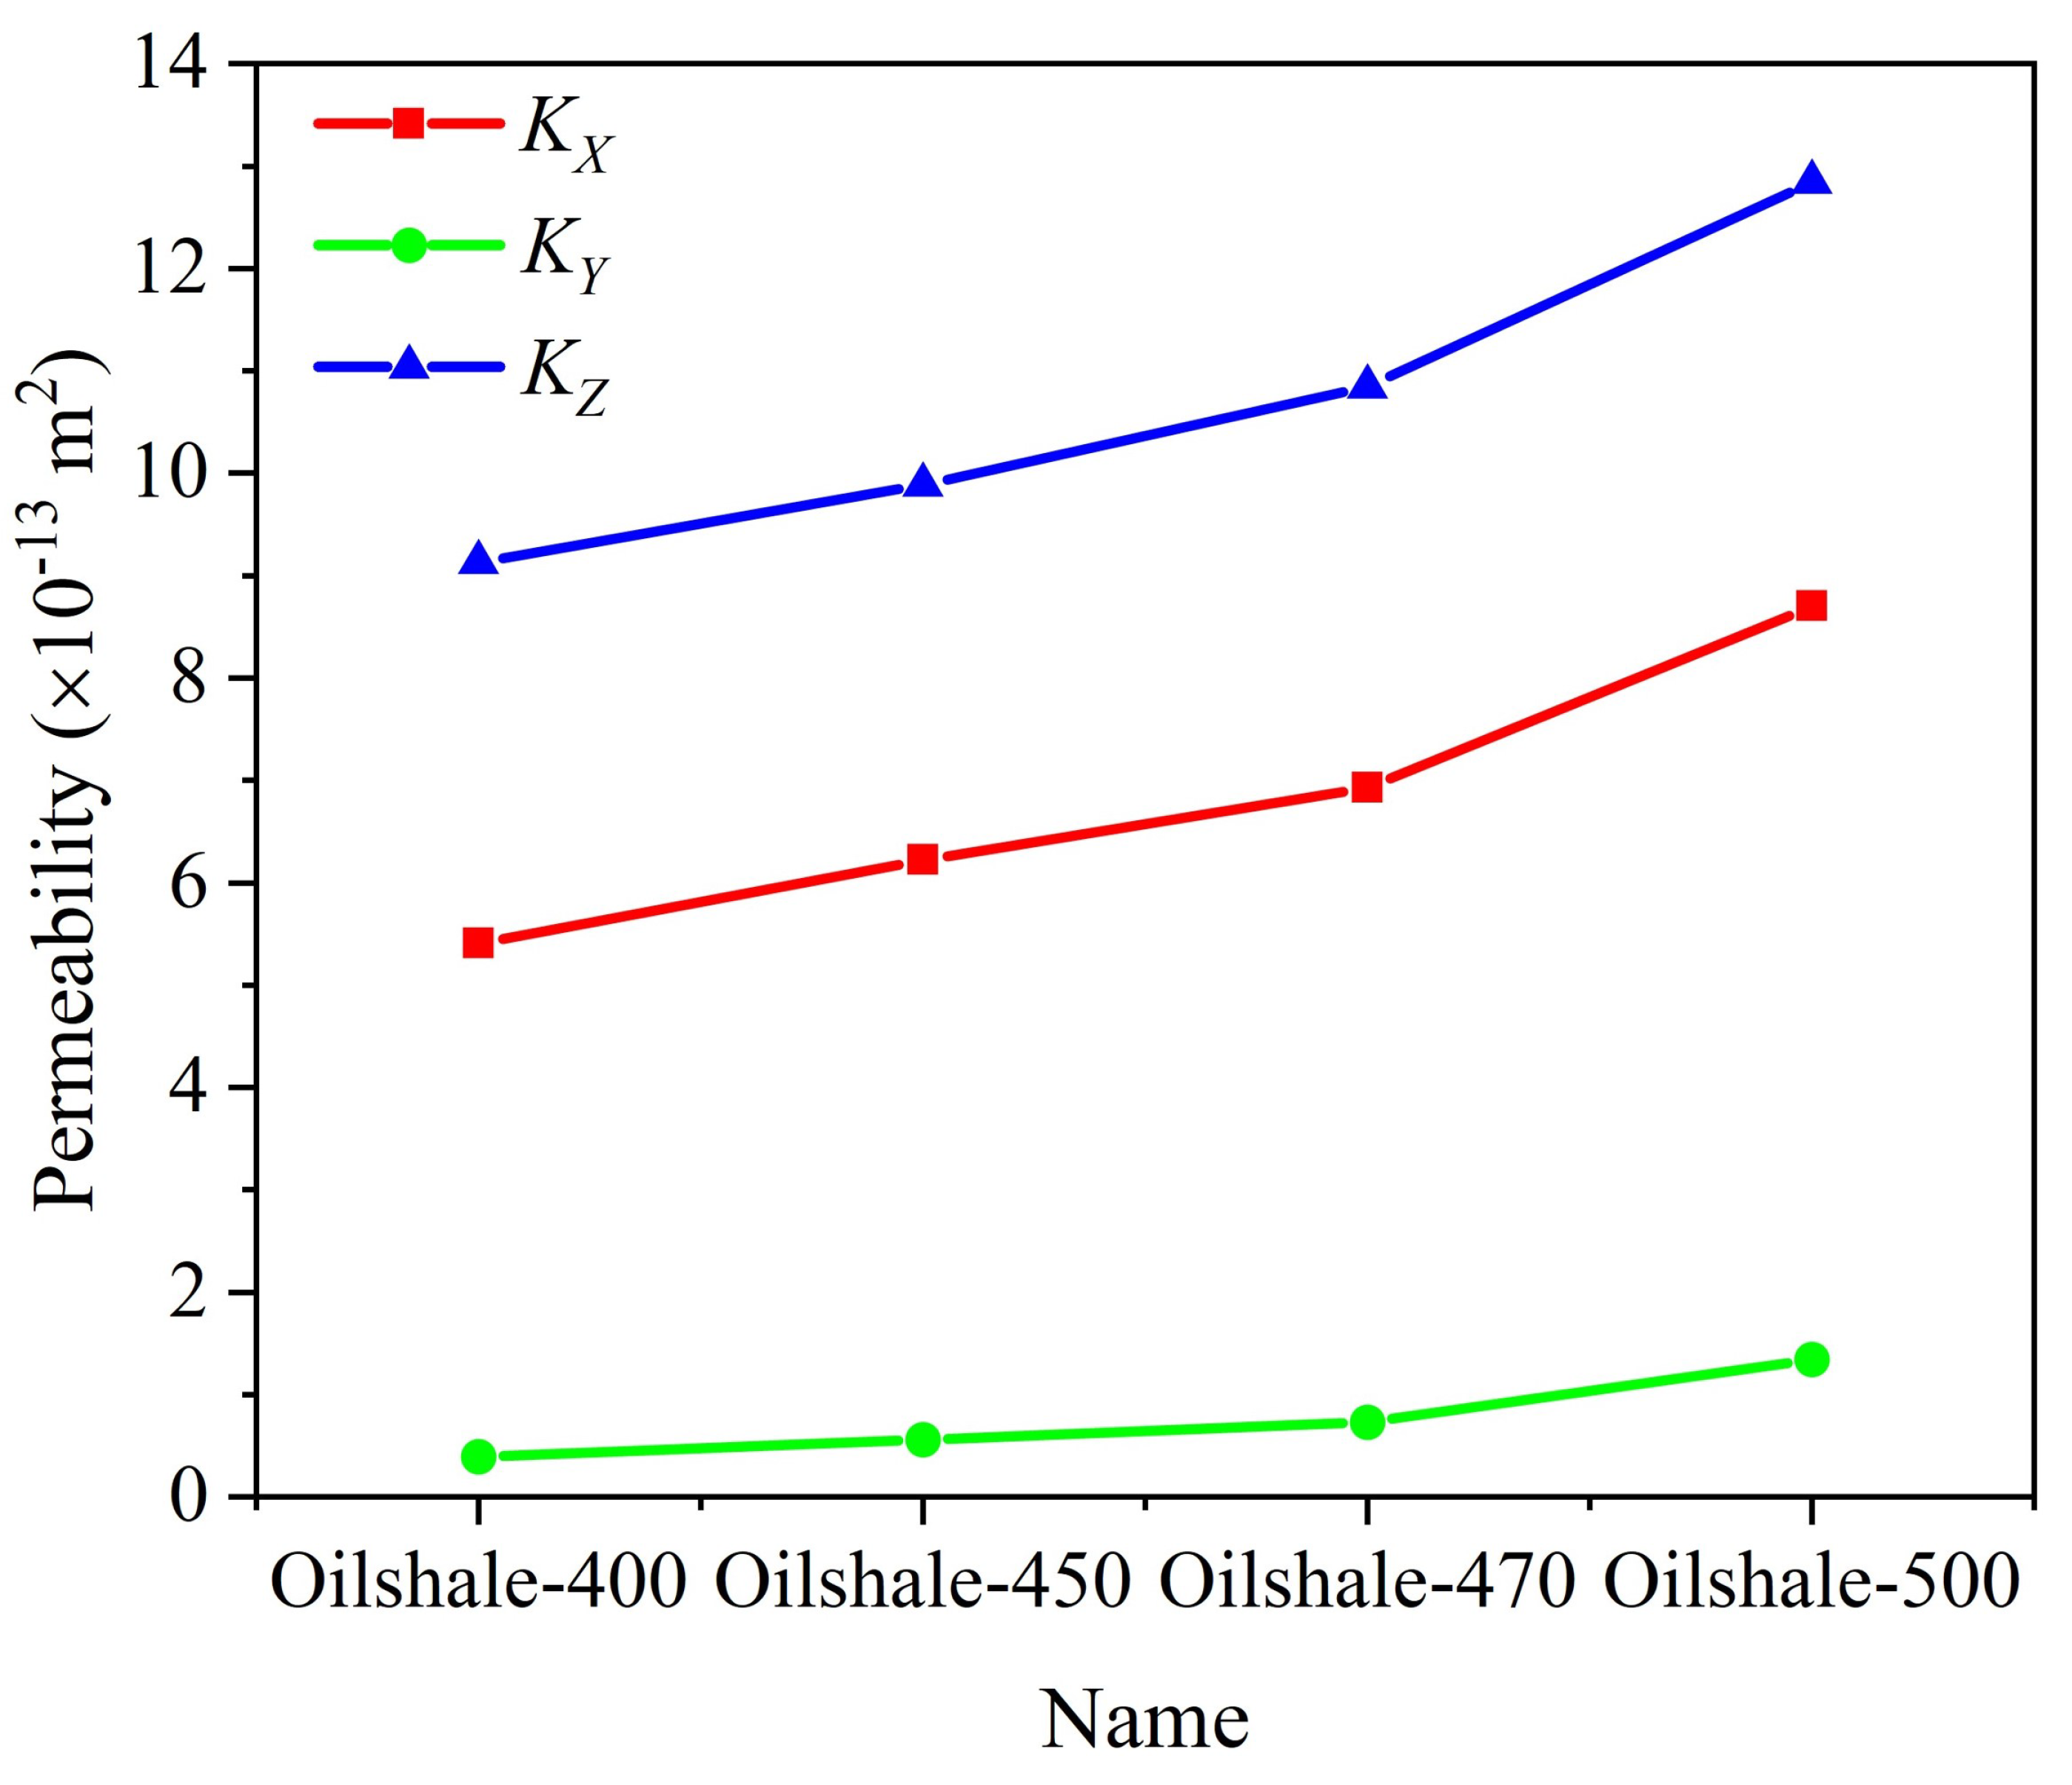
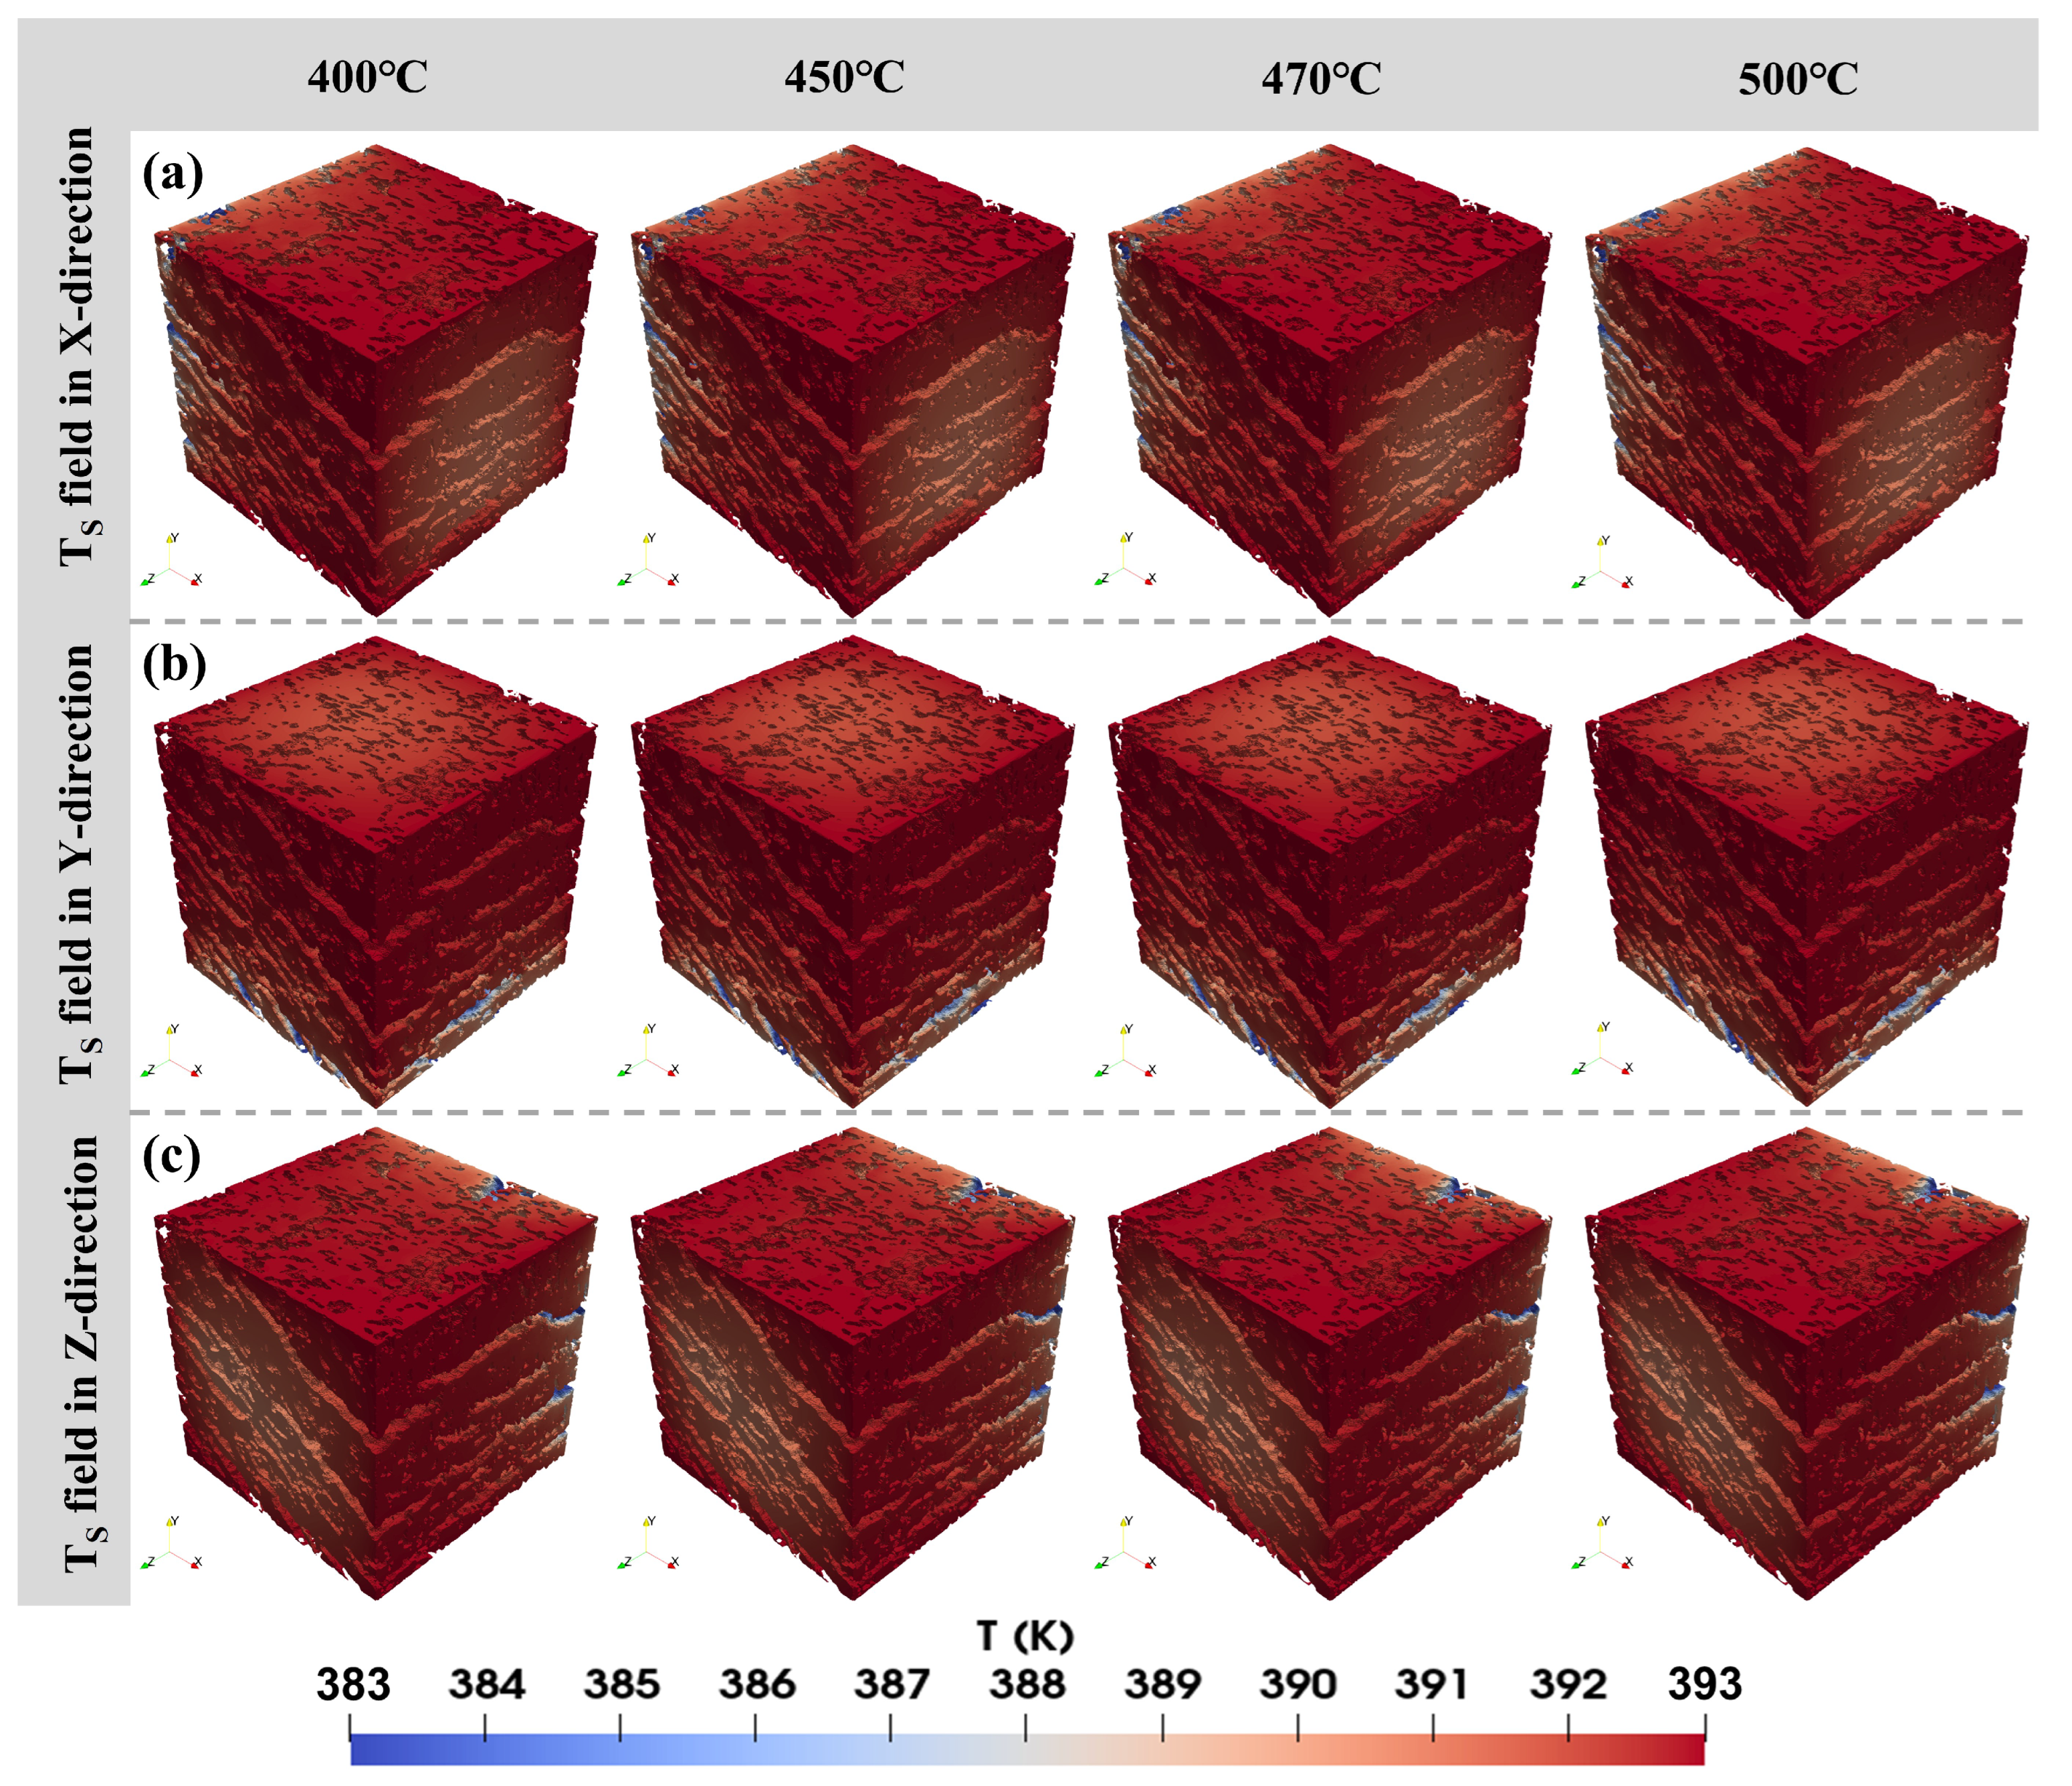
3.1. Influence of Pyrolysis Temperature

Velocity fields and streamlines. Figure 6 depicts the pore structure of oil shale treated at different pyrolysis temperatures and streamline of CO 2 flowing along the X, Y, and Z directions. For clarity purposes, the color bar for the velocity field is set from 1 × 10 9 to 1 × 10 2 m/s. However, please note that this does not imply the actual minimum velocity is 1 × 10 9 and the maximum velocity is 1 × 10 2 during the flow process. As the pyrolysis temperature increases, more organic matter in the oil shale samples decomposes to form pores, resulting in an increase in the porosity of the oil shale samples. However, this increase is not significant, making it almost imperceptible from the pore structure, as depicted in Figure 6. Based on the distribution of velocity fields and streamlines in different directions, it is evident that when CO 2 flows through interconnected pore spaces, the flow velocity is relatively high with minimal variation. However, when CO 2 infiltrates into isolated pore spaces from matrix the flow velocity is extremely low. By comparing streamlines of CO 2 flow in the same direction under different pyrolysis temperature conditions, such as the X direction, it is noted that the streamline distribution remains similar regardless of temperature variation. This suggests that for relatively homogeneous oil shale samples, pyrolysis treatment has minimal impact on the original pore structure network of the oil shale, and does not significantly affect the direction of fluid flow. The primary mechanism lies in decomposing organic matter, enlarging the existing pore volume, thereby influencing the velocity of fluid flow. By observing the results for different flow directions under the same pyrolysis temperature conditions, such as in Figure 6a, we find that different directions of CO 2 injection lead to variations in the position of the minimum flow velocity point and changes in the difference in flow velocity. This is due to alterations in the connectivity of pores in different directions and changes in flow resistance.
Permeability. To further investigate the impact of pyrolysis temperature on the fluid flow characteristics in oil shale, the gas permeability of oil shale samples in various directions was calculated under different pyrolysis temperature conditions, as shown in Figure 7. It can be observed that with the increase in pyrolysis temperature, the permeability in all three directions shows a monotonically increasing trend. This is consistent with the principle that the velocity of fluid flowing parallel to the bedding plane of the oil shale is greater than that flowing perpendicular to the bedding plane. When the pyrolysis temperature increases from 400 °C to 500 °C, the permeability in the X, Y, and Z directions increases from 0.541, 0.0395, 0.913 μ m 2 to 0.870, 0.135, 1.284 μ m 2 , respectively, with percentage increases of 60.81 %, 241.77%, and 40.64%, respectively. This indicates that the impact of pyrolysis temperature on the permeability of oil shale is most significant in the direction perpendicular to the bedding plane. It further demonstrates that with the increase in pyrolysis temperature, the size of pores and microfractures in the oil shale samples increases, effectively enlarging the flow path for oil and gas and enhancing their seepage capacity within the matrix.
Temperature fields. Based on the aforementioned flow field distribution characteristics, the heat transfer during the CO 2 flow in the X, Y and Z directions within the oil shale samples was solved. During the flow of CO 2 in the oil shale samples, the main heat transfer mechanism can be divided into three parts: heat conduction and convection between CO 2 fluids, heat conduction and convection between CO 2 and oil shale, and heat conduction within the solid regions of the oil shale. The temperature fields of the pore regions and the solid regions are shown in Figure 8 and Figure 9, respectively. Since the temperature of the injected CO 2 is lower than that of the rock, the temperature field distribution gradually decreases from the inlet to the outlet along the flow direction. By combining Figure 6 and Figure 8, it can be observed that points with lower temperatures in the temperature field correspond to regions with higher velocities in the velocity field. This indicates that as the flow velocity increases, heat transfer between CO 2 fluids also increases. For the temperature field inside oil shale (as shown in Figure 9), since the heat transfer mechanism within oil shale relies solely on thermal conduction, the heat transfer efficiency is much lower than that of thermal convection. It primarily depends on the position of the fluid–solid interface and the temperature gradient, and is less influenced by the CO 2 flow velocity. Therefore, the temperature distribution within the solid oil shale is relatively uniform. Similar to Figure 6, because the initial organic matter distribution in the oil shale sample is relatively uniform, the pyrolysis process results in minimal changes in the pore space distribution characteristics. Consequently, the temperature field distribution along the same flow direction, as shown in Figure 8a and Figure 9a, exhibits no significant contrast. Therefore, the average temperature and the average temperature difference between CO 2 and oil shale were calculated to further elucidate the flow heat transfer characteristics.
Average temperature and heat transfer coefficient. Figure 10 illustrates the average temperature of CO 2 fluid and oil shale solid during CO 2 flow in different directions (Figure 10a) and the heat transfer coefficients (Figure 10b). Regardless of the flow direction, the average temperature of the oil shale solid region is always higher than that of the CO 2 fluid, consistent with the heat transfer mechanism between the fluid and solid. As the pyrolysis temperature increases, both the fluid and solid regions exhibit a decreasing trend in average temperature, albeit to a minimal extent, which indicates that under low flow velocity conditions, the pyrolysis temperature has a minor impact on heat transfer between CO 2 and oil shale. For instance, when the pyrolysis temperature increases from 400 °C to 500 °C, the average temperatures in the fluid region of CO 2 flowing along the X, Y, and Z directions decrease from 386.146, 386.959, and 386.681 K to 386.078, 386.908, and 387.364 K, with decreases of 0.018%, 0.013%, and 0.037%, respectively. The average temperatures in the solid region also decrease from 387.648, 388.328, and 387.552 K to 387.364, 388.007, and 387.393 K, respectively, with decreases of 0.073%, 0.083%, and 0.041%. When CO 2 flows vertically to the bedding direction of the oil shale, i.e., the Y direction, the average temperature decrease in the fluid region is minimal compared to the other two flow directions, while the decrease in the solid region is the largest. This is consistent with the results of Figure 7, indicating that the pyrolysis temperature has the greatest impact on the fluid when flowing perpendicular to the bedding direction of the oil shale.
From Figure 10b, it can be seen that when CO 2 flows perpendicular to the bedding direction of the oil shale, the heat transfer coefficient between CO 2 and oil shale increases with rising pyrolysis temperatures, i.e., from 0.0421 to 0.0470 W/( m 2 · K). This is mainly because pyrolysis creates fractures and pores within the oil shale, primarily forming between the bedding layers, which increases the porosity in the vertical direction and enhances CO 2 permeability and heat transfer. Additionally, the changes in pore structure in the vertical direction facilitate CO 2 convection and diffusion effects, further increasing the heat transfer coefficient.
However, when CO 2 flows parallel to the bedding direction of the oil shale, the heat transfer coefficient decreases or remains nearly unchanged with increasing pyrolysis temperatures, i.e., from 0.0672 to 0.0610 W/( m 2 · K). This can be attributed to the insulating effect of the bedding layers, which have low thermal conductivity, limiting heat transfer. Additionally, the pyrolysis reactions may be more concentrated within the interlayer gaps, causing localized heat accumulation that is not easily transferred to other areas parallel to the bedding. The heat transfer path parallel to the bedding is longer and more complex, potentially containing thermal resistance that lowers heat transfer efficiency. During pyrolysis, this phenomenon may be more pronounced, resulting in little to no change in the heat transfer coefficient. In summary, the increase in heat transfer coefficient during vertical flow and the decrease or constancy during parallel flow is due to the combined effects of increased porosity, changes in thermal conductivity, enhanced convection and diffusion, as well as the insulating effect of the bedding layers, localized pyrolysis reactions, and the restricted heat transfer path.

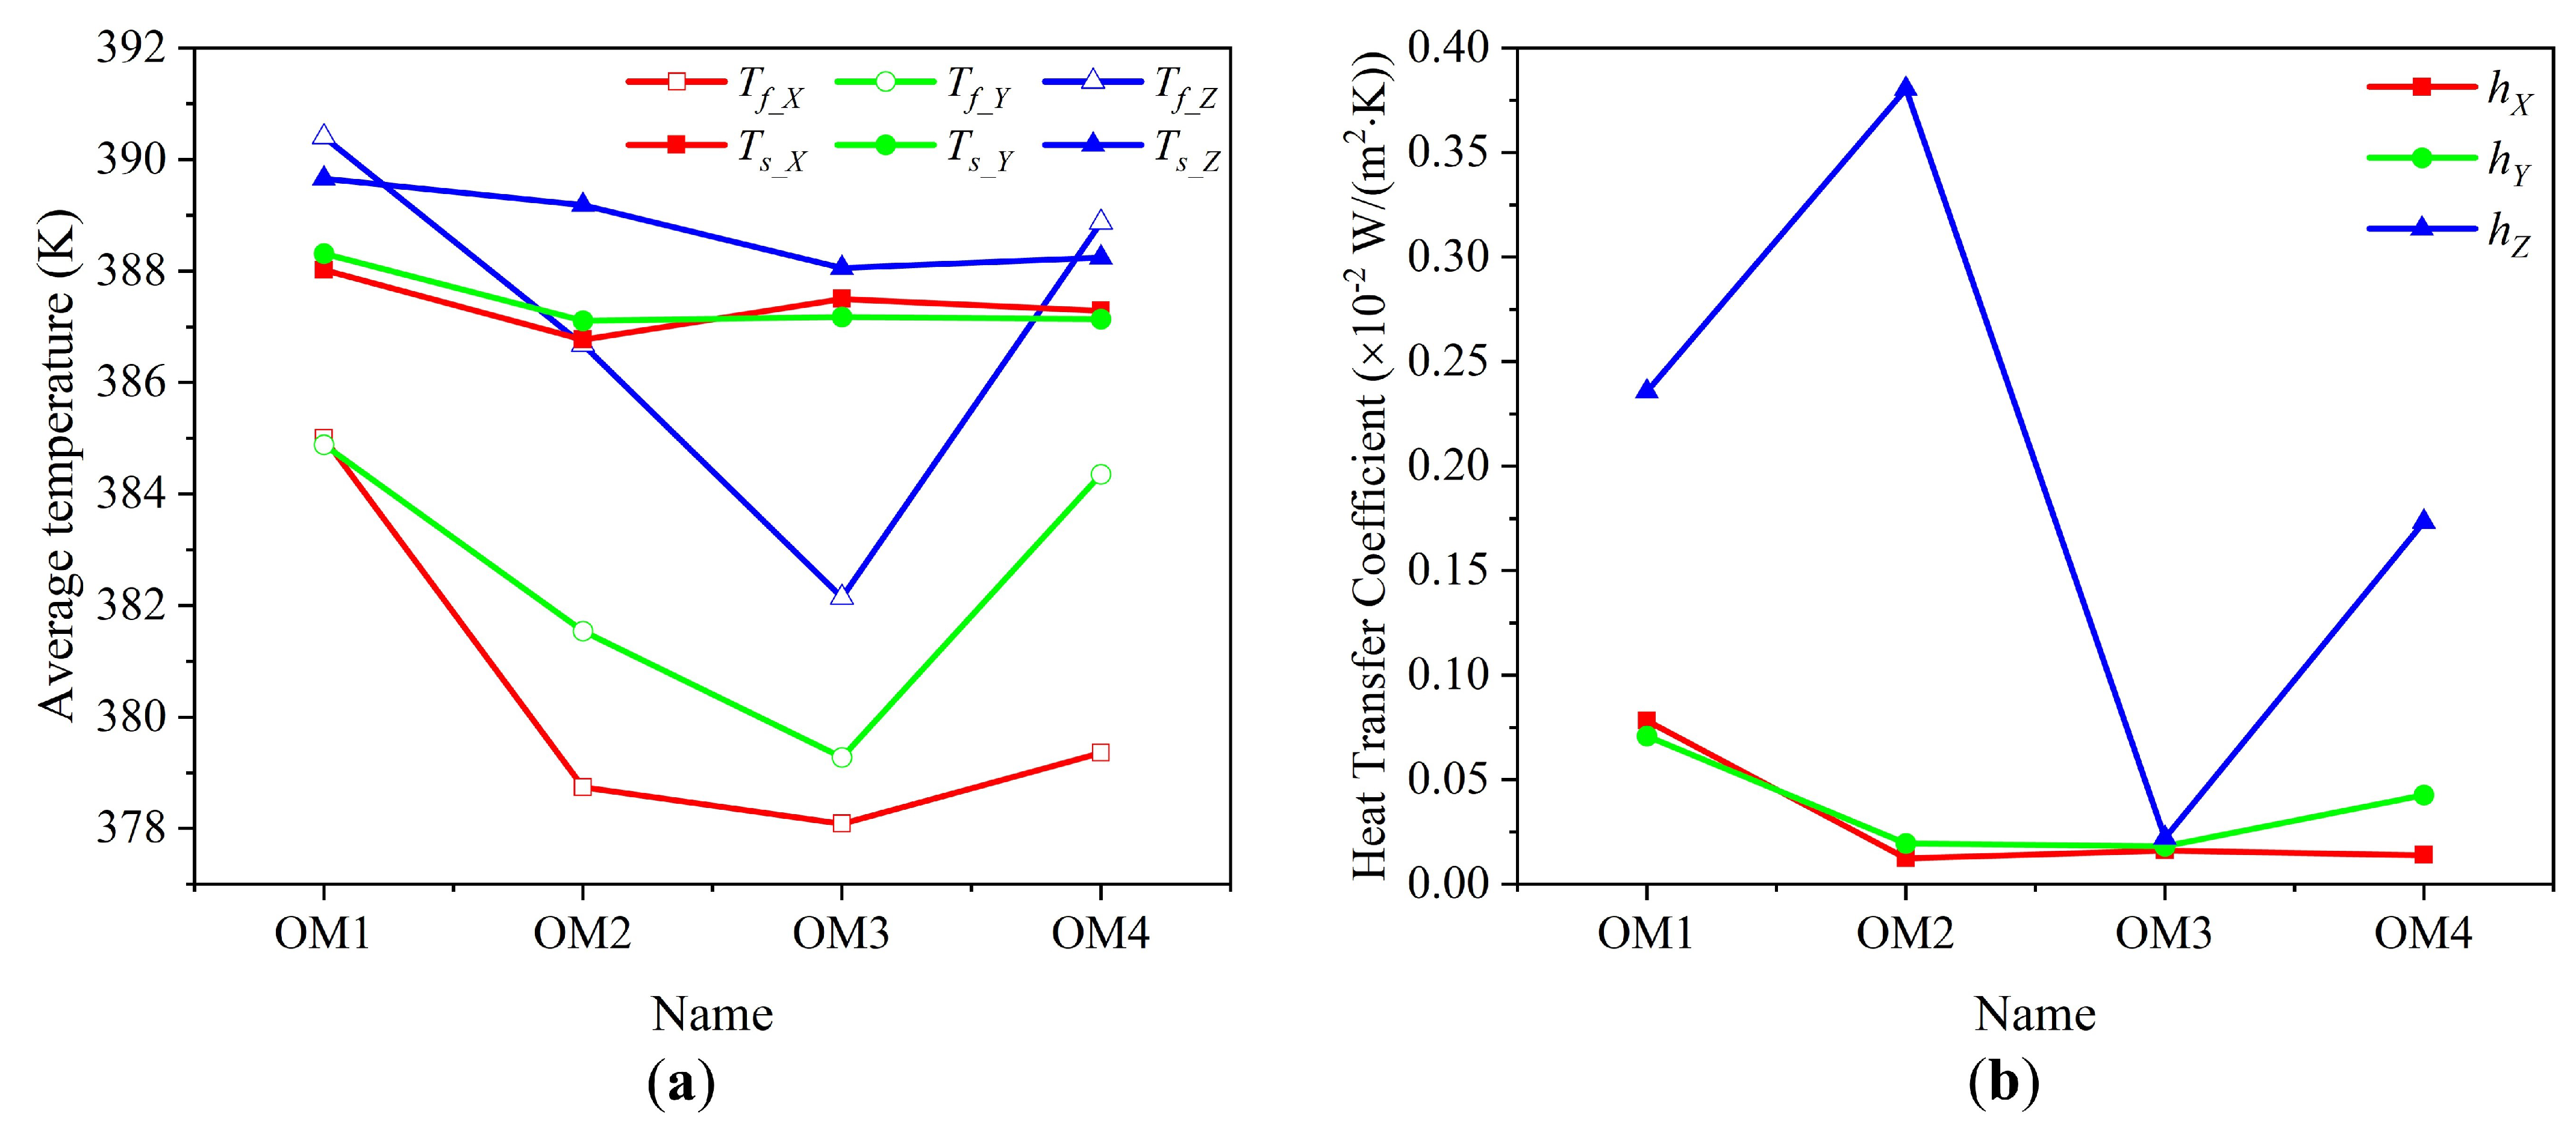
3.2. Influence of Organic Matter Content

Velocity fields and streamlines. Due to the strong heterogeneity of oil shale samples with different organic matter contents, the pore space formed after pyrolysis also exhibits high heterogeneity, as shown by the pore structure in Figure 11. It is important to note that the organic matter content in the original samples increases gradually from OM1 to OM4, which means that after pyrolysis, the porosity of the rock samples should also gradually increase. However, due to the heterogeneity of the samples and the limitations in selecting REVs, the porosity of the selected REVs does not show a gradual increase. Nonetheless, this does not affect the study of the impact of organic matter content on the CO 2 flow and heat transfer mechanisms in oil shale samples, as the pyrolysis of organic matter primarily affects the pore distribution characteristics of the primary pores. The organic matter completely decomposes after pyrolysis, forming large cavities. Some of these cavities are interconnected, enhancing CO 2 flow capability when passing through these pores, while others are isolated, preventing CO 2 fluid from entering. Unlike the previously mentioned oil shale samples treated at different pyrolysis temperatures, the pore distribution characteristics of rock samples with different organic matter contents vary, resulting in significant differences in velocity distribution among the samples, as well as noticeable differences in velocity distribution in different flow directions. For example, comparing the streamlines in Figure 11d when CO 2 flows along the X direction and the Z direction reveals that the velocity of CO 2 flow in the pores in the lower left corner is significantly greater along the Z direction than along the X direction. This indicates that the connectivity of the pores in the Z direction is stronger than in the X direction.
Permeability. To further compare the CO 2 flow characteristics in rock samples with different organic matter contents, the permeability of CO 2 flow in three directions was calculated, as shown in Figure 12. Similar to the flow patterns in oil shale samples treated at different pyrolysis temperatures, the permeability of CO 2 flow parallel to the bedding is greater than that perpendicular to the bedding. However, due to the heterogeneity of the rock samples, the changes in permeability are not monotonic. For the same rock sample, the permeability in the three directions may differ slightly, such as in sample OM1 where the permeabilities in the X, Y, and Z directions are 0.896, 0.134, and 0.0003 μ m 2 , respectively. Conversely, the differences can be significant, as in sample OM2 where the permeabilities in the X, Y, and Z directions are 22.024, 6.669 μ m 2 , and 8.588 nm 2 , respectively, differing by several orders of magnitude. In all four rock samples, the permeability in the direction perpendicular to the bedding, i.e., the Z direction, is extremely low. This indicates that the bedding planes are almost non-contiguous, the original organic matter distribution is relatively isolated, and the pore spaces generated after pyrolysis do not interconnect, thus failing to effectively enhance the permeability of the rock samples.
Temperature fields. The temperature distribution along streamlines in the pore regions and solid regions of oil shale with different organic matter content treated at 500 °C when CO 2 flows along the X, Y, and Z directions are shown in Figure 13 and Figure 14. From Figure 13a,b, particularly evident in samples OM2, OM3, and OM4, CO 2 flow generates preferential pathways where convective heat transfer between CO 2 molecules is intensified. Consequently, the temperature distribution within the samples exhibits similar characteristics to those observed in these preferential pathways. Due to the poor connectivity between bedding planes in each rock sample, although there are large cavities present in the samples, which facilitates the flow and heat transfer of CO 2 . However, when CO 2 flows perpendicular to the bedding direction, it cannot enter these cavities, nor can convective heat transfer occur between them. CO 2 can only rely on heat conduction between CO 2 and the rock (Figure 13c). This results in minimal temperature changes in these cavities, which are almost equal to the initially set temperature. This further illustrates that for the flow and heat transfer problems in rock samples with different organic matter contents, the characteristics of pore structure are crucial factors influencing the fluid flow and heat transfer between fluid–fluid and fluid–solid interfaces. The influence of organic matter content on flow and heat transfer in rock samples essentially stems from the effect of pyrolysis on the characteristics of the original pore network in the rock samples, which is highly correlated with the initial distribution of organic matter and exhibits strong heterogeneity. For instance, if the connectivity of the initial organic matter within the rock specimen is robust, the resultant porosity interconnectivity following the pyrolysis of organic matter will likewise be robust. This can improve fluid flow to some extent, reduce fluid flow resistance, increase fluid flow velocity, and enhance convective heat transfer between fluid–fluid and fluid–solid interfaces, thereby improving heat transfer efficiency. Conversely, even if the organic matter content is high and the organic matter structure is large and intact, if the individual organic matter units are not connected, after pyrolysis, although the porosity of the rock sample can be increased, effective fluid flow channels cannot be formed. Fluids cannot enter, and heat transfer between fluid-fluid and fluid–solid interfaces within the pores can only rely on heat conduction, as shown in Figure 14, which typically has much lower efficiency than convective heat transfer. This results in lower heat transfer efficiency between rock samples. Similar to the previous approach, when heat transfer reaches a steady state, the average temperatures of both the CO 2 and the solid rock samples were calculated, as depicted in Figure 15.
Average temperature and heat transfer coefficient. The average temperatures of CO 2 and the rock solid, as well as the heat transfer coefficients between CO 2 and the rock in rock samples with different organic matter contents, have been calculated, as shown in Figure 15. For CO 2 flow along the Z-direction, the average temperatures of CO 2 in samples OM1 to OM4 are 390.404 K, 386.680 K, 382.145 K, and 388.872 K, respectively, while the average temperatures of the rock solid are 389.660 K, 389.185 K, 388.056 K, and 388.241 K, respectively. Unlike the results shown in Figure 10, when CO 2 flows perpendicular to the bedding planes, the average temperature of the fluid in samples OM1 and OM4 exceeds that of the rock. This indicates that in these two samples, the pyrolysis of organic matter resulted in the formation of numerous isolated pores. These pores are dispersed among the bedding planes and are not interconnected, failing to provide effective channels for fluid flow. Consequently, the CO 2 within these pores cannot engage in convective heat transfer with the flowing CO 2 and relies solely on heat conduction between the rock and CO 2 . This results in the average temperature of the CO 2 approaching the initial temperature of the rock, leading to very low heat transfer efficiency.
Figure 15a shows that the average temperature variation of CO 2 in the four rock samples with different organic matter contents is more pronounced than that of the rock solid. This indicates that the changes in the pore structure of the rock caused by the pyrolysis of organic matter have a greater impact on convective heat transfer between fluids than on heat transfer between the fluid and the rock. Furthermore, this suggests that in samples with higher organic matter content, the development and connectivity of the pore network play a significant role in CO 2 flow and its heat transfer efficiency. Additionally, the heat transfer coefficients between CO 2 and the rock were calculated for CO 2 flowing in the X, Y, and Z directions in rock samples with different organic matter contents, as shown in Figure 15b. For different rock samples, it can be observed that the heat transfer coefficient between CO 2 and the rock is almost maximal in the direction perpendicular to the bedding planes. This phenomenon can be attributed to the poor flow capacity of CO 2 in this direction, thereby predominating its thermal transfer with the rock. Conversely, in the other two directions, where the pore space connectivity is better, CO 2 has stronger flow capacity, and convective heat transfer between CO 2 predominates. This results in relatively lower heat transfer between CO 2 and the rock, leading to a decrease in the heat transfer coefficient.

4. Conclusions

This study provides an in-depth analysis of the fluid flow and heat transfer characteristics of oil shale samples under different pyrolysis temperatures and organic matter contents. Through investigations into velocity fields, permeability, temperature fields, average temperatures, and heat transfer coefficients, several conclusions can be made:
  • The permeability of oil shale samples shows a consistent increase with rising pyrolysis temperatures. While temperature minimally impacts the distribution of velocity and temperature fields, it significantly affects the heat transfer coefficient. Specifically, as temperature increases, the heat transfer coefficient markedly rises perpendicular to the bedding planes but decreases or remains constant parallel to them. This phenomenon is due to changes in the rock’s pore structure from organic matter pyrolysis, which influences fluid flow and heat transfer properties.
  • Organic matter content significantly influences the fluid flow and heat transfer properties of shale samples. Comparing shale samples with varying organic matter contents after thermal treatment shows that differences in organic matter lead to heterogeneity in pore structure, affecting fluid flow and heat transfer characteristics. After pyrolysis, the complete decomposition of organic matter creates large cavities, altering the native pore distribution. If these cavities are interconnected, they enhance fluid flow capacity and improve convective heat transfer. However, if the cavities are isolated, fluids cannot penetrate despite the increased porosity, and heat transfer relies solely on conduction between the fluid and the solid.
  • The influence of organic matter content and pyrolysis temperature on fluid flow and heat transfer in shale is primarily due to the effect of organic matter pyrolysis on the native pore structure. The development and connectivity of the pore network are closely linked to the distribution characteristics of the native organic matter, rather than the quantity of organic matter present.
In summary, our study reveals the significant influence of pyrolysis temperature and organic matter content on the fluid flow and heat transfer characteristics of oil shale samples. These findings provide important theoretical guidance and technical support for the development and utilization of oil shale resources, while also offering valuable insights for future research.

Author Contributions

Conceptualization, Y.S. and D.W.; methodology, B.C. and Y.Z. (Yunpeng Zhang); software, Y.Z. (Yunpeng Zhang); validation, Y.Z. (Yunpeng Zhang) and Y.S.; formal analysis, B.W.; investigation, Y.Z. (Yaochen Zhang); resources, H.W.; data curation, D.W.; writing—original draft preparation, Y.S.; writing—review and editing, B.W., D.W. and Y.S. All authors have read and agreed to the published version of the manuscript.

Funding

This research was funded by the Science Foundation of Key Laboratory of Reservoir Stimulation CNPC (RIPED.CN-2023-JS-432).

Data Availability Statement

The data presented in this study are available on request from the corresponding author.

Conflicts of Interest

The authors declare no conflicts of interest.

References

  1. Caineng, Z.; Qun, Z.; Hongyan, W.; Qian, S.; Nan, S.; Zhiming, H.; Chenjun, Z.; Yuping, S.; Meizhu, W.; Dexun, L. Theory and Technology of Unconventional Oil and Gas Exploration and Development Helps China Increase Oil and Gas Reserves and Production. Oil Forum 2021, 40, 72. [Google Scholar]
  2. Wang, J.; Feng, L.; Steve, M.; Tang, X.; Gail, T.E.; Mikael, H. China’s Unconventional Oil: A Review of Its Resources and Outlook for Long-Term Production. Energy 2015, 82, 31–42. [Google Scholar] [CrossRef]
  3. Zheng, D.; Miska, S.; Ozbayoglu, E.; Zhang, J. Combined Experimental and Well Log Study of Anisotropic Strength of Shale. In Proceedings of the SPE Annual Technical Conference and Exhibition, San Antonio, TX, USA, 16–18 October 2023. [Google Scholar]
  4. Zheng, D.; Ozbayoglu, E.; Miska, S.; Zhang, J. Experimental Study of Anisotropic Strength Properties of Shale. In Proceedings of the 57th U.S. Rock Mechanics/Geomechanics Symposium, Atlanta, GA, USA, 25–28 June 2023. [Google Scholar]
  5. Lei, Y.; Zhijun, J. Global Shale Oil Development and Prospects. China Pet. Explor. 2019, 24, 553. [Google Scholar]
  6. Hu, S.; Zhao, W.; Hou, L.; Yang, Z.; Zhu, R.; Wu, S.; Bai, B.; Jin, X. Development Potential and Technical Strategy of Continental Shale Oil in China. Pet. Explor. Dev. 2020, 47, 877–887. [Google Scholar] [CrossRef]
  7. Zhao, W.; Hu, S.; Hou, L.; Yang, T.; Li, X.; Guo, B.; Yang, Z. Types and Resource Potential of Continental Shale Oil in China and Its Boundary with Tight Oil. Pet. Explor. Dev. 2020, 47, 1–11. [Google Scholar] [CrossRef]
  8. Wang, L.; Yang, D.; Kang, Z. Evolution of Permeability and Mesostructure of Oil Shale Exposed to High-Temperature Water Vapor. Fuel 2021, 290, 119786. [Google Scholar] [CrossRef]
  9. Knyazeva, A.G.; Maslov, A.L.; Martemyanov, S.M. A Two-Phase Model of Shale Pyrolysis. Fuel 2018, 228, 132–139. [Google Scholar] [CrossRef]
  10. Skala, D.; Kopsen, H.; Sokić, M.; Neumann, H.J.; Jovanović, J. Modelling and Simulation of Oil Shale Pyrolysis. Fuel 1989, 68, 168–173. [Google Scholar] [CrossRef]
  11. Wang, G.; Yang, D.; Kang, Z.; Zhao, J.; Lv, Y. Numerical Investigation of the in Situ Oil Shale Pyrolysis Process by Superheated Steam Considering the Anisotropy of the Thermal, Hydraulic, and Mechanical Characteristics of Oil Shale. Energy Fuels 2019, 33, 12236–12250. [Google Scholar] [CrossRef]
  12. Korba, D.; Li, L. Effects of Pore Scale and Conjugate Heat Transfer on Thermal Convection in Porous Media. J. Fluid Mech. 2022, 944, A28. [Google Scholar] [CrossRef]
  13. Li, X.; Ma, T.; Liu, J.; Zhang, H.; Wang, Q. Pore-Scale Investigation of Gravity Effects on Phase Change Heat Transfer Characteristics Using Lattice Boltzmann Method. Appl. Energy 2018, 222, 92–103. [Google Scholar] [CrossRef]
  14. Paknahad, R.; Siavashi, M.; Hosseini, M. Pore-Scale Fluid Flow and Conjugate Heat Transfer Study in High Porosity Voronoi Metal Foams Using Multi-Relaxation-Time Regularized Lattice Boltzmann (MRT-RLB) Method. Int. Commun. Heat Mass Transf. 2023, 141, 106607. [Google Scholar] [CrossRef]
  15. Rabbani, A.; Baychev, T.G.; Ayatollahi, S.; Jivkov, A.P. Evolution of Pore-Scale Morphology of Oil Shale During Pyrolysis: A Quantitative Analysis. Transp. Porous Media 2017, 119, 143–162. [Google Scholar] [CrossRef]
  16. Wang, H.; Chen, L.; Qu, Z.; Yin, Y.; Kang, Q.; Yu, B.; Tao, W.Q. Modeling of Multi-Scale Transport Phenomena in Shale Gas Production—A Critical Review. Appl. Energy 2020, 262, 114575. [Google Scholar] [CrossRef]
  17. Zhang, L.; Li, P.; Chen, J. Pore-Scale Conjugate Heat Transfer of Nanofluids within Fibrous Medium with a Double MRT Lattice Boltzmann Model. Int. J. Therm. Sci. 2021, 163, 106804. [Google Scholar] [CrossRef]
  18. Kopanidis, A.; Theodorakakos, A.; Gavaises, E.; Bouris, D. 3D Numerical Simulation of Flow and Conjugate Heat Transfer through a Pore Scale Model of High Porosity Open Cell Metal Foam. Int. J. Heat Mass Transf. 2010, 53, 2539–2550. [Google Scholar] [CrossRef]
  19. Liu, Z.; Yang, Y.; Zhang, Q.; Imani, G.; Zhang, L.; Sun, H.; Zhong, J.; Zhang, K.; Yao, J. Pore-Scale Flow Simulation of CO2 Sequestration in Deep Shale Based on Thermal-Hydro-Mechanical Coupled Model. Phys. Fluids 2024, 36, 022005. [Google Scholar] [CrossRef]
  20. Meinicke, S.; Dubil, K.; Wetzel, T.; Dietrich, B. Characterization of Heat Transfer in Consolidated, Highly Porous Media Using a Hybrid-Scale CFD Approach. Int. J. Heat Mass Transf. 2020, 149, 119201. [Google Scholar] [CrossRef]
  21. Meinicke, S.; Dietrich, B.; Wetzel, T. Pore-scale numerical analysis of hydrodynamics and conjugate heat transfer in solid sponges. In International Heat Transfer Conference Digital Library; Begel House Inc.: Danbury, CT, USA, 2018. [Google Scholar]
  22. Meinicke, S.; Wetzel, T.; Dietrich, B. Scale-Resolved CFD Modelling of Single-Phase Hydrodynamics and Conjugate Heat Transfer in Solid Sponges. Int. J. Heat Mass Transf. 2017, 108, 1207–1219. [Google Scholar] [CrossRef]
  23. Hugo, J.M.; Topin, F.; Tadrist, L.; Brun, E. From Pore Scale Numerical Simulation of Conjugate Heat Transfer in Cellular Material to Effectives Transport Properties of Real Structures. In Proceedings of the 2010 14th International Heat Transfer Conference, Washington, DC, USA, 8–13 August 2010; American Society of Mechanical Engineers Digital Collection: New York, NY, USA, 2011; pp. 931–936. [Google Scholar]
  24. Li, J.; Zhang, P.; Lu, S.; Chen, C.; Xue, H.; Wang, S.; Li, W. Scale-Dependent Nature of Porosity and Pore Size Distribution in Lacustrine Shales: An Investigation by BIB-SEM and X-Ray CT Methods. J. Earth Sci. 2019, 30, 823–833. [Google Scholar] [CrossRef]
  25. Liu, Z.; Wu, H. Pore-Scale Study on Flow and Heat Transfer in 3D Reconstructed Porous Media Using Micro-Tomography Images. Appl. Therm. Eng. 2016, 100, 602–610. [Google Scholar] [CrossRef]
  26. Lu, Y.; Lu, T.; Lu, Y.; Wang, B.; Zeng, G.; Zhang, X. The Study on Solving Large Pore Heat Transfer Simulation in Malan Loess Based on Volume Averaging Method Combined with CT Scan Images. Sustainability 2023, 15, 12389. [Google Scholar] [CrossRef]
  27. Sun, M.; Hu, C.; Zha, L.; Xie, Z.; Yang, L.; Tang, D.; Song, Y.; Zhao, J. Pore-Scale Simulation of Forced Convection Heat Transfer under Turbulent Conditions in Open-Cell Metal Foam. Chem. Eng. J. 2020, 389, 124427. [Google Scholar] [CrossRef]
  28. Tembely, M.; AlSumaiti, A.M.; Jouini, M.S.; Rahimov, K. The Effect of Heat Transfer and Polymer Concentration on Non-Newtonian Fluid from Pore-Scale Simulation of Rock X-Ray Micro-CT. Polymers 2017, 9, 509. [Google Scholar] [CrossRef]
  29. Tiwari, P.; Deo, M.; Lin, C.L.; Miller, J.D. Characterization of Oil Shale Pore Structure before and after Pyrolysis by Using X-Ray Micro CT. Fuel 2013, 107, 547–554. [Google Scholar] [CrossRef]
  30. Maes, J.; Menke, H.P. Geochemfoam: Direct modelling of flow and heat transfer in micro-ct images of porous media. Heat Mass Transf. 2022, 58, 1937–1947. [Google Scholar] [CrossRef]
  31. Saif, T.; Lin, Q.; Singh, K.; Bijeljic, B.; Blunt, M.J. Dynamic imaging of oil shale pyrolysis using synchrotron X-ray microtomography. Geophys. Res. Lett. 2016, 43, 6799–6807. [Google Scholar] [CrossRef]
  32. Saif, T.; Lin, Q.; Bijeljic, B.; Blunt, M.J. Microstructural imaging and characterization of oil shale before and after pyrolysis. Fuel 2017, 197, 562–574. [Google Scholar] [CrossRef]
  33. Liu, J.; Yu, P.; Li, Y.; Wan, C.; Du, D. Numerical simulation on convective heat transfer characteristics in porous media based on the digital rock technology. Int. J. Heat Mass Transf. 2022, 196, 123323. [Google Scholar] [CrossRef]
  34. Xie, F.; Zhu, C.; Tang, B. An experimental study on anisotropy of thermal conductivity in shale. Energy Geosci. 2023, 4, 100195. [Google Scholar] [CrossRef]
  35. Cheng, C.; Lin, H.; Jiang, Y.; Feng, L.; Xia, Y.; Mu, C. Thermal conductivity of gas-bearing shale of the Longmaxi Formation in the southern Sichuan. Pertol. Geol. 2019, 41, 289–294. [Google Scholar]
  36. Chen, C.; Zhu, C.; Tang, B.; Chen, T. Progress in the study of the influencing factors of rock thermal conductivity. Prog. Geophys. 2020, 35, 2047–2057. [Google Scholar]
  37. Liu, Z.; Ma, H.; Wang, Z.; Guo, Y.; Li, W.; Hou, Z. Experimental study on the thermophysical properties of Jimsar oil shale. Oil Shale 2023, 40, 194–211. [Google Scholar] [CrossRef]
Figure 1. Schematic of CT experimental apparatus [31].
Processes 12 01694 g001
Figure 2. 3D geometry of the eight samples: (a) Oilshale-400 °C, (b) Oilshale-450 °C, (c) Oilshale-470 °C, (d) Oil shale-500 °C, (e) OM1, (f) OM2, (g) OM3, (h) OM4.
Processes 12 01694 g002
Figure 3. Construct the REV from CT images and image processing procedure: (a) binary image of samples, (b) extraction of the REV based on binary image, (c) structure trimming for convenient display, (d) adjust the threshold to obtain solid regions.
Processes 12 01694 g003
Figure 4. Comparsion of porosity between REV and original sample.
Processes 12 01694 g004
Figure 5. The simulated boundary conditions: the red indicates pore regions, and the blue indicates solid regions.
Processes 12 01694 g005
Figure 6. Pore structure of oil shale treated at different pyrolysis temperature and streamlines of CO 2 flowing along the X, Y, and Z directions: (a) Oilshale—400, (b) Oilshale—450, (c) Oilshale—470, (d) Oilshale—500.
Processes 12 01694 g006
Figure 7. Permeability in the X, Y, and Z directions of oil shale samples treated at different pyrolysis temperature.
Processes 12 01694 g007
Figure 8. The temperature distribution along streamlines in the pore regions of oil shale treated at different pyrolysis temperature when CO 2 flows along the X, Y, and Z directions, respectively: (a) temperature field in X-direction, (b) temperature field in Y-direction, (c) temperature field in Z-direction.
Processes 12 01694 g008
Figure 9. The temperature distribution in the solid regions of oil shale treated at different pyrolysis temperatures when CO 2 flows along the X, Y, and Z directions, respectively: (a) temperature field in X-direction, (b) temperature field in Y-direction, (c) temperature field in Z-direction.
Processes 12 01694 g009
Figure 10. The average temperature and heat transfer coefficient between CO 2 and rock samples when CO 2 flows along the X, Y, and Z directions in oil shale treated at different pyrolysis temperature: (a) the average temperature of CO 2 and oil shale samples at steady-state, (b) the heat transfer coefficient.
Processes 12 01694 g010
Figure 11. Pore structure of oil shale with different organic matter content treated at 500 °C and streamlines of CO 2 flowing along the X, Y, and Z directions: (a) OM1, (b) OM2, (c) OM3, (d) OM4.
Processes 12 01694 g011
Figure 12. Permeability in the X, Y, and Z directions of oil shale with different organic matter content treated at 500 °C.
Processes 12 01694 g012
Figure 13. The temperature distribution along streamlines in the pore regions of oil shale with different organic matter content treated at 500 °C when CO 2 flows along the X, Y, and Z directions, respectively, (a) temperature field in X-direction, (b) temperature field in Y-direction, (c) temperature field in Z-direction.
Processes 12 01694 g013
Figure 14. The temperature distribution in the solid regions of oil shale with different organic matter content treated at 500 °C when CO 2 flows along the X, Y, and Z directions, respectively: (a) temperature field in X-direction, (b) temperature field in Y-direction, (c) temperature field in Z-direction.
Processes 12 01694 g014
Figure 15. The average temperature and heat transfer coefficient between CO 2 and rock samples when CO 2 flows along the X, Y, and Z directions in oil shale with different organic matter content treated at 500 °C: (a) the average temperature of CO 2 and oil shale samples at steady-state, (b) the heat transfer coefficient.
Processes 12 01694 g015
Table 1. Porosity and size of rocks in the CT images.
NameWidthHeightNumber of ImagesPorosity
Oilshale-400/450/470/50012801280102021.9%/23.8%/24.1%/24.9%
OM113111388179012.1%
OM213021295179019.1%
OM314261285179023.0%
OM414121400178929.3%
Table 2. CO 2 and oil shale physical and thermal properties.
Properties CO 2 Oil Shale
Density (kg/ m 3 )290.812675.00
Dynamic viscosity ( m 2 /s) 8.10 × 10 8
Specific heat capacity (kJ/g/K)3.051.36
Thermal conductivity (W/m/K)0.041.85
Disclaimer/Publisher’s Note: The statements, opinions and data contained in all publications are solely those of the individual author(s) and contributor(s) and not of MDPI and/or the editor(s). MDPI and/or the editor(s) disclaim responsibility for any injury to people or property resulting from any ideas, methods, instructions or products referred to in the content.

