Article

Novel Efficiency Calculation Model Based on Fine Particle Tracking Behavior

1
State Key Laboratory of Heavy Oil Processing, China University of Petroleum, Beijing 102249, China
2
The Engineering Technology Research Center for Precision Manufacturing Equipment and Industrial Perception of Heilongjiang Province, Qiqihar University, Qiqihar 161006, China
*
Author to whom correspondence should be addressed.
Processes 2024, 12(8), 1710; https://doi.org/10.3390/pr12081710
Submission received: 21 July 2024 / Revised: 6 August 2024 / Accepted: 13 August 2024 / Published: 15 August 2024

Abstract

:
The underflow entrainment of fine particles occurs during the hydrocyclone separation process, resulting in a “fishhook” effect on grade efficiency. Traditional efficiency models fail to address this phenomenon. This study examines the tracking behavior of fine particles, using variations in centrifugal settling velocity to characterize separation performance. The effect of this behavior on particle separation is quantified through a tracking coefficient for small particles and an entrainment coefficient for large particles, together forming a novel efficiency calculation model. The experimental research shows that the new model is applicable for the efficiency calculation of particles with different shapes, and can calculate grade efficiency curves with fishhook segments. By comparing with the existing research results, the accuracy and universality of the new model have been demonstrated. This model facilitates the accurate computation of grade efficiency curves, thereby significantly enhancing the precision of efficiency calculations, which provides guidance for the design and selection of hydrocyclones.

1. Introduction

It is essential to calculate separation efficiency for the successful design and selection of hydrocyclones, which involves the structure and operational conditions of various models. Traditional models like the equilibrium orbit model [1], residence time theory [2], discharge blockage theory [3], and two-phase turbulence theory [4] can be used to analyze hydrocyclone efficiency. However, they do not address the underflow entrainment of fine particles, resulting in significant inaccuracies in efficiency calculations [5].
The underflow entrainment of fine particles occurs when a substantial number of fine particles, which should exit through the overflow, instead exit through the underflow [6,7]. This results in a “fishhook” effect in grade efficiency curves [8] and significant error in fine particle separation efficiency calculations [9]. This phenomenon is primarily attributed to the tracking behavior of small particles [10,11]; these particles, which ideally are separated, follow the wake of larger particles and exit through the underflow pipe.
The present study investigates how the tracking behavior of fine particles affects their velocity. The separation performance of small particles may be improved while controlling the behavior of large particles. A new model for calculating hydrocyclone separation efficiency is established and its accuracy is confirmed through experimental validation.

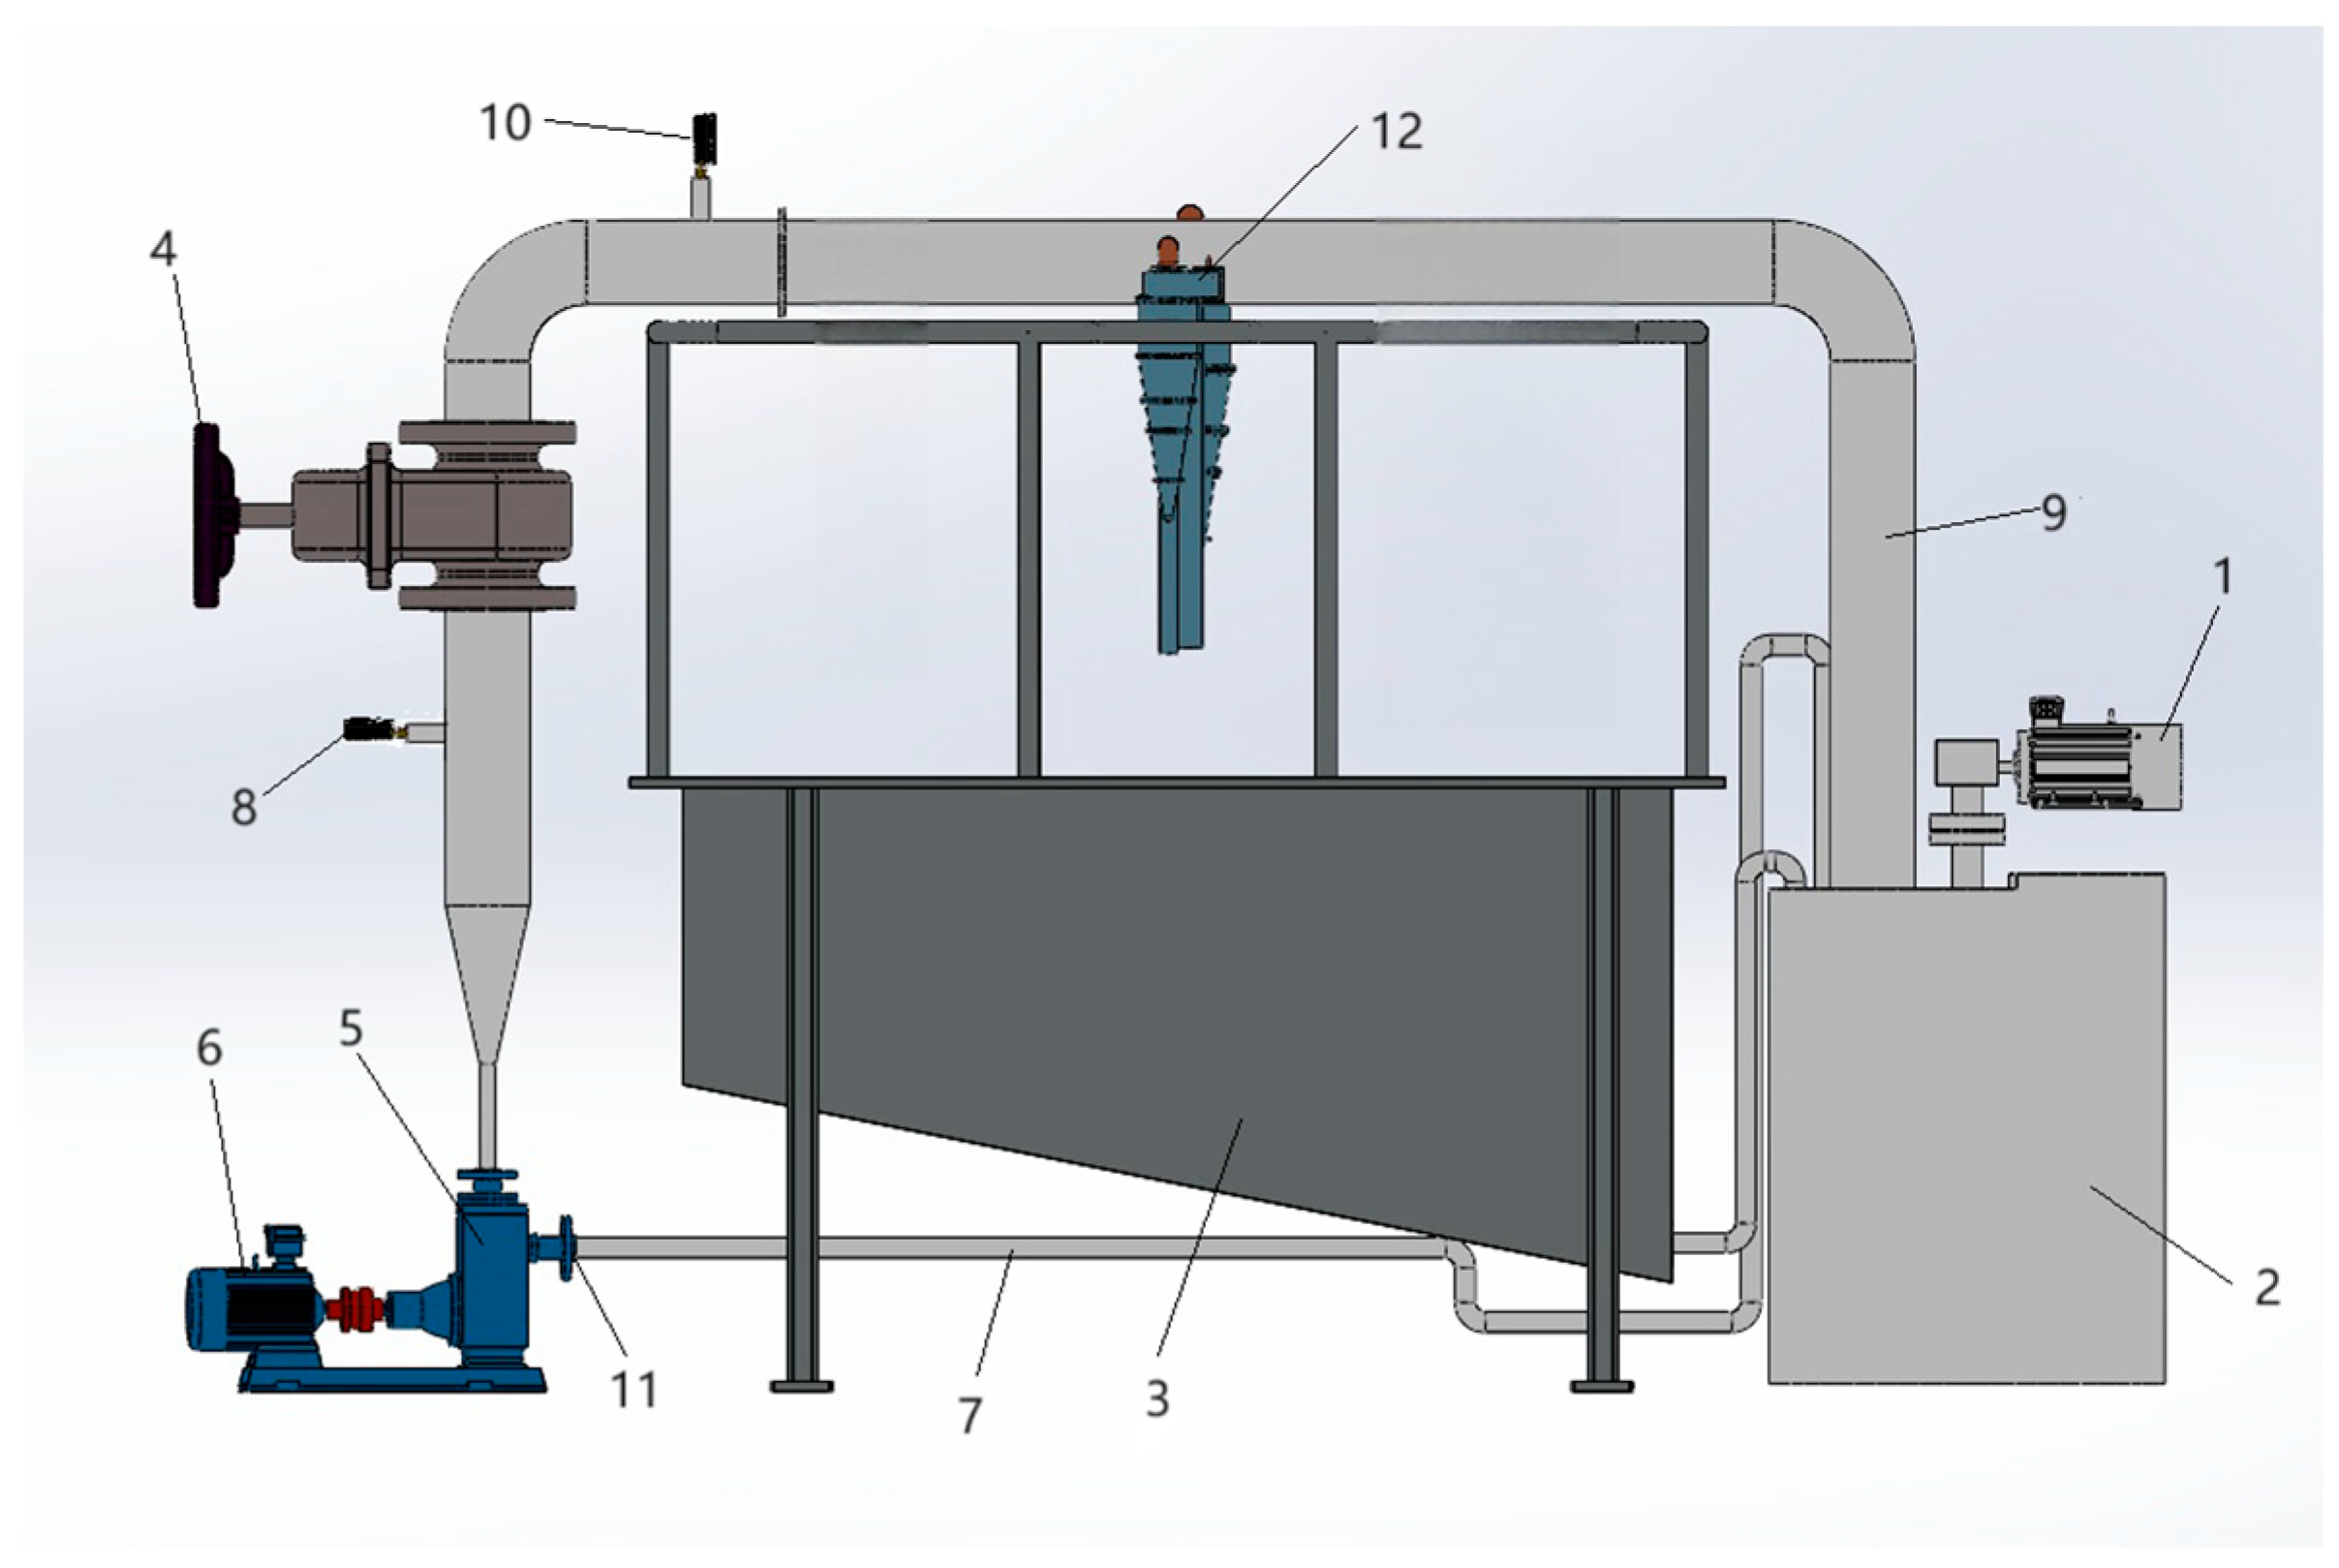
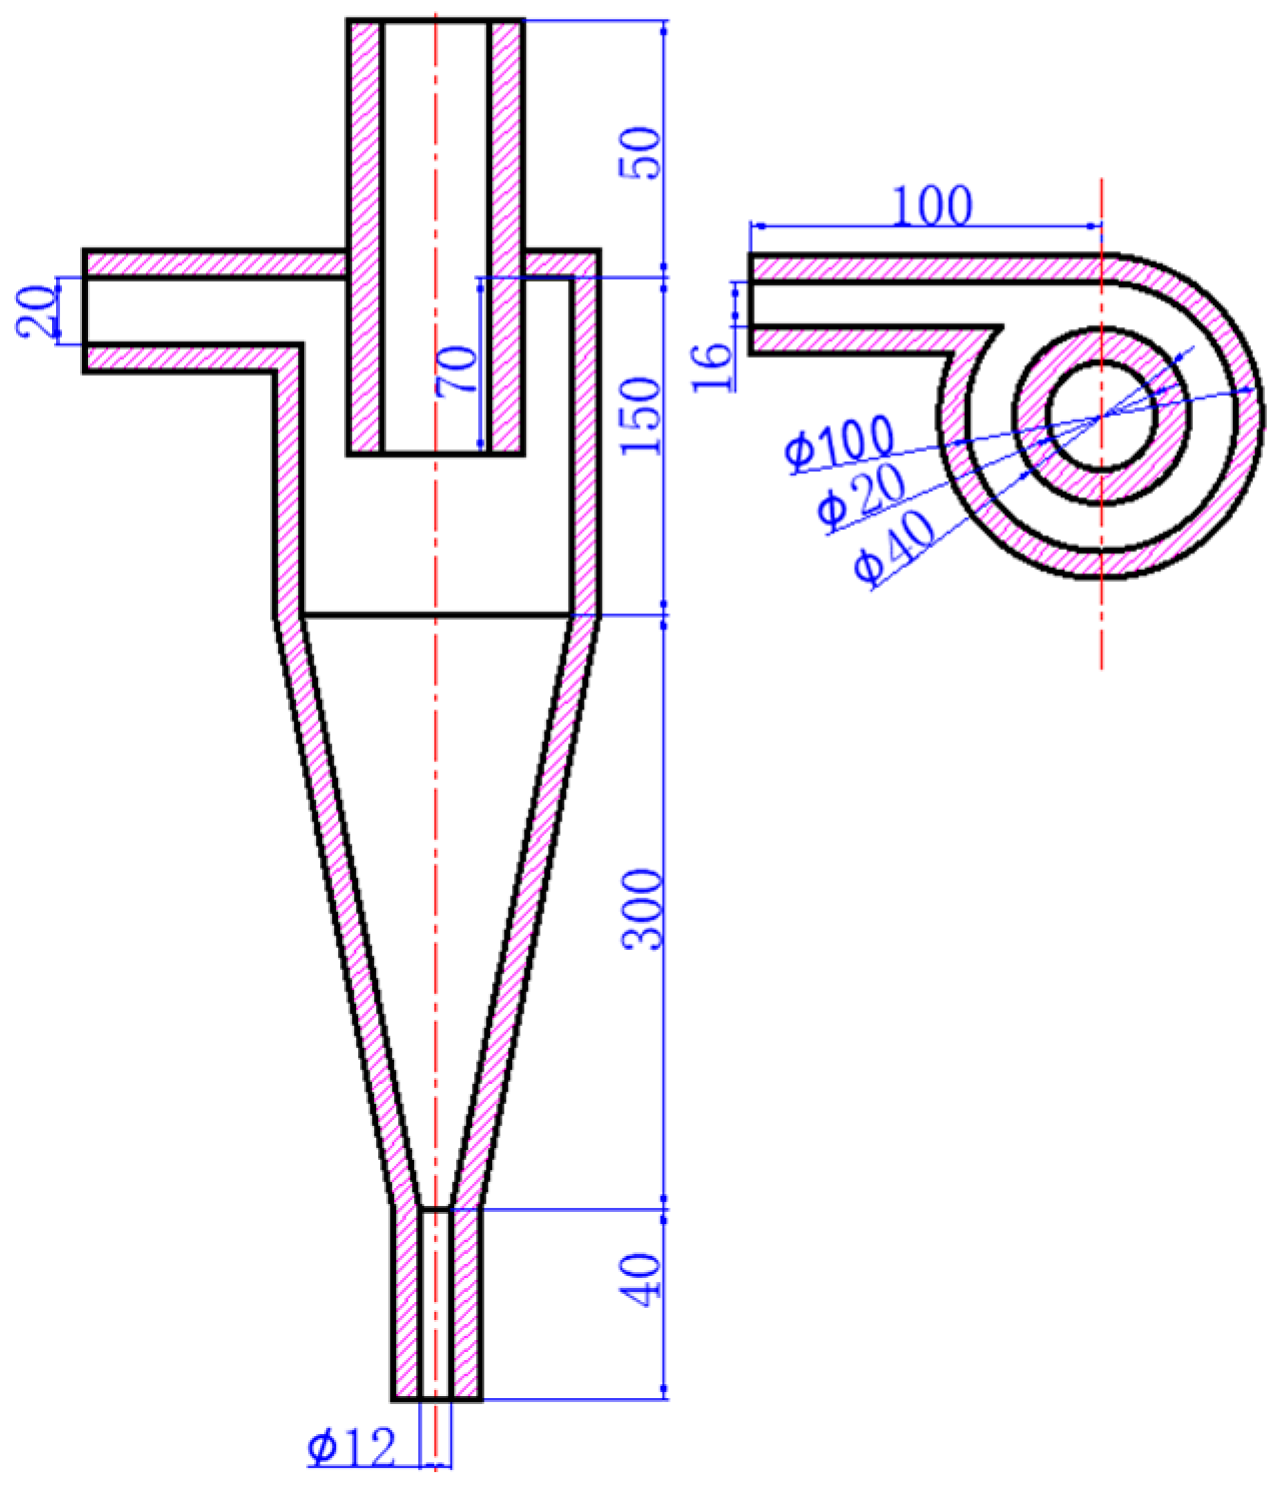
2. Materials and Methods

The experimental system is shown in Figure 1. Slurry tank 2 was filled with mixed liquid, which was evenly stirred by agitator 1 driven by motor 6. The mixed liquid was pressured by centrifugal pump 5, which was then introduced to hydrocyclone 11 along suction pipe 3. The separated liquid flowed into overflow tank 8 from the overflow pipe and the sand-containing slurry was introduced to underflow tank 7 from the underflow pipe, which then converged again at slurry tank 2 to realize the circulating operation. When solid powder was added into the slurry tank to be blended with water, it was fully dispersed in the water by agitator stirring at high speed for more than five minutes.
Experiments were carried out under standard conditions of normal temperature and pressure. Water served as the continuous phase with a 3 wt.% solid mass concentration in the mixed liquid. Data were collected at two inlet velocities, 2.6 and 4.2 m/s, while the inlet pressure was 0.032 MPa and 0.083 MPa. The flow rate was measured by an LDG electromagnetic flowmeter with an accuracy of 1 × 10⁻³ m3/h. The inlet pressure was measured using a YN60BF pressure gauge with an accuracy of 0.01 MPa. The mass was weighed using an electronic scale with a minimum scale of 0.1 g. The mass flow of particles was analyzed by a sampling method, with samples from underflow and overflow ports taken at timed intervals to measure and calculate the flow rate. Then, the samples were dried and solid particle mass was determined to calculate the mass flow rate.
Two types of particles, quartz and glass frit, were used in the experiment. Though these particles share similar size distributions and densities, they differ significantly in shape. The particle size distribution and sphericity were measured using an Eyetech laser analyzer (AmbiValue B.V., Dussen, The Netherlands). The particle density was measured using a pycnometer. The physical properties of the particles are described in Table 1 and the particle size distribution is illustrated in Figure 2.
The particle grade efficiency was the separation efficiency of particles with different sizes, defined as Qm (di) = Qmo (di) + Qmu (di), where di is a certain particle size level, such that Qm (di) is the mass flow rate for a particle with a size of di from the inlet and Qmu (di) from the underflow. The particle grade efficiency was expressed as Equation (1):
η ( d i ) = Q mu ( d i ) Q m ( d i ) = Q mu f u ( d i ) Q m f ( d i )
where Qm is the solid particle mass flow of the inlet and f (di) and fu (di) are the mass percentage of particles with grade di in the inflow and underflow, respectively.
An FX100 hydrocyclone was used as the hydrocyclone element in these experiments. Its geometry and size characteristics are shown in Figure 3.

3. Experimental Results

The equilibrium orbit theory posits that a particle remains in equilibrium along a specific orbit due to the balance of centrifugal and drag forces acting on it. Particles of different sizes occupy distinct equilibrium orbits. Thus, particles outside the orbital plane are separated, while those within the plane may escape with the overflow [12]. The critical particle size at this boundary is denoted as d50c. According to Bram’s [13] research on the separation efficiency of hydrocyclones, the separation area falls outside the locus of zero vertical velocities (LZVV), which is approximately conical. The value of dc50 could be calculated as follows:
d c 50 = 24.66 D in 0.87 D z 1.13 ( 1 D in / D ) 0.8 [ ( 1 D o / D ) μ ( ρ p ρ ) Q h f ] 0.5
where Din is the equivalent diameter of the inlet, D is the diameter of the hydrocyclone, Dz is the average LZVV diameter (approximately 0.43D) [14], Do is the diameter of the overflow pipe, Q is the flow rate, and hf is the free vortex height, which is equal to the distance from the lower end of the cyclone overflow pipe to the end of the cyclone; μ denotes the fluid viscosity, ρp is the particle density, and ρ is the liquid density.
Substituting the calculated dc50 into the appropriate formula reveals the grade efficiency η (d). According to Zhao [15], the grade efficiency can be represented by two parameters: dc50 and the separation limit coefficient c.
η ( d ) = exp ( c d d c 50 ) exp ( c d d c 50 ) + exp ( c )
c = ln u s ( d ) D D t
where Dt is the turbulent diffusion coefficient; us is the centrifugal settling velocity of particles.
According to Schubert [16], Dt is related to pressure drop Δp:
D t = 3.0784 × 10 3 × D o × ( Δ P ρ ) 0.5
where Δp is [17], which can be calculated as follows:
Δ p = 13.69 c v v in 1.75 2 g ( D in D ) 2 [ ( 1.5 D D o 0.85 D u ) 1.58 1 ]
Figure 4 provides a comparison of the calculated values from the equilibrium orbit model with experimental data from quartz separation efficiency trials. It shows significant deviations in the particle grade efficiency curves calculated by the model (MB), particularly an inability to replicate the fishhook shape in smaller-size particles. Thus, the model fails to accurately predict efficiency during the underflow entrainment of fine particles. The model must be revised based on the particles’ tracking characteristics.

4. Model Analysis and Correction Methods

As discussed above, substantial deviations in model calculations can be attributed to the underflow entrainment phenomenon of fine particles, which is driven by their tracking behavior. According to Kashiwaya [18], the separation performance of particles is positively correlated with their settling velocity. Therefore, an observed increase in the separation efficiency of fine particles can be equated to an increase in their centrifugal settling velocity, facilitated by their entrainment by larger particles. Conversely, some large particles experience a decrease in centrifugal settling velocity due to the drag effect exerted by smaller particles, resulting in a decrease in their separation efficiency.
This study aims to correct the dc50 value and separation limit coefficient c, both of which are influenced by changes in the centrifugal settling velocity of particles. The relationship between the centrifugal settling velocity us (d) of particles and their tracking behavior is analyzed first. According to Dueck [19], in a gravitational settling field, the settling velocity of fine particles increases as they track the wake of larger particles. In the same field, the settling velocity of some larger particles decreases due to this drag interaction; the velocity of some large particles decreases as they carry smaller particles. The extent of this change in velocity is related to factors such as particle concentration, size, and density [20].
The principles of centrifugal settling in cyclone separation mirror those of gravity settling, except that gravity acceleration g is replaced by centrifugal acceleration ac. Based on these considerations, changes in particle separation performance driven by the degree of variation in centrifugal settling velocity are investigated in this study. The following equation incorporates particle tracking behavior into the expression of their centrifugal settling velocity:
u s ( d ) u h ( d ) = 1 + d 3 g ( c v ) β t ( d 0.35 1 ) g ( c v ) f e
where fe is the entrainment coefficient, βt is the tracking coefficient, cv is the particle volume concentration, and g (cv) is a function of solid content.
g ( c v ) = 2.25 c v 2 / 3 exp ( 5 c v )
The component uh (d) modifies the settling velocity by adjusting the Stokes velocity of individual particles to account for the effects of concentration:
u h = ( 1 c v ) 4.5 a c d 2 ( ρ p ρ ) 18 μ
The second term on the right-hand side of Equation (7) reflects the increase in velocity of particles that follow in the wakes of larger particles, referred to as the “tracking term”. The third term indicates the decrease in velocity caused by the drag exerted by particles on one another, the “entrainment term”. The effectiveness of this model hinges on the specific formulations of the entrainment and tracking coefficients.

4.1. Tracking Coefficient

The tracking term indicates an increase in velocity. The tracking effect and underflow entrainment of fine particles are more pronounced when its value is higher. Research by Eswaraiah [21] demonstrates that the effect of fine particle underflow entrainment is related to the size, shape, and concentration of particles as well as the operating conditions and structure of the hydrocyclone.
The term d−3 represents the influence of particle size on the tracking effect; smaller particles exhibit a stronger tracking effect. The function g (cv), representing the particle concentration, increases monotonically with a parabolic trend within a 1% to 15% range (Equation (8)). This indicates that higher particle concentrations enhance the tracking effect. The effects of particle shape, operating conditions, and hydrocyclone structure on the tracking effect are encapsulated in the coefficient βt. A larger βt value indicates stronger tracking effects and more severe fine particle underflow entrainment.
Majumder [22] compared the operating conditions and parameters of hydrocyclone structure parameters between an experiment and numerical model to find a certain relationship between βt and the actual operating parameters. Specifically, the influence of operating conditions and hydrocyclone structure on βt can be attributed to the split ratio Ru. Wan [23] found that sphericity Φp cannot be used to linearly characterize the influence of particle shape on the underflow entrainment of fine particles. Accordingly, a piecewise function is utilized here to represent the influence of particle shape on βt:
β t = { f 1 ( R u ) ( Φ p 0.95 ) f 2 ( R u ) ( Φ p > 0.95 )
where Ru can be expressed as [24]:
R u = 0.818 c v 0.232 Q 0.148 ( D u D o ) 2.512
According to Equation (11), flow rates Q and Do are negatively correlated with Ru, while cv and Du are positively correlated with Ru. Thus, Ru is proportional to the value of βt in Equation (9).

4.2. Entrainment Coefficient
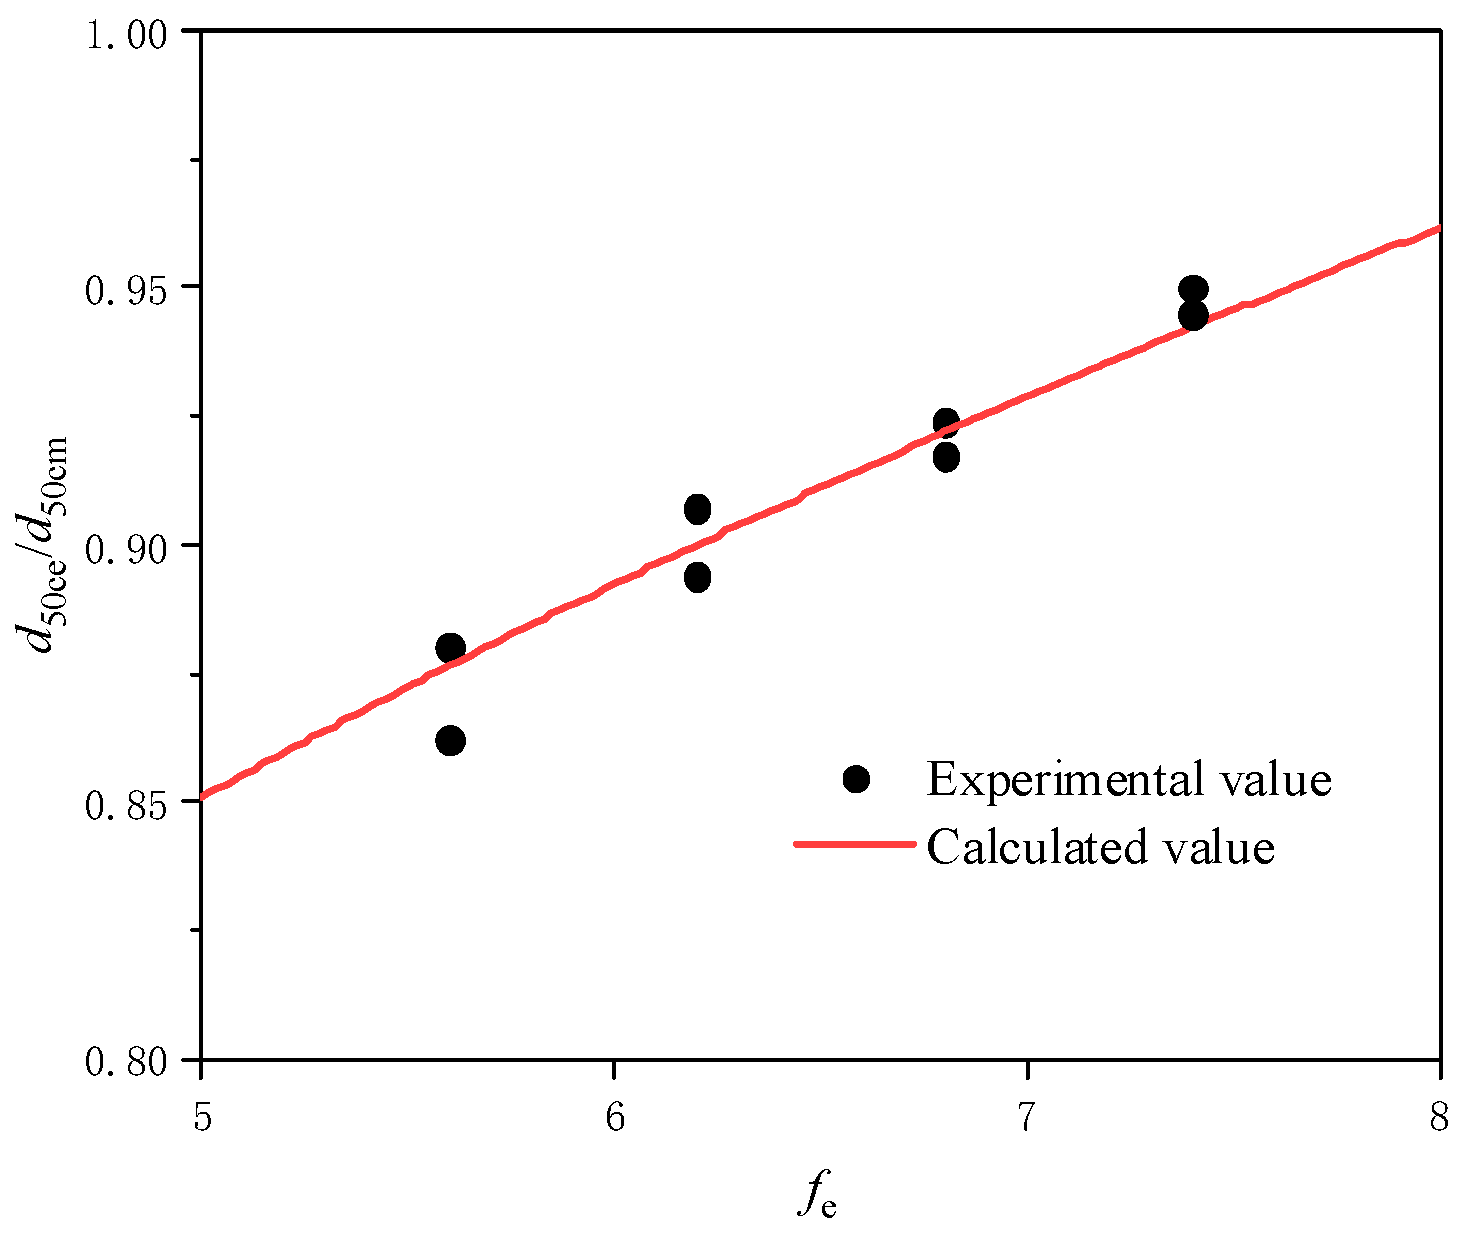
The entrainment term illustrates the decrease in velocity for large particles. The undertow entrainment of fine particles intensifies as this term increases. The tracking term and entrainment term are interactive, affecting each other’s dynamics.
According to Equation (7), particle size and concentration are positively correlated with the entrainment effect. The influence of particle shape, operating conditions, and hydrocyclone structure on the entrainment effect are reflected in the entrainment coefficient fe.
Spelay [25] suggests that the processes of entrainment and tracking are essentially the same mechanisms acting on different particles. Consequently, the relationship between fe and the operating conditions can be described by βt. For fe, it is necessary to consider the potential drag effect caused by small particles tracking the wake of a larger particle in the flow field as per the entrainment coefficient in the integral form:
f e = 0 d f ( x ) f 3 ( β t x ) d x
In this integral, f3 (βtx) represents the function relationship between the undetermined βt and fe, while f (x) is the expression of the particle size distribution function f (d) within the integral. Given that f (d) may be discontinuous, it can be expressed in a summative form:
f e = i = 1 n f ( d i ) f 3 ( β t d i ) ( d n = d )

4.3. Cut Size d50c

The tracking behavior influences not only the separation limit coefficient c but also d50c. Tracking behavior, which involves changes in the centrifugal settling velocity of particles, typically leads to an increase in d50c. This shift can still be quantified by the coefficient fe. According to Qin [26], the change induced by tracking behavior can be equated to an increase in the average diameter of the LZVV in the equilibrium orbit model. Therefore, Equation (2) can be modified as follows:
d 50 c = 24.66 D in 0.87 f ( f e ) D z 1.13 ( 1 D in / D ) 0.8 [ ( 1 D o / D ) μ ( ρ p ρ ) Q h f ] 0.5
where fe denotes all particles affected by the tracking behavior:
f e = 0 d max f ( x ) f 3 ( β t x ) d x

4.4. Model Formulation

According to Yang [27], regression fitting techniques can be employed to determine the specific formulation of Equation (10). The grade efficiencies corresponding to each particle size of quartz, obtained from the experimental results, are substituted into the model. Each data set is then fitted independently to ascertain the values of each parameter within the mode. The accuracy of the fit can be quantified by the average deviation εg, defined as:
ε g = ( η cal ( d i ) η exp ( d i ) ) 2 n
where ηcal (di) and ηexp (di) represent the calculated and experimental values of the efficiency of a certain particle size, respectively; n is the number of fitted groups.
The model parameters in Equation (10) are compared with the actual operating parameters from the experiment. The value of βt is tied to the small particle size range (d < 10 μm), so the value of grade efficiency in this range is taken for fitting. The relationship between βt and Ru is shown in Figure 5, where the fitted equation is:
β t = 484.25 R u 2 27.62 R u + 154.8 ( Φ p 0.95 )
The average fitting deviation of this model is εg = 2.42, indicating that it is accurate.
The relationship between fe and βt is analyzed by comparison between the calculation results (Equation (13)) and experimental data. The value of fe depends on the large particle size range (d > 30 μm), so the efficiency value of this particle size range is taken for fitting. The relationship between βt and fe is shown in Figure 6, where the fitted equation is:
f e = 6.2 0 d f ( x ) β t x 0.32 d x
This model is also accurate, as per its average fitting deviation of εg = 2.53.
For Equation (15), the quartz cut size obtained from the experimental d50ce was compared with the cut size calculated by the model d50cm, then the form of f (fe) was determined by fitting each set of data separately. The relationship between d50ce/d50cm and fe is shown in Figure 7, expressed as follows:
d 50 c = 8.779 D in 0.87 f e 0.46 D z 1.13 ( 1 D in / D ) 0.8 [ ( 1 D o / D ) μ ( ρ p ρ ) Q h f ] 0.5
The average fitting deviation of the model is εg = 2.08, indicating high accuracy.
These results indicate that the proposed efficiency separation model can be formulated effectively by comprehensively considering the tracking effect of fine particles and the entrainment effect of large particles:
c = ln { 1 + 2.25 c v 2 / 3 e 5 c v [ β t d 3 f e ( d 0.35 1 ) ] ( 1 c v ) 4.5 a c d 2 ( ρ p ρ ) 18 μ } 0.0030784 D D o ( Δ P ρ ) 0.5
d 50 c = 20.83 f e 0.46 D z 1.13 D in 0.87 ( 1 D in / D ) 0.8 [ ( 1 D o / D ) μ ( ρ p ρ ) Q h f ] 0.5
Within this model, the calculated separation efficiency is influenced not only by the particle size, medium properties, and concentration but also significantly by the particle size distribution. For small particles, the acceleration mechanism induced by the tracking effect is predominant, leading to much higher centrifugal speeds than those predicted by Stokes’ law. In contrast, for large particles, the deceleration effect due to drag is predominant while changes in velocity due to entrainment are minimal. The actual centrifugal settling velocity for particles is slightly lower than that calculated by Stokes’ law because suspensions have a higher density and viscosity than pure water.

5. Validation of Proposed Model

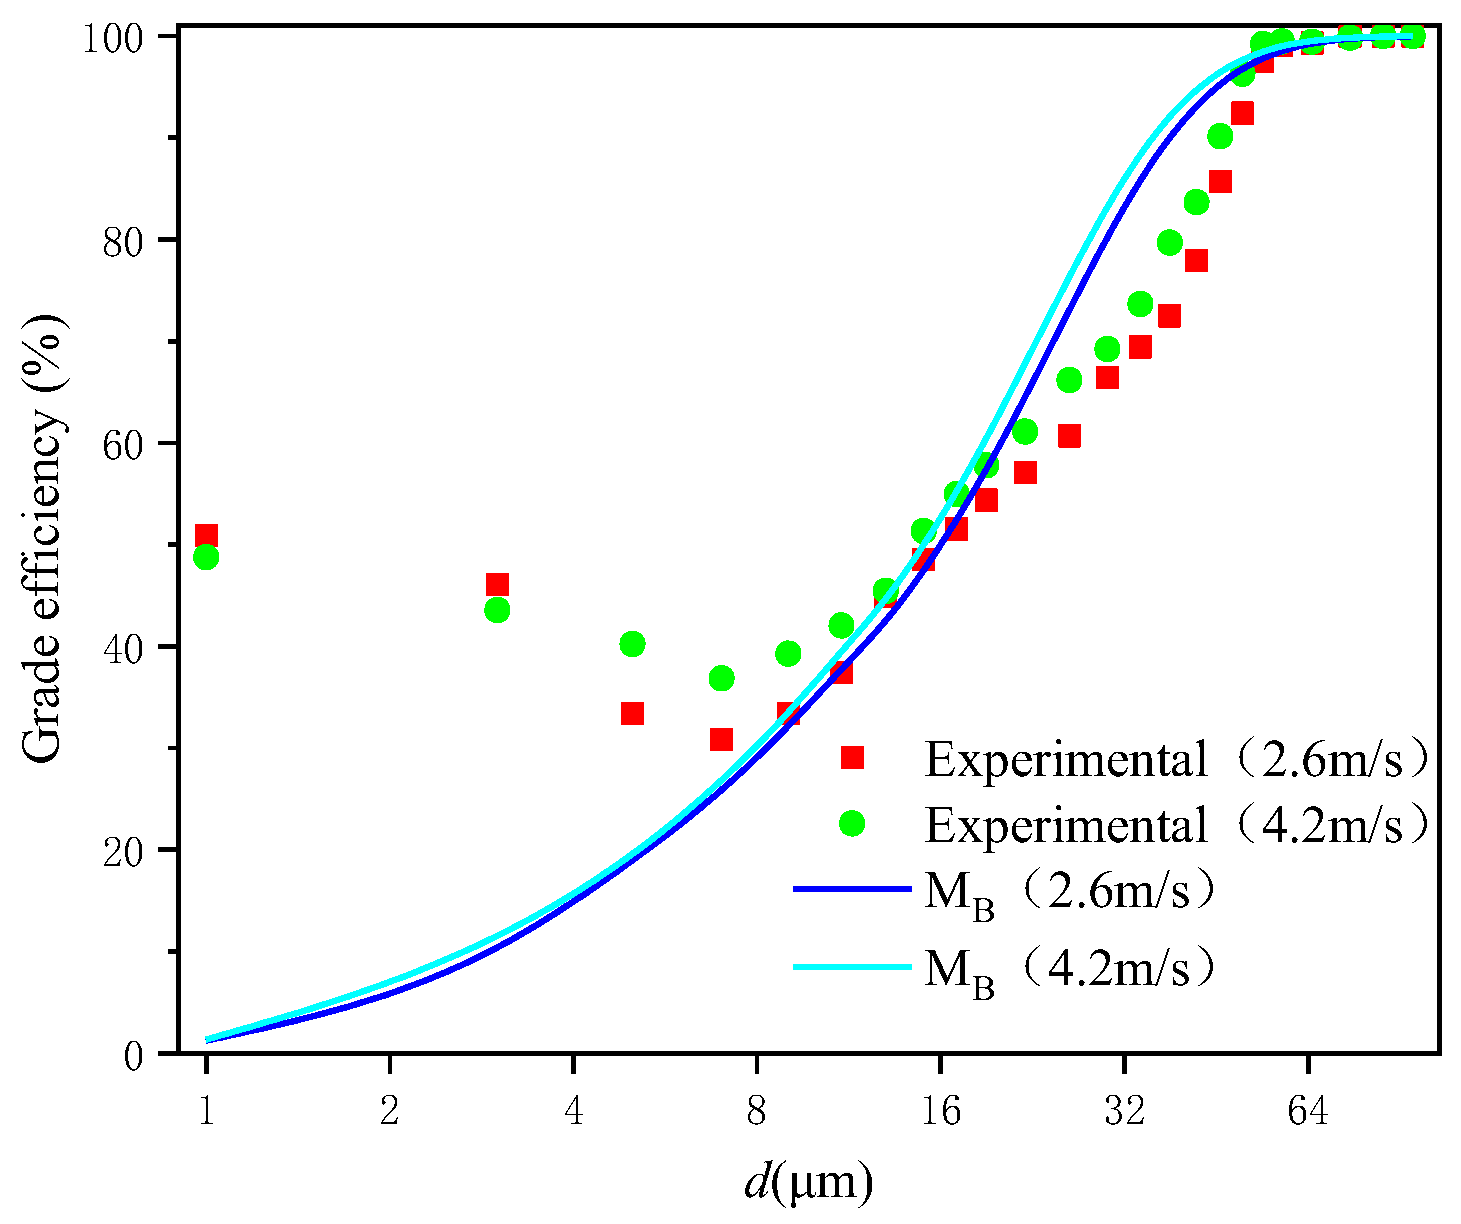
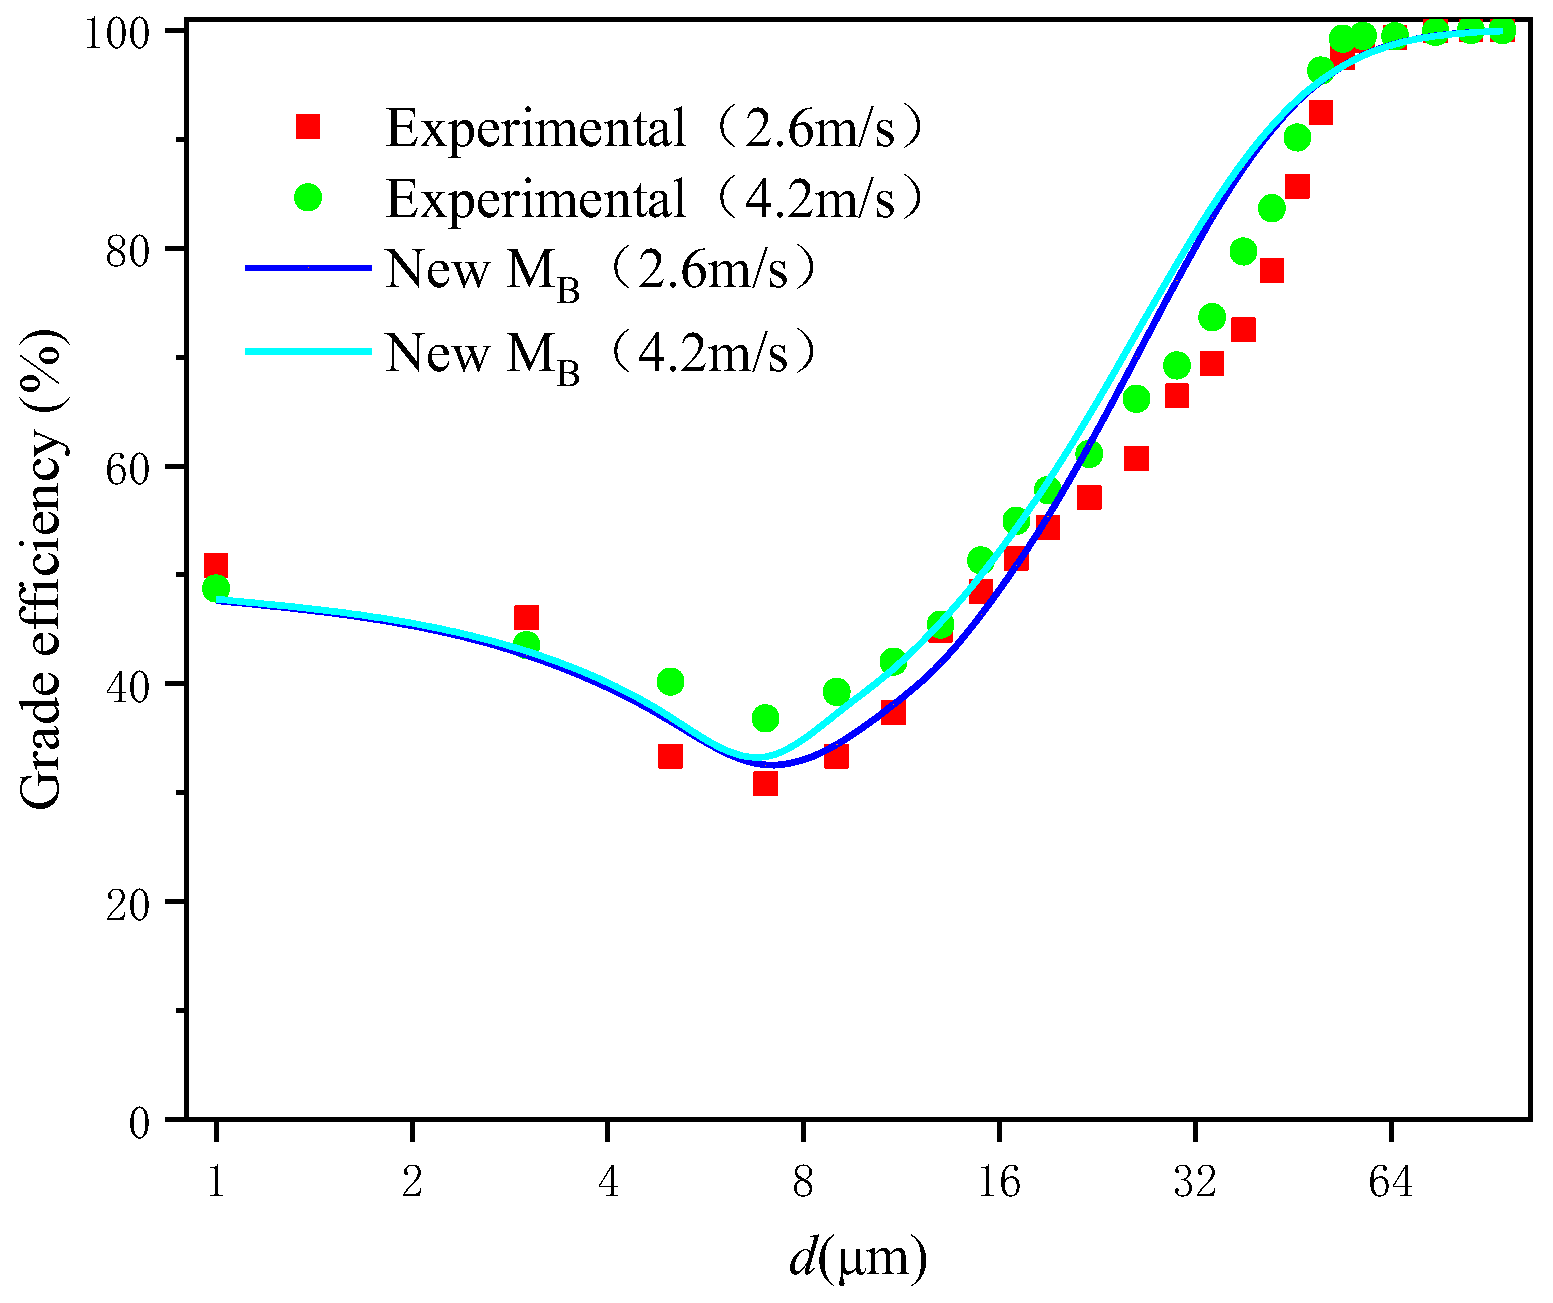
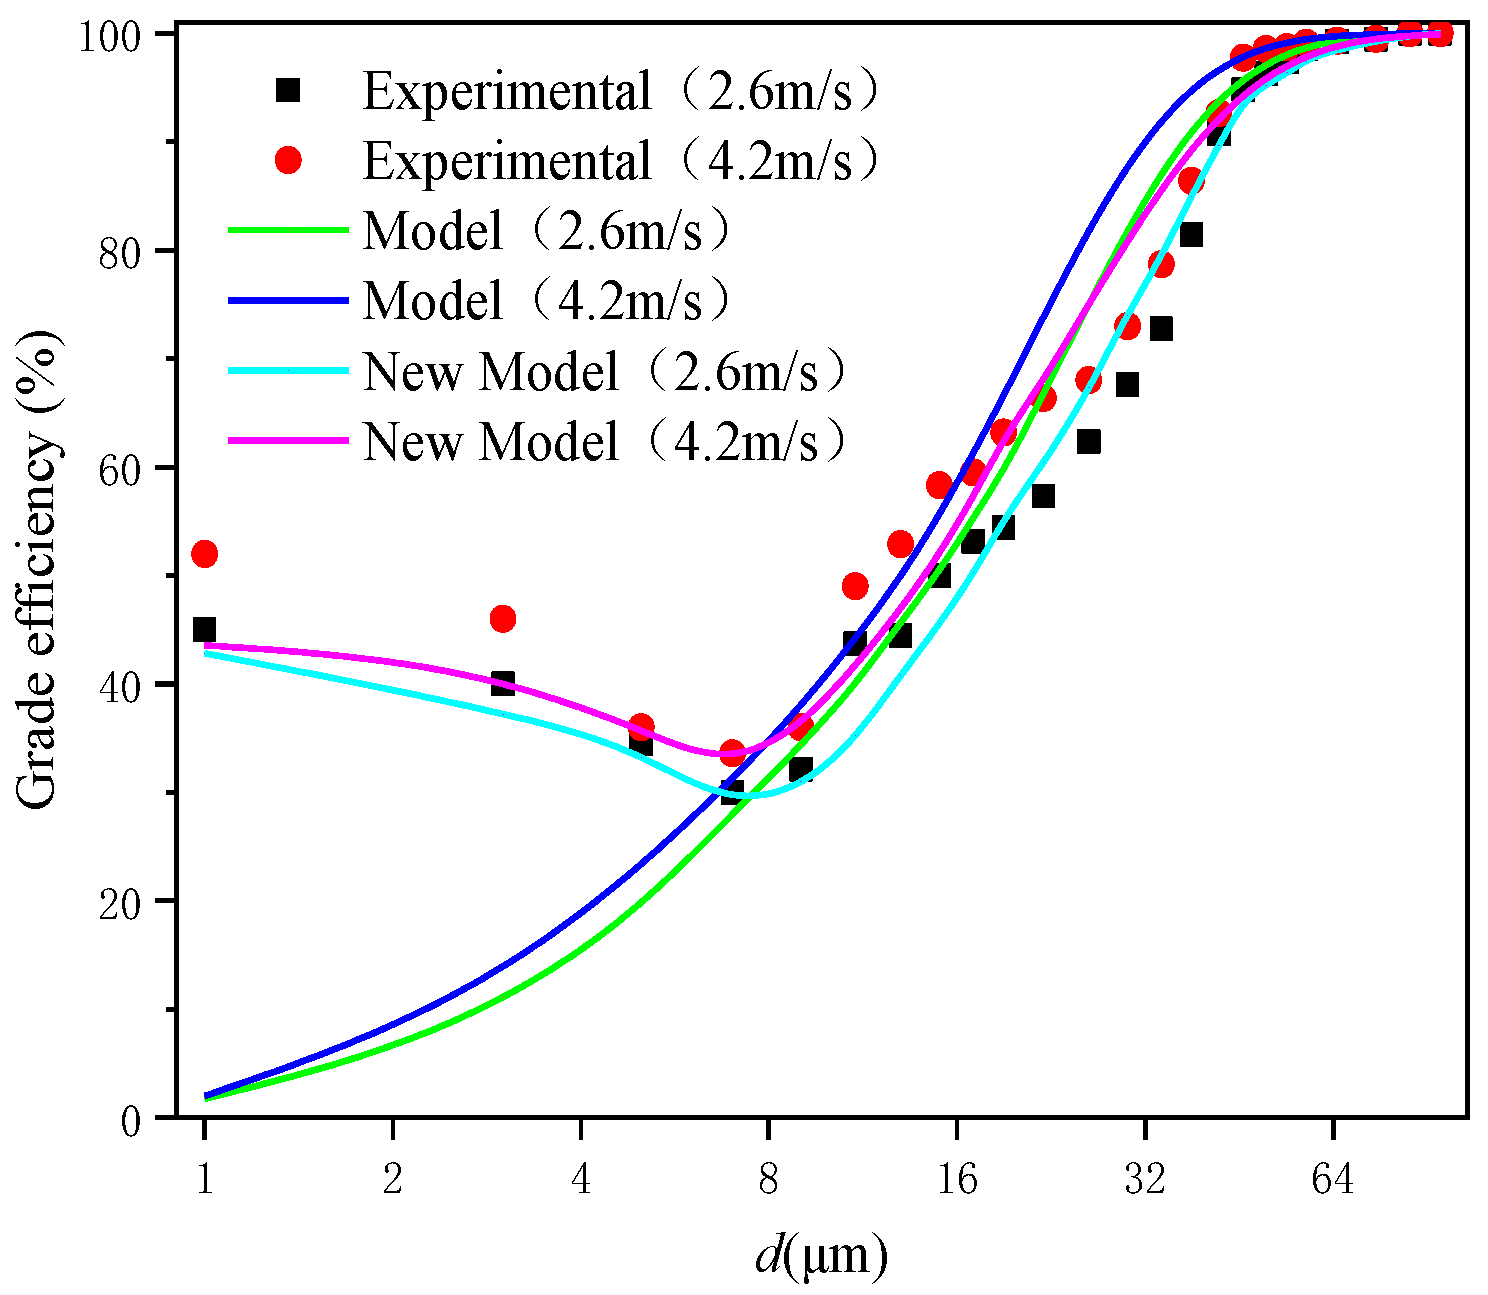
5.1. Comparison and Verification with Experimental Results

As depicted in Figure 8, the values calculated using the proposed model were compared with experimental values for quartz. The model generated grade efficiency curves with a fishhook shape, exhibiting only slight deviation from the experimental curves.
To determine the accuracy of the proposed model for other spherical particles, its calculated values were compared with the experimental values for glass frit. Highly spherical glass frit particles behave much differently than non-spherical particles, necessitating recalculation of βt:
β t = 496.25 R u 2 21.2 R u + 168.6 ( Φ p > 0.95 )
This model was highly accurate, as evidenced by its average fitting deviation of εg = 2.31.
Furthermore, according to Cao [28], replacing large particles has minimal impact on the underflow entrainment of fine particles; the influence of particle shape on fe can be ignored. As shown in Figure 9, the proposed model accurately calculated the fishhook-shaped particle efficiency curves, with only minor deviations from the experimental results.

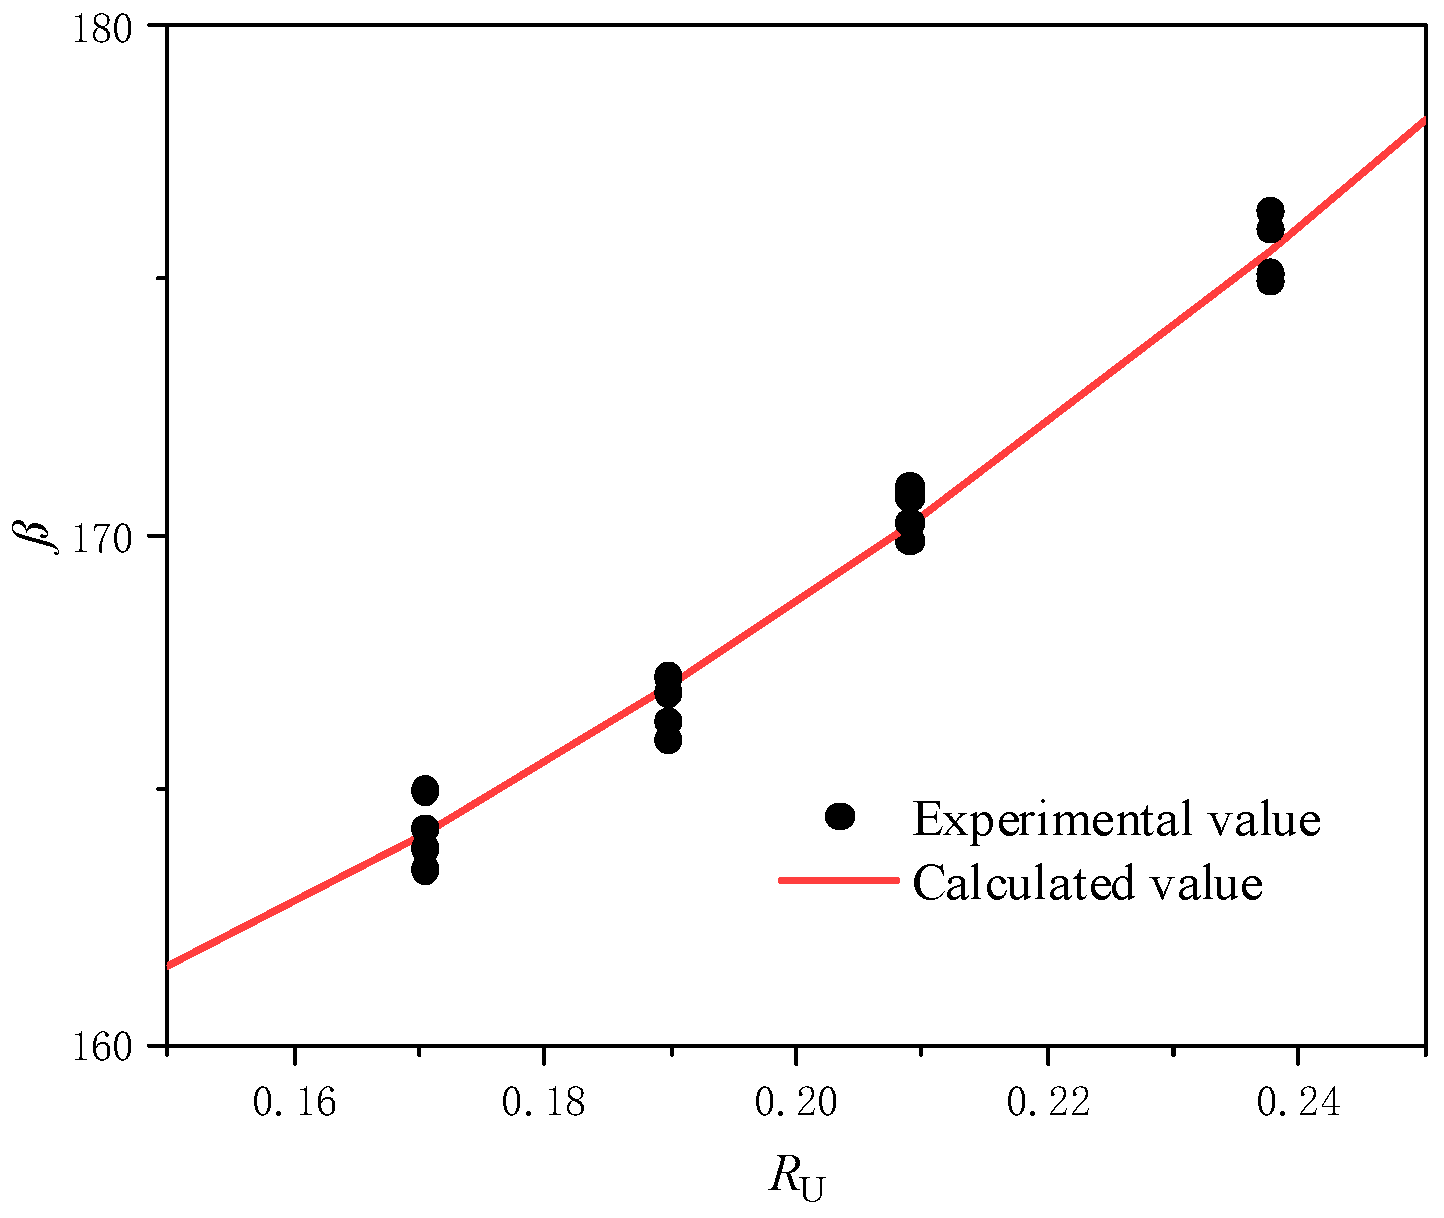
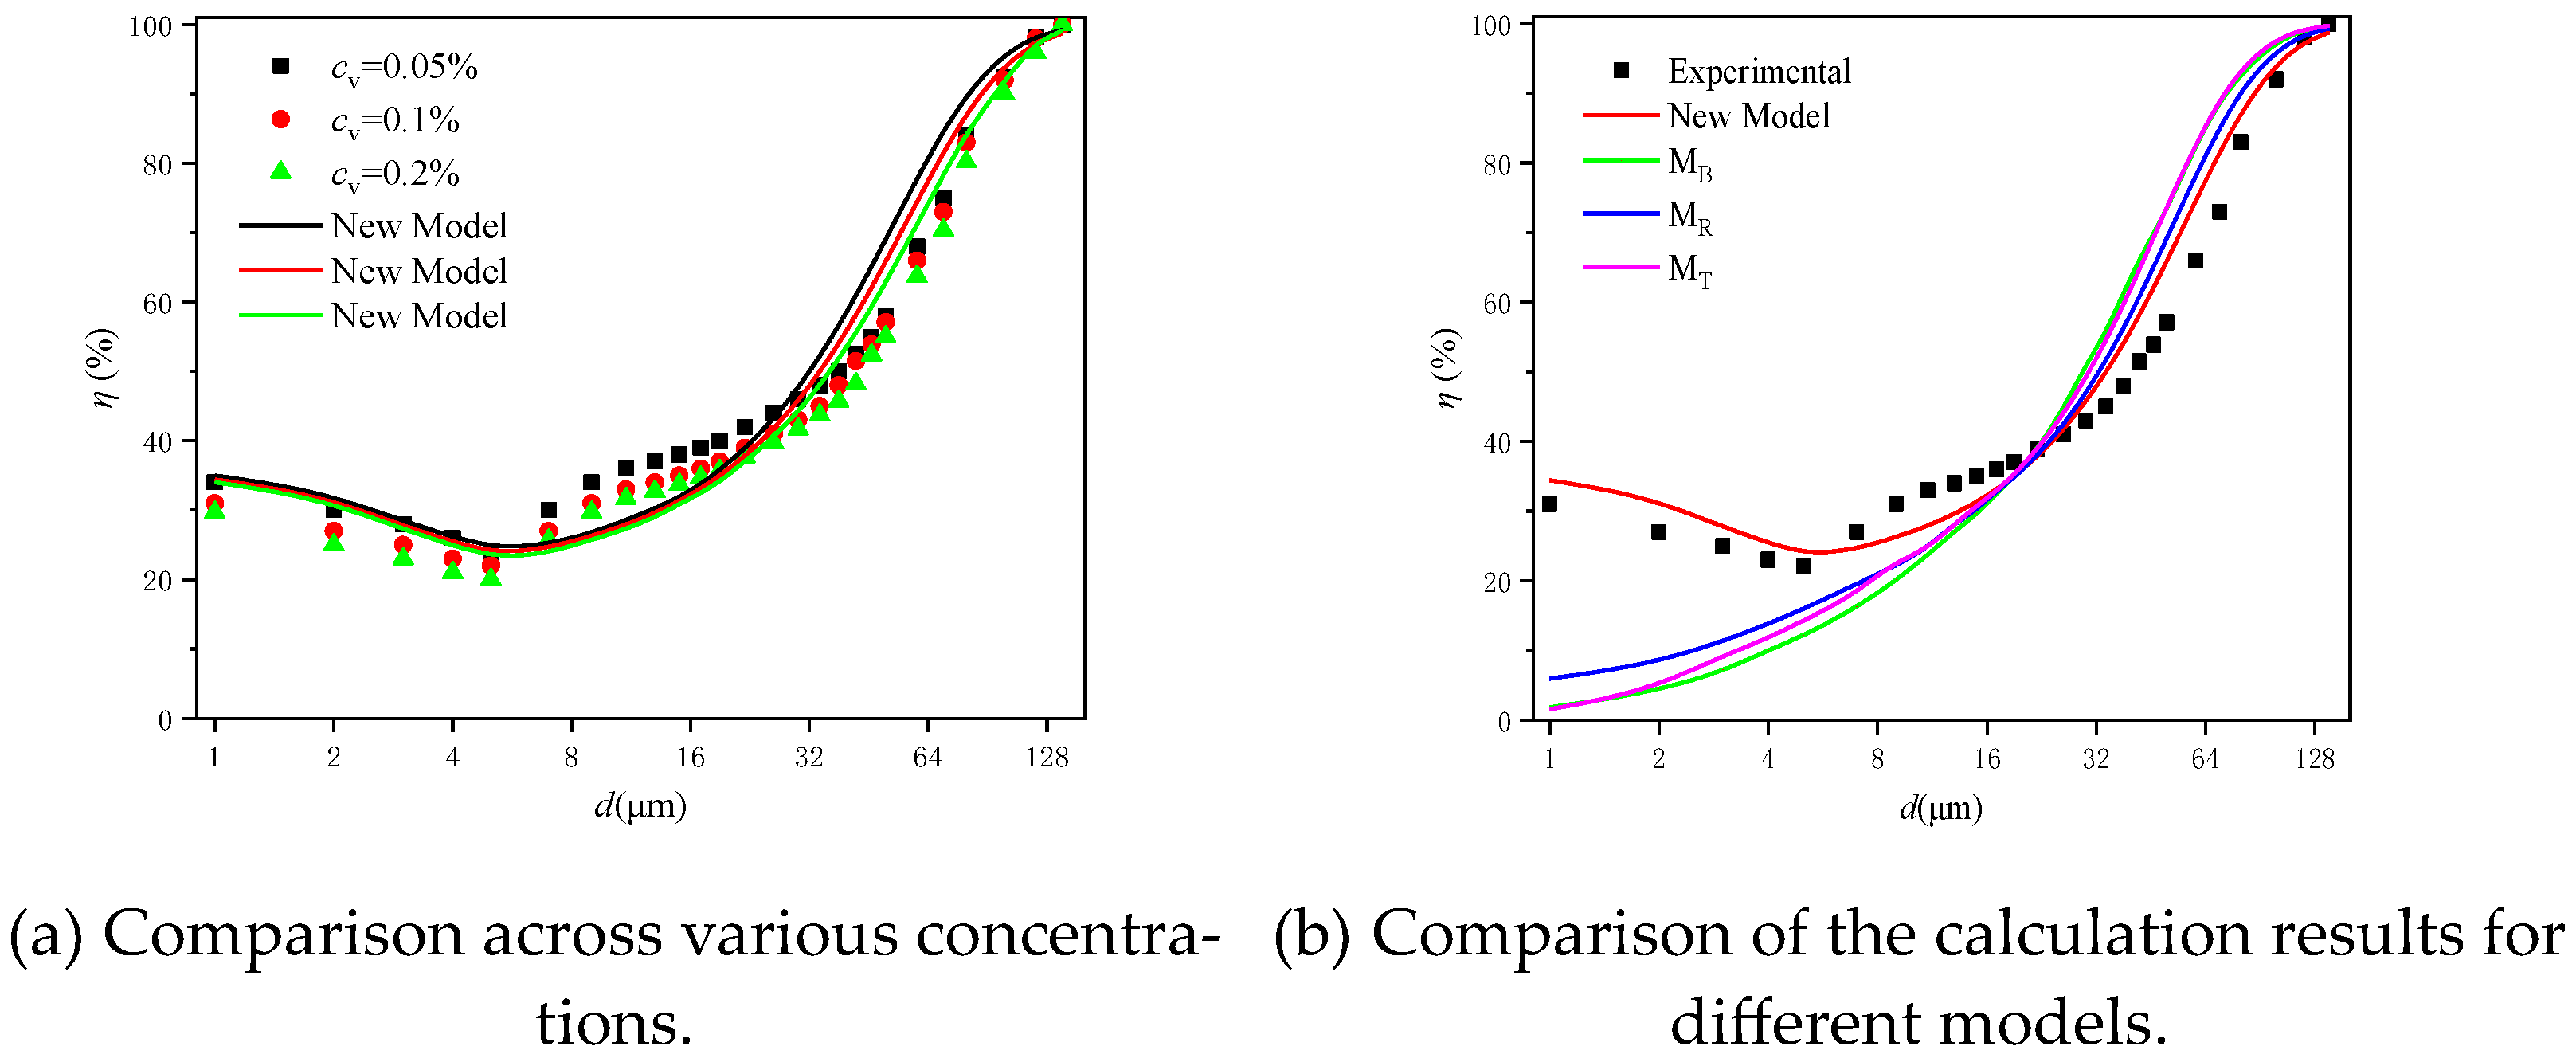
5.2. Verification of Proposed Model

The broader applicability of the proposed model was evaluated by comparing its results with findings from existing research. Abdollahzadeh [29] conducted experimental research on the effect of grade efficiency concentration in small hydrocyclones, and Jiang [30] investigated the grade efficiencies of hydrocyclones with different overflow pipe diameters. The structures of the hydrocyclones they used are described in Table 2.
Abdollahzadeh [29] used flake aluminum powder as a source of solid particles for their experiments, setting the inlet velocity to 5.05 m/s. Particle volume concentrations were set to 0.05%, 0.1%, and 0.2%. The results of the proposed model were compared to Abdollahzadeh’s results, as shown in Figure 10. Figure 10a provides a comparison across various concentrations, where grade efficiency slightly decreased as the concentration increased. The proposed model yielded results consistent with the experimental results.
Figure 10b shows a comparison of the calculation results for different models at a consistent concentration of 0.1%, where MB, MR, and MT represent the equilibrium orbit model, residence time model, and two-phase turbulence model, respectively. The proposed model not only accurately reflected the influence of concentration on grade efficiency, but also yielded calculations closer to the experimental results than the other three models.
Jiang [30] investigated the effect of different overflow pipe diameters on hydrocyclone performance though experiments conducted on a 5 mm-diameter hydrocyclone with non-spherical silica powder as the source of solid particles. The results of the proposed model were compared with Jiang’s results, as shown in Figure 11. Figure 11a provides a comparison across various hydrocyclone structures, where the grade efficiency decreased as the diameter of the overflow pipe increased; again, the proposed model showed the same trends as the experimental data.
Figure 11b shows a comparison among different models with a constant overflow pipe diameter of 25 mm. The proposed model accurately reflected the influence of different structures on grade efficiency while delivering results closer to the experimental data than the other three models.

6. Conclusions

A novel efficiency calculation method for hydrocyclones was established in this study through both theoretical analysis and mathematical fitting. The proposed model was designed to account for the underflow entrainment of fine particles. Its computational accuracy was evaluated through experimental validation and comparison against previous research findings. The main conclusions can be summarized as follows:
(1)
The proposed model leverages changes in centrifugal settling velocity to describe how underflow entrainment affects the separation performance of particles. Specifically, large particles experience a decrease in velocity due to the entrainment effect while small particles increase in velocity due to the tracking effect. These effects on particle velocity can be quantified using tracking and entrainment coefficients. The relationship between these coefficients and factors such as the structure of the hydrocyclone, operating conditions, and particle properties was successfully expressed through theoretical analysis and mathematical fitting.
(2)
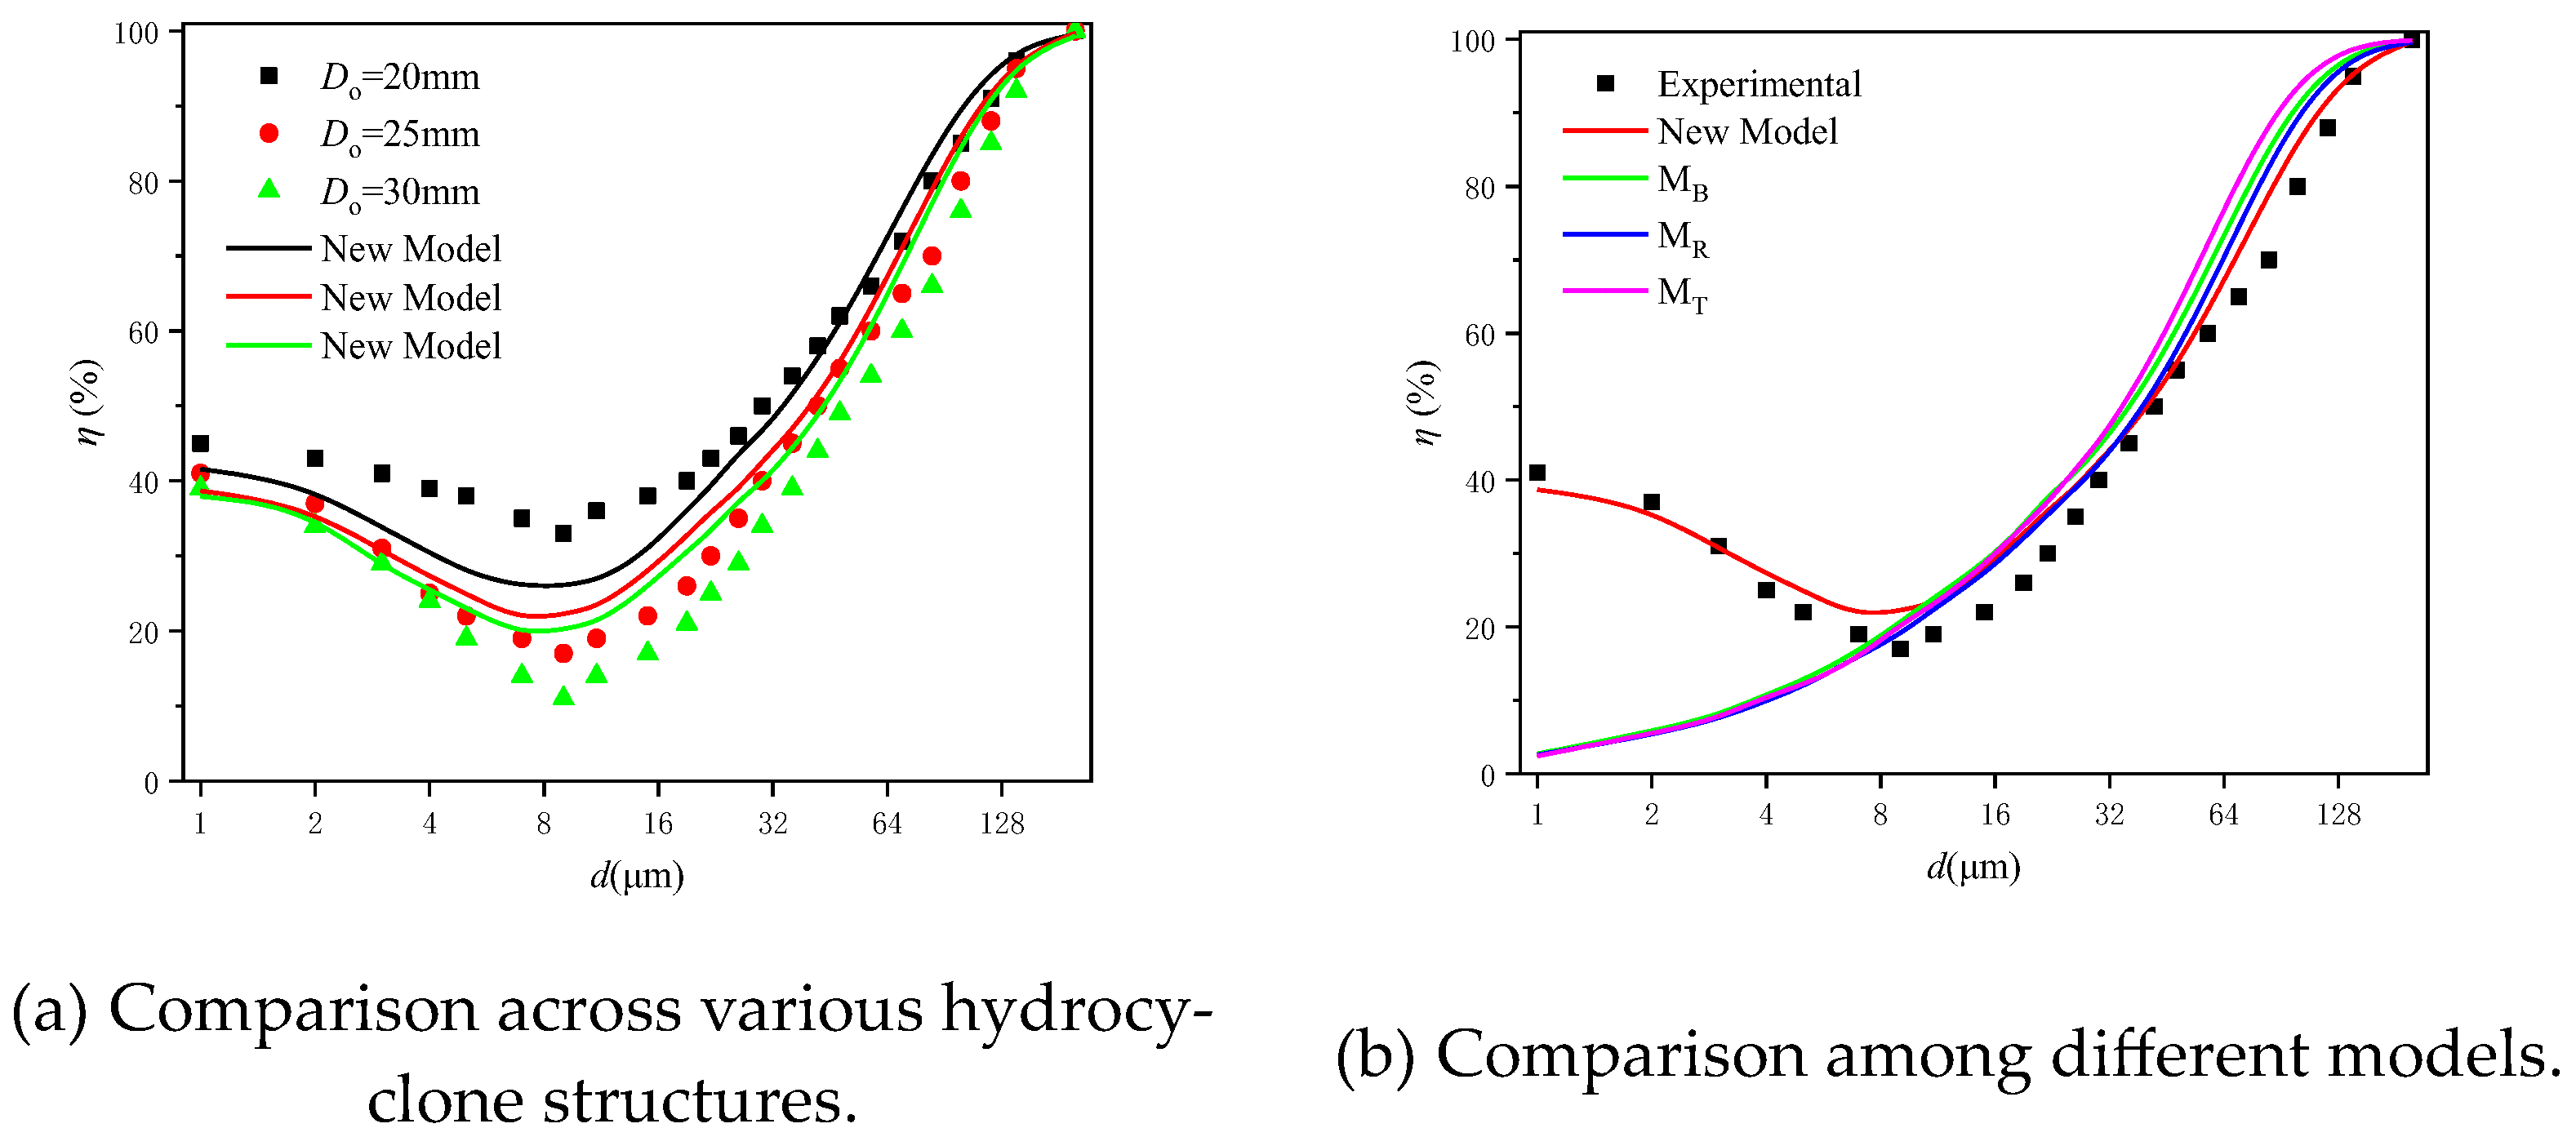
Experimental results showed that, compared to the original model, the proposed model’s efficiency calculations aligned more closely with experimental values and could accurately compute grade efficiency curves, including their fishhook segments. The model was validated based on experimental data from previous studies, demonstrating that despite variations in hydrocyclone structures, particle types, and particle concentrations, the proposed model captured the influence of various parameters and delivered consistently accurate calculation results.

Author Contributions

Conceptualization, J.C.; methodology, X.L. and H.C.; validation, H.Z. and Y.S.; formal analysis, X.M.; resources, J.C. and X.M.; data curation, X.L.; writing—original draft preparation, X.L. and J.C.; writing—review and editing, X.L. and J.C.; visualization, H.Z. and Y.S.; supervision, J.C.; project administration, J.C.; funding acquisition, J.C. All authors have read and agreed to the published version of the manuscript.

Funding

This work is supported by the National Natural Science Foundation of China Youth Fund (11803013) and the Basic Scientific Research Business Cost Scientific Research Project of Heilongjiang Provincial Colleges and Universities (135509209).

Data Availability Statement

The original contributions presented in the study are included in the article, further inquiries can be directed to the corresponding author.

Conflicts of Interest

The authors declare that the research was conducted in the absence of any commercial or financial relationships that could be construed as a potential conflict of interest.

References

  1. Cilliers, J.; Diaz-Anadon, L.; Wee, F. Temperature, classification and dewatering in 10 mm hydrocyclones. Miner. Eng. 2004, 17, 591–597. [Google Scholar] [CrossRef]
  2. Tang, X. Influence of feed rate on the performance of hydrocyclone flow field. Separations 2022, 9, 349. [Google Scholar] [CrossRef]
  3. Zhao, Q.; Cui, B.; Zou, G.; Song, T.; Yang, T.; Zhou, J.; Shen, Y. Evaluation and improvement of mathematical models for hydrocyclone classifiers part I: Laboratory scale. Powder Technol. 2023, 427, 118718. [Google Scholar] [CrossRef]
  4. Xia, Y.; Deng, S.; Gu, M.; Jiao, G.; Zhang, F. Field simulation of liquid-liquid hydrocyclone based on large eddy theory. DBLP 2009, 62, 901. [Google Scholar] [CrossRef]
  5. Padhi, M.; Kumar, M.; Mangadoddy, N. Understanding the bicomponent particle separation mechanism in a hydrocyclone using a computational fluid dynamics model. Ind. Eng. Chem. Res. 2020, 59, 11621–11644. [Google Scholar] [CrossRef]
  6. Alper, N.; Okay, A. Considering hydrocyclone operation for tailings dewatering purpose and its effects on product specifications of paste backfill operations. Miner. Eng. 2021, 173, 107176. [Google Scholar] [CrossRef]
  7. Liu, P.; Fu, W.; Jiang, L. The separation performance of a parabolic hydrocyclone in separating iron from red mud. Powder Technol. 2023, 416, 118205. [Google Scholar] [CrossRef]
  8. Nageswararao, K.; Karri, B. Fish hook in classifier efficiency curves: An update. Sep. Purif. Technol. 2015, 158, 31–38. [Google Scholar] [CrossRef]
  9. Izquierdo, J.; Sukunza, X.; Espinazo, P.; Vicente, J.; Aguado, R.; Olazar, M. Quantitative assessment of the prominence of fish hooks in hydrocyclones over different operation and geometrical parameters. Powder Technol. 2024, 431, 119079. [Google Scholar] [CrossRef]
  10. Zhang, Y.; Cai, P.; Jiang, F.; Dong, K.; Jiang, Y.; Wang, B. Understanding the separation of particles in a hydrocyclone by force analysis. Powder Technol. 2017, 322, 471–489. [Google Scholar] [CrossRef]
  11. Zhu, G.; Liow, J. Experimental study of particle separation and the fishhook effect in a mini-hydrocyclone. Chem. Eng. Sci. 2014, 111, 94–105. [Google Scholar] [CrossRef]
  12. Chen, Q.; Zhuang, Y.; Zhao, J.; Li, B.; Fan, W. Study on the impedance dynamics and control of the active suspensions based on the equilibrium trajectory error. J. Vib. Control. 2023, 29, 479–491. [Google Scholar] [CrossRef]
  13. Bram, M.; Hansen, L.; Hansen, D.; Yang, Z. Hydrocyclone separation efficiency modeled by flow resistances and droplet trajectories. IFAC-Pap. Line 2018, 51, 132–137. [Google Scholar] [CrossRef]
  14. Zeng, X.; Fan, G.; Wang, M.; Zhao, L.; Yan, C. Experimental and numerical study on the length of LZVV in the bubble separator for molten salt reactor. Nucl. Eng. Des. 2023, 401, 112100. [Google Scholar] [CrossRef]
  15. Zhao, Q.; Cui, B.; Ji, A.; Song, T.; Shen, Y. Experimental and numerical study of the effect of particle size distribution on hydrocyclone classification. Adv. Powder Technol. 2024, 35, 104398. [Google Scholar] [CrossRef]
  16. Schubert, H. On the Origin of “Anomalous” Shapes of the Separation Curve in Hydrocyclone Separation of Fine Particles. Part. Sci. Technol. 2004, 22, 219–234. [Google Scholar] [CrossRef]
  17. Patra, G.; Chakraborty, S.; Meikap, B. Role of vortex finder depth on pressure drop and performance efficiency in a ribbed hydrocyclone. South Afr. J. Chem. Eng. 2018, 25, 103–109. [Google Scholar] [CrossRef]
  18. Kashiwaya, K.; Noumachi, T.; Hiroyoshi, N.; Ito, M.; Tsunekawa, M. Effect of particle shape on hydrocyclone classification. Powder Technol. 2012, 226, 147–156. [Google Scholar] [CrossRef]
  19. Dueck, G.; Minkov, L.; Pikushchak, V. Modeling of the fish-hook-effect in a classifier. J. Eng. Phys. Thermophys. 2007, 80, 64–73. [Google Scholar] [CrossRef]
  20. Majumder, A.; Shah, H.; Shukla, P. Effect of operating variables on shape of “fish-hook” curves in cyclones. Miner. Eng. 2007, 20, 204–206. [Google Scholar] [CrossRef]
  21. Eswaraiah, C.; Angadi, S.; Mishra, B. Mechanism of particle separation and analysis of fish-hook phenomenon in a circulating air classifier. Powder Technol. 2012, 218, 57–63. [Google Scholar] [CrossRef]
  22. Padhi, M.; Mangadoddy, N.; Sreenivas, T.; Vakamalla, T.R.; Mainza, A.N. Study on multi-component particle behaviour in a hydrocyclone classifier using experimental and computational fluid dynamics techniques. Sep. Purif. Technol. 2019, 229, 115698. [Google Scholar] [CrossRef]
  23. Wan, Z.; Zhou, K.; Yang, W.; You, Z.; Sun, K. Effect of rotational diffusion of anisotropic particles on the stability of a suspension shear flow. Fluid Dyn. Res. 2019, 51, 035507. [Google Scholar] [CrossRef]
  24. Tian, J.; Wang, H.; Lv, W.; Huang, Y.; Fu, P.; Li, J.; Liu, Y. Enhancement of pollutants hydrocyclone separation by adjusting back pressure ratio and pressure drop ratio. Sep. Purif. Technol. 2020, 240, 116604. [Google Scholar] [CrossRef]
  25. Spelay, B.; Hashemi, A.; Gillies, G.; Sanders, R.S. A multispecies 1D concentration distribution model for coarse-particle slurries. Can. J. Chem. Eng. 2022, 100, 2245–2258. [Google Scholar] [CrossRef]
  26. Qin, F.; Ping, Z.; Gang, J. Modeling on Hydrocyclone Separation Performance by Neural Network. Appl. Mech. Mater. 2011, 105–107, 185–188. [Google Scholar] [CrossRef]
  27. Muthukrishnan, R.; Kalaivani, S. Data depth approach in fitting linear regression models. Mater. Today Proc. 2022, 57, 2212–2215. [Google Scholar] [CrossRef]
  28. Cao, M.; Chen, J.; Hu, B.; Fan, X.; Cui, H.; Wei, Y. Measurements of particle velocity and solid concentration near the wall of a cyclone using high-speed particle shadow velocimetry. Powder Technol. 2023, 426, 226–237. [Google Scholar] [CrossRef]
  29. Rahimi, M.; Abdollahzadeh, A.; Rezai, B. The Effect of Particle Size, pH, and Flocculant Dosage on the Gel Point, Effective Solid Stress, and Thickener Performance of a Coal-Washing Plant. Int. J. Coal Prep. Util. 2015, 35, 125–142. [Google Scholar] [CrossRef]
  30. Jiang, L.; Liu, P.; Yang, X.; Zhang, Y.; Li, X.; Zhang, Y.; Wang, H. Effect of Overflow Pipe on the Internal Flow Fields and Separation Performance of W-Shaped Hydrocyclones. Minerals 2020, 10, 329. [Google Scholar] [CrossRef]
Figure 1. Loop of experimental system. 1—agitator; 2—slurry tank; 3—reflux tank; 4—main valve; 5—centrifugal pump; 6—motor; 7—circulating pipe; 8—electromagnetic flowmeter; 9—suction pipe; 10—pressure gauge; 11—bottom flow valve; 12—hydrocyclone.
Processes 12 01710 g001
Figure 2. Powder particle size distributions.
Processes 12 01710 g002
Figure 3. Hydrocyclone geometry (the unit in the figure is mm).
Processes 12 01710 g003
Figure 4. Comparison of quartz grade efficiencies.
Processes 12 01710 g004
Figure 5. Relationship between model parameters and operating variants.
Processes 12 01710 g005
Figure 6. Fitting of model parameters.
Processes 12 01710 g006
Figure 7. Fitting of model parameters for d50c.
Processes 12 01710 g007
Figure 8. Comparison of quartz grade efficiencies between new model and experimental values.
Processes 12 01710 g008
Figure 9. Comparison of glass frit grade efficiencies.
Processes 12 01710 g009
Figure 10. Comparison between proposed and Abdollahzadeh’s models.
Processes 12 01710 g010
Figure 11. Comparison between proposed model and Jiang’s model.
Processes 12 01710 g011
Table 1. Physical properties of experimental powders.
ParticlesD50DensitySphericity
Quartz35.76 μm2.7 g/cm30.74
Glass frit40.52 μm2.56 g/cm30.98
Table 2. Structural dimensions of experimental hydrocyclone models.
Structure ParametersAbdollahzadeh (mm)Jiang (mm)
D1575
Din4.218
Do5.125
H15120
H27997
Du315
Disclaimer/Publisher’s Note: The statements, opinions and data contained in all publications are solely those of the individual author(s) and contributor(s) and not of MDPI and/or the editor(s). MDPI and/or the editor(s) disclaim responsibility for any injury to people or property resulting from any ideas, methods, instructions or products referred to in the content.

