Article

Insights into the Pattern of the Persistent Heavy Metal Pollution in Soil from a Six-Decade Historical Small-Scale Lead-Zinc Mine in Guangxi, China

1
China Energy Engineering Group Guangxi Electric Power Design Institute Co., Ltd., Nanning 530000, China
2
School of Environment, Northeast Normal University, Changchun 130117, China
3
State Environmental Protection Key Laboratory of Wetland Ecology and Vegetation Restoration, School of Environment, Northeast Normal University, Changchun 130117, China
4
China Power Engineering Consulting Group Co., Ltd., Beijing 100000, China
5
Technical Innovation Center of Mine Geological Environmental Restoration Engineering in Southern Karst Area, Ministry of Natural Resources, Nanning 530000, China
*
Author to whom correspondence should be addressed.
These authors contributed equally to this work.
Processes 2024, 12(8), 1745; https://doi.org/10.3390/pr12081745
Submission received: 23 July 2024 / Revised: 9 August 2024 / Accepted: 12 August 2024 / Published: 20 August 2024
(This article belongs to the Section Environmental and Green Processes)

Abstract

:
Soil heavy metal pollution is one of the hottest topics in soil environmental research. There are a large number of small abandoned metal mines in China. Due to the lack of timely restoration and treatment, the heavy metal concentration in the soil within these mining areas often exceeds the local background levels, facilitating pollution spread to other natural factors such as precipitation, resulting in a wider extent of continuous contamination. This paper investigates the current status of heavy metal pollution in an abandoned small lead-zinc mine, particularly examining the concentrations of 10 specific heavy metals (V, Cr, Ni, Zn, As, Cd, Hg, Pb, Cu, Co) in soil samples. Additionally, it explores the extent of contamination caused by these heavy metals within the area. Besides, principal component analysis and positive matrix factorization model (PMF) were adopted to determine the sources of these heavy metals. The risk assessment of the pollution status was also carried out. The provision of a scientific basis for mining area management under similar conditions holds significant importance. The results indicate a significant positive correlation among the majority of these 10 heavy metals in soil. The presence of these heavy metals in the soil within the concentrator and tailings reservoir area primarily stems from mining operations, construction activities, and discharges from the power system. Hg, Pb, Zn, and As in the surrounding agricultural land mainly come from the heavy metal spillover from the mining area. Furthermore, the area is plagued by severe contamination from As and Pb. The Nemerow comprehensive index method has confirmed substantial pollution in both the concentrator and tailings reservoir. Additionally, there exists a substantial ecological risk ranging from moderate to high.

1. Introduction

Soil heavy metal pollution is one of the hot issues in the field of ecological environment [1]. Heavy metal pollution in soil has the characteristics of concealment, persistence, lag, and irreversibility [2,3]. Heavy metals in soil will also cause pollution to surface water and groundwater, endanger the quality and safety of agricultural products, and further endanger human health [4,5].
The study of the spatial distribution of heavy metal accumulation in mining soil and the identification of pollution sources are key issues in the prevention and control of heavy metal pollution in mining soil [6,7]. China is one of the largest producers and consumers of lead and zinc in the world [8]. Large-scale mining of lead and zinc mines has stimulated the development of local economy, but heavy metal pollution caused by wastewater, waste residue and dust generated during ore processing has also seriously affected the soil and groundwater in the mining area and surrounding areas [9,10,11]. For example, in the Dabaoshan mining area in southern China, mining waste containing a large number of heavy metal elements has accumulated in the mining area, and the wastewater discharged from the mine has gradually seeped into the groundwater from the soil, and the shallow aquifer was polluted by various heavy metals in the downstream of this region. As a result of long-term weathering, erosion, and water transport, the water transports the minerals in the area to the alluvial fan area and deposit on the surface, presenting the regional pollution of heavy metals [5]. The environmental problems left by waste lead-zinc mining areas need to be solved urgently [12,13].
As a place for stacking slag, the heavy metal elements in the tailings pond are affected by water leaching, oxidation, and gravity infiltration, which is likely to cause the migration of pollutants [14,15,16,17]. For example, Lee JY et al. conducted a study on the changes in heavy metal pollution in water streams and groundwater of an abandoned lead-zinc mine during 2002–2003. The study revealed that even after the mine was abandoned, it continued to release heavy metal pollutants into the surrounding environment. [14]. The surface water flowing near the tail mining area may bring heavy metals into agricultural land or other waters [17]. The migration of heavy metals in water contains a number of complex physical, chemical, and biological processes, which mainly include a variety of heavy metals in dissolved and granular forms and in the form of attachments under the action of physical, chemical, and biological gradually migrating to other environments and food chains [14,18]. Moreover, multiple migration and transformation processes of heavy metals in water environment are carried out simultaneously [19,20,21]. In addition, under the action of natural leaching, heavy metal ions in tailings will dissolve, migrate, and precipitate and enrich in a particular area [22]. Therefore, it is of great significance to identify the release and migration rules of heavy metals from tailings ponds for comprehensive management of the tailings pond environment [23,24].
Guangxi province is a prominent mining province in China, especially rich in non-ferrous metal resources [25]. Wuxuan County, located in Laibin City, Guangxi Province, is a typical resource-exhausted city. It has many abandoned mines left over from early mining. Its urban development history, population size and urban planning are representative of resource-exhausted cities all over China. The urgent resolution of heavy metal pollution resulting from lead-zinc mining is currently imperative [26,27]. This study analyzed the present condition and spatial distribution characteristics of heavy metal pollution in the Wuxuan lead-zinc tail mining area and carried out an ecological risk assessment for the study area in order to clarify the long-term impact of early lead-zinc mining activities on the concentration and spatial distribution of heavy metals in soil. It also provides some reference for the environmental assessment and restoration of other similar mining areas after the cessation of mining activities.

2. Materials and Methods
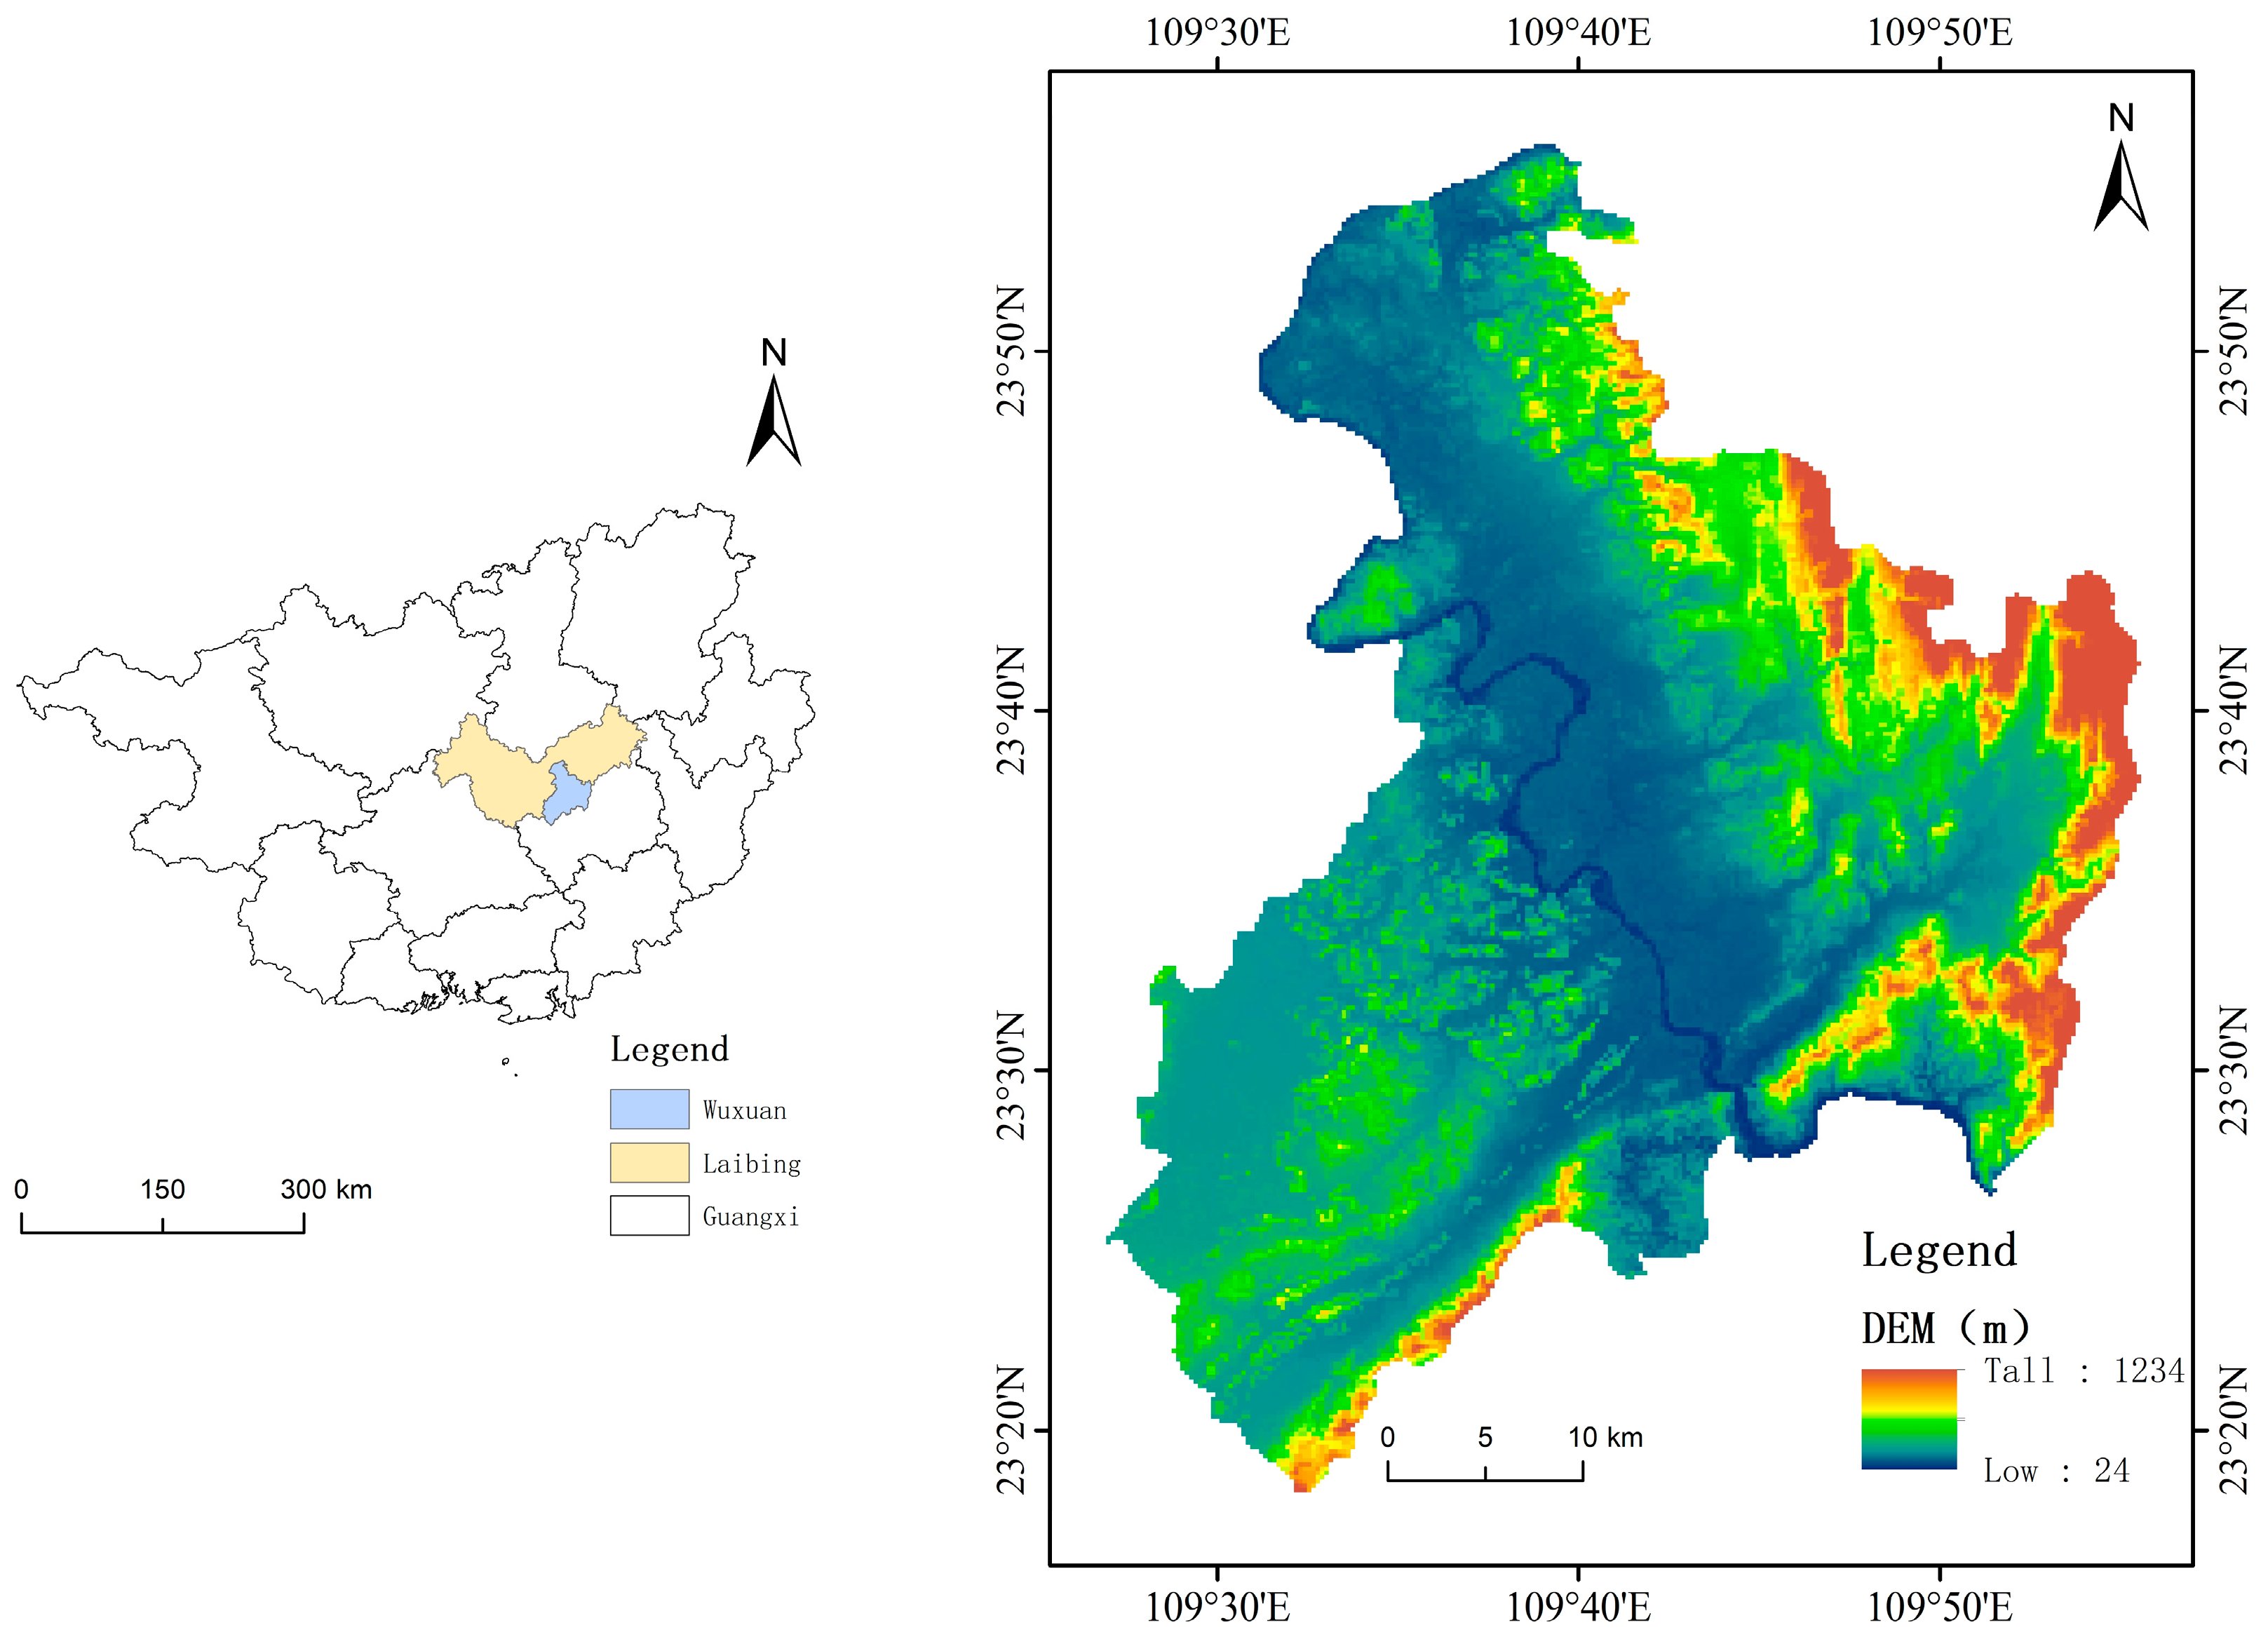
2.1. Study Area

As shown in Figure 1 the research area is located in Sha’an Village, Sanli Town, Wuxuan County, Guangxi Province. Wuxuan County is located in the middle of Guangxi Province, southeast of Laibin City, latitude and longitude coordinates are: 109°27′ E–109°46′ E, 23°19′ N–23°56′ N. Sanli Town is located in the southeast of Wuxuan County [28]. Sanli Town belongs to the hilly landform, to the east is Dayao Mountain, mountains continuous. The western part of the land is low, there is a large area of arable land, and its soil geological characteristics are quaternary sandy mudstone and red loam [29].
Wuxuan County has a mild climate, with an average temperature of 10.0 °C in January, 28.8 °C in July and 21.0 °C annually. The average annual rainfall is 1351.7 mm. Its mineral resources mainly include manganese, lead, pyrite, marble, and barite [28]. Sanli Town is located at a low latitude on the Tropic of Cancer and has a subtropical monsoon climate [29].

2.2. Sampling and Analysis Processes

In this study, according to the differences of topography, landforms and types, the study area is divided into the Sanli Sha’an concentrator and tailings reservoir area, the surrounding area of the mining area, and the area far away from the mining area. This study referred to the layout of sampling grids in previous studies conducted in mining areas; we performed accuracy estimation and ultimately determined that the Sanli Sha’an concentrator and tailings pond in the study area should be divided into uniform grids measuring 100 m × 100 m. Each grid in the mining area is distributed with 1 sampling point, and a total of 64 sampling points are set and can be adjusted according to the actual situation, as shown in Figure 2. A uniform grid of 800 m × 800 m is arranged around and away from the mining area, and four sampling points are arranged in each grid.
In the concentration plant of Sanli Town, Wuxuan County, its tailings pond and the downstream agricultural land, a 1 m × 1 m square sampling square, was set with each sampling point as the center, and soil samples were collected at four corners, and central points within the sampling square, and five equal volume small samples were collected and evenly mixed into one sample. When collecting soil samples, the longitude, latitude, and elevation of the sample points are recorded synchronously with GPS. The soil sample collection method was a five-point collection and method of coning and quartering. Since the topsoil represents the status of heavy metal contamination in the area, 0–15 cm of surface soil was selected as the sample at the sampling point, and debris and plant roots were removed from the sample. The weight of soil samples collected at each sampling point was about 1 kg, and the samples were put in a cool and ventilated place to dry, and the soil samples were ground and screened after drying, then stored under seal. In order to further analyze the content of heavy metals in soil samples and study the occurrence, migration, and transformation of heavy metals in soil, the measurement indexes were the soil’s physical and chemical properties and heavy metal content.
Determination of soil physical and chemical properties of soil samples: Using the “Potential method for the determination of soil pH Value” (HJ962−2018), the pH meter is utilized for the measurement of soil pH.
Determination of heavy metals in soil samples: eight kinds of heavy metals Pb, Cu, Cd, Zn, Cr, Ni, Co, and V were determined by ICP-MS (iCAP RQ, Thermofisher, Shanghai, China) according to GB/T 14506.30−2010. Hg and As contents were determined by atomic fluorescence spectrometer (fls920p, edinburgh) according to DZ/T0279.17−2016. In order to make the experiment with better accuracy and reproducibility, three parallel groups were set.

2.3. Methods of Risk Assessment

(1) The Single-Factor Pollution Index Method
The single-factor pollution index can characterize the extent to which the measured value of heavy metals exceeds the standard limit value. When any of the indicators of a single sample exceeds its evaluation base, it indicates that the soil sample is likely to be contaminated. The single-factor pollution index (Pi) used to evaluate the degree of heavy metal pollution was determined by Formula (1) [30]:
P i = C i / S i
where Pi is the pollution index of a particular substance i in the soil, Ci is the measured value of a single pollutant in the soil, and Si is its pollution standard value, mg/kg.
Considering there is no future land use plan in the study area, and the geographical location is surrounded by rural areas and farmland, from a conservative perspective, the soil pollution evaluation in this study takes the Standard for Soil Environmental Quality Management and Control of Soil Pollution Risk of Agricultural Land (Trial) (GB 15618−2018) as the evaluation standard. For details, see Table 1:
(2) The Nemerow Comprehensive Pollution Index Method
The Nemerow comprehensive pollution index method is a pollution evaluation method based on the single-factor index method, which can evaluate the combined pollution of multiple heavy metals at a certain point [31,32]. The calculation formula is shown in Formula (2):
P I = P i m a x 2 + P i a v e 2 2
where PI is the comprehensive pollution index, P i m a x 2 is the square of the maximum value of the pollution index Pi of each heavy metal element, and P i a v e 2 is the square of the average value of the pollution index Pi of each heavy metal element. The more serious the heavy metal pollution, the larger the value [32]. The classification of the Nemerow pollution index is shown in Table 2:
(3) The Geo-Accumulation Index Method
The geo-accumulation index is used to reflect the level of contamination of a particular metal in the soil by assessing the degree of metal enrichment above baseline or background values [33,34,35]. The calculation formula is as follows:
P i j = l o g 2 c i j K × B E j
where Pij represents the geo-accumulation index value of element j in sample i; Cij represents the concentration of element j in sample i (mg/kg); K stands for correction factor (generally 1.5), which reflects the change of background value due to different geological conditions; BEj is the background density value of cell j [35]. The degree of pollution assessed by the geo-accumulation index method is shown in Table 3:
(4) The Potential Ecological Risk Assessment
The potential ecological risk assessment can reflect the potential ecological harm of soil contaminated by complex heavy metals, and analyze the contribution of different heavy metals to environmental ecological toxicity and the differences in different geographical spaces, etc. [32,36]. The calculation formulas are as follows:
E r i = T r i × C n i C 0 i
R I = i = 1 n T r i × C n i C 0 i
where E r i is the potential ecological hazard coefficient of mercury, C n i is the measured content of a heavy metal, C 0 i is the background value of a heavy metal, T r i and E r i are the toxicity response coefficient and potential ecological hazard index of a heavy metal, and RI is the potential ecological hazard index [35]. The toxicity response coefficients of V, Cr, Ni, Zn, As, Cd, Hg, Pb, Cu, and Co are, respectively, 2, 2, 5, 1, 10, 30, 40, 5, 5, and 5. The relationships between the potential ecological risk coefficient and harm degree are listed in Table 4:

3. Results

3.1. Concentration of Heavy Metals in Soil

3.1.1. Concentration of Heavy Metals in Concentrator Soil

The statistical characteristics of heavy metals in the concentrator are shown in Table 5. The data in the table reveals that the average concentration of heavy metals in the surface soil of the study area follows the order Zn > Pb > As > V>Cr > Cu > Ni > Co > Hg > Cd, with Co having a minimum content of 0.01 mg/kg. The maximum value of Zn was 15,310.86 mg/kg. The comparison between the average content of all heavy metals and the background value showed that the average content of Ni, Cd, Hg, and Co was similar to the background value in Guangxi [37,38], while the average content of V, Cr, As, Zn, Pb, and Cu was several times or even tens of times higher than the background value. The variation coefficients of five kinds of heavy metals V, Cr, Cd, Hg, and Cu in the concentrator are in the range of 0.1–1, which indicates moderate variation; the variation coefficients of five kinds of heavy metals Ni, Zn, As, Pb, and Co are greater than 1, which indicates strong variation.

3.1.2. Concentration of Heavy Metals in Soil of the Tailings Pond

The statistical characteristics of heavy metals in tailings ponds are shown in Table 6. The data in the table show that the average content of heavy metals in surface soil at various points of the tailings pond is Zn > V > Pb > As > Cu > Cr > Ni > Co > Cd > Hg, and the minimum content of all heavy metals is 0.01 mg/kg of Hg and the maximum value is 9825.00 mg/kg of V. The comparison between the average content of heavy metals and the background value shows that Cr, Ni, Hg, and Co are equivalent to or even lower than the background value, while the average values of V, Cd, Zn, As, Pb, and Cu are several times or even tens of times higher than the background value. Only the coefficient of variation of Pb in the tailings reservoir is between 0.1–1, which indicates moderate variation, and the coefficient of variation of the other nine heavy metals is greater than 1, resulting in a strong mutation.

3.1.3. Concentration of Heavy Metals in Soil of Surrounding Agricultural Land

The statistical characteristics of heavy metals in the surrounding agricultural land are shown in Table 7. The data in the table show that the average content of heavy metals in the surface soil of various points in the surrounding agricultural land is Zn > Pb > V> Cr > As > Cu > Ni > Co > Cd > Hg, and the minimum content of all heavy metals is 0.01 mg/kg of Hg. The maximum value of Cr was 321.41 mg/kg. The results of the comparison between the average content of heavy metals and the background value showed that V, Cr, Ni, Cd, Hg, Cu, and Co were equivalent to or even lower than the background value in Guangxi, while the average concentration of Zn, As, and Pb far exceeded the background value. The coefficients of variation of the six heavy metals in the surrounding agricultural land were between 0.1–1. Among them, the coefficient of variation of Cr, Ni, Cd, and Hg is greater than 1, which indicates strong variation.

3.2. Soil Heavy Metal Pollution and Risk Assessment

3.2.1. The Single-Factor Index and the Nemerow Pollution Index

The evaluation results of soil samples in the concentrator are shown in Figure 3. The mean value of the single-factor pollution index (Pi) was As > Pb > V> Co > Zn > Cr > Ni > Pb > Hg > Cu > Cd. The As content of each site was evaluated, and it was found that the proportion of As exceeding the standard was the highest, and the proportion of extremely heavy pollution sites was 72%. The Pb assessment results indicate that the proportions of extremely high, significant, and negligible pollution indexes are 29%, 14%, and 43%, respectively. In the evaluation results of V, heavy pollution and cleanliness are the main ones, accounting for 29% and 36%, respectively. The results of Co evaluation showed that heavy pollution and no pollution were the main ones, accounting for 14% and 86%, respectively. In addition to these four elements, the other six heavy metals are mainly slightly polluted and pollution-free, and no pollution points above slight pollution exist. The Nemerow index method indicated that the soil pollution rating of the concentrator was mainly heavy pollution, accounting for 71.4% of the total sites, and the proportion of clean and clean sites was 21.4% and 7.1%, respectively, with no light pollution and moderate pollution points.
The evaluation results of soil samples from the tailings pond are shown in Figure 4. The average value of the single-factor index (Pi) is As > V > Pb > Zn > Co > Cr > Cd > Cu > Ni > Hg. The pollution of As is the most serious among the indexes, and the extremely heavy pollution point is as high as 95%. The total ratio of light pollution was above 50% of V; The light pollution level of Pb reached 45%. Only 5% of the Cd sites are mildly polluted, and the rest are pollution-free. In addition to these four elements, the other six heavy metals were mainly pollution-free. The Nemerow index method indicates that the soil pollution rating results of the tailings ponds are mainly heavy pollution, accounting for 95% of the total sites, and the remaining 5% are clean sites.
The evaluation results of soil samples of the surrounding agricultural land are shown in Figure 5. The average value of the single-factor index (Pi) is As > Zn > V > Pb > Co > Cr > Cd > Cu > Ni > Hg. The statistical results show that As has more sites that are heavily polluted and lightly polluted, and the other heavy metals are mainly pollution-free and lightly polluted. Among them, V, Cr, Zn, Cd, and Cu contain a few sites that are mildly polluted, while Ni, Hg, Cu, and Pb all have no pollution. The Nemerow index method indicates that the rating results of the surrounding agricultural land are mainly clean, still clean, and lightly polluted, and the points of these three rating results account for 78.5% of the total points, while the moderate pollution and heavy pollution account for 14.3% and 7.1%, respectively.

3.2.2. The Geo-Accumulation Index

The evaluation results of the concentrator are shown in Figure 6a. The mean value of Igeo is Zn > As > Pb > V > Cu > Hg > Co > Ni > Cr > Cd. Among them, Zn pollution is the most severe, with a total proportion of pollution above the moderate-strong level reaching 71%. Following closely is As, with a combined proportion of moderate, heavy, relatively serious, and extremely serious pollution levels also at 71%. Lastly, Pb exhibits a total proportion of moderate, heavy, relatively serious, and extremely serious pollution levels at 72%. In addition to the above three heavy metals, the six heavy metals V, Cr, Ni, Hg, Cu, and Co show moderate and light pollution, and Cd shows no pollution.
The evaluation results of the tailings pond are shown in Figure 6b. The mean value of Igeo was Pb > Zn > As > V > Cd > Cu > Hg > Cr > Ni > Co. Among them, Pb pollution is the most serious, and the points with moderate, heavy, relatively serious, and extremely serious pollution levels account for 90%. The second is Zn—the total proportion of the points of moderate, heavy, relatively serious, and extremely serious pollution level is also 90%, followed by As. The total proportion of the points of moderate, heavy, relatively serious, and extremely serious pollution level is 95%. In addition to the above three elements showing serious pollution, the three heavy metals of V, Cd, and Cu show moderate and strong pollution, the three heavy metals of Cr, Ni, and Hg show light pollution, and the Co shows no pollution.
The evaluation results of the surrounding agricultural land are shown in Figure 6c. The mean value of Igeo was Pb > Zn > As > Cd > Hg > Cr > V > Ni > Cu > Co. Among them, the three heavy metals of Pb, Zn, and As show moderate and light pollution, and the other seven heavy metals show extremely light pollution and no pollution.

3.2.3. Potential Ecological Risk Assessment

The evaluation results of the concentrator are shown in Figure 7. The single-factor index of each heavy metal shows that the heavy metals with high ecological risk at each point of the concentrator are As and Pb, the heavy metals with medium ecological risk are Zn and Hg, and the other six kinds of heavy metals have no ecological risk. The comprehensive index RI of each site indicates that the sites of very serious pollution, heavy pollution, moderate pollution, and slight pollution ecological risks in the concentrator are 42.9%, 28.6%, 7.1%, and 21.4%, respectively.
The evaluation results of the tailings pond are shown in Figure 8. The single-factor index of each heavy metal indicates that the heavy metals with high ecological risk are As and Pb, the heavy metals with medium ecological risk are Zn, Cd, Hg, and cu, and the heavy metals without ecological risk are V, Cr, Ni, and Co. The comprehensive index RI of each point indicates that the points of extremely strong, strong, medium, and slight ecological risks in tailings ponds are 45%, 30%, 20%, and 5%, respectively.
The evaluation results of the surrounding agricultural land are shown in Figure 9. The single-factor index of each heavy metal indicates that only Cd, Hg and As have slight ecological risks at each point of the surrounding agricultural land, while the other seven heavy metals have no ecological risks. The comprehensive index RI shows that 14.3% of the surrounding agricultural land has medium ecological risk, and 85.7% has slight ecological risk.

3.3. Correlation Analysis

As the soil heavy metals in this study did not conform to a normal distribution, origin software was used in this study to conduct Spearman correlation analysis, and the results are shown in Figure 10.
Figure 10a shows the correlation coefficient between the pairs of heavy metals in the concentrator; red represents positive correlation; blue represents negative correlation; the size of the circle represents the strength of the positive and negative correlation; the larger the circle, the stronger the correlation [39]. Figure 10a shows that more than 30% of the pairs of heavy metals in the concentrator are strongly positively correlated at the p ≤ 0.01 level. 20% were strongly positively correlated at the p ≤ 0.05 level, 20% were moderately positively correlated at the p ≤ 0.05 level, 15% were weakly positively correlated at the p ≤ 0.05 level, and 10% were weakly negatively correlated at the p ≤ 0.05 level, indicating that most of the heavy metal content pairs had strong positive correlations.
Figure 10b shows the pairwise correlation coefficients of heavy metals in tailings ponds. As shown in Figure 10b, the pairwise correlation of heavy metals in tailings ponds is close to 20% at the p ≤ 0.01 level, 10% at the p ≤ 0.05 level, and 5% at the p ≤ 0.05 level. There is a weak positive correlation of 5% at the p ≤ 0.05 level, a moderate negative correlation of 20% at the p ≤ 0.05 level, and a weak negative correlation of 35% at the p ≤ 0.05 level, indicating that the correlation between the heavy metal content of the tailings ponds is relatively complex, with both positive and negative correlations accounting for a large proportion.
Figure 10c shows the pairwise correlation coefficient between heavy metals in the surrounding agricultural land, which indicates that 45% of the pairwise heavy metals in the surrounding agricultural land are strongly positively correlated at p ≤ 0.01 level, 30% are strongly positively correlated at p ≤ 0.05 level, and 15% are moderately positively correlated at p ≤ 0.05 level. At the p ≤ 0.05 level, there was a weak positive correlation in 10% and no significant correlation or negative correlation in 5%, indicating that there was a strong positive correlation between the contents of heavy metals in the surrounding agricultural land.

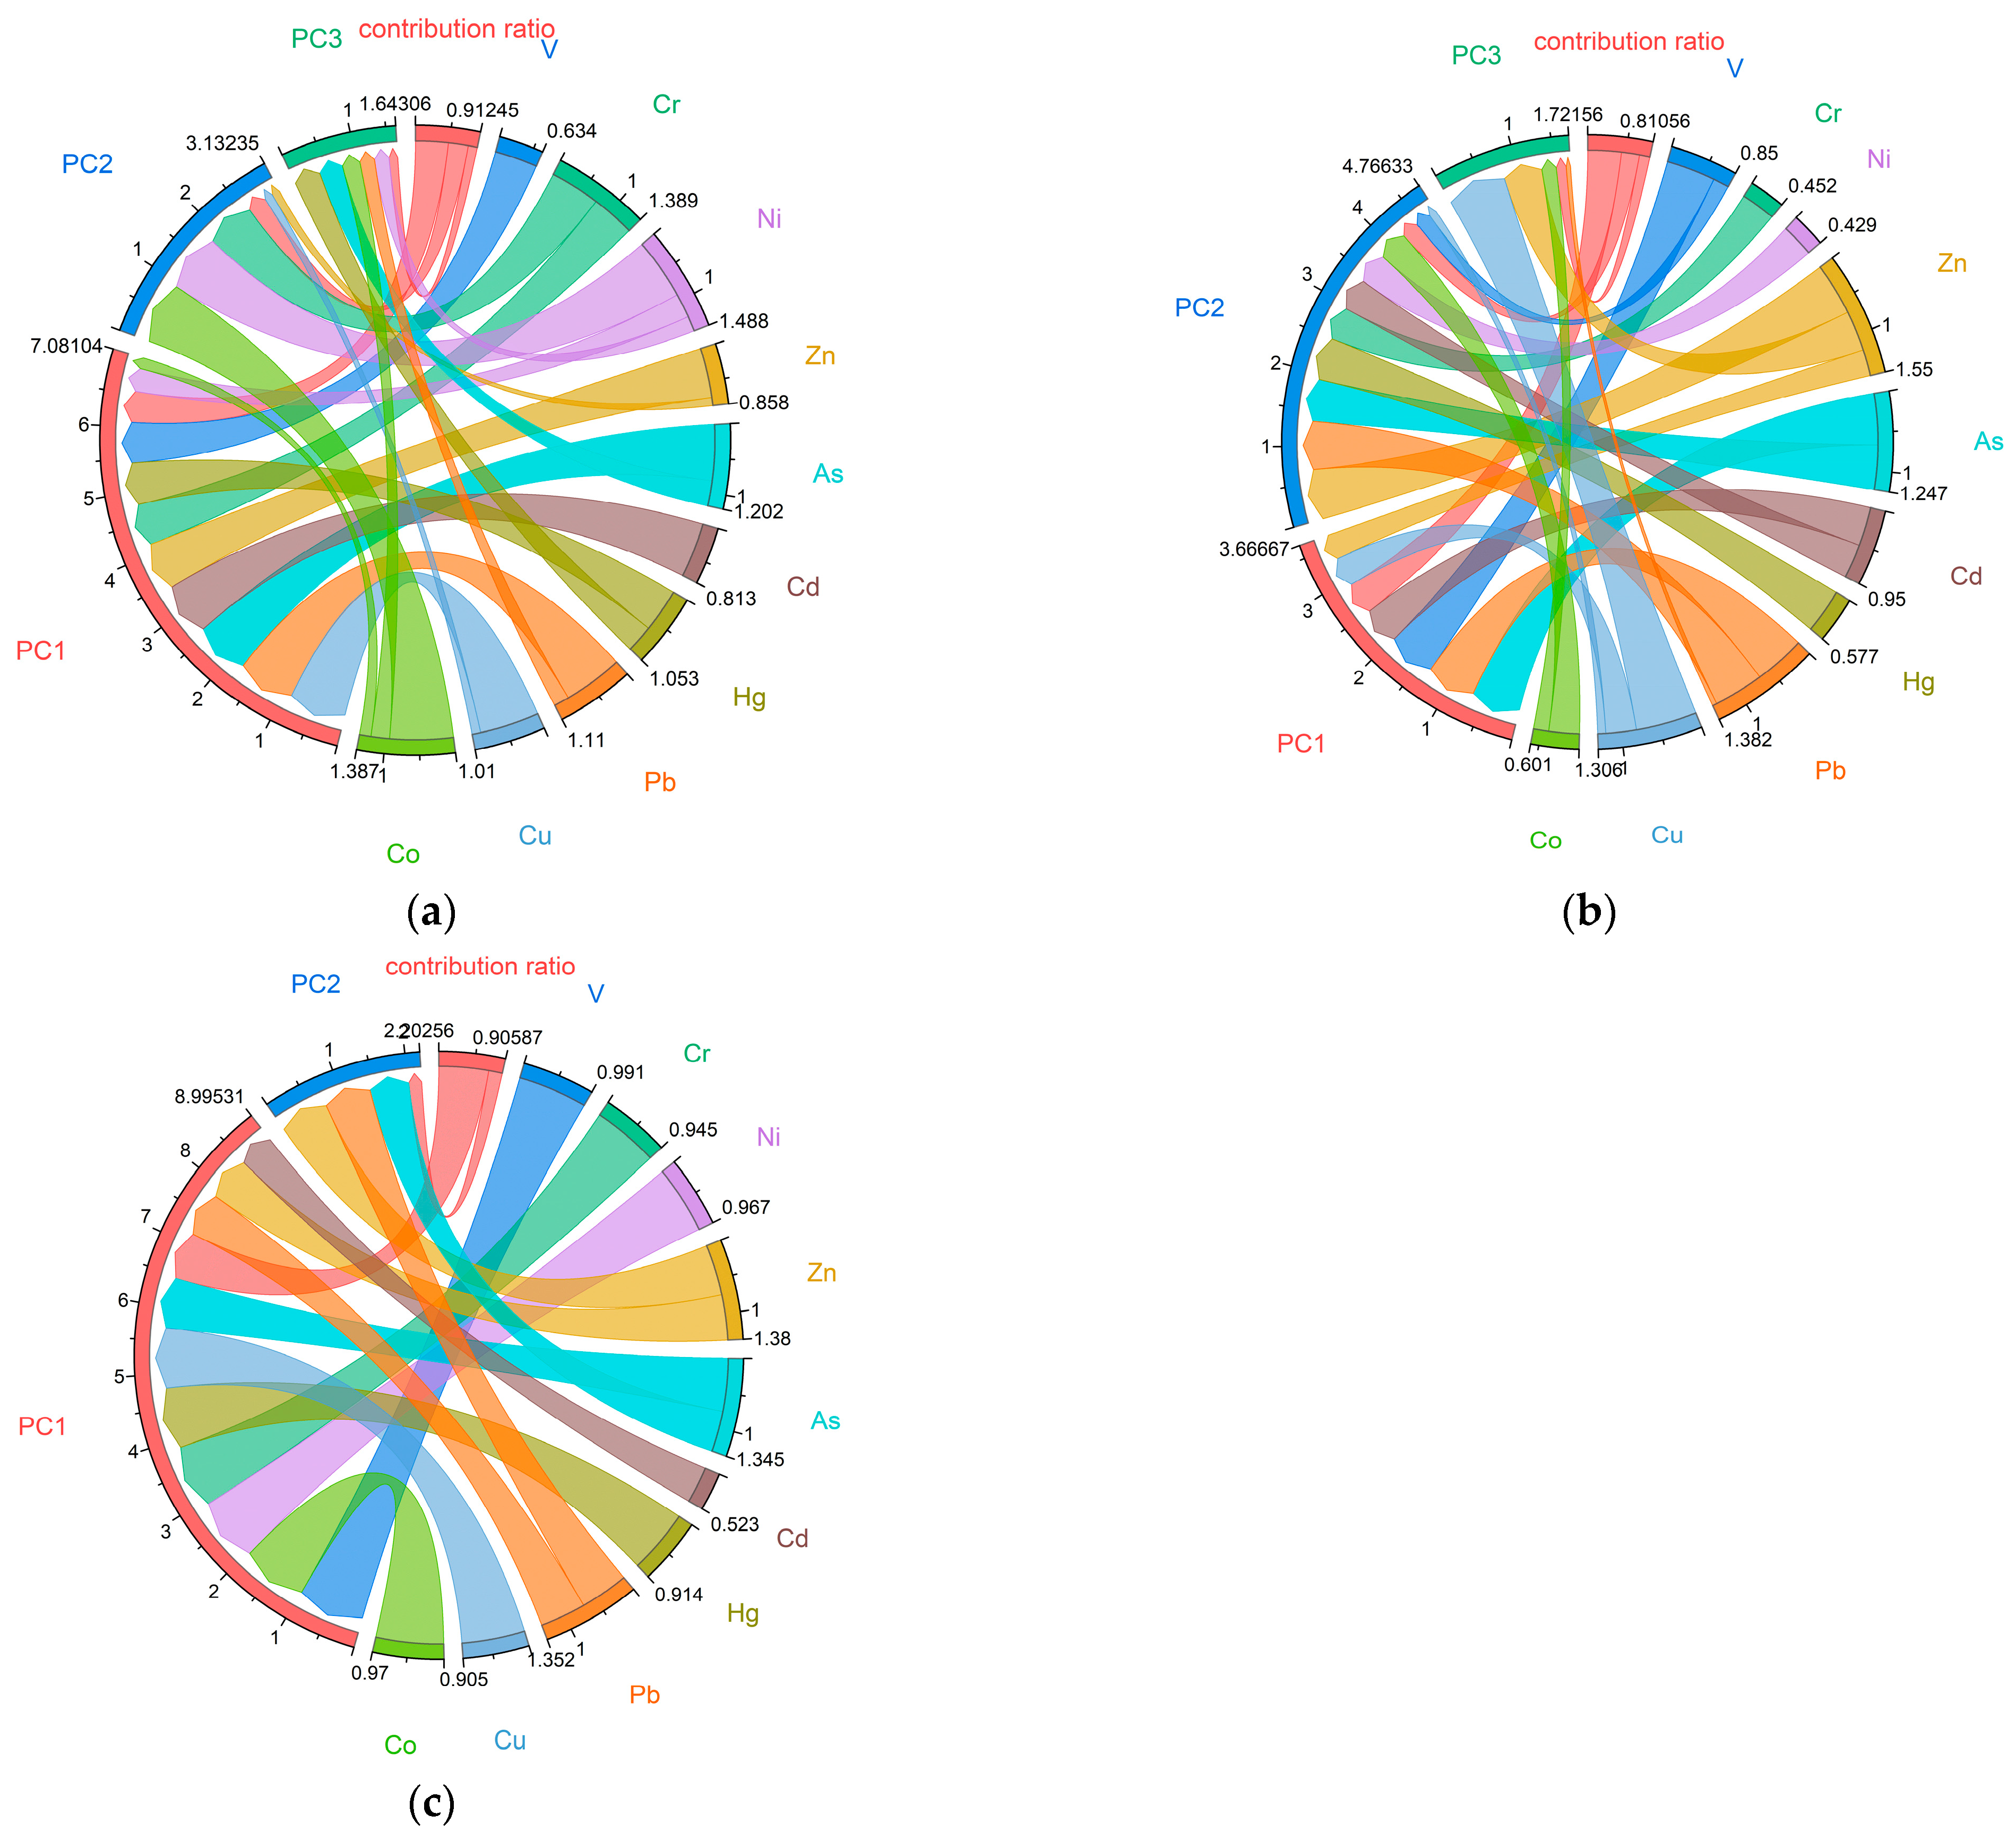
3.4. Principal Component Analysis and PMF Source Analysis

Principal component analysis (PCA) was performed using SPSS. Firstly, KMO and Bartlett’s tests were used to verify whether the data was suitable for principal component analysis, and EPA-PMF5.0 was adopted for positive definite factor matrix decomposition and source analysis (Figure 11). The results are as follows.
Table 8 and Table 9 show the important results of the principal component analysis of each heavy metal in the concentrator. The results showed that the KMO value of heavy metal PCA in the concentrator was 0.622, satisfying KMO > 0.5 and the significance of the Bartlett test was p = 0.000, satisfying p < 0.001, indicating that the correlation between various heavy metals was strong, suitable for PCA, and the analysis results were effective. The main results of the PCA are shown in Table 9.
Table 10 and Table 11 show the important results of the principal component analysis of heavy metals in tailings ponds. The results indicated that the KMO value of heavy metal PCA in the tailings reservoir was 0.562, satisfying KMO > 0.5, and the significance of the Bartlett test was 0.000, satisfying significance p < 0.001, indicating that the correlation between heavy metals was strong, suitable for PCA, and the analysis results were valid. The main results of the PCA are shown in Table 11.
Table 12 and Table 13 show the important results of the principal component analysis of various heavy metals in the surrounding agricultural land. The results indicated that the KMO value of the PCA for heavy metals in the tailings pond was 0.752, satisfying KMO > 0.5, and the Bartlett’s test indicated that the significance p = 0.000, satisfying p < 0.001, which was suitable for PCA analysis and the analysis results were valid. The PCA results are shown in Table 13. The two principal components of the PCA accounted for 71.131% and 19.456%, respectively, and the cumulative contribution rate was 90.586%. In PC1, V, Cr, Ni, Hg, Cu and Co have large positive factor loads. Considering that the frequent use of pesticides and fertilizers may lead to the accumulation of Cu and Cr in soil, it is speculated that PC1 may represent the common source of the tailings pond, mine spills, and agricultural activities. The positive factor loads of Pb and Zn in PC2 are high, so it is speculated that PC2 may represent the direct spill source of lead-zinc ore.

4. Discussion

4.1. Concentration Characteristics of Heavy Metals in Soil

The average contents of Ni, Cd, Hg, and Co in the concentrator are lower or slightly higher than the background value, indicating that these four heavy metals are less affected by human activities, while the average values of V, Cr, As, Zn, Pb, and Cu are several times higher than the background value, indicating that these six heavy metals are greatly affected by human activities, which is consistent with the results of Xu Die et al. [40]. Statistical analysis of the concentration data of various heavy metals in the concentrator shows that the variation coefficient of the five heavy metals V, Cr, Cd, Hg, and Cu in the concentrator is 0.1–1, which indicates medium variation, indicating that their concentration distribution is uneven and varies greatly with space; the variation coefficient of the five heavy metals Ni, Zn, As, Pb, and Co is greater than 1, which indicates strong variation, indicating that their concentration distribution is extremely uneven and varies greatly with space. This is consistent with the results of Li Ping et al. [41].
The average contents of Cr, Ni, Cd, Hg, and Co in tailings ponds are lower or slightly higher than the background value, indicating that these five heavy metals are less affected by activities, while the average values of V, As, Zn, Pb, and Cu are several times higher than the background value, indicating that these five heavy metals are greatly affected by human activities. The results of the coefficient of variation showed that only the coefficient of variation of Pb content was in the range of 0.1–1, which was a moderate variation, indicating that the concentration of lead was unevenly distributed and had a large spatial difference. The other nine indicators are above 1, which indicates strong variation, which indicates that the concentration distributions of the other nine heavy metals except Pb are extremely uneven and changes greatly with space.
The average values of V, Cr, Ni, Cd, Hg, Cu, and Co in various heavy metals in the surrounding agricultural land are close to the background values, indicating that these seven heavy metals are less affected by human activities, while the average values of Pb, Zn and As are higher than the background values, indicating that these three kinds heavy metals are greatly affected by human activities, such as mining or other industrial and agricultural activities. The coefficients of variation of six kinds of V, Zn, As, Pb, Cu, and Co in the surrounding agricultural land are in the range of 0.1–1, which belongs to moderate variation, indicating that their concentration distribution is not uniform and changes greatly with space; the coefficient of variation of Cr, Ni, Cd and Hg is greater than 1, which belongs to strong variation, indicating that their concentration distribution is very uneven and changes greatly with space.

4.2. Correlation Analysis

Heavy metals Zn, As, Cd, Pb, and V in concentrator; Ni, Zn, Cu, and Cr; Zn, Cu, Co and Ni; As, Cd, Pb, Cu, Co, and Zn; Cd, Pb, Cu, and As; Pb, Cu and Cd; Cu and Pb; The positive correlation between the groups of heavy metals Co and Cu is relatively significant, and both are significantly correlated at the p = 0.01 confidence level, indicating that they may come from the same pollution source, which is consistent with the research results of Zhang Chao et al. [42].
Heavy metals Zn, As, Pb, and V in tailings ponds; Ni, Co, Hg, Co and Cr; Cd, Hg, Co, and Ni; As, Pb, Cu, and Zn; Pb, Cu, and As; Hg, Pb, Co, and Cd; Co and Hg; The positive correlation between Cu and Pb groups of heavy metals is relatively significant, and both are significantly correlated at the p = 0.01 confidence level, indicating that they may come from the same pollution source, which is consistent with the results of Hou Cong et al. [43].
Heavy metals Cr, Ni, Zn, As, Cd, Hg, Co, and V in the surrounding agricultural land; Ni, Cd, Hg, Cu, Co and Cr; As, Cd, Hg, Cu, Co, and Ni; As, Pb and Zn; Pb and As; Hg, Cu, Co, and Cd; Cu, Co, and Hg; The positive correlation between the groups of heavy metals Co and Cu is relatively significant, and both are significantly correlated at the p = 0.01 confidence level, indicating that they may come from the same pollution source, which is consistent with the results of Chen Wen et al. [44].

4.3. Principal Component Analysis and PMF Source Analysis

The results of the PCA showed that PC1, PC2, and PC3 could reflect 91.244% of the original data. Among them, the interpretation rate of PC1 to the original data is 48.404%, and As, Cd, Pb, and Cu all have high positive factor loads. The concentrating plant is located in the core area of the mining area, and a large number of heavy metals produced in the mining production process along with the accumulation of production wastewater and tailings cause serious pollution to the soil, which is consistent with the research results of Lv Wenguang et al. [45]. The interpretation rate of PC2 to the original data is 29.435%, in which the positive factor loads of Ni and Co are higher. The research shows that materials in the construction industry contain higher Ni and Co, indicating that PC2 may represent the source of factory construction activities, which is consistent with the research results of Liu Zhaoyue et al. [46]. The contribution rate of PC3 is 13.406%, among which the element with a higher positive factor load is Hg. Combined with relevant studies, it can be seen that PC3 may represent atmospheric subsidence, which is consistent with the research results of Xiong Caiyi et al. [47].
The contribution rates of three principal components extracted by PCA from heavy metals in tailings ponds are 43.767%, 23.633% and 13.656, respectively, and the cumulative contribution rates of these three principal components, PC1, PC2 and PC3, reach 81.056%. In PC1, Pb, Zn, As, and V have large positive factor loads, and the tailings reservoir of lead and zinc mine is here, which is the main site of mineral processing activities. The analysis speculated that PC1 may represent the source of the industrial mining industry, and Zn and Pb in PC2 have large load factors, which are highly overlapping with the large load factors of PC1, and the mining process is highly dependent on vehicle transportation. The transportation process inevitably diffused heavy metals from the mining area to the surrounding areas to some extent, and it is speculated that PC2 may represent the source of industrial mining transportation process, which is consistent with the research results of Wang Honglei et al. [48], Zn and Cu in PC3 have a large positive factor load, and studies have shown that the power supply system can lead to a significant increase in the content of Zn and Cu in soil. It is speculated that PC3 may represent the source of the power supply system, which is consistent with the results of Liu Kun et al. [49].
The two principal components of the PCA extraction of heavy metals from the surrounding agricultural land accounted for 71.131% and 19.456%, respectively, and the cumulative contribution rate reached 90.586%. In PC1, V, Cr, Ni, Hg, Cu, and Co have large positive factor loads. Considering that the frequent use of pesticides and fertilizers may lead to the accumulation of Cu and Cr in the soil, it is speculated that PC1 may represent the common source of heavy metal overflow in mining areas and agricultural activities, which is consistent with the research results of Sun Tingting et al. [50]. The positive factor loading of Pb and Zn in PC2 is high, so it is speculated that PC2 may represent the direct spill source of lead-zinc ore.

4.4. Soil Heavy Metal Pollution Risk Assessment

The evaluation results of the single-factor index method show that As, Pb, and V are the most serious heavy metals in each site of the concentrator and tailings pond. It is speculated that the As, Pb, and V of the concentrator and tailings pond are mainly from mining activities in the mining area. The surrounding agricultural land is only slightly polluted, indicating that the surrounding agricultural land is less affected by the heavy metal spillover from the mine. The Nemerow comprehensive index shows that the concentration plant and tailings pond sites are mainly heavily polluted, while the surrounding agricultural land sites are mainly pollution-free and lightly polluted, indicating that the heavy metals in the mining plant are still mainly concentrated in the original mining area after the closure of mining activities, and the outward diffusion is not obvious.
The geo-accumulation index method compares the heavy metals with the background values of soil elements in Guangxi, and the evaluation results reflect the degree to the heavy metals are affected by human activities [51,52,53]. The evaluation results show that the concentration of Pb, Zn and As heavy metals in the concentrator and tailings reservoir are far above the background value and show strong pollution. Because the geological characteristics of the soil in the study area are Quaternary sandy mudstone, mostly red loam, there is no obvious interference of heavy metals in the history, but because it was a lead-zinc mine in the past, the content of lead and zinc elements in the soil is high [54]. The soil in the study area is still contaminated by Pb, Zn and As, indicating a persistent pollution issue that poses challenges to immediate resolution. The results show that mining has an obvious effect on the content of heavy metals in soil. A variety of heavy metals in the surrounding agricultural land are mainly pollution-free and slightly polluted, indicating that agricultural activities have no obvious impact on the content of heavy metals in soil, which is basically close to the natural value.
The single-factor ecological risk index of heavy metals in concentrator and tailings reservoir shows that in all concentrators, only Pb and As pollution levels present strong ecological risks, while in the evaluation of the geo-accumulation index, Pb, Zn and As heavy metals all present very strong pollution. It is speculated that the toxicity response coefficients of various heavy metals are very different, and the toxicity response coefficients of Pb and As heavy metals are large. Therefore, as long as its concentration causes particular type of pollution to the environment, it will cause a greater ecological risk to the environment, while the toxicity response coefficient of Zn is small, and its concentration will cause an ecological risk to the environment when it is quite high [55,56,57,58]. The ecological risk assessment of the surrounding agricultural land shows that all heavy metals have no obvious ecological risk to the environment, and their current status is no risk.

4.5. Analysis of the Present Condition of Heavy Metal Spillover in the Study Area

The analysis of heavy metal content and distribution in three different sampling areas in the study area shows that As, Zn, and Pb with high content in the concentrator and tailings reservoir tend to spill over to the surrounding agricultural land. The results of source analysis show that only As, a heavy metal in the surrounding agricultural land, is affected by non-agricultural activities, but mining activities contribute more significantly, indicating that an As spill is more serious in the lead-zinc mine, while the Pb and Zn spill is relatively not as serious. The spill of As element into the surrounding agricultural land may affect the quality of agricultural products and domestic water consumption in the agricultural land, so it is suggested to pay more attention to the As element in the future monitoring of heavy metals around the mining area [59,60].

5. Conclusions

The research object of this paper is an abandoned lead-zinc mine located in Sha’an Village, Sanli Town, Wuxuan County, Guangxi Province, China. This paper investigates the current status of heavy metal pollution in this area. The results indicate a significant positive correlation among the majority of the 10 heavy metals present in both the concentrator’s soil and the tailings reservoir. There was a strong positive correlation between V, Ni, and other heavy metals in the soil of the surrounding agricultural land, while the correlation between other heavy metals was weak. The high content of heavy metals in concentrators and tailings ponds are As, Zn, and Pb, among which As has an obvious tendency to spill into the surrounding agricultural land. The results of the principal component analysis indicate that the primary contributors to heavy metal concentrations in the concentrator are mining operations, construction activities, and atmospheric deposition. Mining activities are the main sources of As, Cd, Pb, and Cu. The construction activity of the concentrator is the main source of Ni and Co. Atmospheric subsidence is the main source of Hg. The main sources of heavy metals in tailings ponds are emissions from mining activities and the power system, in which As and V are mainly from mining activities, and Cu and Zn are mainly from mining activities and power system emissions. The occurrence of mine spills, pesticides and fertilizers are the main sources of heavy metals in the surrounding agricultural land. Hg, Pb, Zn, and As mainly come from the heavy metal spills from mining plants, among which As is seriously spilled and Zn, Pb, and Hg are slightly spilled. Cu and Cr mainly come from chemical fertilizers and pesticides. The results of single-factor index method show that As and Pb pollution in the concentrator is extremely serious, As, Pb, and V pollution in a tailings pond is extremely serious, and As pollution in surrounding agricultural land is moderate and mild. The results of the Nemerow comprehensive index method show that the concentrator and tailings pond are heavily polluted in general, and the surrounding agricultural land is slightly polluted or non-polluted in general. The research findings of the potential ecological risk index method indicate that the concentrator and tailings reservoir pose a moderate to high level of ecological risk, whereas the surrounding agricultural land presents a low level of risk.

Author Contributions

Conceptualization, M.G. and Y.X.; methodology, M.G., Y.X., J.Z. and L.X.; software, Y.X. and L.X.; validation, M.G.; formal analysis, M.G. and L.W.; data curation, W.W. and R.F.; writing original draft preparation, Y.X., M.G. and L.X.; writing review and editing, T.Z. and R.F.; visualization, L.X.; supervision and project administration, T.Z. and R.F.; funding acquisition, G.Z. All authors have read and agreed to the published version of the manuscript.

Funding

This research was funded by the Major Science and Technology Project of China Power Engineering Consulting Group Co., Ltd. (No. DG3-P01-2022); Science and Technology Development Plan Project of Jilin Province, China (20240101067JC); the Science and Technology Research Project of Jilin Provincial Education Department (No. JJKH20231316KJ); the Chinese National Natural Science Foundation of China (Grant No. 31230012, 31770520); the Fundamental Research Funds for the Central Universities (No. 134-135132028); and the Chinese Postdoctoral Science Foundation (2021M700496).

Informed Consent Statement

Informed consent was obtained from all subjects involved in the study.

Data Availability Statement

The data presented in this study are available on request from the corresponding author.

Acknowledgments

We are grateful to the Key Laboratory of Vegetation ecology of the Ministry of Education for its help and support.

Conflicts of Interest

Author Mingfan Guo, Rongyang Fan and Tingting Zhang was employed by the company China Energy Engineering Group Guangxi Electric Power Design Institute Co., Ltd. Author Jinxin Zhang and Li Wei was employed by the company China Power Engineering Consulting Group Co., Ltd. The remaining authors declare that the research was conducted in the absence of any commercial or financial relationships that could be construed as a potential conflict of interest.

References

  1. Dhaliwal, S.S.; Singh, J.; Taneja, P.K.; Mandal, A. Remediation techniques for removal of heavy metals from the soil contaminated through different sources: A review. Environ. Sci. Pollut. Res. 2020, 27, 1319–1333. [Google Scholar] [CrossRef]
  2. Stefanowicz, A.M.; Kapusta, P.; Zubek, S.; Stanek, M.; Woch, M.W. Soil organic matter prevails over heavy metal pollution and vegetation as a factor shaping soil microbial communities at historical Zn-Pb mining sites. Chemosphere 2020, 240, 13. [Google Scholar] [CrossRef]
  3. Tsai, M.S.; Chen, M.H.; Lin, C.C.; Liu, C.Y.; Chen, P.C. Children’s environmental health based on birth cohort studies of Asia (2)—Air pollution, pesticides, and heavy metals. Environ. Res. 2019, 179, 22. [Google Scholar] [CrossRef]
  4. Shi, J.D.; Zhao, D.; Ren, F.T.; Huang, L. Spatiotemporal variation of soil heavy metals in China: The pollution status and risk assessment. Sci. Total Environ. 2023, 871, 13. [Google Scholar] [CrossRef]
  5. Qu, L.; Xie, Y.; Lu, G.; Yang, C.; Zhou, J.; Yi, X.; Dang, Z. Distribution, fractionation, and contamination assessment of heavy metals in paddy soil related to acid mine drainage. Paddy Water Environ. 2017, 15, 553–562. [Google Scholar] [CrossRef]
  6. Zhao, S.T.; Shi, T.R.; Terada, A.; Riya, S. Evaluation of Pollution Level, Spatial Distribution, and Ecological Effects of Antimony in Soils of Mining Areas: A Review. Int. J. Environ. Res. Public Health 2023, 20, 242. [Google Scholar] [CrossRef]
  7. Zamotaev, I.V.; Ivanov, I.V.; Mikheev, P.V.; Belobrov, V.P. Transformation and Contamination of Soils in Iron Ore Mining Areas (a Review). Eurasian Soil Sci. 2017, 50, 359–372. [Google Scholar] [CrossRef]
  8. Zhang, X.W.; Yang, L.S.; Li, Y.H.; Li, H.R.; Wang, W.Y.; Ye, B.X. Impacts of lead/zinc mining and smelting on the environment and human health in China. Environ. Monit. Assess. 2012, 184, 2261–2273. [Google Scholar] [CrossRef]
  9. Besser, J.M.; Brumbaugh, W.G.; May, T.W.; Schmitt, C.J. Biomonitoring of lead, zinc, and cadmium in streams draining lead-mining and non-mining areas, Southeast Missouri, USA. Environ. Monit. Assess. 2007, 129, 227–241. [Google Scholar] [CrossRef] [PubMed]
  10. Qi, J.Y.; Zhang, H.L.; Li, X.P.; Lu, J.; Zhang, G.S. Concentrations, spatial distribution, and risk assessment of soil heavy metals in a Zn-Pb mine district in southern China. Environ. Monit. Assess. 2016, 188, 7. [Google Scholar] [CrossRef] [PubMed]
  11. Zhang, X.W.; Yang, L.S.; Li, Y.H.; Li, H.R.; Wang, W.Y.; Ge, Q.S. Estimation of lead and zinc emissions from mineral exploitation based on characteristics of lead/zinc deposits in China. Trans. Nonferrous Met. Soc. China 2011, 21, 2513–2519. [Google Scholar] [CrossRef]
  12. Liu, H.Y.; Probst, A.; Liao, B.H. Metal contamination of soils and crops affected by the Chenzhou lead/zinc mine spill (Hunan, China). Sci. Total Environ. 2005, 339, 153–166. [Google Scholar] [CrossRef]
  13. Han, W.; Zhao, R.; Liu, W.; Wang, Y.; Zhang, S.; Zhao, K.; Nie, J. Environmental contamination characteristics of heavy metals from abandoned lead-zinc mine tailings in China. Front. Earth Sci. 2023, 11, 9. [Google Scholar] [CrossRef]
  14. Lee, J.Y.; Choi, J.C.; Lee, K.K. Variations in heavy metal contamination of stream water and groundwater affected by an abandoned lead-zinc mine in Korea. Environ. Geochem. Health 2005, 27, 237–257. [Google Scholar] [CrossRef]
  15. Doya, R.; Nakayama, S.M.M.; Nakata, H.; Toyomaki, H.; Yabe, J.; Muzandu, K.; Yohannes, Y.B.; Kataba, A.; Zyambo, G.; Ogawa, T.; et al. Land Use in Habitats Affects Metal Concentrations in Wild Lizards Around a Former Lead Mining Site. Environ. Sci. Technol. 2020, 54, 14474–14481. [Google Scholar] [CrossRef]
  16. Zhu, W.H.; Yang, X.T.; He, J.; Wang, X.H.; Lu, R.; Zhang, Z. Investigation and Systematic Risk Assessment in a Typical Contaminated Site of Hazardous Waste Treatment and Disposal. Front. Public Health 2021, 9, 764788. [Google Scholar] [CrossRef]
  17. Tomiyama, S.; Igarashi, T. The potential threat of mine drainage to groundwater resources. Curr. Opin. Environ. Sci. Health 2022, 27, 100347–100358. [Google Scholar] [CrossRef]
  18. Iavazzo, P.; Adamo, P.; Boni, M.; Hillier, S.; Zampella, M. Mineralogy and chemical forms of lead and zinc in abandoned mine wastes and soils: An example from Morocco. J. Geochem. Explor. 2012, 113, 56–67. [Google Scholar] [CrossRef]
  19. Liao, J.B.; Chen, J.; Ru, X.; Chen, J.D.; Wu, H.Z.; Wei, C.H. Heavy metals in river surface sediments affected with multiple pollution sources, South China: Distribution, enrichment and source apportionment. J. Geochem. Explor. 2017, 176, 9–19. [Google Scholar] [CrossRef]
  20. Li, D.S.; Jiang, C.L.; Jiang, C.H.; Liu, F.; Zhu, Q.Y. Geochemical characteristics and migration patterns of rare earth elements in coal mining subsidence lakes under the influence of multiple factors. Sci. Total Environ. 2023, 904, 166668. [Google Scholar] [CrossRef] [PubMed]
  21. Lin, C.; Wu, Y.; Lu, W.; Chen, A.; Liu, Y. Water chemistry and ecotoxicity of an acid mine drainage-affected stream in subtropical China during a major flood event. J. Hazard. Mater. 2007, 142, 199–207. [Google Scholar] [CrossRef]
  22. Hofmann, T.; Schuwirth, N. Zn and Pb release of sphalerite (ZnS)-bearing mine waste tailings. J. Soils Sediments 2008, 8, 433–441. [Google Scholar] [CrossRef]
  23. Melenti, C.; Magyar, I.L. Mapping heavy metal contamination by kriging in valea sesei tailing pond, romania. In Proceedings of the 15th International Multidisciplinary Scientific Geoconference (SGEM), Albena, Bulgaria, 18–24 June 2015. [Google Scholar]
  24. Zhang, W.; Long, J.H.; Zhang, X.R.; Shen, W.N.; Wei, Z.Y. Pollution and Ecological Risk Evaluation of Heavy Metals in the Soil and Sediment around the HTM Tailings Pond, Northeastern China. Int. J. Environ. Res. Public Health 2020, 17, 7072. [Google Scholar] [CrossRef]
  25. Zhang, Y.X.; Song, B.; Zhou, Z.Y. Pollution assessment and source apportionment of heavy metals in soil from lead-Zinc mining areas of south China. J. Environ. Chem. Eng. 2023, 11, 2. [Google Scholar] [CrossRef]
  26. Sun, R.G.; Gao, Y.; Yang, Y. Leaching of heavy metals from lead-zinc mine tailings and the subsequent migration and transformation characteristics in paddy soil. Chemosphere 2022, 291, 132792. [Google Scholar] [CrossRef]
  27. Rodríguez, L.; Ruiz, E.; Alonso-Azcárate, J.; Rincón, J. Heavy metal distribution and chemical speciation in tailings and soils around a Pb-Zn mine in Spain. J. Environ. Manag. 2009, 90, 1106–1116. [Google Scholar] [CrossRef]
  28. Baidu Baike. Available online: https://baike.baidu.com/item/WuxuanCounty/7180911 (accessed on 1 August 2006).
  29. Baidu Baike. Available online: https://baike.baidu.com/item/SanliTown/3236483 (accessed on 14 May 2011).
  30. Li, W.X.; Zhang, X.X.; Wu, B.; Sun, S.L.; Chen, Y.S.; Pan, W.Y.; Zhao, D.-Y.; Cheng, S.-P. A comparative analysis of environmental quality assessment methods for heavy metal-contaminated soils. Pedosphere 2008, 18, 344–352. [Google Scholar] [CrossRef]
  31. Zhang, P.; Qin, C.; Hong, X.; Kang, G.; Qin, M.; Yang, D.; Pang, B.; Li, Y.; He, J.; Dick, R.P. Risk assessment and source analysis of soil heavy metal pollution from lower reaches of Yellow River irrigation in China. Sci. Total Environ. 2018, 633, 1136–1147. [Google Scholar] [CrossRef]
  32. Chai, L.; Wang, Y.H.; Wang, X.; Ma, L.; Cheng, Z.X.; Su, L.M. Pollution characteristics, spatial distributions, and source apportionment of heavy metals in cultivated soil in Lanzhou, China. Ecol. Indic. 2021, 125, 107507. [Google Scholar] [CrossRef]
  33. Wei, J.; Zheng, X.G.; Liu, J.T. Modeling Analysis of Heavy Metal Evaluation in Complex Geological Soil Based on Nemerow Index Method. Metals 2023, 13, 439. [Google Scholar] [CrossRef]
  34. Muller, G. Index of Geoaccumulation in Sediments of the Rhine River. GeoJournal 1969, 2, 109–118. [Google Scholar]
  35. Huo, A.; Wang, X.; Zhao, Z.; Yang, L.; Zhong, F.; Zheng, C.; Gao, N. Risk Assessment of Heavy Metal Pollution in Farmland Soils at the Northern Foot of the Qinling Mountains, China. Int. J. Environ. Res. Public Health 2022, 19, 14962. [Google Scholar] [CrossRef] [PubMed]
  36. Hakanson, L. An ecological risk index for aquatic pollution. A sedimentological approach. Water Res. 1980, 14, 975–1001. [Google Scholar] [CrossRef]
  37. Jiang, Z.C.; Guo, Z.H.; Peng, C.; Liu, X.; Zhou, Z.R.; Xiao, X.Y. Heavy metals in soils around non-ferrous smelteries in China: Status, health risks and control measures. Environ. Pollut. 2021, 282, 117038. [Google Scholar] [CrossRef] [PubMed]
  38. Huang, H.; Mao, J.; Tan, J.; Zhong, K.; Chen, J.; Huang, D.; Gu, X.; Zhang, C. Heavy metal contamination, accumulation, and risk assessment in a paddy field near Pb-Zn mine, in Guangxi Province, China. J. Soils Sediments 2023, 23, 1345–1355. [Google Scholar] [CrossRef]
  39. Xu, H.F.; Croot, P.; Zhang, C.S. Exploration of the spatially varying relationships between lead and aluminium concentrations in the topsoil of northern half of Ireland using Geographically Weighted Pearson Correlation Coefficient. Geoderma 2022, 409, 115640. [Google Scholar] [CrossRef]
  40. Xu, D. Evaluation of Soil Heavy Metal Pollution around Lead-Zinc Mining Area in Northwest Guizhou Based on Land Use; Guizhou Normal University: Guiyang, China, 2024. [Google Scholar]
  41. Li, P. Spatial Characteristics, Source Analysis and Health Risk Assessment of Heavy Metal Pollution in Cultivated Soil in Jinhua City; Zhejiang Normal University: Jinhua, China, 2023. [Google Scholar]
  42. Zhang, C.; He, F.; Wang, N.Y.; Yuan, M.Y.; Laipan, M.W.; Guo, J.K. Characteristics, source analysis and health risk assessment of heavy metal pollution in soil and crops in typical molybdenum mine area of Qinling Mountains. Environ. Sci. 2024, 1–24. [Google Scholar] [CrossRef]
  43. Hou, C.; Wang, S.; Wang, Q.; Hou, C.; Li, W.; Wang, C.; Ma, Z. Characteristics and source analysis of heavy metal pollution in surface soil of counties and cities along the eastern part of Huanghe Mountain. Environ. Sci. 2024, 1–14. (In Chinese) [Google Scholar] [CrossRef]
  44. Chen, W.; Liu, Q.; Wang, B.; Wang, S.; Liu, Z.; Zhang, N.; Li, B. Evaluation and source analysis of heavy metal pollution in cultivated soil of a lead-zinc mining area in Huize County, Yunnan Province. J. Agric. Environ. Sci. 2024, 1–10. (In Chinese) [Google Scholar]
  45. Lv, W.; Zheng, J.; Lai, B. Effect of cadmium pollution in tungsten mine on population in irrigation area of Dayu County. Nonferrous Met. Miner. Explor. 1997, 53–57. (In Chinese) [Google Scholar]
  46. Liu, Z. Analysis of soil heavy metal sources and identification of risk areas in industrial agglomeration area of Xiangjiang River Basin. Chin. Acad. Environ. Sci. 2023. (In Chinese) [Google Scholar] [CrossRef]
  47. Xiong, C. Characteristics and Risk Assessment of Soil Heavy Metal Pollution in Tungsten Ore Area of Southern Gannan; Nanchang University: Nanchang, China, 2023. [Google Scholar] [CrossRef]
  48. Wang, H. Study on the Characteristics and Source Analysis of Heavy Metal Pollution in Soil-Wheat System in Typical Industrial Zone; Northwest A&F University: Xianyang, China, 2024. [Google Scholar] [CrossRef]
  49. Liu, K.; Li, Y.; Yu, H.; Zhou, L.; Li, H.; Wang, J. Characteristics, risks and sources of soil heavy metal pollution in an industrial park in Chongqing. China Environ. Monit. 2024, 40, 74–83. (In Chinese) [Google Scholar] [CrossRef]
  50. Sun, T. Research status of soil heavy metal pollution. Agric. Technol. 2016, 36, 246. (In Chinese) [Google Scholar]
  51. Banerji, A. Acquisition of adaptive traits via interspecific association: Ecological consequences and applications. Ecologies 2021, 2, 43–70. [Google Scholar] [CrossRef]
  52. Yan, T.T.; Zhao, W.J.; Yu, X.Y.; Li, H.X.; Gao, Z.K.; Ding, M.; Yue, J. Evaluating heavy metal pollution and potential risk of soil around a coal mining region of Tai’an City, China. Alex. Eng. J. 2022, 61, 2156–2165. [Google Scholar] [CrossRef]
  53. Liu, W.Z.; Huang, F.; Wang, Y.J.; Zou, T.; Zheng, J.S.; Lin, Z. Recycling Mg (OH)2 Nanoadsorbent during Treating the Low Concentration of Cr. Environ. Sci. Technol. 2011, 45, 1955–1961. [Google Scholar] [CrossRef] [PubMed]
  54. Torbati, S.; Kermani, S.E.; Abedini, A. Remediation of heavy metals by native plant species grown in Iran’s richest gold mine and study of plants’ pollution tolerance strategies. Front. Earth Sci. 2024, 12, 1304497. [Google Scholar] [CrossRef]
  55. Elshamy, M.M.; Heikal, Y.M.; Bonanomi, G. Phytoremediation efficiency of Portulaca oleracea L. naturally growing in some industrial sites, Dakahlia District, Egypt. Chemosphere 2019, 225, 678–687. [Google Scholar] [CrossRef]
  56. Pan, L.; Ma, J.; Hu, Y.; Su, B.; Fang, G.; Wang, Y.; Wang, Z.; Wang, L.; Xiang, B. Assessments of levels, potential ecological risk, and human health risk of heavy metals in the soils from a typical county in Shanxi Province, China. Environ. Sci. Pollut. Res. 2016, 23, 19330–19340. [Google Scholar] [CrossRef] [PubMed]
  57. Xue, Y.X.; Sattari, F.; Lefsrud, L. A quantitative analysis method for ecological-health risks caused by rainfall-induced soil erosion at the Laronde Mine. Eng. Geol. 2024, 330, 107410. [Google Scholar] [CrossRef]
  58. Zheng, X.J.; Chen, M.; Wang, J.F.; Li, F.G.; Liu, Y.; Liu, Y.C. Ecological Risk Assessment of Heavy Metals in the Vicinity of Tungsten Mining Areas, Southern Jiangxi Province. Soil Sediment Contam. 2020, 29, 665–679. [Google Scholar] [CrossRef]
  59. Chai, Y.Z.; Guo, F. Potentially Toxic Element Contamination in Soils Affected by the Antimony Mine Spill in Northwest China. Toxics 2023, 11, 359. [Google Scholar] [CrossRef] [PubMed]
  60. Vidal, M.; López-Sánchez, J.; Sastre, J.; Jiménez, G.; Dagnac, T.; Rubio, R.; Rauret, G. Prediction of the impact of the Aznalcollar toxic spill on the trace element contamination of agricultural soils. Sci. Total Environ. 1999, 242, 131–148. [Google Scholar] [CrossRef] [PubMed]
Figure 1. Geographical map of Wuxuan County.
Processes 12 01745 g001
Figure 2. Distribution of sampling points.
Processes 12 01745 g002
Figure 3. Statistical diagram of the single-factor and Nemerow indexes of the concentrator.
Processes 12 01745 g003
Figure 4. Statistical diagram of the single-factor and Nemerow indexes of the tailing pond.
Processes 12 01745 g004
Figure 5. Statistical map of the single-factor and Nemerow indexes of the surrounding agricultural land.
Processes 12 01745 g005
Figure 6. Statistical map of the geo-accumulation index: (a) the concentrator; (b) the tailings pond; (c) the surrounding agricultural land.
Processes 12 01745 g006
Figure 7. Statistical diagram of the potential ecological risk index of the concentrator.
Processes 12 01745 g007
Figure 8. Statistical diagram of the potential ecological risk index of the tailings pond.
Processes 12 01745 g008
Figure 9. Statistical map of potential ecological risk index of the surrounding agricultural land.
Processes 12 01745 g009
Figure 10. *At level 0.01, remarkably correlative. Correlation diagram of heavy metals: (a) concentrator; (b) tailings pond; (c) the surrounding agricultural land.
Processes 12 01745 g010
Figure 11. The contribution ratio of heavy metals from different sources to each soil (PMF analytic result graph) (a) Concentrator; (b) The tailings pond; (c) The surrounding agricultural land.
Processes 12 01745 g011
Table 1. The single-factor pollution index (Pi) rating standard.
Single-Factor Pollution IndexPi ≤ 11 < Pi ≤ 22 < Pi ≤ 3Pi > 3
Pollution degreeSafeLightly pollutedModerately pollutedHighly polluted
Table 2. The Nemerow comprehensive index (PI) rating standard.
GradeNemerow Comprehensive IndexPollution DegreePollution Level
IPI ≤ 0.7SafeClean
II0.7 < PI ≤ 1.0CautionarySlightly clean
III1.0 < PI ≤ 2.0Lightly pollutedOver background value
IV2.0 < PI ≤ 3.0Moderately pollutedThe soil is heavily polluted
VPI > 3Highly pollutedThe soil is extremely polluted
Table 3. The geo-accumulation index (Igeo) rating standard.
GradeThe Geo-Accumulation IndexPollution Degree
0Pij < 0Non-pollution
10 ≤ Pij < 1Mild pollution
21 ≤ Pij < 2Moderate pollution
32 ≤ Pij < 3Moderate to heavy pollution
43 ≤ Pij < 4Heavy pollution
54 ≤ Pij < 5Relatively serious pollution
65 ≤ PijExtremely serious pollution
Table 4. Potential ecological risk index rating standard.
ParametersItemsEcological Risk Level
E r i Coefficient range<4040–8080–160160–320>320
pollution levelSlight pollutionModerate pollutionHeavy pollutionVery serious pollutionExtremely serious pollution
RICoefficient range<150150–300300–600>600
pollution levelSlight pollutionModerate pollutionHeavy pollutionVery serious pollution
Table 5. Concentration of heavy metals in concentrator soil.
ItemsMinimum
(mg/kg)
Maximum
(mg/kg)
Average
(mg/kg)
Standard Deviation
(mg/kg)
Coefficient Variation
CV
Background Values
(mg/kg)
V2.201018.56407.79371.510.91129.9
Cr2.47357.58114.2899.660.8782.1
Ni0.44153.5536.4844.341.2226.6
Zn1.6715,310.864700.435148.801.1075.6
As0.235787.611137.081542.911.3620.5
Cd0.020.340.140.130.880.267
Hg0.021.220.390.360.920.152
Pb0.736780.971366.321871.801.3724.0
Cu1.06228.1068.8165.280.9527.8
Co0.0177.8314.7223.841.6210.4
Table 6. Concentration of heavy metals in the soil of a tailings pond.
ItemsMinimum
(mg/kg)
Maximum
(mg/kg)
Average
(mg/kg)
Standard Deviation (mg/kg)Coefficient Variation
CV
Background Values
(mg/kg)
V67.929825.001312.922409.501.84129.9
Cr39.23149.5949.4255.711.1382.1
Ni7.8436.0112.7914.131.1126.6
Zn13.309824.832858.082996.501.0575.6
As1.082671.00684.80695.161.0220.5
Cd0.0743.002.529.553.790.267
Hg0.010.590.100.171.670.152
Pb2.683381.001143.711099.870.9624.0
Cu11.371011.59196.02234.581.2027.8
Co0.799.683.333.611.0810.4
Table 7. The concentration of heavy metals in the soil of the surrounding agricultural land.
ItemsMinimum
(mg/kg)
Maximum
(mg/kg)
Average
(mg/kg)
Standard Deviation
(mg/kg)
Coefficient Variation
CV
Background Values
(mg/kg)
V29.51208.9767.7946.100.68129.9
Cr19.72321.4159.2479.071.3382.1
Ni5.9478.7417.7518.631.0526.6
Zn38.12361.07166.15112.930.6875.6
As8.23115.5441.1933.710.8220.5
Cd0.030.880.150.231.530.267
Hg0.010.570.060.152.400.152
Pb24.21137.7670.9636.030.5124.0
Cu7.3146.1218.379.220.5027.8
Co2.2927.057.905.980.7610.4
Table 8. KMO and Bartlett inspection of heavy metals in concentrator.
KMO and Bartlett Inspection
KMO sample appropriateness measure 0.622
Bartlett sphericity testApproximate Chi-square184.519
degree of freedom45
significance0.000
Table 9. Principal component analysis of heavy metals in concentrator.
ItemsPC1PC2PC3
Eigenvalues4.8402.9431.341
contribution ratio/%48.40429.43513.406
accumulating contribution ratio/%48.40477.83891.244
V0.634−0.705
Cr0.6460.743
Ni0.3580.9030.227
Zn0.7350.123−0.585
As0.834−0.2830.368
Cd0.813−0.448−0.110
Hg0.645−0.5180.408
Pb0.880−0.3200.230
Cu0.8820.128
Co0.1700.9410.276
Table 10. KMO and Bartlett inspection of heavy metals in tailings pond.
KMO and Bartlett Inspection
KMO sample appropriateness measure 0.562
Bartlett sphericity testApproximate Chi-square157.494
degree of freedom45
significance0.000
Table 11. Principal component analysis of heavy metals in tailings ponds.
ItemsPC1PC2PC3
Eigenvalues4.3772.3631.366
contribution ratio/%43.76723.63313.656
accumulating contribution ratio/%43.76767.40081.056
V0.6420.208−0.286
Cr−0.8530.452−0.110
Ni−0.8850.429−0.062
Zn0.3390.6850.526
As0.6700.577−0.278
Cd0.5090.441−0.468
Hg−0.6750.577−0.106
Pb0.6680.6550.059
Cu0.4010.1050.800
Co−0.7540.4010.200
Table 12. KMO and Bartlett inspection of heavy metals in the surrounding agricultural land.
KMO and Bartlett Inspection
KMO sample appropriateness measure 0.752
Bartlett sphericity testApproximate Chi-square235.095
degree of freedom45
significance0.000
Table 13. Principal component analysis of heavy metals in the surrounding agricultural land.
ItemsPC1PC2
Eigenvalues7.1131.946
contribution ratio/%71.13119.456
accumulating contribution ratio/%71.13190.586
V0.991−0.060
Cr0.945−0.299
Ni0.967−0.169
Zn0.6540.726
As0.7570.588
Cd0.523−0.551
Hg0.914−0.357
Pb0.6580.694
Cu0.905−0.104
Co0.970−0.168
Disclaimer/Publisher’s Note: The statements, opinions and data contained in all publications are solely those of the individual author(s) and contributor(s) and not of MDPI and/or the editor(s). MDPI and/or the editor(s) disclaim responsibility for any injury to people or property resulting from any ideas, methods, instructions or products referred to in the content.

