Article

Preparation of Fe2O3/g-C3N4 Photocatalysts and the Degradation Mechanism of NOR in Water under Visible Light Irradiation

1
School of Environmental & Safety Engineering, Liaoning Petrochemical University, Fushun 113001, China
2
School of Civil Engineering, Liaoning Petrochemical University, Fushun 113001, China
3
School of Petrochemical Engineering, Liaoning Petrochemical University, Fushun 113001, China
*
Authors to whom correspondence should be addressed.
Processes 2024, 12(8), 1748; https://doi.org/10.3390/pr12081748
Submission received: 29 June 2024 / Revised: 8 August 2024 / Accepted: 16 August 2024 / Published: 20 August 2024
(This article belongs to the Section Environmental and Green Processes)

Abstract

:
Fe2O3/g-C3N4 nano-heterostructures for photocatalytic degradation of NOR (norfloxacin) were successfully prepared by combining co-precipitation and calcination methods. The g-C3N4, Fe2O3, and different composite ratios of Fe2O3/g-C3N4 (FeCNs) were characterized by XRD, SEM, XPS, UV-vis DRS, PL, and electrochemical tests, and the mechanism of photocatalytic degradation of NOR was analyzed. The results indicated that the semiconductor was attached to the surface of g-C3N4 in the form of α-Fe2O3 crystal with good crystalline structure. The composite of Fe2O3 with g-C3N4 increased the specific surface area of the material, effectively reduced the band gap, strengthened the photogenerated e/h+ pair separation, and improved the photocatalytic performance of the composite. The photocatalytic degradation of NOR was consistent with the quasi-primary reaction kinetic model. Among them, FeCN-25wt% showed the optimal photocatalytic degradation of NOR (72.3%) with the largest degradation rate (k = 0.00900 min−1). The Fe2O3/g-C3N4 composite structure is inferred to be a Z-type heterojunction.

1. Introduction

With the rapid development of the pharmaceutical industry, antibiotics have been widely detected in soil and surface water, which has caused many concerns. Norfloxacin (NOR) is widely used as a third-generation fluoroquinolone in the medical field [1]. Due to its difficult degradation, its continuous accumulation in aquatic ecosystems can lead to the formation and spread of bacterial resistance, threatening human health and ecological balance [2,3]. Therefore, there is an urgent need to develop a simple, efficient and low-cost method to degrade and convert NOR.
Photocatalytic oxidation technology has the advantages of being green, efficient, and low cost [4,5,6], and shows good application prospects in the treatment of antibiotics. In the selection of photocatalysts, graphitic carbon nitride (g-C3N4) has higher solar energy utilization than traditional TiO2 and ZnO photocatalysts, and is chemically stable and easy to synthesize [7,8,9,10].
However, unmodified g-C3N4 has poor photogenerated carrier mobility, low photogenerated electron (e)–hole (h+) pair separation efficiency, and weak photocatalytic ability of the material. Fe2O3 is a common semiconductor photocatalytic material with low cost, narrow band gap, and good stability [11,12]. Therefore, it is of great practical significance to couple g-C3N4 with other semiconductors to reduce carrier complexation.
In this paper, co-precipitation and calcination methods were combined to prepare Fe2O3/g-C3N4 nano-heterostructures for photocatalytic degradation of NOR. The g-C3N4, Fe2O3, and FeCNs were characterized by XRD, SEM, XPS, UV-vis DRS, PL, and electrochemical tests to further analyze the mechanism of photocatalytic degradation of NOR, which can provide a referable idea for the effective removal of antibiotics in water.

2. Materials and Methods

2.1. Materials

The chemical agents used in this article were all analytical grade, including norfloxacin (NOR), urea, dicyandiamide, melamine, ferrous sulfate heptahydrate, oxalate, etc. They were purchased from McLean Biochemical Technology Co., Ltd., in Shanghai, China. The reaction solvents in the experiments were deionized water.

2.2. Preparation of Photocatalyst

2.2.1. Preparation of g-C3N4

The urea, dicyandiamide, and melamine were ground and sieved, respectively, and then spread in the crucible to ensure that the agents were heated uniformly during the thermal condensation process, and then the crucible was capped and placed in a muffle furnace. The muffle furnace was programmed to increase the temperature at a rate of 2.5 °C/min for 220 min to 550 °C, and the temperature was maintained at this temperature for 4 h. The reaction products were cooled down to room temperature, and three kinds of g-C3N4 were obtained after grinding and sieving, labeled as CNU, CND, and CNM, respectively.

2.2.2. Preparation of Fe2O3/g-C3N4

Fe2O3/g-C3N4 was prepared by a combination of co-precipitation and calcination as follows: a certain concentration of oxalic acid solution and ferrous sulfate heptahydrate solution were configured, respectively. A certain amount of g-C3N4 (CNM) powder was dispersed in oxalic acid solution by ultrasonic dispersion for 2 h, to which ferrous sulfate heptahydrate solution was added dropwise at a rate of 1 mL/min, stirred magnetically for 2 h, and a yellow precipitate was obtained after 24 h of standing. The above precipitate was centrifuged at high speed, washed alternately with deionized water and anhydrous ethanol until the supernatant was neutral, dried, and laid flat in the crucible, and then placed in a muffle furnace after the crucible was covered. The program of muffle furnace was set as follows: the heating rate was 5 °C/min, the temperature was increased to 450 °C after 90 min, and kept for 2 h. After the reaction, the solid powder of Fe2O3/g-C3N4 was obtained by cooling to room temperature. The composite products were labeled as FeCN-20 wt%, FeCN-25 wt%, FeCN-30 wt%, FeCN-35 wt%, and FeCN-40 wt% depending on the content (mass fraction) of Fe2O3.

2.2.3. Preparation of Fe2O3

Ferrous sulfate heptahydrate and oxalic acid solutions were co-precipitated to produce ferrous oxalate precipitation, which was later centrifuged, washed, dried, and calcined to produce Fe2O3 red solid powder. In order to avoid the influence of other variables on the experimental results, the preparation conditions of this process were not different from those of Fe2O3/g-C3N4 except that g-C3N4 powder was not added.

2.3. Characterization of Photocatalyst

The crystal structure and composition of the samples were analyzed utilizing an X-ray diffractometer (XRD, Brooke D8 Advance, Bruker Corporation, Karlsruhe, Germany). Scanning electron microscope (SEM, SU8010, Hitachi, Tokyo, Japan) was used to characterize the surface morphology of the samples. The specific surface area and pore size distribution of the material were tested and analyzed using a fully automated physical static analyzer (Autosorb-IQ2-MP, Quantachrome Instruments, Beach, FL, USA). X-ray electron spectroscopy (XPS, D/max-2400, Rigaku, Tokyo, Japan) was conducted to analyze the elemental compositions and chemical valence states on the photocatalysts’ surface. The sample was tested using a UV-vis DRS (UV-2600, Shimadzu, Kyoto, Japan) to attain the maximum absorption of the material at 200–1200 nm. Photoluminescence (PL) of the samples was recorded on a fluorescence spectrometer (F-4600, Hitachi, Japan) with a xenon lamp excitation wavelength of 350 nm and a testing range of 375~420 nm. The photocurrent density and electrochemical impedance spectra (EIS) of the samples were obtained on an electrochemical workstation (Chenhua CHI 660E, Shanghai, China) to measure the electrical properties of the photocatalysts (the electrolyte is sodium sulfate).

2.4. Photocatalytic Performance Testing

The photocatalytic performance of the prepared photocatalysts for NOR under visible light irradiation was measured using a 250 W sodium lamp (590 nm) as a light source. During the experiments, 150 mg of photocatalysts was added to a 200 mL solution containing NOR (20 mg/L) and stirred in the dark for 30 min until an adsorption–desorption equilibrium was reached between the photocatalysts and NOR. Then, the sodium lamp was turned on, air was blown in, and the solution was exposed to light for 150 min. Samples were taken at 30 min intervals and filtered through a 0.45 μm organic filter membrane. The absorbance of the solution was measured at 278 nm to obtain the concentration of NOR.

3. Results

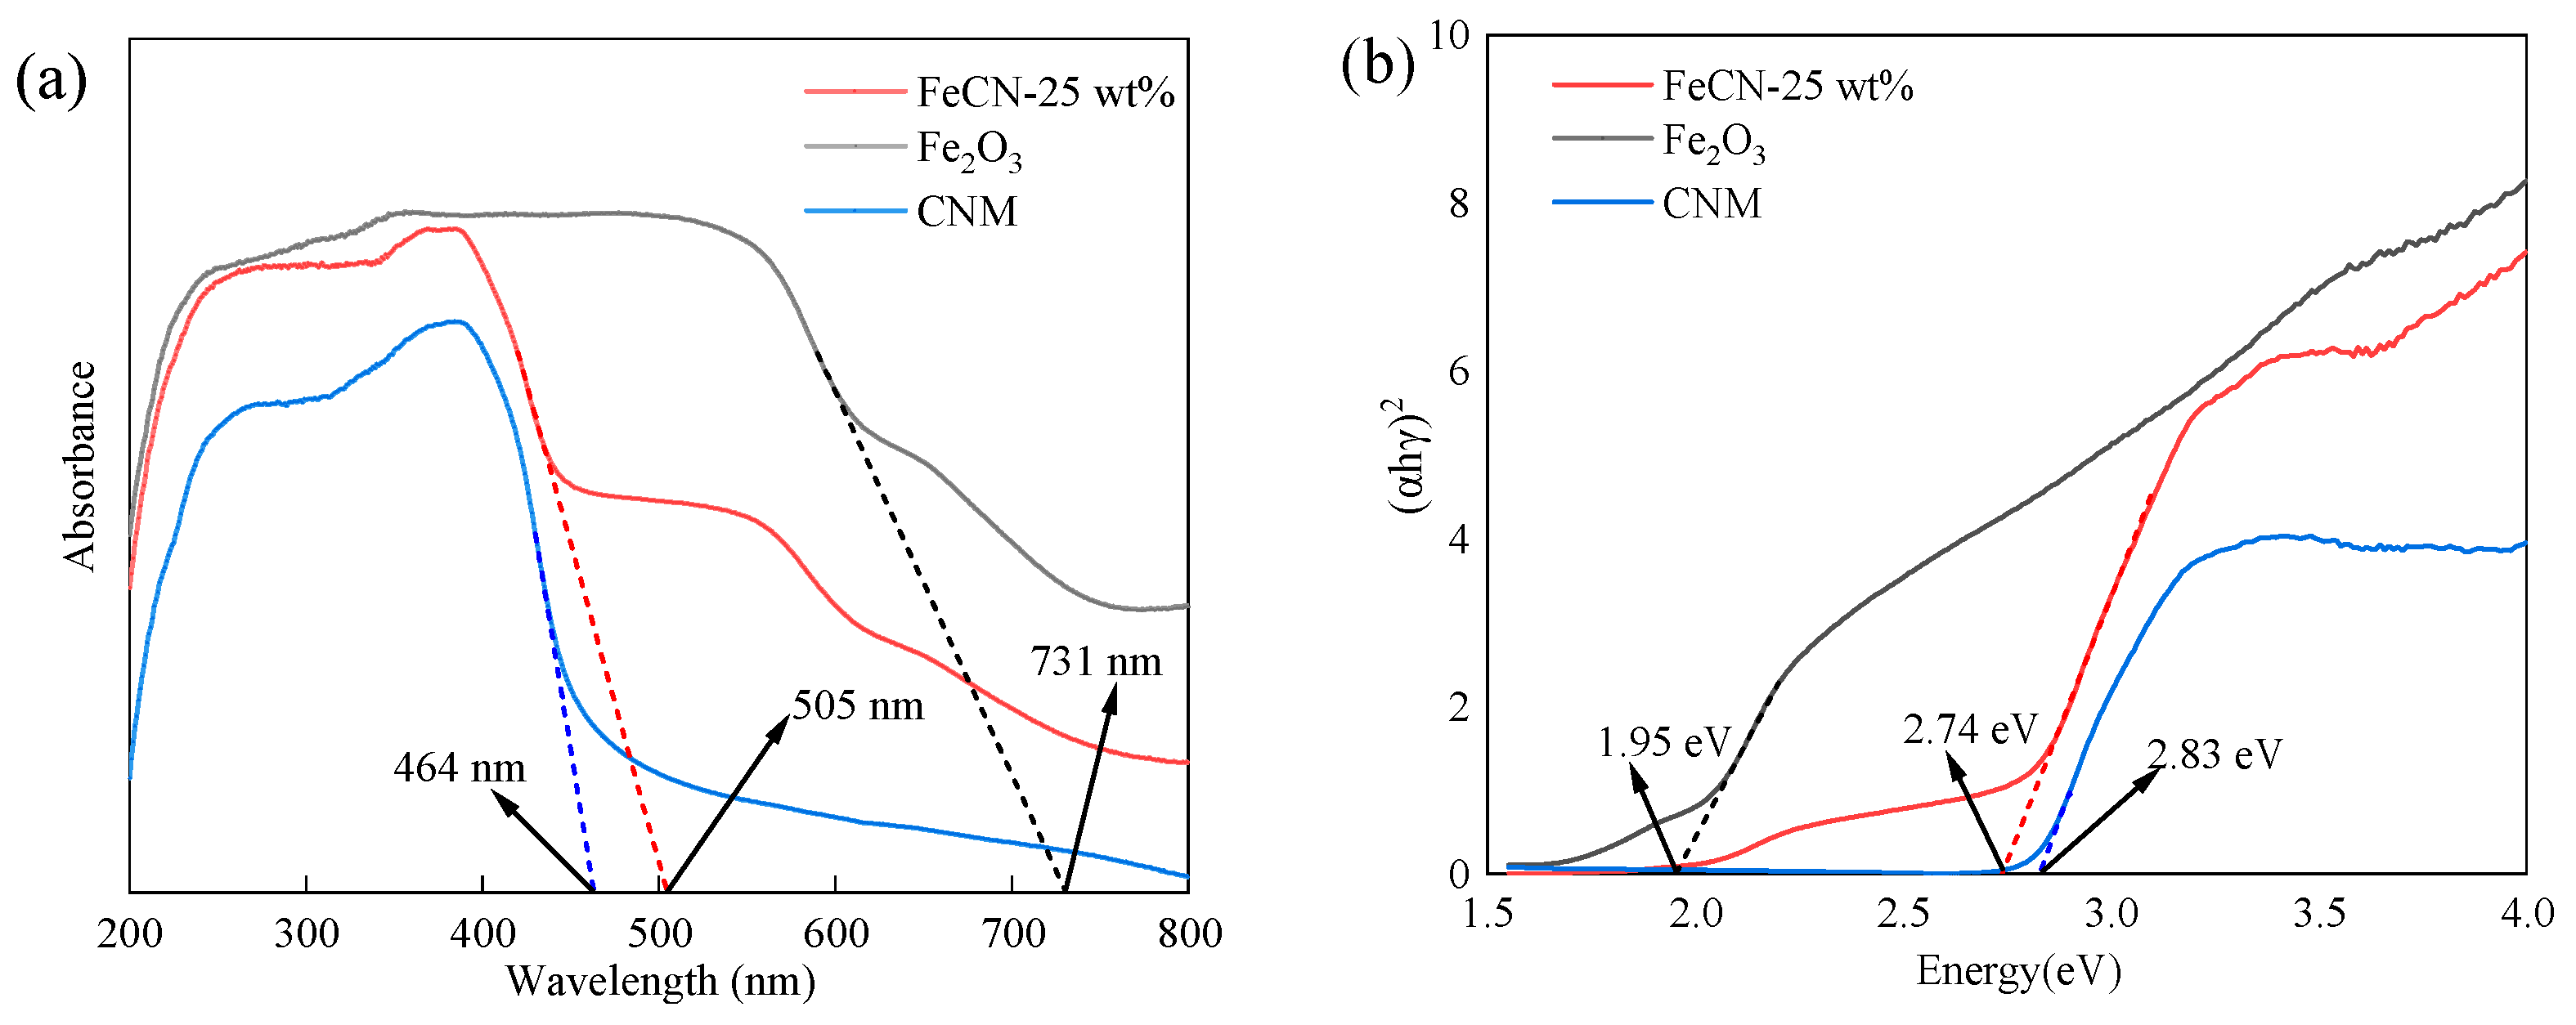
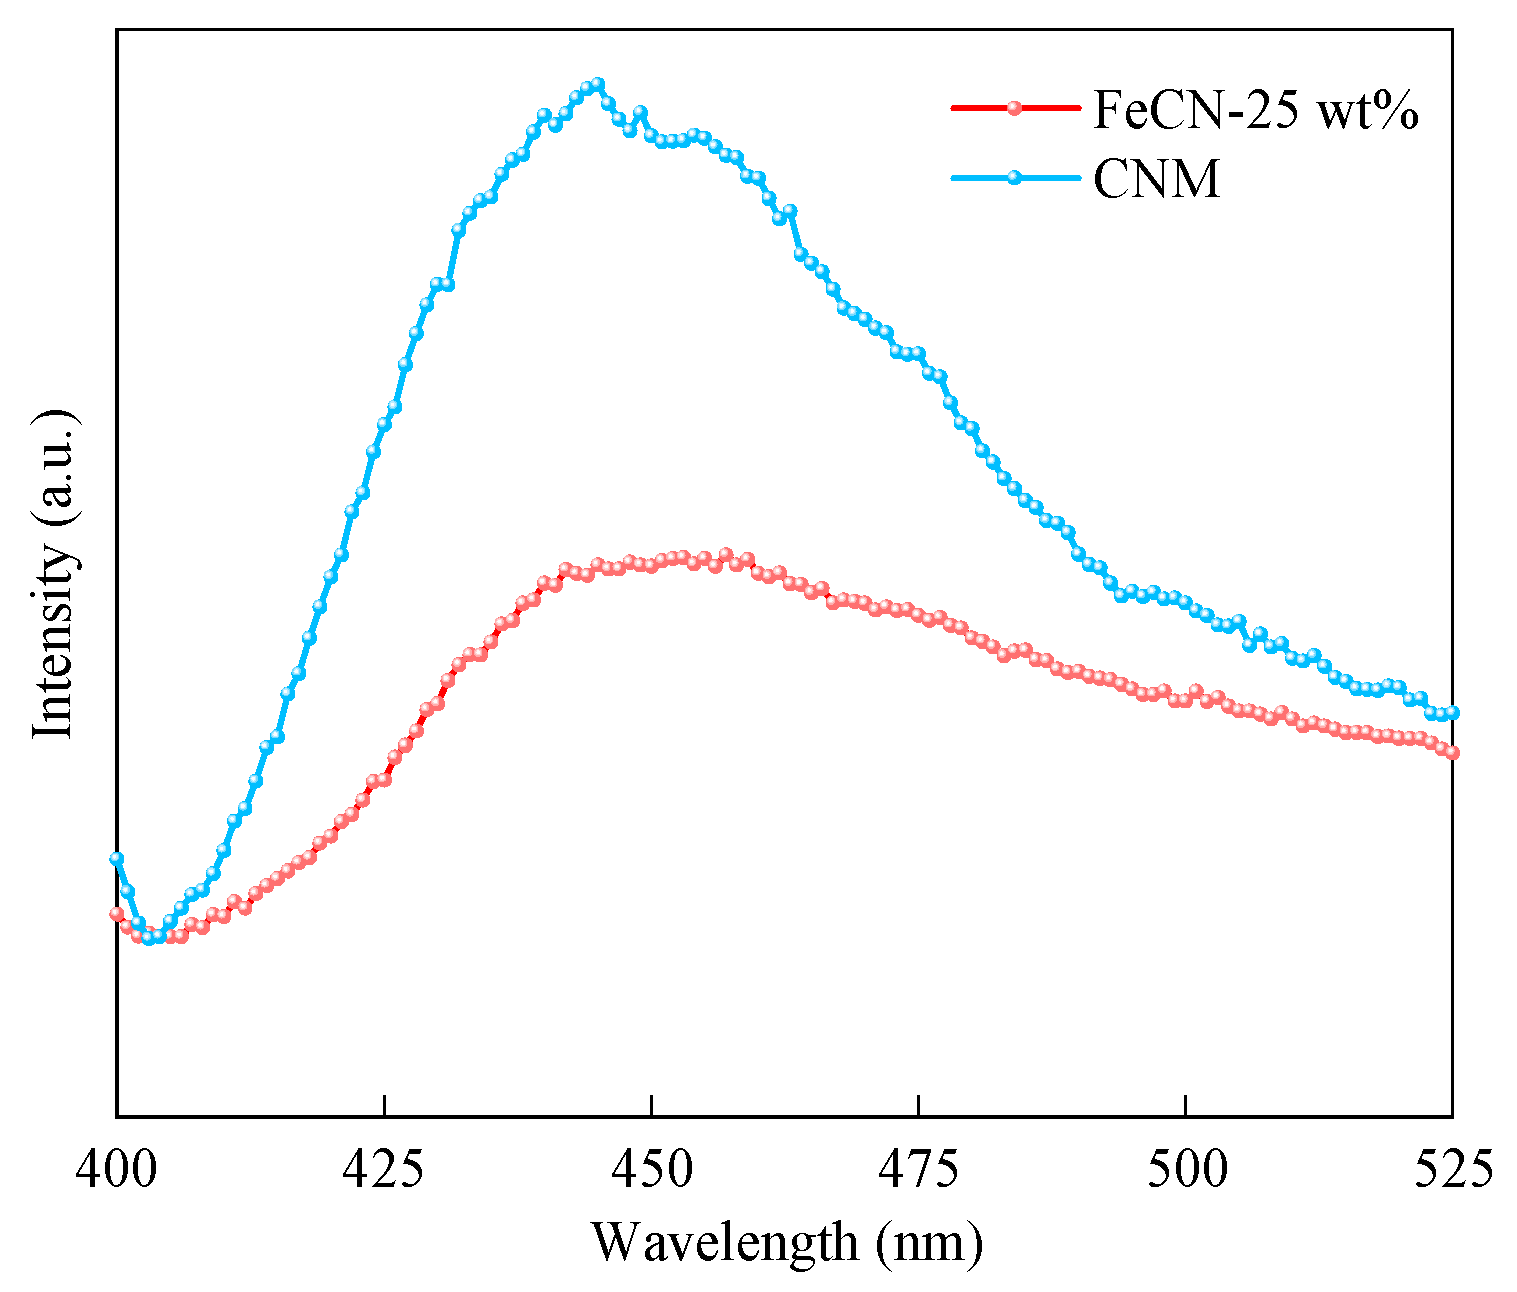
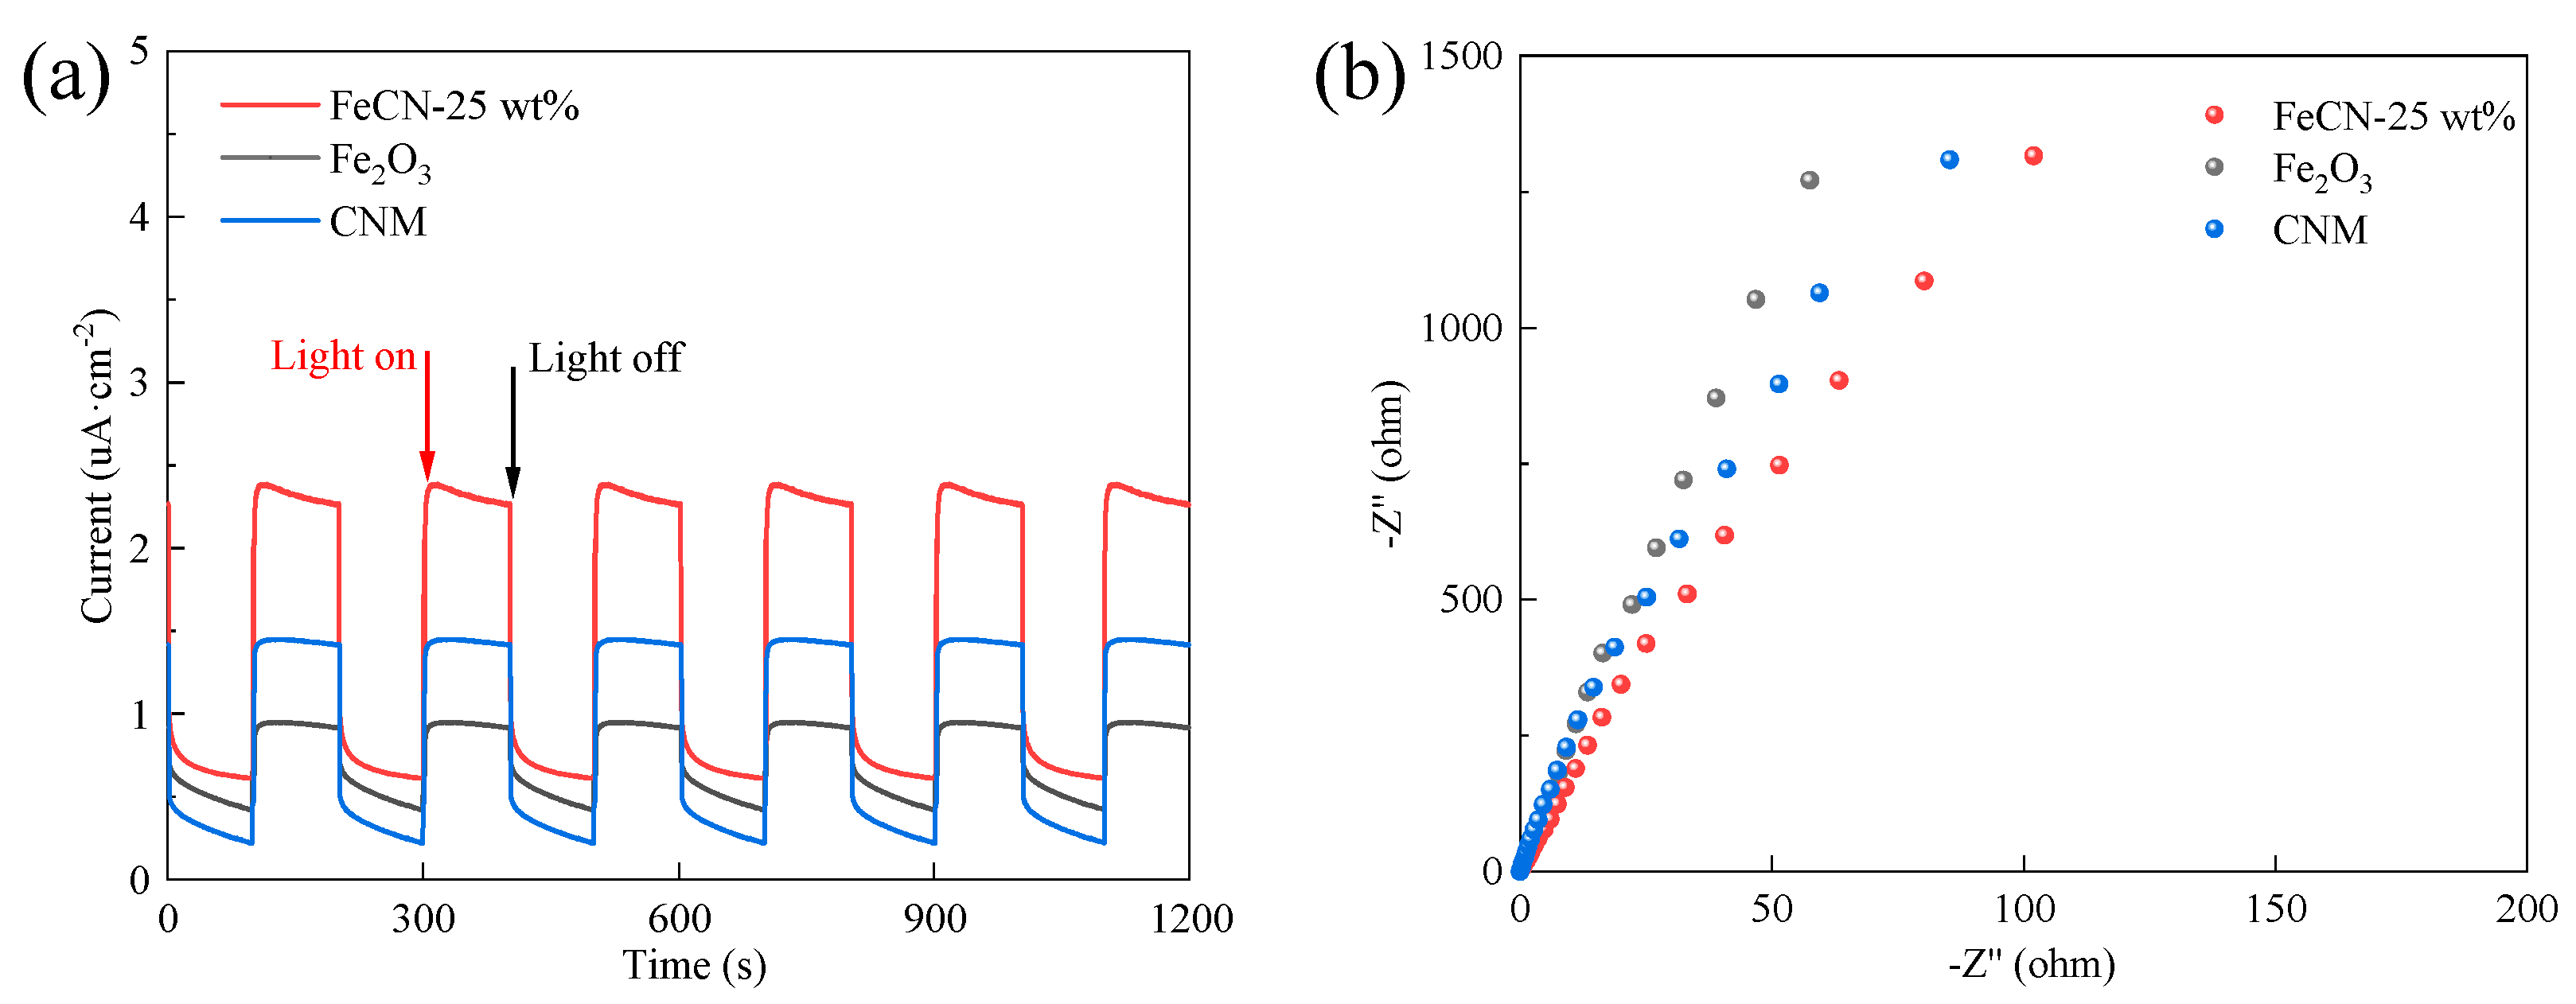
3.1. Characterization of Photocatalysts

The XRD analysis of the photocatalysts prepared in this study are presented in Figure 1. As can be seen from Figure 1a, CNU, CND, and CNM all display the characteristic diffraction peaks at 12.98° and 27.56°, which are analyzed against the g-C3N4 standard card (JCPDS No. 87-1526) and discover that the diffraction peak at 12.98° corresponds to the (100) crystallographic plane and the diffraction peak at 27.56° corresponds to the (002) crystallographic plane, indicating that the urea, dicyandiamide, and melamine calcination products are all g-C3N4 [13]. From the XRD characterization of the three g-C3N4, it is found that CNU, CND, and CNM did not undergo any significant shift of the characteristic diffraction peaks, but the intensity of the diffraction peaks is CND > CNM > CNU. The average diameters of CNU, CND, and CNM are calculated using the Scherrer equation [14], which are 35.2, 39.6, and 42.7 nm, respectively.
As can be seen from Figure 1b, Fe2O3 shows distinct characteristic diffraction peaks at 24.14°, 30.26°, 33.15°, 35.65°, 40.89°, 49.46°, 54.09°, 57.35°, 62.44°, and 63.99°. Comparative analysis by α-Fe2O3 standard card (JCPDS No. 33-0664) reveal that they correspond to (012), (104), (110), (113), (024), (116), (122), (214), and (300) crystal planes, which belong to the characteristic diffraction peaks of the α-crystalline Fe2O3, indicating that the synthesized Fe2O3 is α-Fe2O3.
Compared with the monomer of g-C3N4 and Fe2O3, the characteristic diffraction peaks of FeCNs do not display a significant shift and the crystal structure is relatively intact. However, different synthesis ratios can lead to significant differences in peak intensity between the composite material and the monomer.
Following, 0.15 g each of CNU, CND, and CNM in 200 mL of 20 mg/L NOR solution achieved adsorption equilibrium by dark adsorption for 30 min, followed by photocatalytic degradation for 150 min. The results are shown in Figure S1. After 150 min, the degradation rates of NOR by CNM, CND, and CNU are 49.1%, 45.3%, and 42.9%, respectively, while the blank control is only 20.4% (Figure S1a). From Figure S1b, the correlation coefficients R2 of CNM, CND, and CNU are all greater than 0.9600, so the photocatalytic degradation of NOR conforms to the quasi-primary reaction kinetic model. The photocatalytic degradation rate of NOR by the three precursors is higher than that of the blank control, and it satisfies CNM > CND > CNU. This is because the condensation process of melamine to produce CNM is shorter than that of urea to produce CNU and melamine to produce CND, resulting in fewer intermediates and better degradation effect on NOR. Therefore, CNM was chosen as the precursor for subsequent experiments.
The SEM images of CNM, Fe2O3, and FeCN-25wt% are demonstrated in Figure 2. As can be seen from Figure 2a,b, CNM is a lamellar structure with an irregular surface, but it is difficult to observe its nanosheet structure due to the strong stacking effect of g-C3N4 [15]. α-Fe2O3 is a rod-like structure, which presents an elongated rectangular shape (Figure 2c,d). From Figure 2e,f, it can be seen that the FeCN-25wt% is loose and the rod-like Fe2O3 particles are distributed in the interlayer gaps and surface of the CNM, which increases the specific surface area of the composite.
The N2 adsorption–desorption isotherms of CNM, Fe2O3, and FeCN-25wt% are displayed in Figure S2. In the low-pressure region, CNM, Fe2O3, and FeCN-25 wt% all exhibit low N2 adsorption, mainly mesoporous adsorption. Moreover, the desorption curve is located above the adsorption curve and does not overlap, forming an IV type H3 hysteresis loop. In Table S1, the specific surface area of FeCN-25wt% (165.575 m2/g) is three times that of CNM (47.257 m2/g), which is consistent with the results of SEM testing.
Figure 3 illustrates the results of high-resolution XPS spectra of CNM, Fe2O3, and FeCN-25wt%. As can be seen in Figure 3a, C 1s can be categorized into three peaks with binding energies of 284.80 eV, 286.28 eV, and 288.42 eV, which correspond to graphitized carbon (C-C/C=C, C-N) and sp2-bonded carbon (N-C=N), respectively [16]. The N 1s spectra have three peaks at 398.75 eV, 400.14 eV, and 401.32 eV (Figure 3b), originating from the 3-s-triazine ring C-N=C, N-(C)3, and N in C-N-H, respectively [16]. In Figure 3c, O 1s can be divided into two peaks with binding energies of 529.64 eV and 531.11 eV, stemming from the lattice O and surface -OH of the α-Fe2O3, respectively [17]. Figure 3d reveals the Fe 2p with two peaks at 710.38 eV and 723.62 eV, which both originate from the oscillations of Fe3+ [18,19].
Comparing CNM and Fe2O3, the N 1s, O 1s, and Fe 2p binding energies in FeCN-25wt% are significantly shifted, with positive shifts of 0.2 eV, 0.4 eV, and negative shifts of 0.2 eV, respectively. It is shown that after the composite, an interaction structure is formed between the two components in FeCN-25wt%, which promotes the formation of inter-semiconductor heterojunction, changes the electron–hole pair migration mode, and reduces the electron–hole complexation rate for the purpose of enhancing the catalytic performance.
The optical properties of the prepared CNM, Fe2O3, and FeCN-25wt% photocatalysts were analyzed using UV-vis DRS, and the results are shown in Figure 4a. The onset wavelengths of the absorption spectra of g-C3N4 and Fe2O3 are 464 nm and 632 nm, respectively, which are in agreement with the literature [20,21]. The CNM absorption boundary is 464 nm, Fe2O3 exhibits a broad and strong absorption in the UV-visible range of 200–800 nm, and the FeCN-25wt% absorption boundary is about 505 nm. It can be seen that the absorption boundary and response range of the photocatalytic materials have been significantly improved after compositing, which is conducive to the improvement of photocatalytic efficiency.
The energy band gap values of the three photocatalysts were obtained by calculations based on the Kubelka–Munk equation [22], as shown in Figure 4b. The band gap widths of CNM, Fe2O3, and FeCN-25wt% are 2.83 eV, 1.95 eV, and 2.74 eV, respectively. It can be seen that g-C3N4 combines with Fe2O3 to form a Fe2O3/g-C3N4 heterojunction, effectively reducing the band gap width and facilitating photo excitation, thereby improving photocatalytic performance.
Figure 5 refers to the PL spectra of CNM and FeCN-25wt%. Compared with CNM, the intensity of FeCN-25wt% is greatly weakened. By constructing the heterostructure between Fe2O3 and g-C3N4, not only the electrical conductivity of the catalyst is improved [23], but also the defects of g-C3N4 are regulated, which accelerate the separation and transfer of photogenerated charge carriers on the complexes and enhance the catalytic activity of the photocatalytic materials.
In order to evaluate the separation and complexation of electron–hole pairs and the migration ability of photogenerated carriers of the photocatalysts, transient photocurrent tests and EIS analyses were carried out for CNM, Fe2O3, and FeCN-25wt%, respectively, and the results are shown in Figure 6. Compared with CNM and Fe2O3, FeCN-25wt% shows relatively higher photocurrent intensity (Figure 6a), which indicates that the loading of Fe2O3 promotes charge separation, improves the charge release and transfer ability, and increases the efficiency of photogenerated electron–hole pair separation, and highlights the performance advantage of the material in the photocatalytic system. The impedance arc radius of FeCN-25wt% is smaller compared with that of CNM and Fe2O3 (Figure 6b), which indicates that the resistance of the composite material is minimized when the surface charge is transferred. Therefore, by constructing the heterojunction between Fe2O3 and CNM, the interfacial charge migration ability of the material is effectively enhanced, which effectively reduces the photocatalytic reaction initiation conditions to a certain extent, makes the reaction easier to occur, and improves the photocatalytic activity of the material.

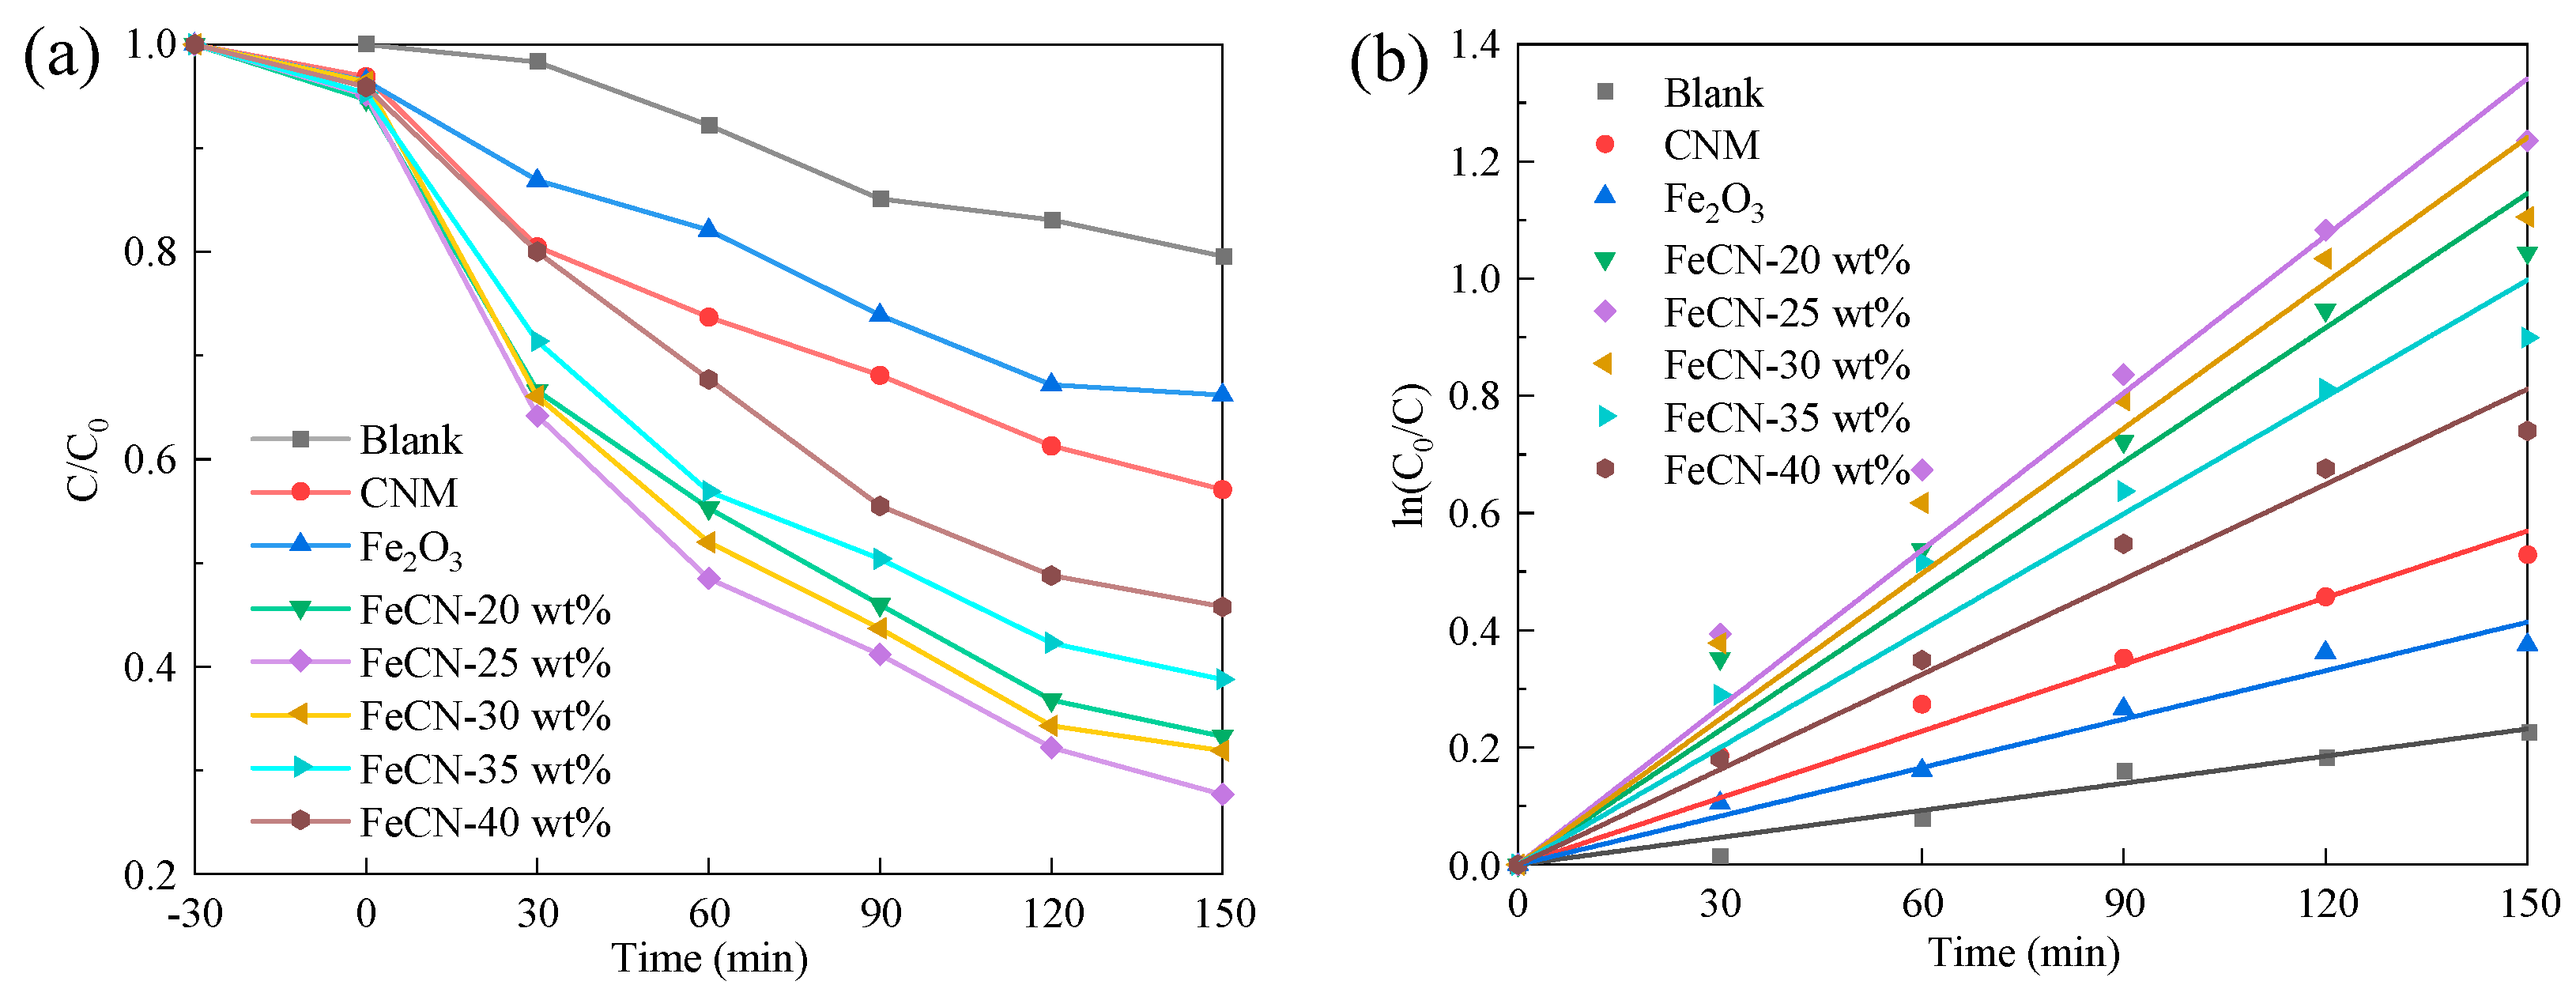
3.2. Photocatalytic Performance

The photocatalytic degradation effect of CNM, Fe2O3, and FeCNs on NOR and the fitting curve of the quasi-first-order reaction kinetics model are depicted in Figure 7. In Figure 7a, compared with CNM and Fe2O3, FeCNs have significantly improved the removal rate of NOR. When the Fe2O3 loading is 20 wt%, 25 wt%, 30 wt%, 35 wt%, and 40 wt%, the removal rates of NOR after visible light irradiation for 150 min are 66.7%, 72.3%, 68.1%, 61.2% and 54.2%, respectively.
From Figure 7b, the correlation coefficients R2 of CNM, Fe2O3, and FeCNs are all greater than 0.9600, so the photocatalytic degradation of NOR conforms to the quasi-primary reaction kinetic model. The reaction rate constants (k) for the photocatalytic degradation of NOR by FeCN-20wt%, FeCN-25wt%, FeCN-30wt%, FeCN-35wt%, and FeCN-40wt% are 0.00764 min−1, 0.009 min−1, 0.00828 min−1, 0.00665 min−1, and 0.00541 min−1, while the photocatalytic degradation rates of NOR by blank control, CNM, and Fe2O3 are 0.00154 min−1, 0.0045 min−1, and 0.00276 min−1. This indicates that FeCNs increase the photocatalytic degradation reaction rate. And among a series of photocatalytic materials with different composite ratios, FeCN-25wt% exhibits the best degradation effect on NOR. The degradation rate of FeCN-25wt% is 2.3684 times higher than that of CNM and 3.2609 times higher than that of Fe2O3. In summary, the composite of CNM and Fe2O3 effectively enhance the photocatalytic degradation performance.

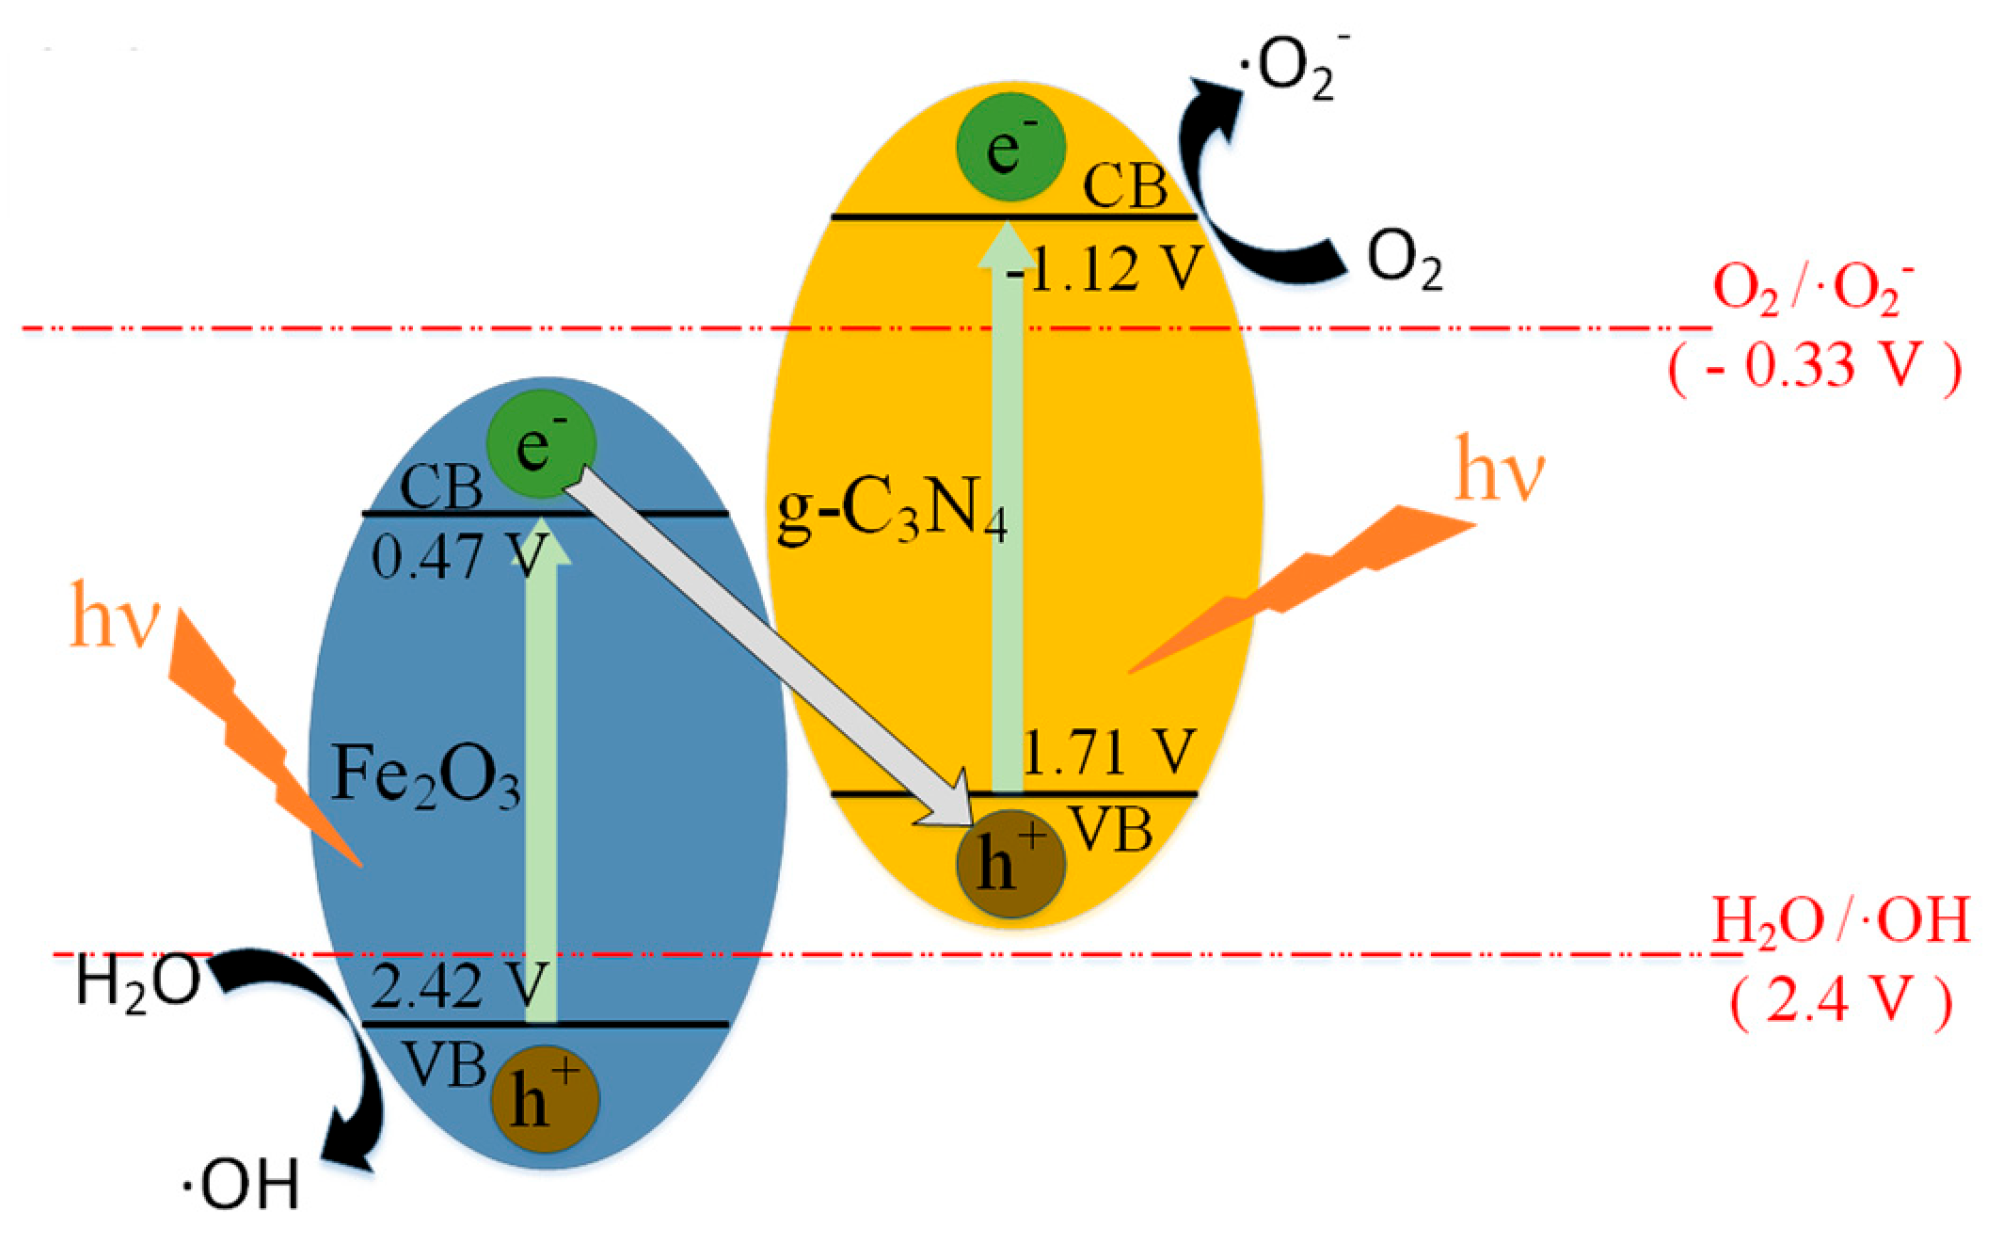
3.3. Photocatalytic Mechanism Analysis

The main reactive groups for the photocatalytic degradation of NOR by FeCN-25wt% were explored by reactive group scavenging experiments. The results are shown in Figure S3. According to Figure 8, the photocatalytic degradation efficiency of the Blank can reach 75.34%. The photocatalytic degradation efficiency of the materials was reduced to 47.29%, 50.23%, 37.31%, and 17.62%, respectively, by adding ethylenediaminetetraacetic acid (EDTA) for h+ capture and removal, AgNO3 for e capture and removal, isopropanol (IPA) for ·OH capture and removal, and benzoquinone (BQ) for ·O2 capture and removal. Therefore, the role of active groups in the photocatalytic degradation process is in the following order: ·O2 > ·OH> h+ > e.
According to Figure S4, the valence band (VB) of g-C3N4 and Fe2O3 are 1.71 eV and 2.42 eV, respectively, which is consistent with reference [24]. Meanwhile, the band gap of g-C3N4 and Fe2O3 are 2.83 eV and 1.95 eV, respectively (Figure 4b). Therefore, the conduction bands (CB) of g-C3N4 and Fe2O3 are −1.12 eV and 0.47 eV, respectively. Based on the above analysis, we hypothesized a possible mechanism for the photocatalytic degradation of NOR by FeCN-25wt% under visible light conditions (Figure 8). Visible light excitation of Fe2O3 and g-C3N4 produces e leaps to form photogenerated e/h+ pairs. When the excitation intensity is greater than the band gap, the e on the VB of Fe2O3 and g-C3N4 jump to the CB. In addition, the CB of Fe2O3 has a higher potential than that of the VB of g-C3N4, and the e of the former tend to move to the latter and complex with the h+, and this process improves the photogenerated carrier transfer between Fe2O3 and g-C3N4. The VB potential of Fe2O3 is more positive than the H2O/OH potential, so h+ on the VB of Fe2O3 can oxidize H2O to ·OH. Similarly, the CB potential of g-C3N4 is more negative than the O2/·O2 potential, so e on the CB of g-C3N4 can reduce O2 to ·O2. ·OH and ·O2− conduct redox reactions with NOR to degrade it into small molecule organic compounds or finally complete the mineralization reaction to produce H2O and CO2. In summary, it is inferred that the heterojunction formed by the Fe2O3/g-C3N4 composite operates according to the Z-type heterojunction mechanism.

4. Conclusions

Compared with the CNM and Fe2O3, the composite FeCN-25wt% effectively reduces the band gap, broadens the response range, and improves the photogenerated e/h+ pair separation efficiency. In addition, FeCN-25wt% displays the optimal photocatalytic degradation of NOR (72.3%) with the largest degradation rate (K = 0.00900 min−1). The main active role in the catalytic degradation process is ·O2, and the Fe2O3/g-C3N4 composite structure is inferred to be a Z-type heterojunction. In conclusion, this paper provides referable ideas for the effective removal of antibiotics from water.

Supplementary Materials

The following supporting information can be downloaded at: https://www.mdpi.com/article/10.3390/pr12081748/s1, Figure S1: (a) Effect of CNU, CND, and CNM on the photocatalytic degradation of NOR; (b) The quasi-first-order kinetic model fits the curve; Figure S2. N2 adsorption-desorption isotherms of CNM, Fe2O3 and FeCN-25wt%; Figure S3. FeCN-25wt% removal of active groups from NOR photocatalytic degradation; Figure S4. The valence band (VB) of g-C3N4 and Fe2O3; Table S1: BET calculation results of surface area, pore diameter and pore volume.

Author Contributions

Conceptualization, Z.L., G.L. and G.G.; methodology, M.L.; software, X.H. and X.W.; investigation, G.G.; resources, G.L.; data curation, Z.L. and M.L.; writing—original draft preparation, Z.L. and G.L.; writing—review and editing, G.G. and W.L.; funding acquisition, Z.L., G.L. and W.L. All authors have read and agreed to the published version of the manuscript.

Funding

This research was supported by Scientific Research Projects of National Natural Science Foundation of China (41701364), Basic Research Program for Higher Education Institutions of Liaoning Provincial Department of Education (LJKMZ20220722, LJKMZ20220716), General Project of Liaoning Provincial Department of Education (LJKZ0379), and Fushun Revitalization Talents Program (FSYC202107006).

Data Availability Statement

Data are contained within the article and Supplementary Materials.

Acknowledgments

All authors thank the editors and reviewers for their comments and suggestions to improve the quality of this paper.

Conflicts of Interest

The authors declare no conflicts of interest. The funders had no role in the design of the study; in the collection, analyses, or interpretation of data; in the writing of the manuscript; or in the decision to publish the results.

References

  1. Zhuang, Y.; Luan, J. Improved photocatalytic property of peony-like InOOH for degrading norfloxacin. Chem. Eng. J. 2020, 382, 122770. [Google Scholar] [CrossRef]
  2. Yin, N.; Chen, H.; Yuan, X.; Zhang, M.; Guo, J.; Zhang, Y.; Qiao, L.; Liu, M.; Song, K. Highly efficient photocatalytic degradation of norfloxacin via Bi2Sn2O7/PDIH Z-scheme heterojunction: Influence and mechanism. J. Hazard. Mater. 2022, 436, 129317. [Google Scholar] [CrossRef]
  3. Wang, G.; Zhao, D.Y.; Kou, F.Y.; Ouyang, Q.; Chen, J.Y.; Fang, Z.Q. Removal of norfloxacin by surface Fenton system (MnFe2O4/H2O2): Kinetics, mechanism and degradation pathway. Chem. Eng. J. 2018, 351, 747–755. [Google Scholar] [CrossRef]
  4. Yu, F.; Li, Y.; Han, S.; Ma, J. Adsorptive removal of antibiotics from aqueous solution using carbon materials. Chemosphere 2016, 153, 365–385. [Google Scholar] [CrossRef]
  5. Prieto, A.; Möder, M.; Rodil, R.; Adrian, L.; Marco-Urrea, E. Degradation of the antibiotics norfloxacin and ciprofloxacin by a white-rot fungus and identification of degradation products. Bioresour. Technol. 2011, 10223, 10987–10995. [Google Scholar] [CrossRef]
  6. Wang, Y.; Shen, C.; Zhang, M.; Zhang, B.T.; Yu, Y.G. The electrochemical degradation of ciprofloxacin using a SnO2-Sb/Ti anode: Influencing factors, reaction pathways and energy demand. Chem. Eng. J. 2016, 296, 79–89. [Google Scholar] [CrossRef]
  7. Zhu, Q.; He, S.; Zhao, X.; Tang, W.; Song, X.; Xue, H.; Yang, L. Photocatalytic degradation of methyl orange by AgCl/ZnO/GO. Res. Environ. Sci. 2020, 33, 969–977. [Google Scholar]
  8. Akhundi, A.; Badiei, A.; Ghodsi, M.Z.; Habibi-Yangjeh, A.; Muñoz-Batista, M.J.; Luque, R. Graphitic carbon nitride-based photocatalysts: Toward efficient organic transformation for value-added chemicals production. Mol. Catal. 2020, 488, 110902. [Google Scholar] [CrossRef]
  9. Shi, H.; Shi, L. Preparation and photocatalytic properties of nanocarbon particles/carbon nitride. J. Liaoning Petrochem. Univ. 2021, 41, 41–45. [Google Scholar]
  10. Yang, W.; Lu, L.; Li, P.; Zhang, J.; Hu, S. Synthesis, modification and application of photocatalytic material graphite phase carbon nitride. J. Petrochem. Univ. 2024, 37, 43–51. [Google Scholar]
  11. Ho-Kimura, S.; Luo, W. Reinforcement of a BiVO4 anode with an Fe2O3 underlayer for photoelectrochemical water splitting. Sustain. Energy Fuels 2021, 5, 3102–3114. [Google Scholar] [CrossRef]
  12. Osterloh, F. Inorganic nanostructures for photoelectrochemical and photocatalytic water splitting. Chem. Soc. Rev. 2013, 42, 2294–2320. [Google Scholar] [CrossRef]
  13. Hussain, A.; Ali, N.; Ali, S.S.; Hou, J.; Aslam, I.; Naeem, H.; Boota, M.; Ul-Hussan, M.; Yin, J.; Wang, X. Diverse morphological study for nonmetal-doped g-C3N4 composites with narrow bandgap for improved photocatalytic activity. Res. Chem. Intermediat. 2022, 48, 2857–2870. [Google Scholar] [CrossRef]
  14. Adrián, G.; Luis, T.; Ramón, M.F.; Francisco, I.; Elena, M.; Pedro, A.; Rita, S.; Benjamin, S. Defective outermost layers of ceria catalysts determined by electrochemical methods as direct responsible for catalytic activity in total oxidation of a representative VOC. Appl. Surf. Sci. 2024, 653, 159354. [Google Scholar]
  15. Yuan, Z.; Zhu, J.; Dong, C.; Wang, L.; Lu, J.; Li, Y.; Ding, J. RSM optimization and kinetics study of α-Fe2O3/g-C3N4@H photocatalyst with S-type heterojunction for esterifying crude castor oil to reduce acidity and synthesize biodiesel. Energy Convers. Manag. 2024, 309, 118449–118465. [Google Scholar] [CrossRef]
  16. Lu, X.; Xu, K.; Chen, P.; Jia, K.; Liu, S.; Wu, C. Facile one step method realizing scalable production of g-C3N4 nanosheets and study of their photocatalytic H2 evolution activity. J. Mater. Chem. A 2014, 2, 18924–18928. [Google Scholar] [CrossRef]
  17. Ye, S.; Qiu, L.G.; Yuan, Y.P.; Zhu, Y.J.; Xia, J.; Zhu, J.F. Facile fabrication of magnetically separable graphitic carbon nitride photocatalysts with enhanced photocatalytic activity under visible light. J. Mater. Chem. A 2013, 1, 3008–3016. [Google Scholar] [CrossRef]
  18. Zhao, Z.; Dai, H.; Deng, J.; Liu, Y.; Wang, Y.; Li, X.; Bai, G.; Gao, B.; Au, C.T. Porous FeOx/BiVO4–δS0.08: Highly efficient photocatalysts for the degradation of Methylene Blue under visible-light illumination. J. Environ. Sci.-China 2013, 25, 2138–2149. [Google Scholar] [CrossRef]
  19. Zhang, R.; Dai, H.; Du, Y.; Zhang, L.; Deng, J.; Xia, Y.; Zhao, Z.; Meng, X.; Liu, Y. P123-PMMA dual-templating generation and unique physicochemical properties of three-dimensionally ordered macroporous iron oxides with nanovoids in the crystalline walls. Inorg. Chem. 2011, 50, 2534–2544. [Google Scholar] [CrossRef]
  20. Fang, S.; Yang, X.; Kangle, L.; Li, Q.; Sun, J.; Li, M. Effect of carbon-dots modification on the structure and photocatalytic activity of g-C3N4. Appl. Catal. B Environ. 2016, 185, 225–232. [Google Scholar] [CrossRef]
  21. Cui, Y.; Briscoe, J.; Wang, Y.; Tarakina, N.V.; Dunn, S. Enhanced photocatalytic activity of heterostructured ferroelectric BaTiO3/α-Fe2O3 and the significance of interface morphology control. ACS Appl. Mater. Interfaces 2017, 9, 24518–24526. [Google Scholar] [CrossRef]
  22. Kumaravel, S.; Avula, B.; Chandrasatheesh, C.; Niyitanga, T.; Saranya, R.; Hasan, I.; Abisheik, T.; Rai, R.S.; Pandiyan, V.; Balu, K. Rational construction of MOF derived α-Fe2O3/g-C3N4 composite for effective photocatalytic degradation of organic pollutants and electrocatalytic oxygen evolution reaction. Spectrochim. Acta Part A Mol. Biomol. Spectrosc. 2024, 310, 123972–123986. [Google Scholar] [CrossRef] [PubMed]
  23. Xiao, H.M.; Zhang, W.D.; Wan, M.X.; Fu, S.Y. Novel electromagnetic functionalized γ-Fe2O3/polypyrrole composite nanostructures with high conductivity. J. Polym. Sci. Part A Pol. Chem. 2009, 47, 4446–4453. [Google Scholar] [CrossRef]
  24. Babar, S.; Gavade, N.; Shinde, H.; Mahajan, P.; Lee, K.H.; Mane, N.; Deshmukh, A.; Garadkar, K.; Bhuse, V. Evolution of waste iron rust into magnetically separable g-C3N4-Fe2O3 photocatalyst: An efficient and economical waste management approach. ACS Appl. Nano Mater. 2018, 1, 4682–4694. [Google Scholar] [CrossRef]
Figure 1. XRD patterns of (a) CNM, CND, CNU and (b) CNM, Fe2O3, FeCNs.
Processes 12 01748 g001
Figure 2. SEM images of (a,b) CNM, (c,d) Fe2O3, and (e,f) FeCN-25wt%.
Processes 12 01748 g002
Figure 3. HRXPS spectra of CNM, Fe2O3, and FeCN-25wt%.
Processes 12 01748 g003
Figure 4. (a) UV-vis DRS spectra and (b) energy band gap of CNM, Fe2O3, FeCN-25 wt%.
Processes 12 01748 g004
Figure 5. PL spectra of CNM and FeCN-25wt%.
Processes 12 01748 g005
Figure 6. (a) Transient photocurrent response spectra and (b) EIS spectra of CNM, Fe2O3, and FeCN-25wt%.
Processes 12 01748 g006
Figure 7. (a) Effect of CNM, Fe2O3, and FeCNs on the photocatalytic degradation of NOR. (b) The quasi-first-order kinetic model fits the curve.
Processes 12 01748 g007
Figure 8. Possible mechanism of photocatalytic degradation of NOR by FeCN-25wt% under visible light.
Processes 12 01748 g008
Disclaimer/Publisher’s Note: The statements, opinions and data contained in all publications are solely those of the individual author(s) and contributor(s) and not of MDPI and/or the editor(s). MDPI and/or the editor(s) disclaim responsibility for any injury to people or property resulting from any ideas, methods, instructions or products referred to in the content.

