Article

Optimal Operation Strategy for Wind–Photovoltaic Power-Based Hydrogen Production Systems Considering Electrolyzer Start-Up Characteristics

1
School of Electrical and Automation, Wuhan University, Wuhan 430072, China
2
Foshan Power Supply Bureau of Guangdong Power Grid Co., Ltd., China Southern Power Grid, Foshan 528000, China
*
Author to whom correspondence should be addressed.
Processes 2024, 12(8), 1756; https://doi.org/10.3390/pr12081756
Submission received: 25 July 2024 / Revised: 12 August 2024 / Accepted: 15 August 2024 / Published: 20 August 2024

Abstract

:
Combining electrolytic hydrogen production with wind–photovoltaic power can effectively smooth the fluctuation of power and enhance the schedulable wind–photovoltaic power, which provides an effective solution to solve the problem of wind–photovoltaic power accommodation. In this paper, the optimization operation strategy is studied for the wind–photovoltaic power-based hydrogen production system. Firstly, to make up for the deficiency of the existing research on the multi-state and nonlinear characteristics of electrolyzers, the three-state and power-current nonlinear characteristics of the electrolyzer cell are modeled. The model reflects the difference between the cold and hot starting time of the electrolyzer, and the linear decoupling model is easy to apply in the optimization model. On this basis, considering the operation constraints of the electrolyzer, hydrogen storage tank, battery, and other equipment, the optimization operation model of the wind–photovoltaic power-based hydrogen production system is developed based on the typical scenario approach. It also considers the cold and hot starting time of the electrolyzer with the daily operation cost as the goal. The results show that the operational benefits of the system can be improved through the proposed strategy. The hydrogen storage tank capacity will have an impact on the operation income of the wind–solar hydrogen coupling system, and the daily operation income will increase by 0.32% for every 10% (300 kg) increase in the hydrogen storage tank capacity.

1. Introduction

In recent years, to effectively address the issues of global environmental pollution and the energy crisis, wind and solar energy generation systems have gradually been increasingly valued and integrated into the power systems due to their low-carbon and environmentally friendly characteristics, greatly promoting the sustainable development of the energy structure of the power system [1]. As of April 2023, China has installed 380 million kilowatts of wind power and 440 million kilowatts of photovoltaic power, totaling 820 million kilowatts of combined wind and solar power capacity. This accounts for 30.9% of the country’s total installed power generation capacity [2].
However, the variable nature of wind and photovoltaic power generation significantly impacts the stability of power grid operations. One way to address this issue is by integrating energy storage systems [3]. Hydrogen energy is a clean and abundant energy source, especially its high energy density and ease of storage and transportation, which has attracted much attention. Using electrolysis to produce hydrogen can help mitigate the fluctuations in wind and photovoltaic power generation, ensuring grid stability and enhancing the quality of wind and solar energy integration. Furthermore, numerous studies from various countries and regions have confirmed the technical and economic feasibility of large-scale hydrogen production from wind and solar power [4,5,6,7,8].
Many studies have been conducted on the operational issues of wind and solar hydrogen production. Reference [9] analyzed the power supply mode of the wind hydrogen energy system, and the analysis results showed that the multi energy supply mode of electricity hydrogen is economically feasible. References [10,11] introduced an optimization model for a comprehensive energy system that includes units for hydrogen production from wind power. By mutual conversion of multiple energy sources, it can simultaneously meet the demand for electricity and hydrogen loads. In reference [12], the goal is to maximize the system revenue of wind hydrogen-coupled power generation while considering the following characteristics of system output to construct an optimized operation model. Reference [13] establishes an optimization model with the goal of minimizing operating costs to ensure system economy and output power stability. The above studies are all aimed at systems containing only wind power, while coupled systems with photovoltaic integration have greater differences in output between day and night. There is currently no literature on the optimization operation of such systems.
In the optimization operation and analysis research of existing wind power hydrogen energy coupling systems, modeling the operating characteristics of electrolytic cells is a key issue. References [13,14] treat the electrolytic cell as a linear electro-hydrogen conversion device and introduce a constant to describe its operating characteristics. References [11,12,13,14,15] treat the working electrolytic cell as a voltage-sensitive nonlinear DC load, establish a nonlinear relationship between the output voltage and current of the electrolytic cell, and analyze the impact of the working performance of the hydrogen production module and the power generation module on the performance of the wind hydrogen-coupled power generation system. In the above literature, only the normal operating state of the electrolytic cell is usually considered, ignoring the operating characteristics of the closed and standby states. The normal operation of an electrolytic cell requires certain temperature support [15]; therefore, transitioning from a closed state to a normal operating state requires a slow heating process. Neglecting the time of this process in the study of wind hydrogen coupling system optimization operation can easily lead to the loss of economic optimality and even infeasibility of optimization strategies in practice, making it difficult to support the optimization operation and rapid development of the coupling system. References [16,17] considered the constraints of electrolytic cell operation in the optimization problem of wind–solar hydrogen production, but in order to finely divide it into states.
Drawing on the aforementioned analysis, this article conducts research on optimized operation strategies for wind–solar hydrogen production. Develop an optimized operational model for wind–solar hydrogen production, taking into account the startup characteristics of the electrolytic cells, aiming to minimize the daily operational costs of hydrogen production from wind and solar sources. Among them, in response to the insufficient theoretical research on the multi-state and nonlinear characteristics of existing electrolytic hydrogen production, a nonlinear operating model of the three state and power current of the electrolytic cell is constructed. This model reflects the difference in cold and hot start-up time of the electrolytic cell, and the model after linear decoupling is easy to apply in the optimization model.

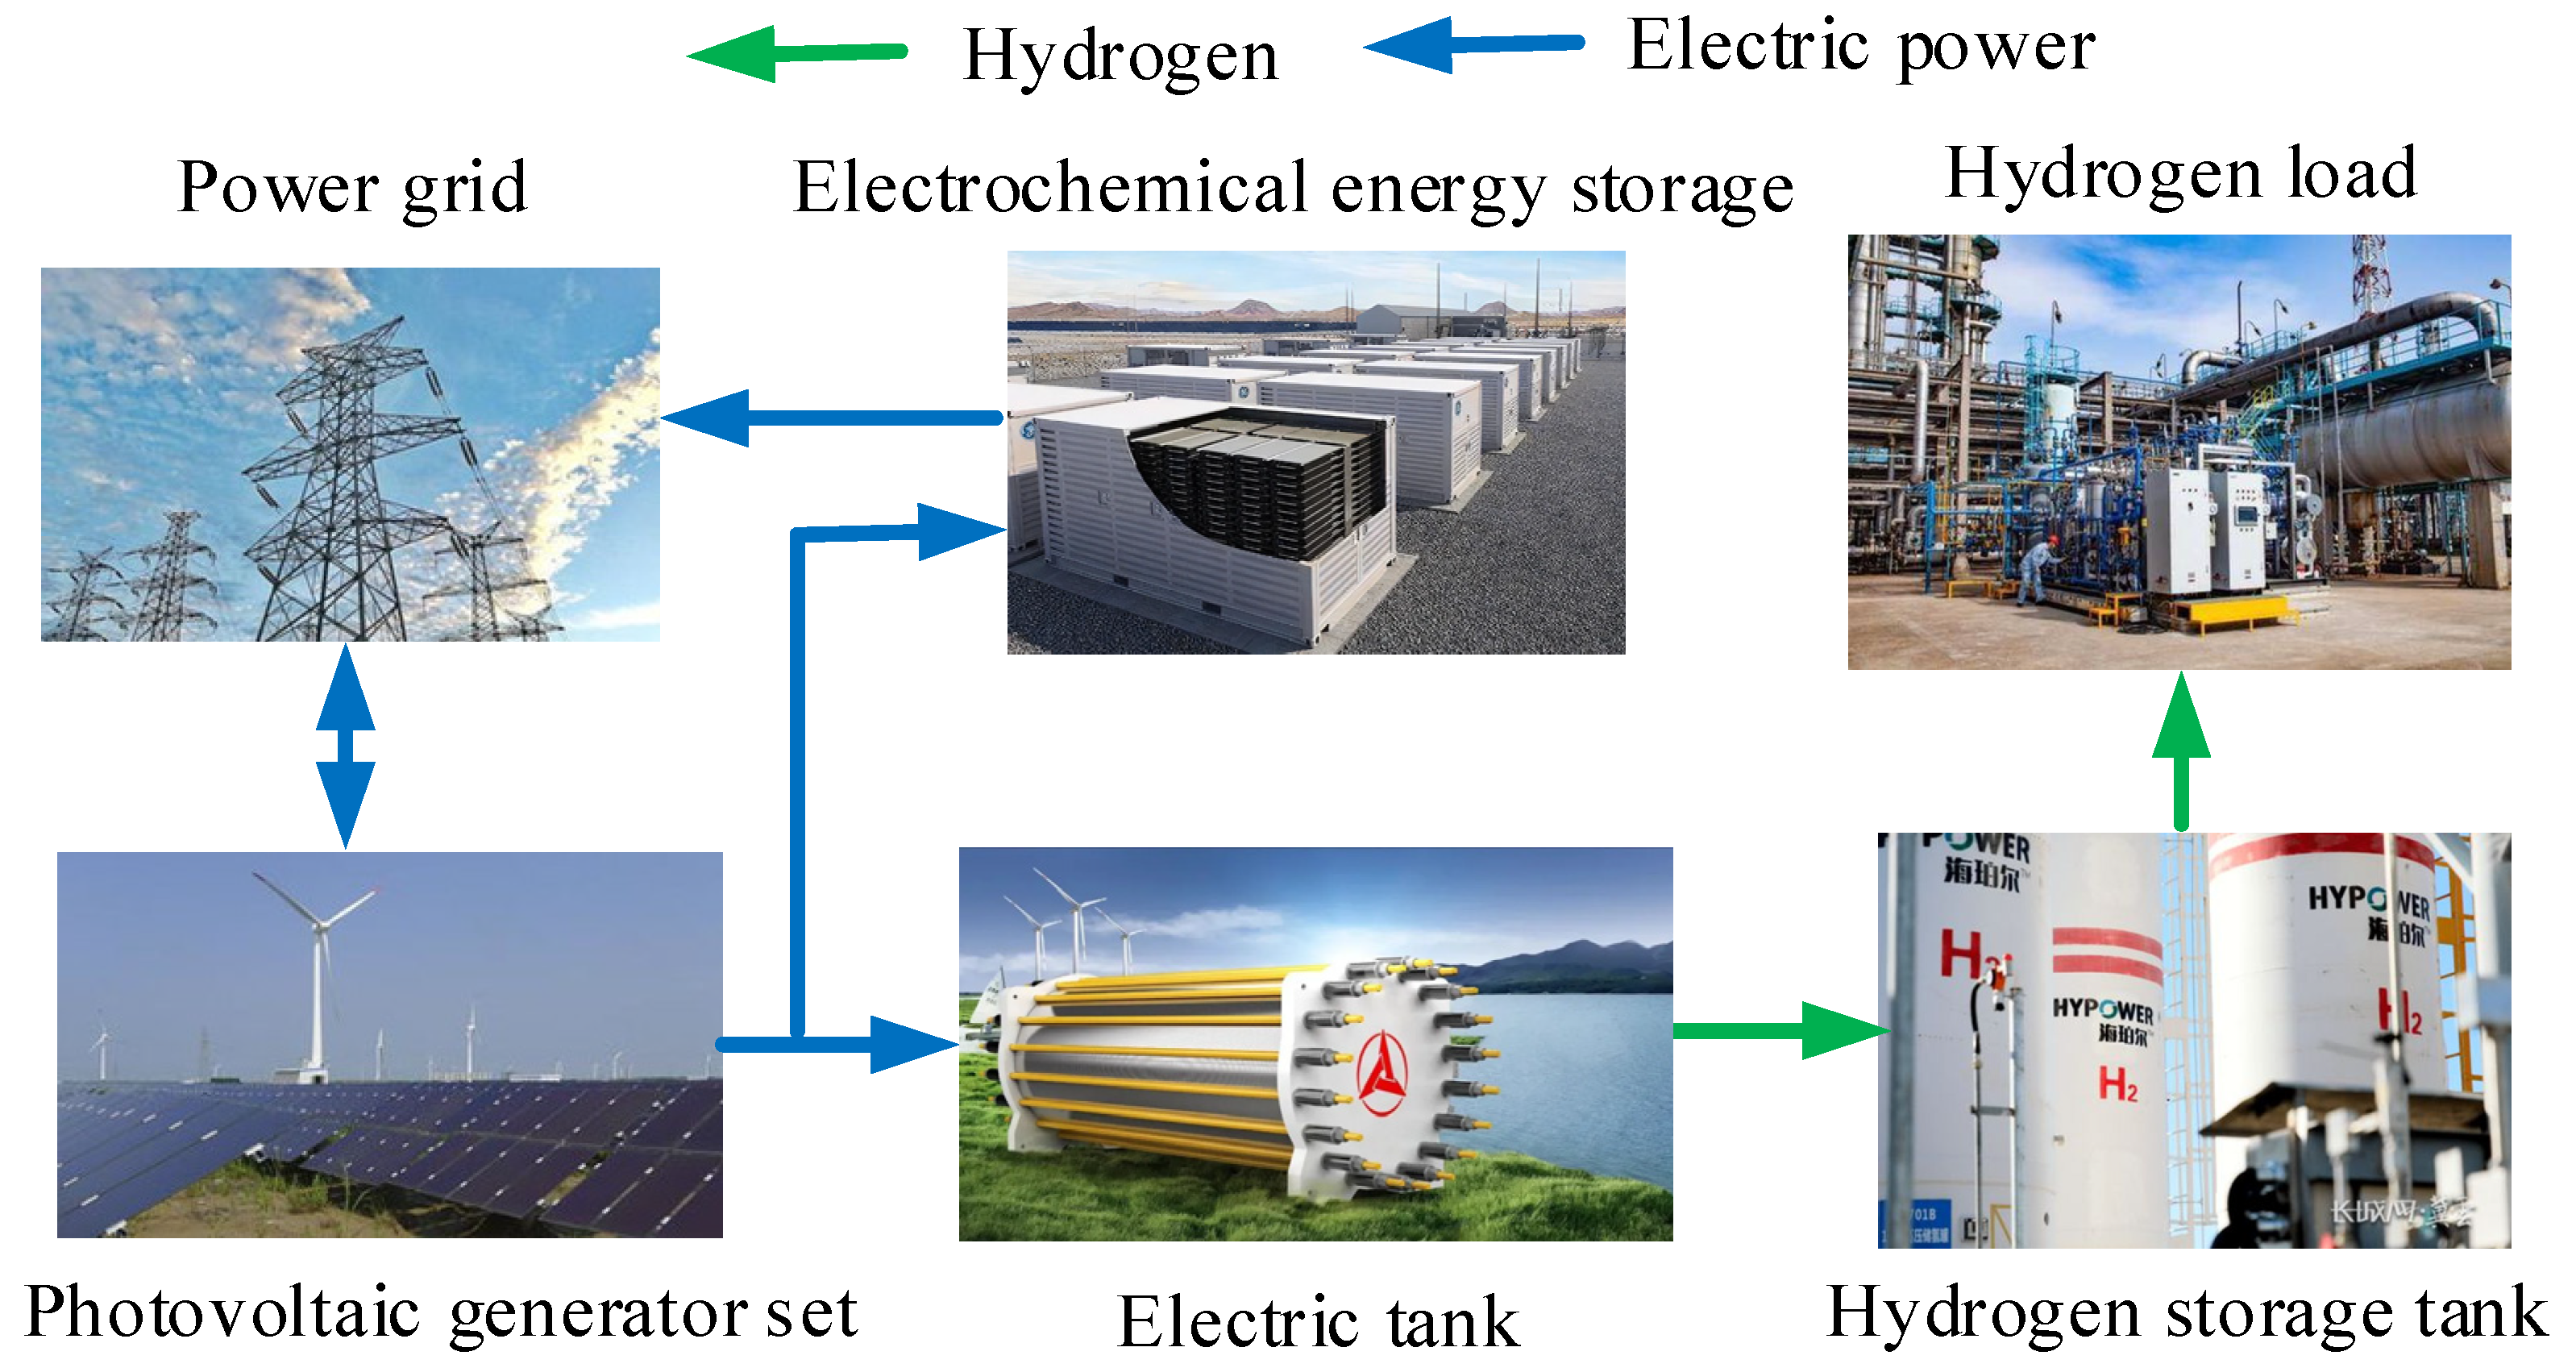
2. Structure of Wind–Solar Hydrogen Production System

This section examines the overall structural composition of wind–solar hydrogen production based on the energy flow relationships within the system. As depicted in Figure 1, the wind–solar hydrogen production system comprises primarily wind and solar power generation units, hydrogen production systems, and electrochemical energy storage. The hydrogen production energy storage system consists of an electrolytic cell and a hydrogen storage tank. The blue arrow direction in the figure represents the flow direction of electrical energy in wind–solar hydrogen production, while the green arrow direction represents the flow direction of hydrogen energy in the system. Among them, the wind and solar power generation unit has completed the work of converting wind and solar resources into electricity, the electrolysis tank consumes electricity for hydrogen production, converts electricity into hydrogen energy, and the hydrogen storage tank stores hydrogen.

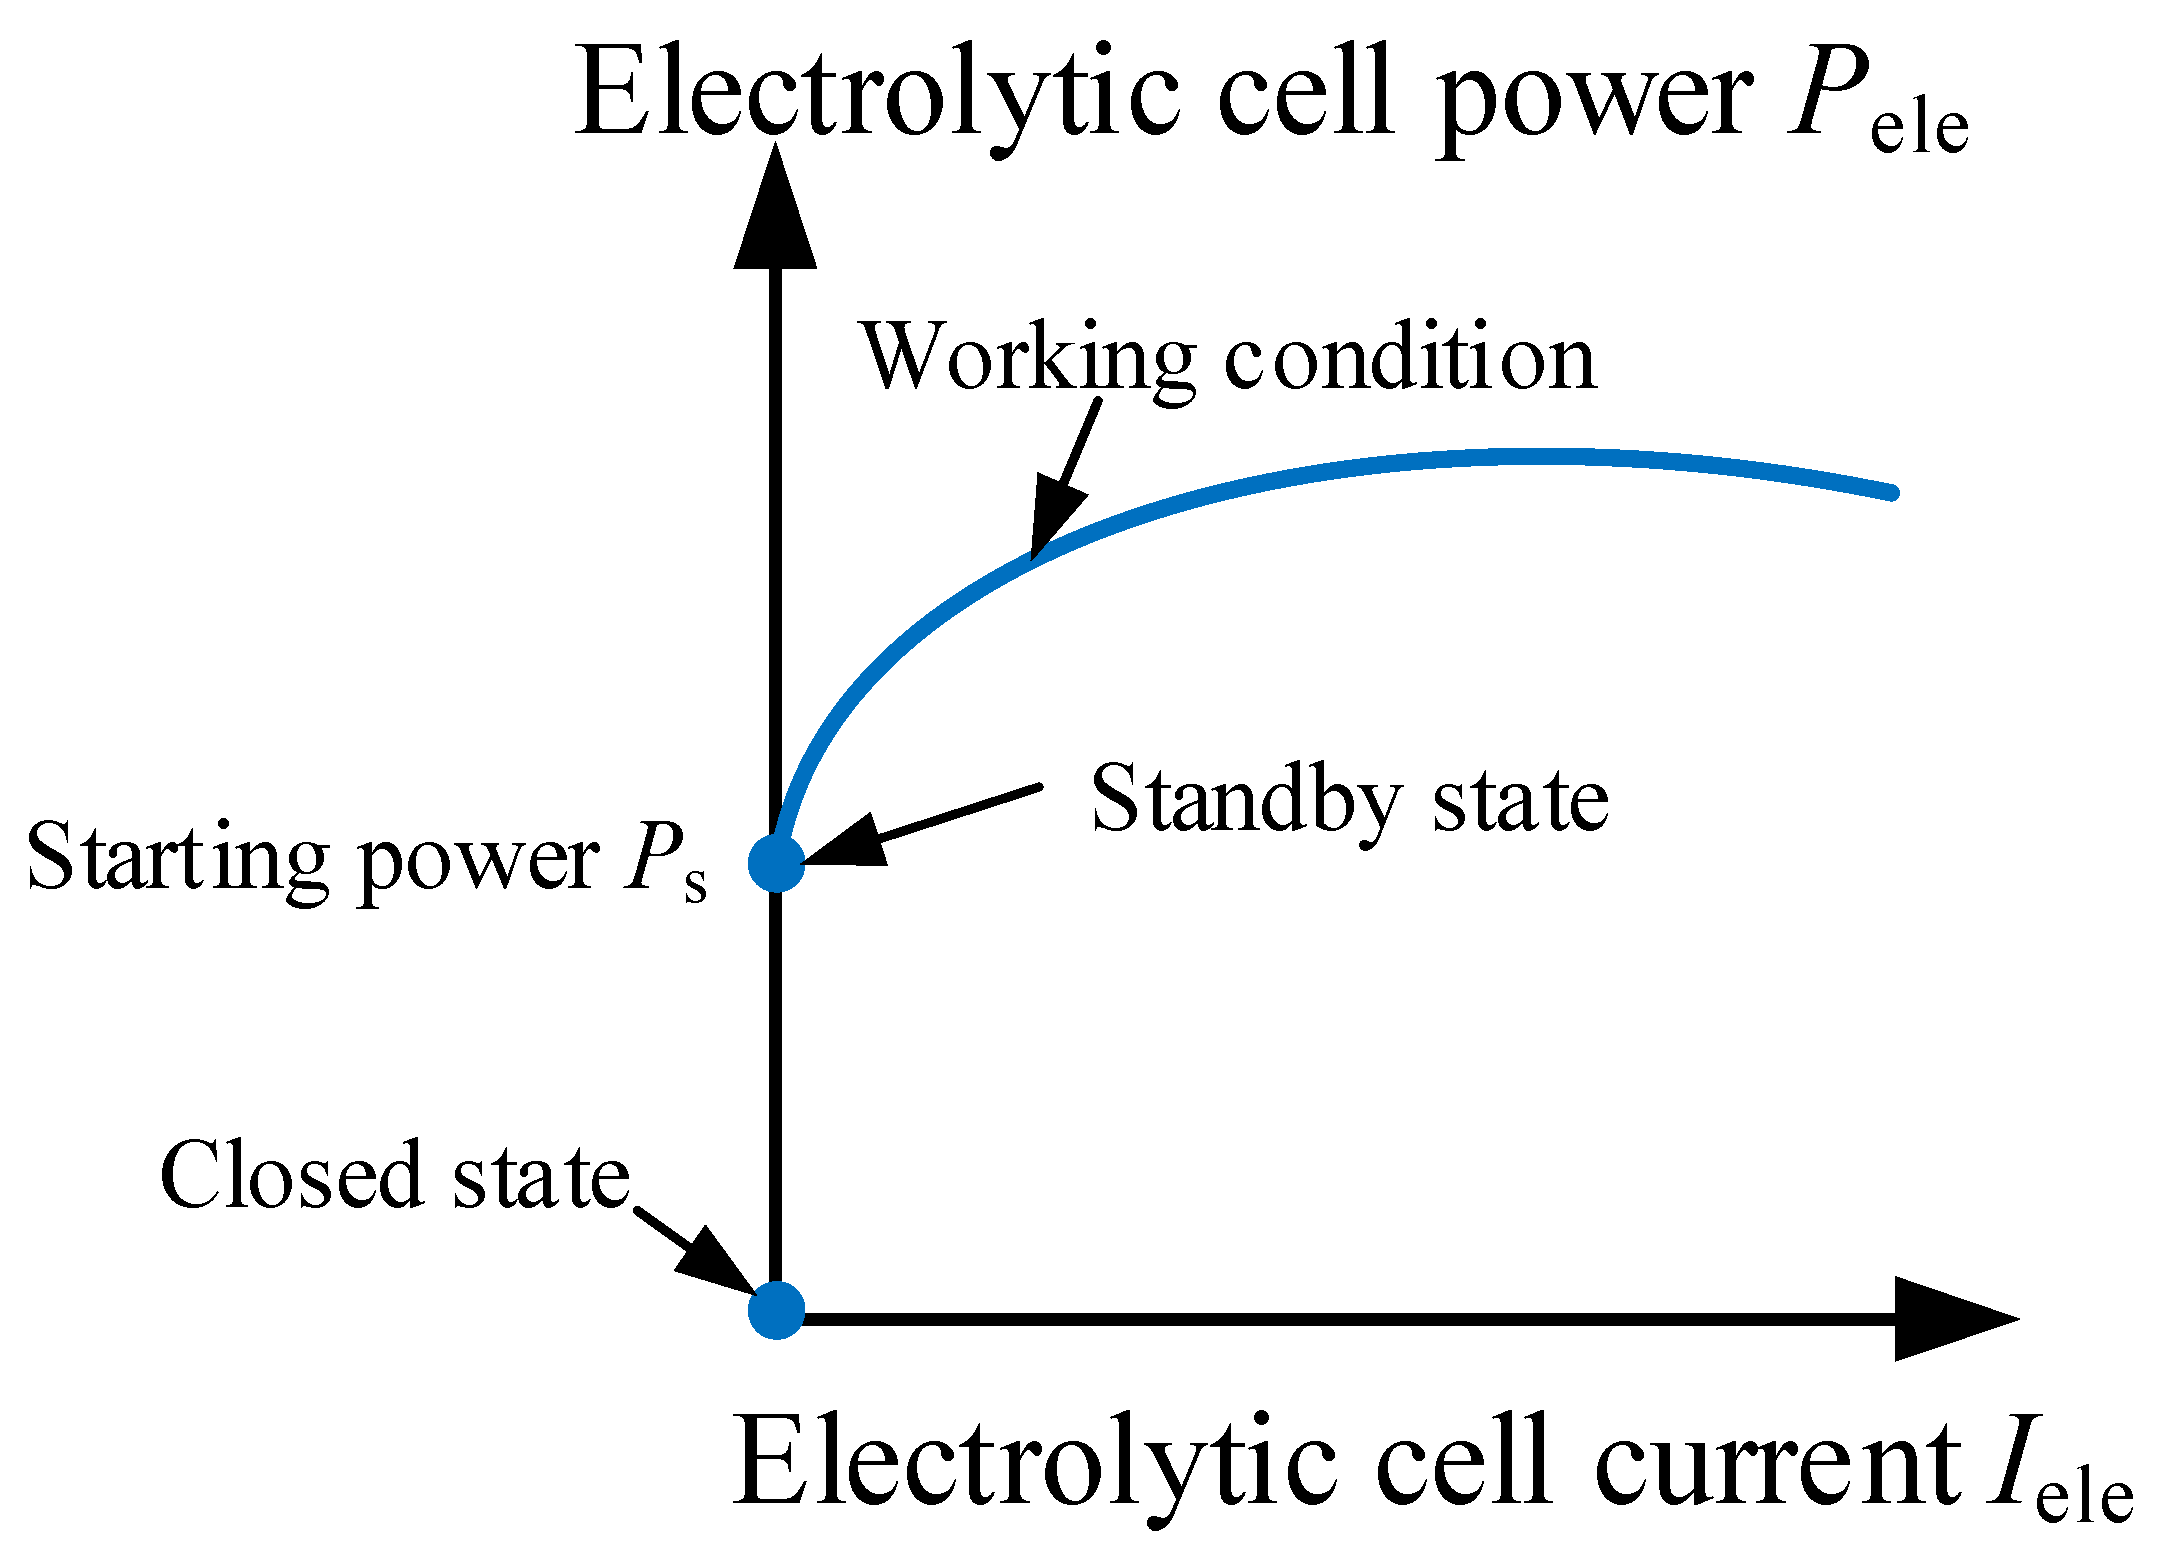
3. A Multi-State Operation Model for Electrolytic Cells Considering Cold and Hot Start Times

Within the system of wind–solar hydrogen production, the electrolytic cell is the primary component for electrical-to-hydrogen energy conversion, and its operating characteristics modeling is crucial for the optimized operation of the wind–solar hydrogen production system. In response to the problem that existing research has overlooked the difference in cold and hot start-up time of electrolytic cells, this paper constructs a multi-state operation model of electrolytic cells considering cold and hot start-up time based on the temperature operating conditions of the electrolytic cells, providing model support for the optimized operation of systems for wind–solar hydrogen production.
Alkaline electrolysis cells are widely used, technologically mature, and easy to maintain. The hydrogen produced is of high purity and relatively low investment cost [18]. Therefore, this article focuses on the study of alkaline electrolysis tanks (hereinafter referred to as electrolysis tanks). The electrolytic cell has certain requirements for operating temperature. To start the electrolytic cell from a closed state, the temperature control part needs to be operated first to raise the temperature of the electrolytic cell to a temperature that can be started before it can enter a normal operating state. Therefore, based on the temperature operating conditions of the electrolytic cell, this section first divides the operation of the electrolytic cell into three states: working, standby, and closed, and constructs a multi-state transition model for the electrolytic cell. In addition, considering the nonlinear relationship between the power and current of the electrolytic cell, a linearized multi-state input–output model, a working range model, and an electric hydrogen energy conversion model are proposed.
(1)
Multi-state transition model for electrolytic cells
The electrolytic cell has three working states: working, standby, and off, represented by 0–1 variables pt, st, and it, respectively. When pt, st, it = 1, it indicates that it is in working, standby, or off state at time t; on the contrary, it is not in this state. Therefore, there is a three-state uniqueness constraint for the electrolytic cell, as shown below:
p t + s t + i t = 1
The hot start of an electrolytic cell refers to the process of equipment transitioning from standby to normal operation, which only takes a few minutes. The cold start of an electrolytic cell refers to the process of the equipment from a closed state to a normal operating state, which usually takes more than 1 h [9]. Characterize the above two start-up states with a time accuracy of 1 h, and use the following formula to indicate that the electrolytic cell can only enter the working state when and only when a standby state occurs. The state diagram of electrolyzers is shown in Figure 2.
p t p t 1 s t 1
Due to the waste of resources caused by the direct transition of the electrolytic cell from standby state to closed state, Equation (3) is defined to limit this situation:
s t + i t + 1 1 , t 2
(2)
A current power linearization model for electrolytic cells in multiple states
According to reference [10], the voltage and power of the electrolytic cell can be represented as:
V t ele   = U ref + r 1 A I t ele   + r 2 ( log ( r 3 A I t ele   + 1 ) )
P t ele   = N el V t ele   I t ele  
In the formula, nf is the Faraday efficiency; F is the Faraday constant; F = 96,487 C/mol. mH2 is the molar mass of hydrogen gas, and n is the number of electrolytic reactors. mele,t is the mass of hydrogen gas prepared at t hours.
By substituting Equation (4) into Equation (5), the nonlinear relationship between electrolytic cell power and current can be obtained:
P t ele = α 1 I t ele   + α 2 ( I t ele ) 2 + α 3 I t ele   lg ( α 4 I t ele + 1 )
{ α 1 = N el U ref α 2 = N el ( r 11 + r 12 T m ) / A α 3 = N el ( r 21 + r 22 T m + r 23 T m 2 ) α 4 = ( r 31 + r 32 T m + r 33 T m 2 + r 34 T m 3 ) / A
The electrolytic cell current I t ele and input power P t ele shown in Equation (5) exhibit a nonlinear relationship. For the convenience of solving, the following uses a piecewise linearization method to decouple the relationship between the SOS-2 ordered set and continuous relaxation variables s t p , ele   and s t I , ele   .
P t ele   = b = 1 N b w b , t p b ele   + s t p , ele  
I t ele   = b = 1 N b w b , t I b ele   + s t I , ele  
M ( 1 p t ) s t p , ele   M ( 1 p t )
M ( 1 p t ) s t I ,   ele   M ( 1 p t )
b = 1 N b w b , t = 1
{ w b , t z b 1 , t + z b , t b = 2 , 3 , N b 1 w 1 , t z 1 , t w N b , t z N b 1 , t
b = 1 N b z b , t = 1
0 w b , t 1
In the formula, s t p , ele   , s t I , ele   = 1 indicates that the electrolytic cell is in a non-working state (i.e., standby or off state), and vice versa, it is not in standby or off state. Nb is the number of segments. Equations (10) and (11) represent the coupling relationship between the relaxation variables s t p , ele   , s t I , ele   and the standby and shutdown working states. wb,t is a type 2 special SOS-2 ordered set; only two adjacent elements in the ordered set are positive, which helps the solver solve the nonlinear problem. The 0–1 variable zb,t can be introduced to establish the SOS-2 ordered set, as shown in (12)~(14).
(3)
Model of working range of electrolytic cell
Constraints on upper and lower limits of electrolytic cell current:
s t P s P t ele   p t M + s t P s
p t I min b I t ele   p t I max b
In the formula, Equation (16) represents that the power of the electrolytic cell is zero in both standby and off states, M is a sufficiently large number, and Ps is the start-up power of the electrolytic cell. I max b and I min b are the upper and lower limits of the working current of the electrolytic cell, respectively.
(4)
Energy Conversion Model for Electrolytic Cell Electricity Hydrogen
m ele , t = 3600 η f m H 2 n I t ele   2 F
In the formula, nf is the Faraday efficiency; F is the Faraday constant; mH2 is the molar mass of hydrogen gas, and n is the number of electrolytic reactors. mele,t is the mass of hydrogen gas prepared at time t [15].

4. Optimization Operation Model of 3 Wind–Solar Hydrogen Production Systems

Drawing on the multi-state operation model of the electrolytic cell discussed earlier, this section aims to minimize the daily operating cost of wind–solar hydrogen production. It constructs an optimized operational model considering the startup characteristics of the electrolytic cell using the typical scenario approach.

4.1. Objective Function

The optimization objective of the wind–solar hydrogen production optimization operation model is to minimize the daily operating cost of the system, as shown below:
min 1 N s t = 1 T s = 1 S Δ t ( C s , t m C s , t u )
C s , t m = u E ( P grid , s , t + P dis , s , t ) + u H m H , s , t
C s , t u = u G Δ t P cur , s , t
Among them, C s , t m and C s , t u respectively, represent the revenue and operating costs of a typical day s at time t. Among them, C s , t m includes the electricity sales revenue to the superior power grid and the hydrogen sales revenue to the hydrogen load; uE and uH are the electricity sales price and hydrogen sales price, respectively. Pgrid,s,t are the transmission power of the wind and solar power unit to the superior power grid; Pdis,s,t are the discharge power of electrochemical energy storage, and mH,s,t are the hydrogen sales volume. The operating cost C s , t u is the penalty cost for wind and solar power units; uG is the penalty cost for power curtailment per unit of electricity; Pcur,s,t is the power curtailment, and Δt is the unit time interval. Ns is the typical daily quantity.

4.2. Constraints

In the optimization operation model for wind–solar hydrogen production, it is essential to account for power balance constraints and equipment operation constraints. The operation constraints of the electrolytic cell have been introduced in Section 3, and the following will introduce power balance constraints, grid-connected operation constraints, hydrogen storage tanks, and electrochemical energy storage operation constraints.
(1)
Power balance constraints of wind–solar hydrogen production system
P wd , s , t + P pv , s , t = P cur , s , t + P s , t ele   + P grid , s , t + P ch , s , t
P cur , s , t 0
In the formula, Pwd,s,t, Ppv,s,t, and P s , t ele   are the power of wind power, photovoltaic units, and electrolytic cells at time t for a typical day s; Pch,s,t are the charging and discharging power of electrochemical energy storage.
(2)
Grid connected operation constraints
P grid , max P grid , s , t P grid , max
Δ P grid , max P grid , s , t + 1 P grid , s , t Δ P grid , max
In the formula, Pgrid,min and Pgrid,max are the upper and lower limits of grid connected power for wind–solar hydrogen production. ΔPgrid,min and ΔPgrid,max are the upper and lower limits of the fluctuation of grid connected power for wind–solar hydrogen production.
(3)
Operational constraints of hydrogen storage tanks
H S s , t + 1 = H S s , t + m ele , s , t m fc , s , t m load , s , t
H S min H S s , t H S max
H S s , t = 1 = α H S max
Δ H S max H S s , t H S s 1 , t Δ H S max
In the formula, HSs,t is the mass of hydrogen stored in the hydrogen storage tank at time t in scenario s; HSmin and HSmax are the upper and lower limits of hydrogen storage capacity. mfc,s,t represent the mass of hydrogen consumed by the hydrogen fuel cell; γhp represents the linear conversion coefficient of the hydrogen fuel cell. mload,s,t are the magnitude of hydrogen load. α is the initial state coefficient of the hydrogen storage tank.
(4)
Constraints related to the operation of electrochemical energy storage
S O C s , t + 1 = S O C s , t + Δ t ( P ch , s , t P dis , s , t )
S O C min S O C s , t S O C max
S O C s , t = 1 = β S O C max
P bat , min P ch , s , t Z bat P bat , max
P bat , min P dis , s , t ( 1 Z bat ) P bat , max
In the formula, SOCs,t is the electrical energy stored by electrochemical energy storage at time t in scenario s; SOCmin and SOCmax are the upper and lower limits of hydrogen storage capacity; Pbat,min and Pbat,max are the upper and lower limits of the electrochemical energy storage charge and discharge power. α is the initial state coefficient of electrochemical energy storage.

5. Case Study

5.1. Parameter Settings

This article emphasizes wind–solar hydrogen production in Table 1 and devises three optimization strategies to validate the effectiveness of the proposed approach, taking into account the standby state of the electrolytic cell. Table 2 presents the operational parameters of the electrolytic cell. Optimization cycle T = 24 h; the time interval is 1 h. The optimized operation model for wind–solar hydrogen production established in this article is a linear mixed integer programming model, which is solved by calling Cplex 12.4 software on the MATLAB 2018a platform. According to Schemes 1–3, the operational strategies for wind–solar hydrogen production were optimized, and Table 3 compares the revenue results of the schemes. Figure 3, Figure 4 and Figure 5, respectively, compare the device operation status of different schemes in four scenarios. Figure 6, Figure 7 and Figure 8 conducts sensitivity analysis on the impact of hydrogen storage tanks on the operational benefits of the system.
Option 1: Based on the two-state (closed and running) operation model of the electrolytic cell, optimize the operational strategy for wind–solar hydrogen production. The specific model can be found in reference [9] and Appendix A.
Option 2: Under the optimal operating strategy obtained in Option 2, the cold start process needs to first go from the closed state to the standby state and then to the operating state in order to obtain the actual operating curve of the electrolytic cell. Taking the actual operating status of the electrolytic cell as a known quantity, combined with the optimization objectives and equipment operation constraints proposed in this article, optimize the operating status of other equipment. Incorporating state change constraints into the optimization process, but not into the optimization solution process, may result in neglecting the impact of some state changes on the benefit results.
Option 3: The approach presented in this article aims to optimize the operational strategy of wind–solar hydrogen production using a multi-state model of an electrolytic cell that considers cold and hot start times. Integrating state change constraints into the optimization process will result in more realistic and cost-effective outcomes.

5.2. Comparative Analysis of Plans

(1)
Economic analysis
Table 3 shows the operating profit results of Schemes 1 and 2. From the table, it can be seen that the various benefits and costs of Scheme 1 and Scheme 3 are completely consistent, while the benefits of Scheme 2 are 77.28% lower than the other schemes. This is because Scheme 3 has optimized the standby state of the electrolytic cell reasonably, so that the operation of wind–solar hydrogen production can accurately approach the ideal operating state of the electrolytic cell. However, Plan 2 did not consider standby status, resulting in a longer start-up process for the electrolytic cell, which increased the cost of electricity abandonment by 120.10% and reduced hydrogen and electricity sales revenue by 78.44% and 330.32%, respectively. From this, it can be seen that by considering the standby state of the electrolytic cell, the operational efficiency of wind–solar hydrogen production can be improved. In actual production, China has regulations on the utilization rate of new energy for energy systems containing wind and solar power units, and a low utilization rate of new energy is unacceptable. The specific reasons will be analyzed in the next section.
(2)
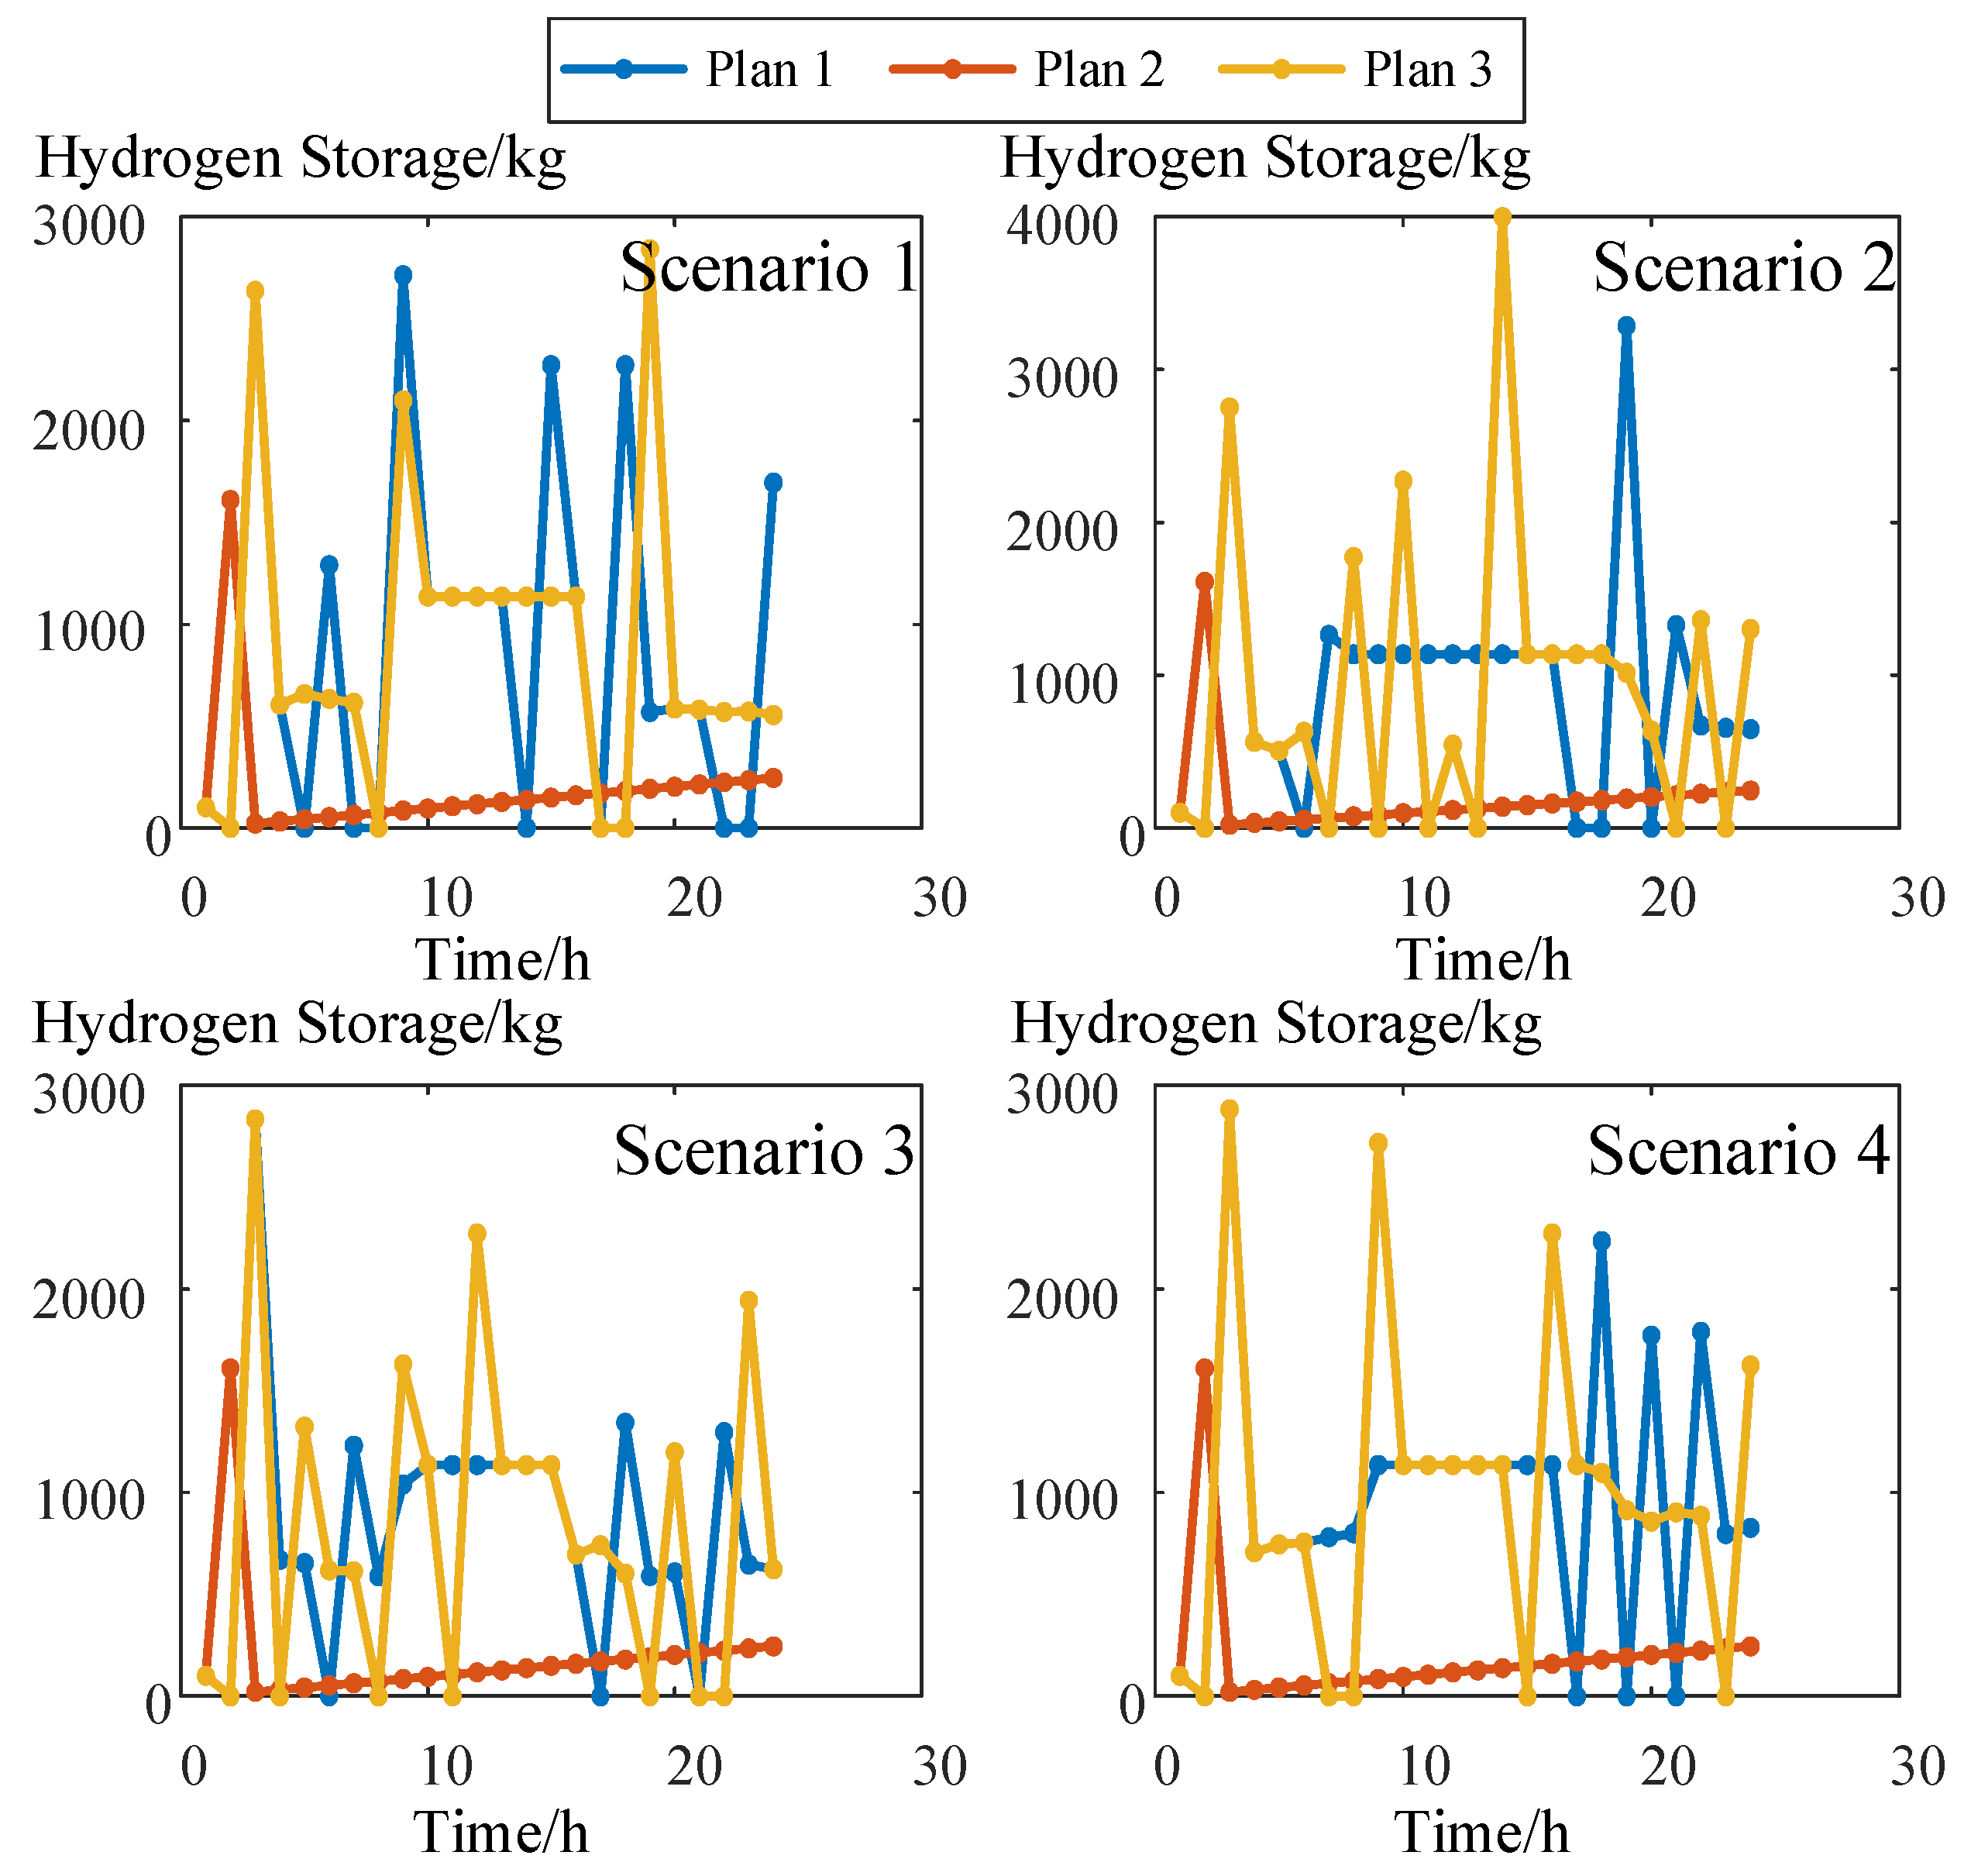
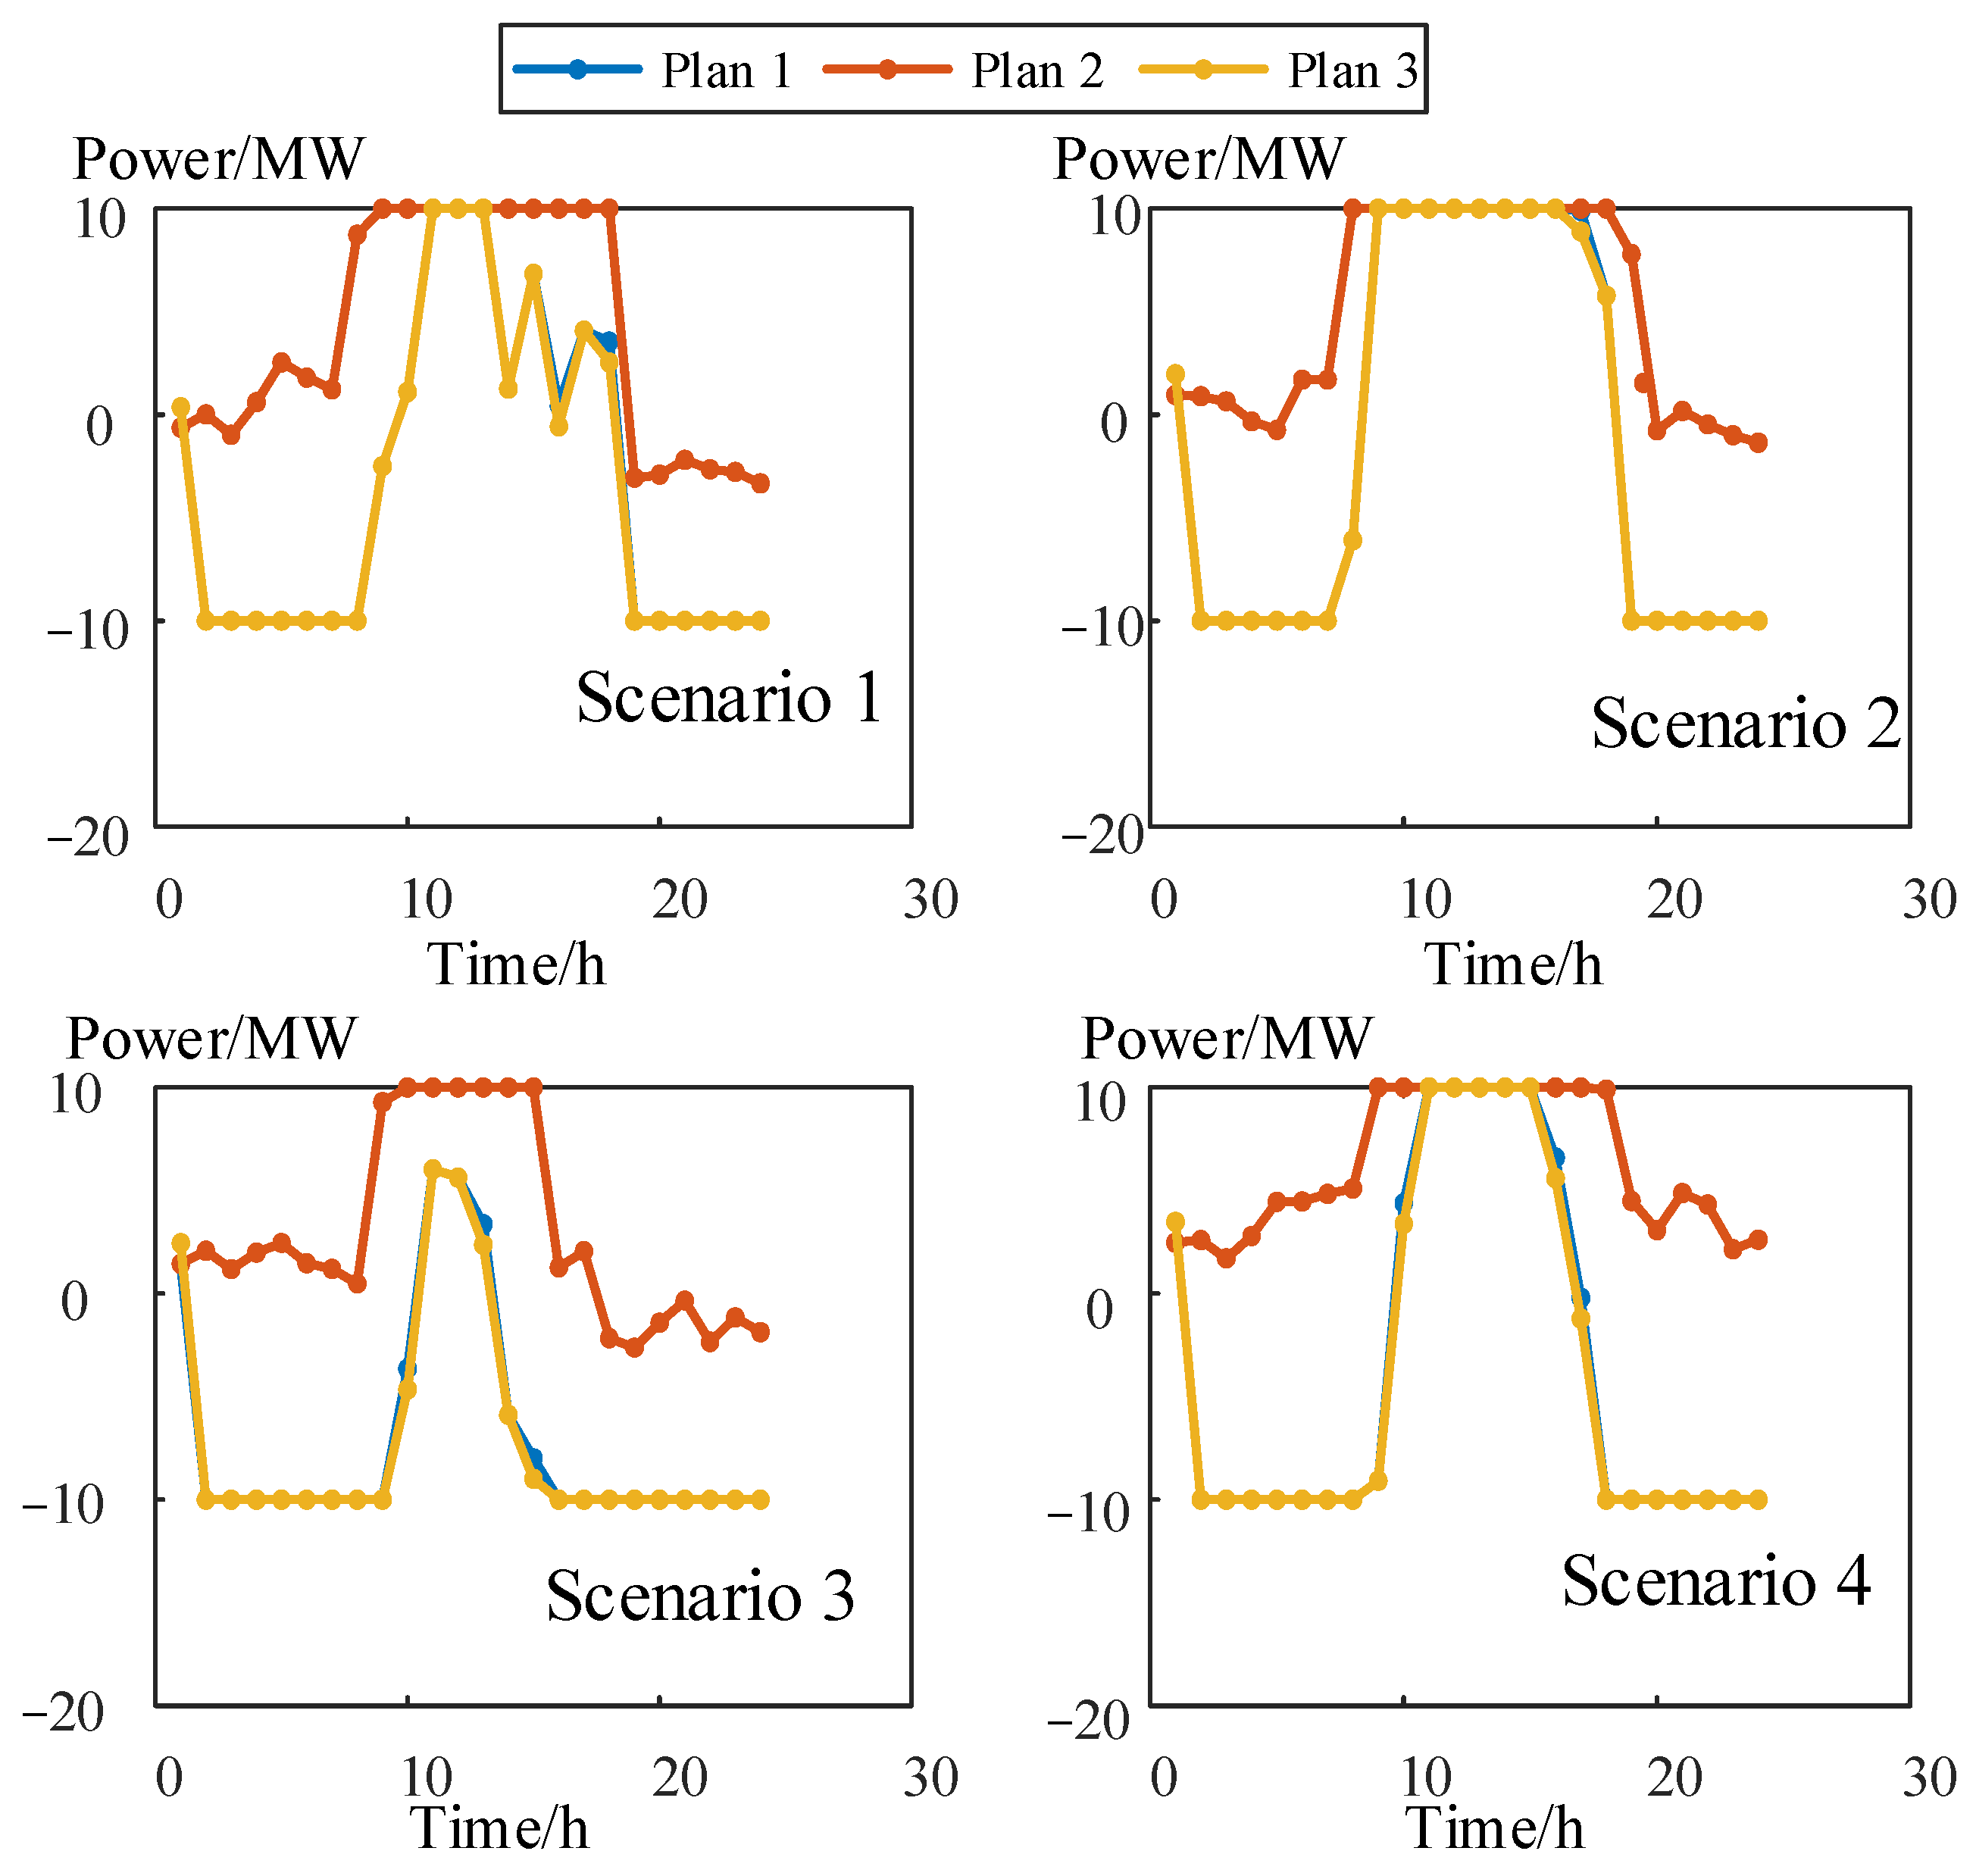
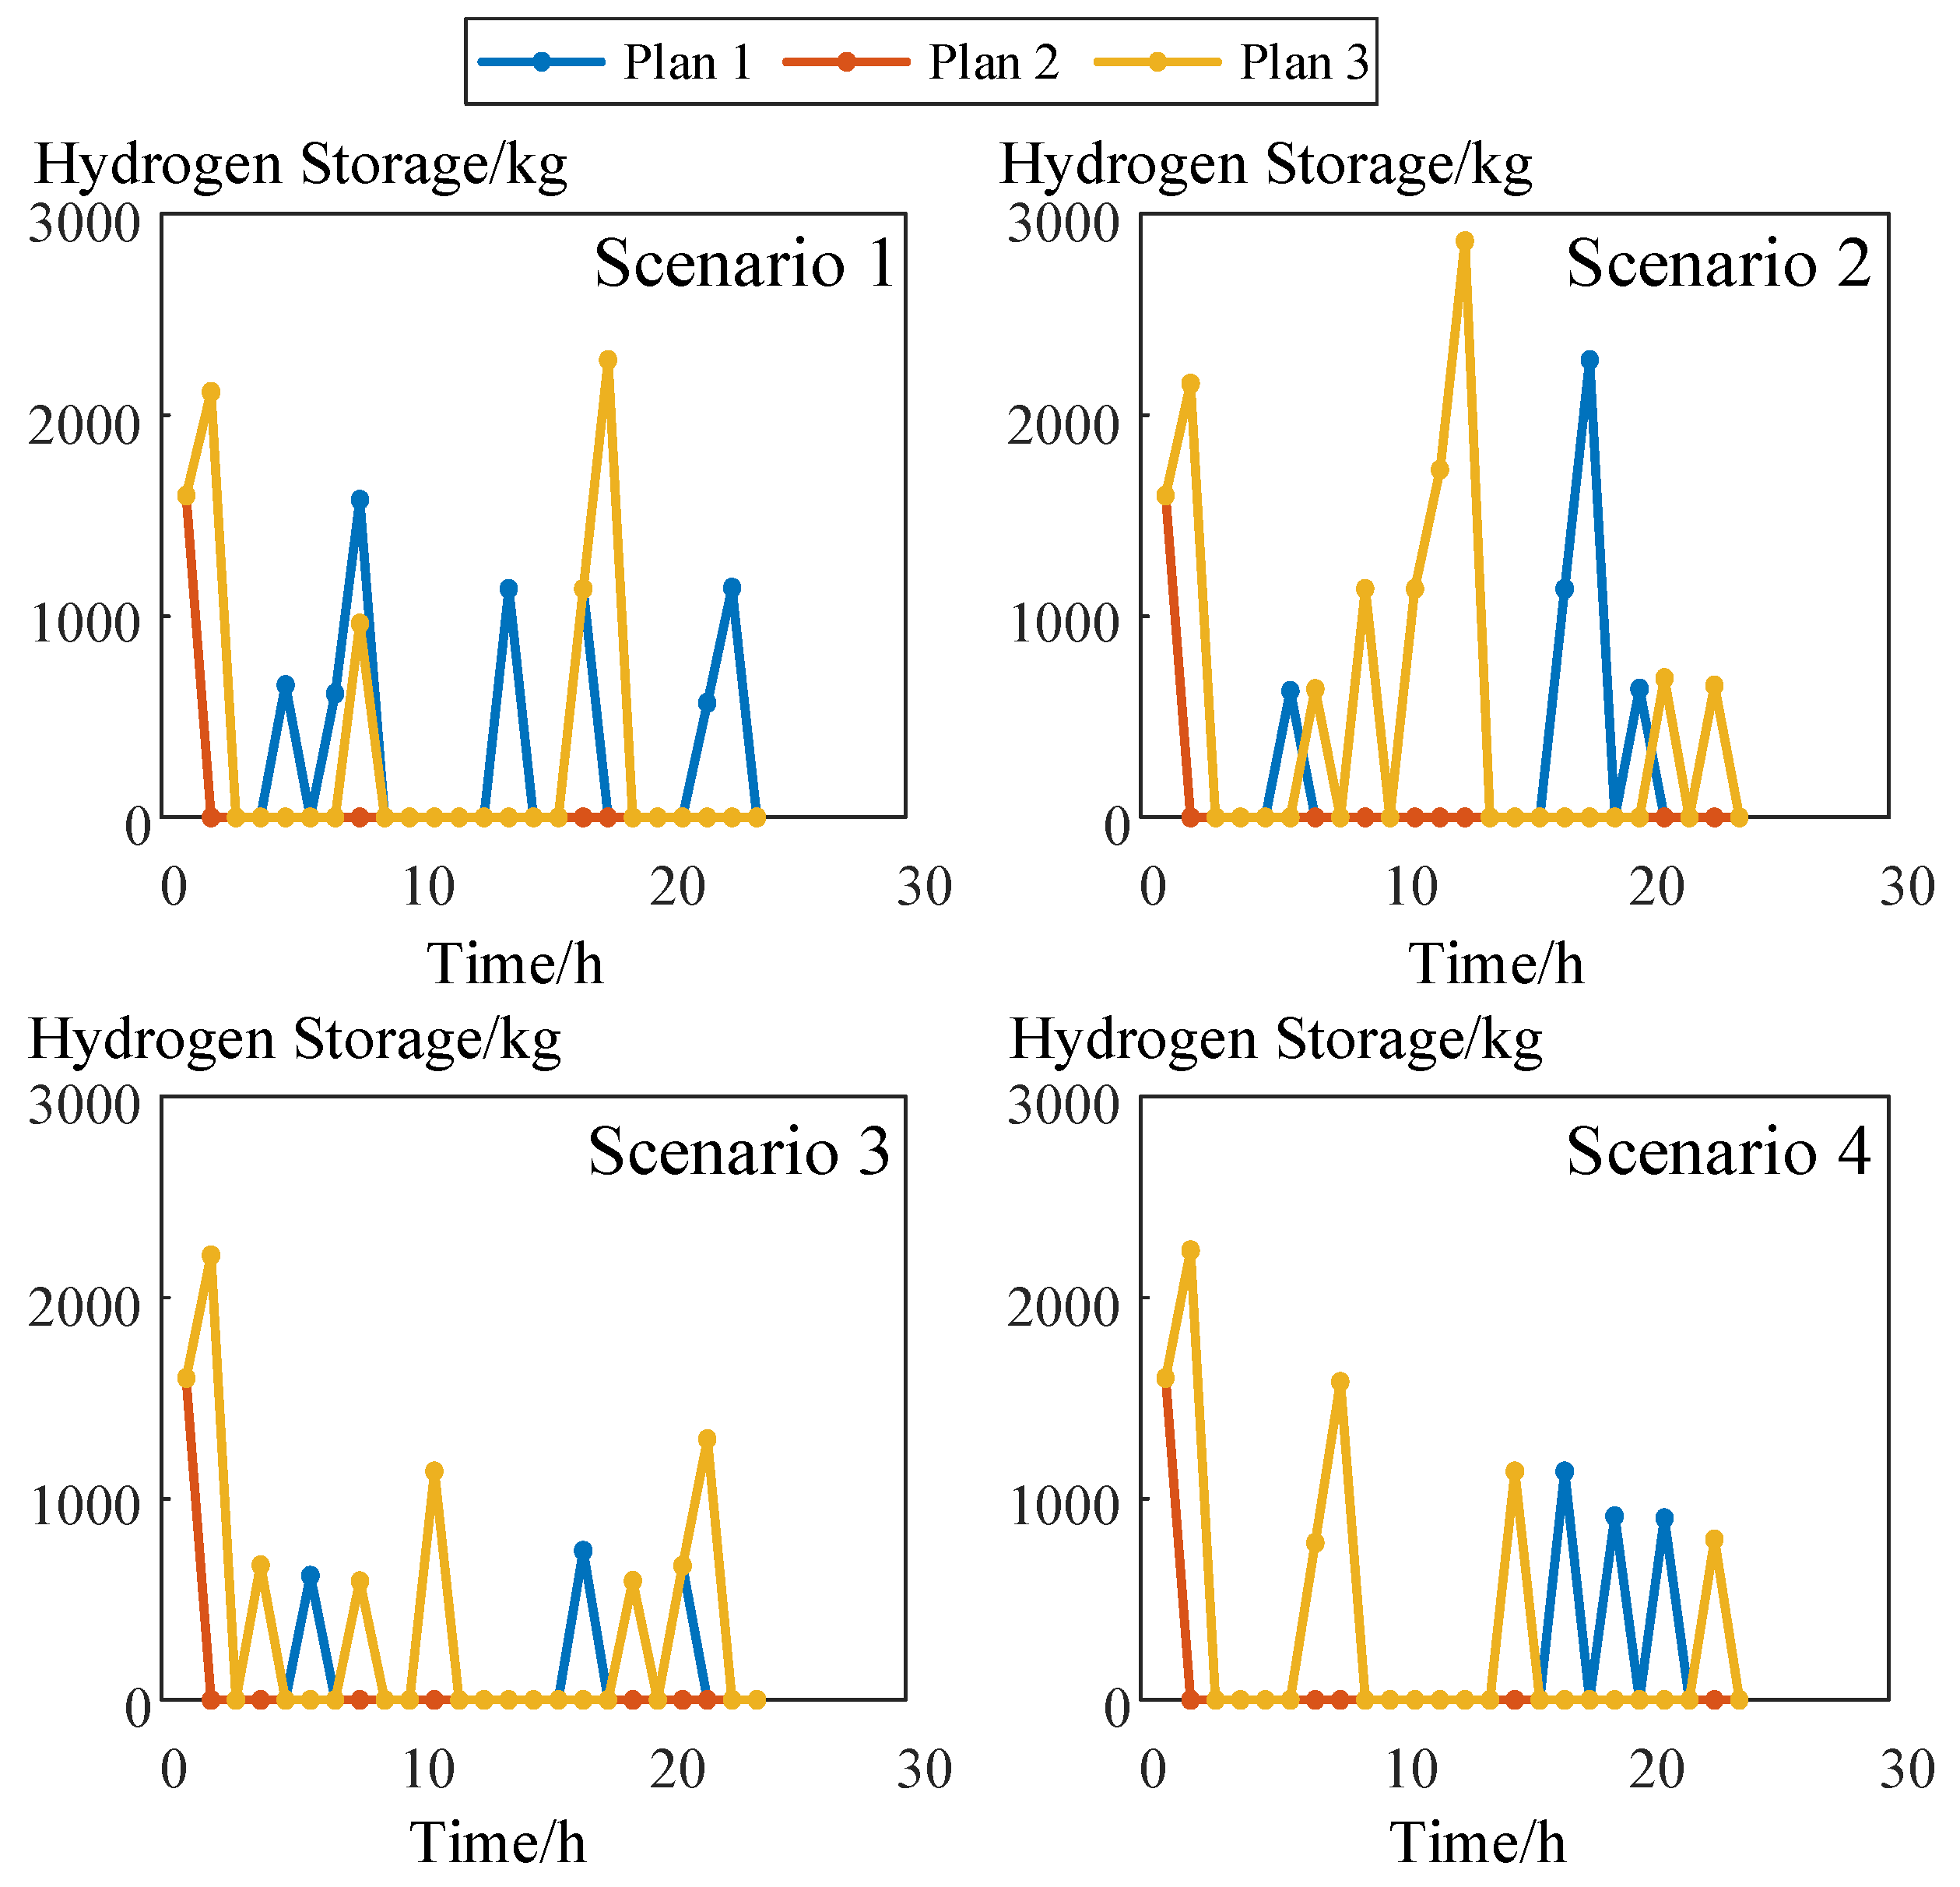
System operation status analysis
Figure 4, Figure 5 and Figure 6 compare the output curves of the electrolytic cell, grid connected power, and wind turbine curtailment power under two schemes. Table 4 presents the indicators of wind and solar energy consumption. According to Table 4, Scheme 1 and Scheme 3 have the lowest curtailment capacity, both of which are 30.79 MW, with a curtailment rate of 27.52%. This is because in the four scenarios shown in Figure 6, the electrolytic cells of Schemes 1 and 3 can quickly enter the maximum power operating state, while Scheme 2 requires a slow heating process, transitioning from the off state to the standby state before entering the normal operating state. The operating state of the electrolytic cell in Scheme 2 is a fixed known quantity, which cannot closely follow the changes in wind energy during the optimization process and cannot obtain a faster corresponding speed from the overall optimization of its own state. However, Plan 1 did not consider the standby state and instead could skip this process and directly transition from the closed state to the open state, saving the transition time during the standby phase. Scheme three optimizes the state changes of the electrolytic cell as a whole by incorporating the state variables of the electrolytic cell into the optimization solution process. Therefore, it can closely follow the changes in wind energy. Therefore, the curtailment rates of Schemes 1 and 3 are lower than those of Scheme 2. Although the standby state of Scheme 3 will consume a certain amount of power, the hot start state saves time from the shutdown state to the standby state and can absorb the rapidly increasing wind and solar power output. In addition, due to the fast start-up of electrolytic cells in Schemes 1 and 3, more wind and solar power output is absorbed. Therefore, in Figure 5, the grid connected power under these two schemes has been reduced, which also explains the phenomenon of reduced electricity sales revenue in Table 3. In fact, compared to references [16,17], the results presented in this article will be closer to the actual production process of electrolytic cells, and the optimization results obtained based on this will also have practical reference value.
Figure 6. Comparison of hydrogen storage curves (kg) under different cases.
Processes 12 01756 g006
Figure 6 and Figure 7 show the variation curves of hydrogen storage and sales under different schemes, respectively. As shown in the figure, the hydrogen sales volume of Scheme 2 almost linearly increases, and the hydrogen storage capacity is immediately consumed from the initial state to 0 and remains unchanged. This indicates that the hydrogen storage tank only has a buffering effect on the prepared hydrogen gas, and the produced hydrogen gas is immediately sold. Although the benefits of Schemes 1 and 3 are the same, the curves of hydrogen storage and sales do not completely overlap. This indicates that the optimization operation strategy considering the difference in cold and hot start times can achieve the same economic effect through optimizing the model.
Figure 7. Comparison of hydrogen storage curves (MW) under different cases.
Processes 12 01756 g007

5.3. Analysis of the Impact of Hydrogen Storage Tank Capacity on System Operating Revenue

Figure 8 compares the system operating benefits under different hydrogen storage tank capacities. As shown in the figure, the total revenue gradually increases with the capacity of hydrogen storage tanks, and the revenue from selling hydrogen also increases almost linearly. For every 10% increase in hydrogen storage tank capacity (300 kg), daily operating revenue increases by 0.32%, and hydrogen sales revenue increases by 2.8%. This is because the increase in capacity of hydrogen storage tanks provides greater flexibility in resources for the consumption of wind and solar power, promotes the consumption of new energy, and increases hydrogen sales revenue. The electricity sales revenue is highest when the hydrogen storage tank capacity is 3300 kg. As the hydrogen storage tank capacity increases, the overall fluctuation of electricity sales revenue does not exceed 0.005%, indicating that the electricity sales revenue remains almost unchanged. This is because the sales volume is constrained by the grid-connected power, and the increase in hydrogen storage tank capacity does not have an impact on the sales volume.
Figure 8. Comparison of operation profits under different capacities of hydrogen tanks.
Processes 12 01756 g008

6. Conclusions

This article considers the difference in cold and hot start-up time of electrolytic cells and the nonlinear input–output relationship. Based on the multi-state operation model of electrolytic cells, an optimized operation model for wind–solar hydrogen production is proposed. The simulation results of the case study verified the effectiveness of the proposed model, analyzing the important role of wind power hydrogen production equipment in reducing system operating costs and improving clean energy consumption. The study compared the operation of the system under different hydrogen load requirements and found that a reasonable arrangement of hydrogen load is conducive to further promoting green and economic operation of the system. By considering the standby state of the electrolytic cell, the operational efficiency of wind–solar hydrogen production can be improved. The capacity of hydrogen storage tanks will have an impact on the operating revenue of wind–solar hydrogen production. For every 10% increase in hydrogen storage tank capacity (300 kg), daily operating revenue will increase by 0.32%, and hydrogen sales revenue will increase by 2.8%, with almost no impact on electricity sales revenue. Overall, this article carefully considers the differences in cold and hot start-up times of electrolytic cells and the nonlinear input–output relationship, making the optimization results of wind–photovoltaic power-based hydrogen production systems more in line with the real working state of electrolytic cells and more practically significant. In fact, new energy sources such as wind power have strong uncertainties, but this article did not consider this uncertainty, which directly affects the optimization results of the electrolytic cell’s working state, resulting in a change in the overall optimization results. This also reflects the limitations of this article. In future research, we will integrate the output prediction of new energy sources such as wind power into the overall optimization process, which will involve the field of new energy output prediction, ultimately making the optimization results closer to actual production and providing more reliable theoretical support for actual production.

Author Contributions

Conceptualization, B.M., J.Z., Z.X., B.W. and H.M.; software, B.M., J.Z., Z.X., B.W. and H.M.; writing—original draft preparation, B.M., J.Z., Z.X., B.W. and H.M. All authors have read and agreed to the published version of the manuscript.

Funding

This research was funded by Guangdong Power Grid Corporation Technology Project (030600KC23100019).

Data Availability Statement

The original contributions presented in the study are included in the article, further inquiries can be directed to the corresponding author.

Conflicts of Interest

Authors Jianfeng Zheng and Zhongye Xian were employed by the Foshan Power Supply Bureau of Guangdong Power Grid Co., Ltd. The remaining authors declare that the research was conducted in the absence of any commercial or financial relationships that could be construed as a potential conflict of interest. The Foshan Power Supply Bureau of Guangdong Power Grid Co., Ltd. had no role in the design of the study; in the collection, analyses, or interpretation of data; in the writing of the manuscript, or in the decision to publish the results.

Appendix A

Two State Model of Electrolytic Cell:
P t ele = b = 1 N b w b , t p b ele   + s t p , ele  
I t ele   = b = 1 N b w b , t I b ele   + s t I , ele  
M i t s t p , ele   M i t
M i t s t I ,   ele   M i t
b = 1 N b w b , t = 1
{ w b , t z b 1 , t + z b , t b = 2 , 3 , N b 1 w 1 , t z 1 , t w N b , t z N b 1 , t
b = 1 N b z b , t = 1
0 w b , t 1
0 P t ele   p t M
p t I min b I t ele   p t I max b

References

  1. Yang, L.; Li, H.; Zhang, H.; Wu, Q.; Cao, X. Stochastic-Distributionally Robust Frequency-Constrained Optimal Planning for an Isolated Microgrid. IEEE Trans. Sustain. Energy 2024. early access. [Google Scholar] [CrossRef]
  2. National Energy Administration. National Renewable Energy Power Development Monitoring and Evaluation Report; National Energy Administration: Beijing, China, 2021.
  3. Chen, S. Research and Analysis of the Impact in the Wind-Solar-Battery Hybrid Generation System; China Electric Power Press: Beijing, China, 2016. [Google Scholar]
  4. Yang, L.; Xu, Y.; Zhou, J.; Sun, H. Distributionally Robust Frequency Constrained Scheduling for an Integrated Electricity-Gas System. IEEE Trans. Smart Grid 2022, 13, 2730–2743. [Google Scholar] [CrossRef]
  5. Li, J.; Yu, G.; Tang, B.; Yang, X.; Xia, X.; Liu, J.; Pan, A. Multi-energy Flow Integrated Energy System Planning Considering Wind and Solar Utilization and Containing Hydrogen Energy Flow. Power Syst. Prot. Control 2021, 49, 11–20. [Google Scholar]
  6. Cao, F.; Guo, T.; Chen, K.; Jin, X.L.; Zhang, L.; Yang, J.H.; Yin, A.M. Progress and Development Prospect of Coupled Wind and Hydrogen Systems. Proc. CSEE 2021, 41, 2187–2201. [Google Scholar]
  7. Li, T.; Sun, Y.-L.; Du, X.-R. Analysis of wind-solar hybrid power supply system. J. Qinghai Norm. Univ. 2011, 24–27. Available online: https://caod.oriprobe.com/articles/28144168/Analysis_of_wind_solar_hybrid_power_supply_system.htm (accessed on 12 August 2024).
  8. Cai, W.; Kong, L.; Bian, Y.; Song, J.; Xu, H. The Homogenization Modeling of Wind- photovoltaic System with Hydrogen Production. Electr. Power 2020, 53, 59–65. [Google Scholar]
  9. Li, Z.; Qiao, Y.; Lu, Z. Review of Rresearch on Wind-Hydrogen Coupled Power Generation Technology. Autom. Electr. Power Syst. 2022, 46, 104–112. [Google Scholar]
  10. Guo, M.; Yan, Z.; Zhou, Y.; Zhang, P. Optimization operation of comprehensive energy system including wind power hydrogen production equipment. China Electr. Power 2020, 53, 115–123+161. [Google Scholar]
  11. Wu, F. Optimization of Wind and Solar Hydrogen Storage Integrated Energy System. Shandong Chem. Ind. 2020, 49, 135–136+138. [Google Scholar]
  12. Yang, J.G.; Liu, W.M.; Li, S.X.; Deng, T.H.; Shi, Z.P.; Hu, Z.C. Optimal Operation Strategy and Benefit Analysis of Wind-Hydrogen Coupled Power Generation System. Electr. Power Constr. 2017, 38, 106–115. [Google Scholar]
  13. Wei, Z. Research of Capacity Optimization of Wind-Hydrogen Coupling System; Hebei University of Technology: Tianjin, China, 2020. [Google Scholar]
  14. Kong, L. Research on Optimal Sizing and Coordinated Control Stragy of Integrated Energy System of Wind Photovoltaitic and Hydrogen; North China Electric Power University: Beijing, China, 2017. [Google Scholar]
  15. Di, J.; Shen, Y.; Jia, M. Modeling and analysis of wind-hydrogen coupled power generation system. Therm. Power Gener. 2022, 51, 65–73. [Google Scholar]
  16. Qiu, Y.; Zhu, J.; Zeng, Y.; Zhou, Y.; Zhou, B.; Li, W. Technological Requirement Analysis and Prospect of Energy Management for Off-grid Renewable Power-to-Hydrogen Systems. Autom. Electr. Power Syst. 2024, 1–18. Available online: http://kns.cnki.net/kcms/detail/32.1180.TP.20240708.1014.003.html (accessed on 12 August 2024).
  17. Yuyang, Z.; Yuhuan, Z.; Yingjun, G. Capacity Configuration and Control Optimization of Off-Grid Wind Solar Hydrogen Storage System. Acta Energiae Solaris Sin. 2024, 45, 50–59. [Google Scholar]
  18. Sun, C. Research on Generation Expansion Planning Considering Hydrogen Load; Dalian University of Technology: Dalian, China, 2021. [Google Scholar]
  19. Zheng, Y.; Wang, J.; You, S.; Li, X.; Bindner, H.W.; Münster, M. Data-driven scheme for optimal day-ahead operation of a wind/hydrogen system under multiple uncertainties. Appl. Energy 2023, 329, 120201. [Google Scholar] [CrossRef]
  20. Raju, M.; Khaitan, S.K. System simulation of compressed hydrogen storage based residential wind hybrid power systems. J. Power Sources 2012, 210, 303–320. [Google Scholar] [CrossRef]
  21. Chen, C. Research on Modeling and Grid-Connected Control of Integerated System of Wind Power/Hydrogen/Fuel Cell; Northeast Electric Power University: Jilin City, China, 2017. [Google Scholar]
Figure 1. System structure diagram of wind–photovoltaic power-based hydrogen production system.
Processes 12 01756 g001
Figure 2. State diagram of electrolyzers.
Processes 12 01756 g002
Figure 3. Comparisons of wind–photovoltaic power.
Processes 12 01756 g003
Figure 4. Comparison of electrolysis power under different cases.
Processes 12 01756 g004
Figure 5. Comparison of on-grid power under different cases.
Processes 12 01756 g005
Table 1. Rated capacities of the wind–photovoltaic power-based hydrogen production system.
DeviceRated Capacity
Hydrogen storage tank3000 kg
Wind turbine10 MW
Photovoltaic unit90 MW
Electrochemical energy storage10 MWh, 1 MW
Table 2. Operation parameters of electrolyzers [19,20,21].
ParameterValue
r118.24 × 10−5 Ω m2
r12−4.12 × 10⁻⁷ m2 °C−1
r210.2393 V
r22−2.952 × 10⁻³ V °C−1
r231.55 × 10−5 V °C−2
r310.6767 A−1 m2
r32−2.71 × 10⁻² A−1 m2 °C−1
r334.87 × 10−4 A−1 m2 °C−2
r34−2.69 × 10⁻⁶ A−1 m2 °C−2
A0.25 m2
Uref1.229 V
Tm80 °C
Nel350
Ps2
I min b , I max b 10, 300
Table 3. Comparisons of operation benefits of different cases.
SchemeTotal RevenueElectricity Sales RevenueHydrogen Sales RevenueAbandoned Electricity Cost
157.64−3.1864.523.70
213.107.3213.918.13
357.64−3.1864.523.70
Table 4. Comparisons of wind–photovoltaic power accommodation indexes of different cases.
SchemePower Generation/MWAbandoned Power/MWAbandonment Rate
1111.8630.7927.52%
2111.8667.7760.58%
3111.8630.7927.52%
Disclaimer/Publisher’s Note: The statements, opinions and data contained in all publications are solely those of the individual author(s) and contributor(s) and not of MDPI and/or the editor(s). MDPI and/or the editor(s) disclaim responsibility for any injury to people or property resulting from any ideas, methods, instructions or products referred to in the content.

