Article

Effects of Autogenous Gas Tungsten Arc Welding (GTAW) on Corrosion Resistance of Stainless Steel 316L

1
Department of Nuclear Equipment Qualification & Safety, Korea Institute of Machinery and Materials, 48, Mieumsandan 5-ro 41beon-gil, Gangseo-gu, Busan 46744, Republic of Korea
2
Division of Materials Science and Engineering, Commonwealth Scientific and Industrial Research Organisation, P.O. Box 218, Lindfield, NSW 2070, Australia
3
LIG Nex1, 207, Mabuk-ro, Giheung-gu, Yongin 16911, Republic of Korea
*
Author to whom correspondence should be addressed.
The authors contributed equally to this work.
Processes 2024, 12(8), 1757; https://doi.org/10.3390/pr12081757
Submission received: 19 July 2024 / Revised: 3 August 2024 / Accepted: 7 August 2024 / Published: 20 August 2024
(This article belongs to the Section Materials Processes)

Abstract

:
The autogenous manual gas tungsten arc welding (GTAW) process was used for cladding austenitic stainless steel 316L using a single pass with various contact tip-to-work distances (CTWDs). Immersion and electrochemical tests were used to evaluate the corrosion resistance of the welded specimens, and a microstructural analysis was conducted to investigate the chemical composition of the molten pool and the heat-affected zone of welding. The key findings of this study indicate that the corrosion resistance improved under a CTWD of 5 mm due to the optimal distribution of ferrite and a refined microstructure. Additionally, the highest hardness was observed in specimens with a CTWD of 3 mm, attributed to the increased ferrite content in the weld metal. As the CTWD increased, the ferrite fraction decreased, and the hardness also diminished. However, in the CTWD 7 mm case, the higher heat input influenced the microstructure and molten pool shape significantly through the Marangoni effect, resulting in a lower corrosion resistance. These results suggest that optimizing the CTWD can enhance the corrosion resistance of welded 316L stainless steel.

1. Introduction

Austenitic stainless steel contains alloying elements such as Cr and Ni and is known to have high corrosion resistance, mechanical properties, and weldability compared to other alloy steels [1,2,3]. Owing to these characteristics, austenitic stainless steels are widely used as structural materials in various industrial fields, especially in environments that require high temperatures, high pressures, and exposure to chemicals. The 316 series of stainless steel is a representative austenitic steel with high Cr and Ni contents, and added Mo, which is used for valves, pipes, and high-temperature structural materials [4,5,6]. However, depending on the environment or duration of application, stainless steel can experience not only uniform general corrosion but also localized corrosion such as pitting corrosion or crevice corrosion. Additionally, environmental-assisted corrosion such as stress corrosion cracking due to stress concentration and galvanic corrosion due to contact with dissimilar metals can occur. These types of corrosion are related to the formation of Cr carbide precipitation at grain boundaries, which affects the material by causing embrittlement and reducing corrosion resistance [7,8,9,10]. To address these issues, surface treatment methods using heat sources and lasers have been reported to enhance corrosion resistance. However, field application is limited due to relatively high processing costs. Therefore, the method using arc plasma is widely used as a surface treatment technique to improve corrosion resistance [11,12,13]. Gas tungsten arc welding (GTAW), also known as tungsten inert gas (TIG) welding, is a welding method in which a non-consumable tungsten electrode generates arc heat with a base metal in an inert gas atmosphere. GTAW is widely used in industries where precise and clean welding is required, such as aerospace, automobiles, and semiconductor manufacturing. Inert gases, such as Ar or He, protect the weld area from atmospheric contamination, minimize defects, and improve welding quality. Autogenous welding using GTAW is advantageous for industrial applications [14].
Cladding using GTAW has been reported to improve corrosion resistance, and various studies have been conducted [15,16]. Panmongkol et al. evaluated the corrosion resistance of stainless steel 304 specimens using different mixing ratios of Ar and N as the inner gas [11]. Kumar et al. evaluated the corrosion resistance of GTAW and autogenous welding specimens using filler [17]. In the GTAW process, the parameters used can affect the quality of the surface and the geometry of the weld pool, which in turn influence material properties such as mechanical properties and corrosion resistance. Therefore, the selection of process parameters is a crucial factor in the cladding process to ensure enhanced corrosion resistance [18]. However, optimization studies on welding parameters that affect corrosion resistance in the cladding process using autogenous GTAW are relatively insufficient [18,19]. Some researchers, such as A. Baghel, A.S. Baskoro, and M.A. Moghaddam, have studied the effects of parameters such as the current, welding speed, gas flow rate, and arc gap on the weld bead geometry, as well as the corrosion and mechanical properties of the surface in their previous research. They also conducted studies to optimize these parameters and investigated the correlations with the material properties [20,21,22]. However, optimization studies concerning contact tip-to-work distances (CTWDs) have not been extensively researched.
Therefore, this study evaluated the effect of the contact tip-to-work distances (CTWDs) on the corrosion resistance of claddings using an autogenous GTAW process for stainless steel 316L. In the GTAW process at various CTWD parameters, the shape of the arc plasma was observed using a high-speed camera, the microstructure of the specimen after welding was observed using an optical microscope, and the hardness was evaluated. The corrosion resistance of each CTWD specimen was evaluated based on its electrochemical properties and the ASTM A262 Practice C [23].

2. Experimental Procedure

2.1. GTAW Process

In this study, an autogenous manual gas tungsten arc welding (GTAW) process was performed on a stainless steel 316L plate with a thickness of 5 mm. The chemical composition of the material used is presented in Table 1. Before the welding process, the plate was cleaned using distilled water and ethyl alcohol to degrease and remove oil. The parameters used for the autogenous manual GTAW are listed in Table 2. The GTAW process was performed in a single pass, and no additional heat treatment was conducted following welding. To evaluate the arc shape, arc plasma imaging was performed using a high-speed camera. A 694 nm bandpass filter was used for imaging, with the shutter speed set to 1/200,000 s. The distance between the camera lens and the electrode was maintained at 740 mm. A schematic of the camera setup used for arc plasma imaging is shown in Figure 1.

2.2. Characterization

Mechanical polishing was performed using SiC papers with grit sizes of 320, 400, 600, and 800, as well as diamond suspensions with particle sizes of 6, 3, 1, and 0.5 μm. Microstructures were observed after etching. To evaluate the corrosion rate, ASTM A262 Practice C and polarization tests were performed. ASTM A262 Practice C is a standardized test method for evaluating the susceptibility of stainless steels and related alloys to intergranular corrosion. This practice can be used to evaluate the effect of Cr carbides, which can reduce the corrosion resistance of materials. The test involved immersing a sample in a 65% nitric acid solution for 48 h, five times. After the immersion test, the specimens were rinsed in distilled water and ethyl alcohol and dried in air. The specimens were weighed using a scale with a minimum count of 0.0001 g before and after immersion in nitric acid. The corrosion resistance was evaluated by measuring the mass loss after immersion in 65% nitric acid five times for 48 h.
The schematic diagram of the cell for electrochemical analysis is shown in Figure 2. A welded surface area of 100 mm2 was subjected to an electrolytic solution of 3.5 wt.% NaCl for a polarization test using a potentiostat (Gamry Interface 500, Gamry Instruments, Warminster, PA, USA) and a three-electrode setup at room temperature. In the corrosion analysis cell, the following electrodes were used: the welded sample as the working electrode, a platinum electrode as the counter electrode, and a Ag/AgCl electrode as the reference electrode. The specimen was cathodically conditioned at −500 mV vs. open-circuit potential for 5 min. The specimens were polarized in the positive direction with 1.67 mV/s to 1500 mV from the open-circuit potential.

3. Results and Discussion

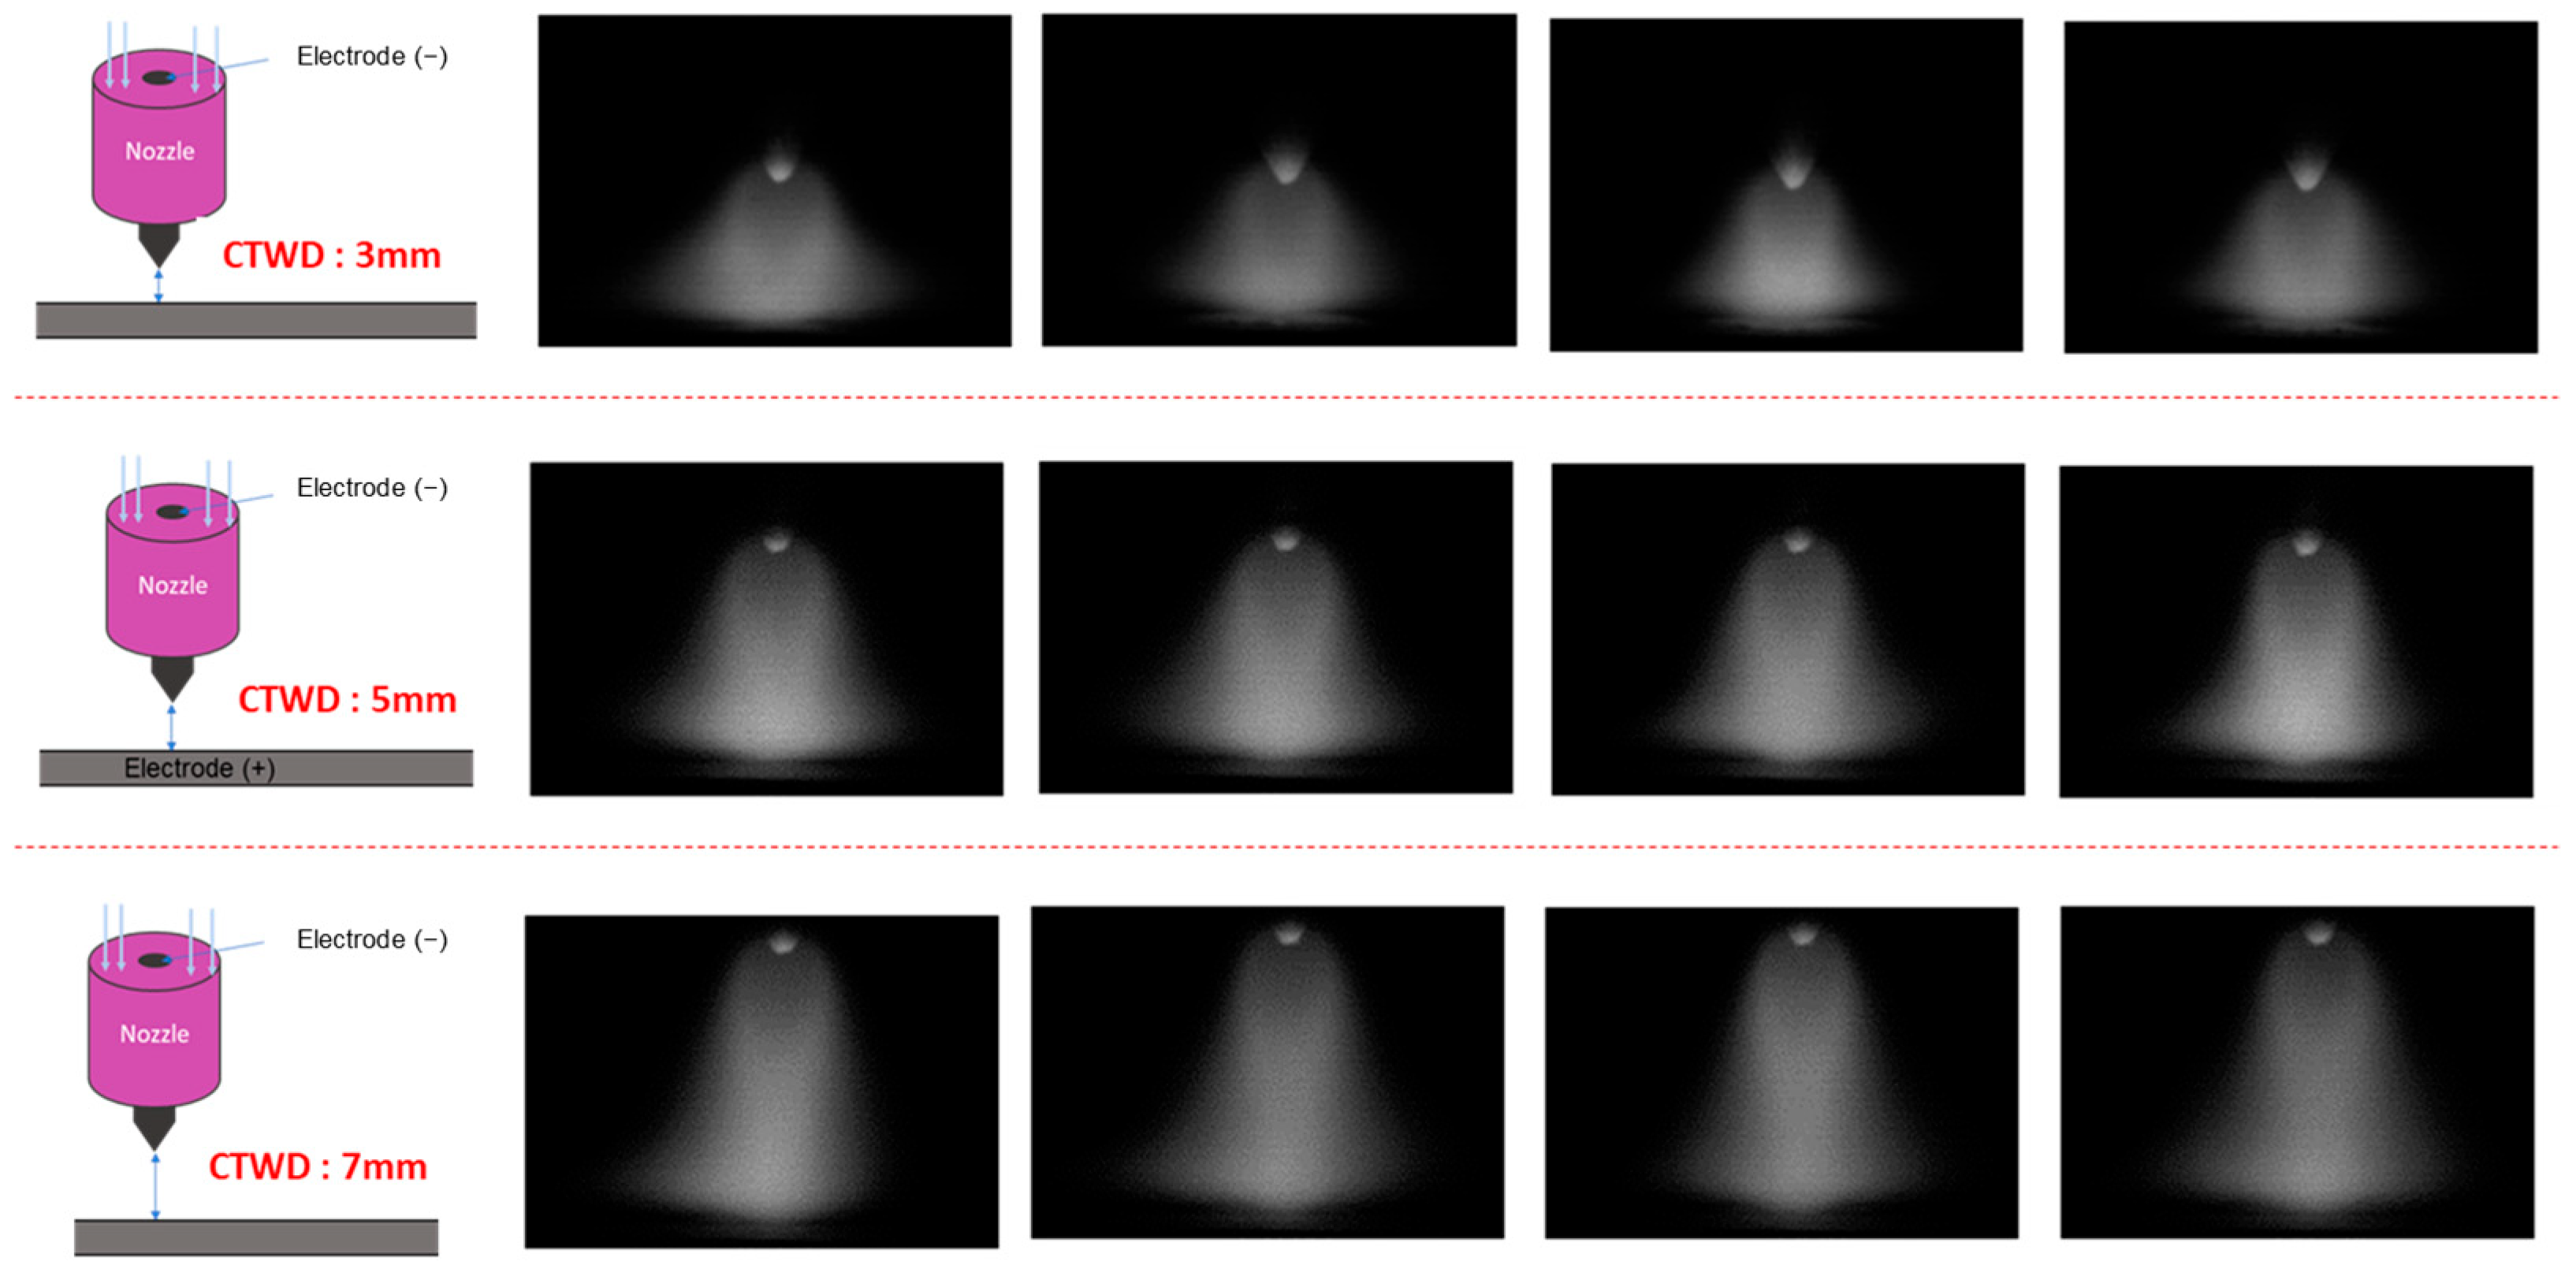
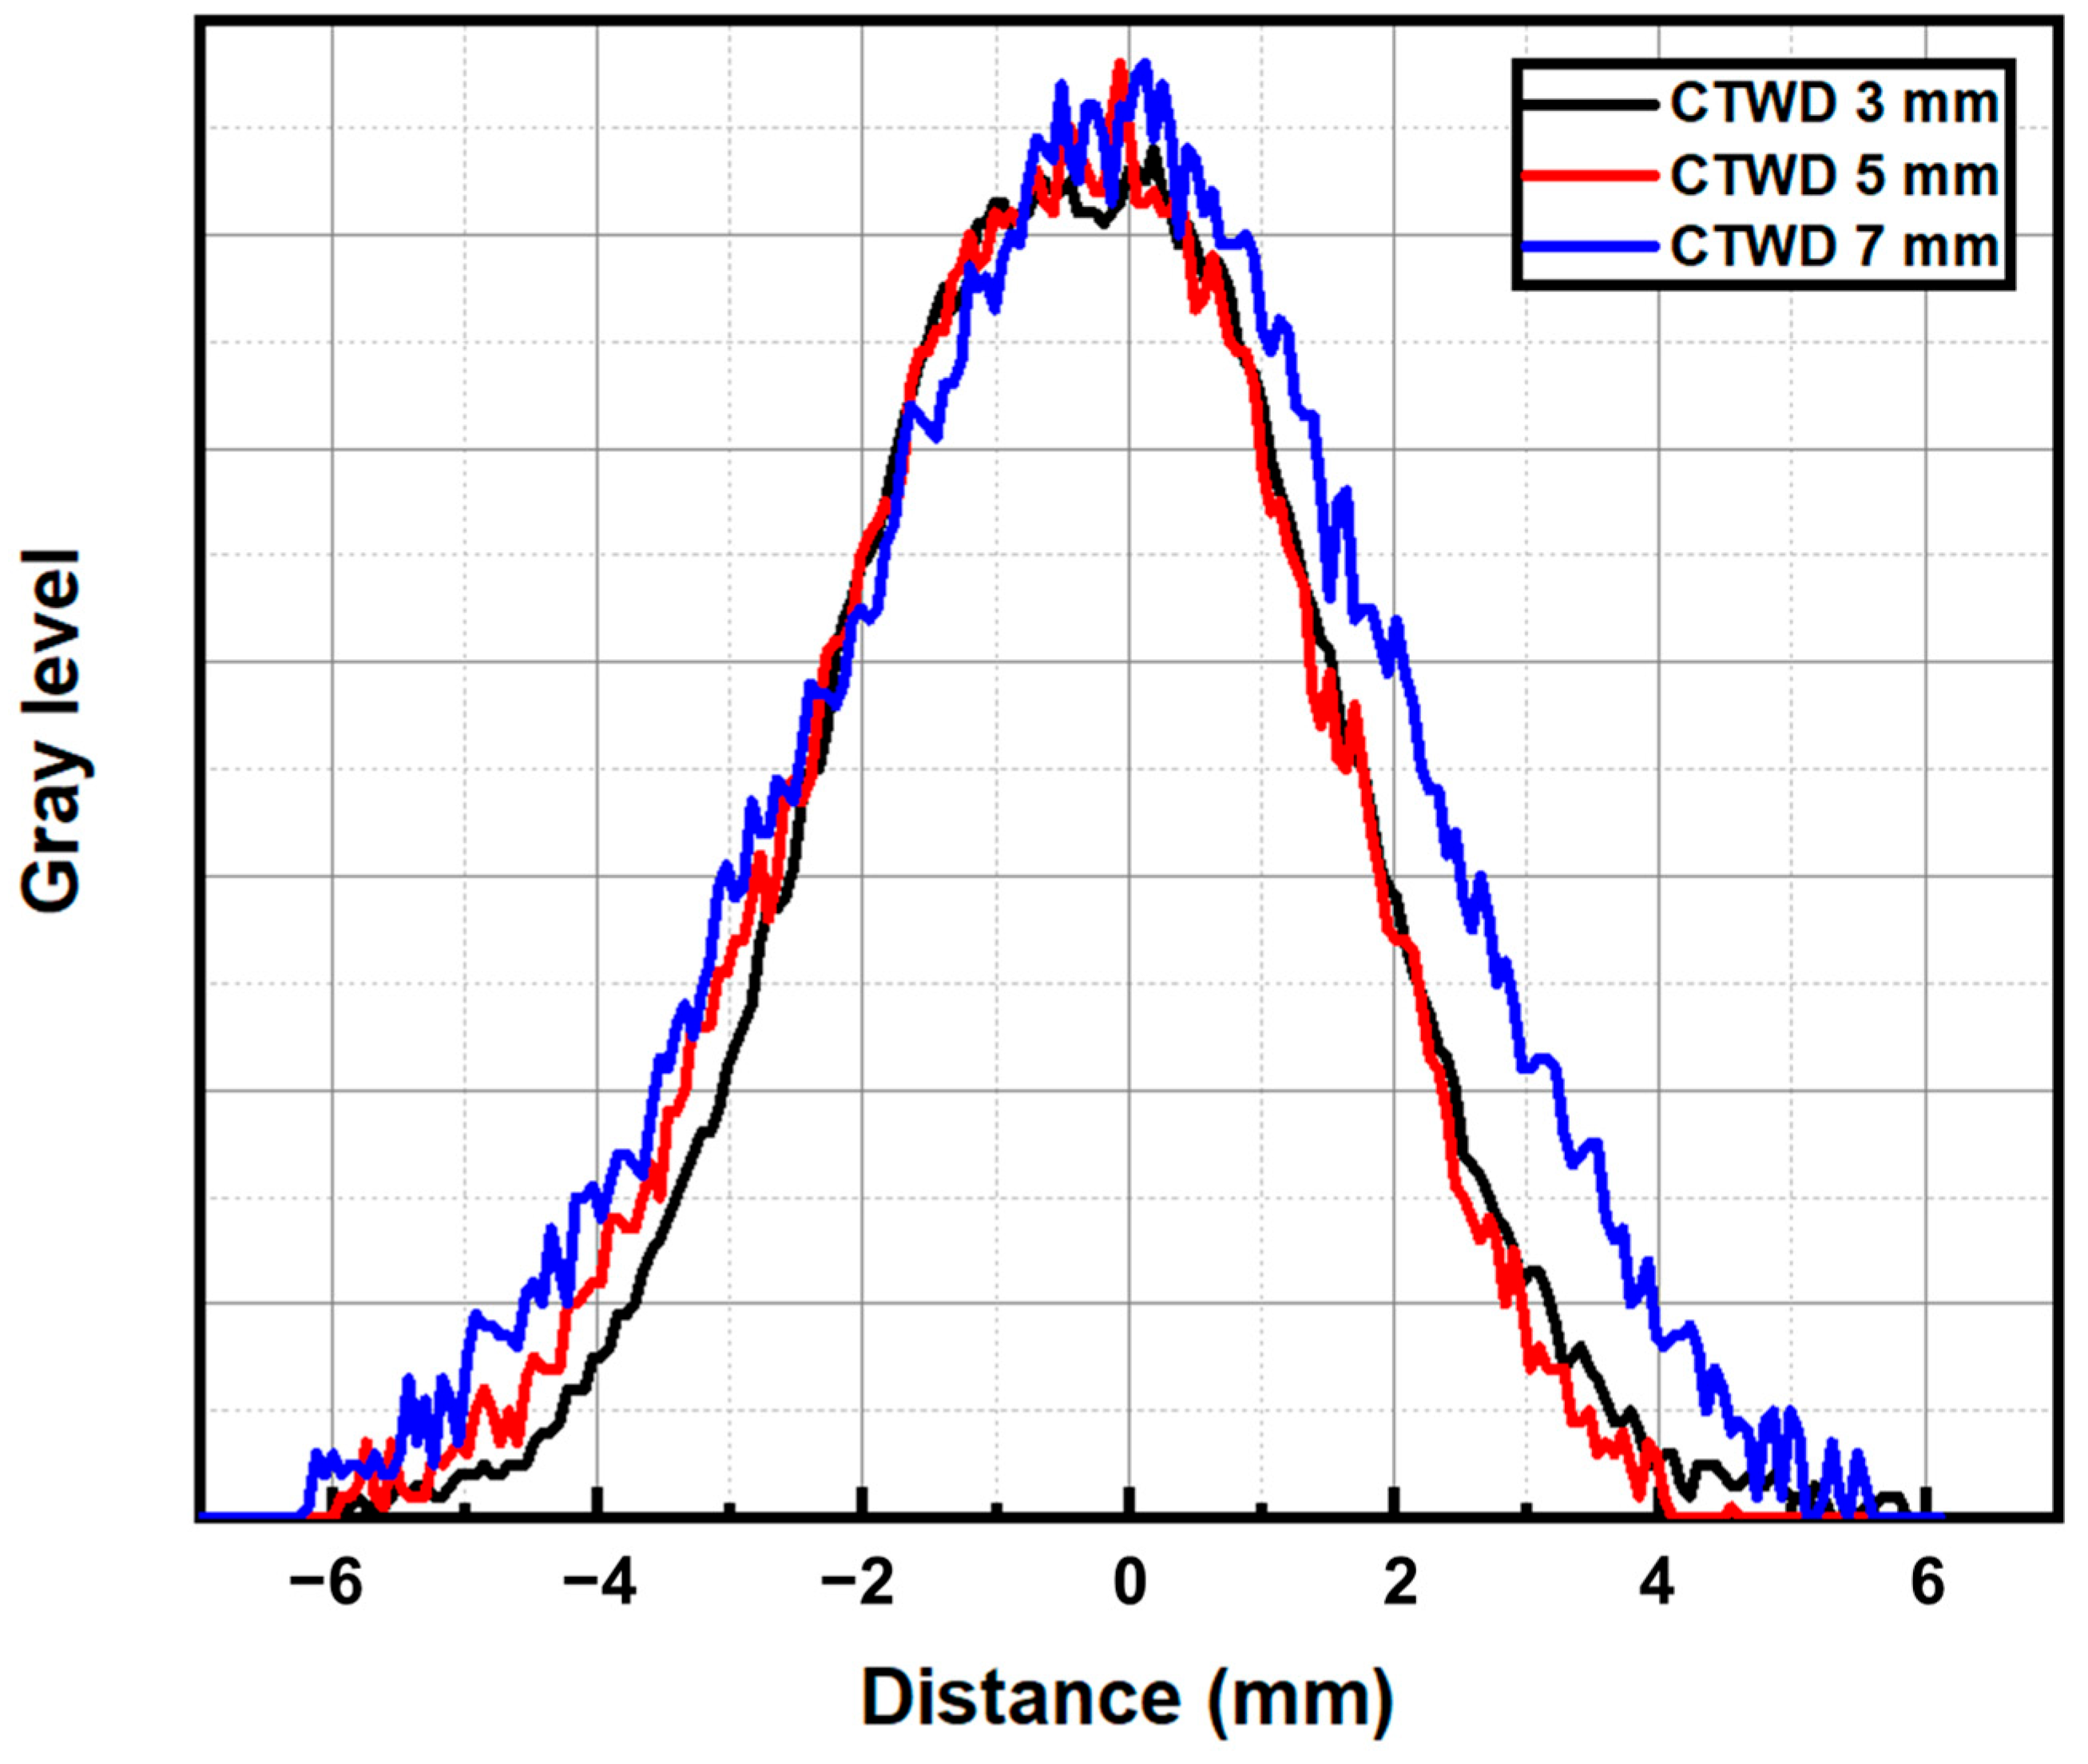
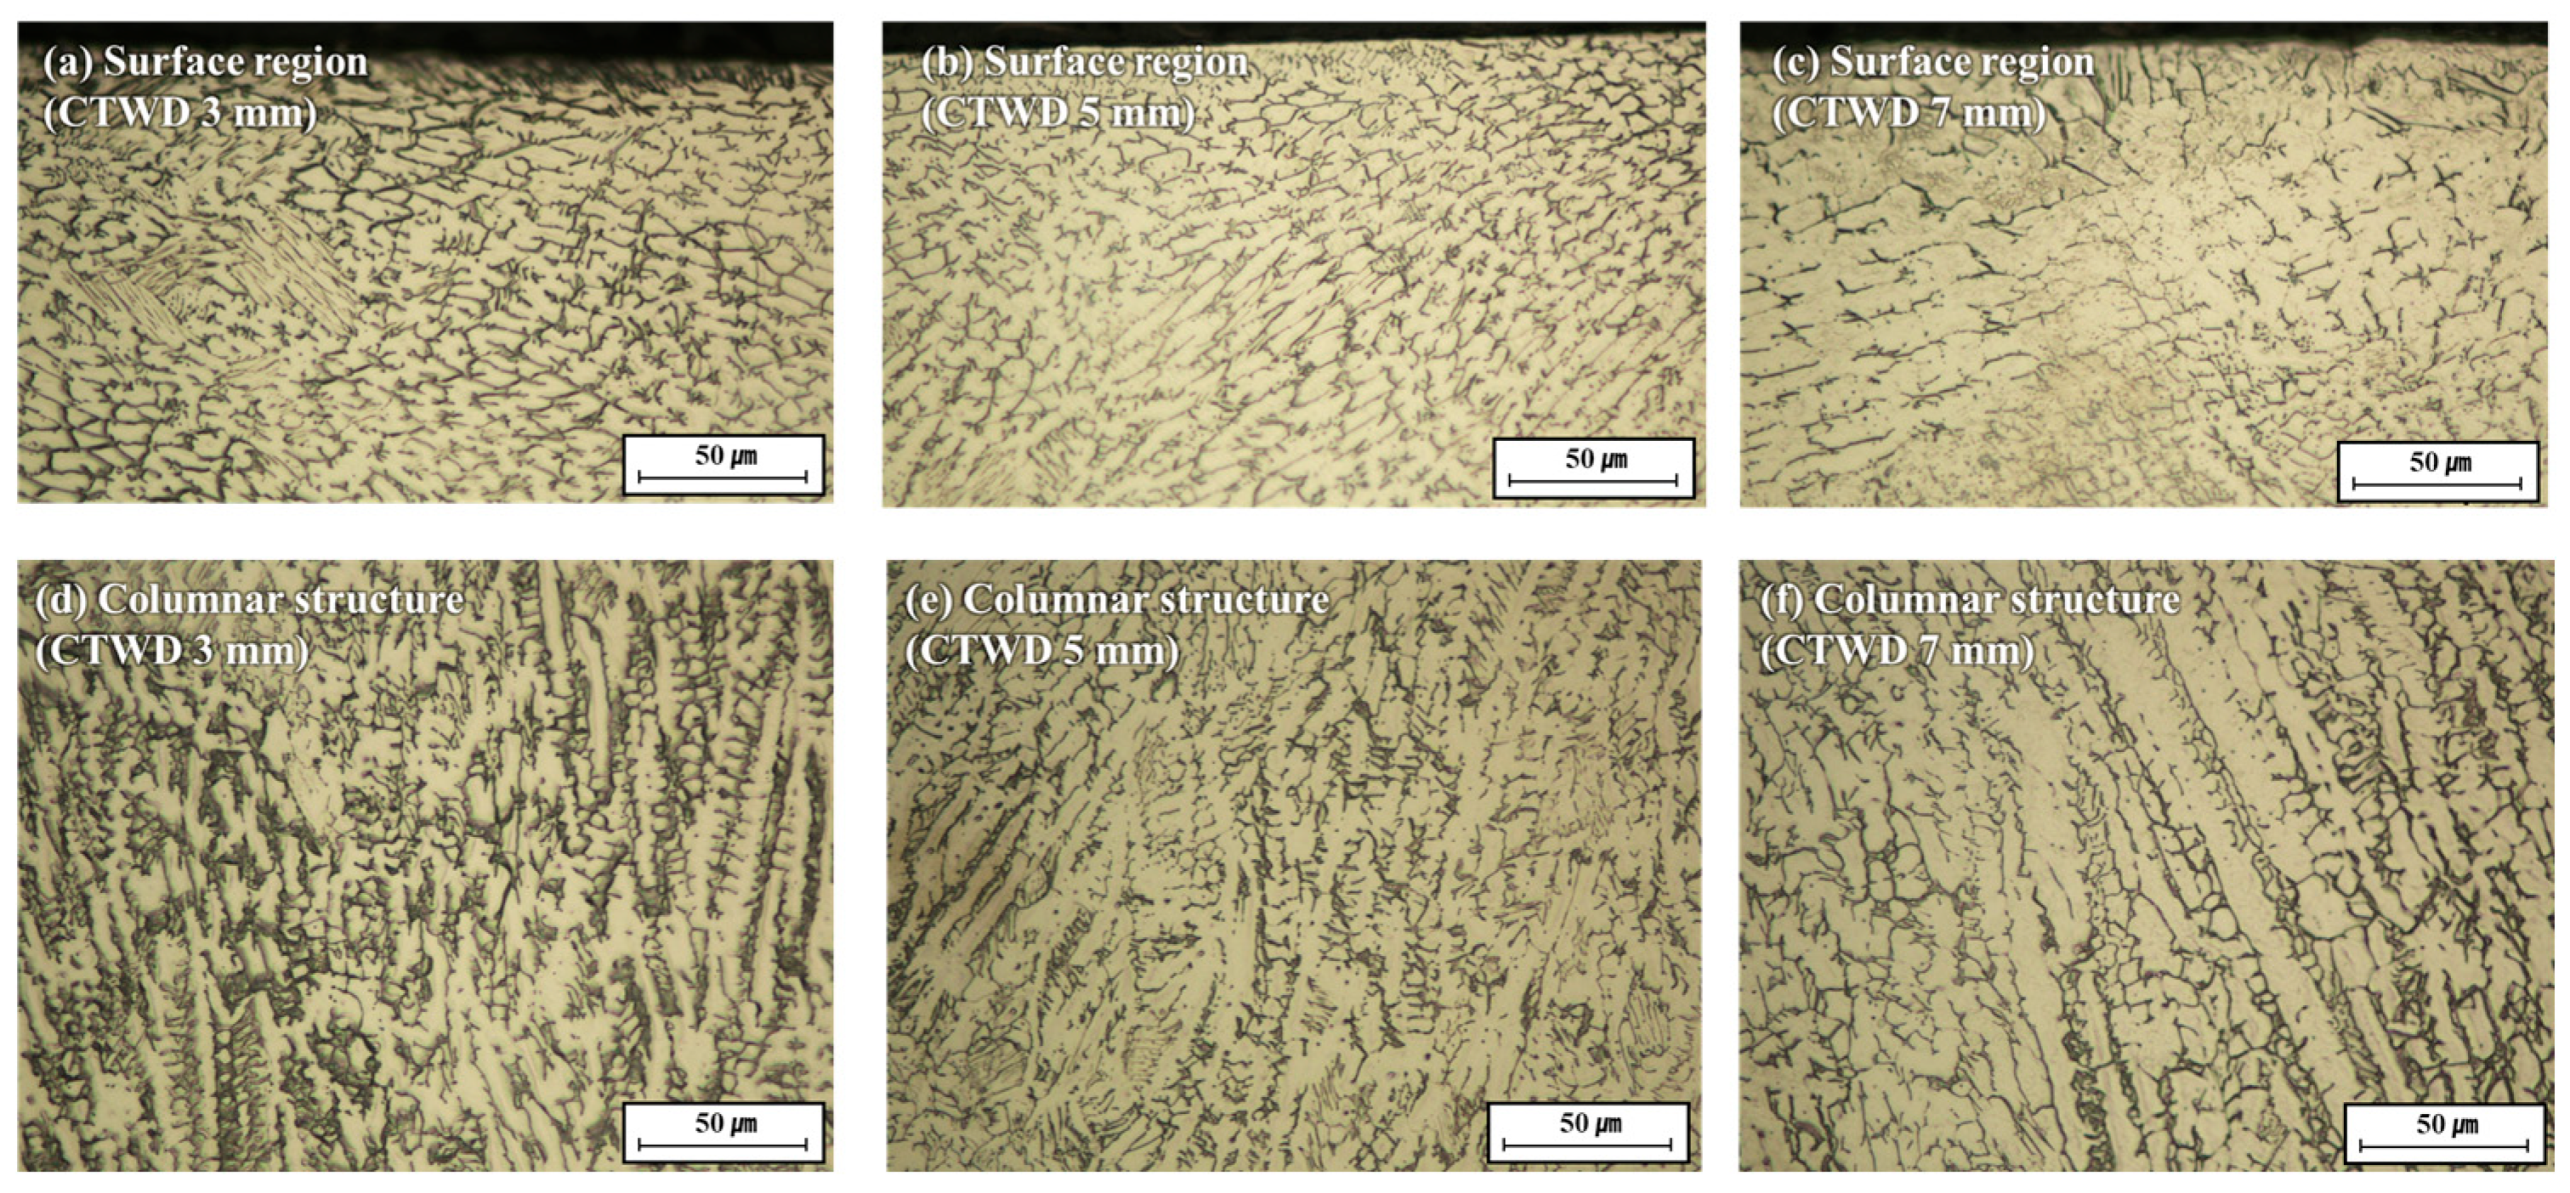
3.1. Arc Plasma Distribution and Microstructure of Molten Pool

Figure 3 shows the results of measuring the arc plasma generated during the GTAW process at various CTWDs using a high-speed camera. As shown in Figure 4, the distribution of the arc heat flux remained similar even as the CTWD increased, as evidenced by the distribution of gray levels above the anode. Consequently, there were no significant changes in the arc distribution and shape with variations in the CTWD. However, the measured current and voltage values exhibited a slight increase with the increasing CTWD. This increase is attributed to the characteristics of the welding machine used in the experiment. Even when set to a constant current, the welding machine tended to operate in a region where both the current and voltage increased. Therefore, considering the increased current and voltage with the increasing CTWD, changes in the distribution of the arc plasma heat flux may occur, potentially affecting the fusion zone shape of the bead [24].
In the CTWD 3 mm case, where a relatively low current and voltage are applied, resulting in a low heat input, the heat flux at the anode surface is reduced if the arc plasma radius remains similar to that of the other CTWD cases. This leads to a relatively small fusion zone shape. Additionally, because of the low applied current, the Marangoni effect, induced by changes in the surface tension resulting from temperature gradients in the molten pool, is considered to have a greater influence on the behavior of the molten pool than the fluid flow driven by the arc pressure on the surface of the molten pool and the electromagnetic forces acting in the depth direction within the molten pool. As a result, the molten pool spreads widely, generating shallow flow patterns.
Table 3 lists the measured values of the voltage, current, and calculated heat input for various CTWD cases in the GTAW process. In the case of a CTWD of 5 mm, both the current and voltage increased compared with a CTWD of 3 mm. Because the arc plasma distribution does not show significant differences compared with a CTWD of 3 mm, this leads to an increase in the heat flux entering the base metal. The size of the fusion zone increases because of the relatively high heat input. The shape of the fusion zone was similar to that of the CTWD 3 mm case, with a penetration depth relatively lower than the bead width, indicating that the Marangoni effect was predominant. In the case of a CTWD of 7 mm, the applied current and voltage increased compared with the CTWD 3 mm and 5 mm cases, resulting in the observation of a fingertip-shaped fusion zone. This is attributed to the higher applied current and voltage under these conditions, which increased the electromagnetic forces and arc pressure, leading to a deeper penetration depth compared to the other CTWD cases.
The apparent arc width increased slightly with a CTWD of 3, 5, and 7 mm. Previous computational models predicted that the arc radius increases with the CTWD, and measurements generally support this for high temperatures [24,25]. Moreover, it was confirmed through macro-section analysis that the deepest penetration occurred for the 7 mm CTWD, with shallower penetration observed for the 3 mm and 5 mm CTWDs. Nestor proved that the arc efficiency decreased as the CTWD increased [25]. However, in this study, as the CTWD increased, the voltage increased, and the total arc power ultimately increased; therefore, the effect of the reduced arc efficiency was offset. Therefore, the penetration at 7 mm was the main reason.
To investigate the microstructure of the 316L specimens following the autogenous GTAW process, OM was employed, and the results are summarized in Figure 5 and Figure 6. The bead widths and maximum penetration depths within the fusion zone are summarized in Table 4. The bead width and maximum penetration depth were measured as 6.68 and 1.14 mm, respectively, at a CTWD of 3 mm, 7.79 and 1.04 mm, respectively, at a CTWD of 5 mm, and 4.91 and 1.48 mm, respectively, at a CTWD of 7 mm. As illustrated in Figure 5, the widest fusion zone on the surface was formed at a CTWD of 5 mm, whereas the penetration depth was the deepest at a CTWD of 7 mm. As mentioned previously, these variations in the fusion zone shape were associated with the arc plasma shape and heat input. At a CTWD of 7 mm, a relatively high heat input led to the formation of a narrower and longer fusion zone.
In all cases, a cellular ferritic structure was formed, which grew into a columnar dendritic structure. With the increasing CTWD, the relative increase in the heat input affected the growth of columnar dendrites and side arms, as observed in more areas. In the surface region, as the heat input increases, the number of relatively fine coaxial grains decreases. During GTAW-induced solidification, the temperature gradient decreased towards the center of the molten pool, whereas the solidification rate increased, leading to an expanded supercooling region. Therefore, at low cooling rates, the solidification time for the formation of the columnar structure increases, resulting in an increase in the fine epitaxial columnar structure. Therefore, the columnar structure grew the most in the CTWD 7 mm case, which had the highest heat input owing to the characteristics of the arc plasma. Figure 6 illustrates the microstructure of the surface region and columnar structure. No significant differences in the grain size were observed in the surface regions of a CTWD of 3 and 5 mm. At a CTWD of 7 mm, relatively large grains were formed, and this trend was similarly observed for the columnar structures [25,26].
The ferrite fraction in the surface region and columnar structure based on OM image analysis are presented in Figure 7. As the CTWD increases, the ferrite content decreases, leading to a decrease in the hardness of the surface region and columnar structure. The hardness decreased because ferrite is naturally harder than austenite. In addition, the lower hardness of the columnar structure compared with that of the surface structure was due to the finely grained surface region hindering the movement of dislocations [27,28].
Figure 8 shows the hardness measurement results in the columnar structure and surface region according to CTWD. From these results, two main discussions can be derived. Firstly, the difference in the ferrite fraction with varying CTWDs and the consequent changes in hardness. As seen in Table 3, as the CTWD increases, the heat input also increases, and the cooling rate decreases, providing more time for the transformation from ferrite to austenite. Therefore, the ferrite fraction decreases, resulting in reduced hardness. Secondly, the difference in hardness according to the structure. In all CTWD cases, more ferrite was observed in the columnar structure than in the surface region. However, due to the characteristics of the structure, the equiaxed grain structure in the surface region exhibited a higher hardness. In the equiaxed grain structure of the surface region, grains grow uniformly in all directions, resulting in many grain boundaries. These grain boundaries are known to hinder dislocation movement, thus increasing hardness. On the other hand, the columnar structure has grain boundaries that grow in a specific direction, allowing easier dislocation movement in that direction. This results in lower resistance to dislocation movement, thereby reducing hardness.
The microstructure and phases are determined by solidification and can be predicted by the chemical composition of the alloying element (Creq/Nieq). Solidification can be classified into four transformation modes: austenite (A), austenite–ferrite (AF), ferrite–austenite (FA), and ferrite (F). The solidification mode determines the composition, shape, and phase of a structure. Figure 9 and Figure 10 illustrate the variations in solidification modes according to Creq and Nieq. According to the WRC 1992 equation, solidification occurs in A or AF when the Creq/Nieq ratio is approximately 1.48 or below, in the FA mode when 1.48~1.95, and in the F mode when it is above 1.95. In this study, the stainless steel 316L used had a Creq of 20.72 and a Nieq of 13.52, resulting in a Creq/Nieq ratio of approximately 1.53, indicating solidification in the FA mode. In this mode, the formation of the FA structure during the solidification stage resulted in a relatively complex grain boundary. According to the solidification mode presented in Figure 9 and Figure 10 based on the Creq/Nieq ratio, primary ferrite transforms into austenite as the molten pool cools. This transformation occurs as Ni, an austenite-stabilizing element, is released at the solid/liquid interface, leading to an increase in Nieq within the liquid, which gradually forms an austenite structure. Therefore, in regions with a high cooling rate, ferrite forms in a columnar structure along the thermal gradient, while in regions with a relatively lower cooling rate, a cellular ferritic structure is formed. As a result, the 316L stainless steel exhibits a mixture of ferrite and austenite, with ferrite present in both cellular and columnar structures [29,30].
% C r   e q u i v a l e n t C r e q , w t . % = C r + M o + 0.7 N b
% N i   e q u i v a l e n t N i e q , w t . % = N i + 35 C + 20 N + 0.25 C u

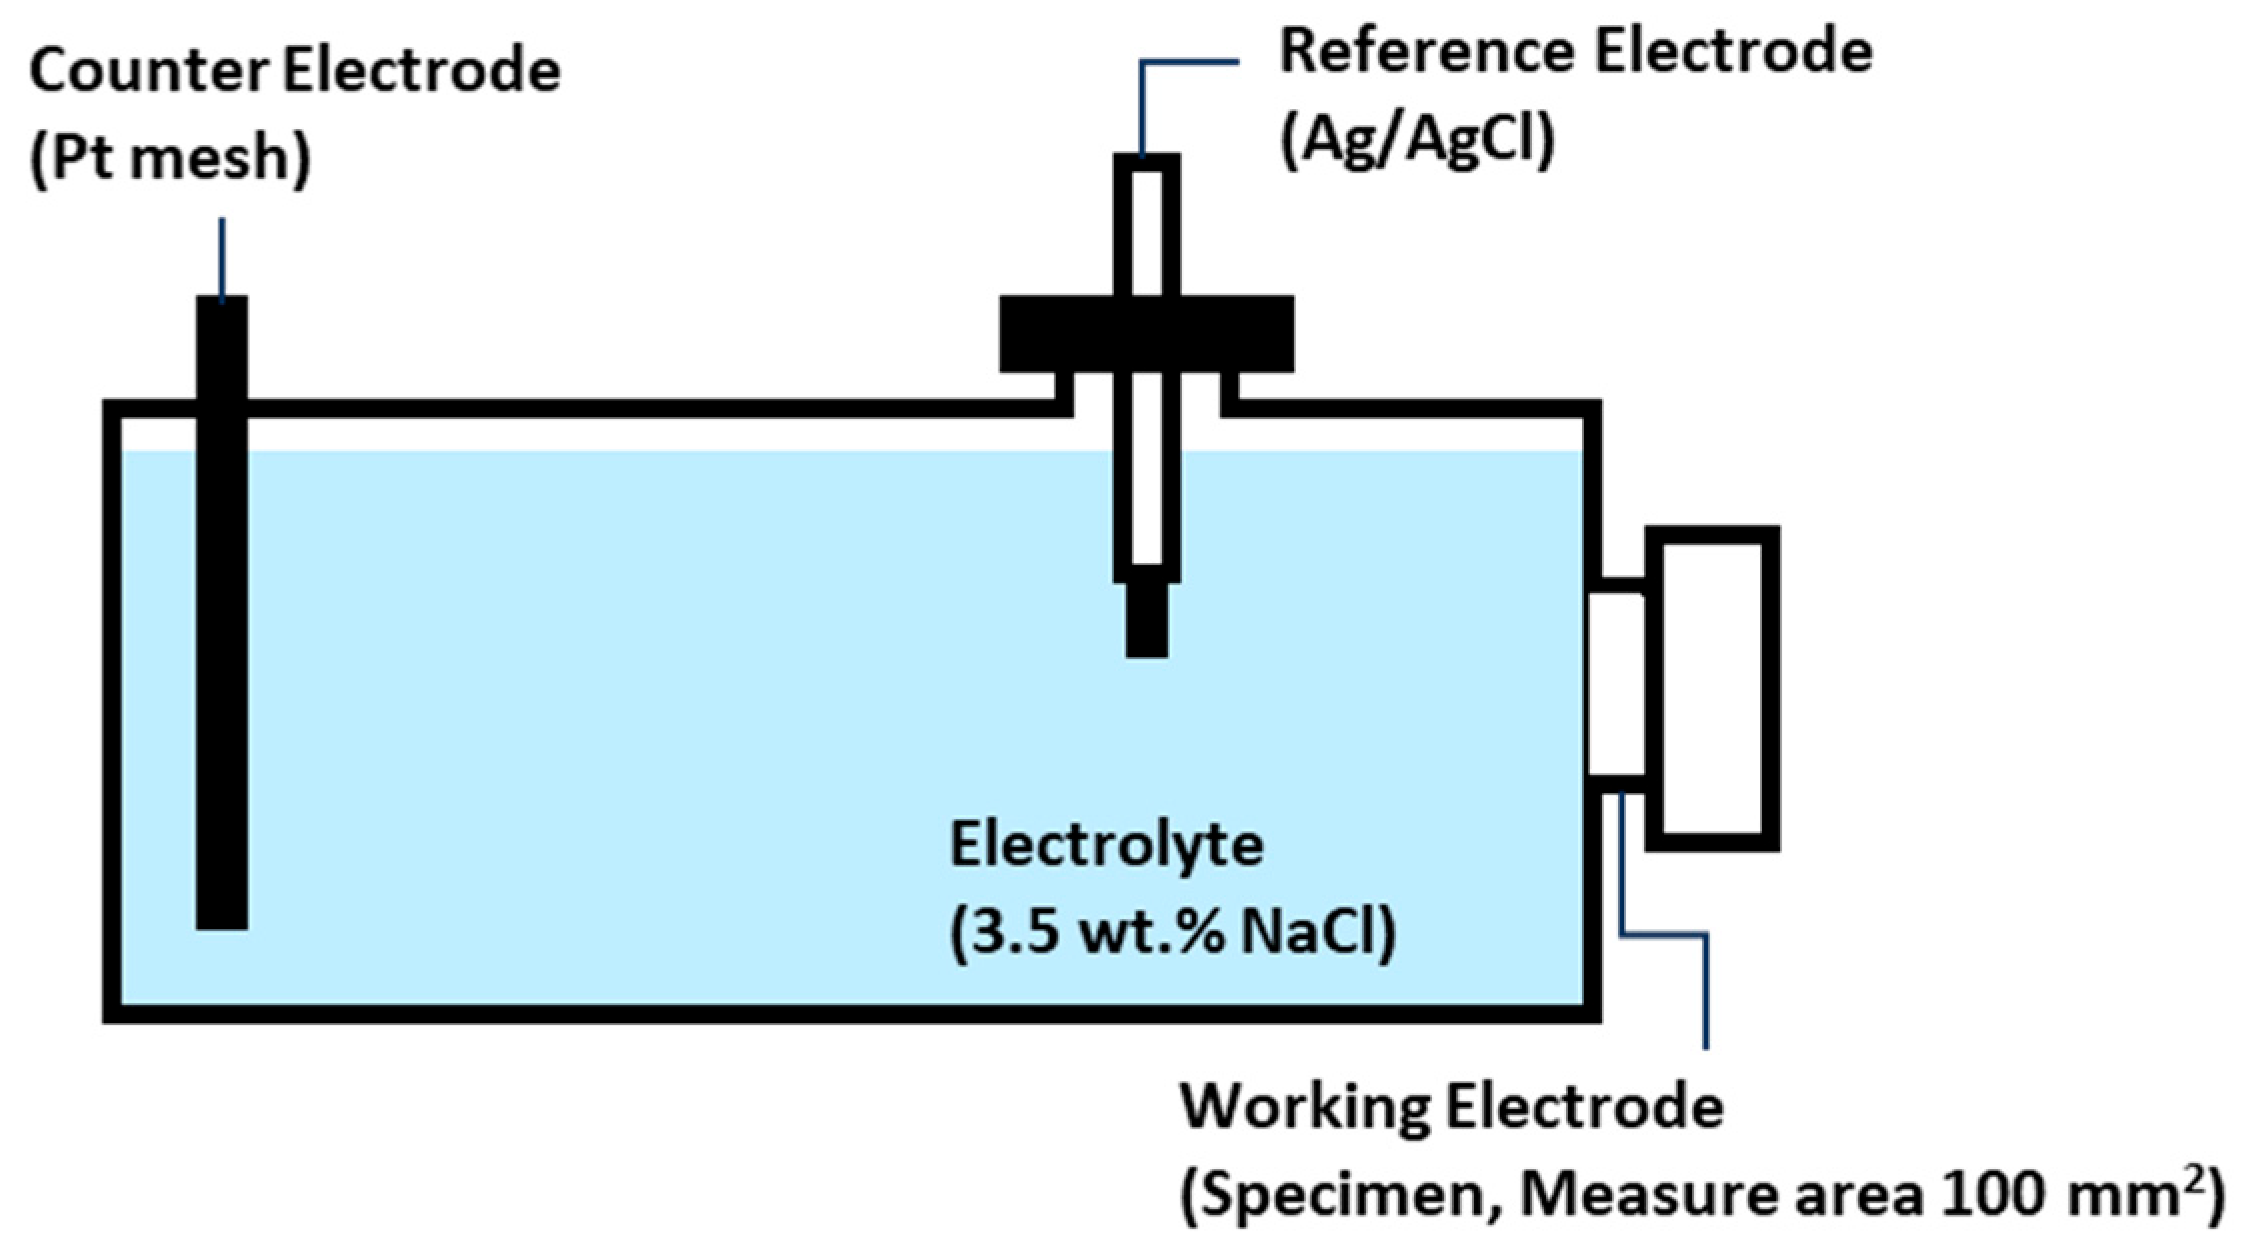
3.2. Corrosion Behavior

Figure 11 and Figure 12 illustrate the polarization curve and corrosion rate, respectively, for the CTWD. In the polarization curve, at a CTWD of 7 mm, the corrosion potential was lower and the corrosion current was higher than those of the base metal. However, the passivation region and potential for pitting corrosion were similar to or higher than those of the base metal, as well as compared to the other CTWD cases. This is because the formation of a columnar structure owing to the GTAW process leads to a rapid diffusion rate of Cr, resulting in the expedited formation of the passivation film. However, as the voltage subsequently increased, the current rapidly increased, leading to breakage of the passive film. For the CTWD 5 mm specimen, the corrosion potential was higher and the corrosion current was lower than those of the base metal, indicating a higher corrosion resistance. Furthermore, the increase in current following the voltage increase after the pitting potential was slower than that in the base metal and CTWD cases. This was due to the rapid formation of the passivation film facilitated by the characteristics of the surface region and the high diffusion rate of Cr. These characteristics influence the corrosion rate calculated by the corrosion current and are similarly evaluated in the corrosion rate according to ASTM A262 practice C, which is determined based on the weight loss after immersion in nitric acid. In the CTWD of 7 mm, although the ferrite content was relatively low, the higher content of the columnar structure and the influence of the grain size at the surface delayed the initiation of pitting.
However, in the CTWD 7 mm case, a relatively deep bead shape was observed, and a wide area of the columnar structure was formed along the heat transfer direction during solidification. Therefore, it is assumed that the diffusion of Cr was accelerated along the directional columnar structure. Compared to the fine grains in the surface region, the columnar structure has a higher density of grain boundaries, which likely resulted in faster corrosion progression.

4. Conclusions

This study investigated the effects of different contact tip-to-work distances (CTWDs) on the microstructure, mechanical properties, and corrosion resistance of 316L stainless steel surface heat treatment using the GTAW process. The shape of the fusion zone was significantly influenced by the CTWD. A CTWD of 3 mm resulted in a narrower and shallower fusion zone, while a CTWD of 7 mm led to deeper penetration and a more defined fingertip shape. The optimal CTWD of 5 mm provided a balanced fusion zone with adequate width and depth, beneficial for corrosion resistance. The microstructural analysis revealed that the ferrite content decreased with the increasing CTWD, which corresponded to a decrease in hardness. The corrosion tests showed that a CTWD of 5 mm provided the highest corrosion resistance. This was attributed to the optimal distribution of ferrite and the formation of a stable passivation film and structures of equiaxed fine grain in the surface region. In contrast, a CTWD of 7 mm, despite deeper penetration, exhibited higher corrosion rates due to the penetration depth of the fusion zone and columnar structure formation.
The most interesting effect of the GTAW melting process in this study is the clear demonstration that an optimal CTWD of 5 mm enhances the corrosion resistance of 316L stainless steel. This finding is crucial for industrial applications where corrosion resistance is paramount. The results underscore the importance of precise control over the welding parameters to achieve the desired material properties, thereby providing valuable insights for the optimization of welding processes in various engineering applications. By optimizing the CTWD, it is possible to significantly improve the performance and durability of welded structures, making this a critical consideration for the development of high-performance materials and surface treatment methods in corrosive environments.

Author Contributions

Writing—original draft, data curation, investigation, and formal analysis, I.S. (co-first author); writing—review and editing, methodology, and validation, G.-H.J. (co-first author); visualization and formal analysis, S.-K.K.; validation and investigation D.K.; conceptualization and methodology, Y.-H.K.; conceptualization, data curation, and formal analysis, A.B.M.; methodology and validation, H.P.; visualization and methodology, T.-K.P.; project administration, funding acquisition, conceptualization, and supervision, D.-W.C. All authors have read and agreed to the published version of the manuscript.

Funding

This work was supported by the Korea Institute of Machinery and Materials (KIMM, NK250C) and LIG NEX1.

Data Availability Statement

Data are contained within the article.

Conflicts of Interest

Authors Ducklae Kim and Hyunwoo Park were employed by the company LIG Nex1. The remaining authors declare that the research was conducted in the absence of any commercial or financial relationships that could be construed as a potential conflict of interest. The authors declare that this study received funding from company LIG Nex1. The funder was not involved in the study design, collection, analysis, interpretation of data, the writing of this article or the decision to submit it for publication.

References

  1. Li, S.; Wang, Y.; Wang, H.; Xin, C.; Wang, X. Effects of long-term thermal aging on the stress corrosion cracking behavior of cast austenitic stainless steels in simulated PWR primary water. J. Nucl. Mater. 2016, 469, 262–268. [Google Scholar] [CrossRef]
  2. Nuthalapati, S.; Kee, K.; Pedapati, S.R.; Jumbri, K. A review of chloride induced stress corrosion cracking characterization in austenitic stainless steels using acoustic emission technique. Nucl. Eng. Technol. 2024, 56, 688–706. [Google Scholar] [CrossRef]
  3. Ji, C.; Huang, H.; Sun, J.; Chen, P. Experiment and simulation research on bonding mechanism of bimetallic clad pipes fabricated by solid-liquid cast-rolling bonding (SLCRB) process. J. Manuf. Process. 2018, 34, 593–602. [Google Scholar] [CrossRef]
  4. Klenam, D.; McBagonluri, F.; Bamisaye, O.; Asumadu, T.; Ankah, N.; Bodunrin, M.; Andrews, A.; Soboyejo, W. Corrosion resistant materials in high-pressure high-temperature oil wells: An overview and potential application of complex concentrated alloys. Eng. Fail. Anal. 2024, 157, 107920. [Google Scholar] [CrossRef]
  5. Li, D.; Liu, Q.; Wang, W.; Jin, L.; Xiao, H. Corrosion Behavior of AISI 316L Stainless Steel Used as Inner Lining of Bimetallic Pipe in a Seawater Environment. Materials 2021, 14, 1539. [Google Scholar] [CrossRef] [PubMed]
  6. Kim, S.-J.; Lee, S.-J.; Chong, S.-O. Electrochemical characteristics under cavitation-erosion for STS 316L in seawater. Mater. Res. Bull. 2014, 58, 244–247. [Google Scholar] [CrossRef]
  7. Vignal, V.; Voltz, C.; Thiébaut, S.; Demésy, M.; Heintz, O.; Guerraz, S. Pitting Corrosion of Type 316L Stainless Steel Elaborated by the Selective Laser Melting Method: Influence of Microstructure. J. Mater. Eng. Perform. 2021, 30, 5050–5058. [Google Scholar] [CrossRef]
  8. Ren, Z.; Ernst, F. Stress–Corrosion Cracking of AISI 316L Stainless Steel in Seawater Environments: Effect of Surface Machining. Metals 2020, 10, 1324. [Google Scholar] [CrossRef]
  9. Cai, B.; Liu, Y.; Tian, X.; Wang, F.; Li, H.; Ji, R. An experimental study of crevice corrosion behaviour of 316L stainless steel in artificial seawater. Corros. Sci. 2010, 52, 3235–3242. [Google Scholar] [CrossRef]
  10. Li, S.-X.; He, Y.-N.; Yu, S.-R.; Zhang, P.-Y. Evaluation of the effect of grain size on chromium carbide precipitation and intergranular corrosion of 316L stainless steel. Corros. Sci. 2013, 66, 211–216. [Google Scholar] [CrossRef]
  11. Malhotra, D.; Shahi, A.S.; Gupta, K. Effect of GTAW remelting on the corrosion performance of AISI 316L cladding. Mater. Corros. 2021, 72, 141–153. [Google Scholar] [CrossRef]
  12. Brytan, Z.; Bonek, M.; Dobrzański, L.A.; Ugues, D.; Grande, M.A. The Laser Surface Remelting of Austenitic Stainless Steel. Mater. Sci. Forum 2010, 654–656, 2511–2514. [Google Scholar] [CrossRef]
  13. Kwok, C.; Lo, K.; Chan, W.; Cheng, F.; Man, H. Effect of laser surface melting on intergranular corrosion behaviour of aged austenitic and duplex stainless steels. Corros. Sci. 2011, 53, 1581–1591. [Google Scholar] [CrossRef]
  14. Panmongkol, P.; Phung-On, I. Effect of backing gas mixtures on corrosion properties of stainless steel grade 304 weld metal by autogenous GTAW. J. Mater. Res. Technol. 2021, 11, 1559–1570. [Google Scholar] [CrossRef]
  15. Ishida, T. Formation of stainless steel layer on mild steel by welding arc cladding. J. Mater. Sci. 1991, 26, 6431–6435. [Google Scholar] [CrossRef]
  16. Khara, B.; Mandal, N.D.; Sarkar, A.; Sarkar, M.; Chakrabarti, B.; Das, S. Weld cladding with austenitic stainless steel for imparting corrosion resistance. Indian Weld. J. 2016, 49, 74. [Google Scholar] [CrossRef]
  17. Kumar, A.; Chopkar, M.K.; Verma, J.; Taiwade, R.V.; Tandon, V.; Shukla, S. Effect of filler and autogenous TIG welding on microstructure, mechanical properties and corrosion resistance of nitronic 50 stainless steel. Mater. Res. Express 2018, 6, 026557. [Google Scholar] [CrossRef]
  18. Pujari, K.; Patil, D.; Mewundi, G. Selection of GTAW process parameter and optimizing the weld pool geometry for AA 7075-T6 Aluminium alloy. Mater. Today Proc. 2018, 5, 25045–25055. [Google Scholar] [CrossRef]
  19. Streicher, M.A. Corrosion Tests and Standards—Application and Interpretation, 2nd ed.; Baboian, R., Ed.; ASTM: West Conshohocken, PA, USA, 2005; p. 257. [Google Scholar]
  20. Baghel, A.; Sharma, C.; Upadhyay, V.; Singh, R. Optimization of process parameters for autogenous TIG welding of austenitic stainless-steel SS-304. Int. J. Interact. Des. Manuf. 2023, 1–15. [Google Scholar] [CrossRef]
  21. Baskoro, A.S.; Widyianto, A.; Prasetyo, E.; Kiswanto, G. The Taguchi and Response Surface Method for Optimizing Orbital Pipe Welding Parameters in Pulsed Current Gas Tungsten Arc Welding (PC-GTAW) for SS316L. Trans. Indian Inst. Met. 2024, 77, 1607–1620. [Google Scholar] [CrossRef]
  22. Moghaddam, M.A.; Kolahan, F. Modeling and optimization of A-GTAW process using back propagation neural network and heuristic algorithms. Int. J. Press. Vessels Pip. 2021, 194, 104531. [Google Scholar] [CrossRef]
  23. ASTM A262; Stand Practices for Detecting Susceptibility to Intergranular Attack in Austenitic Stainless Steels. American Society for Testing and Materials (ASTM International): West Conshohocken, PA, USA, 2014.
  24. Cho, D.; Lee, S.; Na, S. Characterization of welding arc and weld pool formation in vacuum gas hollow tungsten arc welding. J. Mater. Process. Technol. 2012, 213, 143–152. [Google Scholar] [CrossRef]
  25. Guo, S.; Xu, J.; Gu, J.; Peng, Y.; Zhou, Q.; Wang, K. Effect of cellular structure on the mechanical properties of 316L stainless steel fabricated by EBF3. J. Mater. Res. Technol. 2023, 25, 5469–5482. [Google Scholar] [CrossRef]
  26. Morozova, I.; Kehm, C.; Obrosov, A.; Yang, Y.; Miah, K.U.M.; Uludintceva, E.; Fritzsche, S.; Weiß, S.; Michailov, V. On the Heat Treatment of Selective-Laser-Melted 316L. J. Mater. Eng. Perform. 2023, 32, 4295–4305. [Google Scholar] [CrossRef]
  27. Park, J.-H.; Kim, S.-H.; Moon, H.-S.; Kim, M.-H.; Cho, D.-W. Effect of process parameters on root pass welding and analysis of microstructure in V-groove pulsed gas metal arc welding for mild steel. Int. J. Adv. Manuf. Technol. 2020, 109, 1969–1985. [Google Scholar] [CrossRef]
  28. Kiran, D.V.; Cho, D.-W.; Lee, H.-K.; Kang, C.Y.; Na, S.-J. A study on the quality of two-wire tandem submerged arc welds under iso-heat input conditions. Int. J. Adv. Manuf. Technol. 2014, 78, 53–62. [Google Scholar] [CrossRef]
  29. Kovitya, P.; Cram, L.E. A two-dimensional model of gas-tungsten welding arcs. Weld. J. 1986, 65, 34–39. [Google Scholar]
  30. Nestor, O.H. Heat intensity and current density distributions at the anode of high current, inert gas arcs. J. Appl. Phys. 1962, 33, 1638–1648. [Google Scholar] [CrossRef]
  31. Kujanp, V.; Suutala, N.; Takalo, T.; Moisio, T. Correlation Between Solidification Cracking and Microstructure in Austenitic and Austenitic-Ferritic Stainless Steel. Weld. Res. Int. 1979, 9, 55–76. [Google Scholar]
  32. Brooks, J.A.; Goods, S.H.; Robino, C.V. Weld properties of AISI 303 free-machining stainless steel. Weld. J. 2003, 82, 84-S. [Google Scholar]
  33. Kotecki, D.J.; Siewert, T.A. WRC-1992 Constitution Diagram for Stainless Steel Weld Metals: A Modification of the WRC-1988 Diagram. Weld. J. 1992, 71, 171s–178s. [Google Scholar]
Figure 1. Schematic diagram of experimental setup.
Processes 12 01757 g001
Figure 2. Schematic diagram of electrochemical cell.
Processes 12 01757 g002
Figure 3. Arc plasma shape during GTAW process at CTWD of 3, 5, and 7 mm.
Processes 12 01757 g003
Figure 4. Arc distribution analysis using gray-level image of arc plasma shape.
Processes 12 01757 g004
Figure 5. Fusion zone at CTWD (a) 3 mm, (b) 5 mm, and (c) 7 mm.
Processes 12 01757 g005
Figure 6. Surface region of CTWD (a) 3 mm, (b) 5 mm, and (c) 7 mm and columnar structure of CTWD (d) 3 mm, (e) 5 mm, and (f) 7 mm.
Processes 12 01757 g006
Figure 7. Area fraction of delta ferrite of CTWD 3, 5, and 7 mm at surface region and columnar structure.
Processes 12 01757 g007
Figure 8. Vickers hardness of columnar structure, fine grain region, and surface.
Processes 12 01757 g008
Figure 9. Solidification modes and phases transformations in stainless steel [31,32].
Processes 12 01757 g009
Figure 10. WRC-1992 diagram [33].
Processes 12 01757 g010
Figure 11. Potentiodynamic polarization curve of net welded area of the base metal and welded specimen.
Processes 12 01757 g011
Figure 12. Corrosion rate of the net welded area of the base metal and welded specimen, calculated by weight loss from ASTM A262 practice C and corrosion current from polarization curve.
Processes 12 01757 g012
Table 1. The chemical composition of AISI-type stainless steel 316L (wt.%).
ElementFeCrNiMoCMnPSSiCuNNb
Composition (wt.%)Bal.18.211.52.500.01801.840.0200.01600.6900.1600.06750.032
Table 2. Parameters for the GTAW setup.
ParametersValue
Set current135 A
Shielding gasArgon 100%, 20 L/min
Welding speed5 mm/s
Tungsten electrode60-degree tip angle, 3.2 mm diameter
Contact tip to work distance3, 5, and 7 mm
Table 3. Measured current and voltage during GTAW process.
CasesVoltage (V)Current (A)Calculated Heat
Input (J/mm)
CTWD 3 mm115.914.0019,771
CTWD 5 mm135.216.3426,510
CTWD 7 mm146.917.7031,202
Table 4. Fusion zone shape under GTAW process at CTWD 3, 5, and 7 mm.
CTWD 3 mmCTWD 5 mmCTWD 7 mm
Bead width (mm)6.687.794.91
Maximum penetration depth (mm)1.141.041.48
Disclaimer/Publisher’s Note: The statements, opinions and data contained in all publications are solely those of the individual author(s) and contributor(s) and not of MDPI and/or the editor(s). MDPI and/or the editor(s) disclaim responsibility for any injury to people or property resulting from any ideas, methods, instructions or products referred to in the content.

