Article

Establishment and Research of Cotton Stalk Moisture Content–Discrete Element Parameter Model Based on Multiple Verification

1
College of Mechanical and Electrical Engineering, Shihezi University, Shihezi 832000, China
2
Key Laboratory of Northwest Agricultural Equipment, Ministry of Agriculture and Rural Affairs, Shihezi 832000, China
*
Author to whom correspondence should be addressed.
Processes 2024, 12(8), 1770; https://doi.org/10.3390/pr12081770
Submission received: 15 July 2024 / Revised: 9 August 2024 / Accepted: 20 August 2024 / Published: 21 August 2024
(This article belongs to the Section Process Control and Monitoring)

Abstract

:
In view of the large difference in moisture content of cotton stalk in autumn in Xinjiang, the existing process of obtaining discrete element simulation parameters of cotton stalk is low in accuracy and complicated in operation, leading to the problems of poor universality and low accuracy in regard to the discrete element simulation parameter-calibration method in the process of mechanized transportation, throwing and returning to the field. Therefore, the experimental study on cotton stalk with different moisture content was carried out with the accumulation angle as the response value, so as to construct a parameter model that can quickly and accurately calibrate cotton stalk with different levels of moisture content. The model has high applicability and flexibility, and it can be widely used in the simulation test of various cotton field-operation machinery, such as a residual film-recycling machine, cotton picker, crushing and returning machine and other equipment. The water content–accumulation angle model was established by the cylinder-lifting method, and the correlation coefficient of the model was 0.9993. Based on EDEM 2020 software, the Hertz–Mindlin model was used to simulate the stacking angle of cotton stalk, and the rolling friction coefficient, static friction coefficient and collision recovery coefficient between cotton stalk and cotton stalk–steel were obtained. Through the Plackett–Burman test, climbing test and Box–Behnken test, three significant parameters, namely the rolling friction coefficient, static friction coefficient and static friction coefficient between cotton stalk and steel, were selected from discrete element simulation parameters to characterize the moisture content of cotton stalk, and the accumulation angle–discrete element parameter model was established. The p-value of the model was less than 0.0001, and the relative error was only 2.67%. Based on the moisture content–stacking angle model and the stacking angle–discrete element parameter model, the moisture content–discrete element parameter model was constructed. The model was verified by the cylinder-lifting method and the plate-drawing method, and the relative error was only 2.79%. Finally, the model was further verified by comparing the effect of the throwing uniformity between the mechanical simulation test and field test, and the relative error was only 4.75%. The test proves that the moisture content–discrete element parameter model is accurate and reliable, not only providing the design basis and support for the mechanization research of cotton stalk conveying and returning to the field in Xinjiang but also providing ideas for the calibration of discrete element simulation parameters of other crop straws.

1. Introduction

Xinjiang, as the main production area of cotton, national high-quality cotton production base, cotton planting area, yield, yield and other indicators for many years, ranked first in the country. The sown area increased from 1749.7 thousand hectares in 2011 to 2369.3 thousand hectares in 2023, accounting for the proportion of the country’s total sown area from 38.7% to 84.98% [1]. With the large-scale planting of cotton, the yield of cotton stalk has also increased year by year. Cotton stalk is an important renewable organic resource. The direct return of cotton stalk to the field is the most important and effective means of straw recycling, and it also meets the requirements of conservation tillage [2,3,4,5].
The mechanization of cotton stalk returning to field has become the main technical means and method of cotton stalk returning to field. The cotton stalk-crushing and -returning machine is an important instrument for directly crushing and returning cotton stalk to the field. At present, the discrete element method can be used to analyze the complex interaction between cotton stalk and cotton stalk and device to design or optimize the cotton stalk-crushing and -returning machine, which can save the research and development cost, shorten the research and development cycle and improve the performance of the machine [6,7]. The application of the discrete element method is based on the premise of accurate discrete element parameters. Many domestic scholars have calibrated the discrete element simulation parameters of rice straw [8,9], wheat straw [10], corn straw [11], banana straw [12], etc., but the discrete element parameters of cotton straw are less calibrated. Zhang Ximei et al. [13] calibrated the discrete element parameters of cotton straw under a specific moisture content and obtained a set of discrete element simulation parameters under the moisture content. Zhang Bingcheng et al. [14] used the angle of repose of cotton stalk-cutting particles as the response value to calibrate the contact parameters between particles and established a response model between the contact parameters and the angle of repose, but the moisture content of the cotton stalk was 22.03~36.16%. In practice, the moisture content range of cotton stalk is large, so the universality of this method is insufficient. Liang Rongqing et al. [15] established a second-order response model between the contact parameters and the angle of repose and compared the error between the physical stacking angle under different moisture content and the simulated stacking angle obtained by the second-order response model to verify that the second-order response model can be used to calibrate the contact parameters of cotton stalks with different moisture content. Although the above research takes into account the influence of moisture content on the discrete element parameters of cotton stalk, there are the following shortcomings: the measurement error of cotton stalk stacking angle is large, the measurement error of moisture content is small, and the response model between moisture content and discrete element parameters is not constructed; in the study, only a single cotton stalk particle model was established, which was quite different from the cotton stalk particles in the actual machinery.
Therefore, in view of the difference of discrete element parameters of cotton stalk under different levels of moisture content, this paper takes the cotton stalk after autumn harvest in Xinjiang with a moisture content of 25~55% as the research object and establishes the moisture content–accumulation angle model of cotton stalk by the cylinder lifting method [13,16]. Taking the stacking angle as the response value, the Plackett–Burman experimental design was used to screen the factors, and the optimal factor level range was determined by the climbing test. The Box–Behnken experimental design was used to optimize and establish the mathematical model between the stacking angle and the discrete element simulation parameters. Subsequently, based on this model, the correlation model between cotton stalk moisture content and discrete element simulation parameters was derived and established. In order to ensure the accuracy of the model, two experimental methods, the cylinder-lifting method and plate extraction method [17,18], were used for verification. Finally, the effect of the spreading uniformity of cotton stalks with different moisture contents was compared and analyzed by mechanical simulation test and field actual spreading test. The purpose of this study is to construct a general and practical calibration method of cotton stalk discrete element parameters; that is, to construct a parameter model that can quickly and accurately calibrate cotton stalks with different moisture contents and to provide theoretical support and technical guidance for the mechanized transportation and throwing of cotton stalks in autumn in Xinjiang.

2. Materials and Methods

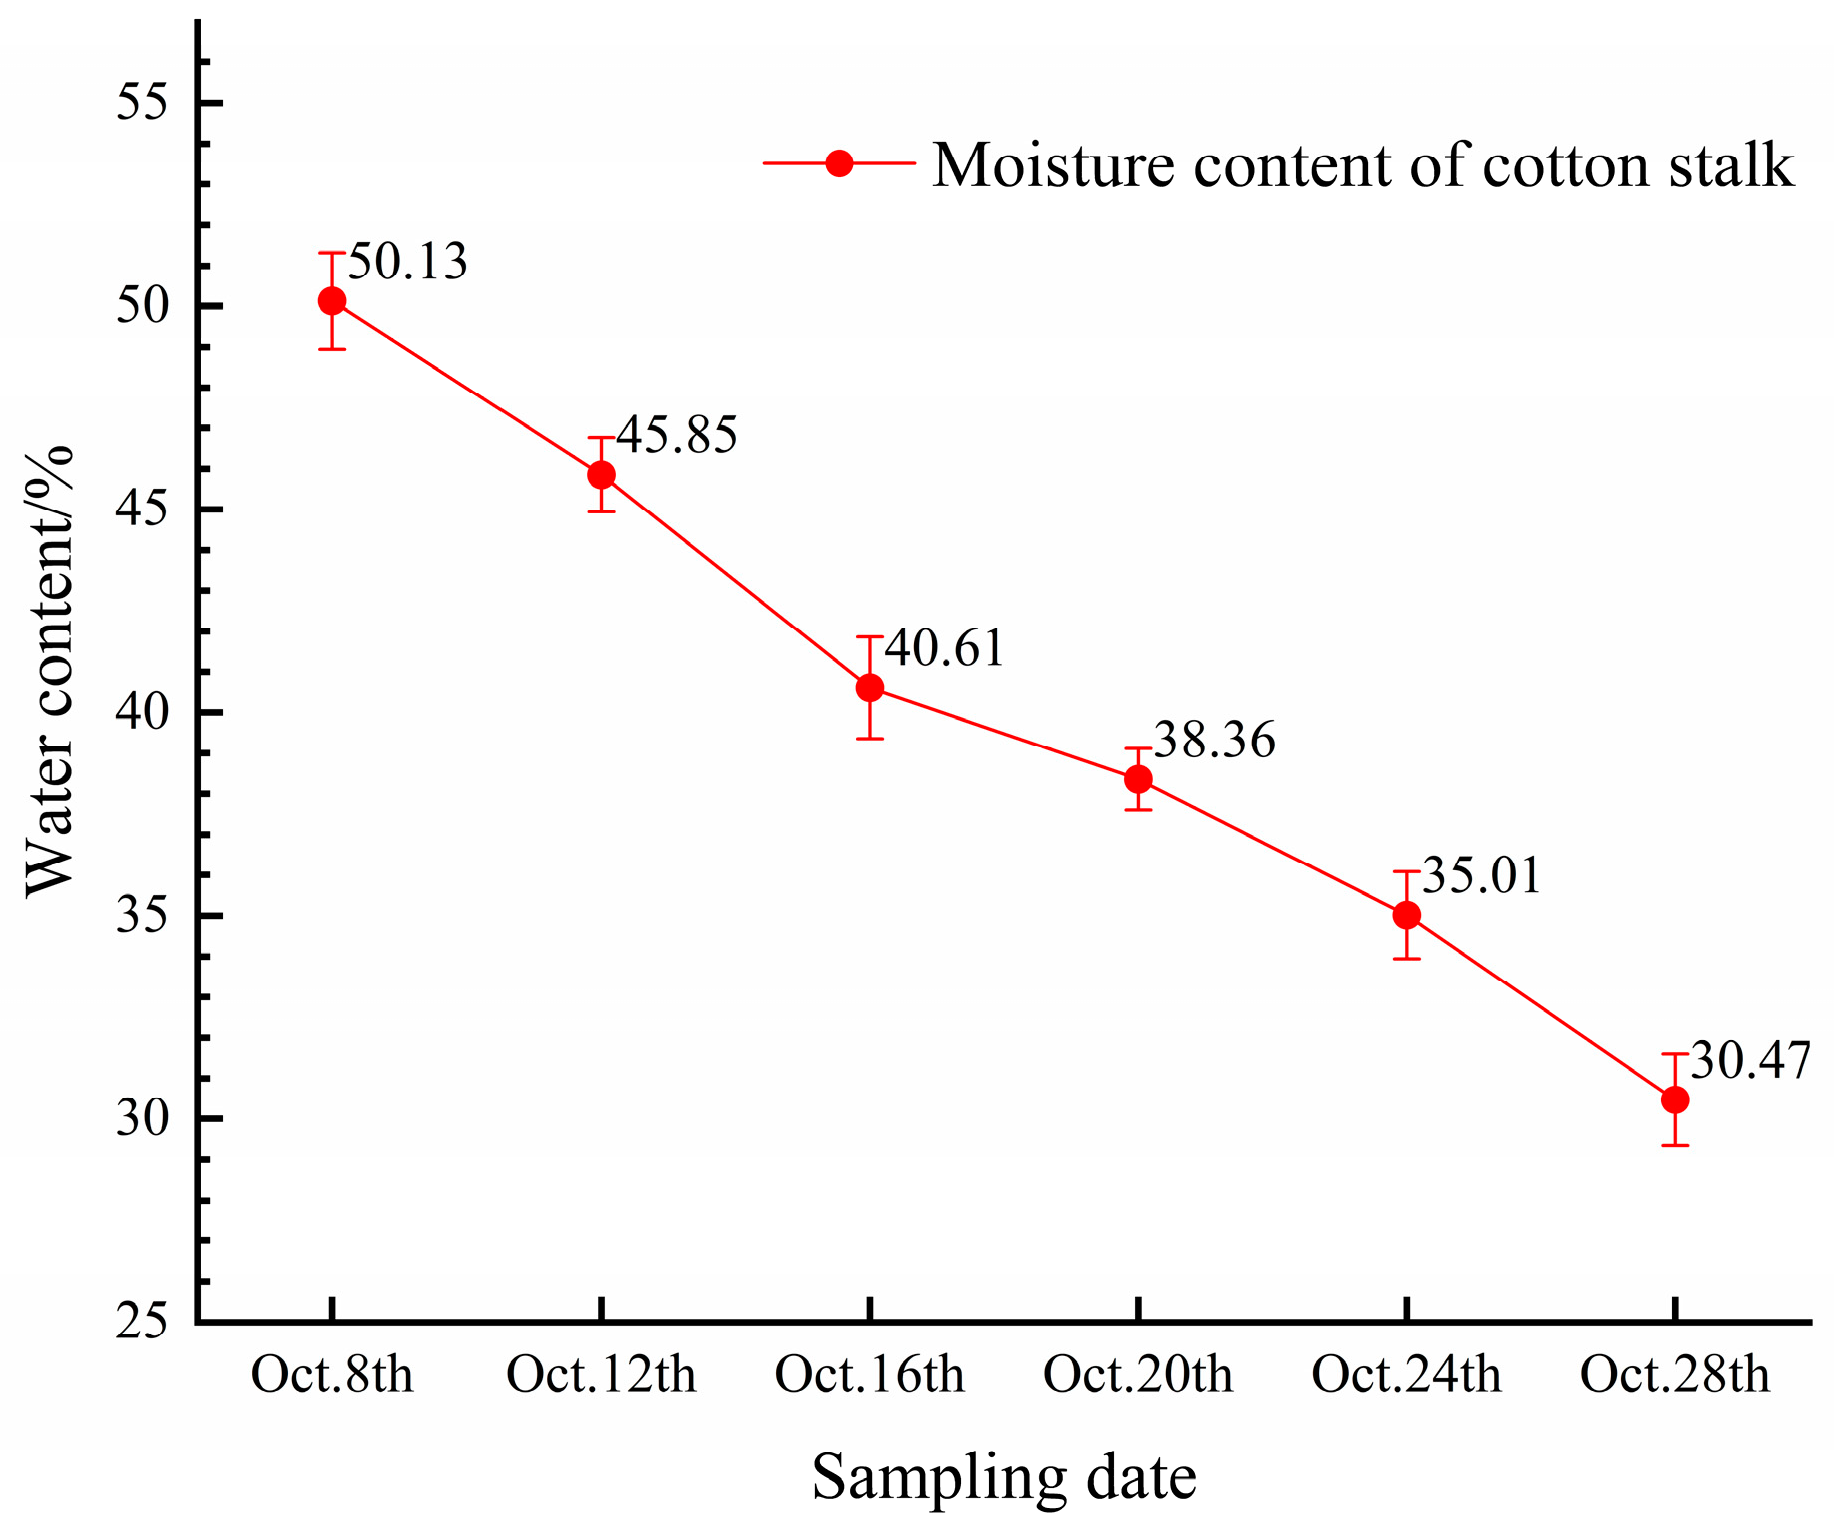
2.1. Testing Material

The cotton stalk in this experiment was taken from the second branch of the 145th Regiment in Shihezi City, Xinjiang. In order to obtain the moisture content range of cotton stalk in autumn, the samples were taken from the sampling points once every three days, from 8 October to 28 October, a total of six times. According to the large distribution area of cotton stalk, the uniform distribution of cotton stalk and the elimination of errors caused by accidental factors, the five-point sampling method was used for sampling. Six cotton stalks were taken from each measuring point. The wet weight and dry weight of the cotton stalks in each measuring point were taken, respectively; the moisture content of the cotton stalks was measured; and the mean value was taken [19]. The calculation formula of cotton stalk moisture content is as follows:
H j = M j s M j g M j g × 100 %
In the formula:
  • Hj—cotton stalk moisture content, %;
  • Mjs—sample cotton stalk wet weight, g;
  • Mjg—sample cotton stalk dry weight, g.
Before measuring the moisture content of cotton stalk, the diameter of cotton stalk was measured. The middle part of 450 mm away from the root of cotton stalk was taken as the test material, and the average diameter of cotton stalk was 10.29 mm. As shown in Figure 1, the moisture content of cotton stalk in Xinjiang in autumn was calculated to be 25~55%. Therefore, five moisture content gradients were prepared by a natural air-drying method and adding pure water in the moisture content range of cotton stalk (25~55%) in this stacking angle test [17]. After the measurement of the moisture content of the cotton stalk was completed, the accumulation angle test of the cotton stalk was carried out. The moisture content of the five groups of the accumulation angle test was 52.13%, 46.79%, 39.61%, 32.01% and 26.47%, respectively.

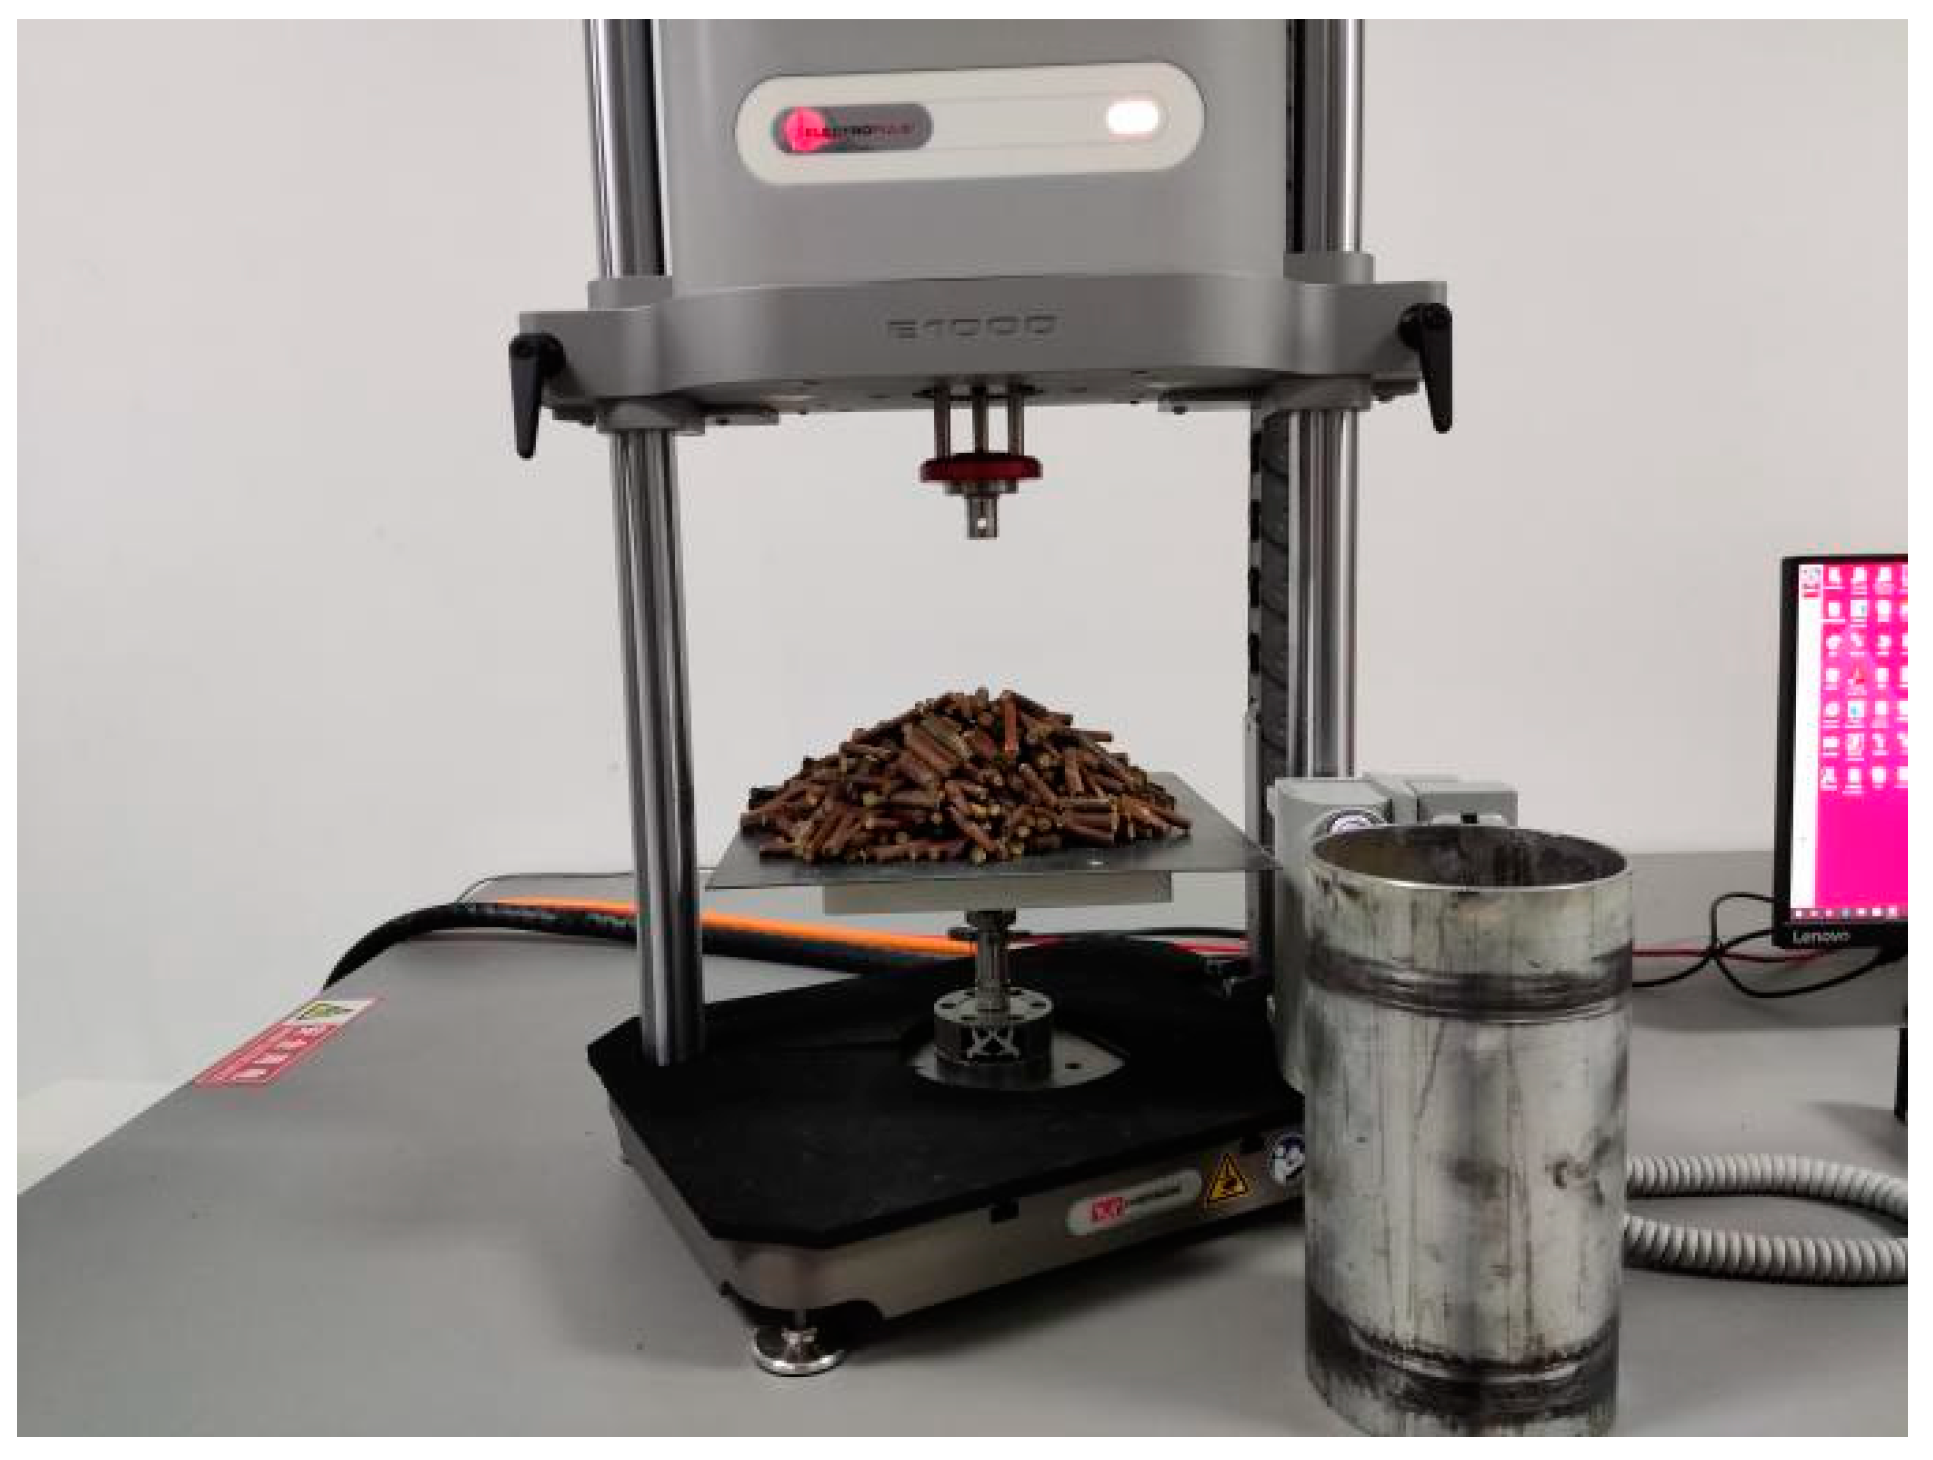
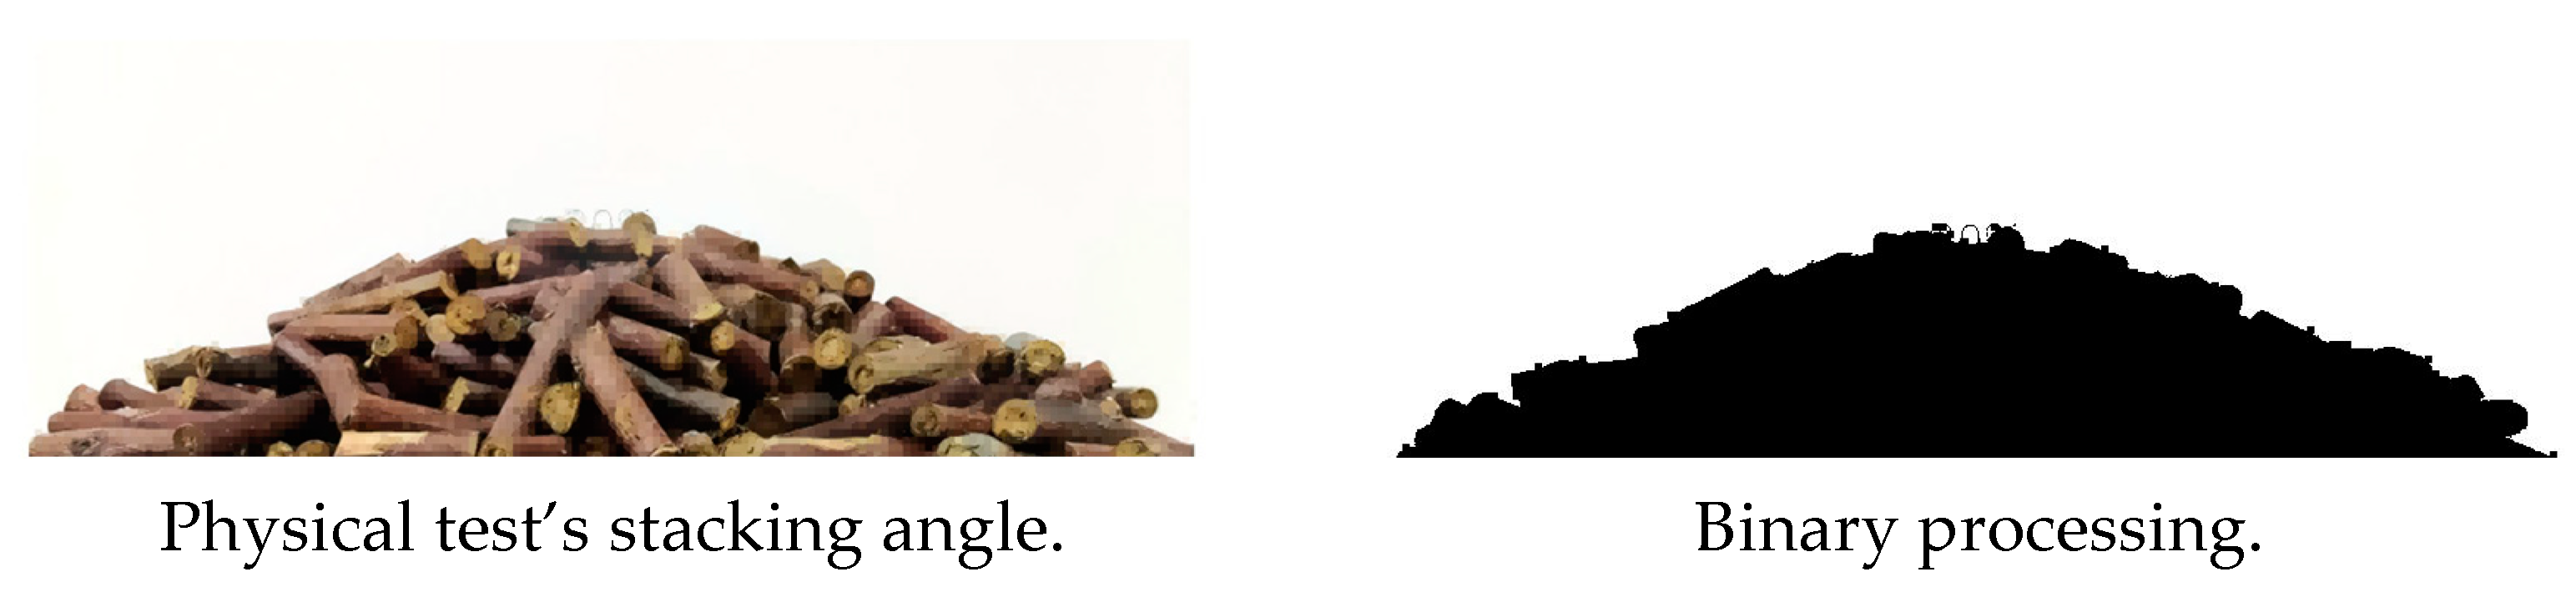
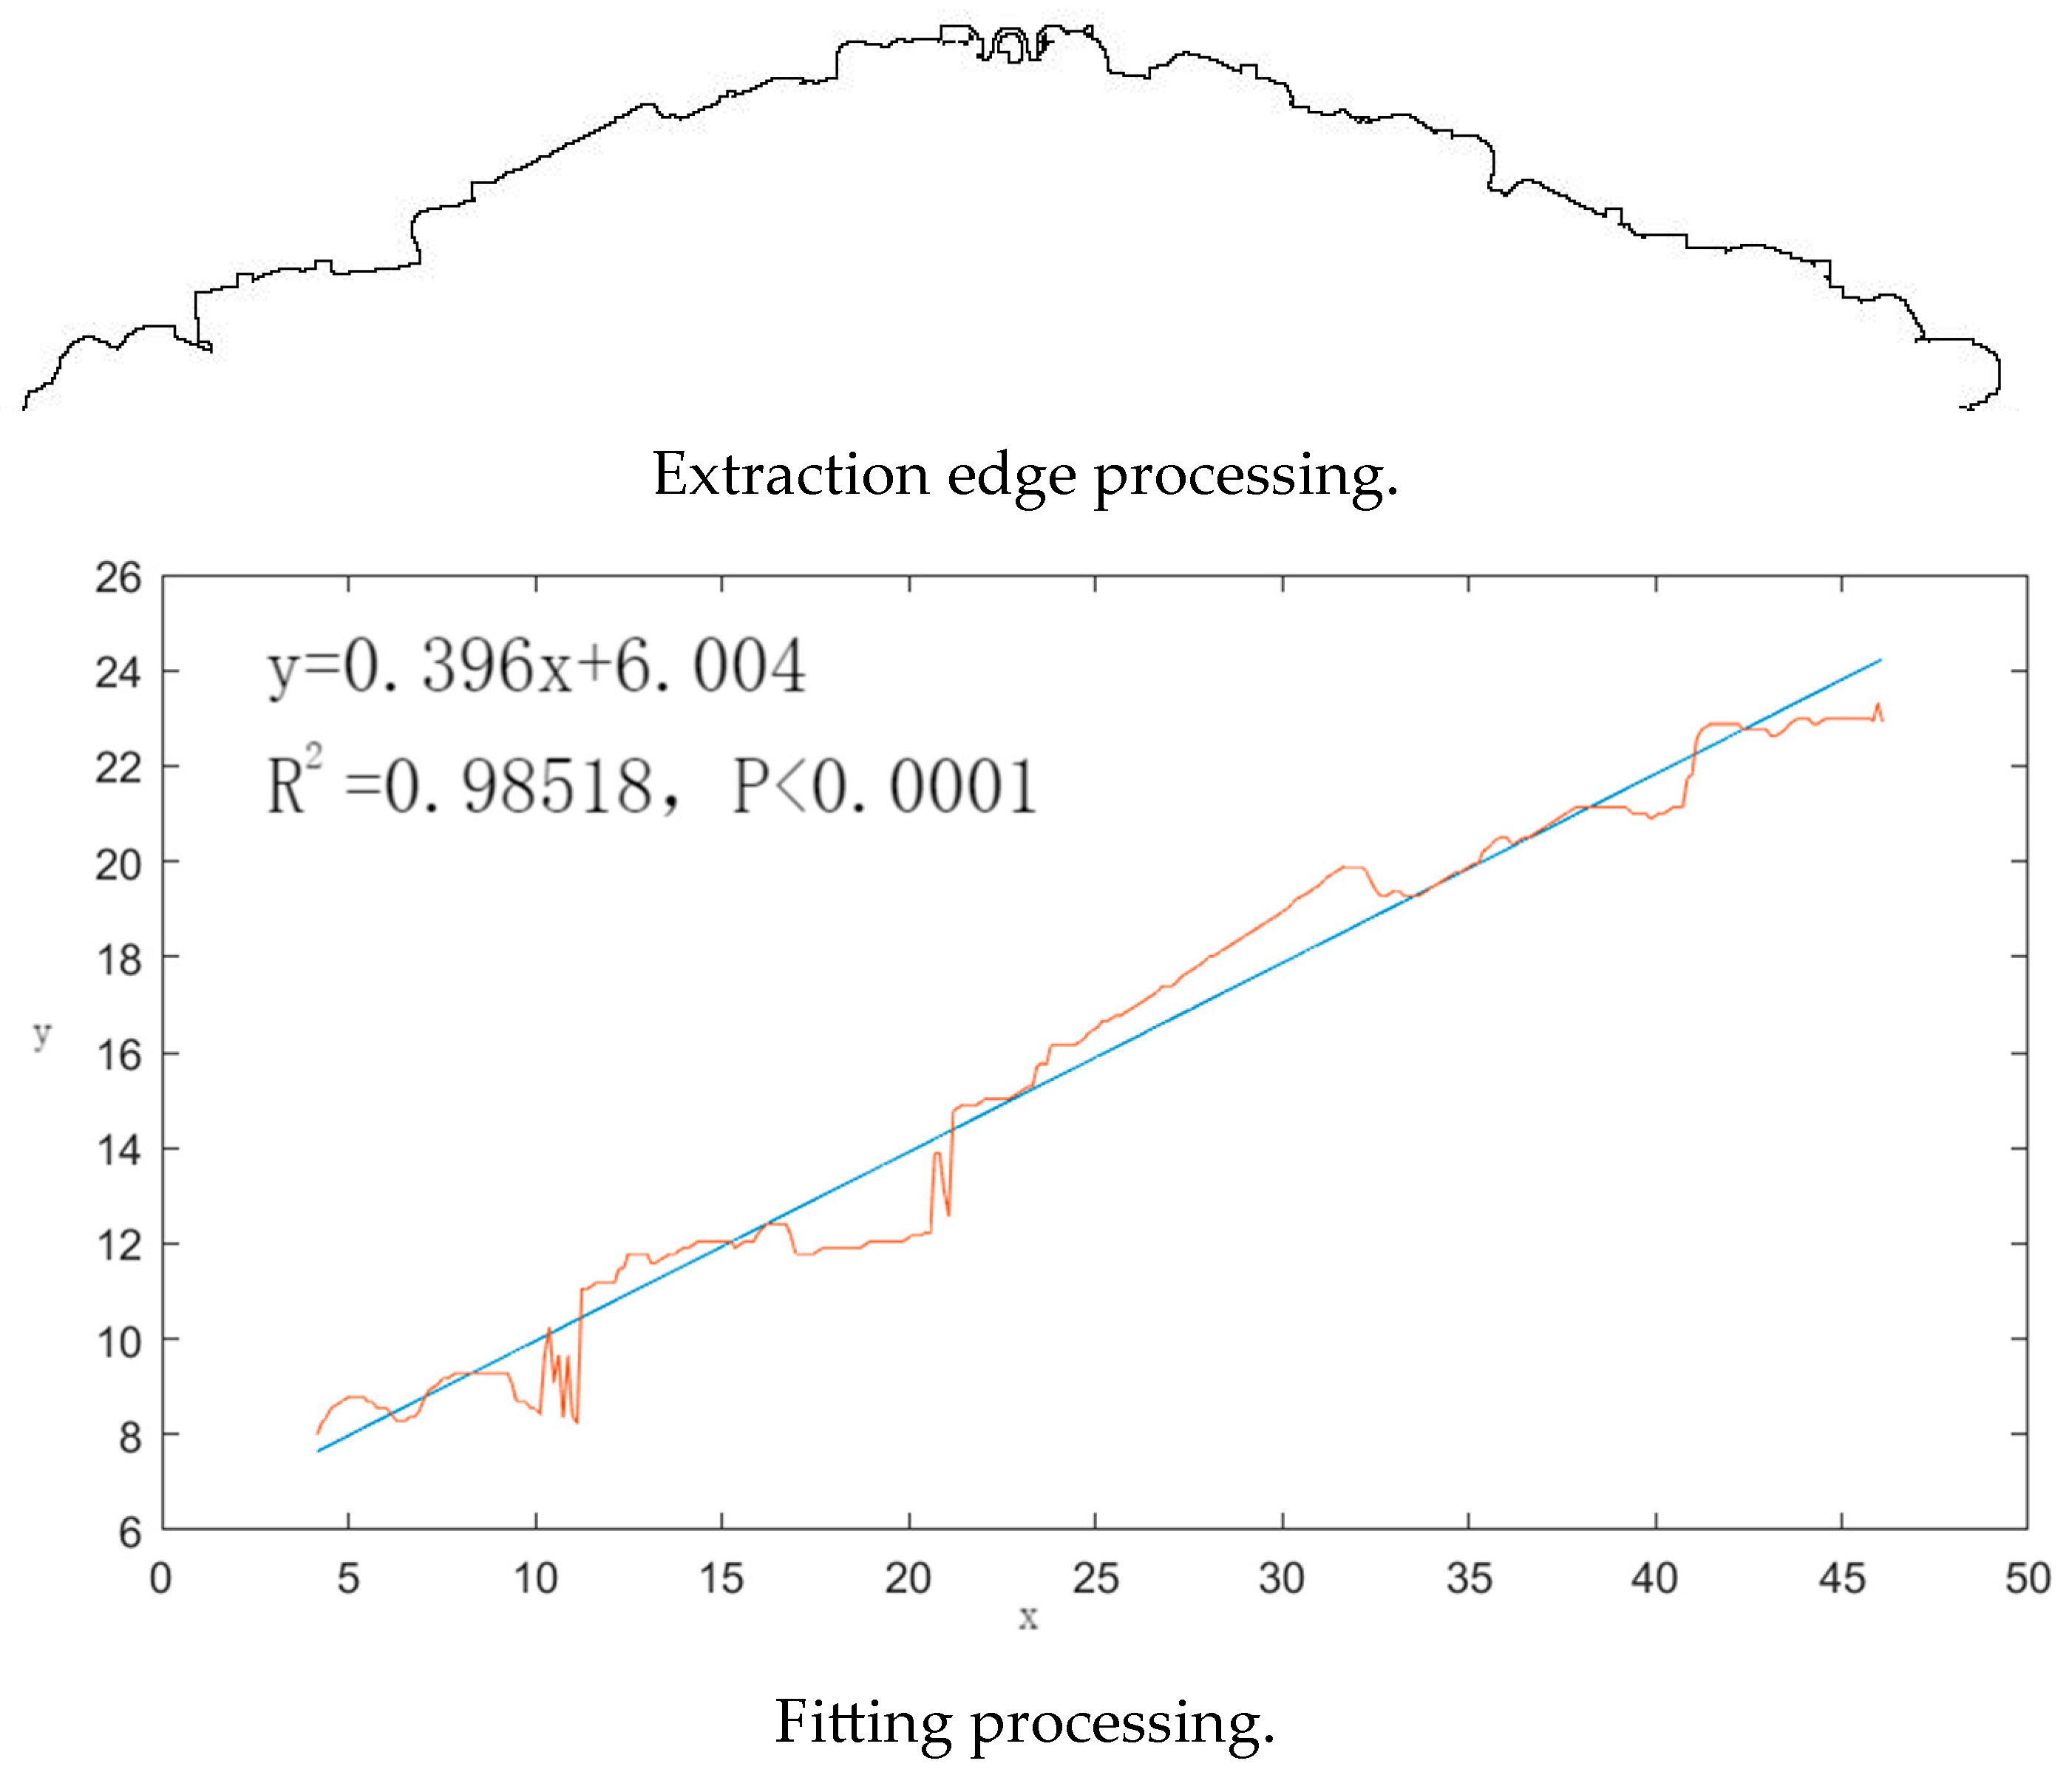
2.2. Cotton Stalk Pile-Up Angle Physical Experiment

In this experiment, the cylinder-lifting method was used to measure the accumulation angle of cotton stalk [13,17]. Figure 2 shows the test equipment, which is composed of a universal test bench, cylinder and platform.
The cylinder is made of Q235 steel, with a height of 240 mm and an inner diameter of 120 mm. The cylinder is upright on the platform. Before the test, cotton stalks with a stem diameter of 10 mm were selected for cutting. The shear lengths were 30, 35, 40, 45 and 50 mm, respectively. The number of fillings was 500, and the cotton stalks of each length accounted for 20% of the total [13]. During the test, the cylinder rose at a precisely controlled uniform speed of 50 mm/s to ensure that the cotton stalk formed a stable pile shape at the predetermined platform, as shown in Figure 3. The angle between the pile bottom surface and the slope is called the accumulation angle. Then, the camera was used to collect the accumulation angle of the cotton stalk from three different perspectives. In order to ensure the accuracy and reliability of the data, the linear fitting of the edge contour was carried out by MATLAB R2018b software, and the fitting line was obtained. The slope of the fitting line is the tangent value of the cotton stalk stacking angle, so as to obtain the cotton stalk stacking angle. The accumulation angles of five cotton stalks with different moisture contents were measured, respectively. The test under each moisture content condition was repeated five times, and the measurement results were averaged. Based on these accurate experimental data, a mathematical model between the moisture content of cotton stalk and the stacking angle was constructed, and the correlation between the two was analyzed in depth, providing a solid theoretical basis for further research and application.

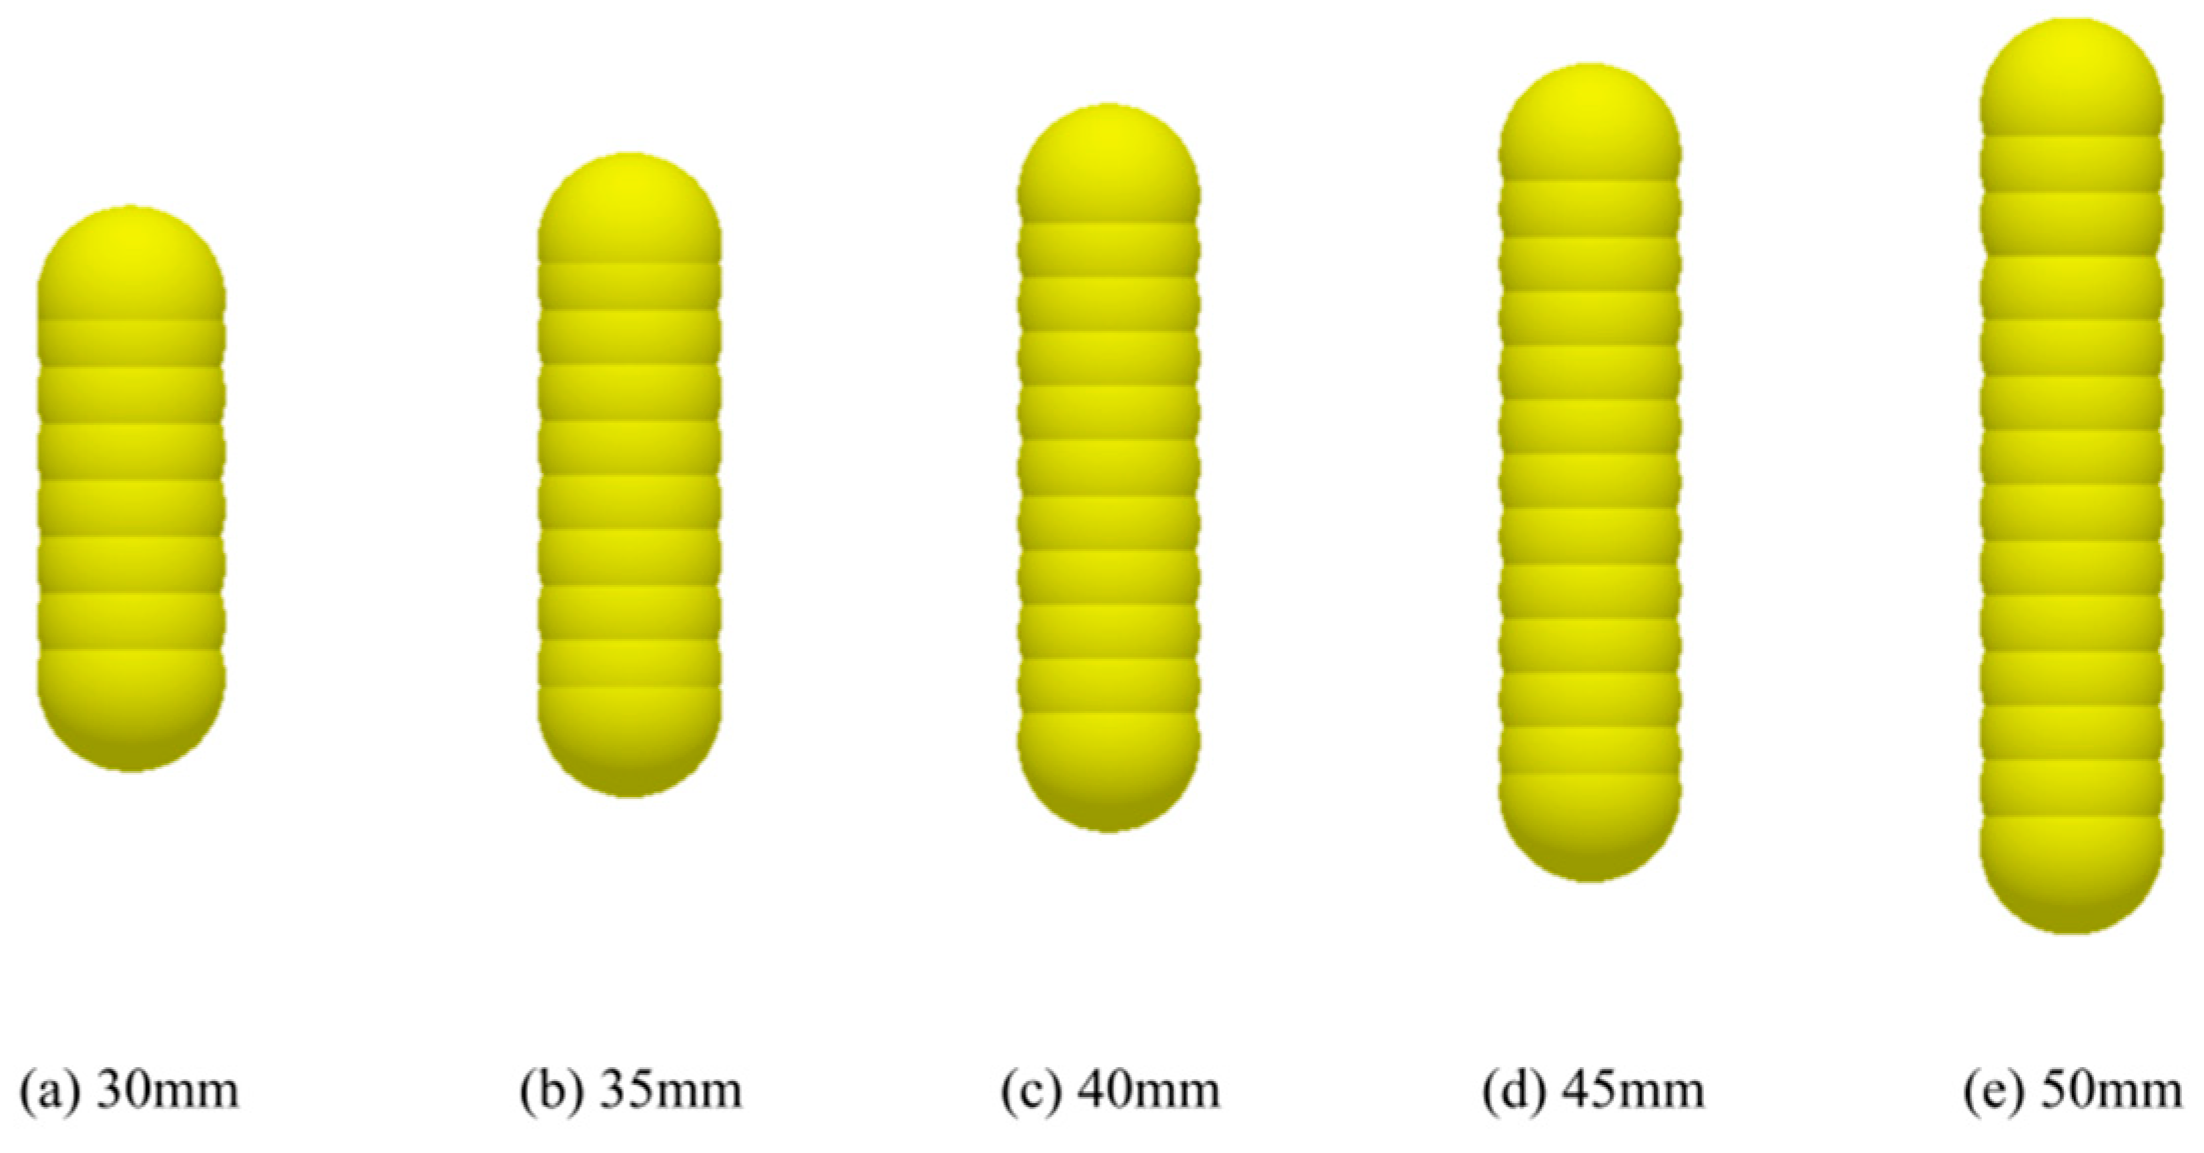
2.3. Construction of Cotton Stalk Discrete Element Model

Contact model: Combined with the characteristics of small adhesion between cotton stalk epidermis, the Hertz–Mindlin model in EDEM 2020 software is used in this cotton stalk accumulation simulation test, which can effectively measure the contact parameters between cotton stalks and cotton stalk–steel [20].
Geometric model and material intrinsic parameters: In order to simulate the morphology of cotton stalk after mechanical crushing and returning to the field and the actual accumulation state of reduced cotton stalk particles, based on EDEM 2020 software, five cotton stalk models with different lengths were composed by spherical particle combination. As shown in Figure 4, the spherical unit diameter of the cotton stalk model is 10 mm.
The intrinsic parameters of cotton stalk and steel are shown in Table 1.
Zhang Bingcheng et al. [14] used the angle of repose of cotton stalk cutting particles as the response value to calibrate the contact parameters between particles and established the response model between the contact parameters and the angle of repose. The authors mentioned, in the paper, that the intrinsic parameters, such as the Poisson’s ratio and shear modulus, of cotton stalk had little effect on the angle of repose, so the contact parameters were selected in the test. Liang Rongqing et al. [15] established a second-order response model between contact the parameters and repose angle. The author also mentioned in the paper that the intrinsic parameters, such as the Poisson’s ratio and shear modulus, of cotton stalk have little effect on the repose angle. Therefore, according to the above literature, this paper takes the stacking angle as the response value to study the cotton stalk with different levels of moisture content and does not consider the influence of moisture content on the Poisson’s ratio and shear modulus in its intrinsic parameters. Therefore, the Poisson’s ratio and shear modulus of cotton stalk are not used as test factors [25,26,27,28], and the values in the test are shown in Table 1.
Contact parameters: Combined with the EDEM general particle material database and the intrinsic parameters of cotton stalk and steel, according to the recommended values in References [29,30,31], the range of contact parameters of the cotton stalk accumulation angle is determined as shown in Table 2.

2.4. Simulation Method of Cotton Stalk Stacking Angle and Determination of Test Scheme

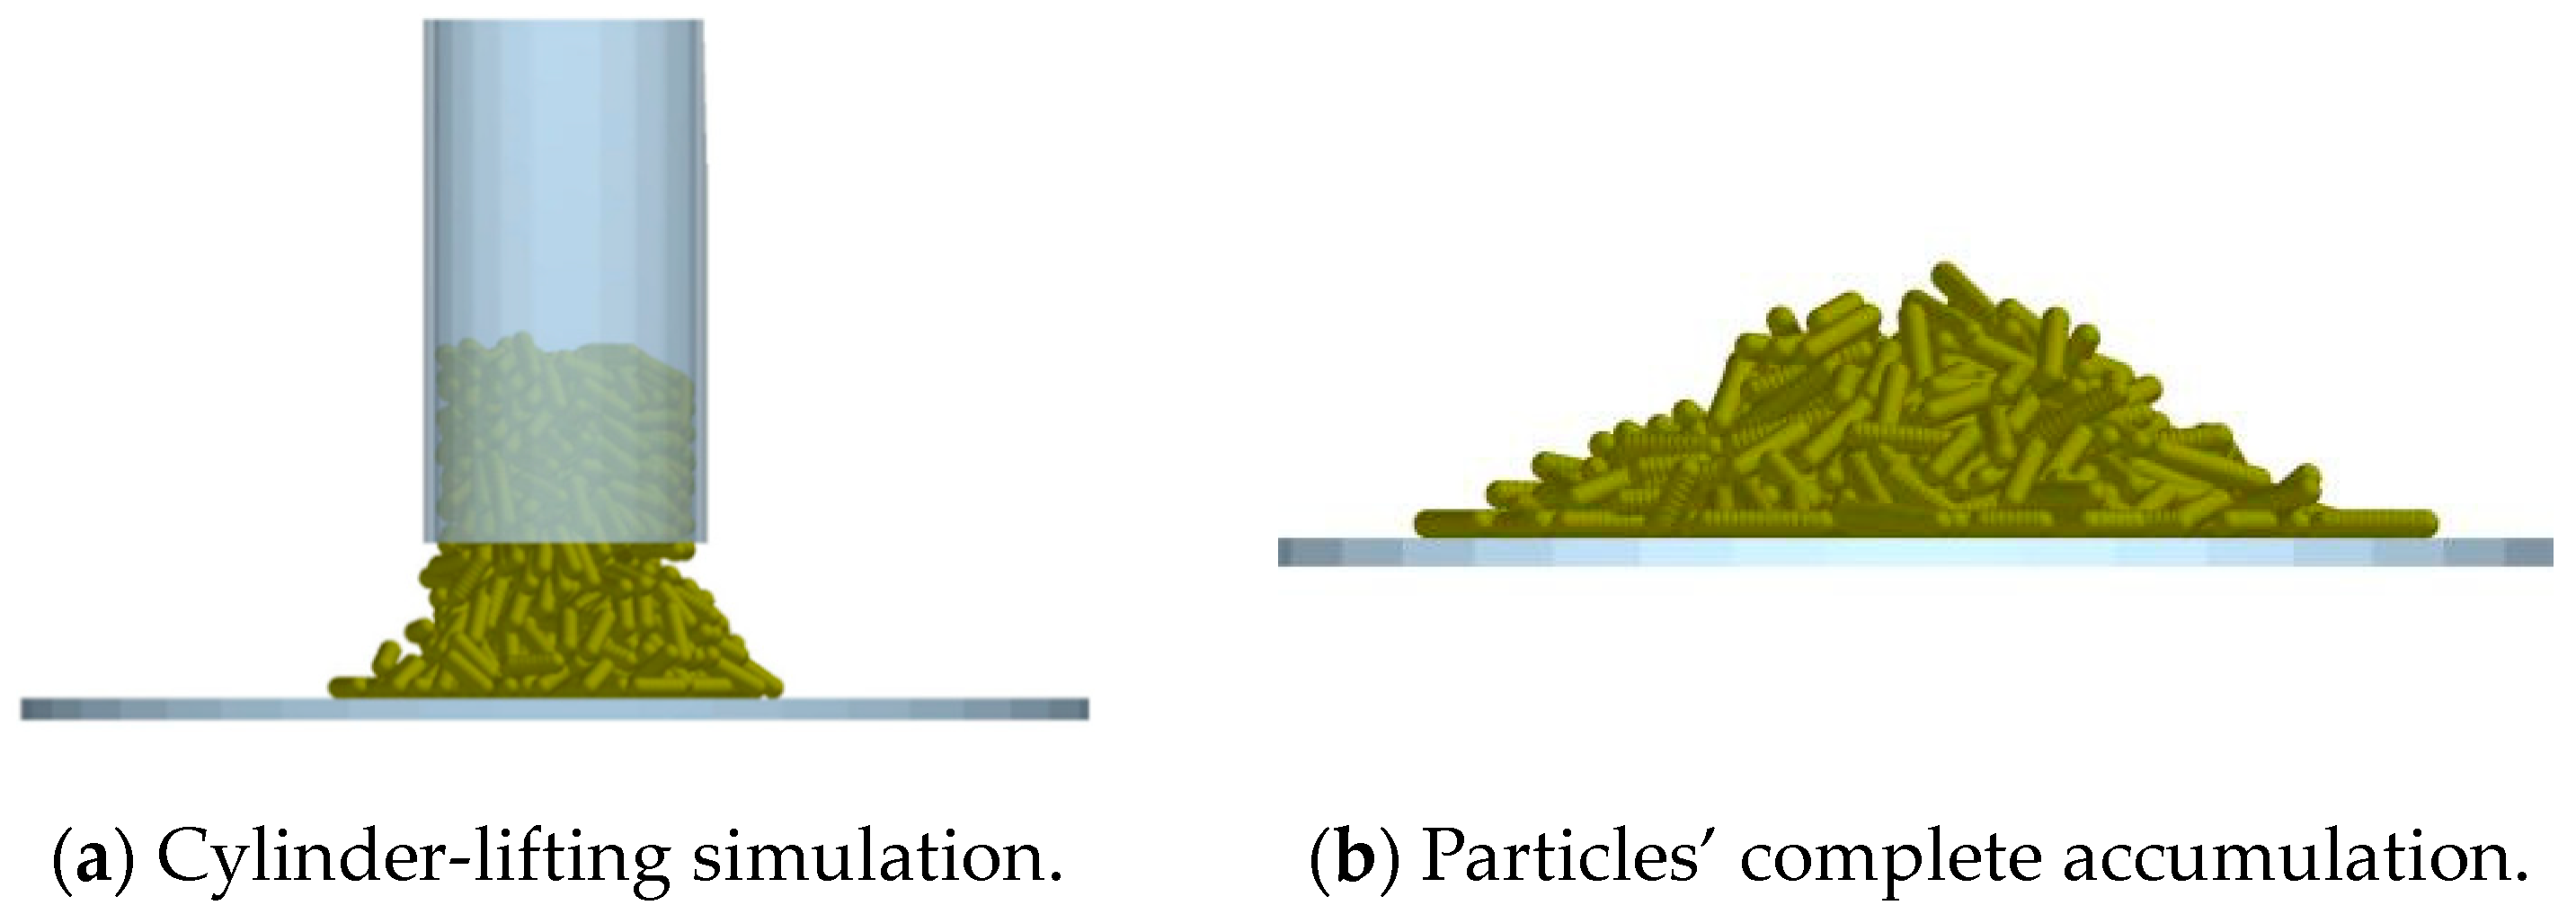
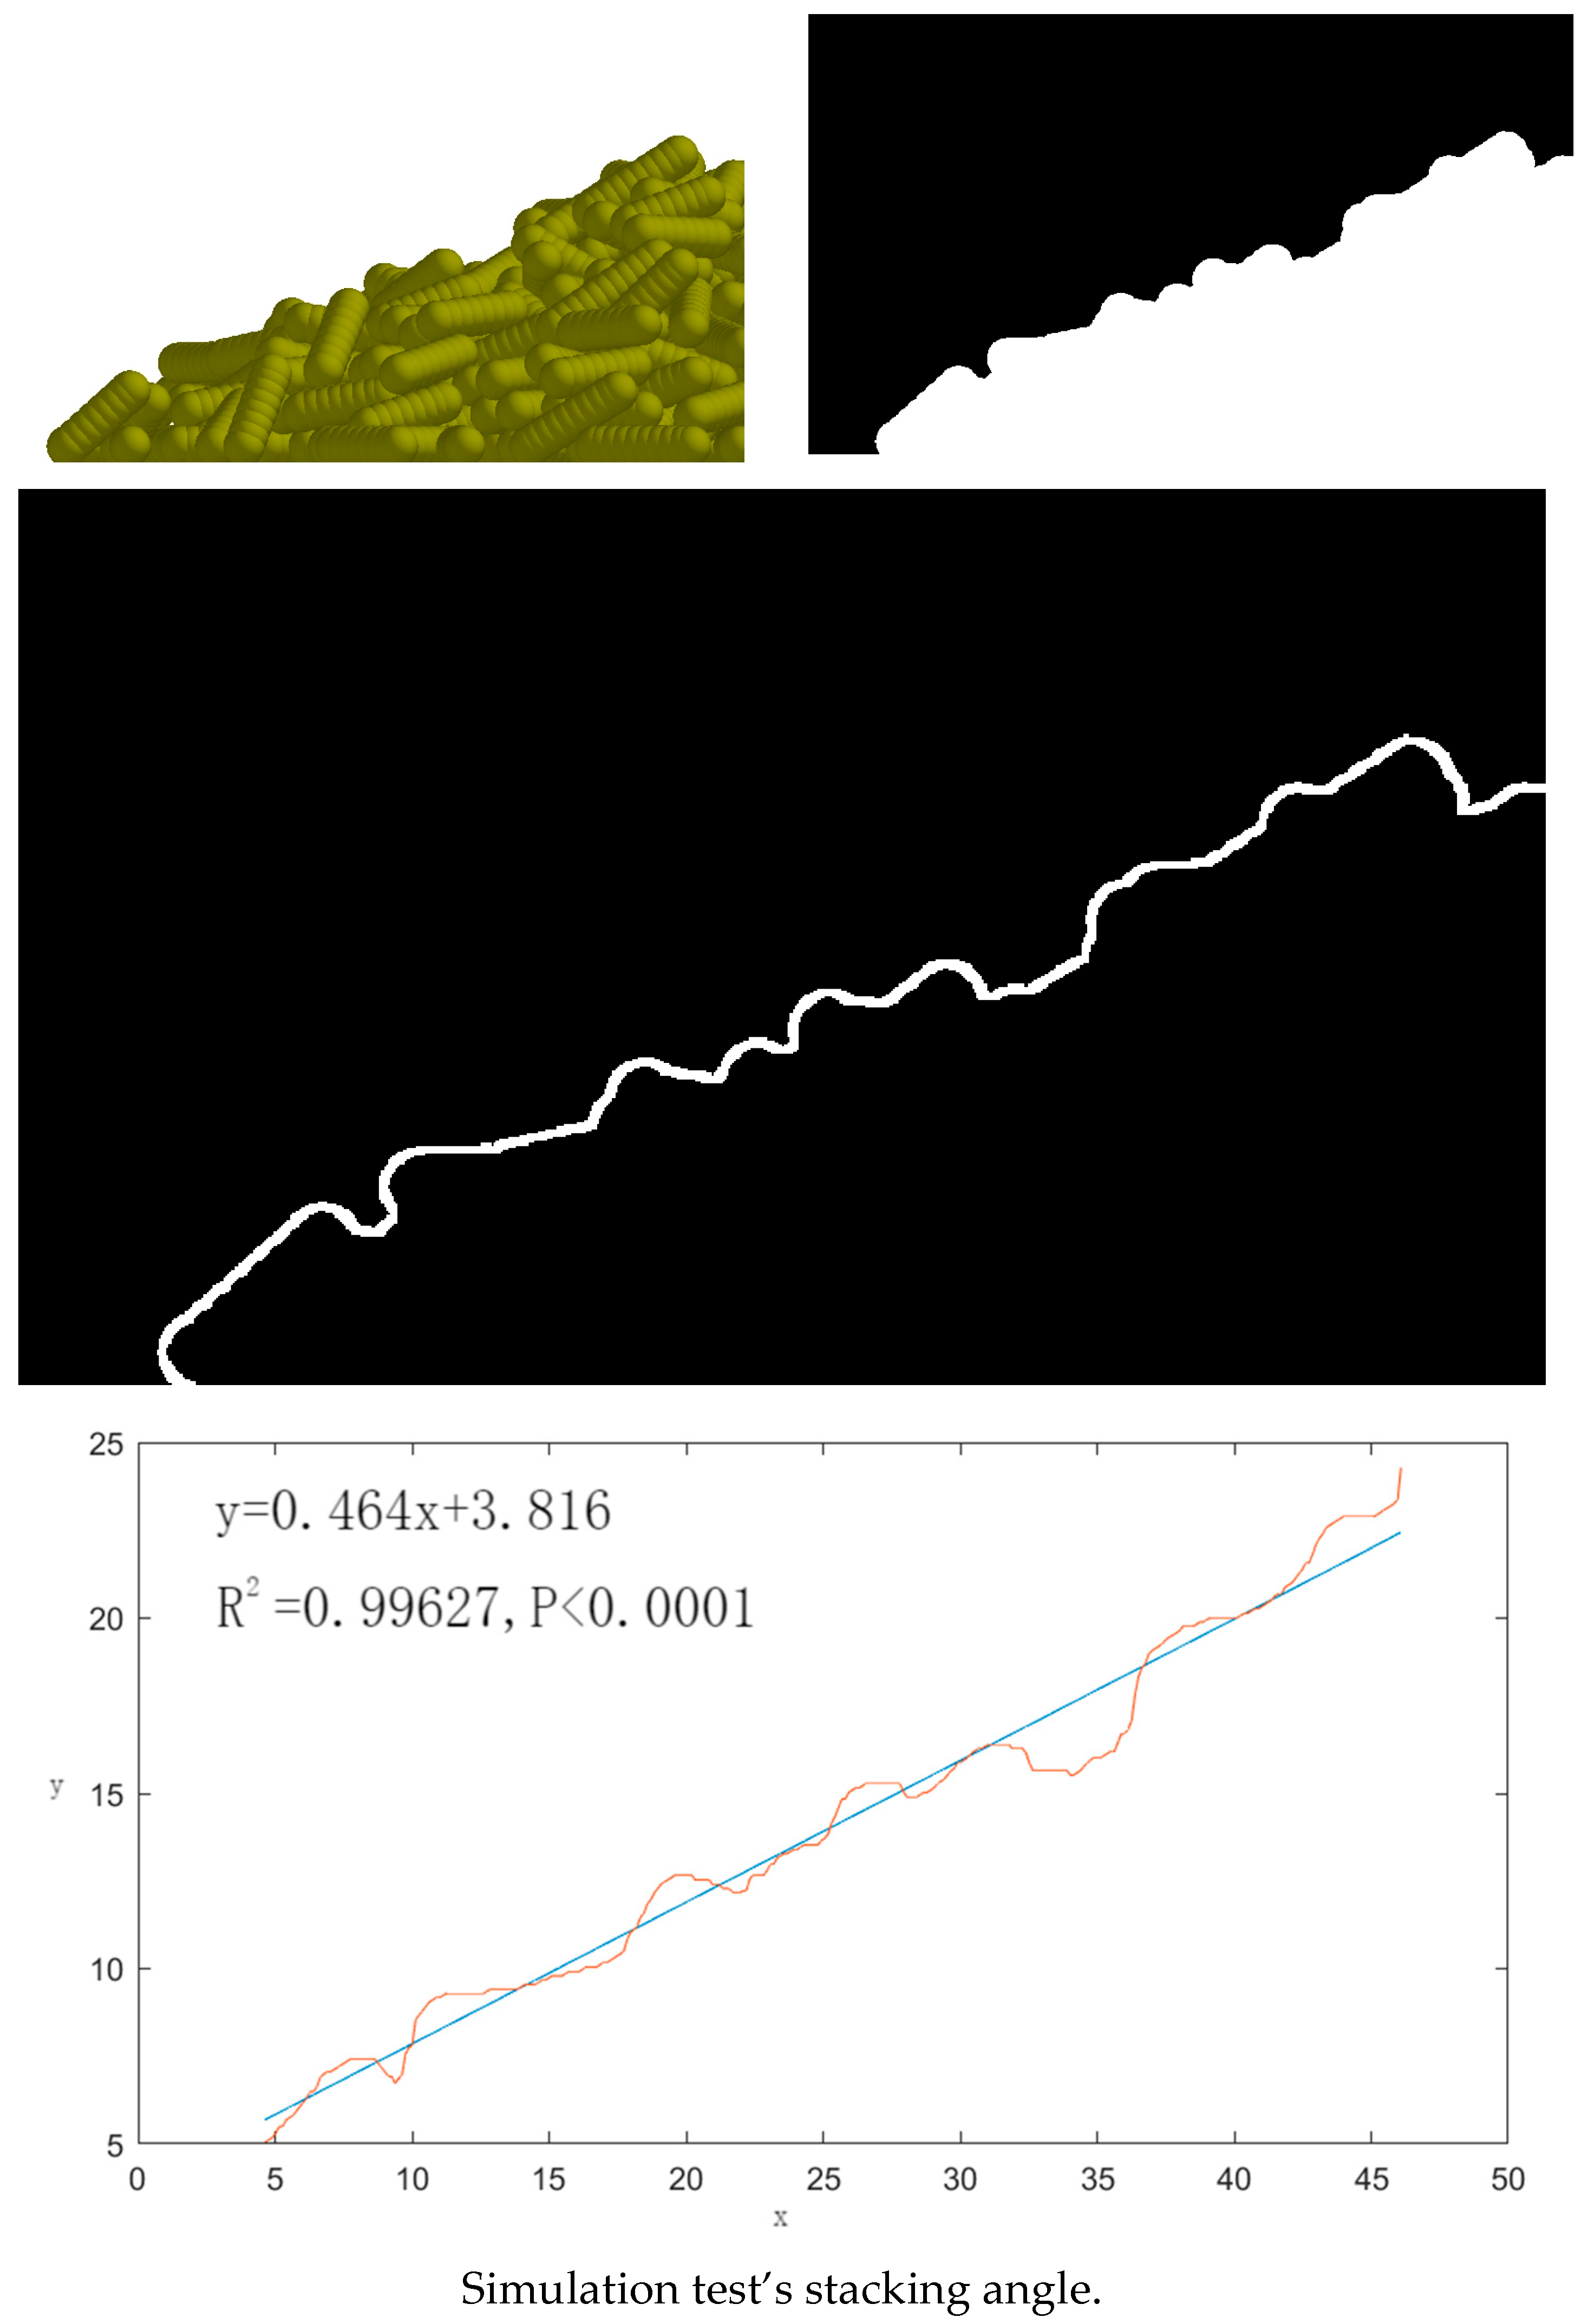
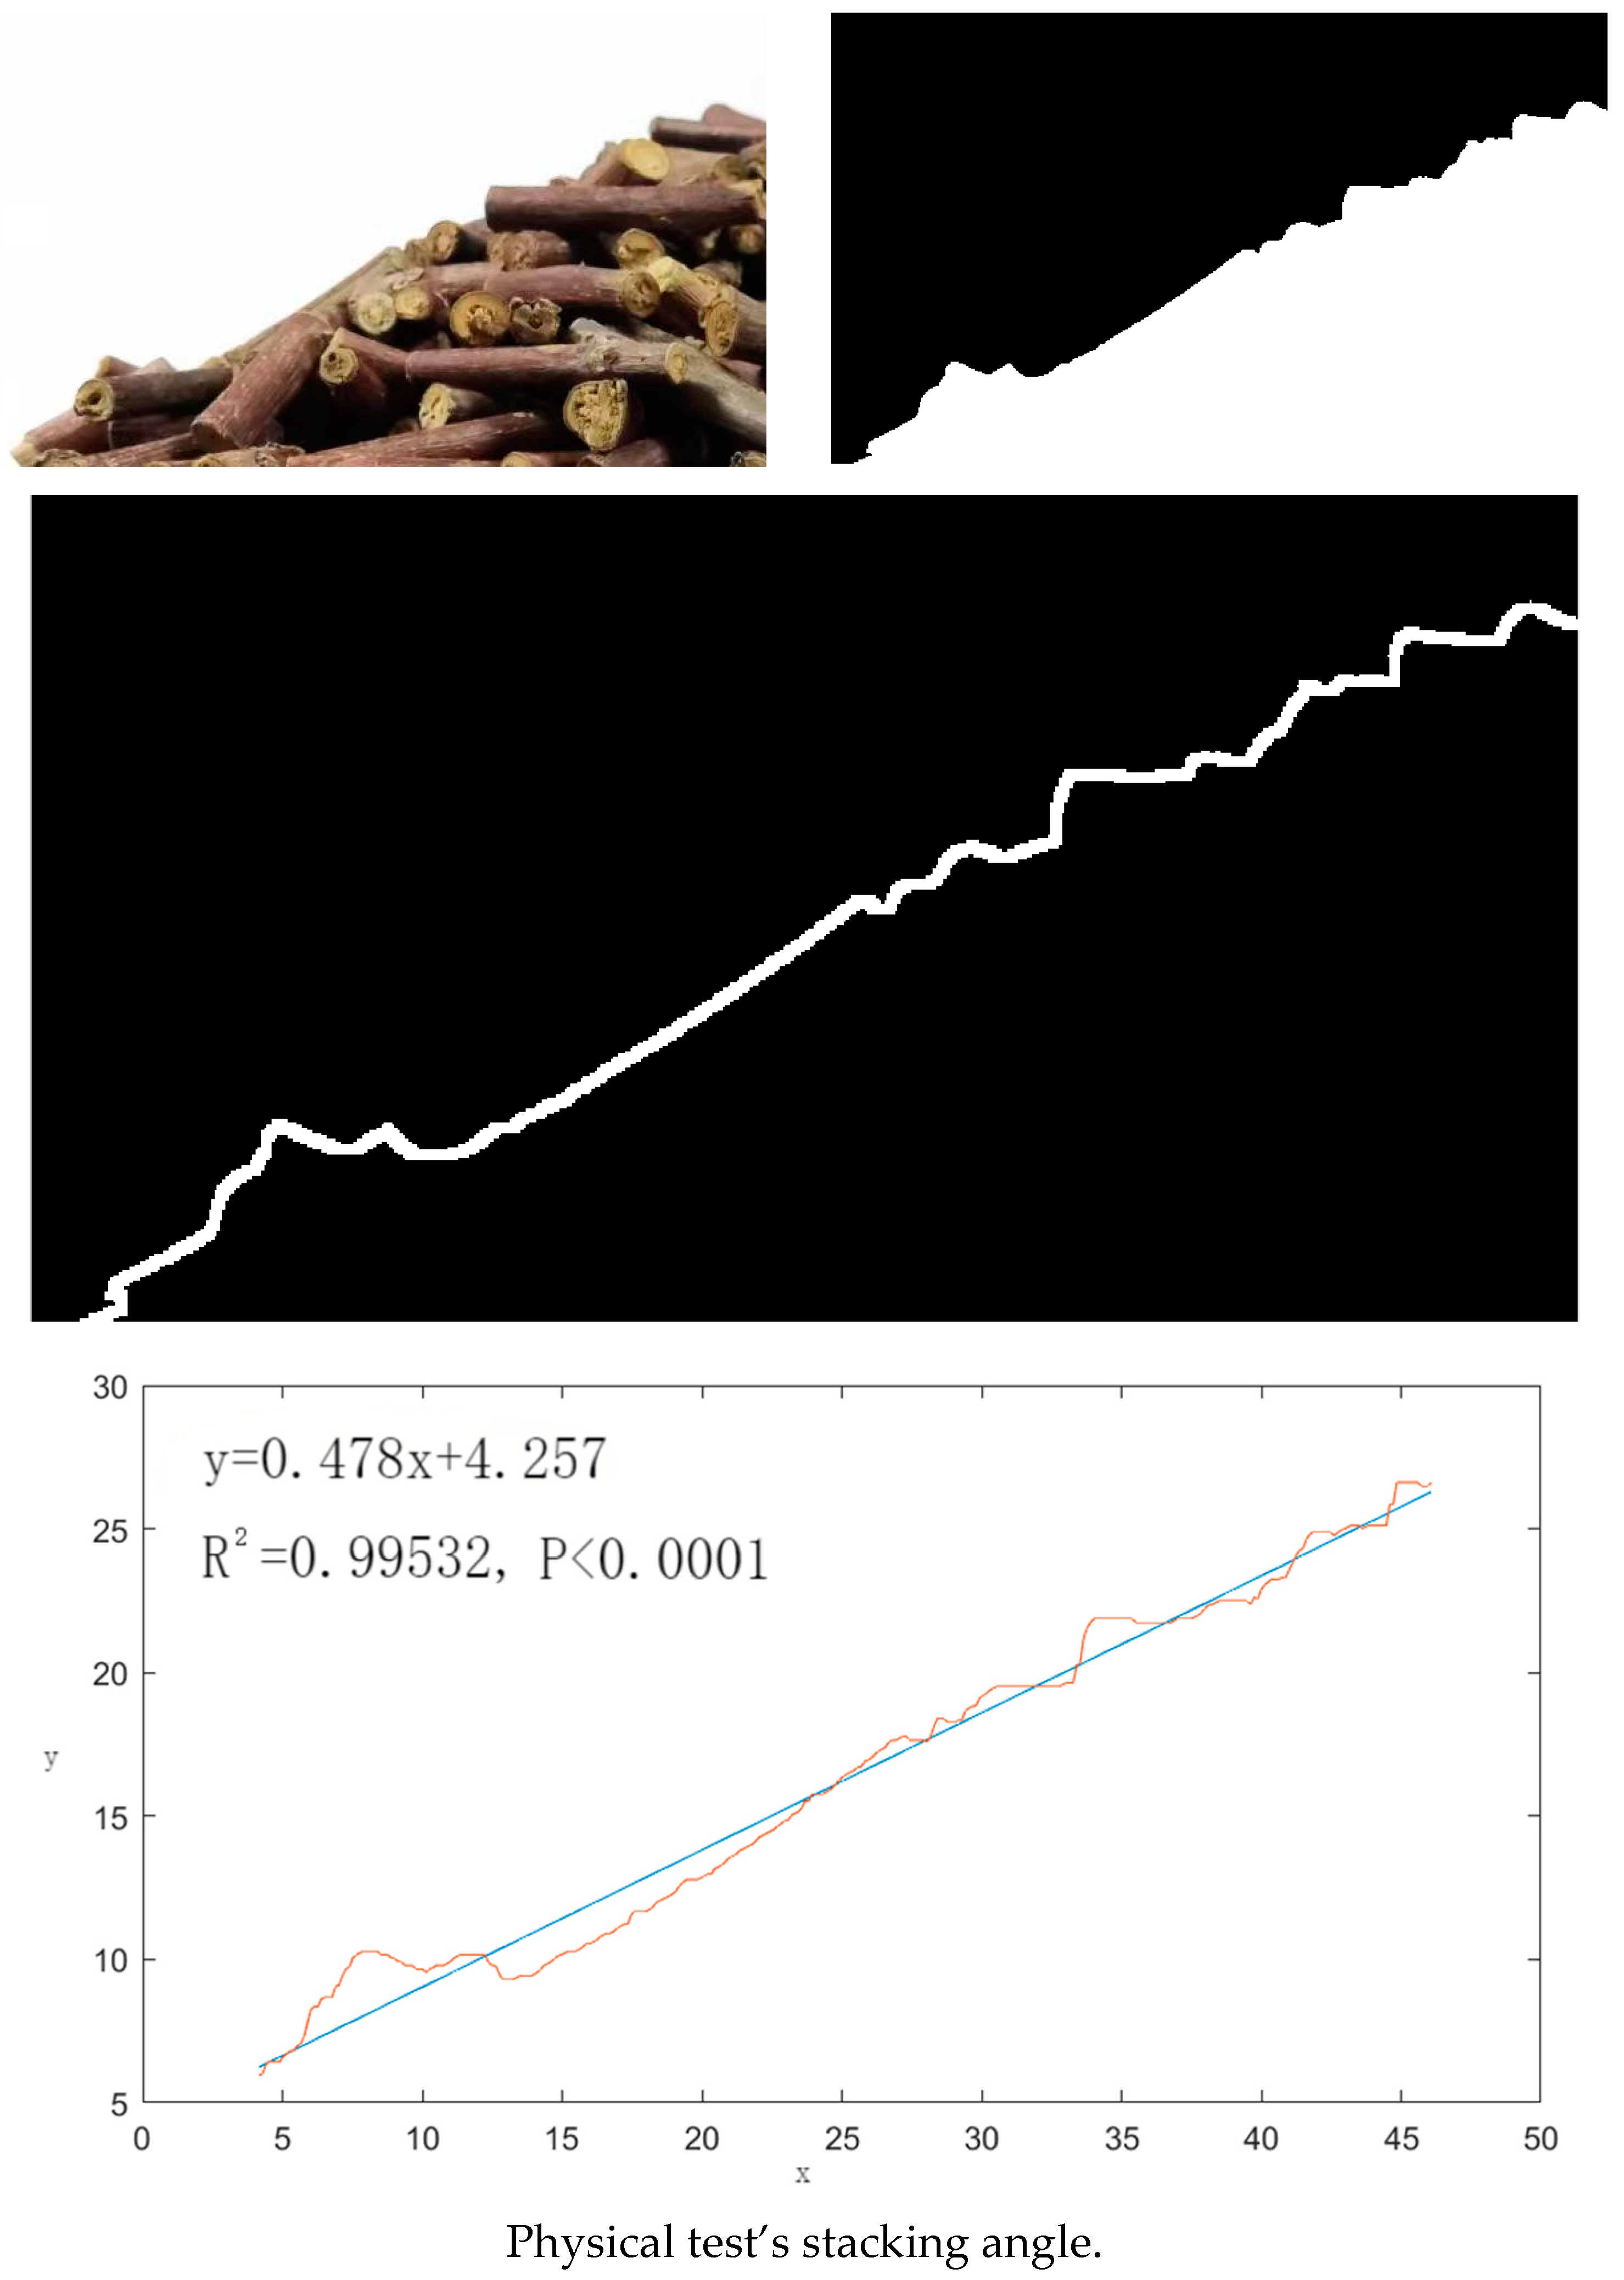
2.4.1. Simulation Method of Cotton Stalk Stacking Angle

The setting of the cotton stalk simulation process was the same as that of physical test. Before the simulation test, the cylinder with the same size as the physical test was drawn in SolidWorks and converted into IGS format and imported into EDEM. A virtual plane was established above the imported cylinder model as a particle factory, and 500 cotton stalk particles were filled in the cylinder by dynamic generation. After the cotton stalk particles were completely stationary, the cylinder rose at a constant speed of 50 mm/s until the cotton stalk particles were accumulated. The simulation test is shown in Figure 5. Through the MATLAB R2018b software, the simulated stacking angle image was binarized, the edge line was extracted and the linear fitting was performed to obtain the fitting line. Then, the slope of the fitting line was used as the tangent value of the cotton stalk stacking angle, so as to obtain the cotton stalk stacking angle value. The image processing is shown in Figure 6.

2.4.2. Determination of Plackett–Burman Design, Climbing Design and Box–Behnken Design

Using Design-Expert13.0 (STAT-EASE) software and Plackett–Burman experimental design method, the stacking angle was used as the key response variable to accurately identify the discrete element parameters that have a significant effect on the stacking angle from seven factors, such as cotton stalk density and contact parameters, listed in Table 2. In order to ensure the comprehensiveness and representativeness of the test, the seven parameters were set at three levels, namely low, medium and high, and quantified by coding −1, 0 and 1. The specific level assignment is detailed in Table 3. The test scheme and its implementation results are described in detail in Section 2.2.
In order to accurately define the parameter range and determine the optimal value interval, a climbing test was designed for the significant parameters. During the test, the non-significant parameters keep the intermediate-level value unchanged, while the significant parameters gradually increase according to the preset step size. By comparing the relative error between the simulated stacking angle and the stacking angle (29.26°) of the cotton stalk physical test under the intermediate horizontal moisture content (39.61%), the parameter with the smallest error is determined as the intermediate-level value of the optimal interval of the significant parameters. This method effectively reduces the range of parameter search and provides important basic data for subsequent optimization research. The detailed climbing test scheme and its results can be found in Section 2.3.
The optimal interval of discrete element parameters was determined by the climbing test, and the Box–Behnken test was designed on this basis. Through the model optimization of the test results, the relationship model between the stacking angle and the significance parameters was constructed. In order to accurately evaluate the error, three central points were set up, and 15 groups of experiments were carried out. Each group of experiments were repeated 5 times to ensure the stability of the results, and the average value of the stacking angle was taken as the final test result. In the experiment, the significant parameters are set according to three levels, namely low, medium and high, after the optimization of the climbing test, and they are represented by codes −1, 0 and 1 for the data analysis and result interpretation. At the same time, the value of non-significant parameters is consistent with the climbing test to ensure the consistency and comparability of the test. The detailed test plan and its implementation results are shown in Section 2.4.
Taking the stacking angle of physical experiment of cotton stalk under six different moisture contents as the target, the optimal combination of discrete element parameters was obtained by solving and optimizing the stacking angle–discrete element parameter model obtained by the Box–Behnken experiment. In the optimization process, we keep the non-significant parameters consistent with the values in the climbing test. Then, using EDEM 2020 simulation software, the simulation test was carried out based on the optimized discrete element parameter combination, and the simulation accumulation angle was measured. Finally, by comparing the simulated stacking angle with the physical test stacking angle, the accuracy of the stacking angle–discrete element parameter model was verified.

2.5. Confirmation of Verification Test Plan

By constructing the cotton stalk stacking angle–discrete element parameter model, the discrete element parameters of cotton stalk can be theoretically inferred. However, in practice, the measurement process of cotton stalk stacking angle is relatively cumbersome and the error is large, which limits the accuracy and reliability of the model in practical applications. Considering that the measurement process of moisture content is simple and accurate, this study innovatively proposes the derivation of the cotton stalk moisture content–stacking angle model and cotton stalk stacking angle–discrete element parameter model and constructs the cotton stalk moisture content–discrete element parameter model. The construction of this model aims to develop a universal, practical and accurate discrete element parameter calibration method to optimize the simulation and prediction of the cotton stalk accumulation process. In order to verify the accuracy and reliability of the constructed cotton stalk moisture content–discrete element parameter model, two methods of cylinder lifting method and plate-pulling method were used to measure the stacking angle, and the results were compared with the predicted values of the model. As shown in Figure 7, the simulation test and physical test of the stacking angle of the extraction plate method are shown.
In order to verify that the established moisture content–discrete element parameter model can provide a design basis and support for the mechanization research of cotton stalk transportation and throwing back to the field, the simulation test and field verification test of throwing back to the field were carried out. (1) Simulation test: The moisture content of cotton stalk was randomly set, and the discrete element parameters were obtained by the moisture content–discrete element parameter model. The SolidWorks 2020 software was used to establish the simulation machine, which was imported into the EDEM 2020 software to simulate the process of transporting and returning the broken stalk to the field. (2) Field verification test: The moisture content of cotton stalk was measured once a day, and the field test was carried out when the moisture content was the same as that of the simulation test. The machine adopted the same working parameters as the simulation test, such as the forward speed, the screw auger speed and the feeding amount. Taking the throwing uniformity of broken straw as the test index, the effect of throwing and returning to the field was compared, and the error analysis was carried out. As shown in Figure 8, the scattered field simulation-testing machine has a simplified model and a field test machine.

3. Results and Discussion

3.1. Construction of Cotton Stalk Moisture Content–Accumulation Angle Model

The stacking angle of five groups of moisture content cotton stalks measured by the cylinder-lifting method is shown in Table 4.
According to Table 4, the moisture content–stacking angle model was obtained by fitting the polynomial of moisture content and stacking angle of cotton stalk samples.
R1 = 0.01222x2 − 0.3652x + 24.765
where x is the moisture content of cotton stalk, %.
The correlation coefficient of the model is 0.9993, and the fitting curve is shown in Figure 9. In the range of 26.47~52.13% moisture content, the accumulation angle of cotton stalk increases with the increase in moisture content.

3.2. Results and Analysis of Significant Parameter Screening

The Plackett–Burman test was designed based on Design-Expert 13.0 software. The parameters in Table 3 were used as the test factors. The test scheme and stacking angle results are shown in Table 5.
Table 6 shows the results of the significance analysis of the Plackett–Burman test parameters.
According to the data of Table 6, the p-values of parameters x1, x2 and x5 are all less than 0.05, so it shows that the rolling friction coefficient, x1, between cotton stalks; the static friction coefficient, x2, between cotton stalks; and the static friction coefficient, x5, between cotton stalks and steel have significant influence on the cotton stalk stacking angle test. The influence of the three parameters on the stacking angle is the positive effect, and the static friction coefficient, x2, between cotton stalks is the most significant, and the significance of the cotton stalk stacking angle test is the highest. The reasons are as follows: (1) With the increase in the static friction coefficient between cotton stalk and steel, the sliding resistance of cotton stalk particles between steel walls increases, thus affecting the fluidity of cotton stalk particles and increases the stacking angle. (2) The flowability of particles is affected by the rolling and sliding between particles. Therefore, the rolling friction coefficient and the static friction coefficient between particles are the key parameters to determine the flowability. With the increase in these two friction coefficients, the rolling and sliding between the particles will be more hindered, resulting in a decrease in its fluidity, which in turn increases the accumulation angle. (3) The cotton stalk in the model is composed of five cylindrical particles with different lengths, and the motion mode between the cylindrical models is mainly sliding. Therefore, the influence of static friction coefficient on the stacking angle is more significant than that of rolling friction coefficient.
The p-values of other parameters were all greater than 0.05, indicating that there was no significant effect on the cotton stalk stacking angle test. Therefore, in order to facilitate the follow-up test, only three significant parameters were considered in the climbing test, Box–Behnken test and verification test, and the intermediate level value was taken for the non-significant factors.

3.3. Determination of Optimal Interval of Significance Parameters

The results of the steepest climbing test are shown in Table 7. It can be seen that when the rolling friction coefficient between cotton stalks is 0.07, the static friction coefficient between cotton stalks is 0.4, and the static friction coefficient between cotton stalks and steel is 0.4, and the relative error between the simulated accumulation angle and the physical test accumulation angle is the smallest, which is 2.632%. That is to say, this group of parameters is the intermediate-level value of the optimal interval of the significant parameters, and the corresponding optimal intervals are [0.06, 0.08], [0.35, 0.45] and [0.35, 0.45], respectively.

3.4. Establishment of Cotton Stalk Stacking Angle–Discrete Element Parameter Model

The Box–Behnken experimental factor code is shown in Table 8.
The Box–Behnken experimental design and results are shown in Table 9. The determination coefficient was R2 = 0.9900, the corrected determination coefficient was R2adj = 0.9772, the coefficient of variation was 4.00% and the precision was 29.467. After establishing and optimizing the discrete element parameter model of the stacking angle, we performed the variance analysis, and the results are shown in Table 10.
According to the test results and variance analysis, x1, x2, x5 and x22 had a significant effect on the accumulation angle of cotton stalk, and x12 had a significant effect on the accumulation angle of cotton stalk. The established cotton stalk stacking angle–discrete element parameter model is as follows:
R1 = 58.1375 − 2802.125x1 − 1404.175x2 + 1351.75x5 + 43812.5x12 + 2318.5x22

3.5. Validation of Cotton Stalk Stacking Angle–Discrete Element Parameter Model

The optimal combination of five sets of discrete element parameters (rolling friction coefficient between cotton stalks, static friction coefficient between cotton stalks and static friction coefficient between cotton stalks and steel) was obtained by solving and optimizing the stacking angle of five groups of cotton stalks with different moisture contents. The parameters were substituted into EDEM again for the simulation test of stacking angle, and the stacking angle of cotton stalks was obtained. Then, the error analysis was carried out with the physical test angle, as shown in Table 11.
The accumulation angle and fitting curve of cotton stalk obtained by the simulation and physical test are shown in Figure 10 for when the moisture content of cotton stalk is set to 39.61%. Among them, the accumulation angle of the simulation test is 24.89°, and the accumulation angle of the physical test is 25.55°, showing a high consistency. It can be seen from the data in Table 11 that, after determining the optimal combination of three significant discrete element parameters, the simulation was carried out based on the discrete element parameter model of stacking angle. The relative error between the simulated stacking angle of cotton stalk and the physical test stacking angle under each moisture content is less than or equal to 2.67%. This result fully proves that the established cotton stalk stacking angle–discrete element parameter model has good accuracy and applicability, and that it can be effectively used to determine the discrete element parameters. Therefore, the model has broad application prospects in discrete element simulation and parameter calibration in the field of agricultural engineering.

3.6. Moisture Content–Discrete Element Parameter Model Construction and Stacking Angle Test Verification

In order to accurately and quickly calibrate the discrete element parameters of cotton stalk under different moisture contents, based on the moisture content–stacking angle model and the stacking angle–discrete element parameter model, the model of moisture content and discrete element parameters (rolling friction coefficient between cotton stalks, static friction coefficient between cotton stalks and static friction coefficient between cotton stalks and steel) is derived from Equations (2) and (3). The moisture content–discrete element parameter model is as follows:
0.01222x2 − 0.3652x = 33.3725 − 2802.125x1 − 1404.175x2 + 1351.75x5 + 43812.5x12 + 2318.5x22
According to Formula (4), the moisture content of cotton stalk can be directly used to derive the target value of the discrete element parameter combination. This derivation process uses the software platform of Design-Expert 8.0, utilizing its built-in model target value optimization solution function to effectively determine the optimal combination of discrete element parameters. Based on the moisture content–discrete element parameter model of cotton stalk, the optimal combination of discrete element parameters of cotton stalk under three groups of random moisture content is obtained. The physical test’s stacking angle and simulation stacking angle of cotton stalk are obtained by a physical test and simulation of cylinder lifting method and plate-pulling method, respectively, as shown in Figure 11 and Figure 12. Each group of experiments was repeated five times, and the results were averaged. The measurement results are shown in Table 12 and Table 13.
From Table 12 and Table 13, it can be seen that the relative error between the simulated stacking angle and the physical test stacking angle in the three groups of tests is less than or equal to 2.79%. It shows that the established cotton stalk moisture content–discrete element parameter model is reliable. The relative error between the cotton stalk moisture content–discrete element parameter model and the accumulation angle–discrete element parameter model is very close and small, thus proving the reliability of the model and showing that the two models can be used for the determination of discrete element parameters. As another verification method, the plate extraction method, can further reflect the reliability of the model. Because the moisture content measurement is more accurate and easier to operate than the accumulation angle measurement, considering the practical application of the discrete element parameter prediction model, the established moisture content–discrete element parameter model is more practical than the accumulation angle–discrete element parameter model. The two models can adapt to the calibration of discrete element parameters under the different moisture contents of cotton stalk, and they are universal.

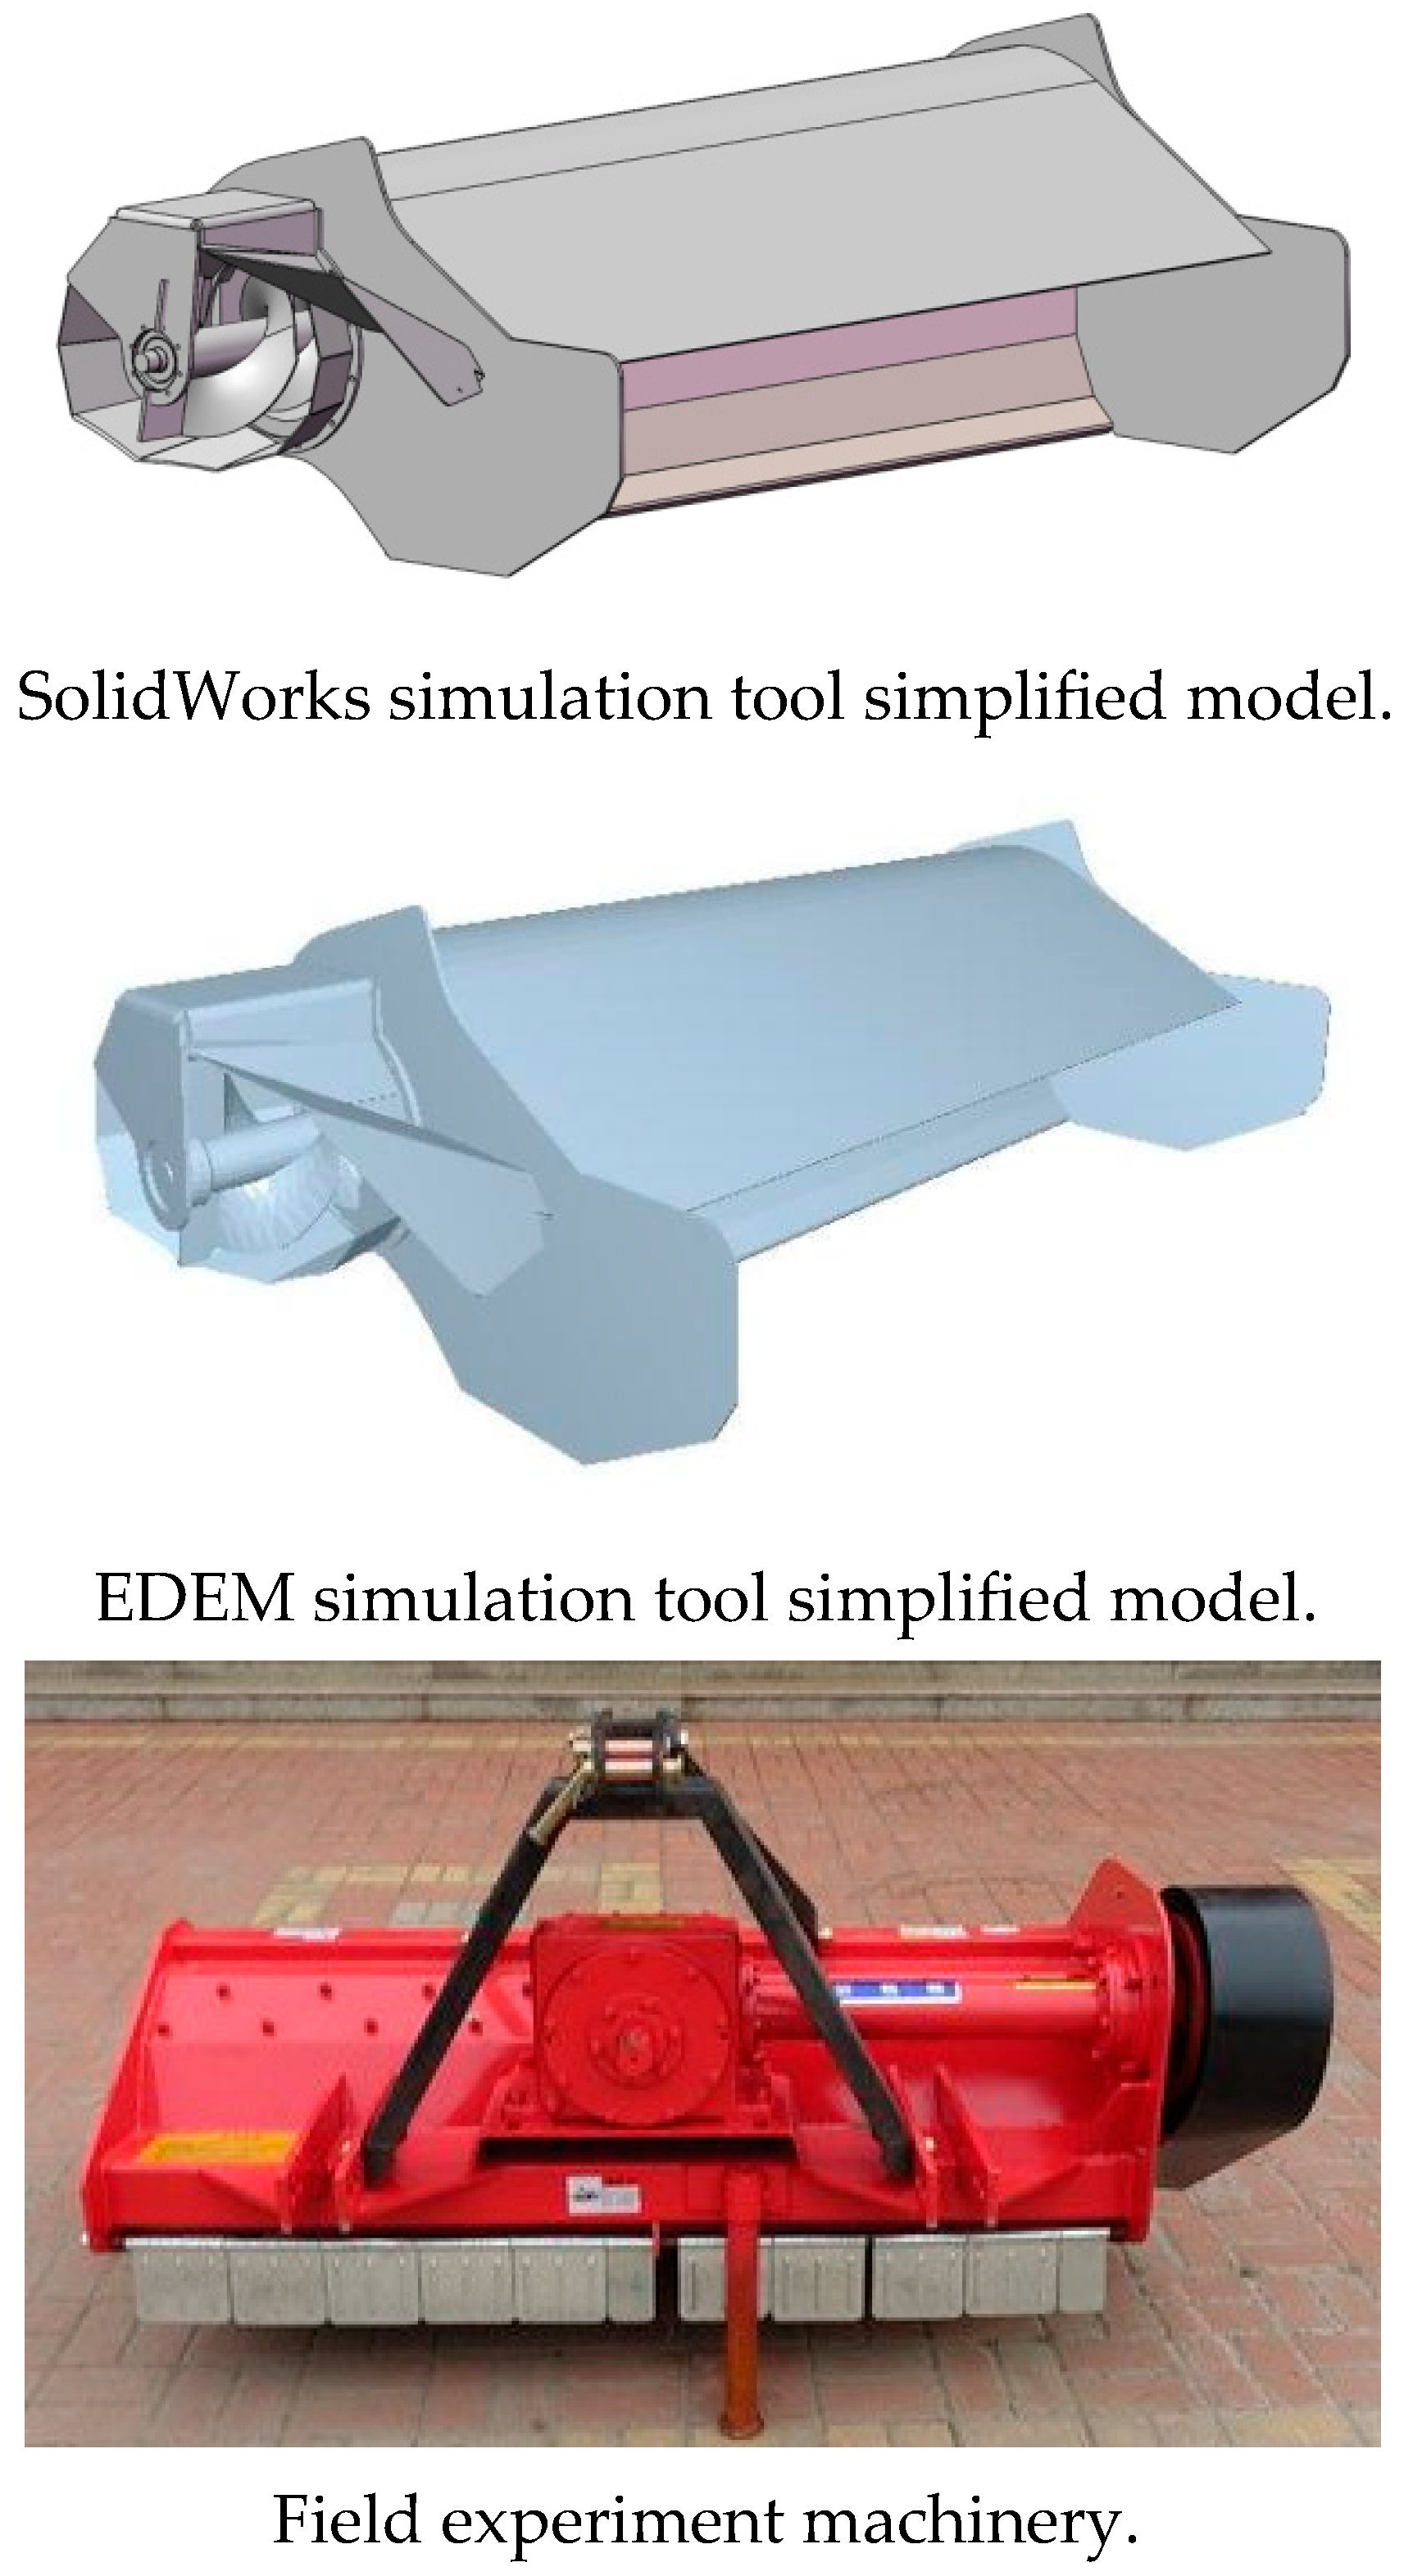
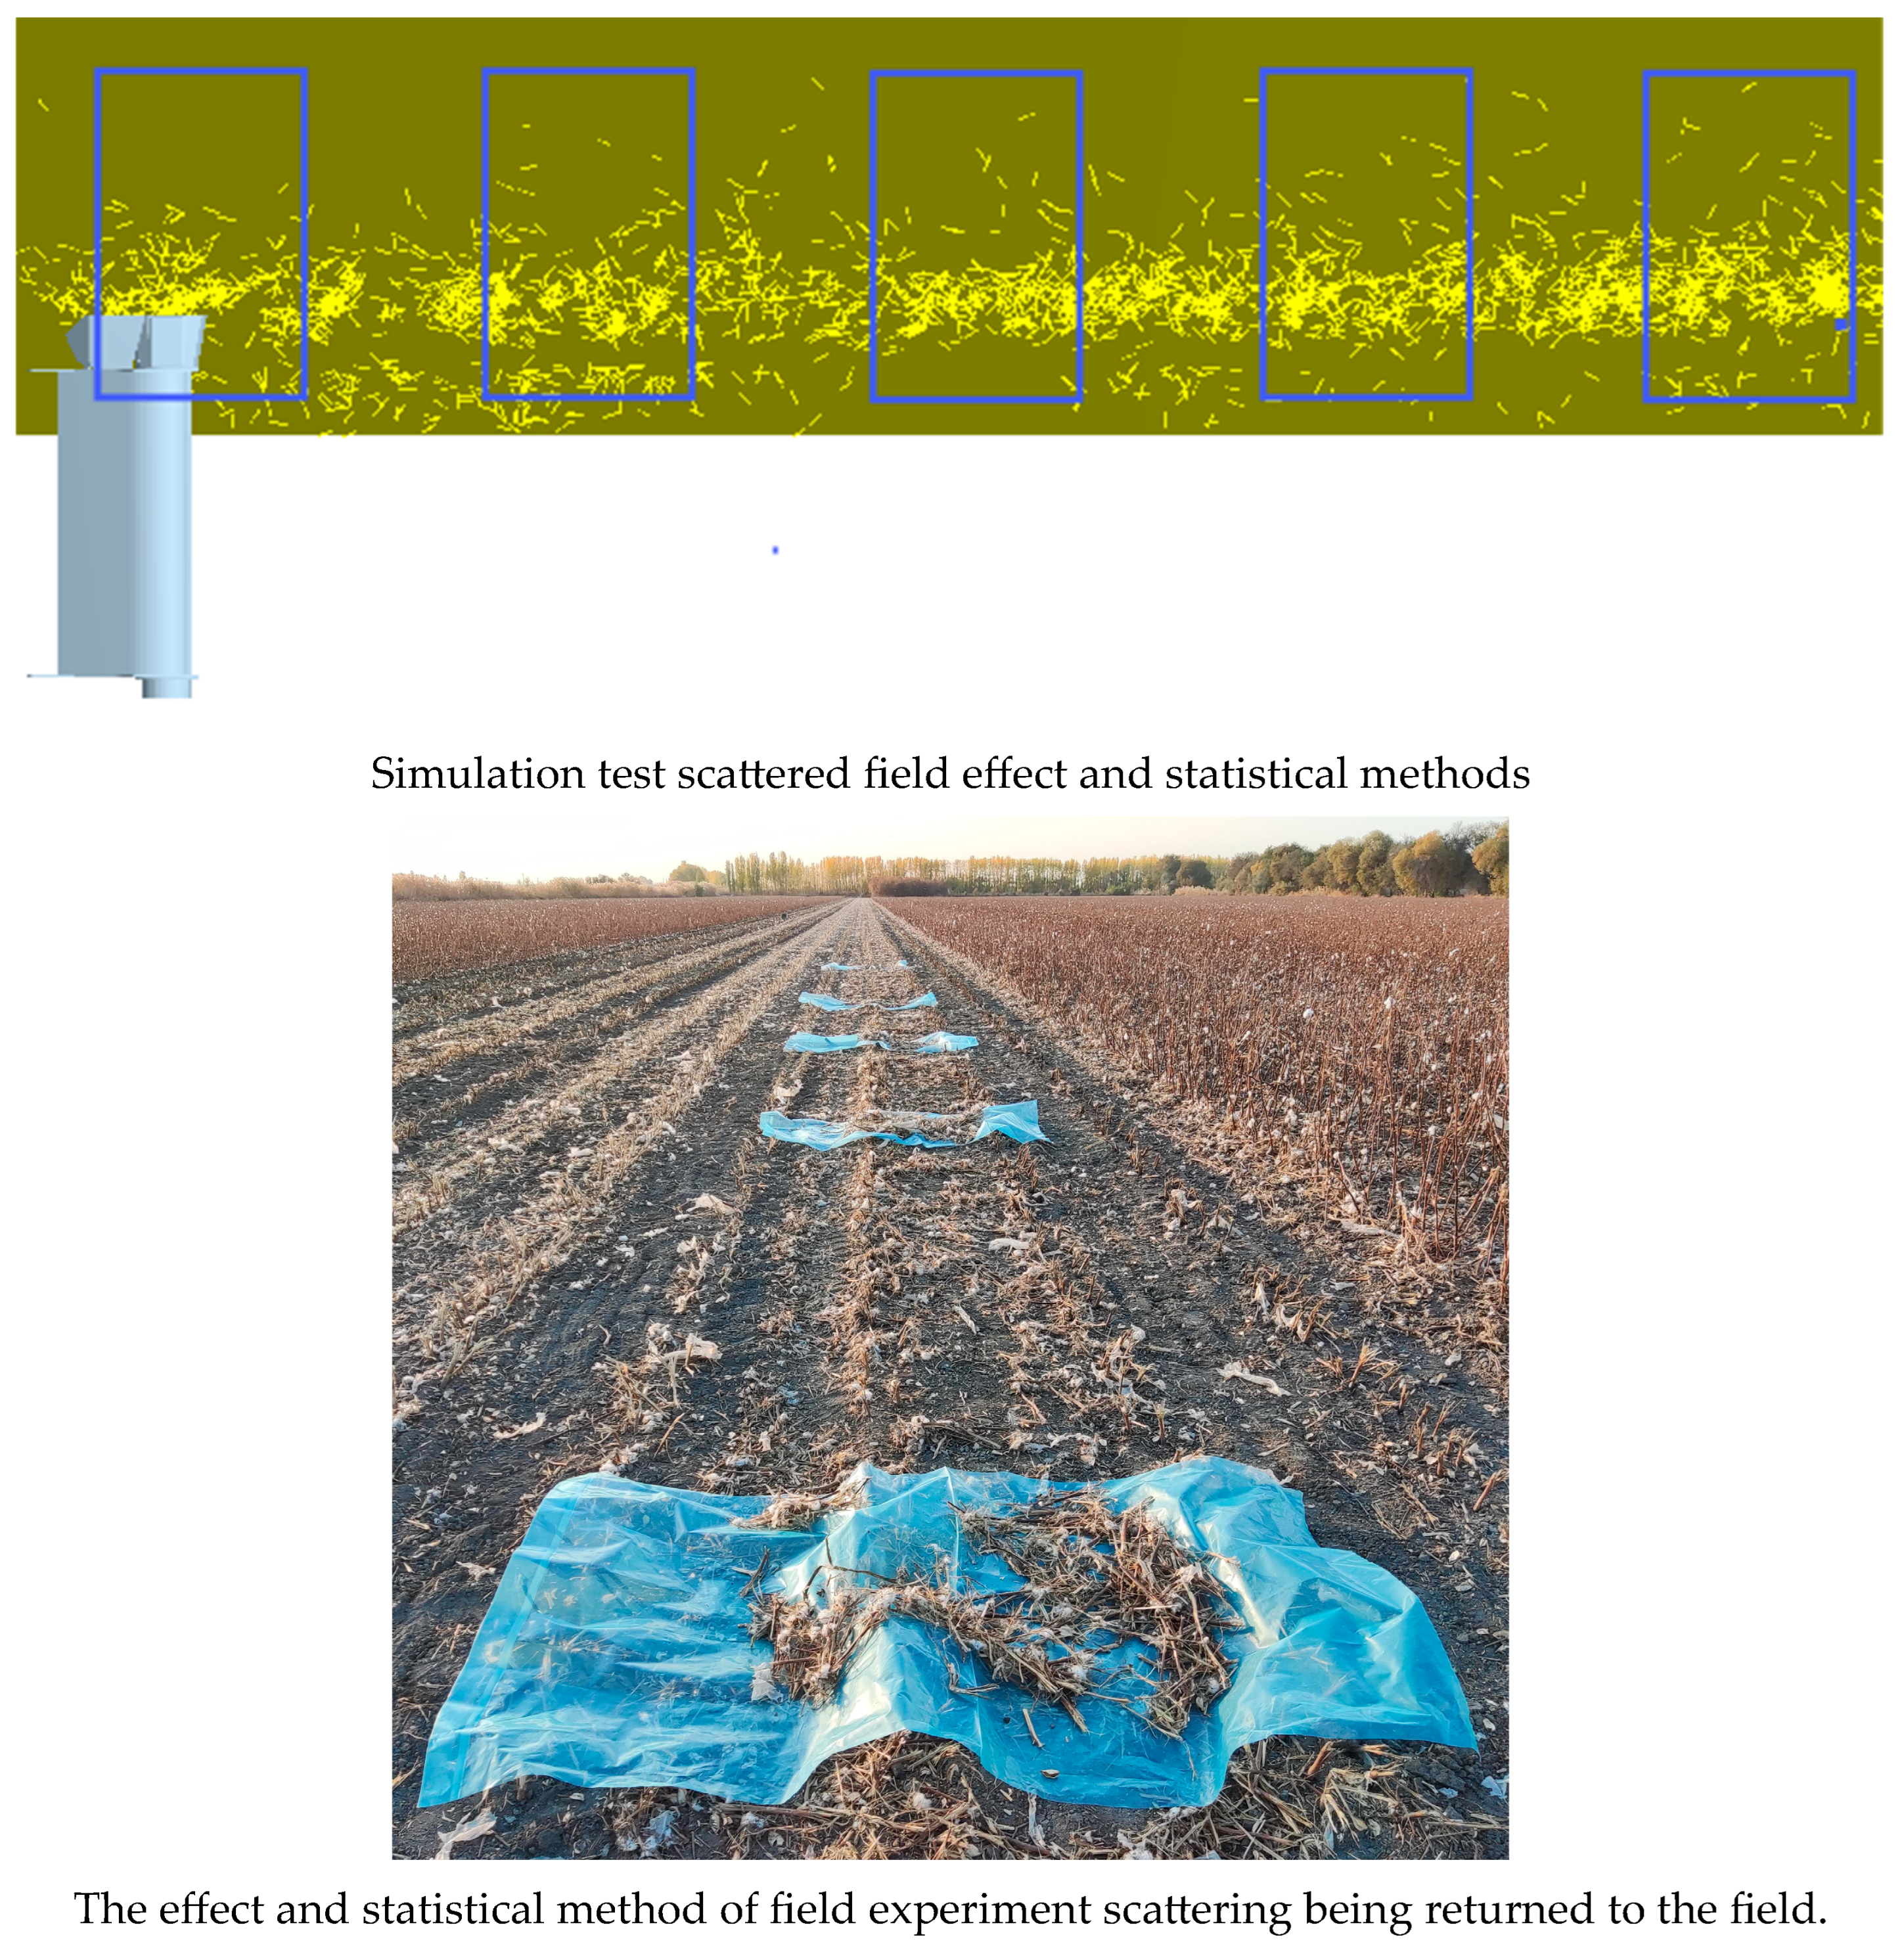
3.7. Experimental Verification of Throwing and Returning Device

(1) Dispersion unevenness: Three points were selected as measuring points according to the equidistant stroke direction of the machine. The width of each measuring point is the width of the dispersion operation, and the statistical area with a length of 1 m was used for relevant data statistics. After the cotton stalk was returned to the field, the cotton stalk in each measuring point was picked up and weighed, and the uniformity of cotton stalk throwing was calculated according to the following formula:
M = i = 1 5 M z i
Y = 1 1 M i = 1 5 M z i M 2 4 × 100 %
where i is the position number of the measuring point; Y is the cotton stalk scattering’s unevenness, %; Mzi is the total mass of cotton stalk, kg; and M is the average weight of cotton stalk at the measuring point, kg.
(2) The simulation test of scattering and returning to the field: The moisture content of the cotton stalk was randomly set to 30%, and the optimal discrete element parameter combination was found by the moisture content–discrete element parameter model with the help of Design-Expert 8.0 software—rolling friction coefficient between cotton stalks is x1 = 0.069, static friction coefficient between cotton stalks x2 = 0.381 and cotton stalk–steel static friction coefficient x5 = 0.363. The other discrete element parameters are selected as the intermediate level values. The working parameters are as follows: the forward speed is 8 km/h, the screw auger speed is 1000 r/min, the feeding amount is 8 kg and the simulation time is 10 s. Subsequently, the simulation experiment of cotton stalk spiral conveying and throwing back to the field was carried out. The uniformity of throwing can be measured by EDEM 2020 software post-processing module.
(3) Field verification test: When the measured moisture content of cotton stalk was 30.27%, the field verification test was carried out. The working parameters were as follows: the forward speed was 8 km/h, the screw auger speed was 1000 r/min, the feeding amount was 8 kg, the working time was 10 s, and the throwing uniformity was measured by Formulas (5) and (6). The effect of throwing and returning to the field and the statistical method are shown in Figure 13, and the test results are shown in Table 14.
It can be seen from Figure 13 that the effect of cotton stalk scattering and returning to field in the simulation and field experiment is very similar. It can be seen from Table 14 that the relative error between the simulation test’s scattering uniformity and the field test’s scattering uniformity in the three measuring points is less than or equal to 4.75%, which further verifies the practicability and reliability of the established moisture content–discrete element parameter model. It can provide a theoretical reference for the design and research of the Xinjiang cotton stalk-conveying and -returning mechanical device.

4. Conclusions

The moisture content of cotton stalks in autumn in Xinjiang varies greatly, and the moisture content has a significant impact on the material characteristics of cotton stalks. Based on the related machinery studied by the discrete element method, the moisture content is also an important factor in its consideration. For this reason, a parameter model that can quickly and accurately calibrate cotton stalks with different moisture contents was constructed. The main research conclusions are as follows:
(1)
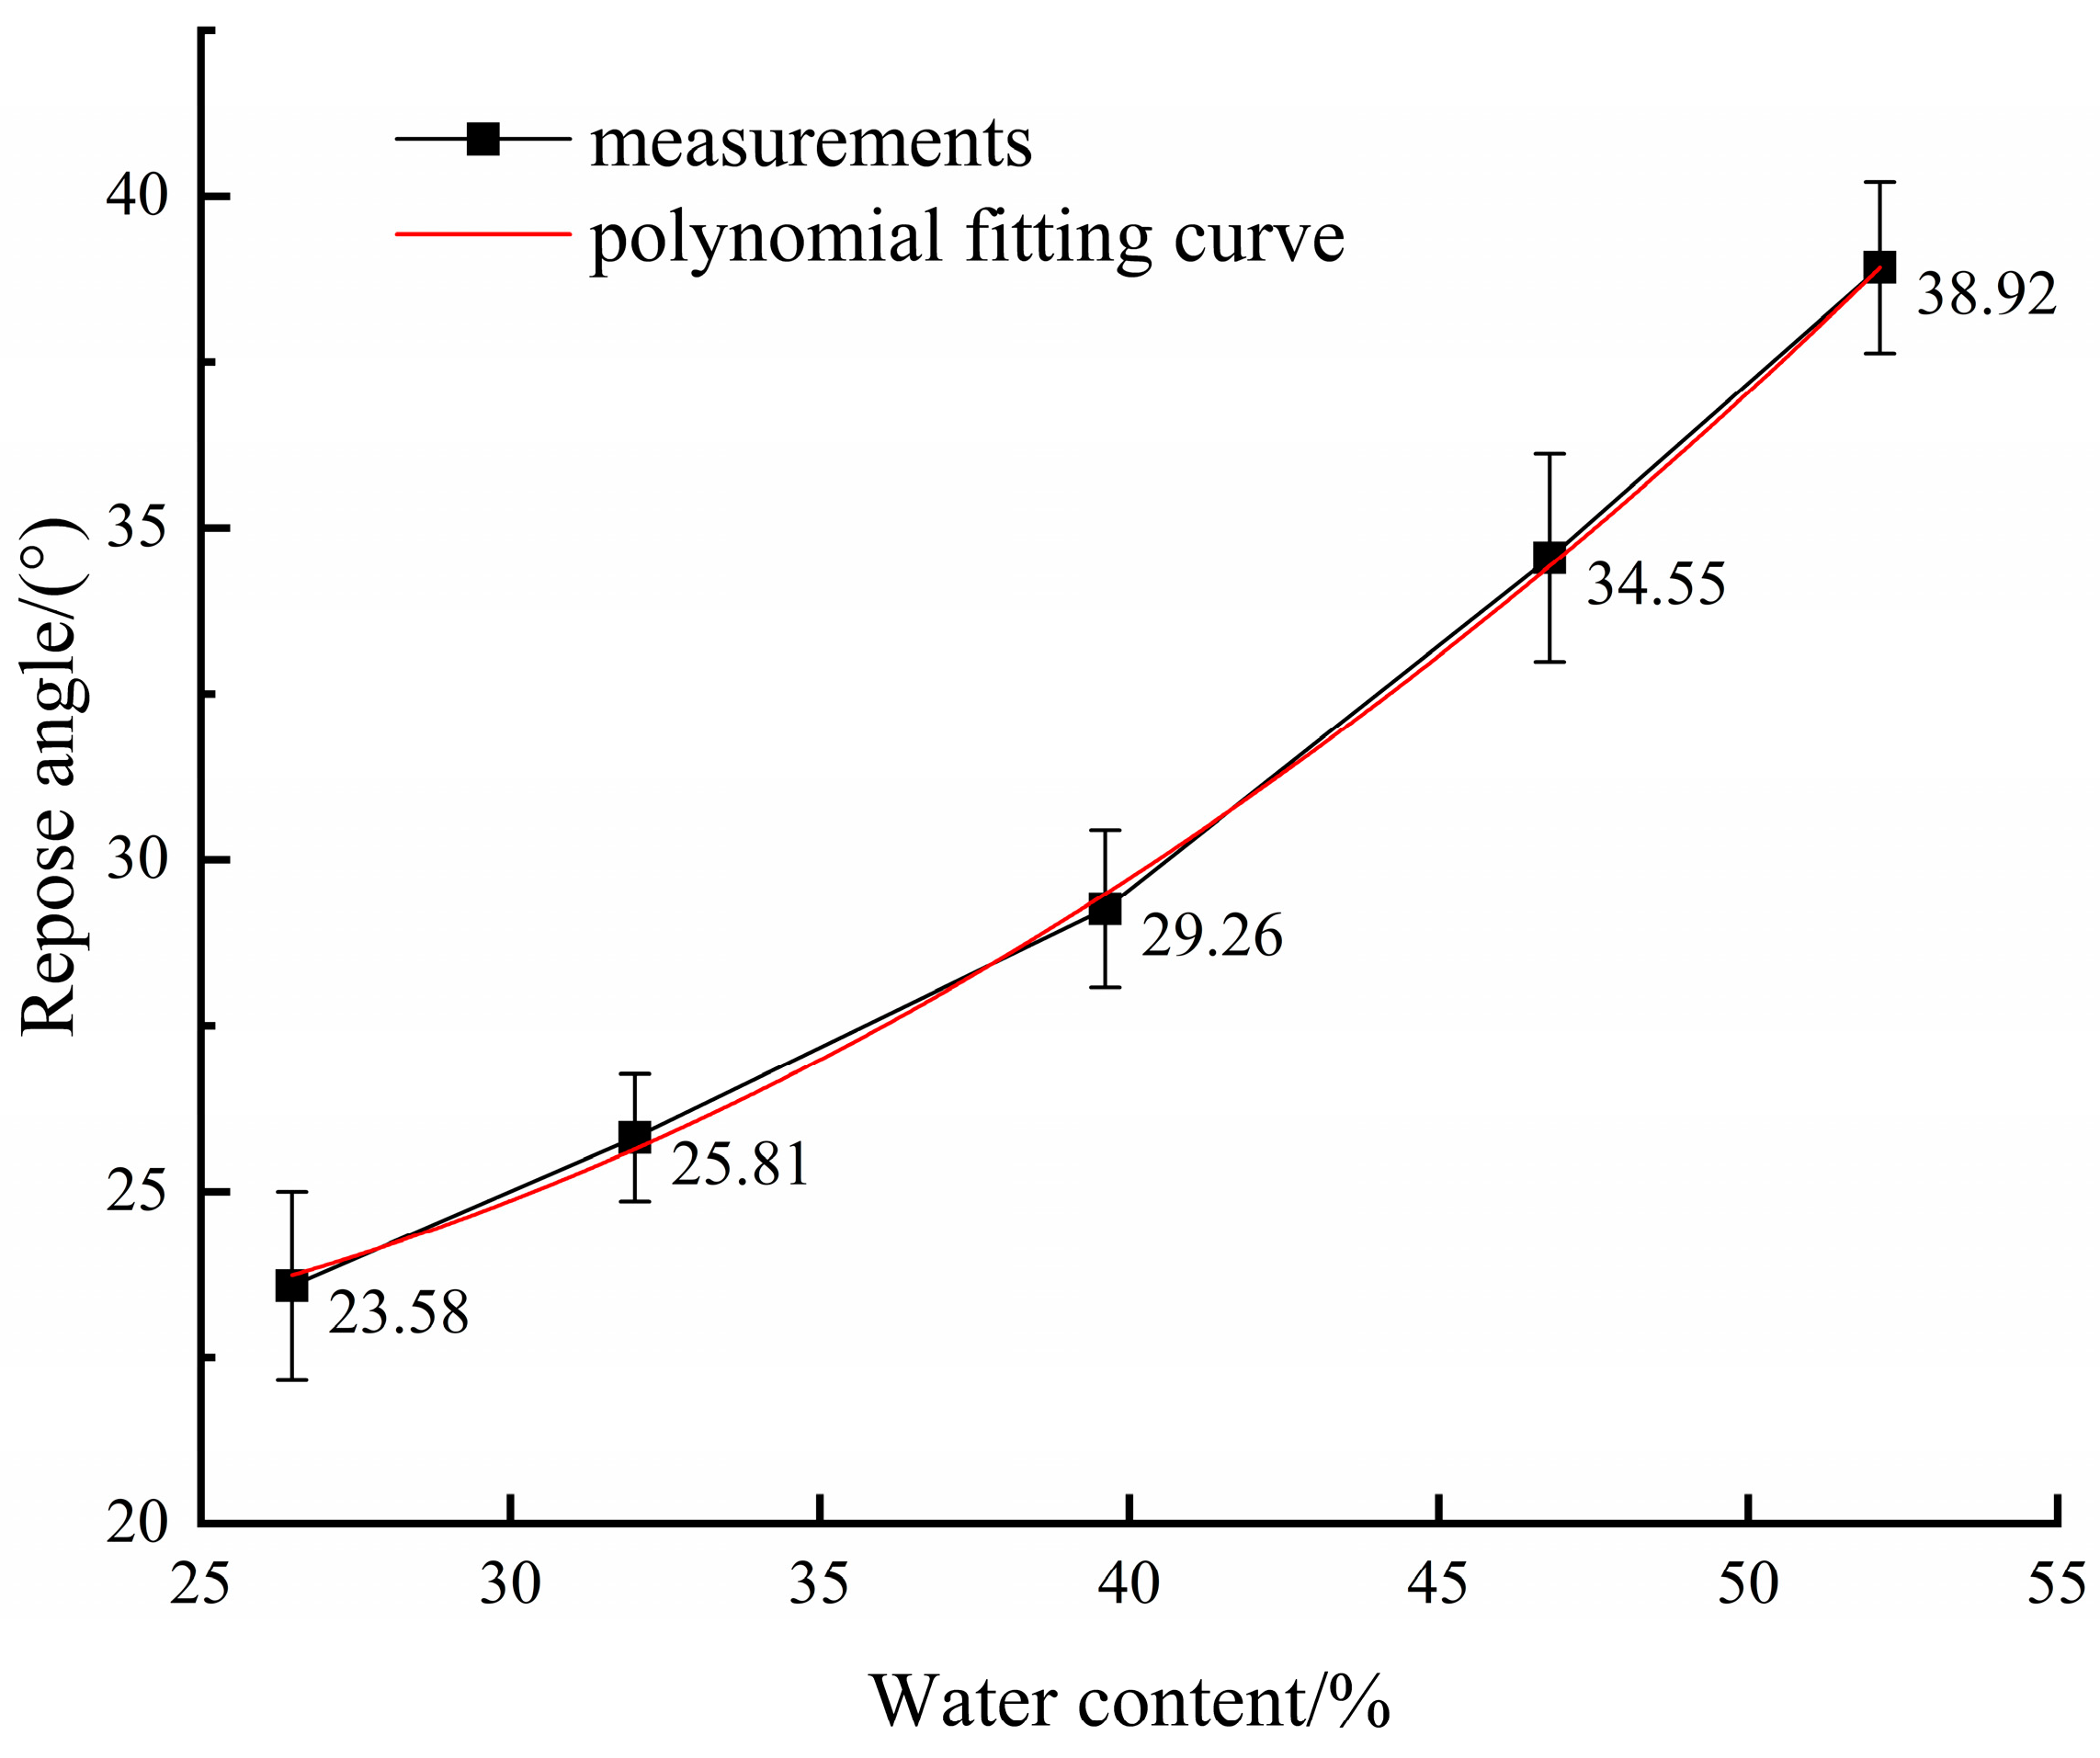
Based on the physical experiment of the cylinder-lifting method, the moisture content–accumulation angle model of cotton stalk with moisture content in the range of 26.47~52.13% was successfully constructed. Through the statistical analysis, the correlation coefficient of the model was as high as 0.9993, showing a very high goodness of fit.
(2)
Through the combination of the Plackett–Burman test and climbing test, the significant parameters of cotton stalk discrete element with moisture content in the range of 26.47~52.13% and their optimal intervals were systematically determined: the rolling friction coefficient between cotton stalks is 0.06~0.08, the static friction coefficient between cotton stalks is 0.35~0.45 and the static friction coefficient between cotton stalks and steel is 0.35~0.45. The cotton stalk stacking angle–discrete element parameter model was established by the Box–Behnken test. The model had a p < 0.0001, and the relative error was only 2.67%.
(3)
Based on the moisture content–accumulation angle model and the accumulation angle–discrete element parameter model, the moisture content–discrete element parameter model of cotton stalk was established. The reliability of the cotton stalk moisture content–discrete element parameter model was verified by the cylinder-lifting method and the plate extraction method, and the relative error was only 2.79%. The simulation test and field test were used to verify the effect of throwing and returning to the field. The relative error was only 4.75% by comparing the effect of throwing and returning to the field, with the throwing uniformity as the test index. The practicability and reliability of the moisture content–discrete element parameter model were further verified, providing the design basis and support for the mechanization research of cotton stalk conveying, throwing and returning to the field in Xinjiang.
(4)
Based on the established moisture content–discrete element parameter model and stacking angle–discrete element parameter model, through reasonable mathematical derivation and model analysis, the optimal combination of discrete element significant parameters of cotton stalk under different moisture content conditions can be accurately solved. This method is not only universal and suitable for the calibration of cotton stalk parameters under different moisture contents, but also its practicability was fully verified.
The results of this study can provide important parameter characterization for the use of discrete element method to study the dynamic characteristics of cotton stalk in cotton stalk-returning machinery and can also provide an effective reference for the calibration of discrete element simulation parameters of other crop straws with large differences in water content.

Author Contributions

Conceptualization, T.W.; methodology, T.W.; software, X.F. and J.Z.; validation, D.J. and H.G.; writing—original draft preparation, T.W.; writing—review and editing, L.Y.; supervision, L.Y.; funding acquisition, L.Y. All authors have read and agreed to the published version of the manuscript.

Funding

This research was funded by the National Key Research and Development Program of China (grant number 2022YFD2002403), the Science and Technology Department of Xinjiang Uygur Autonomous Region (grant number 2022B02020-4) and the National Cotton Industry Technology System (grant number CARS-15-23).

Data Availability Statement

The data presented in this study are available upon request from the corresponding author.

Conflicts of Interest

The authors declare no conflicts of interest.

References

  1. Wang, J.L.; Guo, F.; Wang, Y.B.; Zhang, X.J.; Gan, L.L.; Wang, X.H. Analysis of upland cotton fiber quality in Aksu Prefecture of Xinjiang in 2021. J. China Cotton. 2024, 51, 33–37. [Google Scholar]
  2. Xie, W.Y.; Ma, S.H.; Zhao, L. Research status and technical analysis of straw crushing equipment. J. Xinjiang Agric. Mech. 2023, 5, 14–17+24. [Google Scholar] [CrossRef]
  3. Song, G.P. Countermeasures for comprehensive utilization of crop straw. J. Hubei Polytech. Univ. 2002, 38, 9–12. [Google Scholar]
  4. Qin, M.; Dong, Q.; Zhong, X.H.; Zhang, M.M.; Li, W.W.; Song, H.; Zhai, L.X. Research progress of conservation tillage in China. J. Henan Agric. Sci. 2023, 52, 1. [Google Scholar]
  5. Lu, C.Y.; Luo, X.W.; Li, H.W.; Zang, Y.; Ou, Y.G. Progress and suggestions of conservation tillage in China. J. Strateg. Study CAE 2024, 26, 103–112. [Google Scholar]
  6. Wang, J.; Chen, B.; Wang, J.L.; Lu, Y.T.; Wang, M.; Song, Y.; Han, H.Y.; Wang, F.Y. Effect of different mechanization methods of straw returningon growth, yield and quality of cotton. J. Agric. Res. Arid Areas 2021, 39, 18–24+56. [Google Scholar]
  7. Qi, L.; Cao, W.L.; Lu, Y.T.; Wang, M.; Ying, Y.K.; Tan, X.Z.; Yan, P.P.; Li, Z.Q. The present application and thinking about technique of cotton stalks returned to field in Xinjiang corps. J. Anhui Agric. Sci. 2015, 43, 154–156. [Google Scholar]
  8. Ma, Z.T.; Zhao, Z.H.; Quan, W.; Shi, F.G.; Gao, C.; Wu, M.L. Calibration of discrete element parameter of rice stubble straw based on EDEM. J. Chin. Acad. Agric. Sci. 2015, 43, 154–156. [Google Scholar]
  9. Zhao, Z.H.; Wu, M.L.; Xie, S.P.; Luo, H.F.; Li, P.C.; Zeng, Y.; Jiang, X.H. Parameter calibration for the discrete element simulation of soil-preceding rice stubble and its rotary tillage trajectory. J. Trans. Chin. Soc. Agric. Eng. 2024, 40, 72–82. [Google Scholar]
  10. Wang, W.Z.; Liu, W.R.; Yuan, L.H.; Qu, Z.; He, X.; Lu, Y.L. Simulation and experiment of single longitudinal axial material movement and establishment of wheat plants model. J. Trans. Chin. Soc. Agric. Mach. 2020, 51, 170–180. [Google Scholar]
  11. Wang, X.; Tian, H.Q.; Xiao, Z.Q.; Li, D.P.; Ren, X.G.; Cheng, X.; Liu, F. Determination of corn straw stem node contact physical parameters and calibration of discrete element numerical simulation. J. Jiangsu Agric. Sci. 2023, 51, 162–170. [Google Scholar]
  12. Zhang, X.R.; Hu, X.H.; Liu, J.X.; Yang, Y.M.; Li, Y. Calibration and verification of bonding parameters of banana straw simulation model based on discrete element method. J. Trans. Chin. Soc. Agric. Mach. 2023, 54, 121–130. [Google Scholar]
  13. Zhang, J.X.; Zhang, P.; Zhang, H.; Tan, C.L.; Wan, W.Y.; Wang, Y.C. Discrete element simulation parameters calibration for xinjiang cotton straw. J. Trans. Chin. Soc. Agric. Mach. 2024, 55, 76–84. [Google Scholar]
  14. Zhang, B.C.; Chen, X.G.; Liang, R.Q.; Wang, X.Z.; Meng, H.W.; Kan, Z. Calibration and test of contact parameters between chopped cotton stalks using response surface methodology. J. Agric. 2022, 12, 1851. [Google Scholar]
  15. Liang, R.Q.; Chen, X.G.; Zhang, B.C.; Wang, X.Z.; Kan, Z.; Meng, H.W. Calibration and test of the contact parameters for chopped cotton stems based on discrete element method. J. Int. J. Agric. Biol. Eng. 2022, 15, 1–8. [Google Scholar]
  16. Liu, F.Y.; Zhang, J.; Li, B.; Chen, J. Calibration of parameters of wheat required in discrete element method simulation based on repose angle of particle heap. J. Trans. Chin. Soc. Agric. Eng. 2016, 32, 247–253. [Google Scholar]
  17. Zhu, X.H.; Fu, S.K.; Li, X.D.; Wei, Y.Q.; Zhao, W. General method for discrete element parameters calibration of goat manure with different moisture contents. J. Trans. Chin. Soc. Agric. Mach. 2022, 53, 34–41. [Google Scholar]
  18. Wang, Y.X.; Liang, Z.J.; Zhang, D.X.; Cui, T.; Shi, S.; Li, K.H.; Yang, L. Calibration method of contact characteristic parameters for corn seeds based on EDEM. J. Trans. Chin. Soc. Agric. Eng. 2016, 32, 36–42. [Google Scholar]
  19. Yin, Y.W. Design and Experimental Research of the Cotton Stalk Chopper. Ph.D. Thesis, Hunan Agricultural University, Changsha, China, 2016. [Google Scholar]
  20. Wang, W.W.; Cai, D.Y.; Xie, J.J.; Zhang, C.L.; Liu, L.C.; Chen, L.Q. Parameters calibration of discrete element model for corn stalk powder compression simulation. J. Trans. Chin. Soc. Agric. Mach. 2021, 52, 127–134. [Google Scholar]
  21. Jin, W.; Zhang, X.J.; Ding, Y.C.; Bai, S.H.; Liu, W.P.; Zhou, X.C. Experiment on suspension separation of residual film and lmpurity based on EDEM-Fluent coupling. J. Trans. Chin. Soc. Agric. Mach. 2022, 53, 89–98. [Google Scholar]
  22. Wan, X.Y.; Liao, Q.X.; Jiang, Y.J.; Shan, Y.Y.; Zhou, Y.; Liao, Y.T. Discrete element simulation and experiment of mechanized harvesting and chopping process for fodder rape crop harvest. J. Jilin Univ. 2022, 52, 2735–2745. [Google Scholar]
  23. Wang, L.M.; Fan, S.Y.; Cheng, H.S.; Meng, H.B.; Shen, Y.J.; Wang, J.; Zhou, H.B. Calibration of contact parameters for pig manure based on EDEM. J. Trans. Chin. Soc. Agric. Eng. 2020, 36, 95–102. [Google Scholar]
  24. Yuan, Q.C.; Xu, L.M.; Xing, J.J.; Duan, Z.Z.; Ma, S.; Yu, C.C.; Chen, C. Parameter calibration of discrete element model of organic fertilizer particles for mechanical fertilization. J. Trans. Chin. Soc. Agric. Eng. 2018, 34, 21–27. [Google Scholar]
  25. Zhu, K. Experimental Study on Mechanical Characteristic of Cotton Stalk. Ph.D. Thesis, Huazhong Agricultural University, Wuhan, China, 2014. [Google Scholar]
  26. Shi, N. Peeling method of cotton stalk and development of rubbing peeling machine. Ph.D. Thesis, Northwest A&F University, Xianyang, China, 2018. [Google Scholar]
  27. Zhang, P. Parameter Calibration and Crushing Verification Test of Xinjiang Cotton Straw Based on Discrete Element. Ph.D. Thesis, Xinjiang Agricultural University, Urumqi, China, 2023. [Google Scholar]
  28. Du, X.J.; Li, Y.D.; Yan, S.T.; Li, X.Z.; Song, Z.H.; Li, F.D. Mechanics Characteristics of Cotton Stalks. J. Trans. Chin. Soc. Agric. Mach. 2011, 42, 87–91. [Google Scholar]
  29. Li, P.P.; Wu, S.; Zhang, X.L.; Wang, J.Z.; Xu, Y.F. Parameter optimization of vertical screw mixing for tomato straw and fermentation strains. J. Trans. Chin. Soc. Agric. Mach. 2016, 47, 114–120. [Google Scholar]
  30. Jia, H.L.; Deng, J.Y.; Deng, Y.L.; Chen, T.Y.; Wang, G.; Sun, Z.J.; Guo, H. Contact parameter analysis and calibration in discrete element simulation of rice straw. Int. J. Agric. Biol. Eng. 2021, 14, 72–81. [Google Scholar]
  31. Zhang, T.; Liu, F.; Zhao, M.Q.; Ma, Q.; Wang, W.; Fan, Q.; Yan, P. Determination of corn stalk contact parameters and calibration of discrete element method simulation. J. China Agric. Univ. 2018, 23, 120–127. [Google Scholar]
Figure 1. Change in cotton stalk moisture content from 8 October to 28 October.
Processes 12 01770 g001
Figure 2. Cylinder-lifting method’s accumulation angle-measuring instrument.
Processes 12 01770 g002
Figure 3. Measurement of cotton stalk stacking angle.
Processes 12 01770 g003aProcesses 12 01770 g003b
Figure 4. Geometric model of cotton stalk particles.
Processes 12 01770 g004
Figure 5. Cylinder-lifting method’s simulation test.
Processes 12 01770 g005
Figure 6. Image processing.
Processes 12 01770 g006
Figure 7. Accumulation angle simulation and physical experiment based on plate-pulling method.
Processes 12 01770 g007
Figure 8. Dispersing and returning field-testing machine.
Processes 12 01770 g008
Figure 9. Fitting curve of moisture content–stacking angle of cotton stalk.
Processes 12 01770 g009
Figure 10. Simulation and physical test stacking angle.
Processes 12 01770 g010aProcesses 12 01770 g010b
Figure 11. Physical test and simulation test of plate-drawing method.
Processes 12 01770 g011
Figure 12. Physical test and simulation test of cylinder-lifting method.
Processes 12 01770 g012
Figure 13. The effect and statistical method of experimental scattering being returned to the field.
Processes 12 01770 g013
Table 1. Intrinsic parameters of cotton stalk and steel.
MaterialDensity/(g cm−3)Poisson RatioShear
Modulus/GPa
Source
Cotton stalk1.06~1.280.350.69References [21,22]
Rolled steel7.850.3079.4References [23,24]
Table 2. The range of cotton stalk contact parameters.
Exposure ParameterNumerical Value
Rolling friction coefficient between cotton stalks, X10.05~0.1
Static friction coefficient between cotton stalks, X20.3~0.6
Collision recovery coefficient between cotton stalks, X30.3~0.7
Cotton stalk–steel rolling friction coefficient, X40.05~0.1
Cotton stalk–steel static friction coefficient, X50.3~0.6
Restitution coefficient of cotton stalk–steel collision, X60.3~0.7
Table 3. Plackett–Burman experimental factor coding.
ParameterCoding
−101
Cotton stalk density/(g·cm−3), x01.061.171.28
Rolling friction coefficient between cotton stalks, x10.050.0750.1
Static friction coefficient between cotton stalks, x20.30.450.6
Collision recovery coefficient between cotton stalks, x30.30.500.7
Cotton stalk–steel rolling friction coefficient, x40.050.0750.1
Cotton stalk–steel static friction coefficient, x50.30.450.6
Restitution coefficient of cotton stalk–steel collision, x60.30.500.7
Table 4. Accumulation angle of cotton stalk with 5 groups of moisture content.
Water content/%52.1346.7939.6132.0126.47
Repose angle/(°)137.9232.6527.8224.6121.66
237.2833.2829.9325.1122.58
339.1935.0628.5625.8423.99
439.8735.2529.1226.6824.79
540.3436.5130.8726.8124.88
mean value38.9234.5529.2625.8123.58
Standard deviation/(°)1.291.571.180.961.41
Table 5. Plackett–Burman experimental design and results.
Serial Numberx0x1x2x3x4x5x6Repose Angle/(°)
1−11−111−1129.03
211−1111−130.13
311−1−1−11−129.44
41−1−1−11−1125.72
5−111−111149.44
61−1111−1−137.51
71−111−11143.32
8−1−1−11−11126.48
9−1−1−1−1−1−1−126.63
10−1111−1−1−144.43
11111−1−1−1144.54
12−1−11−111−143.65
Table 6. Parameter significance analysis.
ParameterEffectMean SquarepSaliency List
x0−1.56.750.14714
x13.9546.810.0091 **2
x215.91759.38<0.0001 **1
x3−1.426.050.16465
x40.110.03410.90467
x52.4317.760.0436 *3
x61.123.790.25016
Note: * means significant difference (p < 0.05), and ** means extremely significant difference (p < 0.01).
Table 7. Steepest climbing test.
Serial Numberx1x2x5Simulation Accumulation Angle/(°)Relative Error/%
10.050.30.326.838.305
20.060.350.3527.535.913
30.070.40.430.032.632
40.080.450.4533.5114.525
50.090.50.537.5628.336
Table 8. Box–Behnken experimental factor coding.
CodingParameter
x1x2x5
−10.060.350.35
00.070.400.40
10.080.450.45
Table 9. Box–Behnken experimental design and results.
Serial Numberx1x2x5Simulation Accumulation Angle/(°)
1−11052.66
200036.55
300032.21
400038.19
5−10149.36
600042.48
700035.97
8−10−120.99
9−1−1033.51
1010153.18
1101−135.63
121−1044.94
1310−133.25
140−1146.84
1511057.92
160−1−123.51
1701156.46
Table 10. Analysis of variance of Box–Behnken experimental model.
Source of VarianceMean SquareDegree of FreedomAverage SquareFp
Model1840.919204.5520.080.0003 **
x1134.231134.2313.180.0084 **
x2362.751362.7535.610.0006 **
x51068.6111068.61104.90<0.0001 **
x1280.82180.827.930.0259 *
x22141.461141.4613.890.0074 **
Residual error71.30710.19
Misfit term15.6835.230.37590.7762
Pure error55.62413.91
Summation1912.2216
Note: * means significant difference (p < 0.05), and ** means extremely significant difference (p < 0.01).
Table 11. Optimal values of discrete element parameters of cotton stalk under different moisture contents and verification test results.
Water Content/%Physical Test Stacking Angle/(°)Rolling Friction Coefficient between Cotton StalksStatic Friction Coefficient between Cotton StalksCotton Stalk–Steel Static Friction CoefficientSimulation Accumulation Angle/(°)Relative Error/%
26.4723.580.0680.3850.36023.171.74
32.0125.810.0610.3970.36426.211.55
39.6129.260.0740.4130.35330.042.67
46.7934.550.0630.3840.39933.981.65
52.1338.920.0740.3550.40638.650.69
Table 12. Verification test results by plate-drawing method.
Water Content/%Formula Stacking Angle/(°)Rolling Friction Coefficient between Cotton StalksStatic Friction Coefficient between Cotton StalksCotton Stalk–Steel Static Friction CoefficientSimulation Accumulation Angle/(°)Physical Test Stacking Angle/(°)Relative Error/%
28.4224.260.0630.3980.36026.1325.452.67
35.6727.290.0650.3840.37428.3627.602.75
44.9333.030.0630.3850.39333.6533.301.05
Table 13. Cylinder-lifting method’s verification test results.
Water Content/%Formula Stacking Angle/(°)Rolling Friction Coefficient between Cotton StalksStatic Friction Coefficient between Cotton StalksCotton Stalk–Steel Static Friction CoefficientSimulation Accumulation Angle/(°)Physical Test Stacking Angle/(°)Relative Error/%
28.4224.260.0630.3980.36024.4024.851.81
35.6727.290.0650.3840.37428.0327.272.79
44.9333.030.0630.3850.39333.9433.451.46
Table 14. Simulation and field test results.
Test Measuring PointsSimulation Test Dispersion Uniformity/%Field Test Throwing Uniformity/%Relative Error/%
184.7787.292.89
286.1283.742.76
386.6582.534.75
Disclaimer/Publisher’s Note: The statements, opinions and data contained in all publications are solely those of the individual author(s) and contributor(s) and not of MDPI and/or the editor(s). MDPI and/or the editor(s) disclaim responsibility for any injury to people or property resulting from any ideas, methods, instructions or products referred to in the content.

