Article

A Study on the Influence of Oxy-Hydrogen Gas Flame on the Combustion Stability of Coal Powder and Nitrogen Oxide Emissions

Key Laboratory of Liaoning Province for Clean Combustion Power Generation and Heating Technology, Shenyang Institute of Engineering, Shenyang 110136, China
*
Author to whom correspondence should be addressed.
Processes 2024, 12(8), 1777; https://doi.org/10.3390/pr12081777
Submission received: 22 July 2024 / Revised: 13 August 2024 / Accepted: 17 August 2024 / Published: 22 August 2024
(This article belongs to the Section Energy Systems)

Abstract

:
Co-firing zero-carbon fuels as an effective emission reduction strategy in coal combustion processes has garnered widespread attention. This paper proposes utilizing the combustion performance of oxy-hydrogen gas derived from zero-carbon fuels to address issues related to low-concentration coal powder combustion and nitrogen oxide emissions. A test apparatus for coal powder combustion initiated by oxy-hydrogen gas flames was constructed, and experimental and simulation methods were employed to study the impact of oxy-hydrogen gas flame initiation on the temperature inside the combustion chamber, coal powder gasification combustion reactions, and nitrogen oxide emissions. The results indicate that with an excess air coefficient of 0.8, as the oxy-hydrogen gas flow rate increased from 0.022 kg/h to 0.789 kg/h, the average temperature inside the combustion chamber increased from 801 K to 1459 K. The volatile matter release rate and its combustion reaction rate increased, leading to a decrease in volatile matter content. The peak concentration of volatiles was shifted from a position of 68 mm to 7 mm, and the proportion of Cchar–H2O reaction increased from 5% to 34%. NO emissions decreased from 132 ppm to 68 ppm, and the rate of reduction in NO emissions decreased from 15.38% to 5.49%.

1. Introduction

Under the “dual-carbon” strategy, the National Development and Reform Commission of China has outlined in the “Medium- and Long-Term Plan for Hydrogen Energy Industry Development (2021–2035)” that hydrogen energy is a crucial component of the future national energy system and a key carrier for achieving a green and low-carbon transition in end-use energy. In the future, utilizing surplus renewable energy for hydrogen production and implementing the co-firing of green hydrogen-based fuels in coal-fired power plants will provide a technological pathway for the low-carbon transformation of coal power. This approach aims to accelerate the development of a clean, low-carbon, safe, and efficient new energy system, contributing to the achievement of peak carbon and carbon neutrality goals. Oxy-hydrogen gas, a hydrogen–oxygen mixture produced by water electrolysis, is generated with a precise stoichiometric ratio of H2 to O2 (2:1, 60.79% H2 and 30.39% O2). It combusts without the need for additional oxidizers, achieving a flame temperature of up to 3000 K. The only byproduct is water vapor, making it a clean and efficient carbon-free fuel. Oxy-hydrogen gas is produced from renewable electricity, used immediately without storage or transportation, and is safer than hydrogen in use. Given the properties and advantages of oxy-hydrogen gas, researchers both domestically and internationally have initiated studies on the high-value utilization of oxy-hydrogen gas in conjunction with carbon-based fuels. These efforts have laid a foundation for improving the combustion efficiency of carbon-based fuels and reducing pollutant emissions.
The scholar Arjun [1] utilized oxy-hydrogen gas as a fuel additive in internal combustion engines, resulting in a net increase in brake power of 2% to 5.7% and an increase in brake thermal efficiency pf 10.26% to 34.9%. It was observed that fuel consumption decreased from 30% to 20%, while average CO and NO emissions, respectively, decreased by 18% and 14%. Gad et al. [2] explored the emissions and performance of cotton ethyl ester blends in diesel engines using enriched oxy-hydrogen gas and kerosene additives. Kenanolu et al. [3] investigated compensating for the drawbacks of using ammonia as the primary fuel in gas turbines with oxy-hydrogen gas. The study compared the combustion performance of propane, pure ammonia, and ammonia enriched with 3 L/min, 5 L/min, and 7 L/min of oxy-hydrogen gas at a flow rate of 10 L/min. Results indicated that besides enhancing gas turbine performance and eliminating carbon emissions, oxy-hydrogen gas should also be utilized to control NOx emissions. Gu et al. [4] developed a medium-sized oxy-hydrogen gas generator and subsequently introduced oxy-hydrogen gas into a biomass thermal air gasifier for co-combustion. Results showed average reductions in CO, NOx, and smoke concentrations by 93.0%, 22.5%, and 80%, respectively. The integration of biomass fuel with oxy-hydrogen gas effectively reduces pollutant emissions and saves fuel. Demir et al. [5] investigated the effects of adding fuel, graphene, and HHO gas on the performance and exhaust emissions of diesel engines through experimental methods. They found that with increasing amounts of graphene and HHO gas, the thermal efficiency of the diesel engine improved, while the exhaust emissions decreased. In China, a research team from the School of Automotive Engineering at Jilin University [6,7] conducted experimental studies on the impact of oxy-hydrogen gas supply on the performance of heavy-duty diesel engines. The results indicated that due to the blending of oxy-hydrogen gas, the combustion of atomized diesel fuel in the combustion chamber became more thorough, resulting in improved fuel utilization efficiency. Zhang et al. [8] from Zhejiang University investigated the combustion characteristics of three commonly used coals in a one-dimensional furnace, based on clean gas (HHO) assisted ultra-low load combustion technology, using the actual peak-shaving process of a power plant boiler as the simulation object. They found that the addition of HHO significantly improved the combustion stability of the three types of coal powders at ultra-low loads. Zhao et al. [9] from Jilin University experimentally investigated the effects of varying HHO flow rates, excess air ratios, and exhaust gas recirculation (EGR) rates on the performance of gasoline direct injection engines. The results indicated that the synergistic effect of gasoline direct injection, HHO, and EGR significantly improved combustion performance and pollutant emissions under lean-burn conditions. They also identified the optimal operating conditions for a spark-ignition engine as 1500 rpm, intake manifold pressure of 42 kPa, HHO flow rate of 16 L/min, and EGR rates between 6% and 12%.
The above research demonstrates the significant potential of oxy-hydrogen gas in assisting the combustion of carbon-based fuels. Building on this research, we propose a technical approach for oxy-hydrogen gas-assisted pulverized coal combustion. This study proposes substituting traditional fuels with oxy-hydrogen gas in power plant coal boilers, alongside plasma and gas ignition technologies. It establishes an oxy-hydrogen gas-assisted coal combustion system and investigates the effects of oxy-hydrogen gas flame temperature and water vapor concentration on the stability of coal powder gasification combustion and NOx emissions using experimental and simulation methods. This research provides theoretical insights for promoting renewable energy integration, expanding hydrogen energy applications, and enhancing the reliability of peak shaving in power plant coal boilers.

2. Numerical Simulation

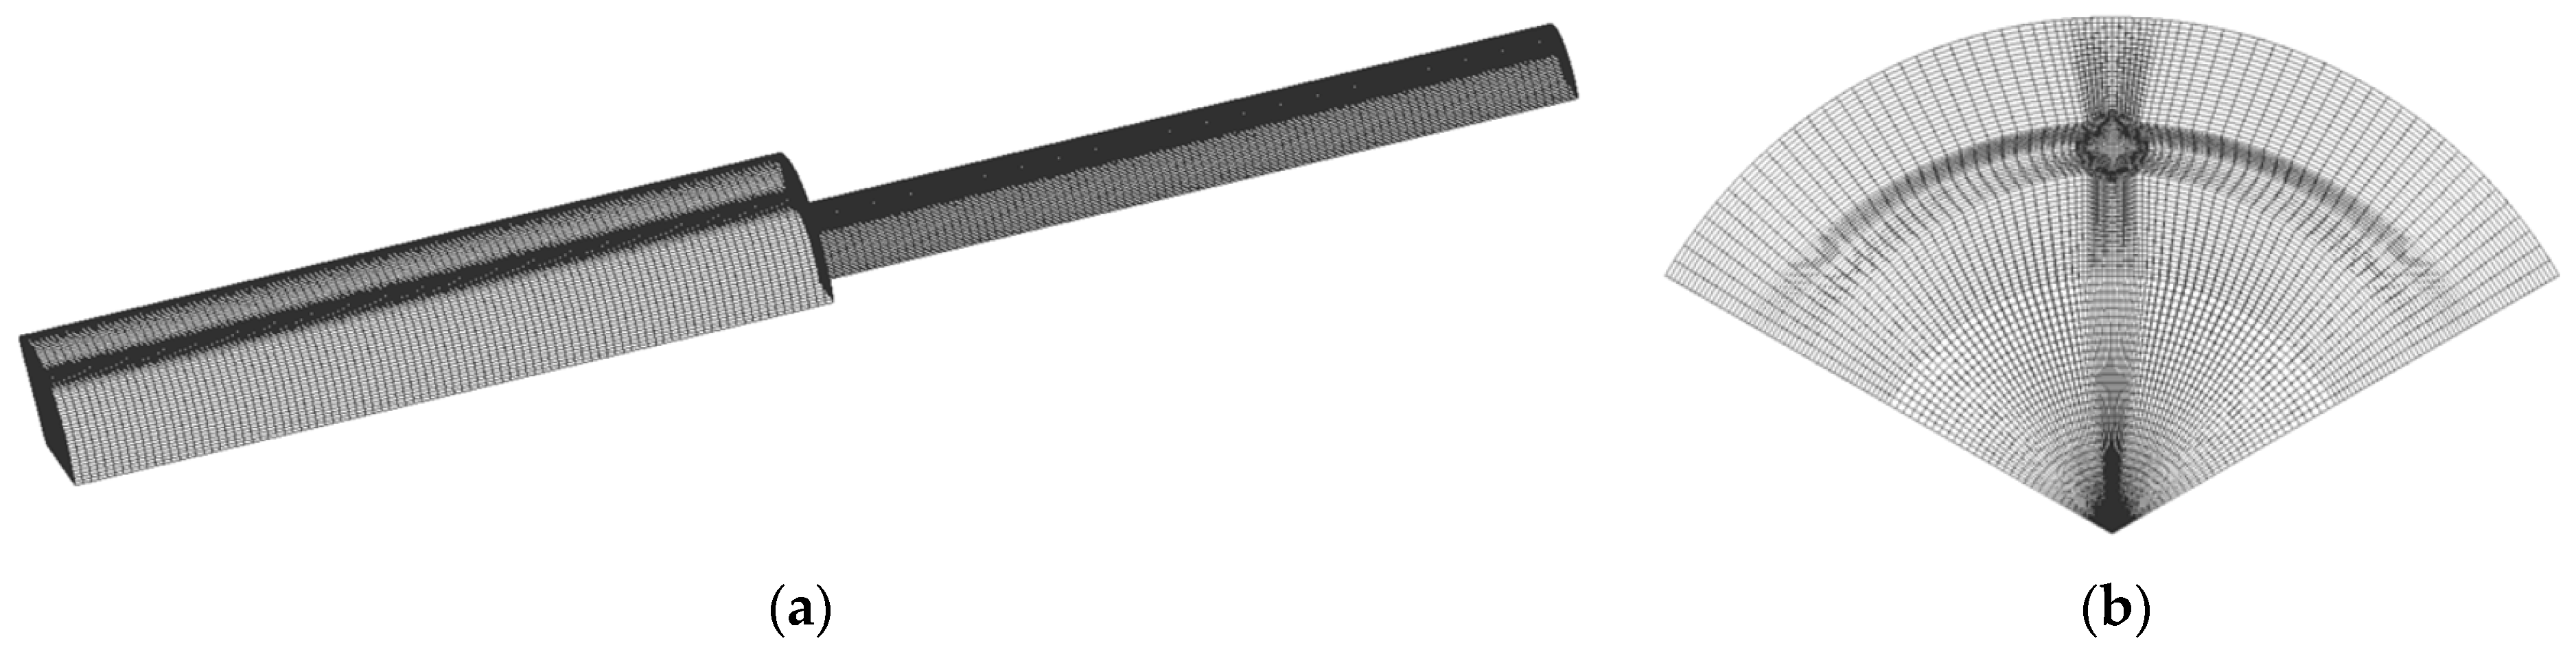
2.1. Geometric Structure

The simulated objects are two cylindrical combustion chambers with different diameters, referred to as the first-stage combustion chamber and the second-stage combustion chamber. The diameter of the first-stage combustion chamber is 28 mm, and the diameter of the second-stage combustion chamber is 56 mm. Both combustion chambers have a height of 200 mm. The first-stage combustion chamber is defined as the gasification area. At the 200 mm elevation, there are three circular secondary air inlets with a diameter of 4 mm each. The primary air inlet is located at the bottom, with an outer diameter of 28 mm and an inner diameter of 1 mm in a ring-shaped area. A circular area with a 1 mm inner diameter serves as the inlet for the oxy-hydrogen gas. The measurement points for experimental data are distributed on the cross-section as shown in Figure 1.

2.2. Simulation Method

This study utilizes ICEM CFD 2021 R1 for mesh generation. To save computational time and cost, given the symmetry of the combustion chamber, only one-third of the combustion chamber is modeled and simulated. A structured hexahedral mesh is employed, with refinement in specific localized regions. The overall mesh and localized mesh refinement are depicted in Figure 2.
This study utilizes the FLUENT 2021 R1 simulation platform, assuming the gas-phase flow is steady-state with gravity in the z-direction at −9.81 m/s2, the simulation utilizes the Standard k-ε turbulence model. For gas-phase heat transfer, the P1 radiation model is utilized. Component transport models are utilized to calculate changes in each gas-phase component. The gas-phase combustion model selected is the finite-rate/eddy-dissipation model within a volume reaction framework. A coupled algorithm of second-order accuracy is used to solve the pressure-velocity coupling. The convergence criterion for the energy equation is set to 10−6, and for other equations, it is set to 10−3.
We utilized the DPM model to simulate the motion and combustion of coal particles. The devolatilization of coal particles follows a single-rate model. Coal particle size distribution adheres to the Rosin–Rammler function. For modeling coal particle combustion, the multiple surface reactions model was selected, comprising three steps of carbon surface reactions and five steps of volume combustion reactions. Detailed reaction specifics and parameters can be found in Table 1, where ‘A’ represents the pre-exponential factor, ‘Ea’ represents the activation energy (kJ/mol), and coefficients for reactants and products are rounded to three decimal places. The WSGGM model is utilized for the absorption coefficient of the mixed gas, with a scattering coefficient of 0.5. The initial temperature was 293.15 K, and the particle diameter was 80 μm. The specific heat of coal was taken as 1680 J/(kg·K), without considering interactions between particles. This study utilized FLUENT’s built-in post-processing capabilities to predict the impact of fuel-type NOx, thermal NOx, and prompt NOx on NOx generation. The NOx model employed a temperature probability density function (PDF), specifically a β-PDF function.

2.3. Model Validation

To validate the accuracy of the simulation work, we utilized a test rig based on the experimental setup described in reference [15], and measured the temperature distribution within the combustion chamber using thermocouples. Three sets of experiments were conducted under identical operating conditions, with the average values of these three experimental data sets being taken to minimize experimental error. Both the experiments and simulations employed the same type of coal, Fushun bituminous coal from Liaoning Province, China. The industrial and elemental analyses of this coal are presented in Table 2.
The experimental results are compared with the simulation results in Figure 3a, showing that the temperature discrepancy along the central axis of the combustion chamber is within 5%. This indicates the reliability of the simulation. This study also conducted grid independence verification using the same mesh generation method. Three different mesh configurations were created: a fine grid with 1,681,800 cells, a medium grid with 1,512,848 cells, and a coarse grid with 1,227,720 cells. The grid independence validation is shown in Figure 3b. It is evident that temperature variations along the axial distance remain consistent across different mesh densities. Therefore, the coarse grid with 1,227,720 cells was ultimately selected for subsequent simulation work.

2.4. Simulation Conditions

To explore the influence of different excess air coefficients on the water vapor volume fraction of combustion products in pulverized coal combustion initiated by oxy-hydrogen gas ignition, this study conducted both numerical simulations investigations. A coal powder flow rate of 10 g/min was selected for numerical simulation, and the required amounts of air and oxy-hydrogen gas for each condition were calculated based on the theoretical complete combustion reaction equation. Fifteen operational conditions were established, as shown in Table 3. The water vapor volume fraction is equal to the volume of water vapor divided by the sum of the volumes of water vapor and air, multiplied by 100%.

3. Results and Discussion

To investigate the impact of oxy-hydrogen gas on coal powder combustion, this study focuses on simulating and analyzing the effects of oxy-hydrogen gas ignition methods on temperature distribution, gasification products, and NOx emissions within the combustion chamber. Since the only byproduct of oxy-hydrogen gas combustion is water vapor, the water vapor volume fraction is used as a proxy to represent the concentration of oxy-hydrogen gas.

3.1. Temperature Distribution

Figure 4a illustrates the numerical simulation results of the average temperature distribution within the combustion chamber for different oxy-hydrogen gas flow rates. The numerical calculation results show that the average temperature in the combustion chamber increases with the oxy-hydrogen gas flow rate. The high-temperature flame produced by oxy-hydrogen gas primarily heats the combustion chamber rapidly through convective heat transfer. With a thermal conductivity of 0.024 W/(m·K) for the combustion chamber, the temperature within the combustion chamber rises from 651 K to 975 K as the oxy-hydrogen gas flow rate increases from 0.022 kg/h to 0.789 kg/h, thereby meeting the high-temperature conditions required for rapid pulverized coal gasification combustion. When the oxy-hydrogen gas flow rate increases from 0.022 kg/h to 0.132 kg/h, the temperature rise is 62 K. However, as the oxy-hydrogen gas flow rate further increases from 0.132 kg/h to 0.296 kg/h, the temperature rise increases to 96 K. This indicates that, compared to lower flow rates of oxy-hydrogen gas, the temperature rise exhibits a slightly greater increase with higher oxy-hydrogen gas flow rates. It is noteworthy that when the Brown’s gas flow rate increases from 0.296 kg/h to 0.507 kg/h, a change of 0.211 kg/h, the corresponding temperature rise is similar to that observed when the flow rate increases from 0.132 kg/h to 0.296 kg/h. The temperature increases in these two cases are 80 K and 96 K, respectively. This phenomenon occurs because, by the time the oxy-hydrogen gas flow rate reaches 0.296 kg/h, the concentration of water vapor within the combustion chamber has reached a saturation point. Increasing the oxy-hydrogen gas flow rate further results in additional heat being absorbed primarily by the water vapor, which has a high specific heat capacity. Consequently, under high flow rate conditions, even though the oxy-hydrogen gas flow rate increment increases, the temperature rise does not correspondingly increase. This indicates that although temperature shows a positive correlation with oxy-hydrogen gas flow rate, once the flow rate exceeds a certain threshold—such as 0.296 kg/h mentioned in this study—the rate of temperature increase begins to slow down.
Figure 4b illustrates the average temperature distribution in the gasification zone of coal powder combustion under oxy-hydrogen gas ignition for conditions 1 to 15. It can be observed that with an excess air coefficient of 0.8, as the water vapor volume fraction increases from 0% to 10%, the temperature in the gasification zone rises from 800 K to 947 K, an increase of 147 K. Conversely, when the water vapor volume fraction increases from 10% to 20%, the temperature in the gasification zone rises from 947 K to 1200 K, an increase of 253 K. Notably, the latter temperature increase is 1.7 times greater than the former. This is because, when the volumetric fraction of water vapor increases from 0% to 10%, the coal dust undergoes a rapid Cchar–H2O gasification reaction with the water vapor after the volatiles are released. Both the volatile release process and the gasification reaction between the coke and water vapor absorb significant amounts of heat, which exerts a suppressive effect on the temperature increase. When the volumetric fraction of water vapor increases from 10% to 20%, the increased oxy-hydrogen gas flow rate generates additional heat. This not only meets the thermal demand for rapid coal dust gasification but also significantly enhances the temperature rise within the combustion chamber. Additionally, the oxidation reaction of the coke releases substantial amounts of heat, further contributing to the temperature increase. However, when the volumetric fraction of water vapor increases from 20% to 30% and from 30% to 40%, the temperature increments are only 100 K and 160 K, respectively, showing a significant decrease in the temperature rise. This phenomenon is similar to the situation observed with oxy-hydrogen gas combustion alone, where the temperature increment decreases as the water vapor fraction increases from 20% to 30%. Both cases are attributed to the heat absorption by the high concentration of water vapor. It is noteworthy that, with a water vapor volume fraction of 10%, as the excess air coefficient increases from 0.8 to 1.0, the temperature in the gasification zone rises from 947 K to 1000 K. When the excess air coefficient further increases from 1.0 to 1.2, the temperature in the gasification zone rises from 1000 K to 1120 K. This is due to the increased intake of air, which ensures more complete combustion of the coal powder and consequently releases a substantial amount of heat. Regardless of changes in the excess air coefficient, the temperature increment exhibits a trend of initially increasing and then decreasing with a rising water vapor fraction.

3.2. Gas Composition Distribution

The central flame temperature of oxy-hydrogen gas can reach 3000 K, allowing for rapid heating of the coal powder and the swift release of volatile components. This intense heat rapidly heats the coal dust, thereby accelerating the substantial release of volatiles. Figure 5a shows the variations in the mass fraction of the volatiles and the positions of the peak release for conditions 1 through 15, where α represents the excess air coefficient. As shown in the figure, when the excess air coefficient is 0.8, increasing the steam volume fraction from 0% to 10% reduces the average mass fraction of volatiles from 0.305 to 0.225. Although the temperature increase from 800 K to 947 K promotes the release of volatile matter, it also significantly accelerates the oxidation reactions of the volatile matter. As a result, instead of the expected increase, the content of volatile matter actually decreases with rising temperature. As shown in the figure, with an excess air coefficient of 0.8, increasing the water vapor volume fraction from 0% to 10% decreases the average mass fraction of volatiles from 0.305 to 0.225. Although raising the temperature from 800 K to 947 K promotes the release of volatiles, it also significantly enhances the oxidation reactions of the volatiles. Consequently, instead of the anticipated increase, the content of volatiles actually exhibits a decreasing trend with higher temperatures. The trend in the oxidation reaction rate of volatiles with increasing water vapor volume fraction, as shown in Figure 5b, supports this conclusion. Under an excess air coefficient of 0.8, as the water vapor volume fraction increases from 0% to 10%, the oxidation reaction rate of volatiles rises significantly from 0.009 kg∙mol/(m3∙s) to 0.05 kg∙mol/(m3∙s), leading to greater consumption of volatiles. Moreover, under an excess air coefficient of 0.8, as the water vapor volume fraction increases from 0% to 10%, the location of the peak concentration of volatiles shifts notably from 68 mm to 15 mm. This indicates a significant advance in the release of volatiles. However, as the water vapor volume fraction increases further from 10% to 40%, the location of the peak concentration of volatiles remains relatively unchanged. This indicates that oxy-hydrogen gas ignition method facilitates the early release of volatiles during the coal powder combustion process. However, the effectiveness of oxy-hydrogen gas in promoting the early release of volatiles is relatively insensitive to the flow rate of the oxy-hydrogen gas. Additionally, as shown in Figure 5a, when the water vapor volume fraction remains constant, the average mass fraction of volatiles gradually decreases with increasing excess air coefficient. When the excess air coefficient increases from 0.8 to 1.0, the reduction in volatiles content is more pronounced compared to the reduction observed when the excess air coefficient increases from 1.0 to 1.2. This is because the increase in the excess air coefficient from 0.8 to 1.0 transitions the combustion of pulverized coal from an oxygen-deficient regime to a stoichiometric regime, significantly enhancing the heat release from coal combustion. This shift promotes the oxidation reaction of volatiles by increasing both the reactants and the reaction heat.
Some researchers suggest that the concentration of gasification gas (CO and H2) is an indicator of gasification reaction intensity [16]. The gasification gas distribution maps for conditions 1–5 and conditions 7 and 12 are shown in Figure 6a. As shown in the figure, when the excess air coefficient is 0.8, the concentration of gasification gas increases from 0.006 to 0.026 as the water vapor volume fraction increases from 0% to 10%, with a concentration increase of only 0.02. However, when the water vapor volume fraction increases from 10% to 20%, the gasification gas concentration rises from 0.026 to 0.095, resulting in a significantly greater concentration increase of 0.069. This is because, as previously discussed, when the water vapor volume fraction increases from 0% to 10%, the temperature rise within the combustion chamber is relatively modest, and the water vapor volume fraction remains relatively low. Consequently, the rate of the Cchar–H2O gasification reaction between coke and water vapor increases only slightly. In contrast, when the water vapor volume fraction increases from 10% to 20%, the rate of this gasification reaction increases significantly. However, the increase in gasification gas concentration corresponding to water vapor volume fractions rising from 20% to 30% and from 30% to 40% decreases to 0.02 and 0.005, respectively. However, the increase in gasification gas concentration for water vapor volume fractions rising from 20% to 30% and from 30% to 40% decreases to 0.02 and 0.005, respectively. This is because a coal powder flow rate of 10 g/min is insufficient to react completely with the excess water vapor. Additionally, the high water vapor concentration lowers the temperature rise within the combustion chamber, which in turn reduces the rate of increase in the gasification reaction. Figure 6a also shows that with a water vapor volume fraction of 0.8, as the excess air coefficient increases from 0.8 to 1.0, the gasification gas concentration rises from 0.026 to 0.045. However, further increasing the excess air coefficient does not significantly change the gasification gas concentration. This is because increasing the excess air coefficient from 0.8 to 1.0 introduces more air, which enhances the exothermic oxidation process of the coal char with air. This, in turn, directly increases the rate of gasification reaction between the coal char and water vapor.
From Figure 6b, it can be observed that when the excess air coefficient is 0.8, as the volumetric fraction of water vapor increases from 0% to 20%, the proportion of the Cchar–H2O gasification reaction significantly increases, with corresponding values of 9% and 15%. However, as the water vapor volumetric fraction increases from 20% to 40%, the rate of increase in the proportion of the coke-water gasification reaction diminishes. The increase in the proportion of the coke–CO2 reaction is lower compared to the increase in the proportion of the coke–water reaction. This is because the increased intake of water vapor facilitates the occupation of active sites on the coal char surface by water molecules, thereby reducing the frequency of CO2 and O2 interactions with these active sites. This suppression of the Cchar–CO2 and Cchar–O2 gasification reactions significantly promotes the Cchar–H2O gasification reaction. When the volumetric fraction of water vapor is 10%, increasing the excess air coefficient from 0.8 to 1.2 directly enhances the proportion of reactions between coal char and oxygen as well as carbon dioxide. This is due to the introduction of additional air, which positively promotes the reaction between coke and oxygen, leading to increased carbon dioxide production, and thereby indirectly accelerates the reaction rate between coke and carbon dioxide.

3.3. NO Emission Characteristics

The oxy-hydrogen gas ignition method significantly enhances the coke gasification reaction through improvements in both temperature and gas composition, leading to increased gasification gas production. The high reducing potential of the gasification gas aids in reducing NO emissions via the reburning process. Additionally, the increased concentration of water vapor promotes the formation of a porous structure in the coke, facilitating the occupation of active sites on the char surface by NO, thus accelerating the reduction of NO by the coke [17]. The reburning process of NO includes both homogeneous and heterogeneous reduction phases. The homogeneous reduction of NO primarily involves the reduction of NO to N2 through the interaction with reducing species such as CHi, CO, and NHi, which are produced from the pyrolysis of reburn fuel. The main reaction mechanisms are as follows:
N O + C H i H C N +
H C N + O / O H N 2 +
N O + N H i N 2 +
C H i + O C O + H +
The heterogeneous reduction of NO primarily involves the reaction between coke and nitrogen oxides. This process can be summarized as follows: coke adsorbs NO from the flue gas and undergoes a reduction reaction with NO, producing N2 and other by-products. The main reaction mechanisms are as follows:
N O + C O C O 2 + 0.5 N 2
N O + 2 C C ( N ) + C ( O )
C ( N ) + C ( N ) N 2 + 2 C
C ( O ) C O
C ( O ) + C O C O 2 + C
In the equation, C(N) and C(O) represent the nitrogen and oxygen atoms adsorbed on the carbon, respectively. Figure 7 shows the NO emission levels at the outlet of the combustion chamber under operating conditions 1 to 15. From Figure 7, it can be observed that with a constant excess air coefficient, the NO emission decreases overall as the volumetric fraction of water vapor increases from 0% to 40%. However, as the volumetric fraction of water vapor increases by 10% increments, the corresponding reduction in NO emissions decreases sequentially, with the NO reduction decreasing from 15.38% initially to 5.49%. The associated changes in the volumetric fraction of water vapor are from 0% to 10% and from 30% to 40%, respectively. This is because, when the volumetric fraction of water vapor increases from 0% to 10%, the temperature inside the combustion chamber is relatively lower, and thermal NO has not yet formed. Additionally, the concentration of gasification gas significantly increases, which promotes the reduction reaction of NO, leading to a larger reduction in NO emissions. When the volumetric fraction of water vapor increases from 30% to 40%, the reduction in NO emissions diminishes significantly. This is because, although the concentration of highly reducing gasification gas increases, the formation of thermal NO also rises due to the higher temperature in the combustion chamber. The combined effect of gasification gas promoting NO reduction and the increased generation of thermal NO results in a reduced extent of NO emission decrease. Figure 7 also shows that with a constant volumetric fraction of water vapor, NO emissions increase with the excess air coefficient. This is because the intake of more air enhances the burnout rate of coal char and increases the conversion of char-N to NO, leading to higher NO emissions.

4. Conclusions

In this study, an independently developed oxy-hydrogen gas-assisted pulverized coal combustion system was utilized to investigate the effects of oxy-hydrogen gas ignition on coal powder gasification combustion and nitrogen oxide emission characteristics. Numerical simulations were conducted to analyze the temperature distribution, gasification gas composition, and NO emission characteristics within the combustion chamber under low-load conditions. The main conclusions are as follows:
(1)
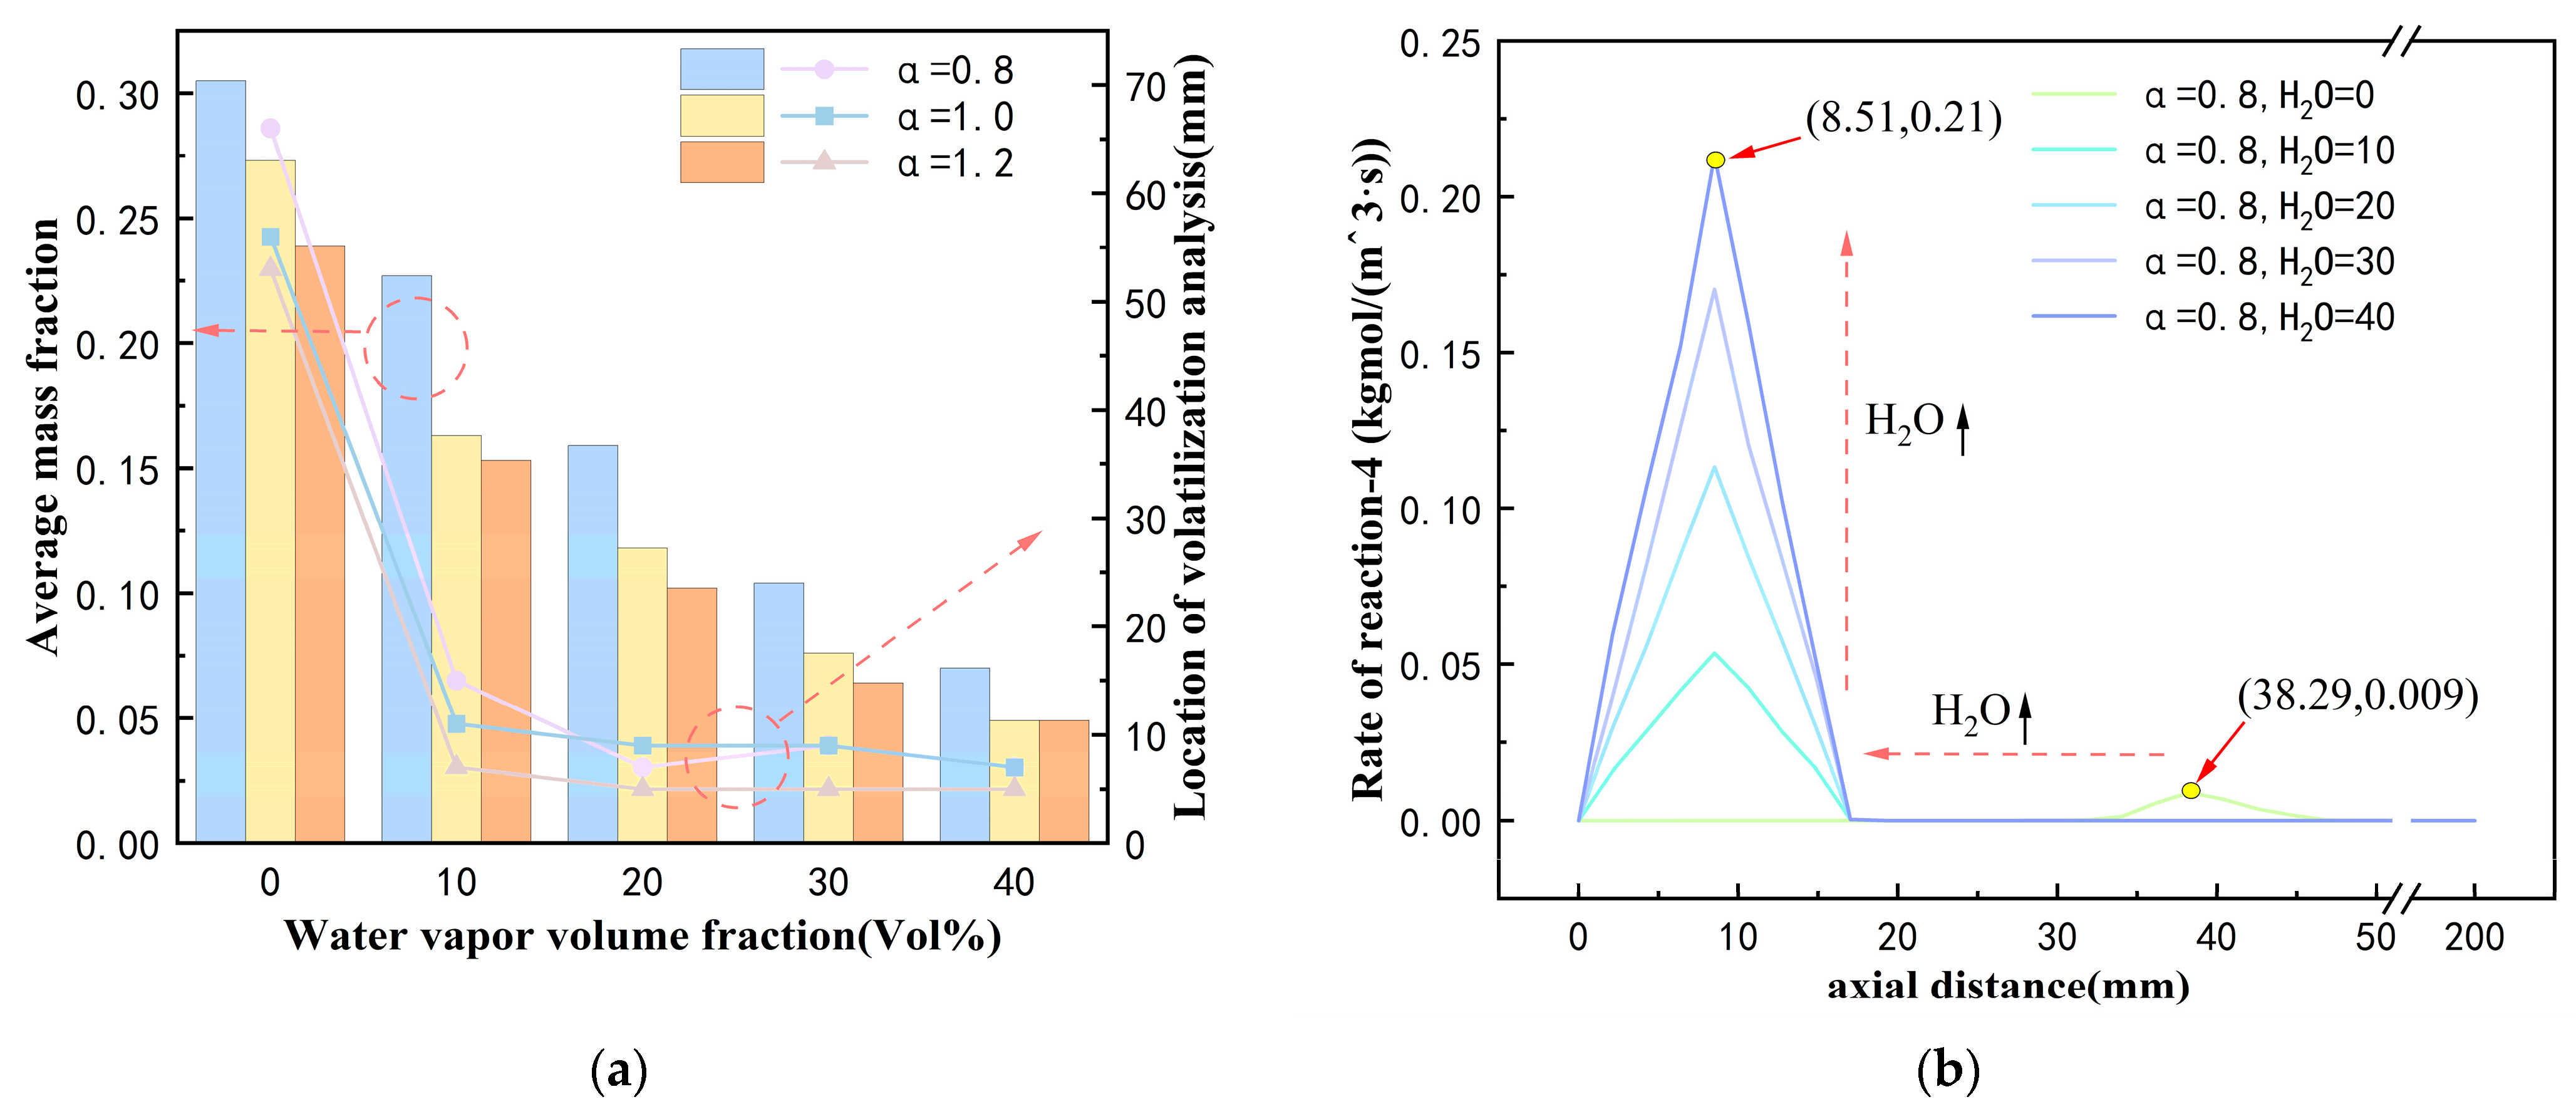
Without preheating the coal powder flow, the flames and high-temperature steam generated by oxy-hydrogen gas combustion facilitate the rapid release of volatile components from the coal powder. At an oxy-hydrogen gas flow rate of 0.022 kg/h, the combustion chamber temperature rises to 641 K, creating favorable conditions for the rapid release of volatiles. When the excess air coefficient is 0.8, increasing the steam volume fraction from 0% to 40% raises the average temperature in the combustion chamber from 801 K to 1459 K. This substantial temperature increase enhances the peak concentration of volatiles and shifts the release position of the peak concentration from 68 mm to 7 mm;
(2)
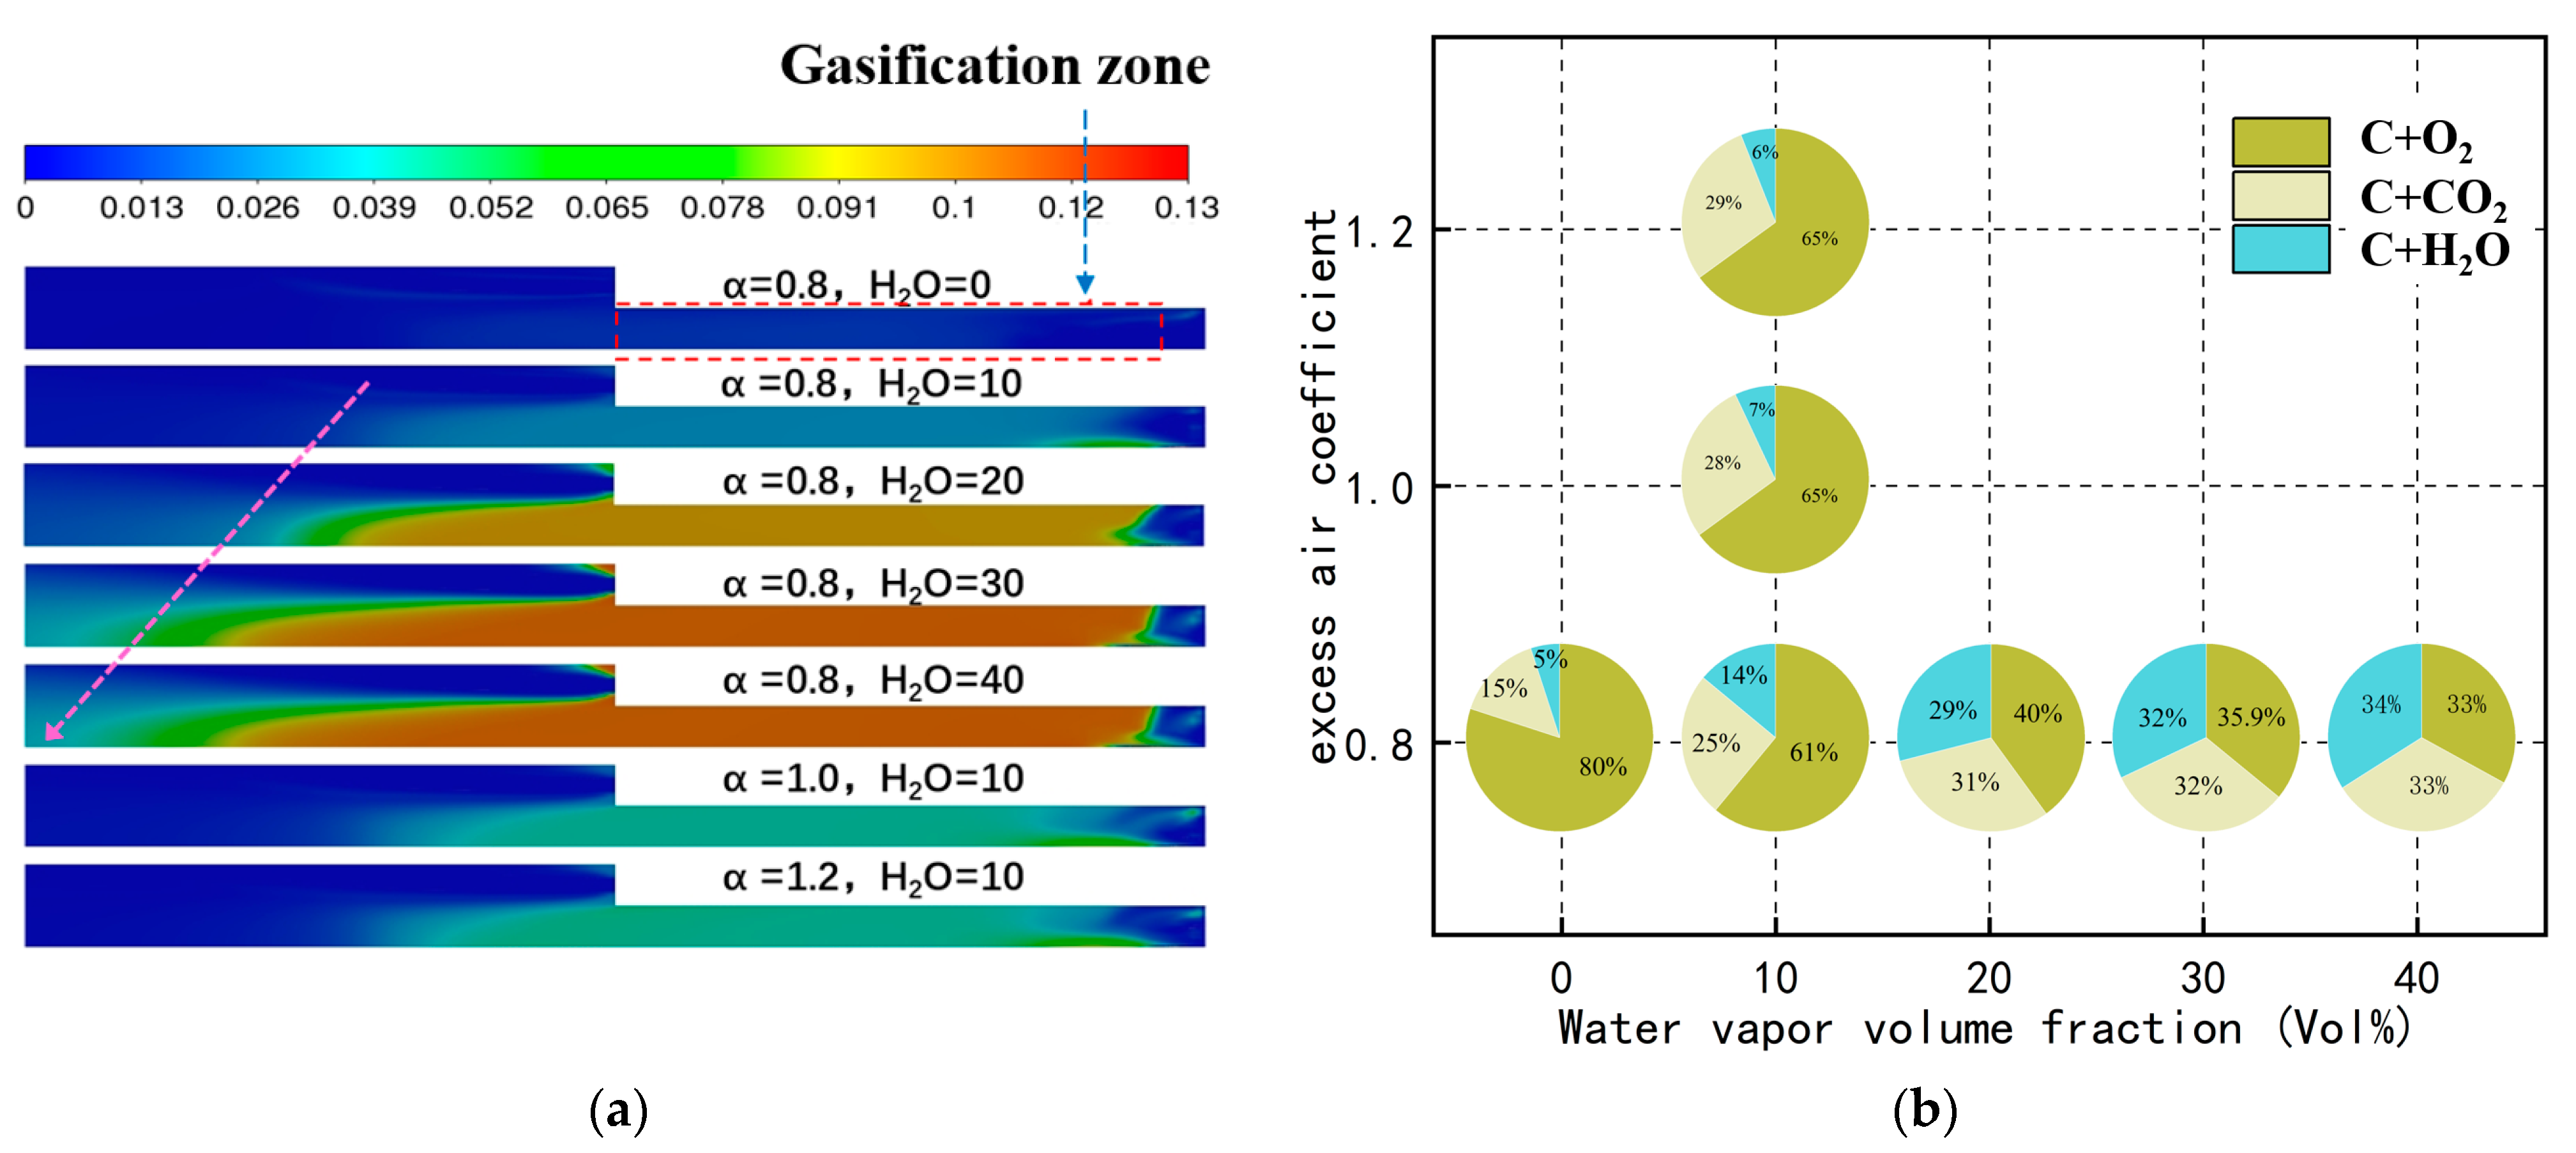
Under oxy-hydrogen gas ignition, the generation of a large amount of high-temperature steam significantly enhances the gasification reaction between coke and water vapor. With an excess air coefficient of 0.8, increasing the steam volume fraction from 0% to 40% raises the proportion of the reaction between coke and water vapor from 5% to 34%. Additionally, the average mass fraction of the gasification gas increases substantially from 0.006 to 0.12. The high concentration of gasification gas can either directly combust to achieve stable combustion or leverage its reducing properties to reduce NO emissions;
(3)
The high-temperature steam generated by oxy-hydrogen gas combustion facilitates the gasification reactions during coal powder combustion, resulting in the production of a substantial amount of highly reducing gasification gas. This reducing gas can directly reduce NO to N2, thereby lowering nitrogen oxide emissions. With an excess air coefficient of 0.8, increasing the water vapor volume fraction from 0% to 40% reduces NO emissions from 132 ppm to 86 ppm. Furthermore, as the water vapor volume fraction increases, the rate of reduction in NO emissions decreases from 15.38% to 5.49%.

Author Contributions

Conceptualization, H.Z.; Software, Z.X.; Investigation, S.Y.; Data curation, H.P.; Writing—original draft, J.C.; Writing—editing & review, W.X.; Visualization, Y.X.; Supervision, Y.F. All authors have read and agreed to the published version of the manuscript.

Funding

This study was supported by Science and Technology Project of Shenyang Science and Technology Bureau (22-322-3-20); Project of Science and Technology Department of Liaoning Province (2022-MS-304 and XNLG2481); Liaoning Province Science and Technology Plan Joint Program (2023JH2/101700257 and 2023JH2/101700256); Basic Research Projects of Higher Education Institutions in Liaoning Province (JYTMS20230299 and LJKZZ20220138).

Data Availability Statement

The datasets generated or analyzed during this study are available from the corresponding author on reasonable request.

Conflicts of Interest

The authors declare no conflict of interest.

References

  1. Arjun, T.; Atul, K.; Muraleedharan, A.P.; Walton, P.A.; Bijinraj, P.; Raj, A.A. A review on analysis of HHO gas in IC engines. Mater. Today Proc. 2019, 11, 1117–1129. [Google Scholar] [CrossRef]
  2. Gad, M.S.; El-Fakharany, M.K.; Elsharkawy, E.A. Effect of HHO gas enrichment on performance and emissions of a diesel engine fueled by biodiesel blend with kerosene additive. Fuel 2020, 280, 118632. [Google Scholar] [CrossRef]
  3. Kenanoğlu, R.; Baltacioğlu, E. An experimental investigation on hydroxy (HHO) enriched ammonia as alternative fuel in gas turbine. Int. J. Hydrogen Energy 2021, 46, 29638–29648. [Google Scholar] [CrossRef]
  4. Gu, X.; Cheng, M.; Zhang, X.; Zeng, Y. The pollutant discharge improvement by introducing HHO gas into biomass boiler. Int. J. Hydrogen Energy 2021, 46, 23292–23300. [Google Scholar] [CrossRef]
  5. Demir, U.; Çelebi, S.; Özer, S. Experimental investigation of the effect of fuel oil, graphene and HHO gas addition to diesel fuel on engine performance and exhaust emissions in a diesel engine. Int. J. Hydrogen Energy 2024, 52, 1434–1446. [Google Scholar] [CrossRef]
  6. Liu, Y.F. Experimental Study on Effect of Oxy-Hydrogen Gas HHO Supply on Performance of Heavy-Duty Diesel Engine. Master’s Thesis, Jilin University, Changchun, China, 2019. [Google Scholar]
  7. Wang, X. Experimental Study on the Influence of Oxy-Hydrogen Gas Supply on Gasoline Engine Performance. Master’s thesis, Jilin University, Changchun, China, 2022. [Google Scholar] [CrossRef]
  8. Zhang, Y.; Wu, Q.; Zhu, Y.; Kang, X.; Hou, B.; Zhou, H. Combustion stability and emission characteristics of a pulverized coal furnace operating at ultra-low loads assisted by clean gas (HHO) from water electrolysis. Fuel 2024, 370, 131811. [Google Scholar] [CrossRef]
  9. Zhao, Z.; Huang, Y.; Yu, X.; Guo, Z.; Li, M.; Wang, T. Effect of brown gas (HHO) addition on combustion and emission in gasoline engine with exhaust gas recirculation (EGR) and gasoline direct injection. J. Clean. Prod. 2022, 360, 132078. [Google Scholar] [CrossRef]
  10. Pratt, D.T.; Smoot, L.; Pratt, D. Pulverized Coal Combustion and Gasification; Springer: Berlin, Germany, 1979; Volume 1007, p. 978-1. Available online: https://link.springer.com/book/10.1007/978-1-4757-1696-2 (accessed on 16 August 2024).
  11. Howard, J.B.; Williams, G.C.; Fine, D.H. Kinetics of carbon monoxide oxidation in postflame gases. Symp. (Int.) Combust. 1973, 14, 975–986. [Google Scholar] [CrossRef]
  12. Field, M.A. Measurements of the effect of rank on combustion rates of pulverized coal. Combust. Flame 1970, 14, 237–248. [Google Scholar] [CrossRef]
  13. Hautman, D.J.; Dryer, F.L.; Schug, K.P.; Glassman, I. A multiple-step overall kinetic mechanism for the oxidation of hydrocarbons. Combust. Sci. Technol. 1981, 25, 219–235. [Google Scholar] [CrossRef]
  14. Jones, W.P.; Lindstedt, R.P. Global reaction schemes for hydrocarbon combustion. Combust. Flame 1988, 73, 233–249. [Google Scholar] [CrossRef]
  15. Cui, J.; Zhao, H.; Xu, Y.; Yang, S.; Pan, H.; Xiao, W.; Fu, Y.; Xue, Z. Experimental investigation on oxy-hydrogen gas flame injecting coal powder gasification and combustion. Processes 2024, 12, 692. [Google Scholar] [CrossRef]
  16. Zhao, Z.; Zhang, Z.; Zha, X.; Gao, G.; Li, X.; Wu, F.; Luo, C.; Zhang, L. Internal association between combustion behavior and NOx emissions of pulverized coal MILD-oxy combustion affected by adding H2O. Energy 2023, 263, 125878. [Google Scholar] [CrossRef]
  17. Li, Y.; Sun, R.; Wu, J.; Wang, Z.; Wang, M.; Song, Z. Effect of H2O on char-nitrogen conversion during char-O2/H2O combustion under high-temperature entrained flow conditions. Combust. Flame 2019, 207, 391–405. [Google Scholar] [CrossRef]
Figure 1. (a) Side view of the combustion chamber; (b) Top view of the combustion chamber.
Processes 12 01777 g001
Figure 2. (a) Overall grid diagram; (b) Encryption grid diagram.
Processes 12 01777 g002
Figure 3. (a) Temperature change of combustion chamber center axis; (b) Grid independence verification.
Processes 12 01777 g003
Figure 4. (a) Temperature change in combustion chamber under different oxy-hydrogen gas flow rate; (b) Average temperature change in combustion chamber when oxy-hydrogen gas flame ignites pulverized coal.
Processes 12 01777 g004
Figure 5. (a) Trend of volatile release in the coal powder gasification zone with varying water vapor volume fraction; (b) Variation of reaction rate of coal powder gasification reaction (4) under different oxy-hydrogen gas flow rates.
Processes 12 01777 g005
Figure 6. (a) Contour map of gasification gas concentration; (b) The proportion of carbon surface reactions.
Processes 12 01777 g006
Figure 7. NO emissions at the outlet of the combustion chamber under operating conditions 1 to 15.
Processes 12 01777 g007
Table 1. The combustion reaction mechanism of coal powder.
ProjectEquationChemical ReactionAEa/(kJ/mol)Cite
Carbon surface reaction(1)C(s) + 0.5O2 → CO2.39.23E+07[10]
(2)C(s) + CO2 → 2CO4.41.62E+08[10]
(3)C(s) + H2O → CO+H21.331.47E+08[10]
Volume combustion reaction(4)Vol + 1.471O2 → 1.38CO + 2.069H2O + 0.041N22.119E+112.027E+08Fluent
(5)CO + 0.5O2 → CO21.3E+111.26E+08[11]
(6)H2 + 0.5O2 → H2O3.9E+171.7E+08[12]
(7)CO + H2O → CO2 + H22.75E+098.4E+07[13]
(8)CO2 + H2 → CO + H2O6.81E+101.14E+08[14]
Table 2. Industrial analysis and elemental analysis of bituminous coal [15].
Industrial Analysis/(%)Elemental Analysis/(%)
MadVadAadFCadCdafHdafNdafOdafSdaf
1.1031.6911.7755.4485.775.431.385.222.21
Table 3. Experimental and simulated operating conditions.
ConditionExcess Air CoefficientWater Vapor Volume Fraction/%Mass Flow Rate of Primary Air/(kg/h)Mass Flow Rate of Secondary Air/(kg/h)
10.800.0340.136
20.8100.0340.136
30.8200.0340.136
40.8300.0340.136
50.8400.0340.136
61.000.0420.169
71.0100.0420.169
81.0200.0420.169
91.0300.0420.169
101.0400.0420.169
111.200.0510.203
121.2100.0510.203
131.2200.0510.203
141.2300.0510.203
151.2400.0510.203
Disclaimer/Publisher’s Note: The statements, opinions and data contained in all publications are solely those of the individual author(s) and contributor(s) and not of MDPI and/or the editor(s). MDPI and/or the editor(s) disclaim responsibility for any injury to people or property resulting from any ideas, methods, instructions or products referred to in the content.

