Article

Pressurized Regenerative Calcium Cycle for Utility-Scale Energy Storage: A Techno-Economic Assessment

1
Centre for Innovative Energy Technologies, The University of Newcastle, Callaghan, NSW 2308, Australia
2
Jord International Pty Ltd., St Leonards, NSW 2065, Australia
*
Author to whom correspondence should be addressed.
Processes 2024, 12(8), 1778; https://doi.org/10.3390/pr12081778
Submission received: 6 July 2024 / Revised: 19 August 2024 / Accepted: 21 August 2024 / Published: 22 August 2024
(This article belongs to the Special Issue Advances in Renewable Energy Systems (2nd Edition))

Abstract

:
The University of Newcastle (UON) and Jord International Pty Ltd. (Jord) have jointly developed a novel concept for the storage of energy from renewable and fossil fuel sources. The process, referred to as the pressurized regenerative calcium cycle (PRC2), relies on cyclic carbonation and calcination of CaO/CaCO3, in which low-cost electrical energy (i.e., off-peak, or excess generation from renewables) drives the calcination reaction and electricity is generated as required through the carbonation reaction. Initial proof-of-concept testing of the process was previously conducted within an existing fluid bed reactor at UON. The PRC2 concept was successfully demonstrated by maintaining the fluid bed reactor at a constant temperature by using the heat released during the reaction of calcium oxide and carbon dioxide. Following proof-of-concept testing, further refinement of the PRC2 process, which is the subject of this paper, was conducted to address its shortcomings and, importantly, facilitate the detailed design, construction, and operation of a large-scale demonstration plant. Nine different configurations were examined for the PRC2 process, for each of which a combined experimental, process modelling, and techno-economic assessment was completed. Experimental investigations were conducted to determine the suitability of carbonate materials for the PRC2 process. Process modelling and levelized cost of storage (LCOS) calculations were concurrently conducted and revealed that the molten salt approach (Option 9) was the most promising, having superior round-trip efficiency and lowest LCOS. For practical reasons (e.g., technical difficulties of working with molten salts), Option 3 (indirect power generation using a fluid bed reactor) was deemed the most feasible option for a demonstration scale plant. The LCOS for Option 3 (assuming a 100 MWe capacity) was calculated to be AUD 245 per MWh, which is on par with the cost of batteries for peak power replacement applications (the cost associated with lithium-ion batteries is AUD 370 per MWh).

1. Introduction

Calcium looping-based processes are considered by many to be very effective and viable options for thermochemical energy storage, particularly for grid- and/or utility-scale applications [1,2,3,4,5,6]. They are among the most suitable options for load-shifting and/or time-shifting operations due to their high side storage temperatures (up to 950–1000 °C). Importantly, calcium looping-based processes can be employed in conjunction with renewable energy systems (e.g., for solar thermal energy storage) or deployed alongside fossil fuel-based generating assets such as coal-fired power plants.
Motivated by the same drivers, the University of Newcastle (UON) and Jord International Proprietary Limited (Jord) have recently completed a joint program of study aimed at developing a novel calcium looping-based process for the storage of energy from renewable and fossil fuel sources. The process, named pressurized regenerative calcium cycle (PRC2), relies on a cyclic carbonation and calcination process of calcium carbonate-rich minerals, for example, limestone or dolomite. During periods when electricity is at a low cost (e.g., off-peak periods or periods of excessive generation from renewables), the carbonate particles undergo calcination to form calcium oxide (CaO). The necessary heat for this endothermic reaction is provided by Joule heating of the reactor. During calcination, the carbonate particles are forced to relinquish their carbon dioxide (CO2) content. This is achieved by using a steady flow of CO2 to maintain the partial pressure of CO2 in the reactor at levels which, according to Le Chatelier’s principle, shift the reaction towards the production of more CO2. The resulting CO2 then runs through a compressor and is stored in a pressurized tank. During the peak period, when additional power is required, the CaO particles undergo a rapid and exothermic reaction caused by exposure to CO2 drawn from the storage tank. The hot CO2 flow is then taken from the outlet of the carbonation reactor and channeled through an externally fired turbo-generator for the production of electricity. The turbine exhaust gas is then passed through a heat exchanger (HEX) and used to preheat the pressurized CO2 stream entering the carbonation reactor. A single reactor can be utilized, for both the calcination and the carbonation, by altering the process conditions.
Proof-of-concept testing of the PRC2 process within an existing fluid bed reactor at UON has previously been completed. In that study, the PRC2 concept was successfully demonstrated by maintaining the fluid bed reactor at a constant temperature of 740 °C (the operating limit of the existing reactor) using the heat released during the reaction of CaO and CO2. These tests were conducted with air/CO2 mixtures by exploiting the known CaCO3/CaO/CO2 equilibrium curve, as presented in Figure 1. In Figure 1, it is highlighted that at a reaction temperature of 740 °C, 5.9 vol.% CO2 is required before the carbonation reaction will occur. In the case of proof-of-concept experiments, 13.4 vol.% CO2 was provided to the bed, of which 7.3 vol.% was captured to generate the heat required to maintain the bed at 740 °C and overcome the heat losses from the system. Practically, the PRC2 process would need to operate using 100% CO2 to allow for compression and storage of the CO2 following the calcination cycle. Further, operating using 100% CO2 requires calcination temperatures in excess of 900 °C, as shown by the CaCO3/CaO/CO2 equilibrium curve in Figure 1.
Further refinement of the PRC2 process (the subject of this paper) was conducted following proof-of-concept testing, in order to develop a concept design that addressed the technical challenges of the PRC2 process identified in proof-of-concept testing, and in doing so, open a pathway to the detailed engineering design, construction, and operation of a demonstration plant in the future. The preliminary concept design of the PRC2 process proposed is presented in Figure 2.
The process depicted in Figure 2 is a closed-loop carbon dioxide system in which the process alternates between calcination and carbonation cycles. During carbonation, carbon dioxide from the bulk storage vessel is first heated before being passed through a turbine. Turbine 1 recovers part of the energy used to compress the carbon dioxide for storage during the calcination cycle. Following Turbine 1, the CO2 will be at the operating pressure of the fluid bed. The gas passes through Heat Stove 2 to increase the temperature of the gas before it enters the fluid bed. Some CO2 will be captured by the calcium oxide in the fluid bed. This carbonation reaction provides the heat necessary for power production at Turbine 2. The hot off-gas from the fluid bed passes through a cyclone to remove any entrained particles before it enters Turbine 2. The concept design shows an open-cycle turbine system in which the hot off-gas is used directly in the turbine. The turbine exhaust gas is then compressed to the fluid bed operating pressure and recycled. An alternative to the open-cycle system is a closed-cycle system in which the off-gas from the fluid bed heats the turbine working fluid. This would avoid direct contact with the off-gas, which may still contain fine particles not removed by the cyclone. At the completion of the carbonation cycle, the process would be switched to the calcination cycle. The temperature of the fluid bed would be increased to a level greater than 900 °C. Temperatures above 900 °C are required for the calcination reaction to proceed when using 100% carbon dioxide as the process gas. Part of the CO2 released during the calcination reaction would be recycled to maintain fluidization of the calcium carbonate. The recycling loop may consider a high-temperature fan or, alternatively, heat exchangers and a low-temperature fan. The remaining carbon dioxide would be passed through Heat Stove 2 to cool the gas before compression. Heat generated from the compression cycle would be stored in Heat Stove 1, allowing the compressed gas to be stored at a low temperature, thus reducing the size of the storage vessel. Using the preliminary concept design presented in Figure 2 as a starting point, Phase II of the project involved an iterative approach incorporating process modelling, experimental investigations, and a techno-economic assessment, with the results from each task informing the next iteration of the concept design. Several key challenges were identified during the development of the preliminary concept design:
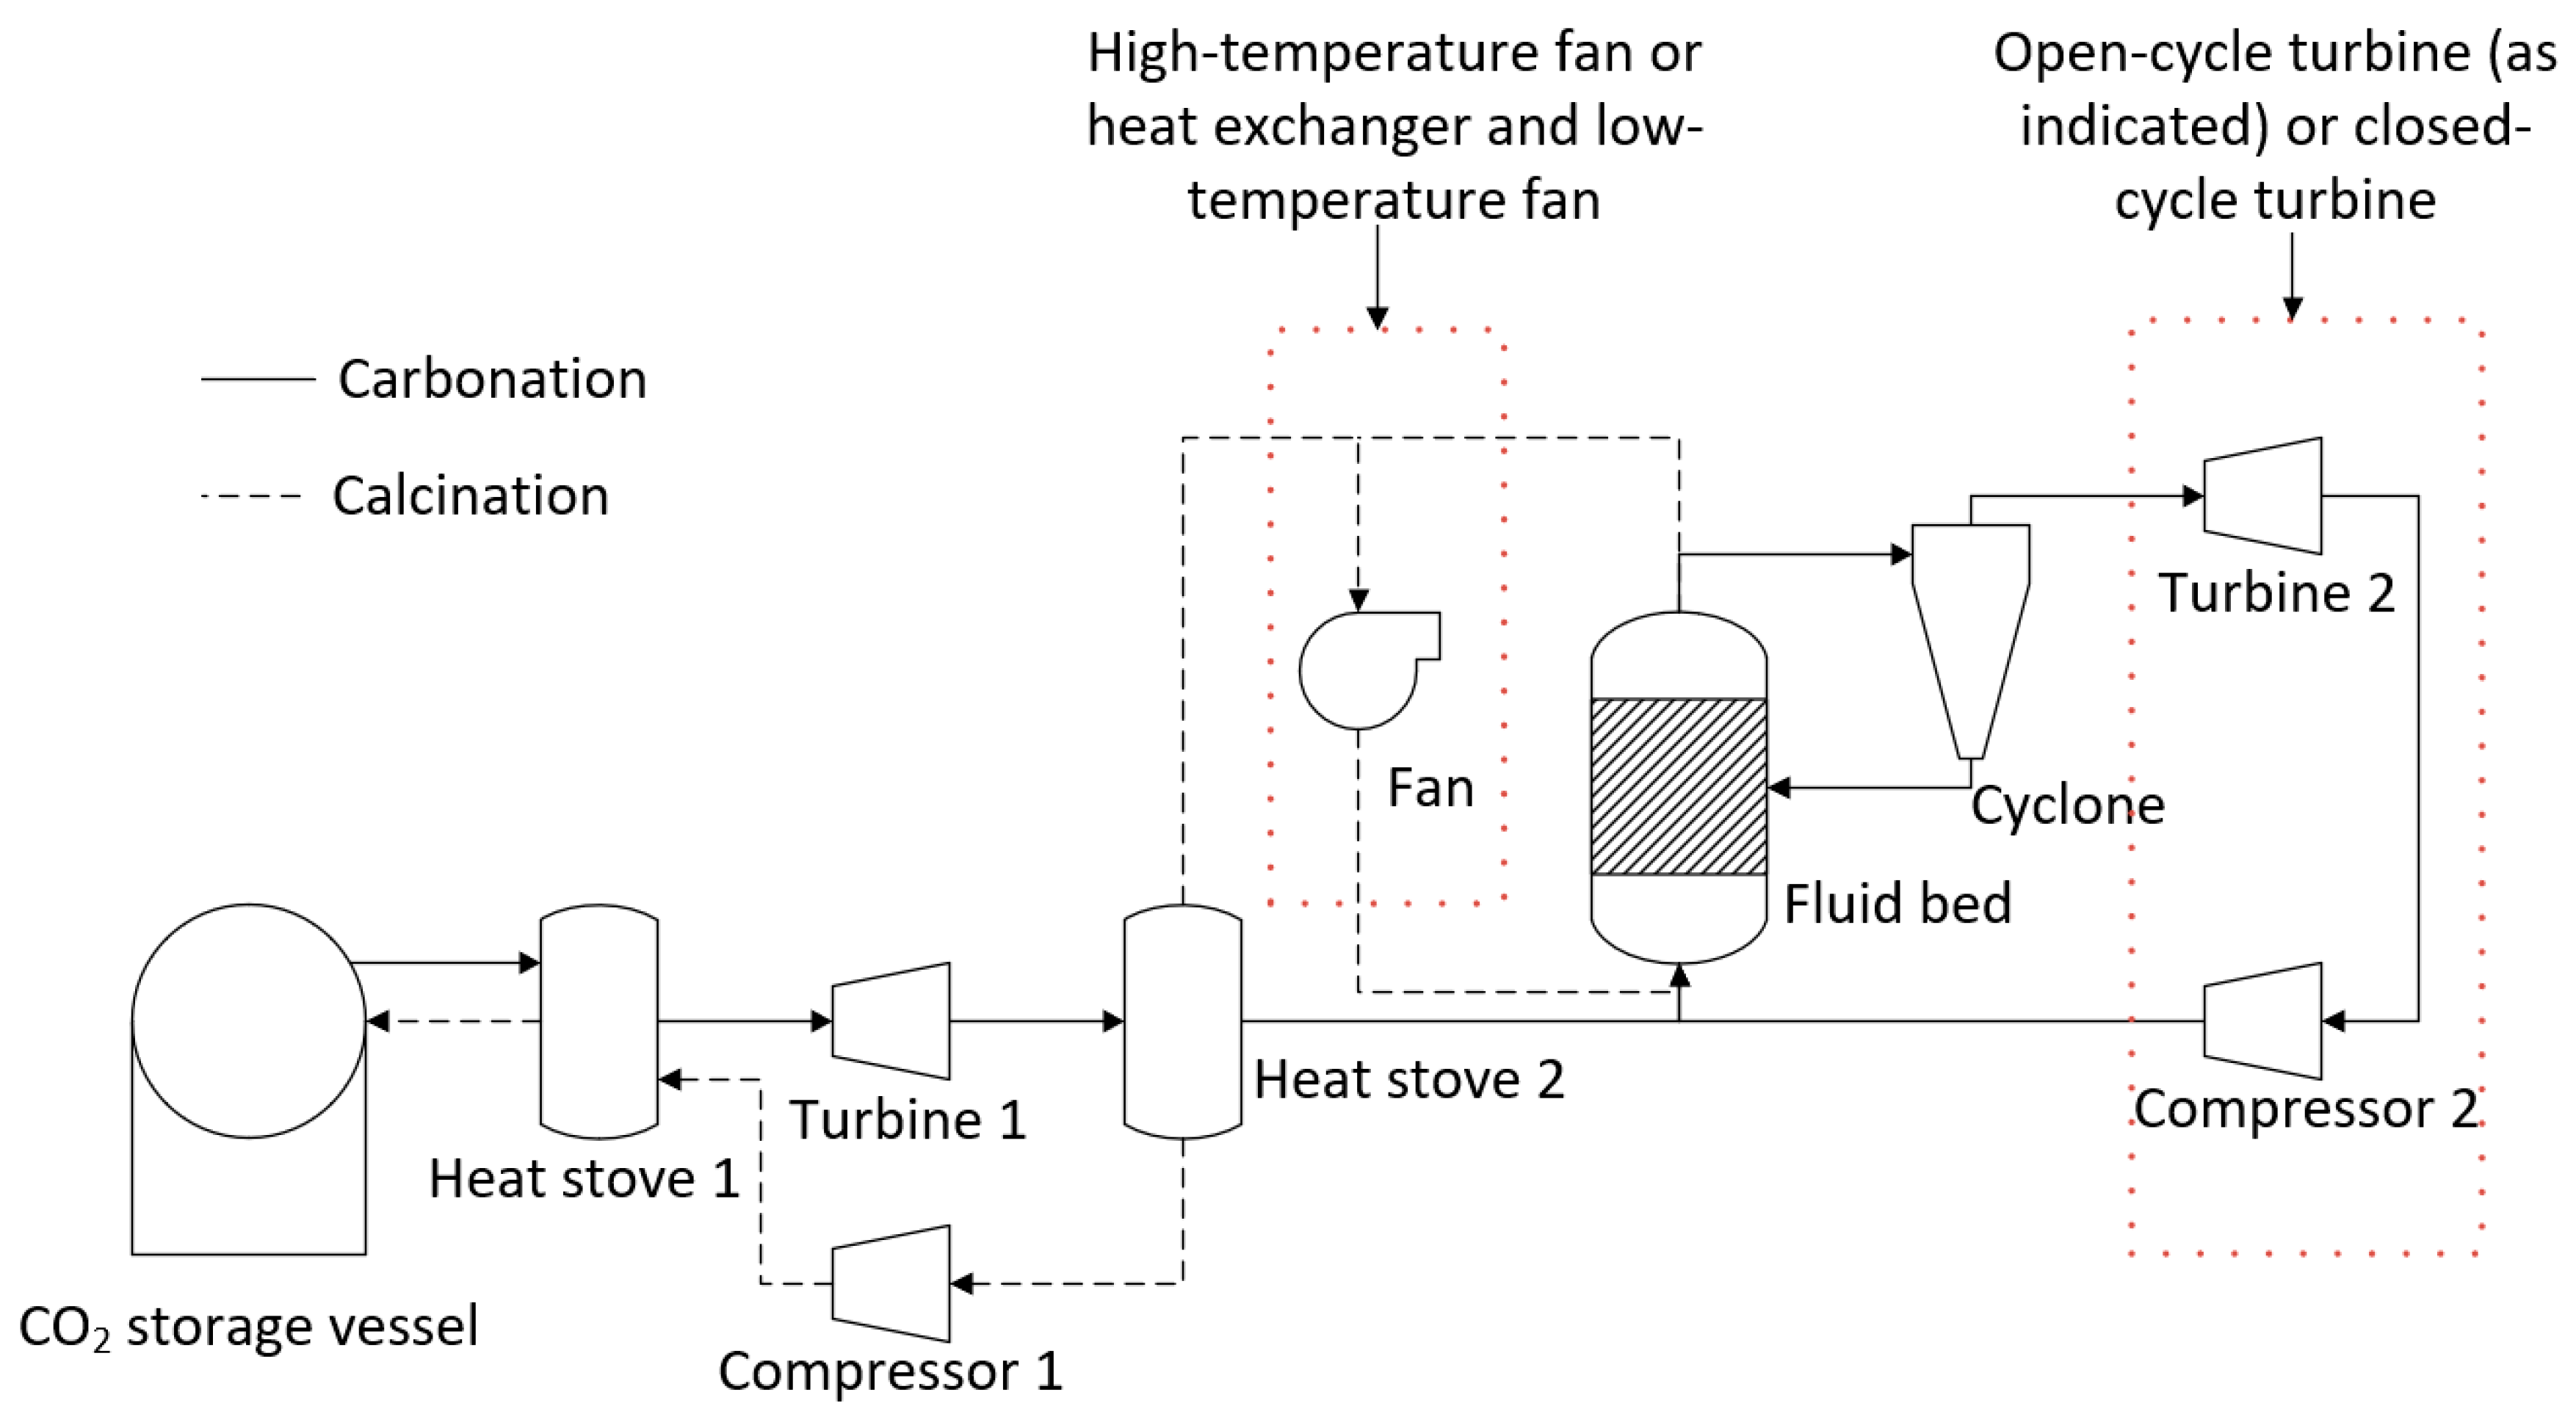
  • Open-cycle or closed-cycle configuration for turbines—An open-cycle configuration would likely provide the greatest output from the turbine. However, there is the possibility that fine particles from the fluid bed may not be removed by the cyclone. These particles would have a detrimental impact on the turbine. High-temperature filtration of the off-gas is a possible solution, or a closed-cycle system could be employed. A closed-cycle process in which there is no direct contact between the fluid bed off-gas and the turbine working fluid would avoid the issue of entrained particles damaging the turbine. However, the output from the turbine would decrease. One advantage of a closed-cycle system is that the carbonation cycle could be undertaken at atmospheric conditions, reducing the construction cost of the fluid bed.
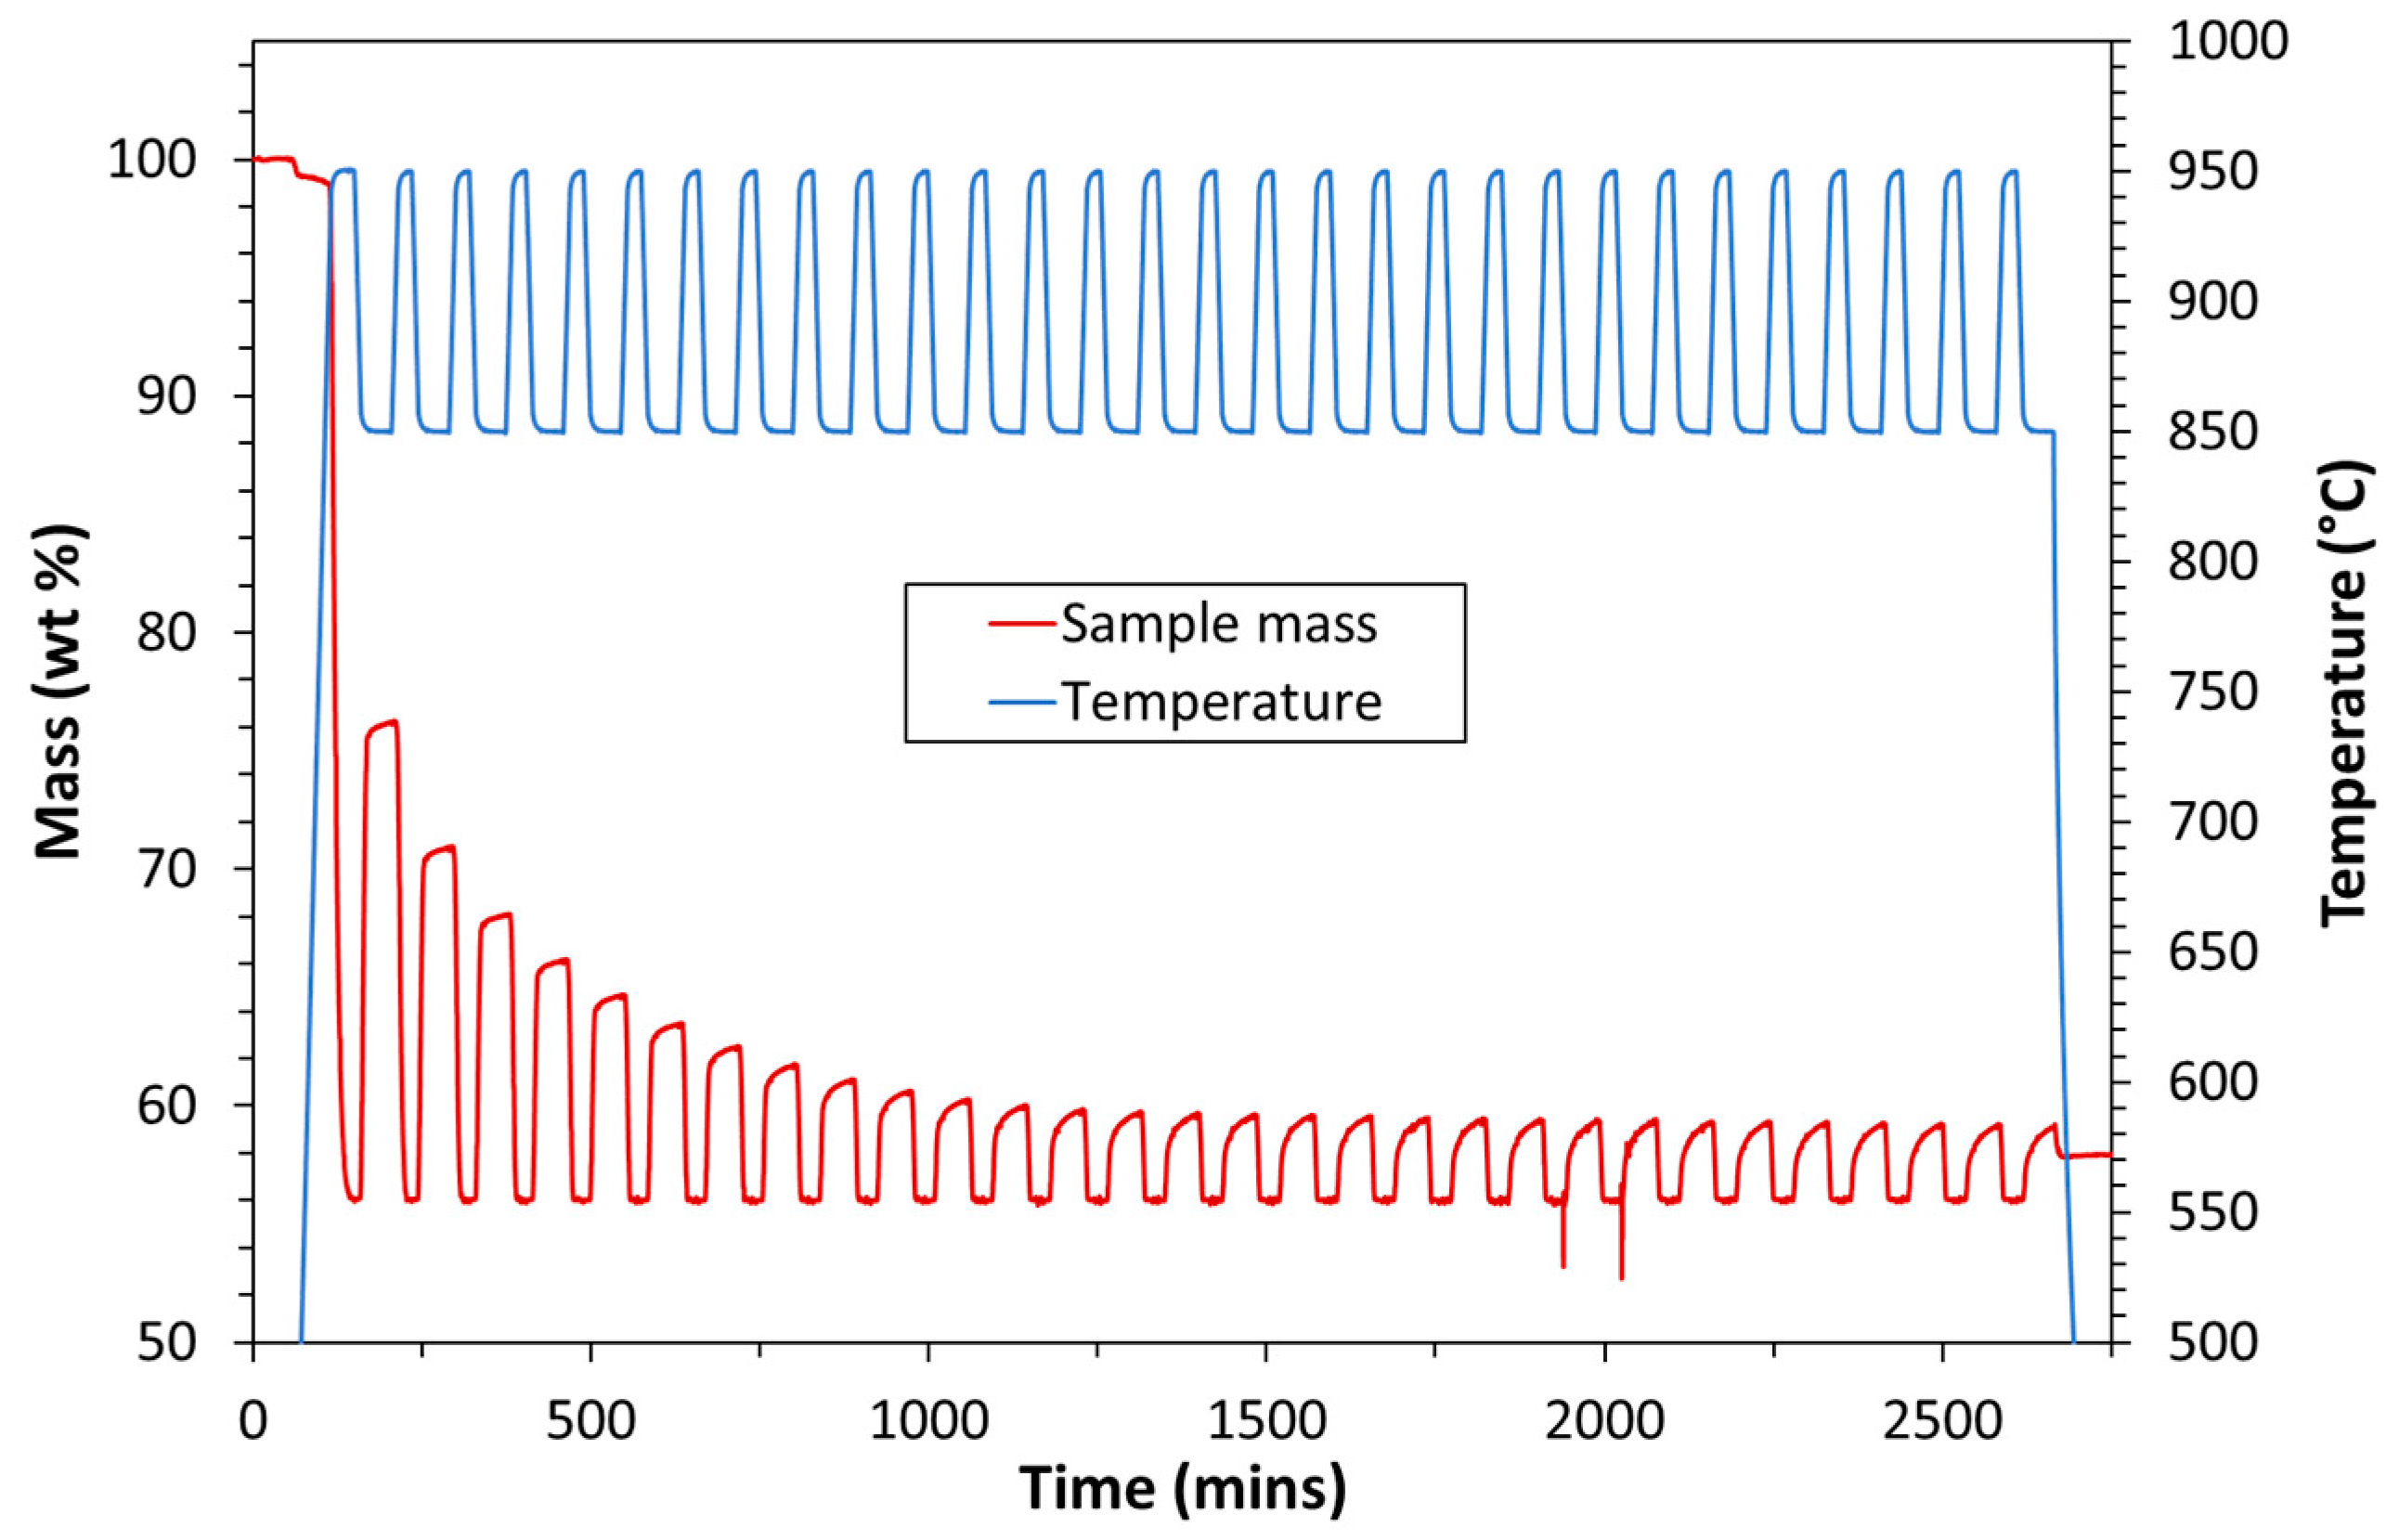
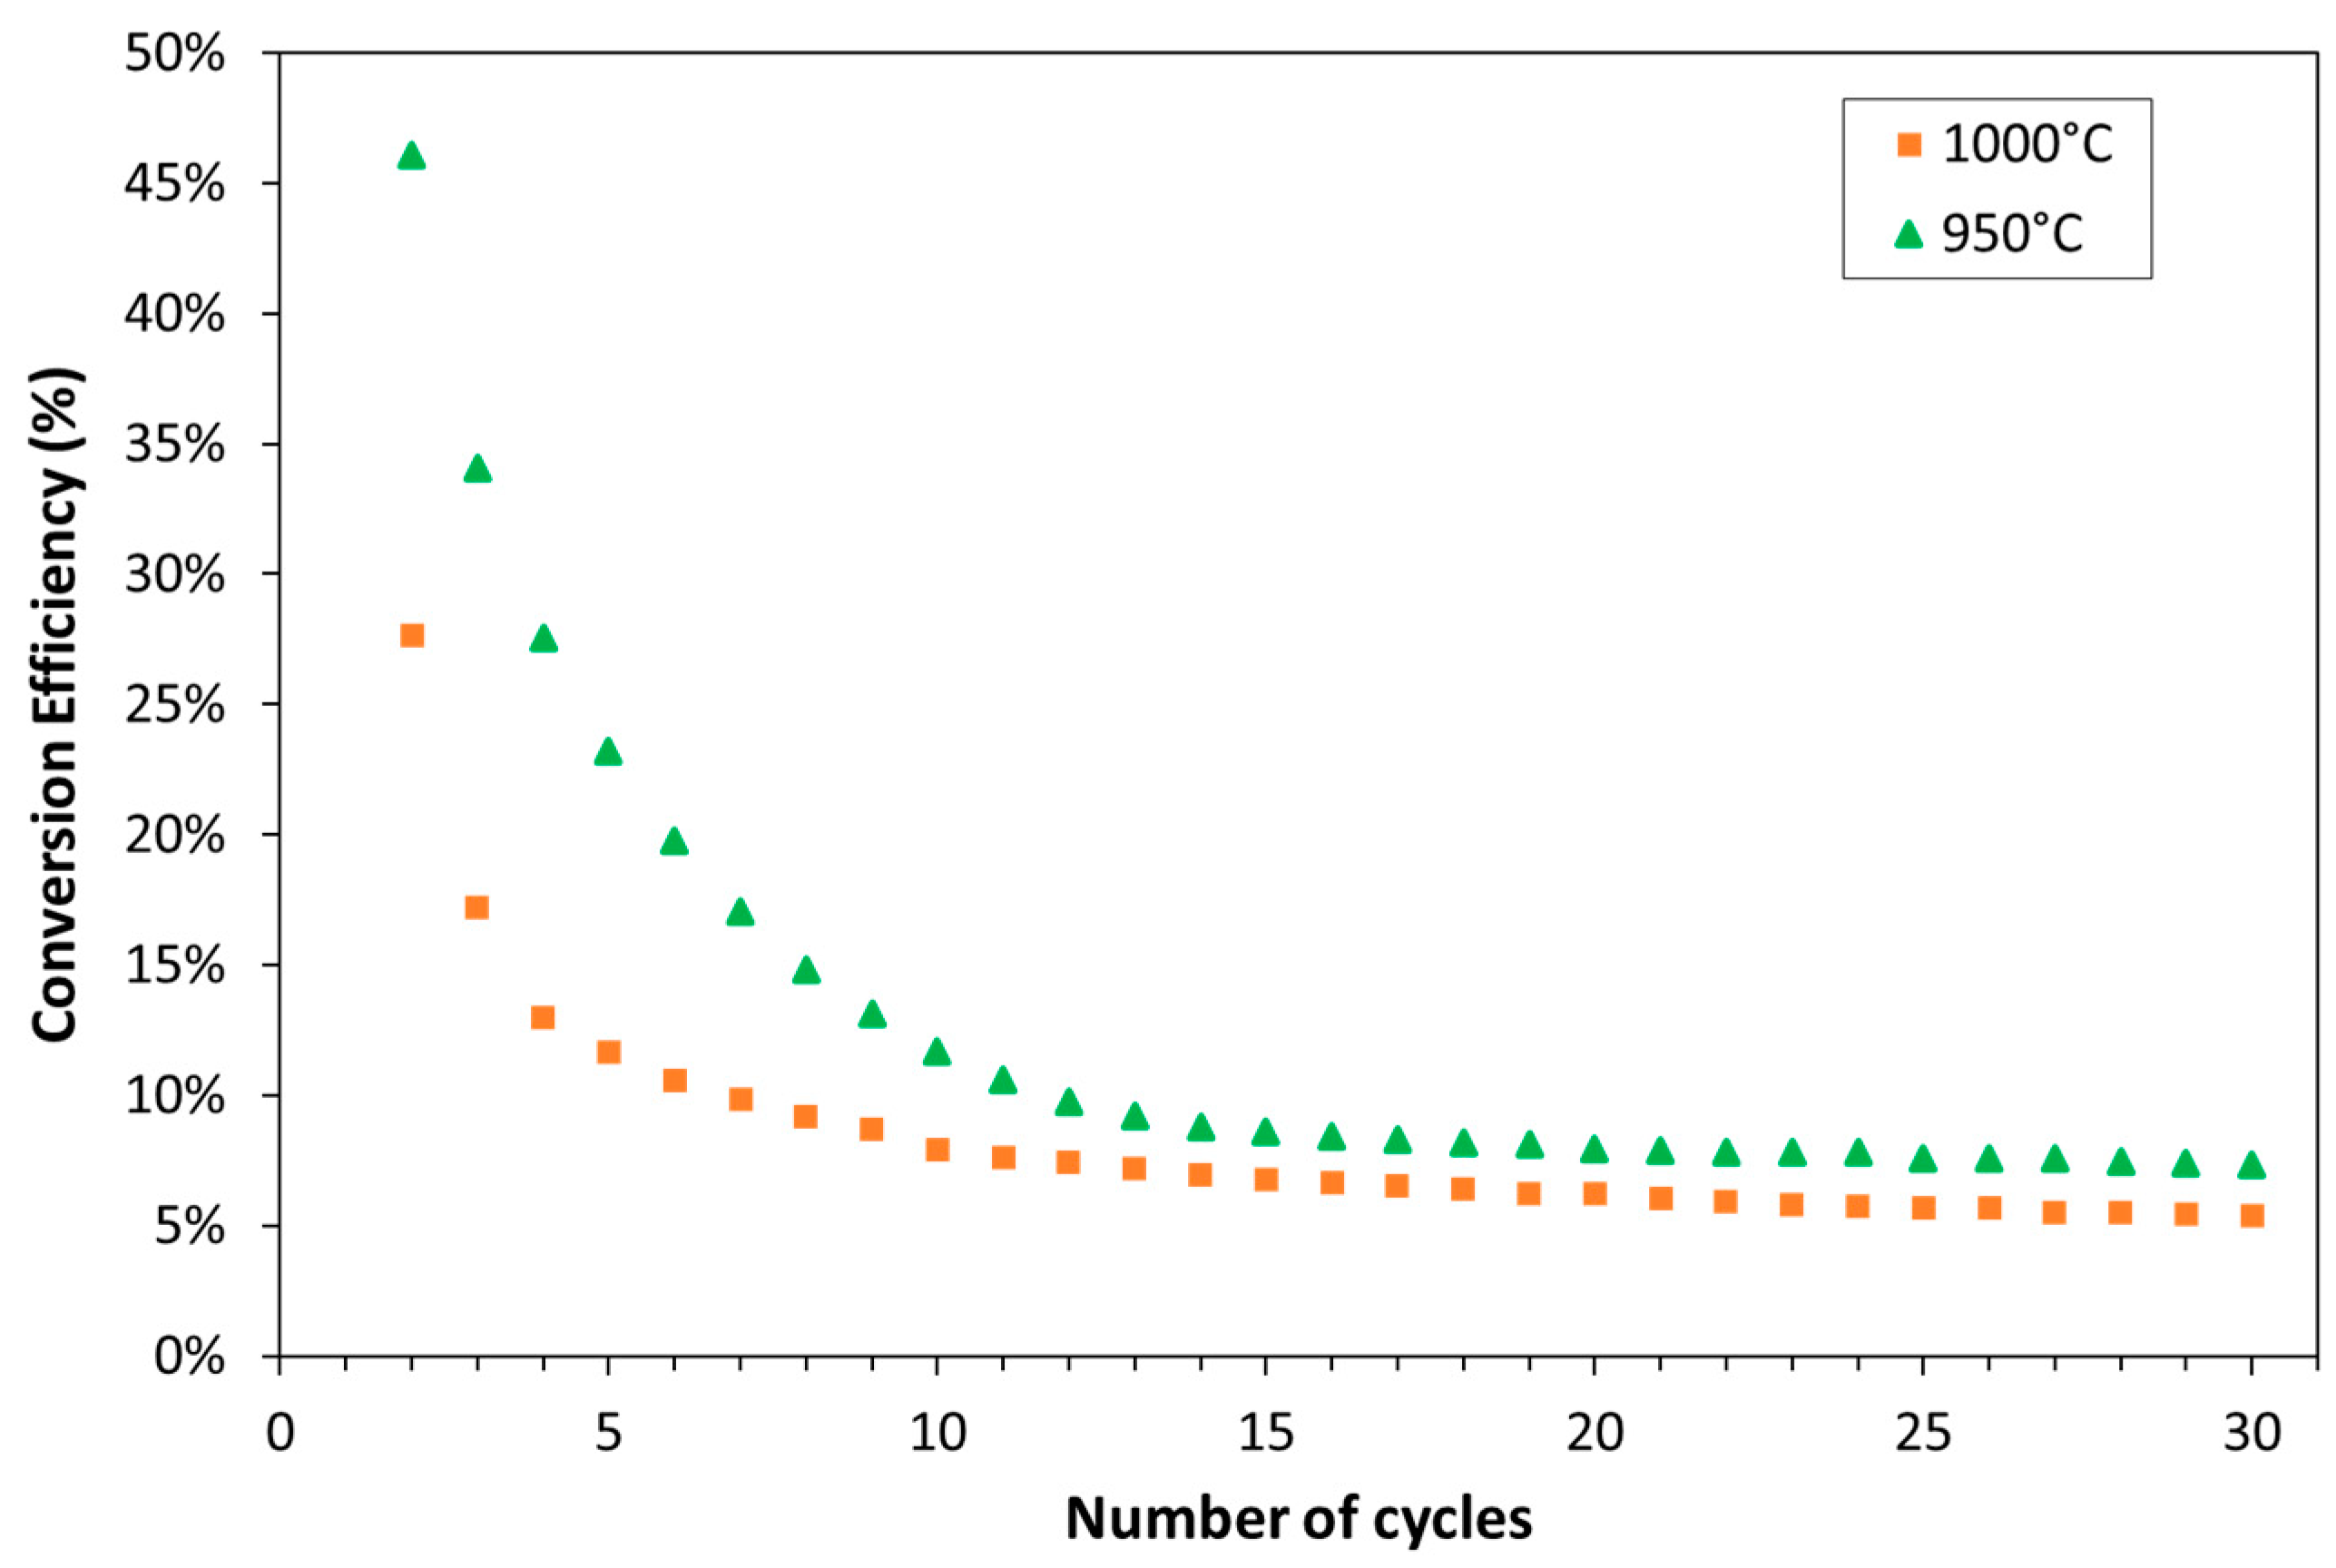
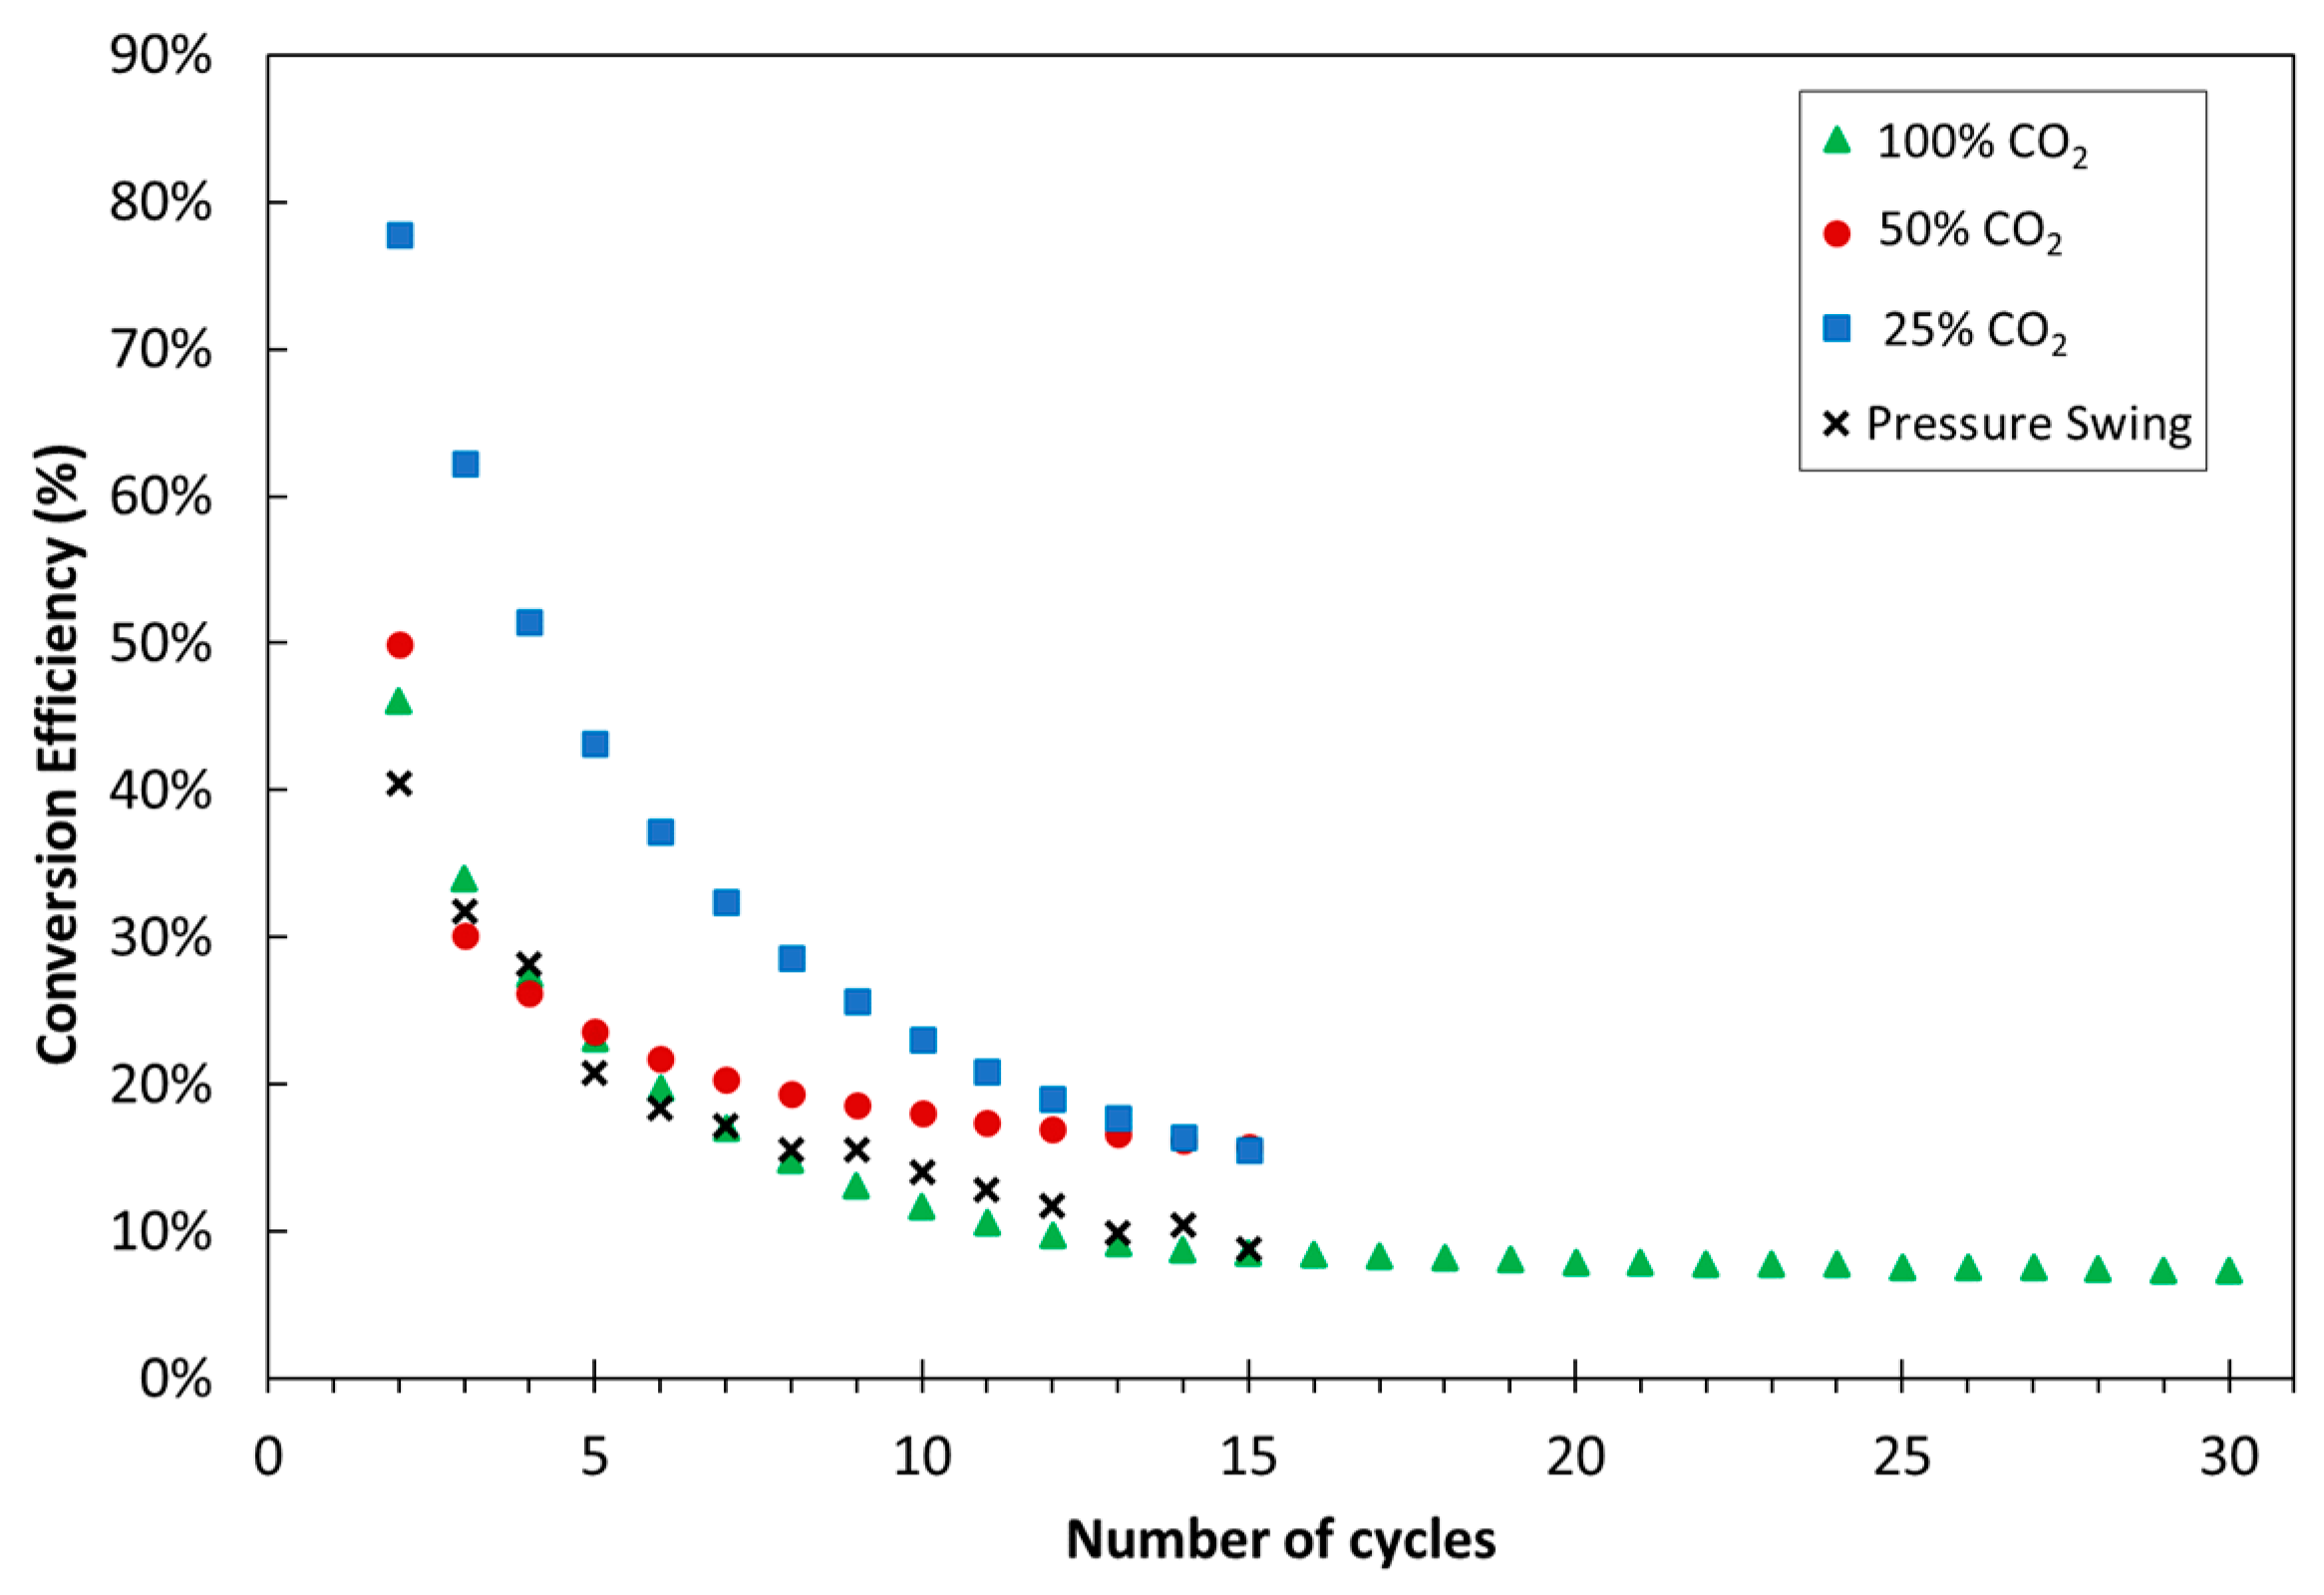
  • Atmospheric or pressurized carbonation reactor—For an open-cycle turbine, the fluid bed would be operated at the inlet pressure required by the turbine. The capital cost for a pressurized fluid bed is significantly greater than for an atmospheric fluid bed. If a closed-cycle turbine is employed, then there is no requirement for the fluid bed to operate above atmospheric pressure. The conversion of calcium oxide in multicycle systems (i.e., the amount of material that will convert to limestone in each cycle) is known to decrease and converge toward a constant value. The final value is a function of the process conditions, including the pressure of the system. The conversion would determine the quantity of material required for a given power output, and therefore influences the size of the fluid bed. Optimization of the process conditions in order to reduce the capital costs would follow.
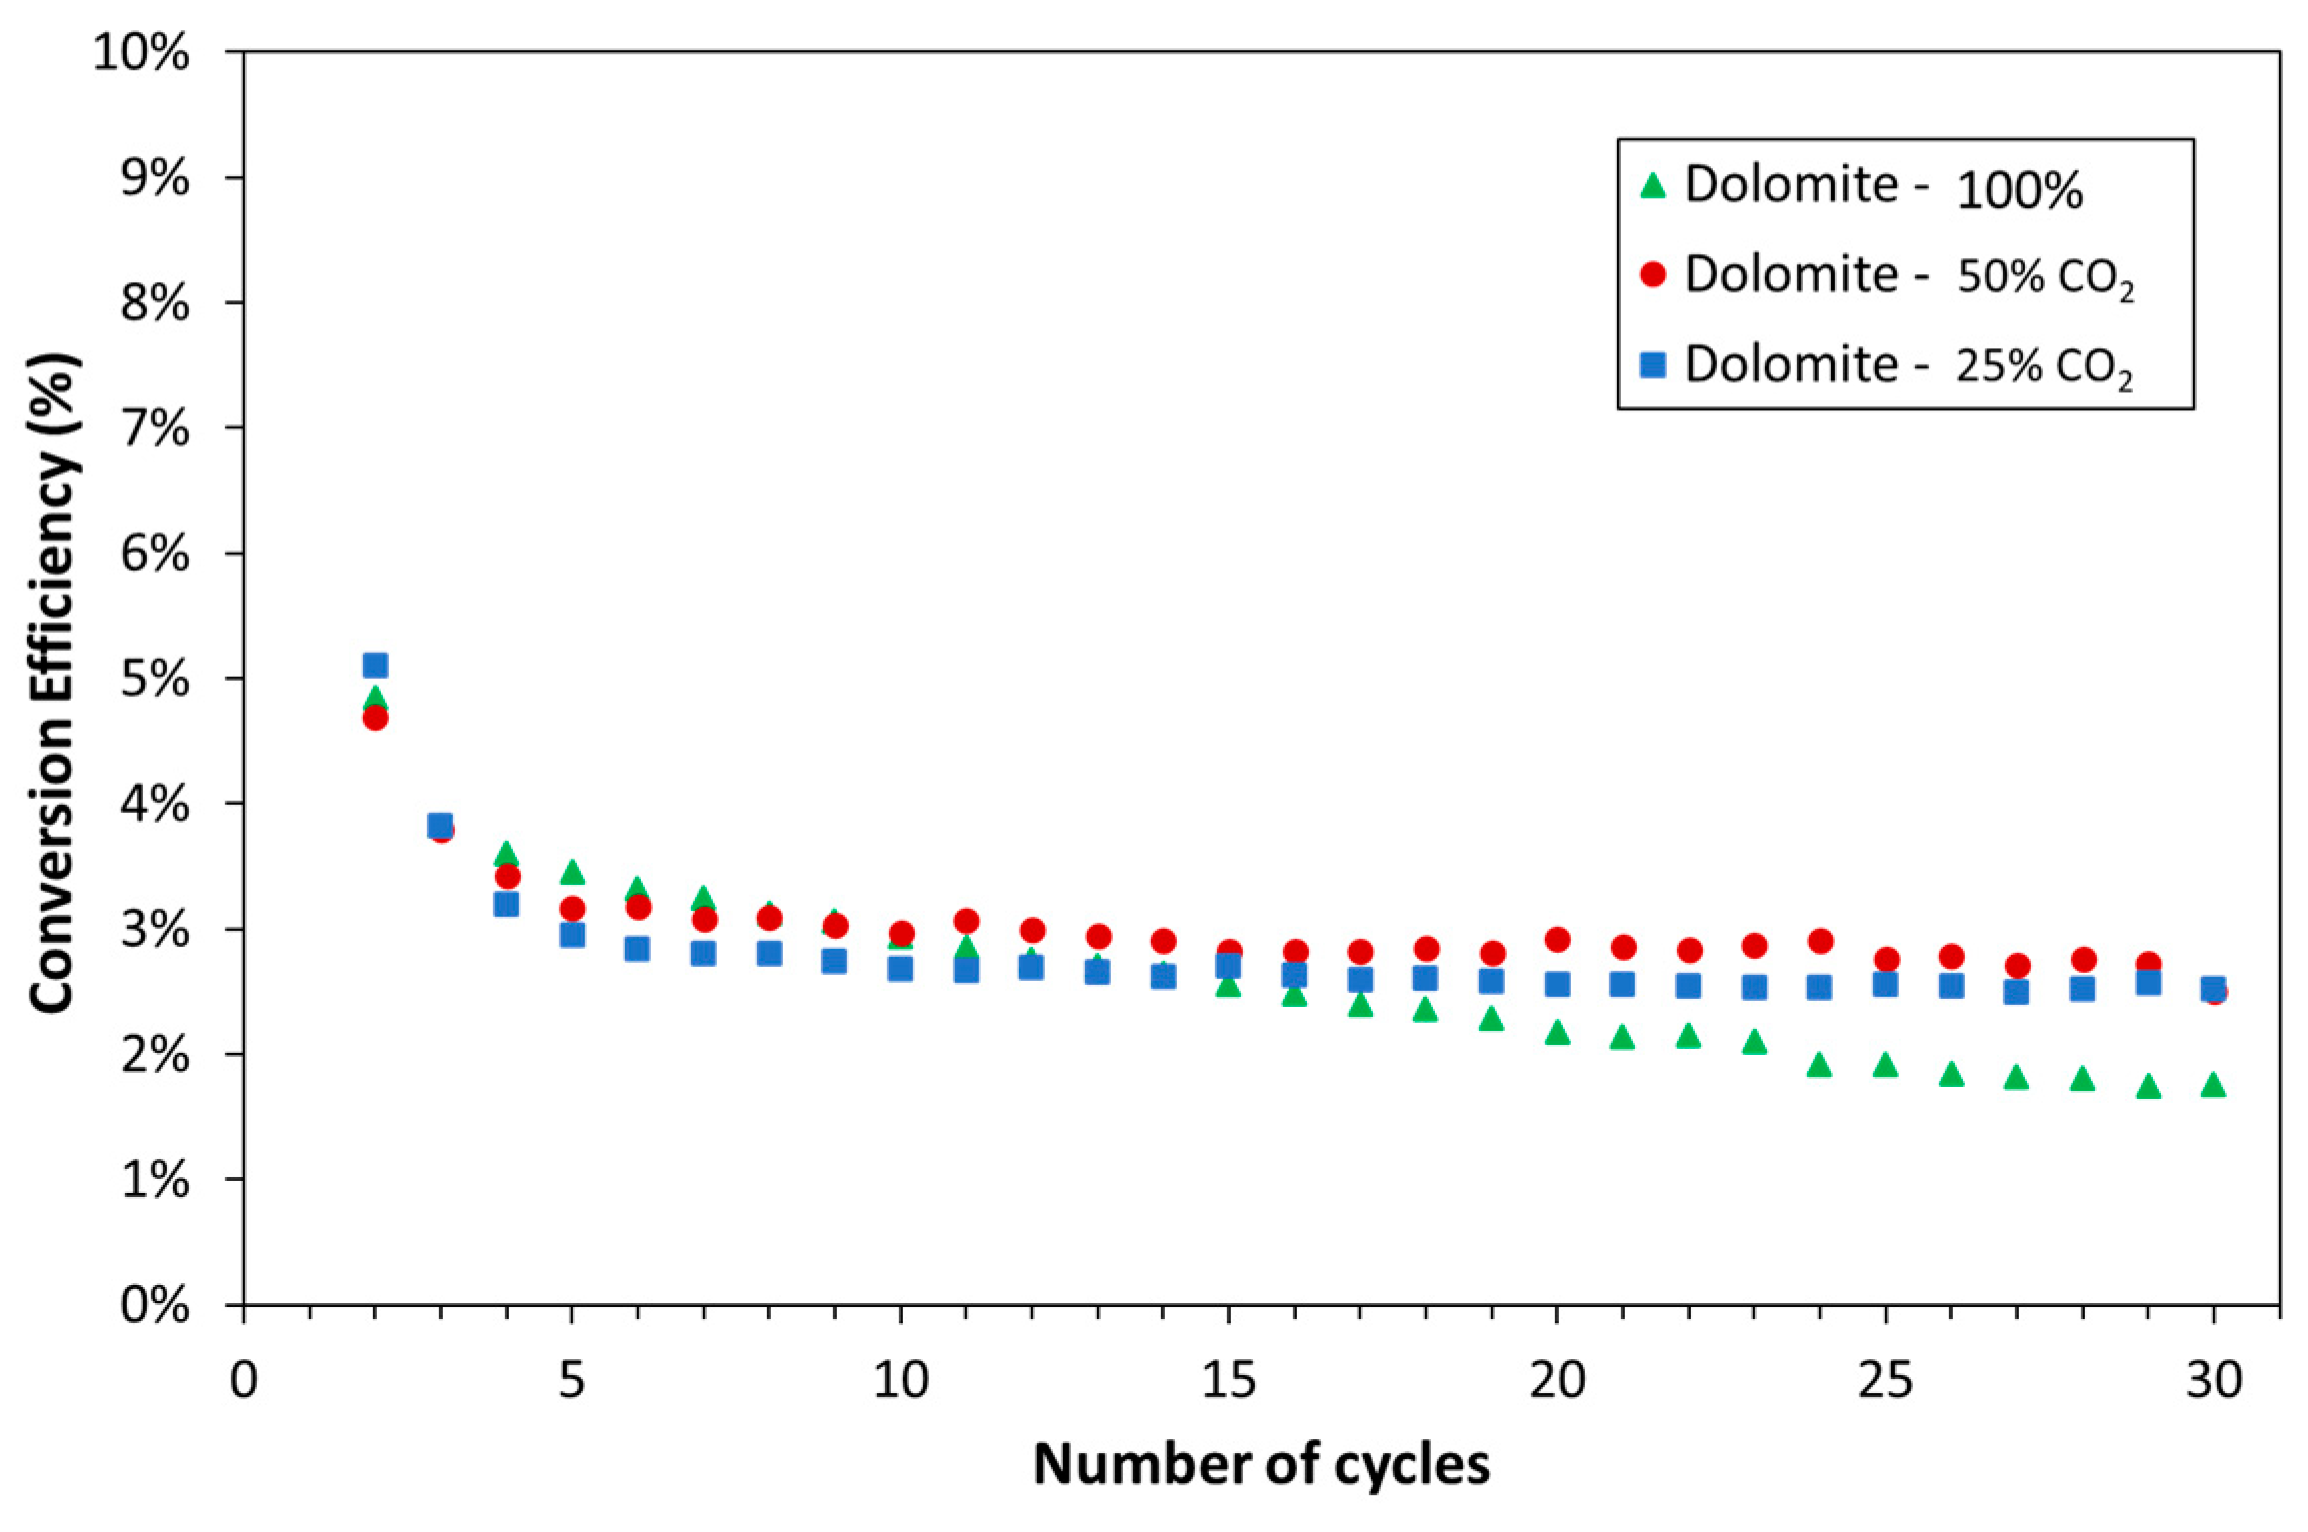
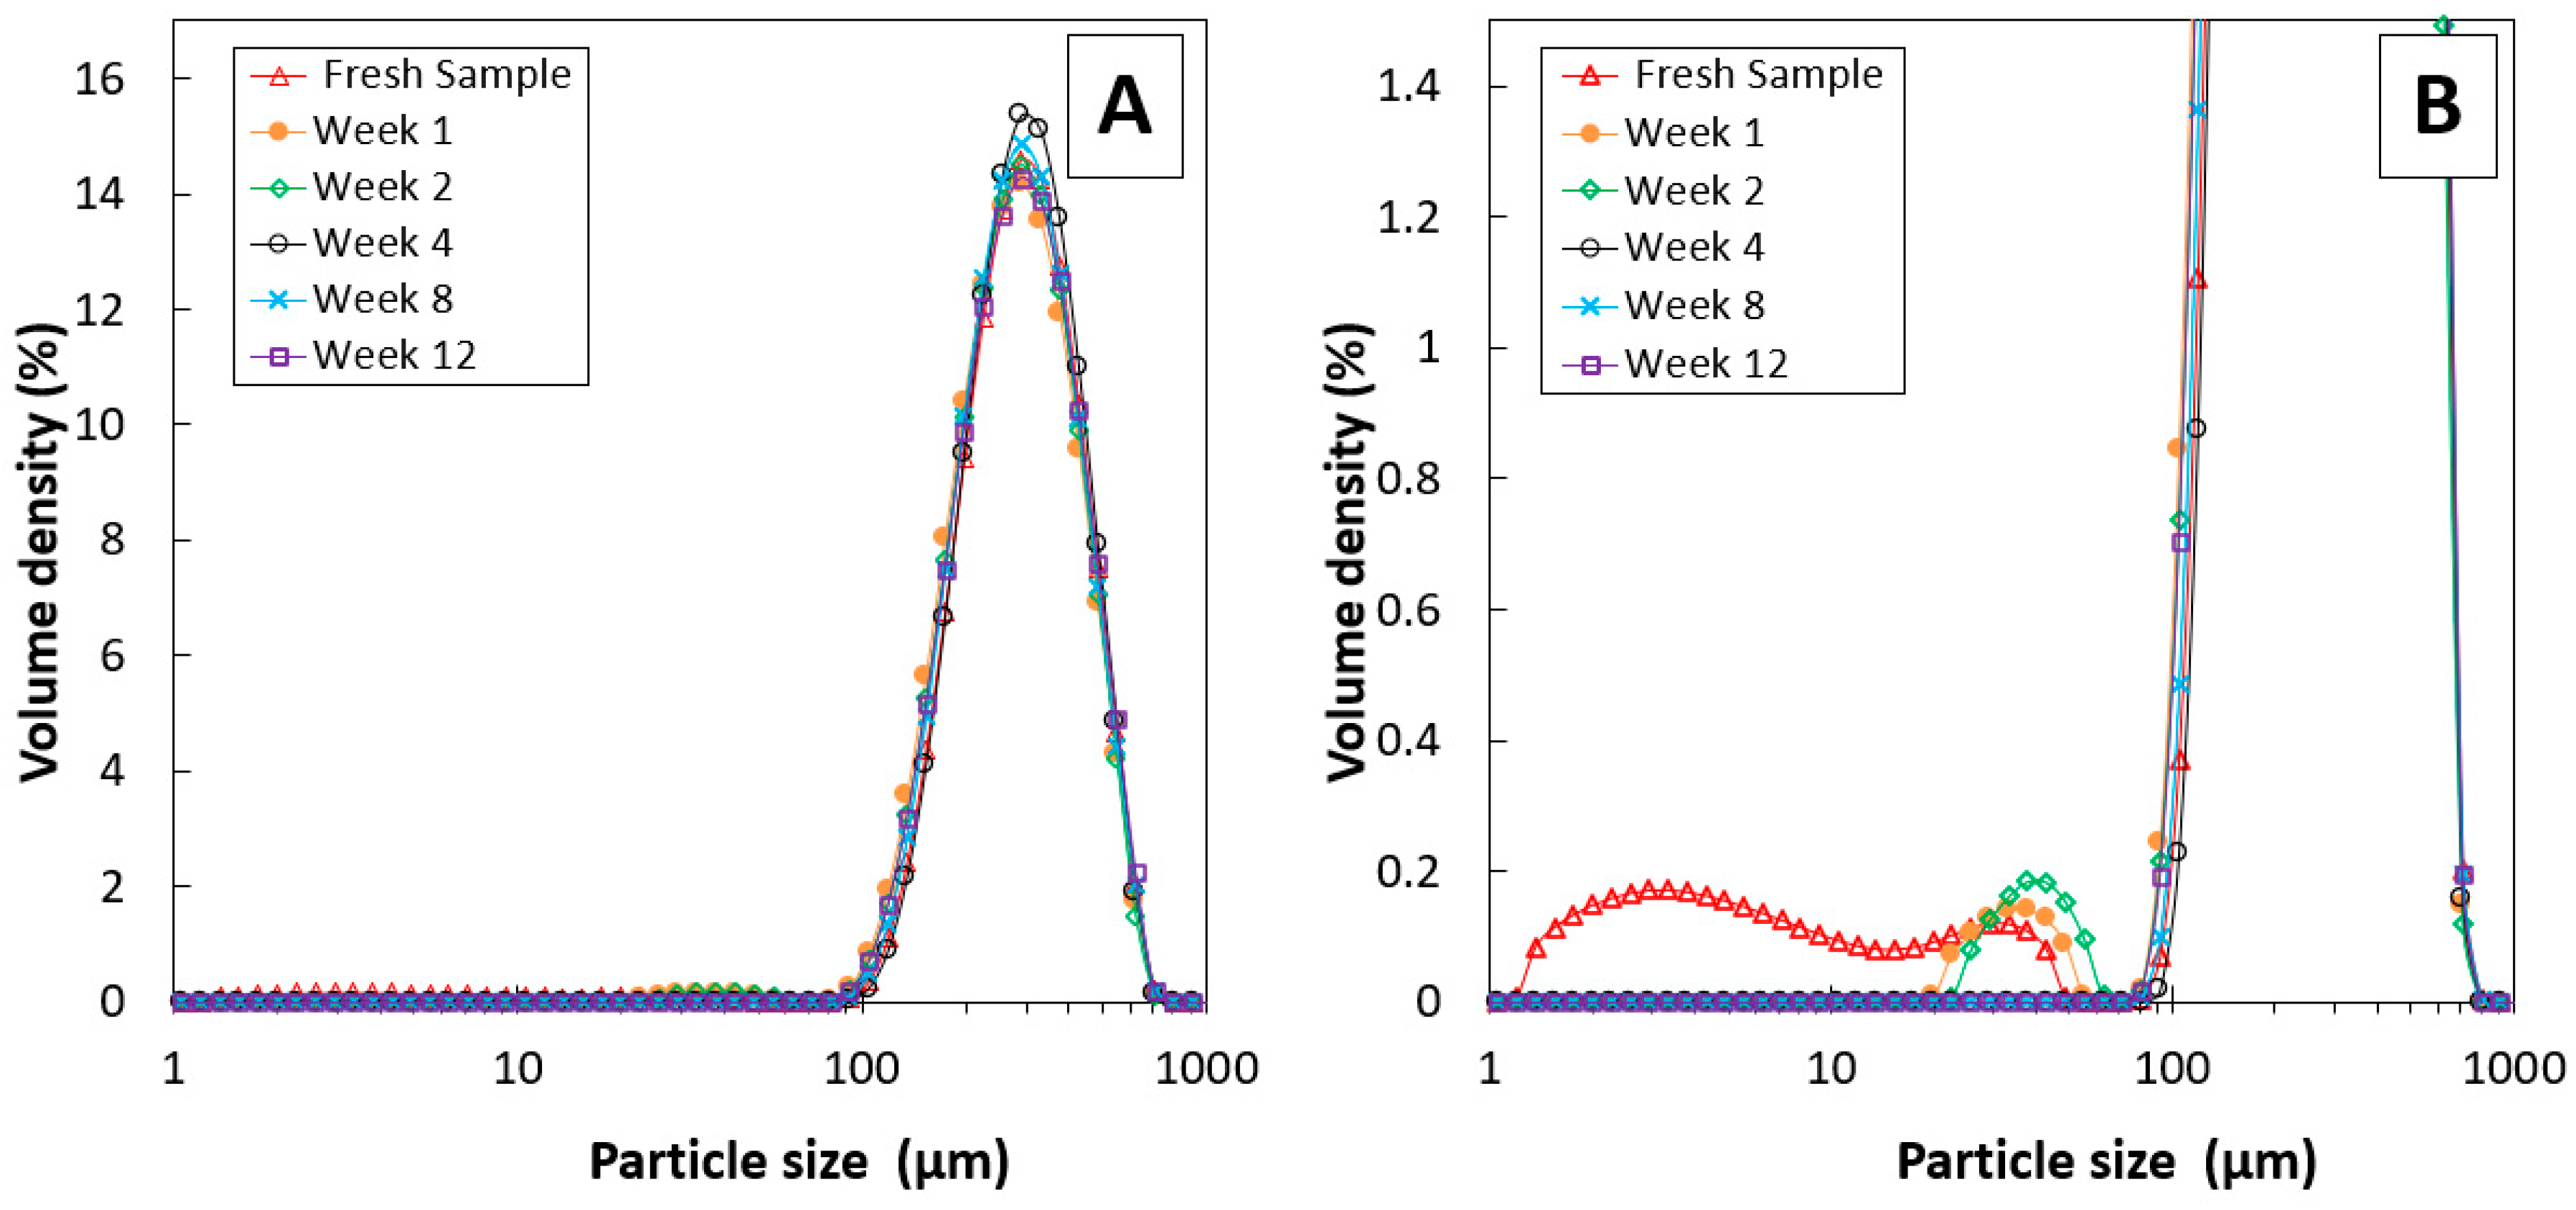
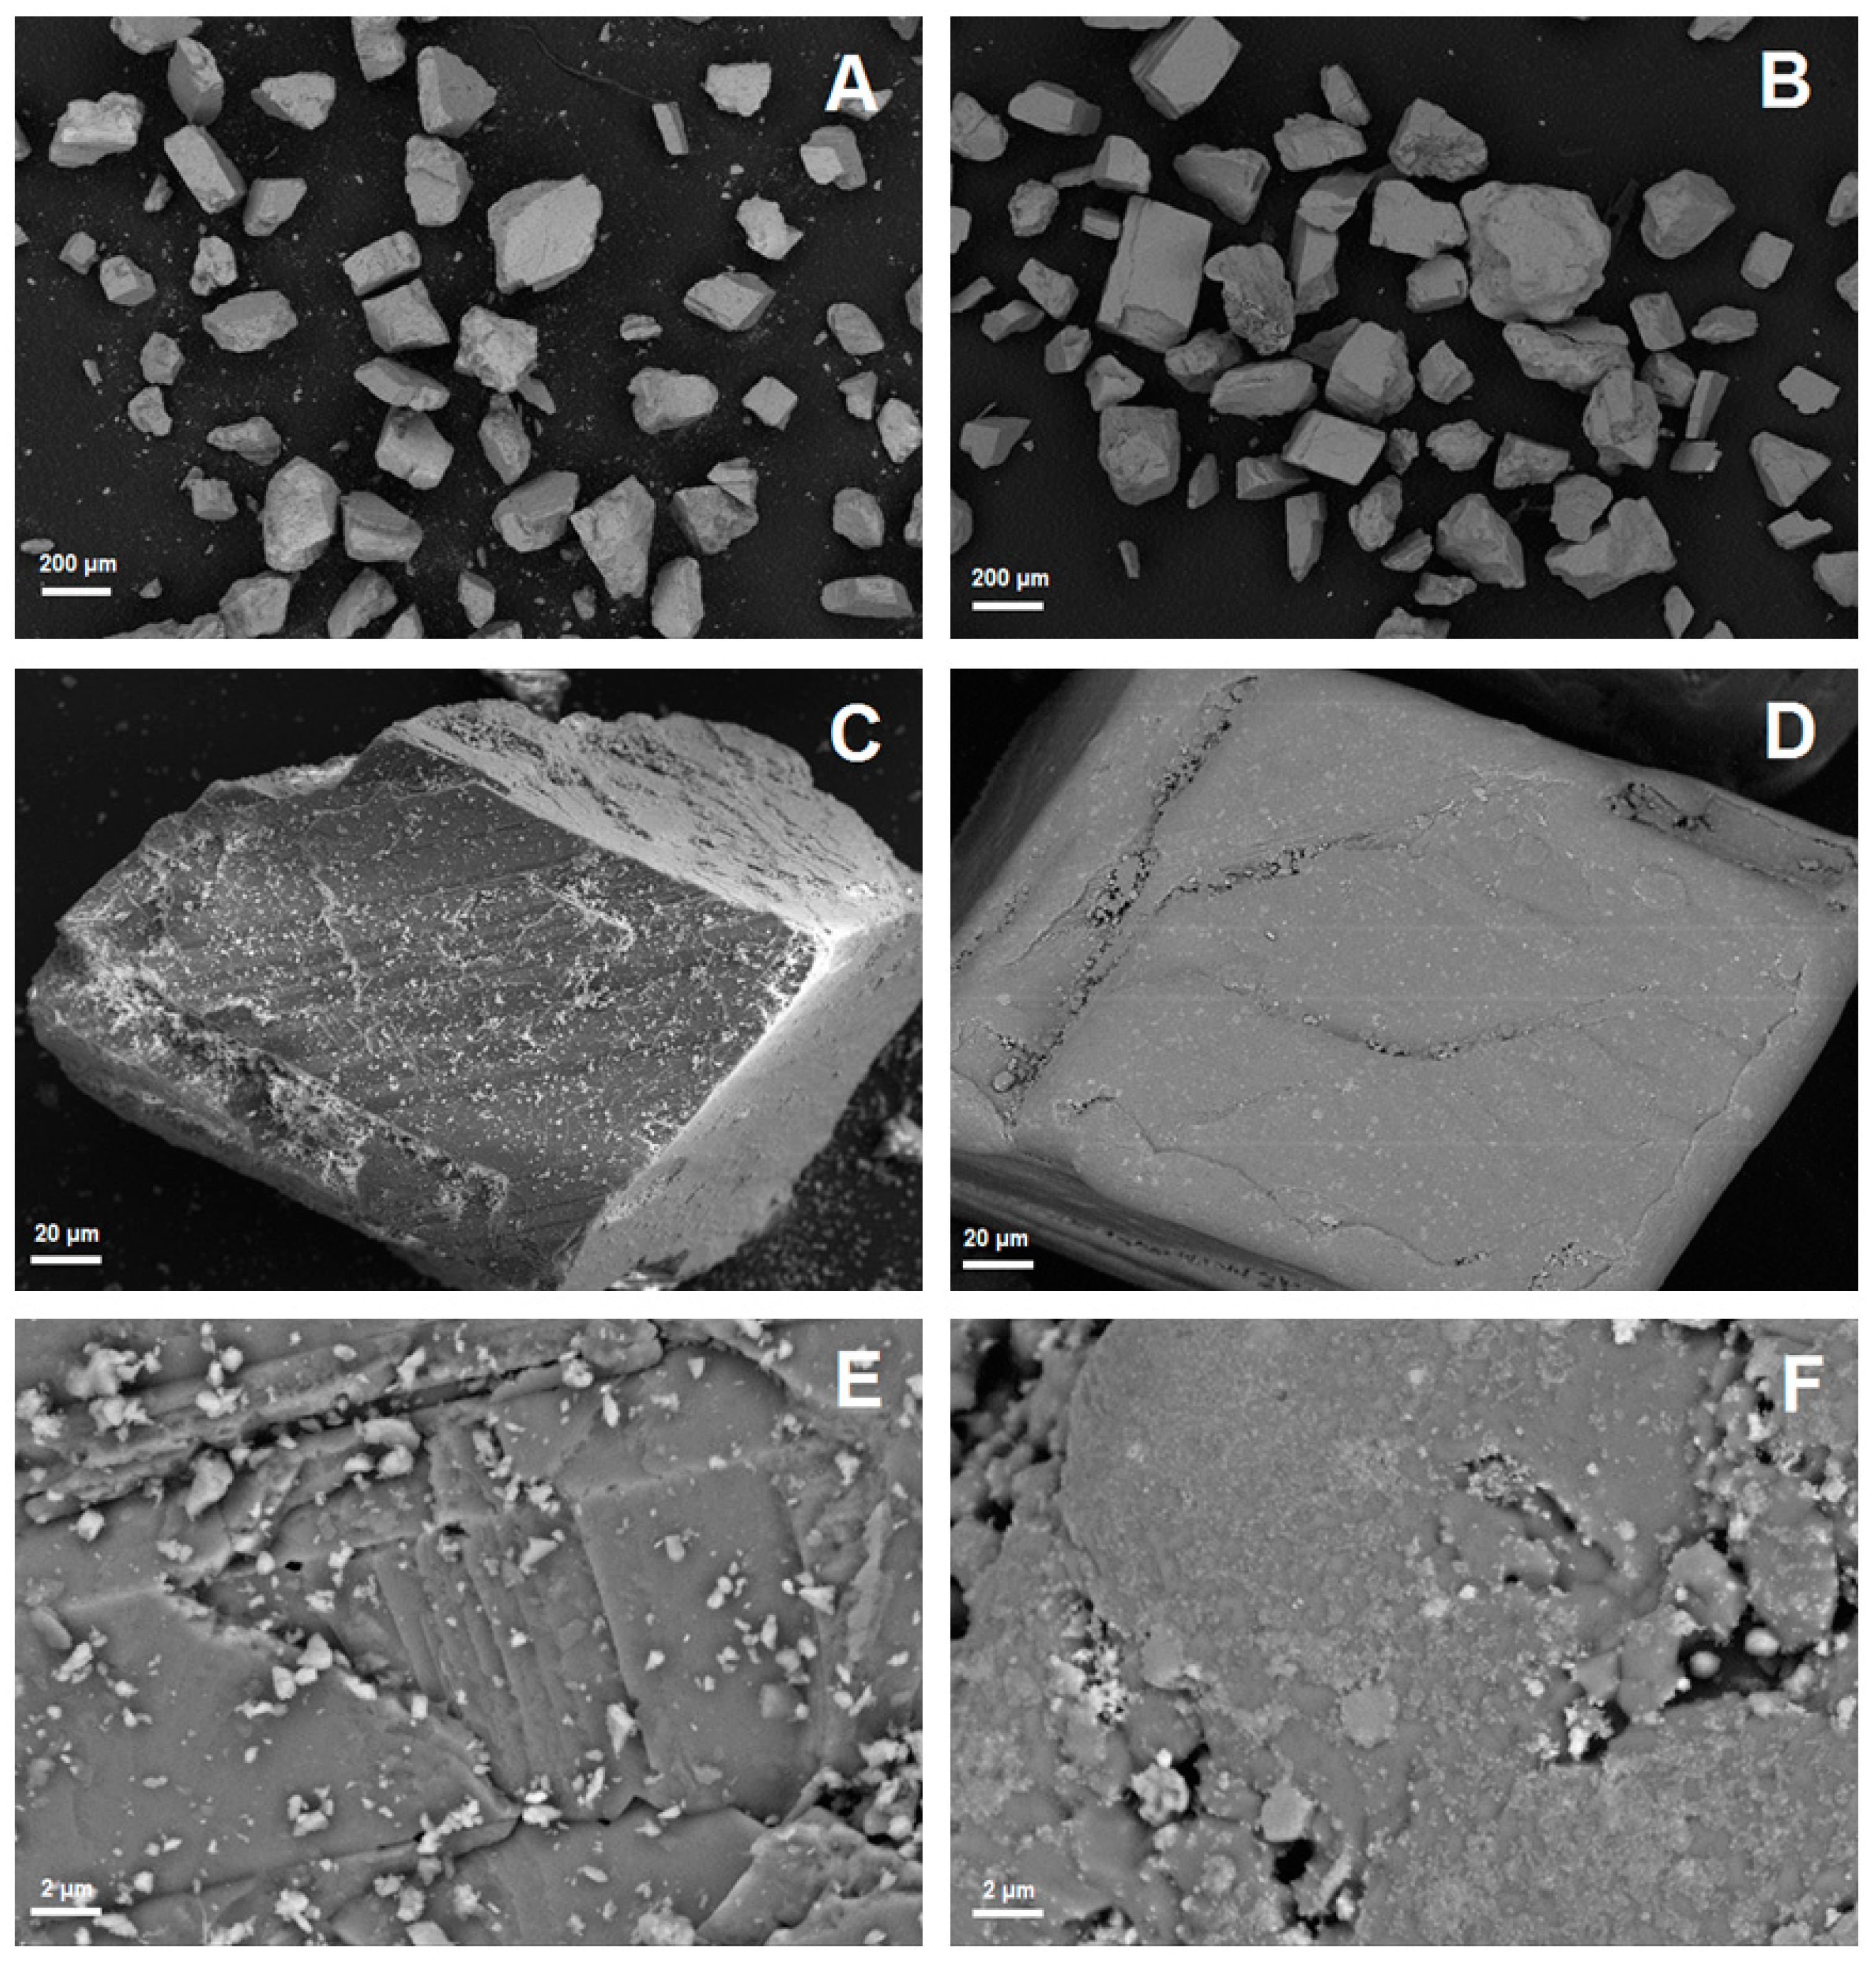
  • Carbonate material reactivity and physical properties—The reactivity and conversion of the carbonate material (calcium carbonate or alternatives) will influence the quantity of material required and the size and geometry of the fluid bed. The other key consideration for the bed material is the change in the particle size distribution through multiple calcination and carbonation cycles. Changes in particle size distribution will impact the reaction kinetics and the cyclone performance. Alternative carbonate materials with a greater mechanical strength may be suitable for the PRC2 process. These materials typically contain a lower percentage of carbonate compared with calcium carbonate, and therefore a greater mass of material would be required for the same power output.
  • Heat storage methods—Heat stoves, essentially thermal storage vessels, were proposed as a means to transfer heat from the calcination cycle to the carbonation cycle. Heat stoves operate by direct contact between the gas stream and the solid thermal storage material. Consequently, the heat-stove vessel must be rated to the same pressure as the gas stream. In the preliminary concept design, Heat Stove 1 would be at 80 bar (the same pressure as the bulk carbon dioxide storage vessel) and Heat Stove 2 would be at 4 bar (the same pressure required for the inlet to the fluid bed and Turbine 2 for an open-cycle system). Constructing large pressure vessels for heat stoves may be cost-prohibitive. Alternatives include indirect heat storage methods, in which the gas pipes are pressure-rated and the heat-stove vessels are at atmospheric pressure.
  • CO2 recycling stream for fluidization during calcination—A fraction of the carbon dioxide in the off-gas during calcination will need to be recycled to maintain fluidization of the bed material. The off-gas during calcination will be between 900–950 °C. High-temperature fans may be cost-prohibitive for the recycling process. Alternatively, the entire off-gas stream could be passed through Heat Stove 2 and a fraction of the cold gas stream could be passed back through a fan and heat exchanger before it re-entered the bed.
Nine different configurations were proposed to overcome the aforementioned challenges. A combined set of experiments, process modelling, and techno-economic analyses was successfully completed to identify the most suitable and effective configuration for the PRC2 process.

2. Materials and Methods

2.1. Overview

The project outlined here consisted of three broad activity streams (tasks):
  • Experimental—The experimental work involved high pressure thermogravimetric analyzer (HP-TGA) experiments and laboratory-scale particle analysis.
  • Process modelling—For each concept design, process modelling was carried out using the open-source chemical looping simulator DWSIM.
  • Techno-economic assessment—For each concept, the LCOS was determined by using the standard approach reported in the open literature.
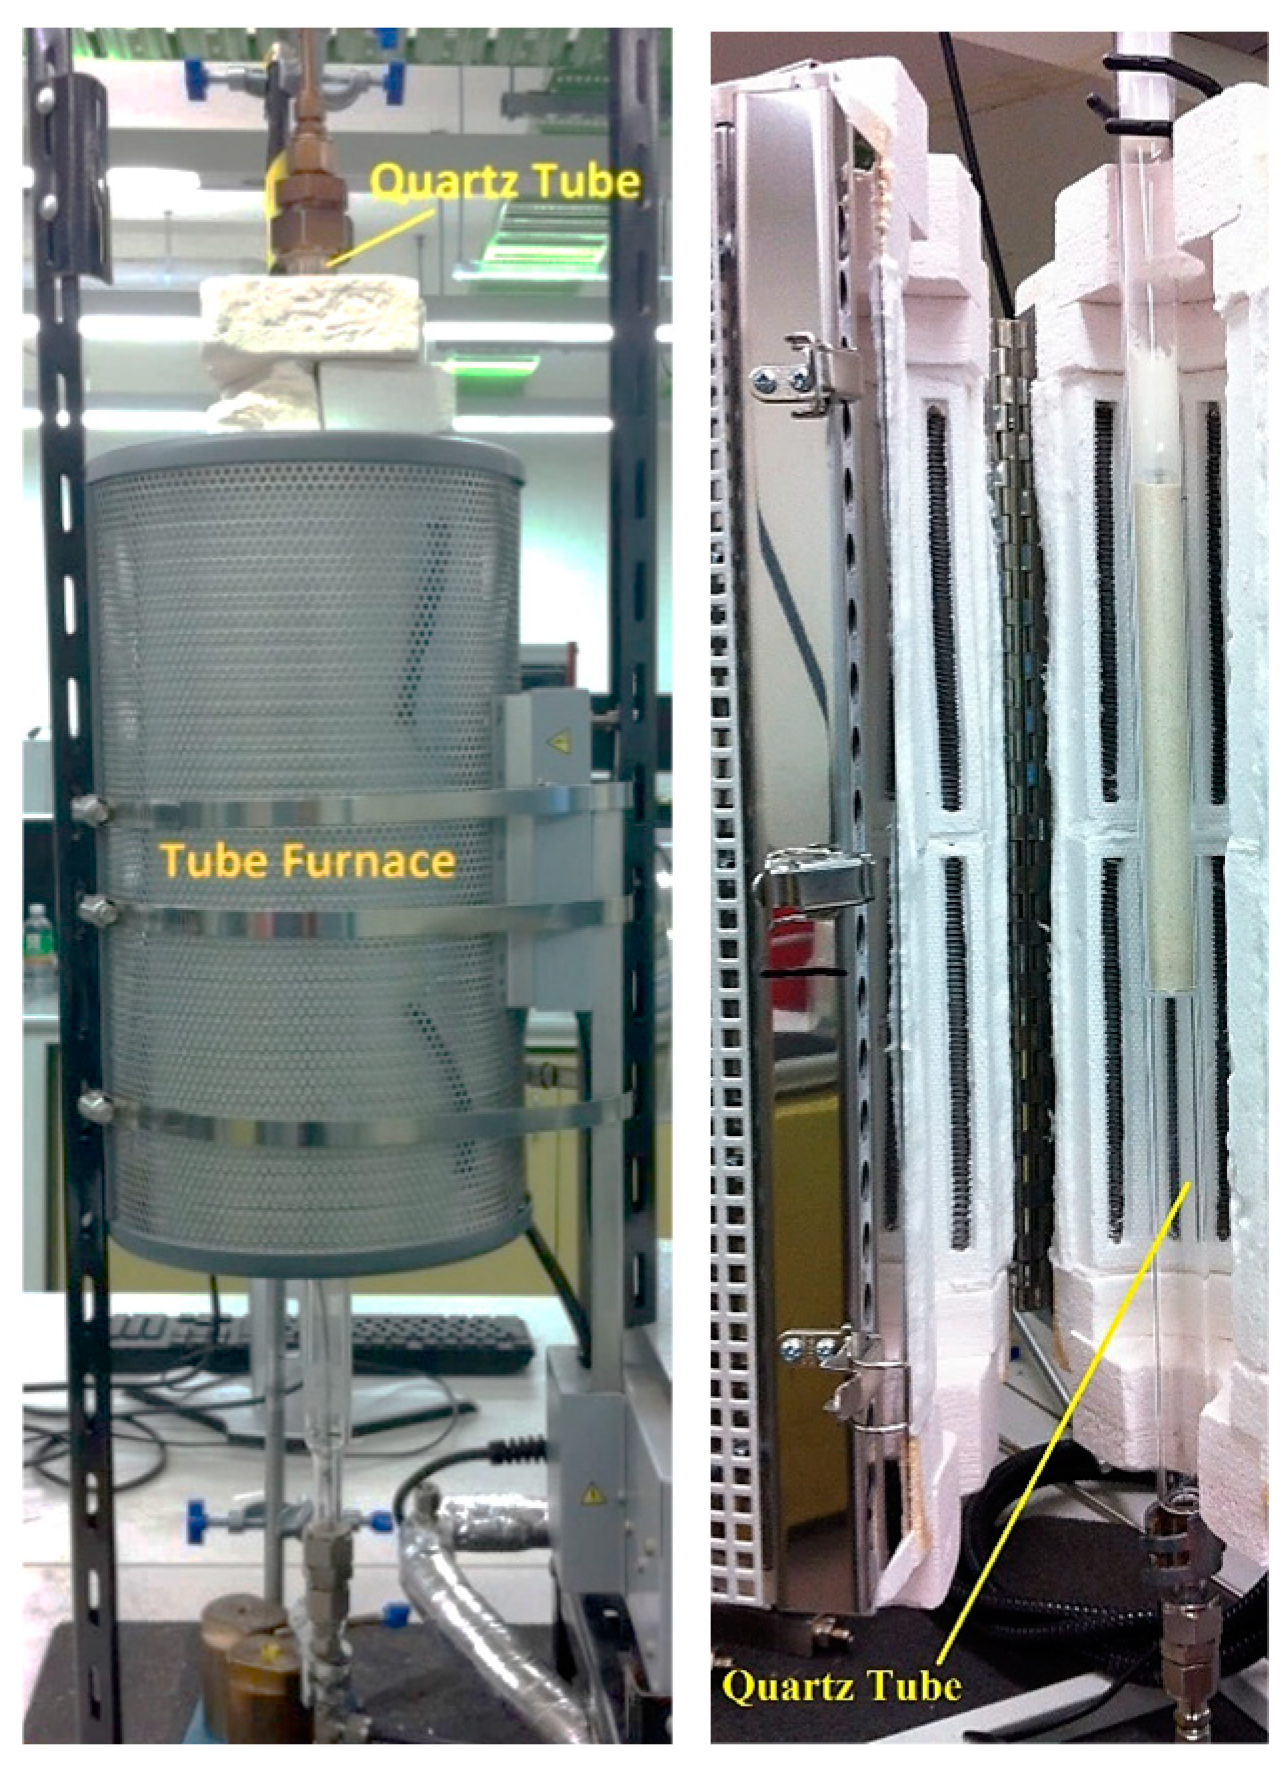
The detailed methodology for each task is presented in the following sections.

2.2. Experimental

For the HP-TGA study, a Rubotherm HP-TGA was used to perform a series of multicycle conversion experiments specifically undertaken to understand the operation of the PRC2 process with 100% CO2, as well as the carbonation/calcination temperatures required. Hence, the effects of carbonation temperature, calcination temperature, reaction atmosphere, pressure, and carbonate material were examined. A summary of each of the experimental conditions investigated is presented in Table 1. All calcium carbonate (CaCO3) used in experiments was obtained from Omya Australia, and the dolomite (CaMg(CO3)2) was naturally occurring, and obtained from Western Australia. A summary of the X-ray fluorescence (XRF) characterization of both samples is presented in Table 2.
For each experimental condition, a blank run was performed with an empty crucible to account for buoyancy effects, while for each sample run, 500 mg of CaCO3, or, based on the experiment, CaMg(CO3)2, was loaded into the crucible. Calcination was performed for 30 min, and carbonation was performed for 60 min, with total gas flowrates of 100 mL/min of the respective gas mixture. For the hydration experiments (Nos. 13 and 14 in Table 1), calcination was performed in 100% CO2 (Coregas, 5.0 purity) for 60 min, after which the sample was cooled to 450 °C under either N2 (Coregas, 5.0 purity) or CO2 and then maintained at 450 °C for 5 min. The hydration step was then performed with 90% steam injected (2.17 mL/min) into the reaction chamber at 450 °C and balanced with either N2 or CO2 at 2 bar. A temperature of 450 °C was used, as this is the maximum temperature at which Ca(OH)2 has been reported to be stable by studies such as that of Materic and Smedley [7]. A maximum stable temperature was determined, as the practical implications of cooling down a reactor and then reheating it after hydration would serve as a significant energy penalty to the PRC2 process. After hydration, the sample was heated to 850 °C under 100 mL/min of either N2 or CO2 and the temperature allowed to stabilize for 5 min. Carbonation was then performed in 100% CO2 for 60 min. The process was then repeated for 5 to 10 cycles. The conversion efficiency levels of the carbonate materials ( x C a C O 3 and x C a M g ( C O 3 ) 2 ) over the course of each experiment were determined by taking the ratio of the CO2 carrying capacity of the sorbent and the amount of CO2 captured. The conversion efficiency equations for CaCO3 and CaMg(CO3)2 are presented in Equation (1) and Equation (2), respectively.
x C a C O 3 = m C O 2   e x p e r i m e n t a l ( m i , C a C O 3 m C a O   e x p e r i m e n t a l ) × 100
x C a M g C O 3 2 = m C O 2   e x p e r i m e n t a l ( m i , C a M g ( C O 3 ) 2 m C a M g O   e x p e r i m e n t a l ) × 100
where x C a C O 3 (%) is the conversion efficiency of CaCO3, x C a M g ( C O 3 ) 2 (%) is the conversion efficiency of CaMg(CO3)2, and   m C O 2   e x p e r i m e n t a l (wt%) is the mass of CO2 captured during the carbonation cycle. The m i , C a C O 3 (wt%) is the initial mass of CaCO3, m C a O   e x p e r i m e n t a l (wt%) is the minimum mass reached during the calcination of CaCO3, m i , C a M g ( C O 3 ) 2 (wt%) is the initial mass of CaMg(CO3)2, and m C a M g O   e x p e r i m e n t a l (wt%) is the minimum mass reached during the calcination of CaMg(CO3)2. The experimentally determined conversion efficiencies were then used in the process modelling of the nine different PRC2 process configurations.
A particle attrition study was then conducted to examine particle sintering and/or breakage under long-term fluidization in a CO2 atmosphere. The particle attrition study was carried out in a laboratory-scale fluidized bed, as shown in Figure 3. The experimental setup consisted of a quartz tube reactor placed inside a vertical tube furnace which was maintained at 850 °C. Fifty grams of fresh CaCO3, the same material used in the HP-TGA study, was loaded into the quartz tube reactor and fluidized with 1 NL/min of CO2. The flow rate determined was selected to ensure that the minimum fluidization velocity of the particles was exceeded; the flowrate was in the bubbling fluidization regime. The experimental setup was operated continuously for a period of 12 weeks, with 2 g of sample taken every week for the first four weeks and then every fortnight from week 4 to week 12 (i.e., weeks 6, 8, 10, and 12) for further analysis.
Particle size analysis was conducted on each of the samples taken during the particle attrition experiments via a Malvern Mastersizer 3000 (Malvern, UK). The particle size distribution, mean particle diameter, and surface area of each of the samples were measured. Each measurement was performed three times, and an average value was obtained. From the particle size distribution, the d-values (d10, d50, and d90) and Sauter mean diameter were determined. The d-values correspond to the intercepts for 10%, 50%, and 90% of the cumulative mass of the particle size distribution, and the Sauter mean diameter was calculated as follows:
d [ 3,2 ] = i ( n i × d i 3 ) i ( n i × d i 2 )
where d[3,2] is the Sauter mean diameter, ni is the number of particles in size range i, and di is the particle diameter in size range i.
To examine the changes in surface morphology, scanning electron microscopy (SEM) was conducted on a fresh CaCO3 sample and the sample collected after 8 weeks of the particle attrition study (Sample 6, collected after 8 weeks). SEM was conducted on a Zeiss Sigma VP field emission scanning electron microscope (FE-SEM) equipped with back-scattered electron (BSE) and secondary electron (SE) detectors.

2.3. Alternative Configurations for the PRC2 Process

The process used to identify potential demonstration plant configurations involved an iterative approach. Each new configuration was proposed based on the outcomes of experimental, process modelling, and/or levelized cost of storage calculations. In total, nine concept designs were developed and evaluated. A summary of each option, including a process flow diagram of the configuration and a summary of the key process metrics and stream information is provided in Appendix A. A brief description of each concept design is provided, as follows:
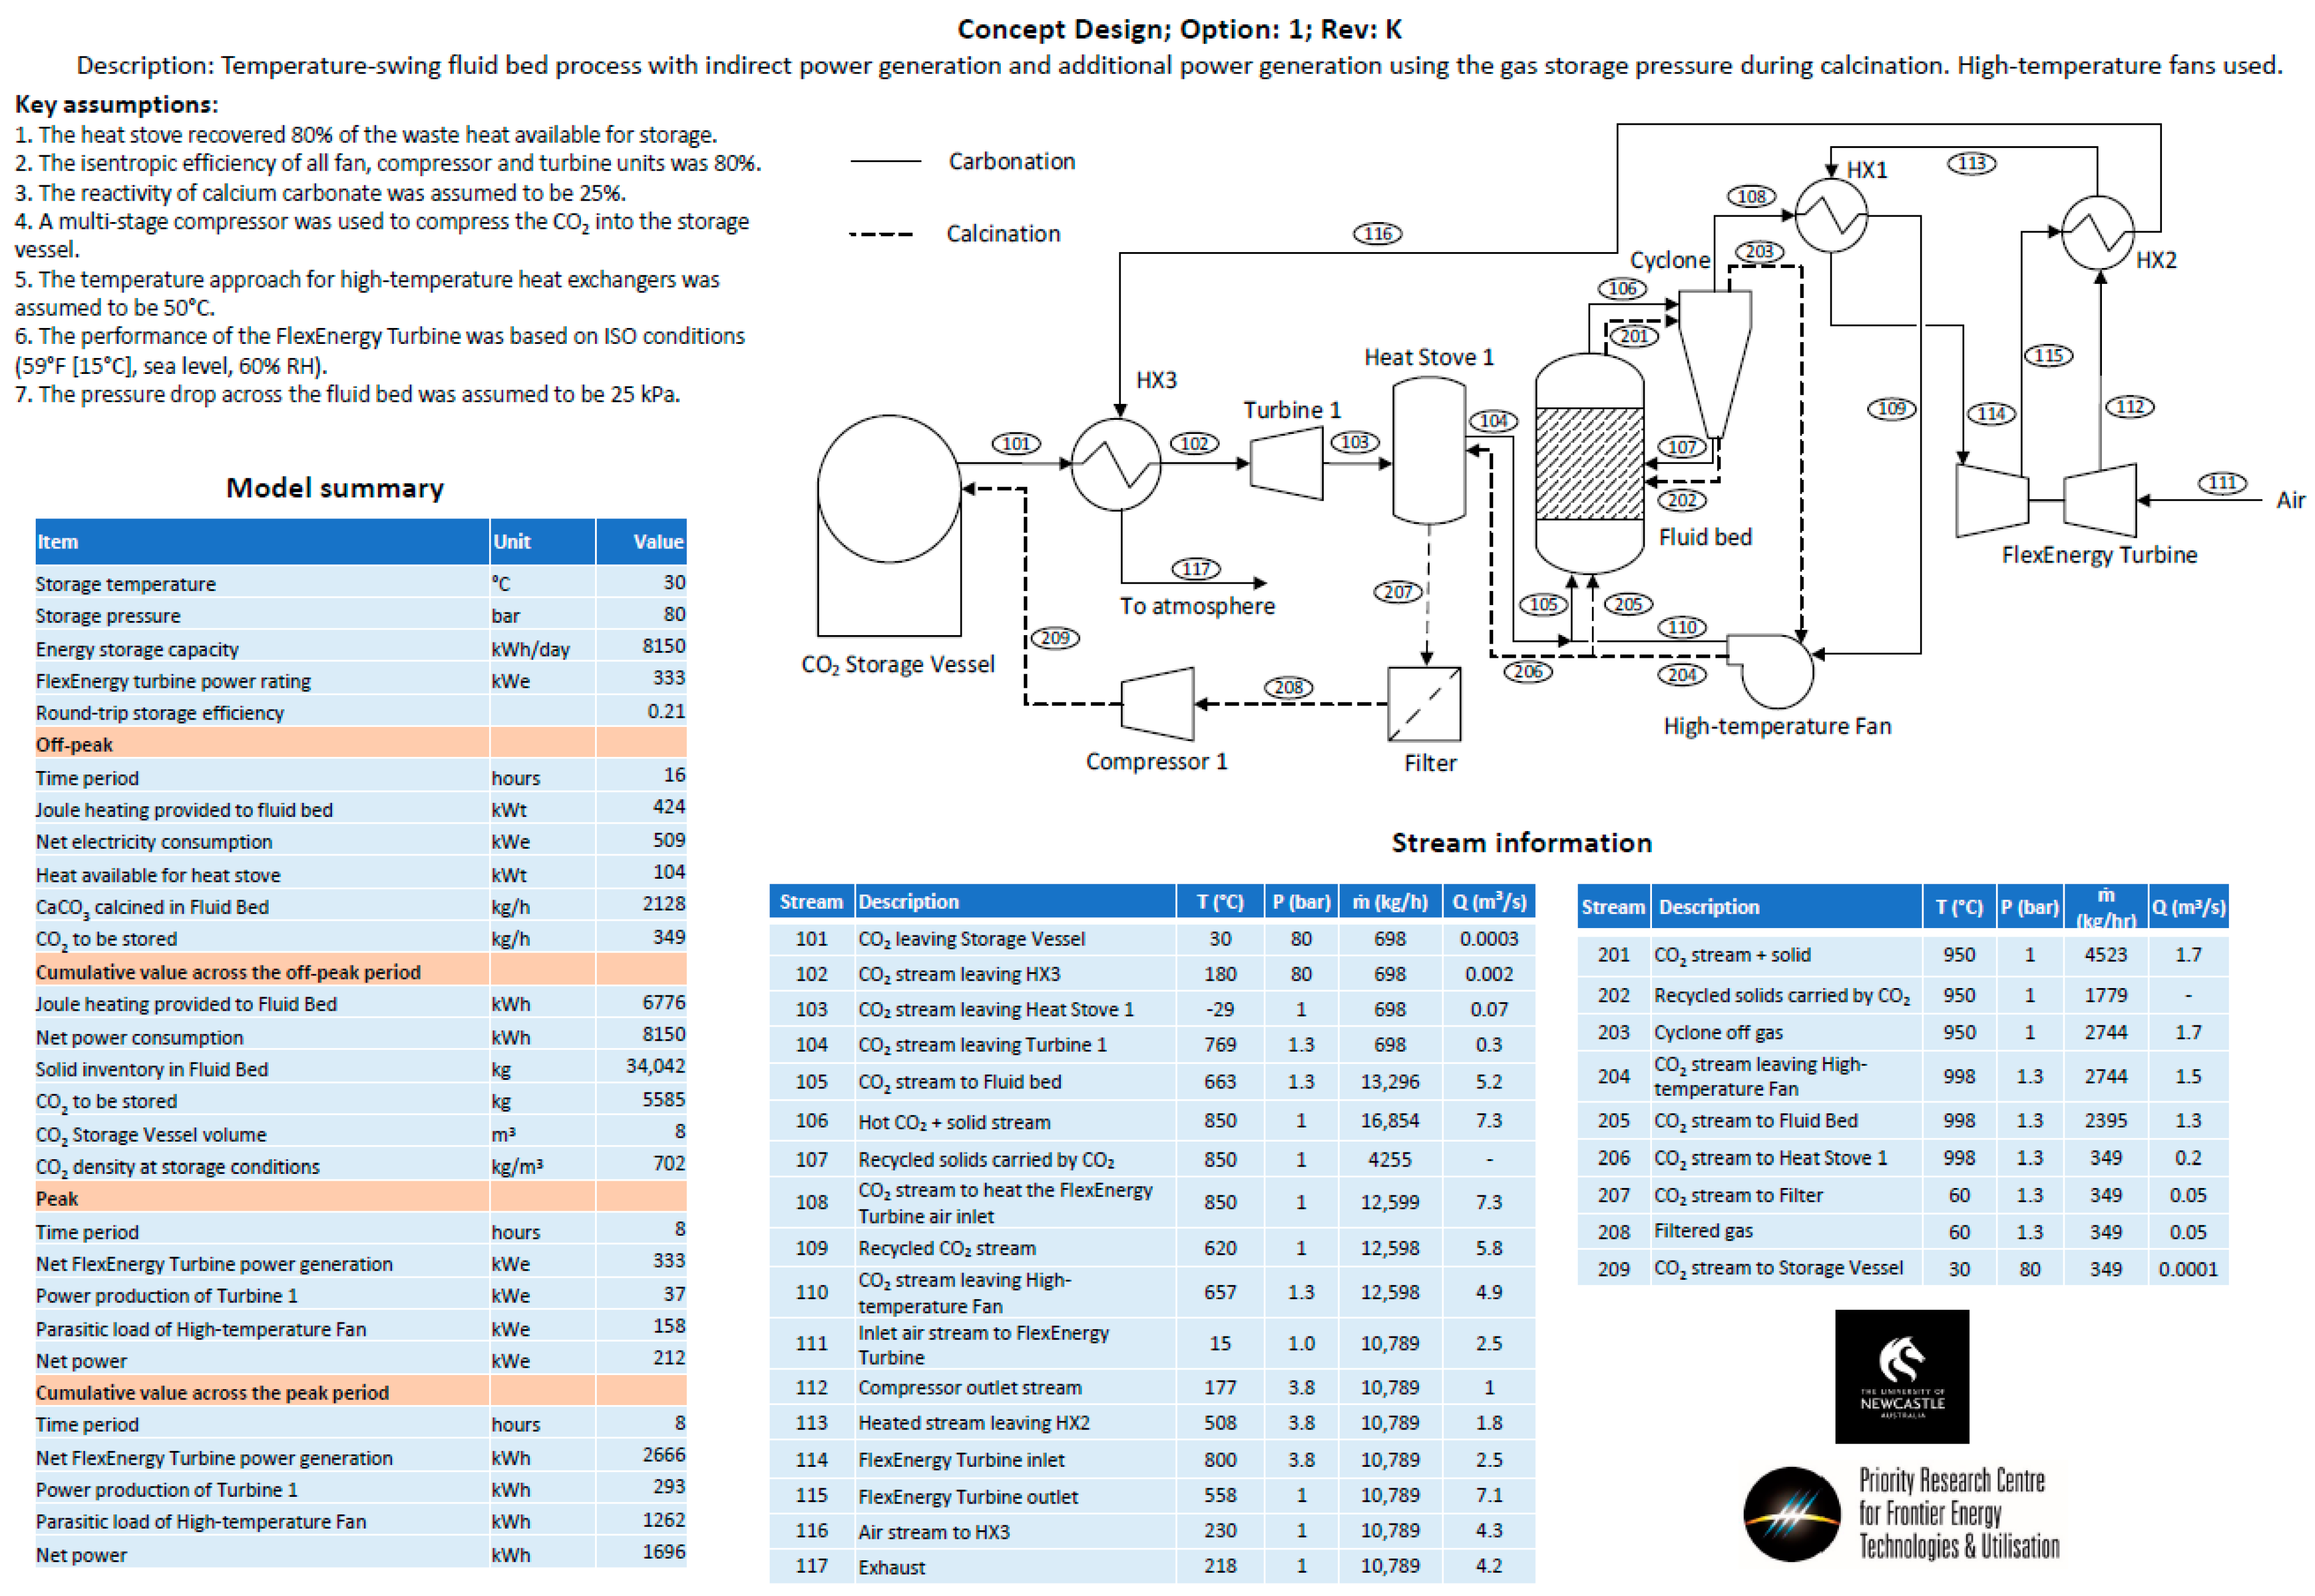
  • Option 1—Temperature swing process with indirect power generation. The hot fluid bed off-gas (CO2) was passed through a heat exchanger to heat the turbine working fluid (air). A high-temperature fan was used to circulate CO2 in the system. A single heat stove was used to cool and heat CO2 entering and leaving the CO2 storage vessel. A second turbine was used to recover energy as CO2 was expanded from the storage vessel.
  • Option 2—Temperature swing process with direct power generation. The hot fluid bed off-gas (CO2) was used directly in the turbine. Before passing through the turbine, the gas was filtered to remove any particles from the circulating stream. The filtration step required additional heat exchangers to satisfy the operating temperatures of the filter and compressor. Option 2 had a configuration entering and exiting the CO2 storage vessel similar to that of Option 1.
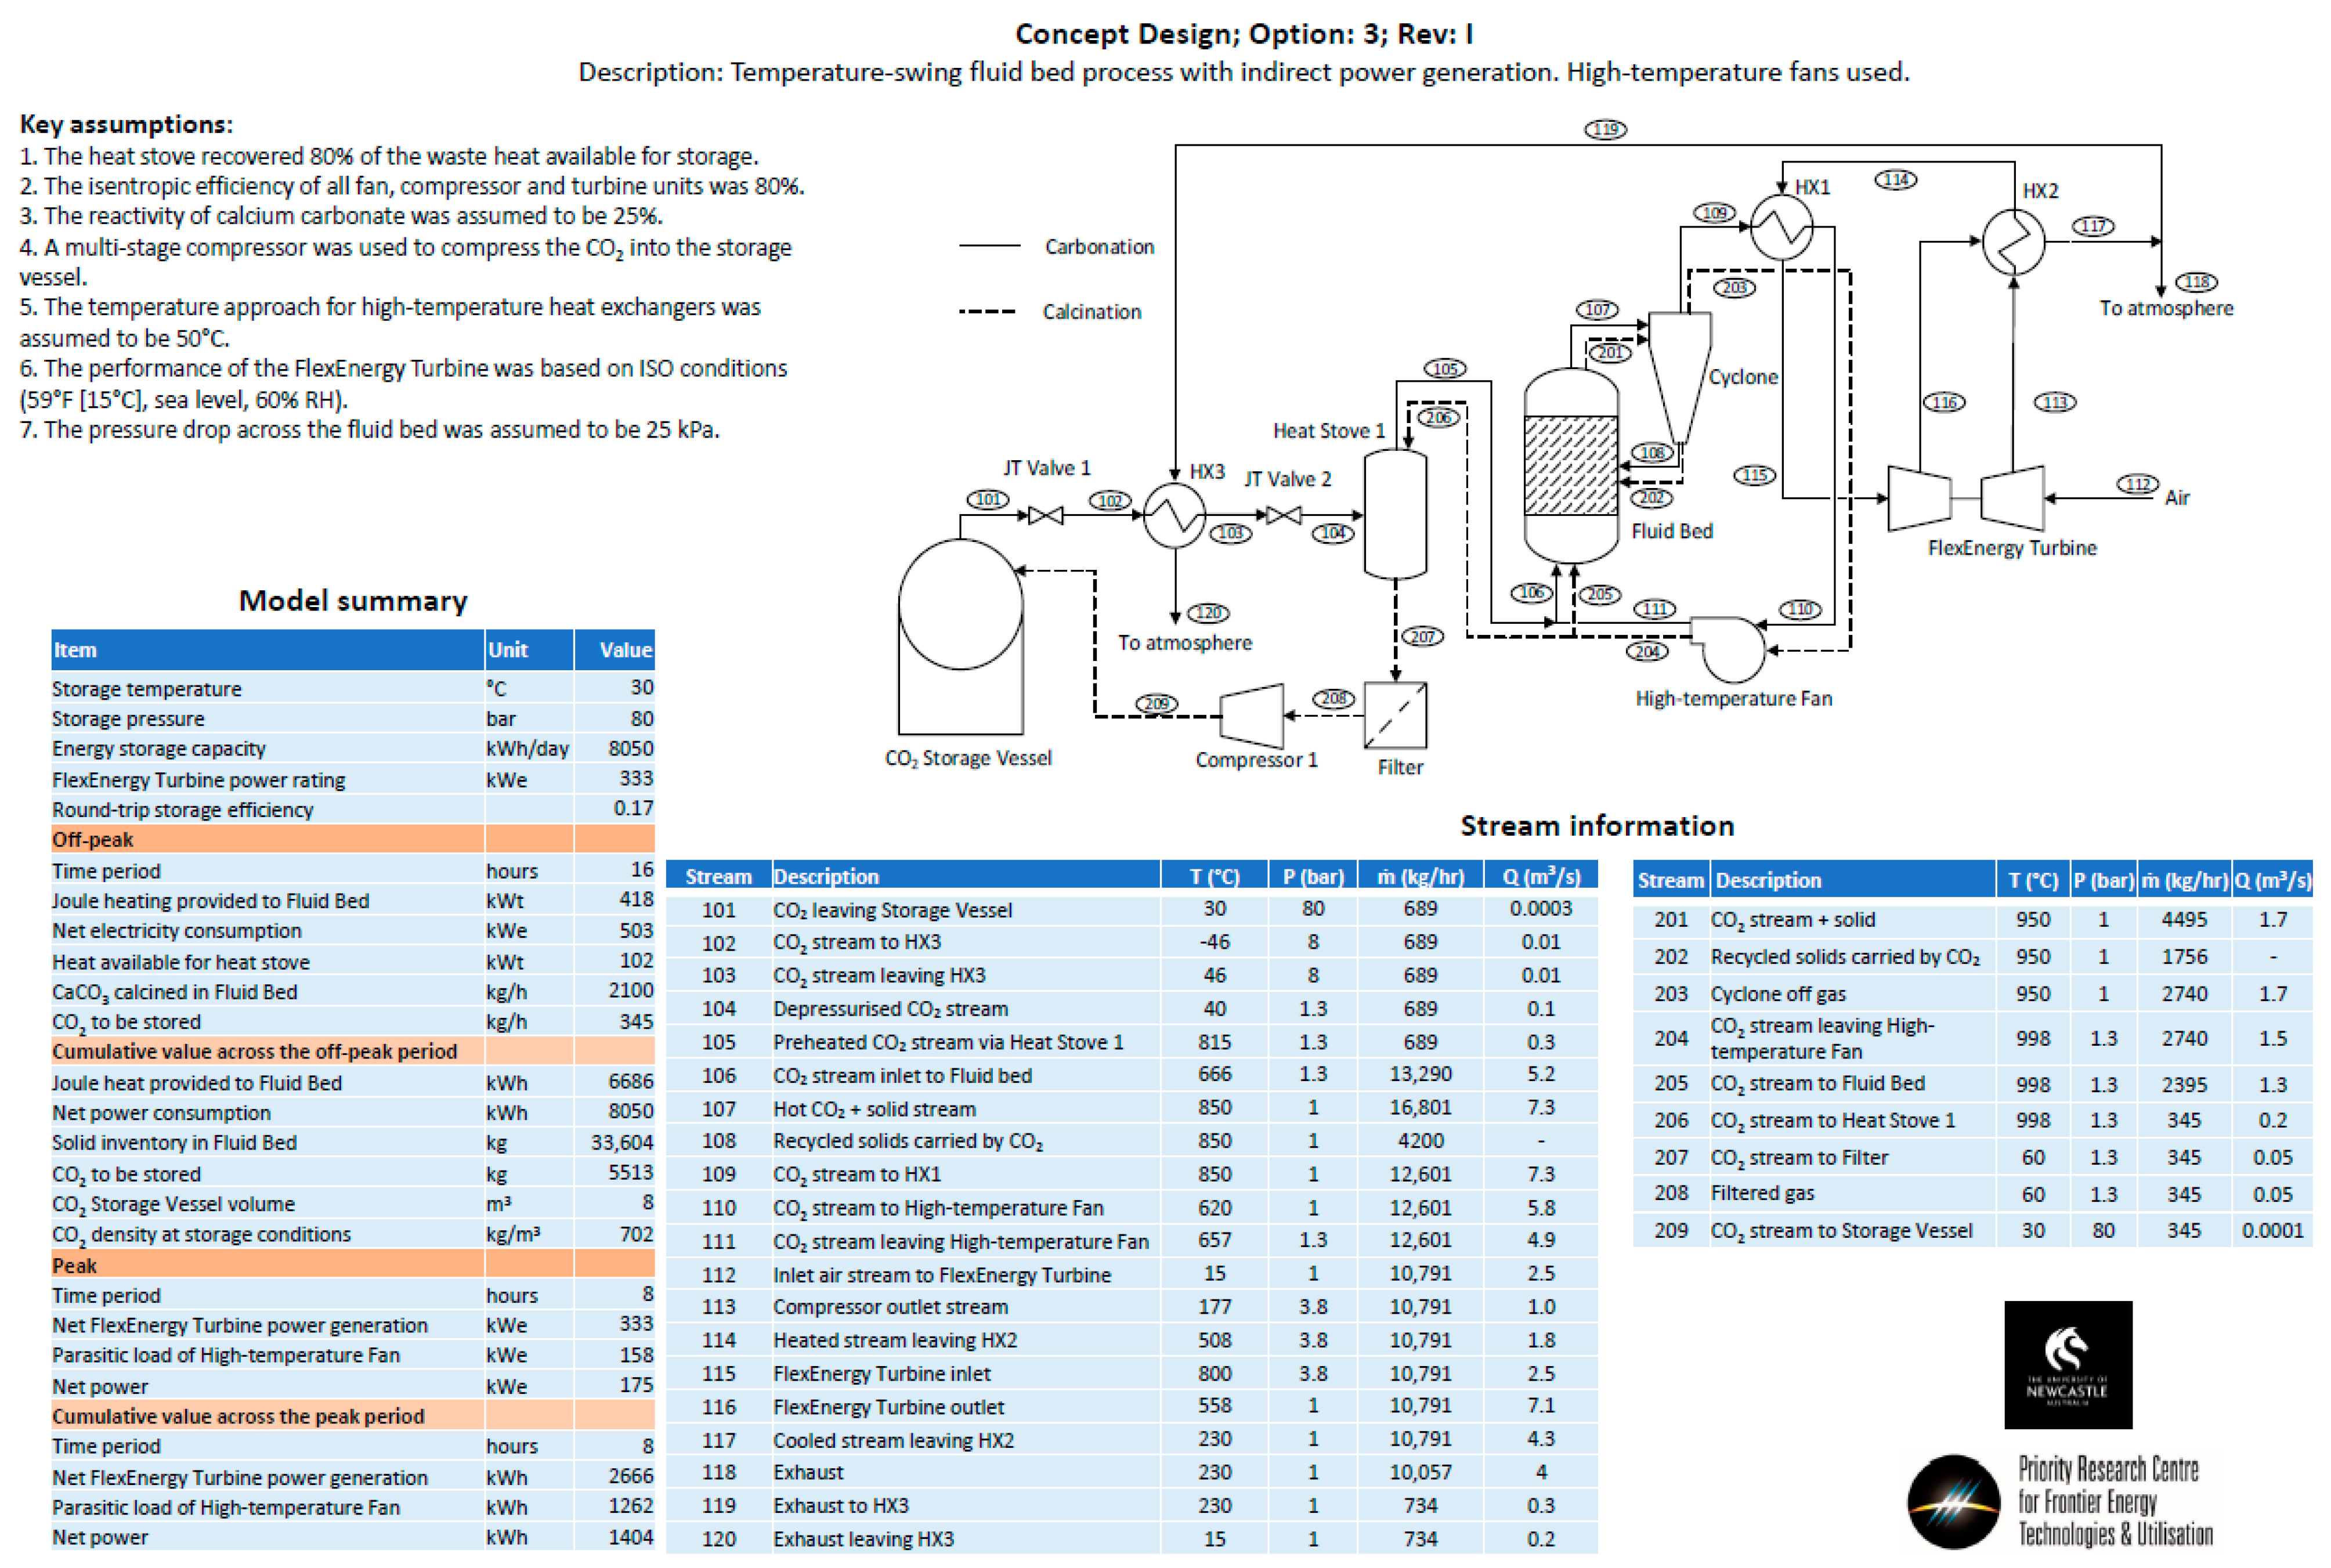
  • Option 3—The same configuration as Option 1, except with the removal of the additional turbine used to recover energy from the stream exiting the CO2 storage vessel. Instead, a series of Joule–Thomson valves were implemented in the model.
  • Option 4—The same approach as Option 3, except the high-temperature fan has been replaced by low-temperature fan options.
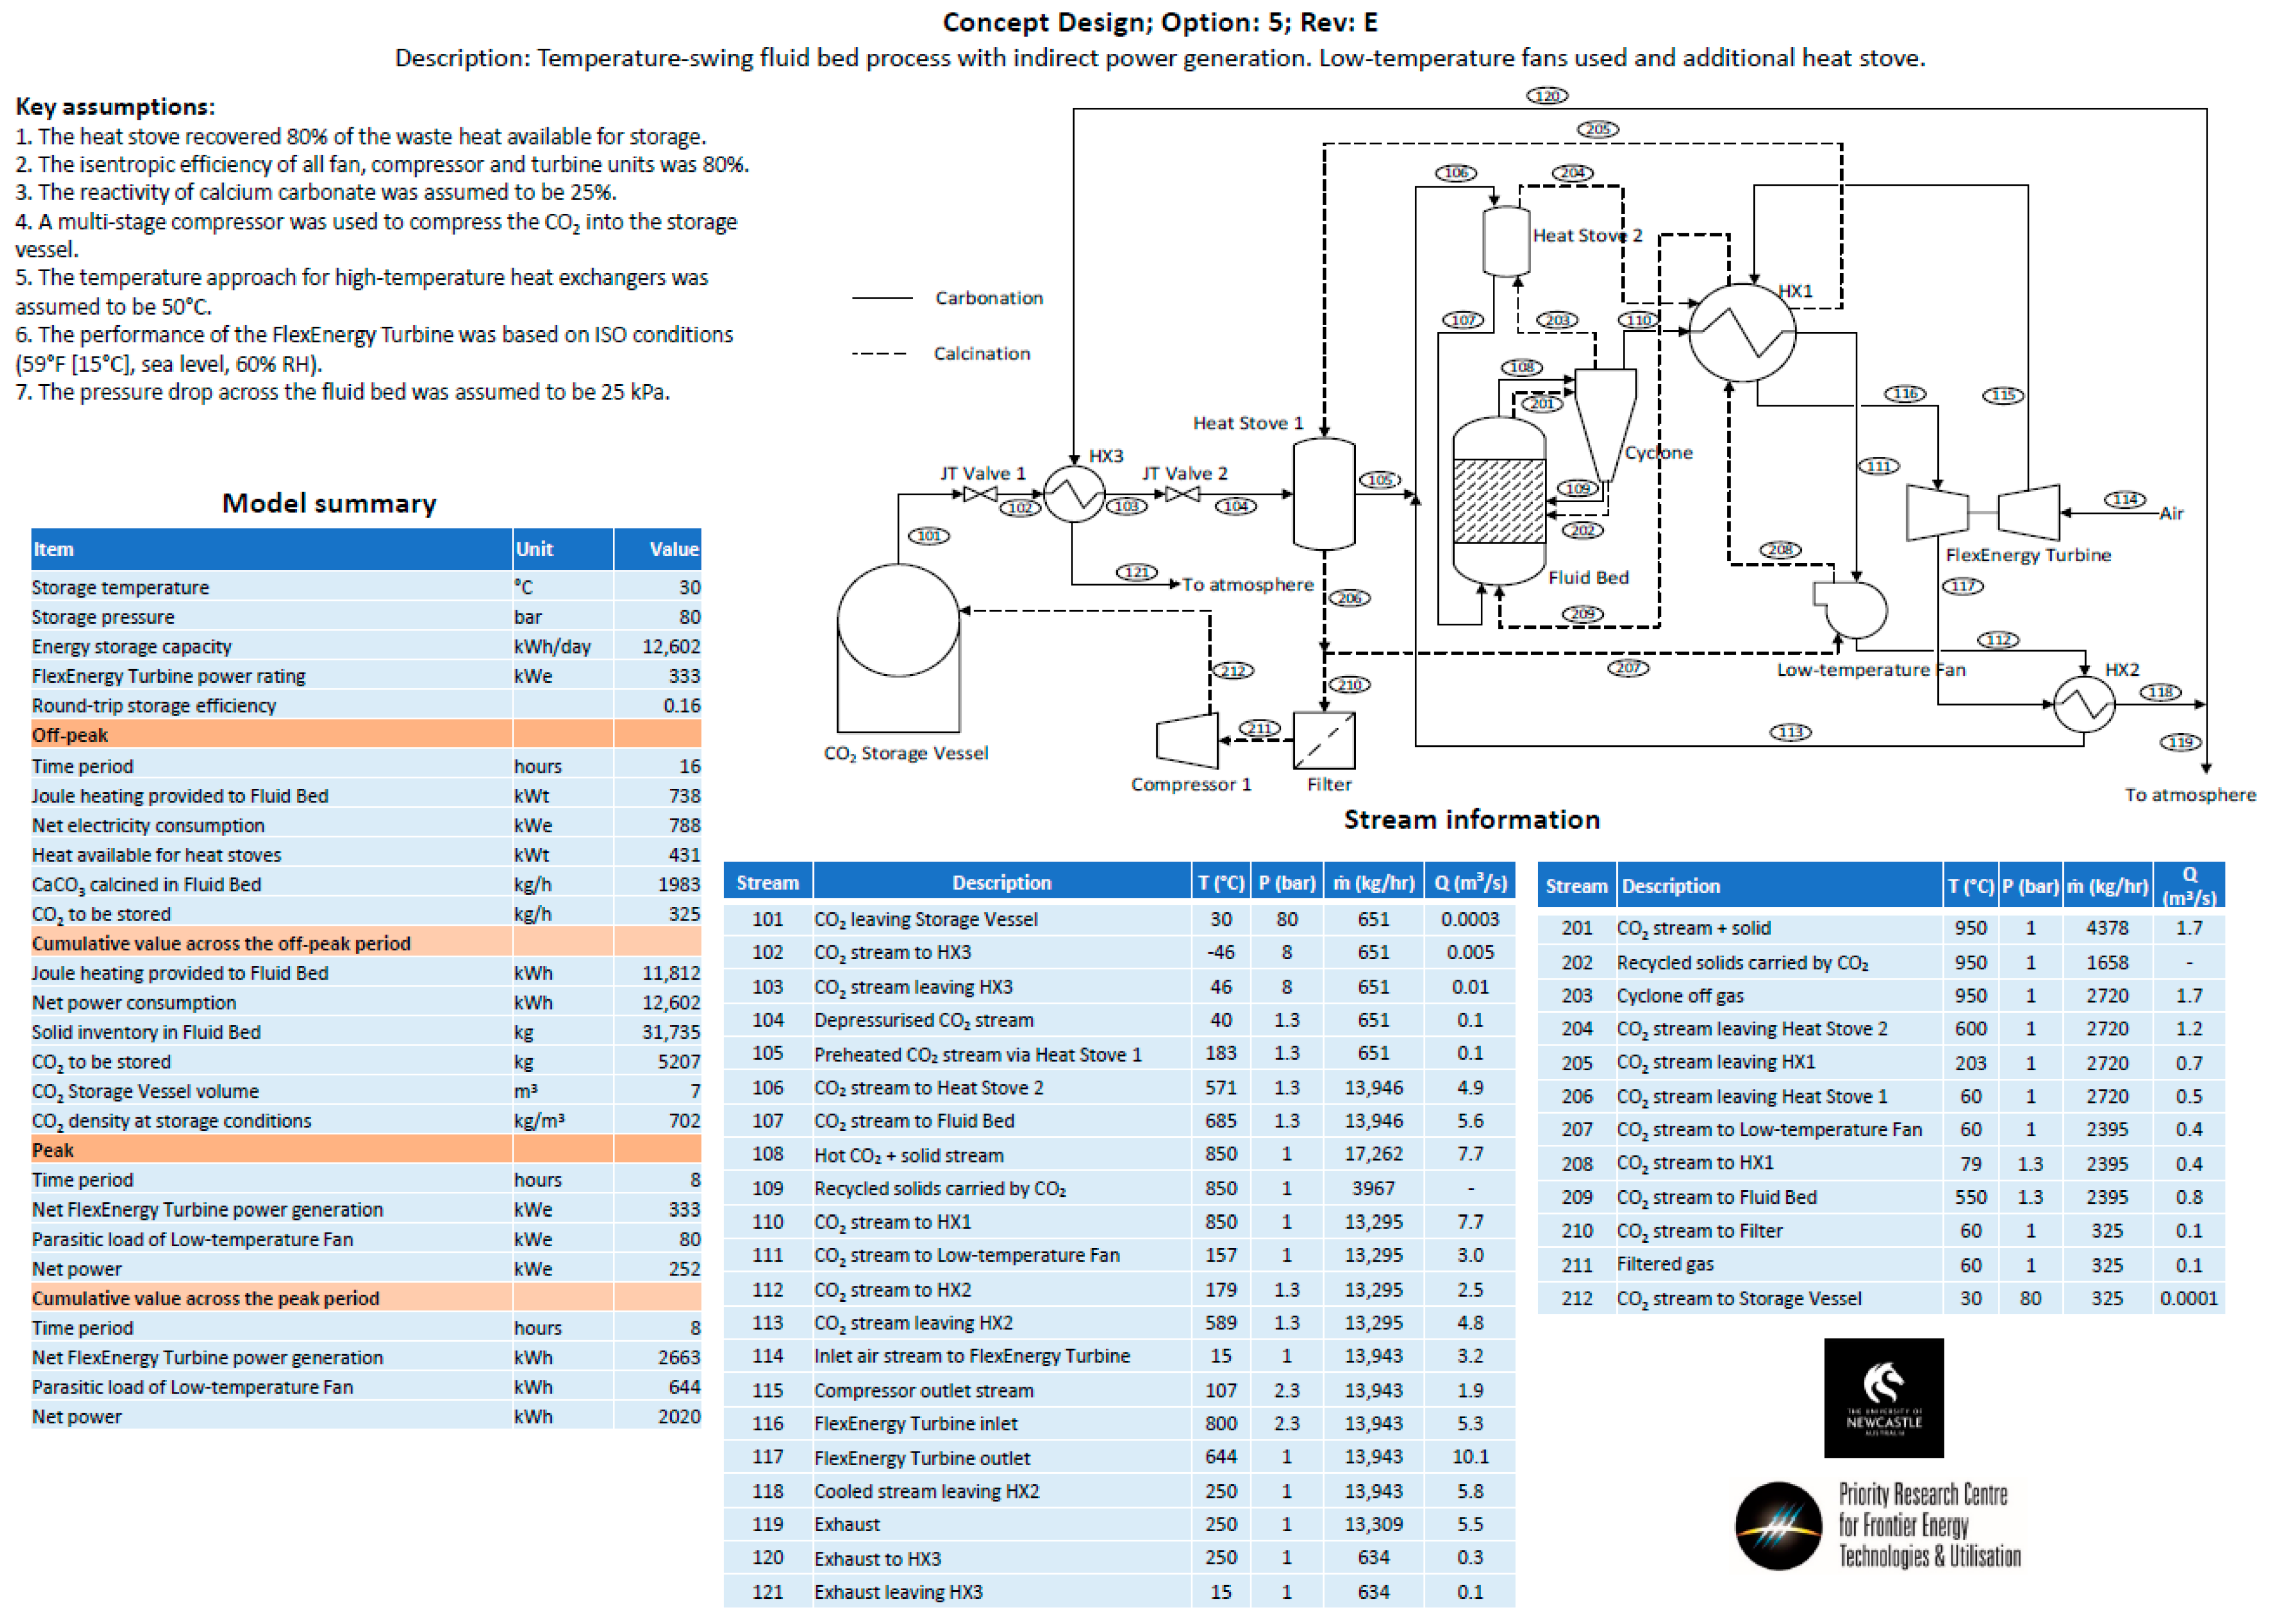
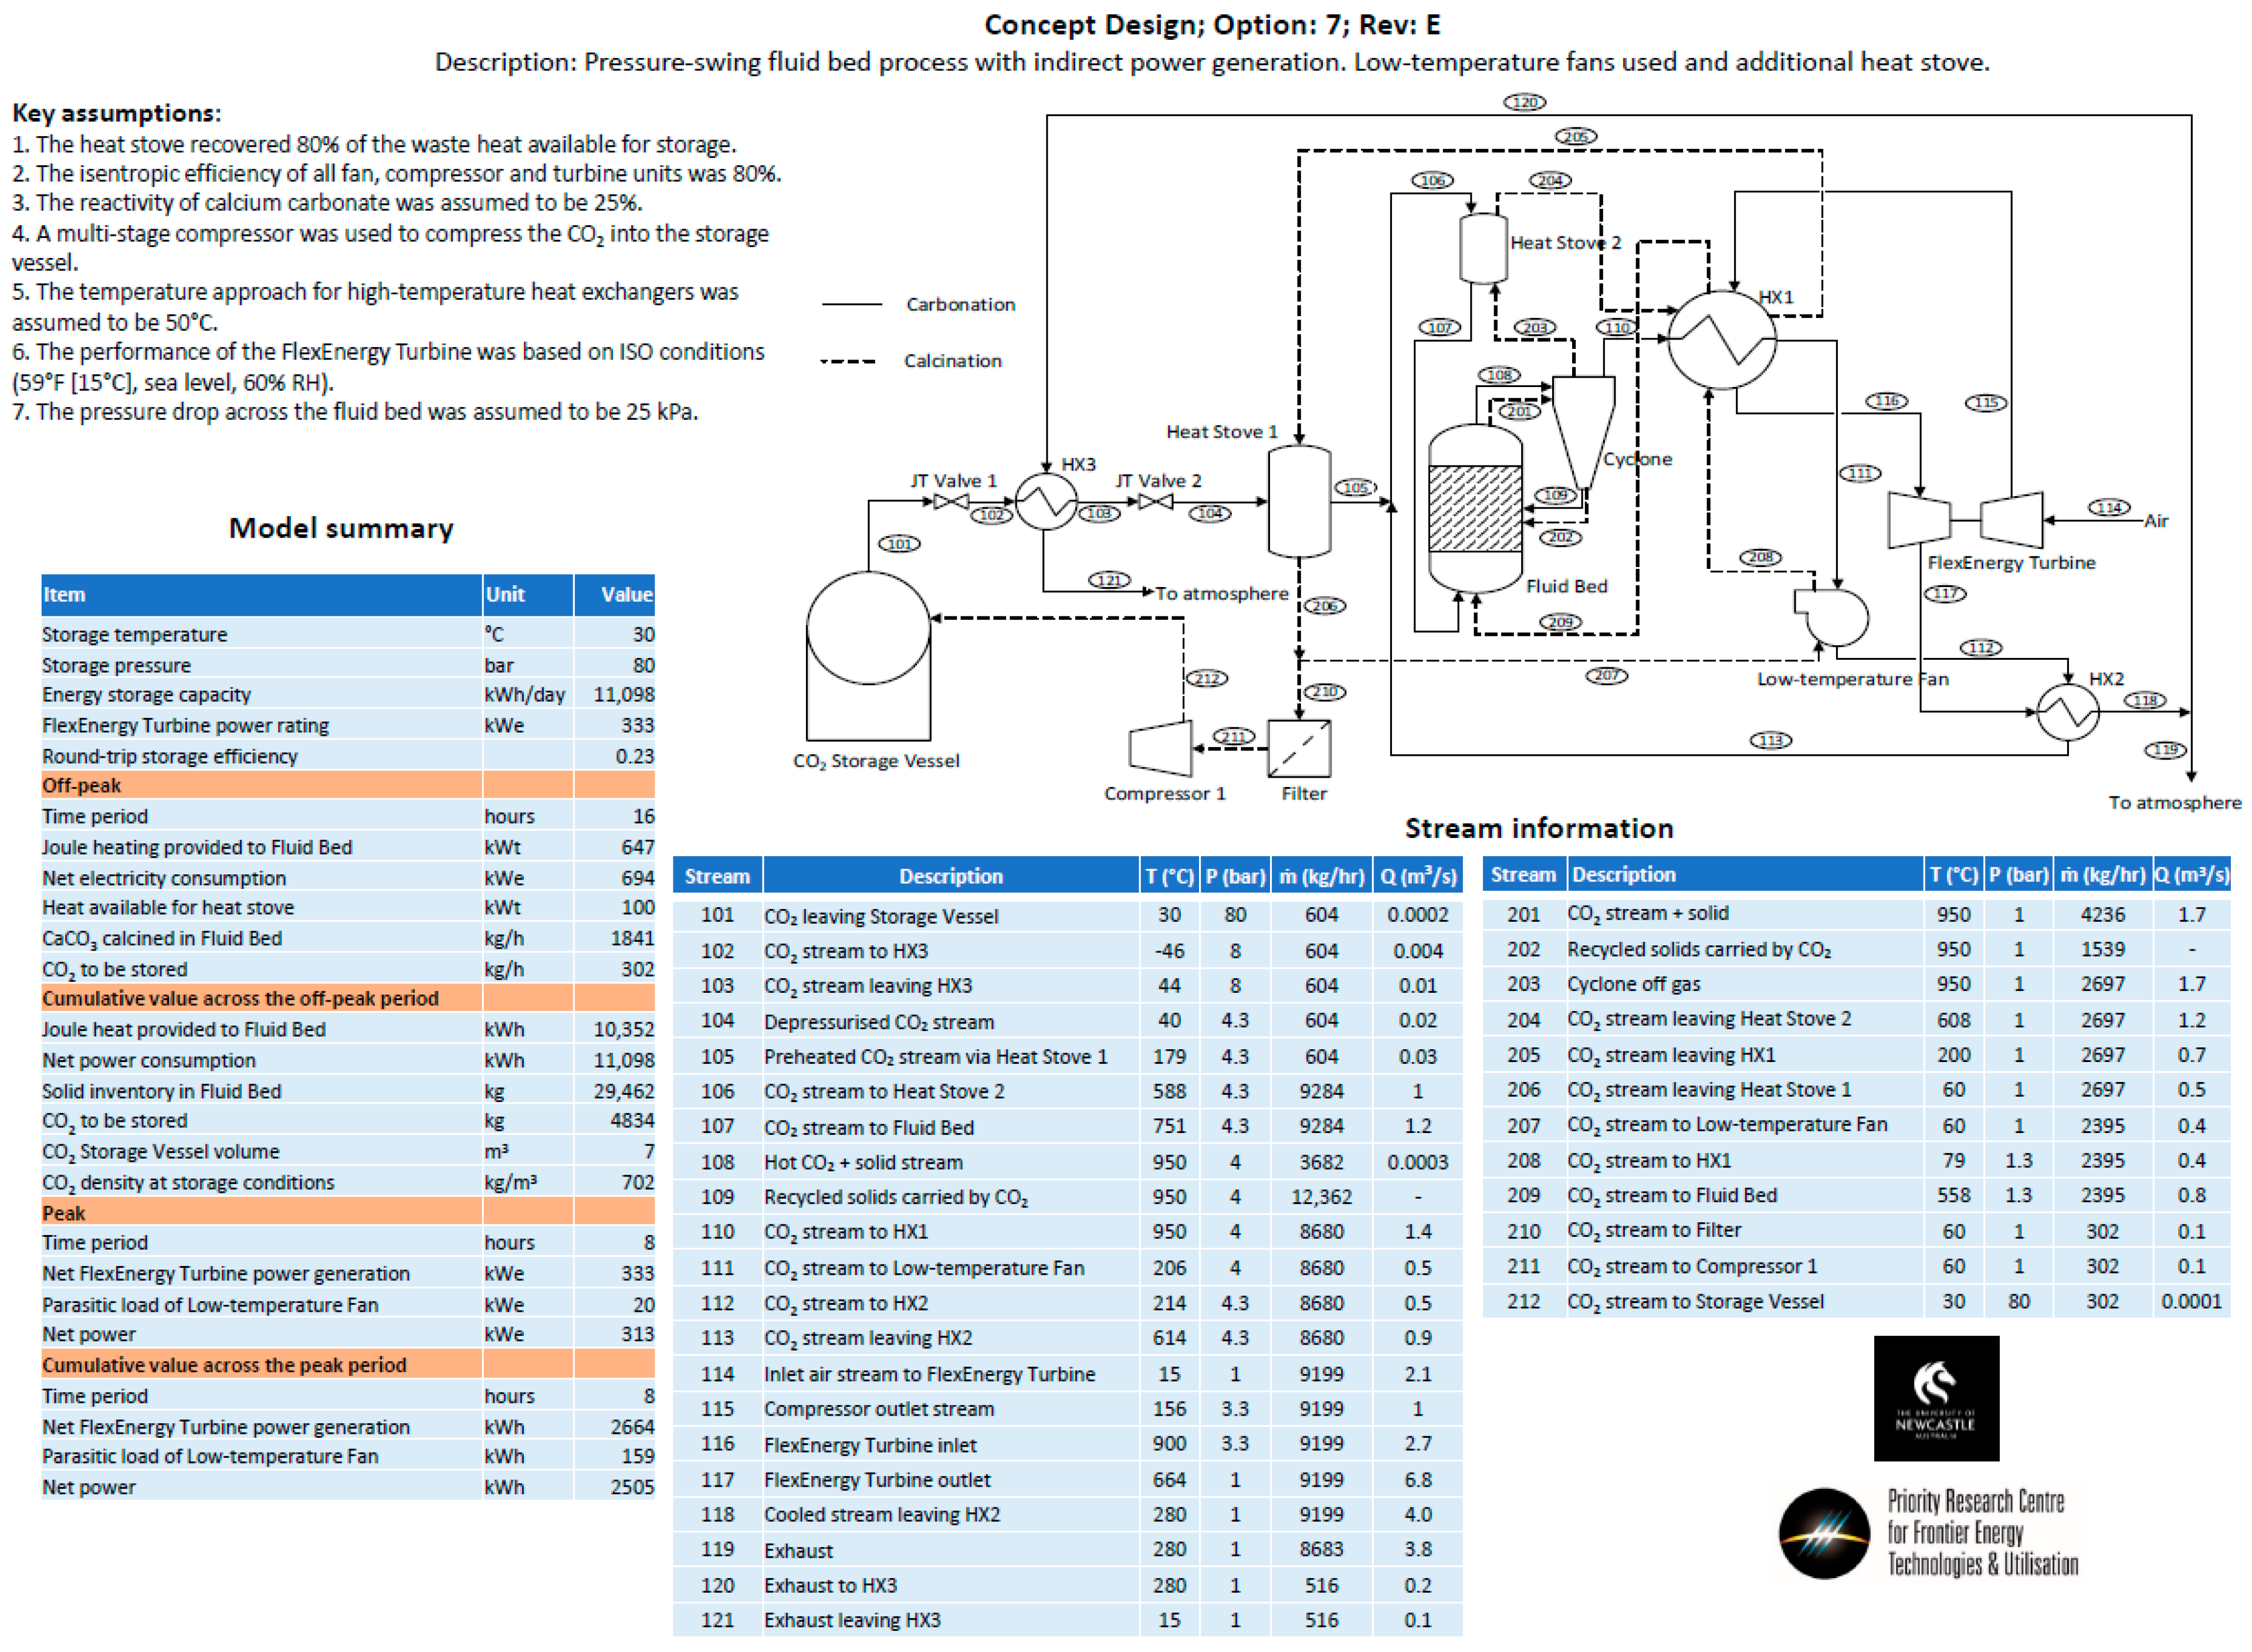
  • Option 5—The same approach as Option 4, except for the fact that it utilizes an additional heat stove.
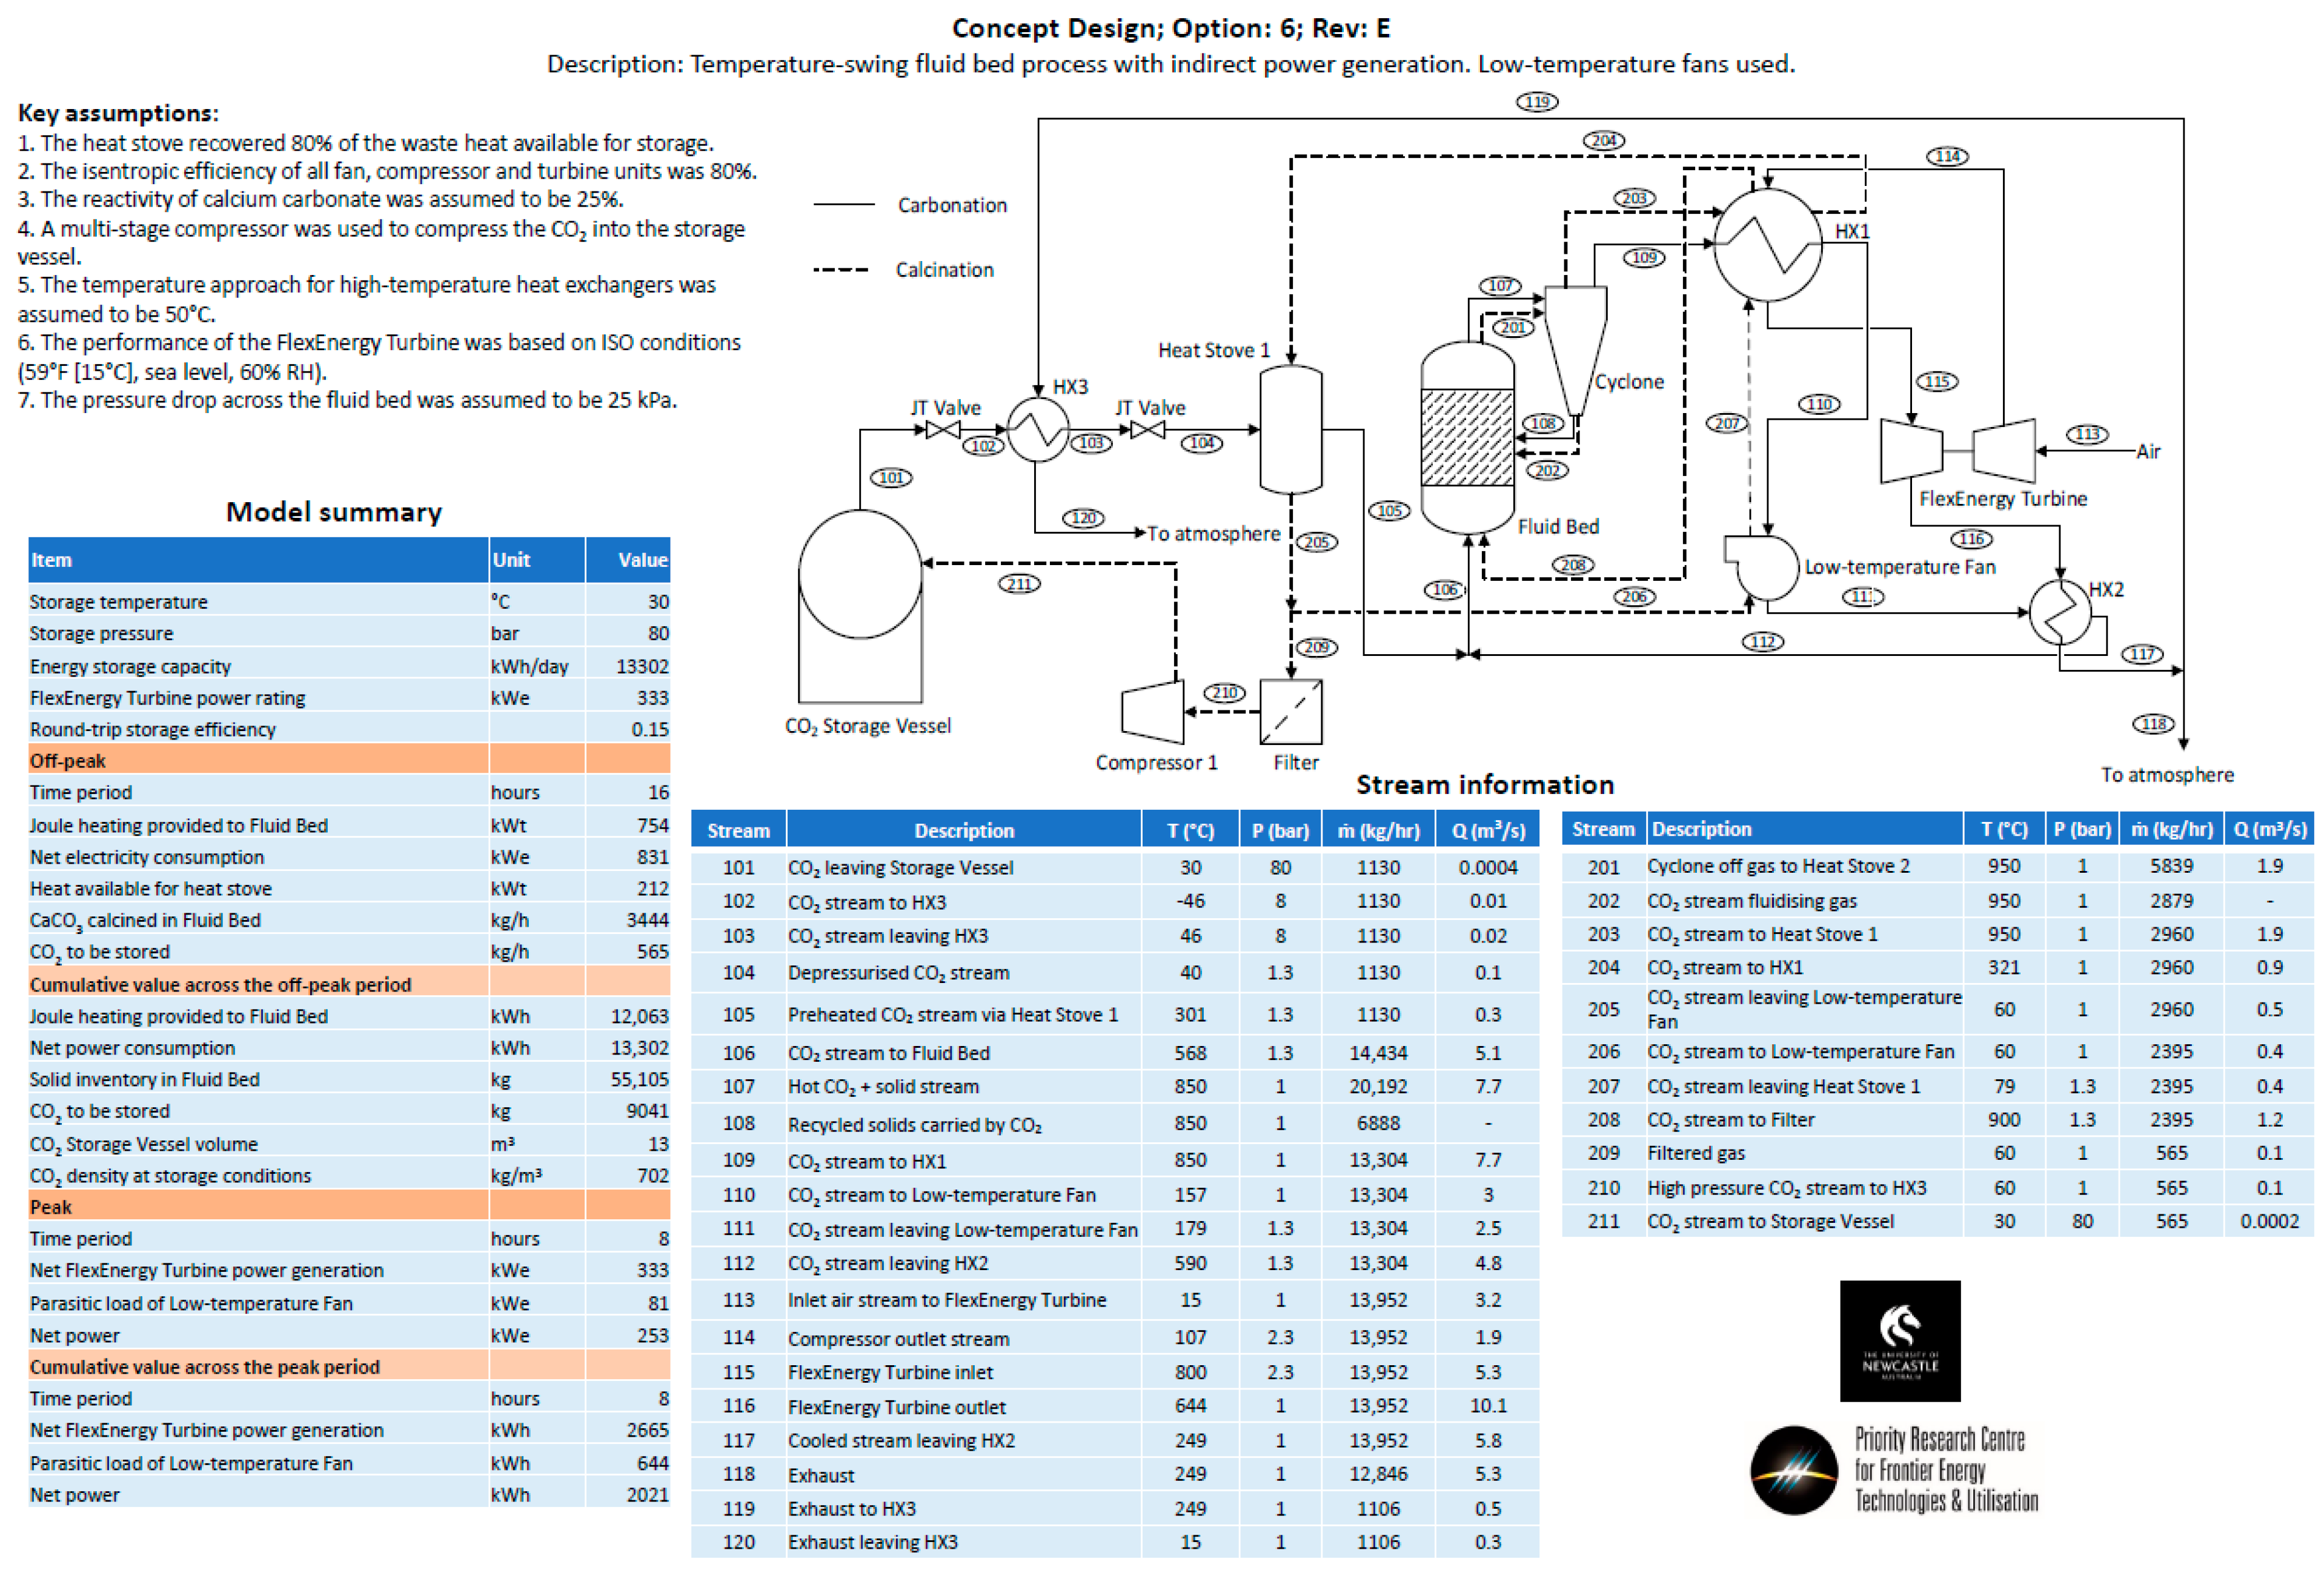
  • Option 6—The same approach as Option 4, except for the fact that it utilizes an alternate low-temperature fan configuration.
  • Option 7—A pressure swing process with the same process configuration as Option 5. The temperature of the fluid bed was held at a constant temperature for both carbonation and calcination. The pressure of the fluid bed was changed between the carbonation (high pressure) and calcination cycles (low pressure).
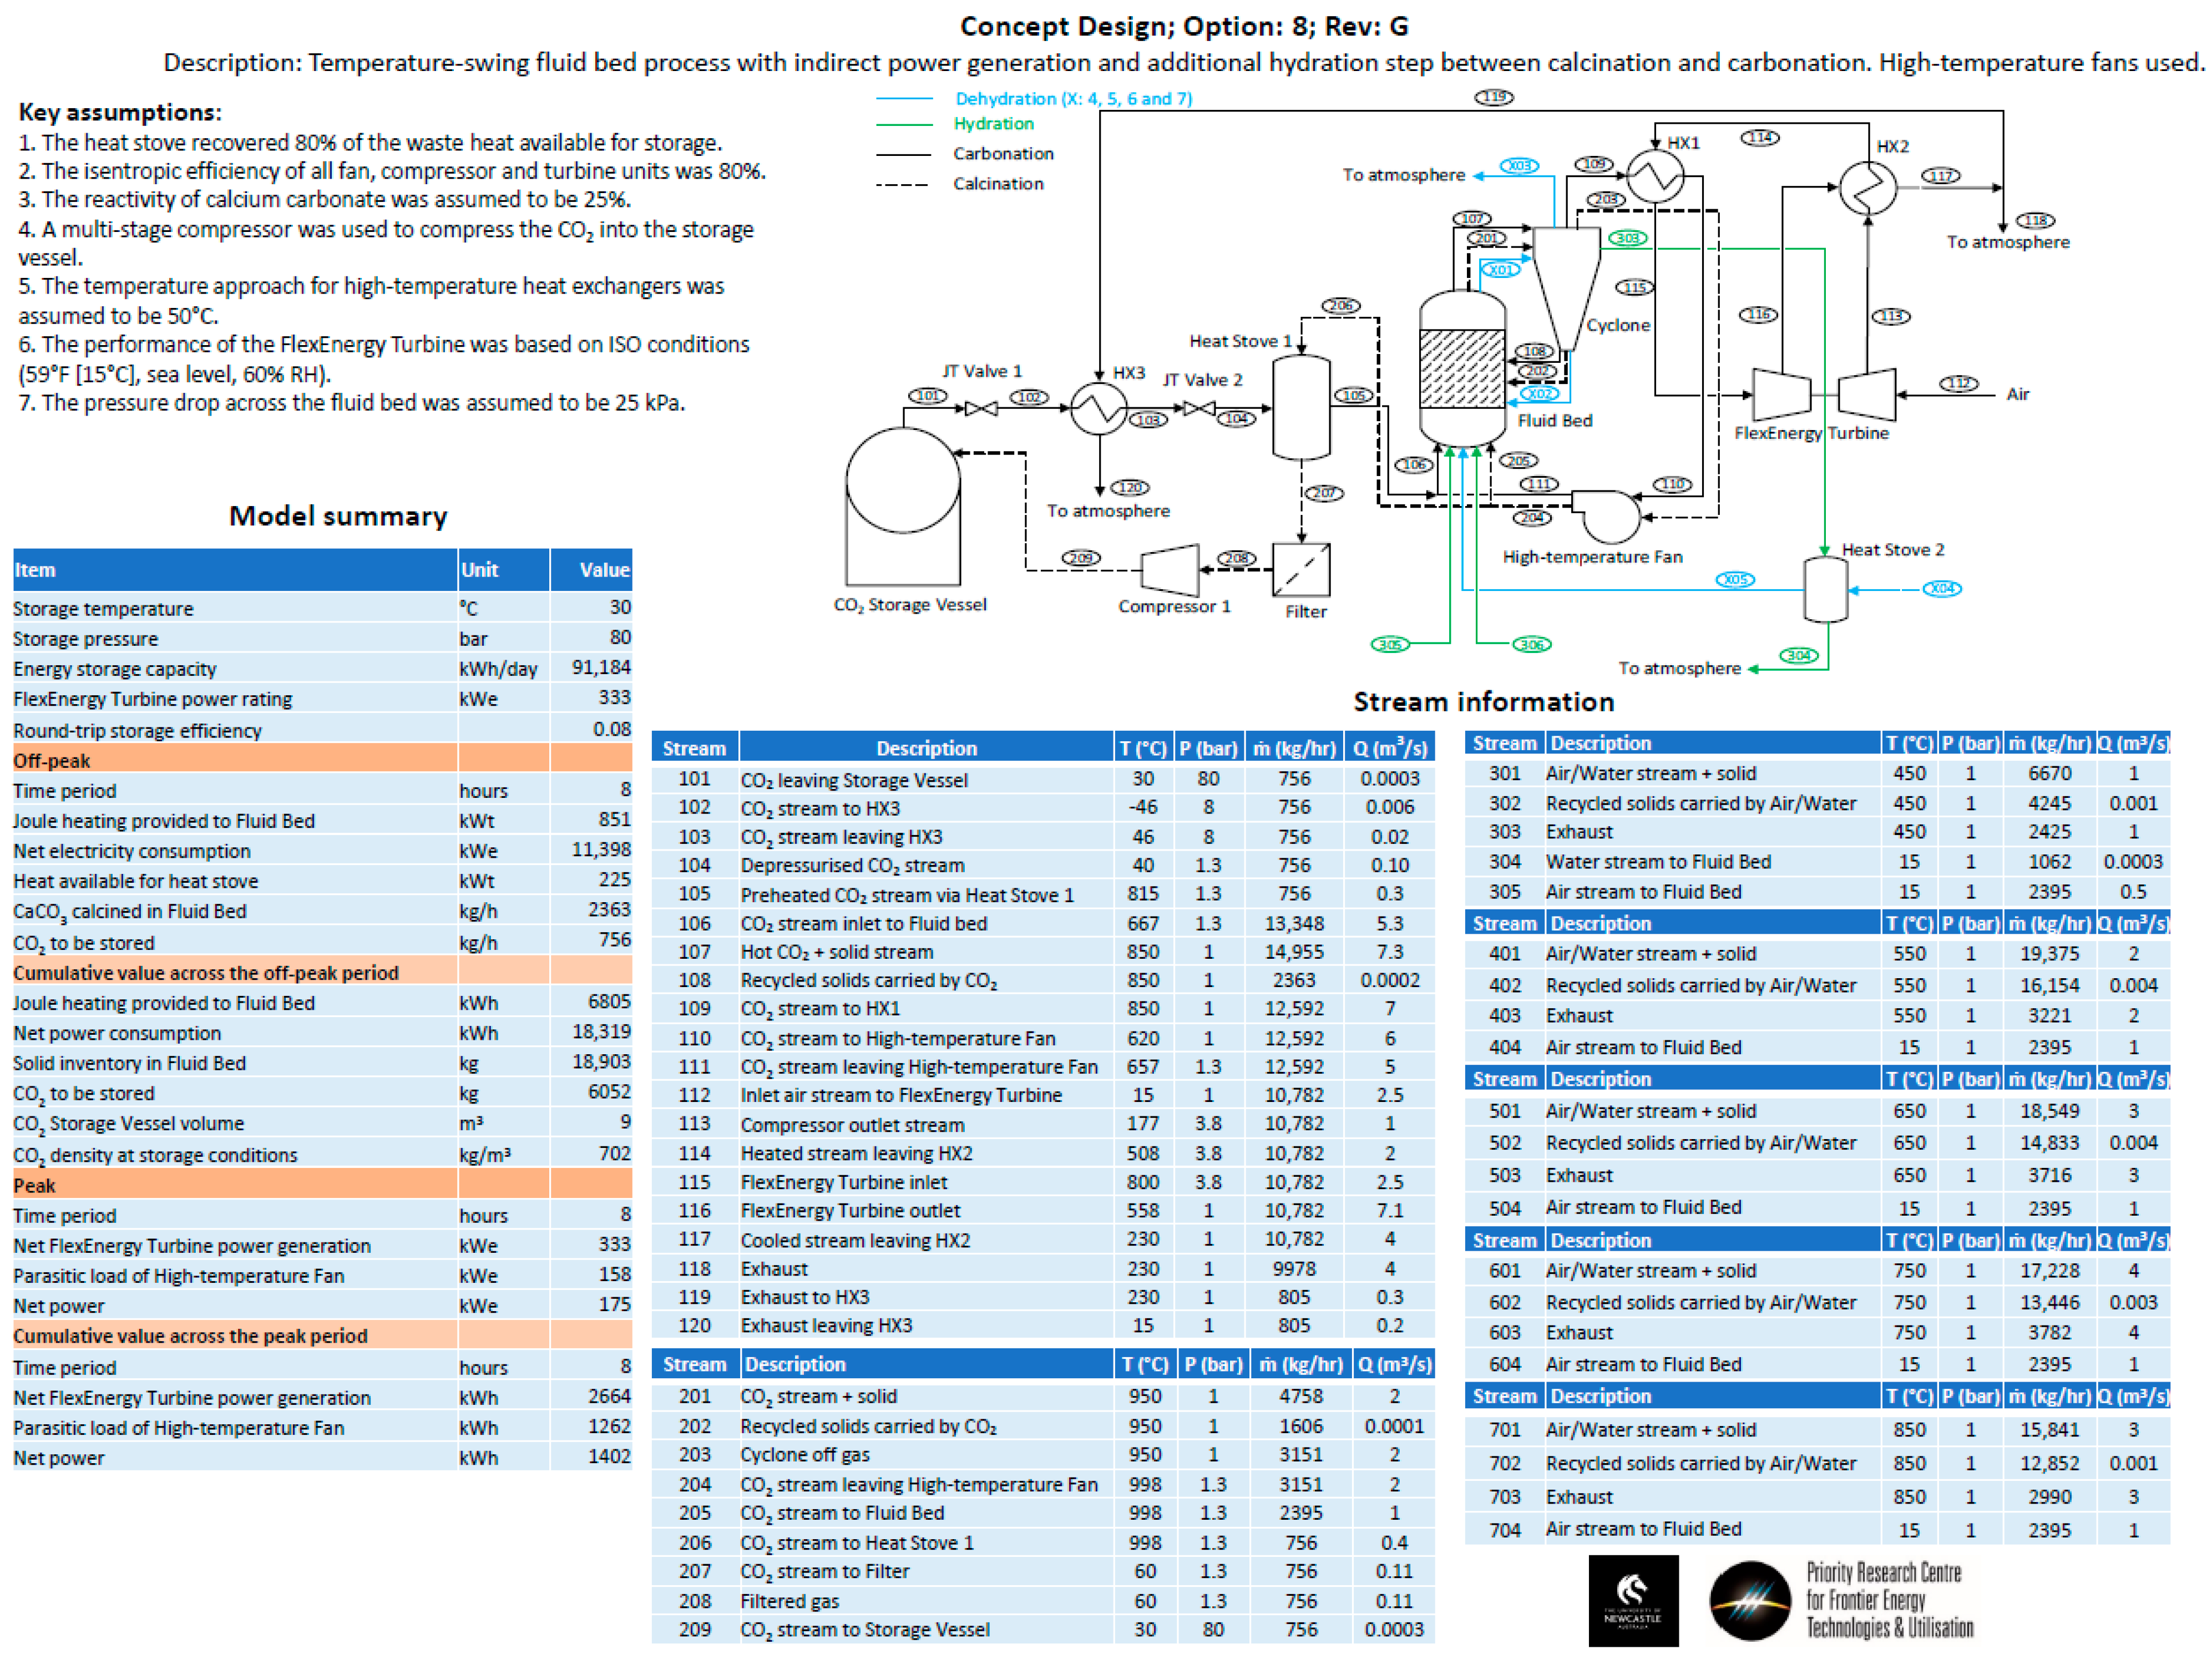
  • Option 8—The same configuration as Option 3, but a hydration step was added between the calcination and carbonation steps. The hydration step aimed to improve the conversion efficiency of the carbonate material.
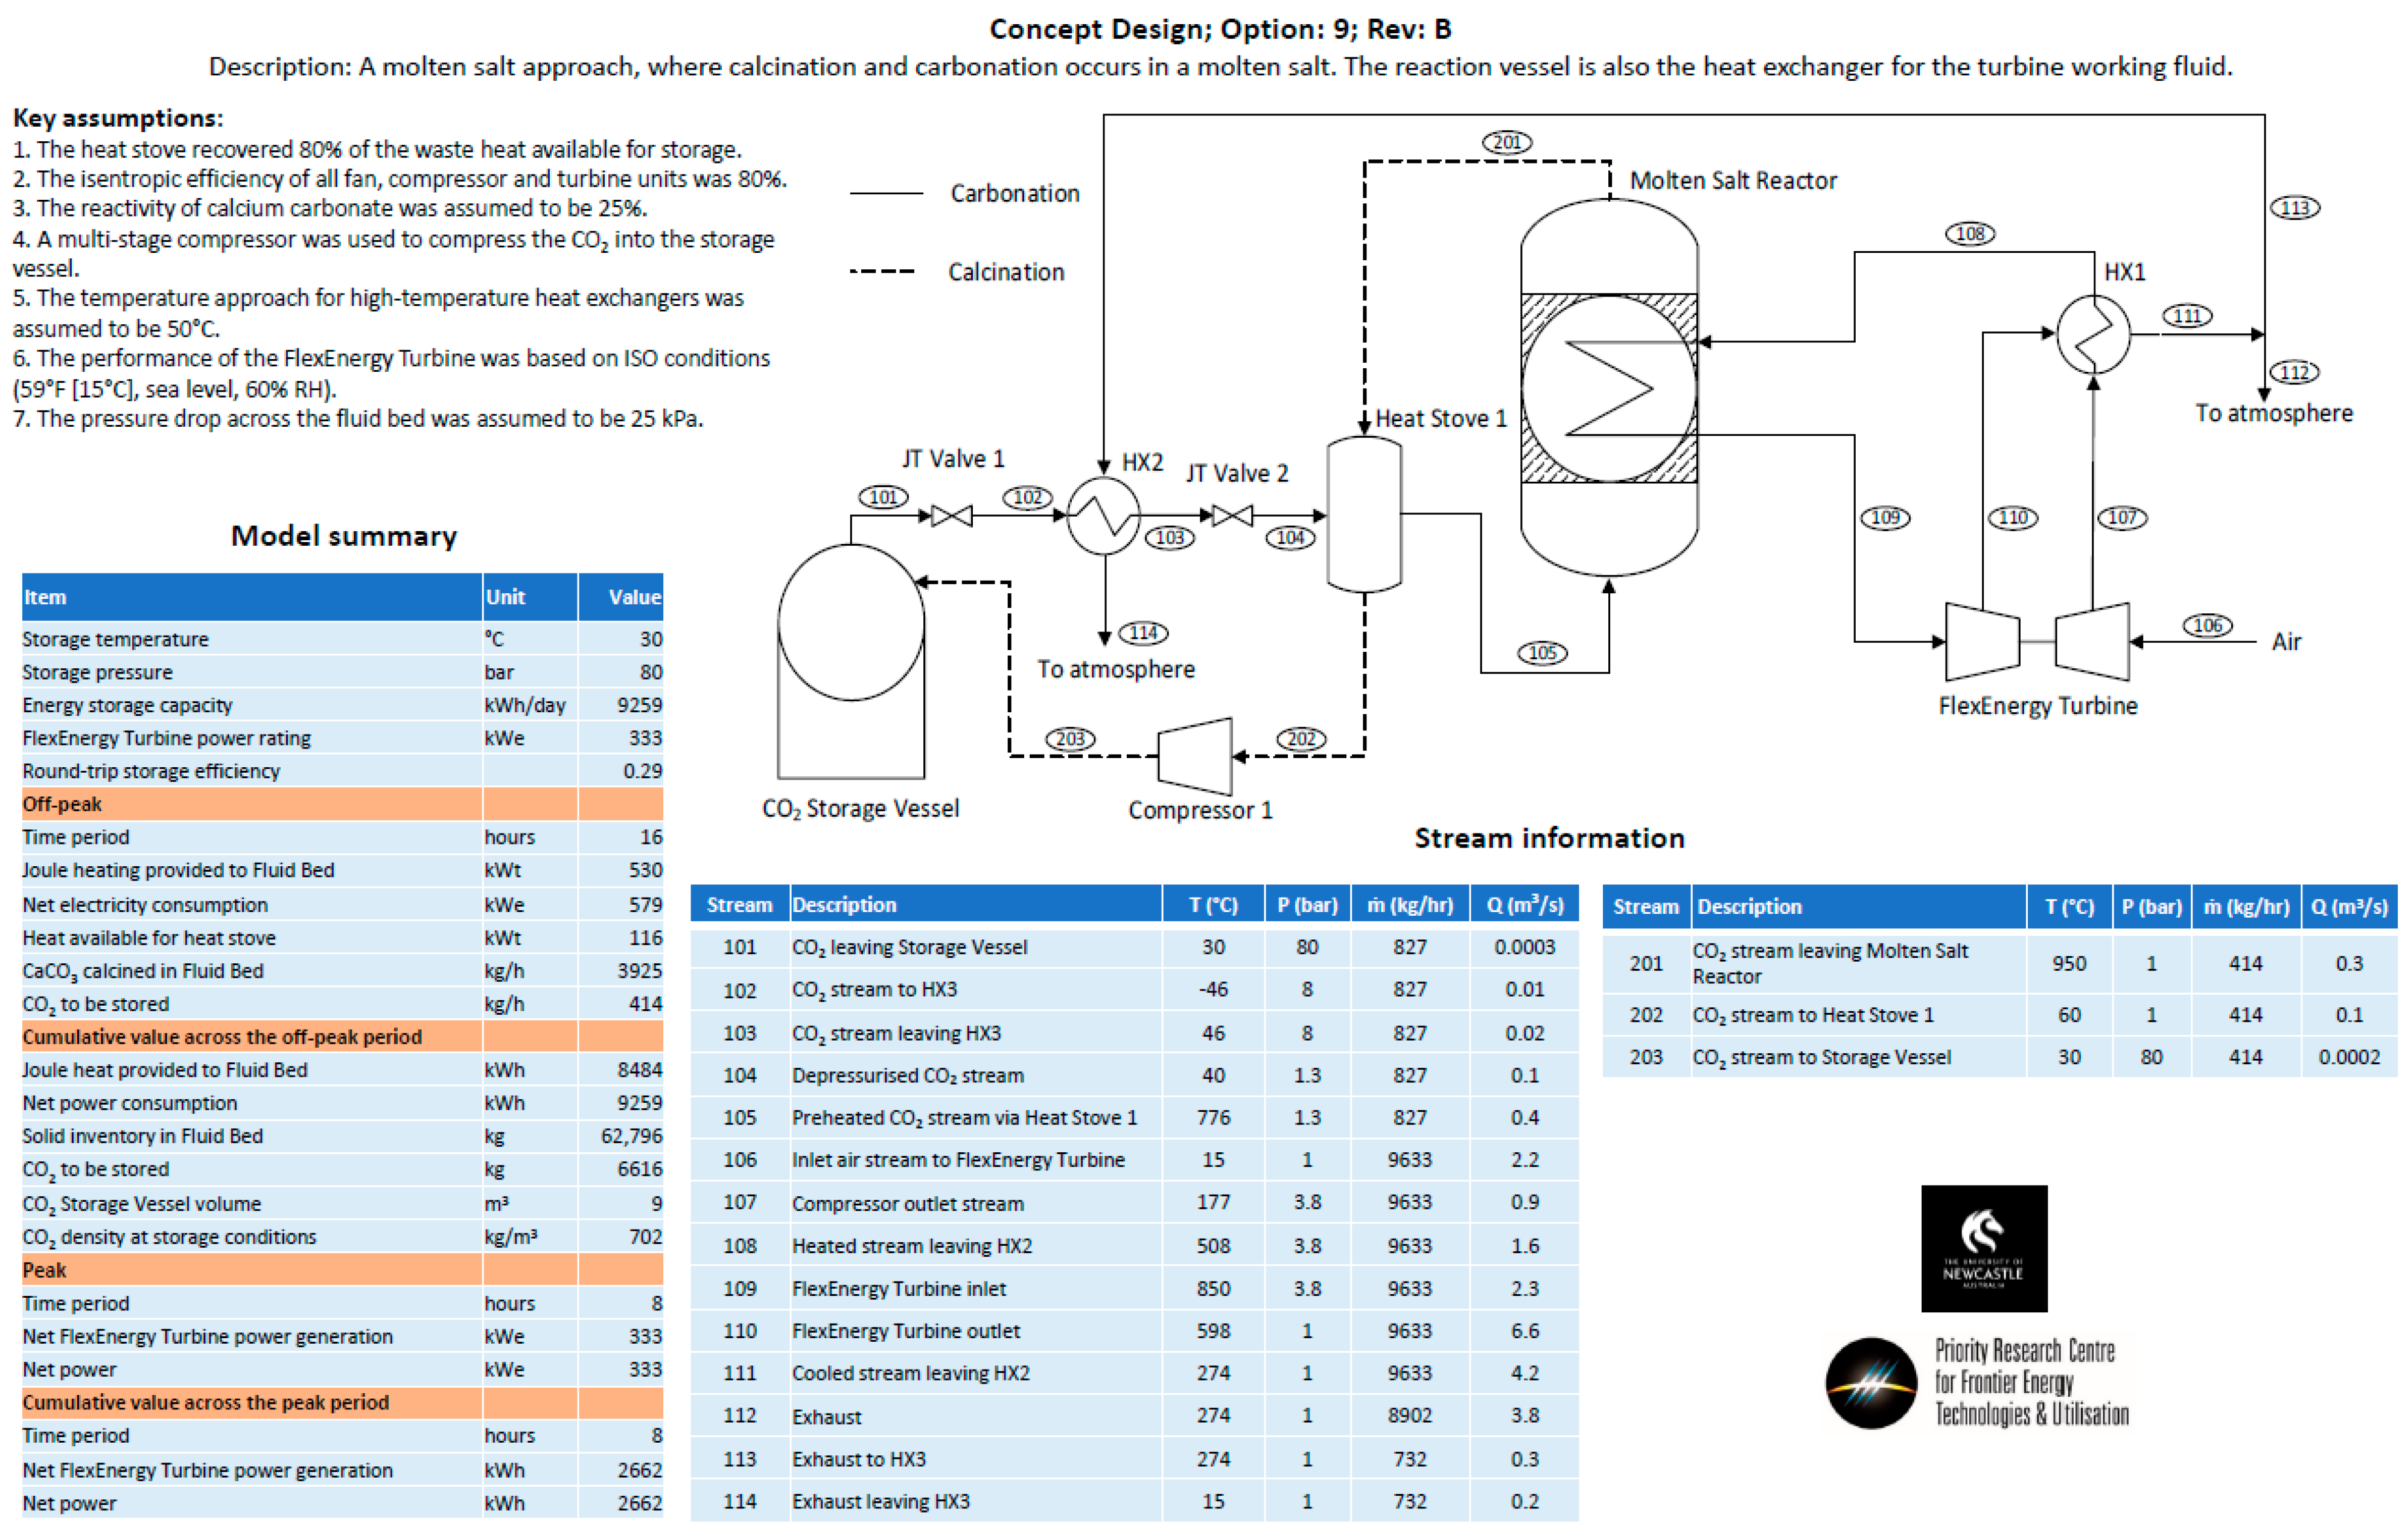
  • Option 9—A molten salt approach, operating on the principle that the carbonate sorbent would be dissolved in a molten salt at up to 25 wt%. It was envisaged that the molten salt/carbonate mixture would be contained on the shell side of a shell-and-tube heat exchanger. During the carbonation phase, carbon dioxide would be bubbled through the shell side, while air would be passed through the tube side to increase the temperature of the air, and then passed directly through a turbine for power production. During the calcination phase, the shell-and-tube heat exchanger would be electrically heated, and CO2 released and passed through a heat stove before being compressed for storage in the CO2 storage vessel.

2.4. Process Modelling

Process configurations were developed and modelled in DWSIM. A total of nine process configuration options were devised for the PRC2 process and are detailed in Section 2.3. The input parameters and assumptions required to complete the modelling were informed by the experimental work described in Section 2.2. For all nine process configurations modelled, a 333 kWe FlexEnergy turbine was used for electricity generation during the carbonation cycle. For all configurations, the carbonation and calcination temperatures were set at 850 °C and 950 °C, respectively, and where necessary, a hydration temperature of 450 °C was used. A nominal carbonation time of eight hours and calcination time of sixteen hours were used for all configurations except for Option 8, in which carbonation and calcination were performed for eight hours each and hydration and dehydration were performed for four hours each. Further details of the key assumptions used in the process modelling are presented in Table 3.
From the data obtained from DWSIM simulations, the following process efficiency metrics were determined for all nine investigated options:
N e t   p o w e r   p r o d .   d u r i n g   p e a k = T o t a l   p o w e r   g e n e r a t e d P a r a s i t i c   l o a d s
N e t   p o w e r   c o n s u m e d   d u r i n g   o f f - p e a k = T o t a l   p o w e r   c o n s u m e d H e a t   r e c o v e r e d
R o u n d - t r i p   s t o r a g e   e f f i c i e n c y = N e t   p o w e r   p r o d u c e d   d u r i n g   p e a k   p e r i o d N e t   p o w e r   c o n s u m e d   d u r i n g   o f f - p e a k   p e r i o d
In addition to DWSIM simulations, fundamental modelling was conducted for the fluid bed and heat-stove unit operations. The fluid bed was modelled based on the inventory size and flowrates calculated from DWSIM simulations to determine reactor size and particle fluid dynamics. All fluid bed modelling was conducted based on the methods of Kunii and Levenspiel [8]. Modelling of the heat-stove unit operations was performed to determine if the concept could be practically implemented. All heat-stove modelling was conducted in MATLAB R2019.

2.5. Techno-Economic Analysis

Capital costs for each option were calculated based on the methodology outlined by Towler and Sinnott [9]. The total fixed capital cost for each unit operation was then calculated by multiplying the capital cost by installation factors for piping, equipment erection, electrical work, instrumentation and process control, civil engineering work, structures, and insulation and coatings. Changes from default installation factors were based on the experience of the research team. Capital costs were converted to a 2022 Australian dollar value using the Chemical Engineering Plant Cost Index and an exchange rate of USD 1 = AUD 1.31. The input data for unit operation sizing was derived from the modelling and simulations detailed in previous section. A summary of the key assumptions for estimating the capital cost of each unit operation is provided in Appendix B.
The levelized cost of storage was calculated using the method outlined by Julch [10], with the exception that there was no capital reinvestment and no residual value of the plant at the end of the project. A project life of 25 years was used for the calculation. An inflation rate of 3% per year was used, increasing the operating costs and the electricity costs. The levelized cost of storage calculation is shown in Equation (7):
L C O S = C A P E X +   t = 1 t = n A t ( 1 + i ) t t = 1 t = n W o u t ( 1 + i ) t
where CAPEX is the total fixed capital cost, At is the sum of the operation expenditure in year t and the electricity costs during the off-peak period, Wout is the annual energy output of the plant and i is the interest rate, assumed to be 10% for this assessment.

3. Results and Discussion

3.1. Experimental

Initial HP-TGA experiments were conducted to determine the temperature at which calcination would occur in a CO2 atmosphere. The theoretical equilibrium temperature for CaCO3 decomposition under 100% CO2 is 895 °C; however, it has been reported that, experimentally, the onset of CaCO3 decomposition is delayed up to 925 °C [11]. The experiments performed, as detailed in Table 1, were consistent with a previous study by Valverde et al. [11], which found calcination occurred at temperatures of 950 °C and above, but not at 900 °C. Only calcination temperatures up to 1000 °C were examined, as above this temperature, particle sintering and deactivation has been reported by González et al. [12], reducing particle cyclability to almost nonexistent levels. A series of multicycle calcination–carbonation experiments were performed. Figure 4 presents the mass change of CaCO3 with time over 30 calcination and carbonation cycles for experiment 4 (cf. Table 1). CaCO3 has a molecular weight of 100 g/mol and CaO of 56 g/mol; hence, full calcination was assumed to have occurred after every cycle, as the sample mass consistently reached 56%. The rate of calcination was relatively rapid, as evidenced by the steep gradient in sample mass reduction for each calcination cycle shown in Figure 4. Conversely, the carbonation reaction occurred in two clear stages; the first stage was very rapid and represented carbonation on the surface of the CaO particles, as described by Bhatia and Perlmutter [13]. The second stage was significantly slower and plateaued over time, as shown in Figure 4, and was attributed to a slower regime controlled by diffusion of CO2 through the product CaCO3 layer, as also described by Bhatia and Perlmutter [13].
Over the first 10 cycles, the conversion of CaO to CaCO3 continually decreased, before reaching a plateau for the remainder of the cycles. This was consistent with studies completed by Abanades and Alvarez [14], as well as Sun et al. [15]; specifically, the primary drop in CaCO3 conversion efficiency occurs over the first 10–20 cycles, after which it remains relatively constant up to 100 cycles. Using Equation (1), the conversion efficiency for every experiment with CaCO3 was calculated. Figure 5 presents the effect of calcination temperature on the conversion efficiency as a function of the number of calcination–carbonation cycles. At both calcination temperatures, as the number of cycles increased, the conversion efficiency decreased, with both reaching plateaus, after approximately 20 cycles, of 8% and 6%, at 950 °C and 1000 °C, respectively. For the higher calcination temperature of 1000 °C, the decline in conversion occurred sooner, with a conversion efficiency of 18% reached after three cycles, while at a calcination temperature of 950 °C it took eight cycles to reach 18%. The significant reduction in the conversion efficiency was attributed to a decrease in the reactive surface area of the particles due to sintering during calcination. Sintering causes changes in the pore structure of CaO and has a more pronounced effect at higher temperatures. According to Lyskiov et al. [16], the initial decomposition of CaCO3 produces highly dispersed CaO which re-carbonates incompletely. Subsequently, CaO grains grow and form an interconnected CaO structure. However, due to diffusion limitations, only the outer layer is accessible; hence, carbonation on the outer layer results in an asymptotic CO2 conversion efficiency after several cycles [17].
Under 100% CO2, a calcination temperature of 950 °C or higher was required to completely decompose CaCO3. As shown in Figure 5, a higher calcination temperature resulted in lower conversion efficiency, which was attributed to particles sintering, i.e., pore closure, at high temperatures [18]. To reduce the calcination temperature and improve the conversion efficiency, a change to the CO2 partial pressure was necessary. To achieve this, experiments 5–7 (refer to Table 1) were performed, in which the multicycle conversion of CaCO3 was investigated for different gas mixtures of CO2 and air. The CO2 conversion efficiencies of CaCO3 at 25%, 50%, and 100% CO2 by volume balanced with air are compared in Figure 6. For the 25%, 50%, and 100% experiments, calcination was performed at 850 °C, 900 °C, and 950 °C, respectively. Over the first five cycles, the rate of decay in conversion efficiency was slower for 25% CO2, while 50% CO2 followed the same trend as the 100% CO2 experiment. However, after 15 cycles, the conversion efficiencies of samples treated under 25% and 50% CO2 converged to the same value of 16%, compared to a conversion efficiency of 8% for the 100% CO2 experiment. Although reducing the calcination temperature improved the conversion efficiency, resulting in a smaller fluidized bed, any cost reductions were offset by the increased gas storage requirements. Consequently, gas mixtures were not considered further for any process options. In addition to varying the CO2 concentration, the partial pressure of CO2 in the system can be also changed by varying the pressure in the system. It has been reported by Chacartegui et al. [19] that the overall process-efficiency of calcium looping processes can be improved by 3–5% by using a pressure-swing approach. Figure 6 also presents the results of pressure-swing experiments where the calcination and carbonation temperatures were fixed at 950 °C and the pressure in the system was alternated between 1.2 bar (during calcination) and 4 bar (during carbonation). Under pressure-swing conditions, no improvement in conversion efficiency was observed in comparison to the temperature swing experiments.
In addition to CaCO3, another carbonate material, dolomite (CaMg(CO3)2), was investigated for its CO2 capture properties over multiple calcination–carbonation cycles. Using Equation (2), the conversion efficiency for each experiment with dolomite was calculated. Figure 7 presents the effect of calcination temperature on the conversion efficiency of dolomite as a function of the number of calcination–carbonation cycles for three CO2 concentrations; 25%, 50%, and 100%. For the 25%, 50%, and 100% experiments, calcination was performed at 850 °C, 900 °C, and 950 °C, respectively. After two cycles, the conversion efficiency dropped to 5% for all CO2 concentrations examined. After 20 cycles, the conversion efficiency began to stabilize at approximately 3% for 25% and 50% CO2 and 2% for a 100% CO2 atmosphere. The results for dolomite were significantly worse than those for limestone, and hence, limestone was concluded to be the superior carbonate material for the PRC2 process.
A final means used to improve the conversion efficiency of limestone over multiple cycles was to introduce an intermediate CaO hydration step to produce hydrated lime (Ca(OH)2). According to the literature, hydration of CaO leads to an increase in the surface area and the molar volume due to the formation of Ca(OH)2. During the hydration process, steam penetrates to the core of CaO and reacts to form Ca(OH)2. The drawback of the hydration process is that it can potentially decrease the mechanical strength of the CaCO3 sample by promoting particle attrition [20]. Manovic and Anthony [21] reported that higher CO2 conversion during steam injection can be related to the enhancement of CO2 diffusion through the layer of newly formed CaCO3 during the diffusion-controlled stage of the carbonation reaction. In addition, Donat et al. [22] reported higher CO2 conversion efficiency for natural limestone after 30 carbonation–calcination cycles in the presence of steam. The authors linked the results to a shift in pore size distribution towards larger pores, which are less prone to blockage during carbonation and enhance the rate of CO2 diffusion through the layer of CaCO3 during carbonation. Two hydration experiments were performed, as detailed in Table 1, for experiments 13 and 14. For experiment 13, the calcination, hydration, and carbonation temperatures were set at 950 °C, 450 °C, and 850 °C, respectively. A gas atmosphere of 100% CO2 was used for calcination and carbonation and 90% steam and 10% N2 was used for the hydration step. The cooling and heating intervals between calcination, hydration, and carbonation were all performed under 100% N2.
Figure 8 shows the mass change obtained for experiment 13, in which the hydration step was conducted using 90% steam and 10% N2 at 450 °C. The mass observed at the completion of each hydration step was 74%, which is consistent with the molecular weight of Ca(OH)2, which is 74 g/mol. For the subsequent carbonation step, the sample mass increased with each successive cycle to 87%, 89%, 96%, 96%, and 97%. The addition of the hydration step clearly improved the CaCO3 conversion efficiency, however, for experiment 13, cooling, heating, and hydration were conducted by means of the injection of nitrogen. In a practical PRC2 process configuration, this is unlikely to occur; rather, 100% CO2 would be utilized. Hence, experiment 14 was conducted in which the calcination, hydration, and carbonation temperatures were set at 950 °C, 450 °C, and 850 °C, respectively. A gas atmosphere of 100% CO2 was used for calcination and carbonation, and 90% steam and 10% CO2 was used for the hydration step. The cooling and heating intervals between calcination, hydration, and carbonation were all performed under 100% CO2.
Similarly, Figure 9 shows the mass change obtained for experiment 14, in which the hydration step was conducted using 90% steam and 10% CO2 at 450 °C. Clear differences were observed between experiment 13 and experiment 14, most notably the final mass reached at the end of each carbonation cycle. As shown in Figure 9 by an increase in mass, carbonation occurred during the cooling period in 100% CO2 as the temperature decreased from the calcination temperature of 950 °C to the hydration temperature of 450 °C. Hence, when the steam was introduced, there was little to no formation of Ca(OH)2, as a layer of CaCO3 was already present on the particles. Subsequently the extent of carbonation after the hydration step was minimal.
A comparison of the conversion efficiencies for the two hydration experiments is presented in Figure 10. The use of N2 between the calcination–hydration–carbonation reactions greatly improved the conversion efficiency of CaCO3, with 90% conversion achieved after five cycles. Practically, the implementation of a hydration step that uses inert air for the cooling, hydration, and heating steps may be difficult, and would lead to the loss of carbon dioxide from the process. Make-up carbon dioxide would be required, which could be provided from additional calcium carbonate if part of the bed is periodically replaced. The use of carbon dioxide between the calcination–hydration–carbonation reactions resulted in conversion efficiencies after five cycles comparable to those for calcination and carbonation without the hydration step.
As for particle attrition, the particle size distributions (PSDs) for the samples taken at different time intervals in the particle attrition study are presented in Figure 11, with Figure 11A showing the entirety of the particle size distribution for all the samples, while Figure 11B presents a closer look at the distribution of fine particles. Within the size range of 100–1000 µm, the distribution of particles was relatively similar for all samples, with a slight shift to larger particle sizes apparent for the Week 12 sample. Conversely, Figure 11B shows there was a clear difference below 100 µm. For the fresh CaCO3 sample, there was a spread of particles between 1–100 µm; however, at the end of the first week there are no longer any particles below 50 µm and by the end of the third week there are no particles below ~100 µm.
Table 4 presents a summary of the particle size metrics for the different samples taken over the course of the particle attrition experiment. The calculated specific surface area of the fresh CaCO3 sample was significantly higher than the other samples, which were taken at 1–12 weeks, and the particle Sauter mean diameter, dSauter, was significantly lower for the fresh CaCO3 sample. These differences were attributed to the presence of sub-100 µm particles in the fresh CaCO3 sample, as shown in Figure 11. The reduction in fine particles apparent after 3 weeks of the particle attrition study was attributed to particle sintering.
To confirm the effects of particle sintering, SEM imaging of the fresh CaCO3 and the Week 8 sample was conducted. Figure 12A–E show the SEM images for fresh CaCO3 and the Week 8 sample obtained from the attrition experiment, respectively. The absence of fine particles is noticeable in Figure 12B in comparison to the fresh CaCO3 sample. At 1000× magnification, the fresh CaCO3 particle has noticeably square edges, while the Week 8 sample is rounded and has a smooth appearance, likely caused by a combination of fluidization conditions and sintering. At 10,000× magnification the effect of particle sintering is obvious, with Figure 12E having square edges and fine particles distributed in the surface, while for the Week 8 sample shown in Figure 12F, the surface is smooth, while it is apparent that the fine particles have fused to the core CaCO3 surface during the attrition study and re-crystallized. Future studies may investigate the effect of continual cycling for up to six months on particle attrition to determine if the particle characteristics produced after twelve weeks in this study are similar.

3.2. Process Modelling

To begin with an overview, as noted earlier, process modelling was conducted to obtain key information on the process to inform the techno-economic assessment. All options were modelled on the following key parameters:
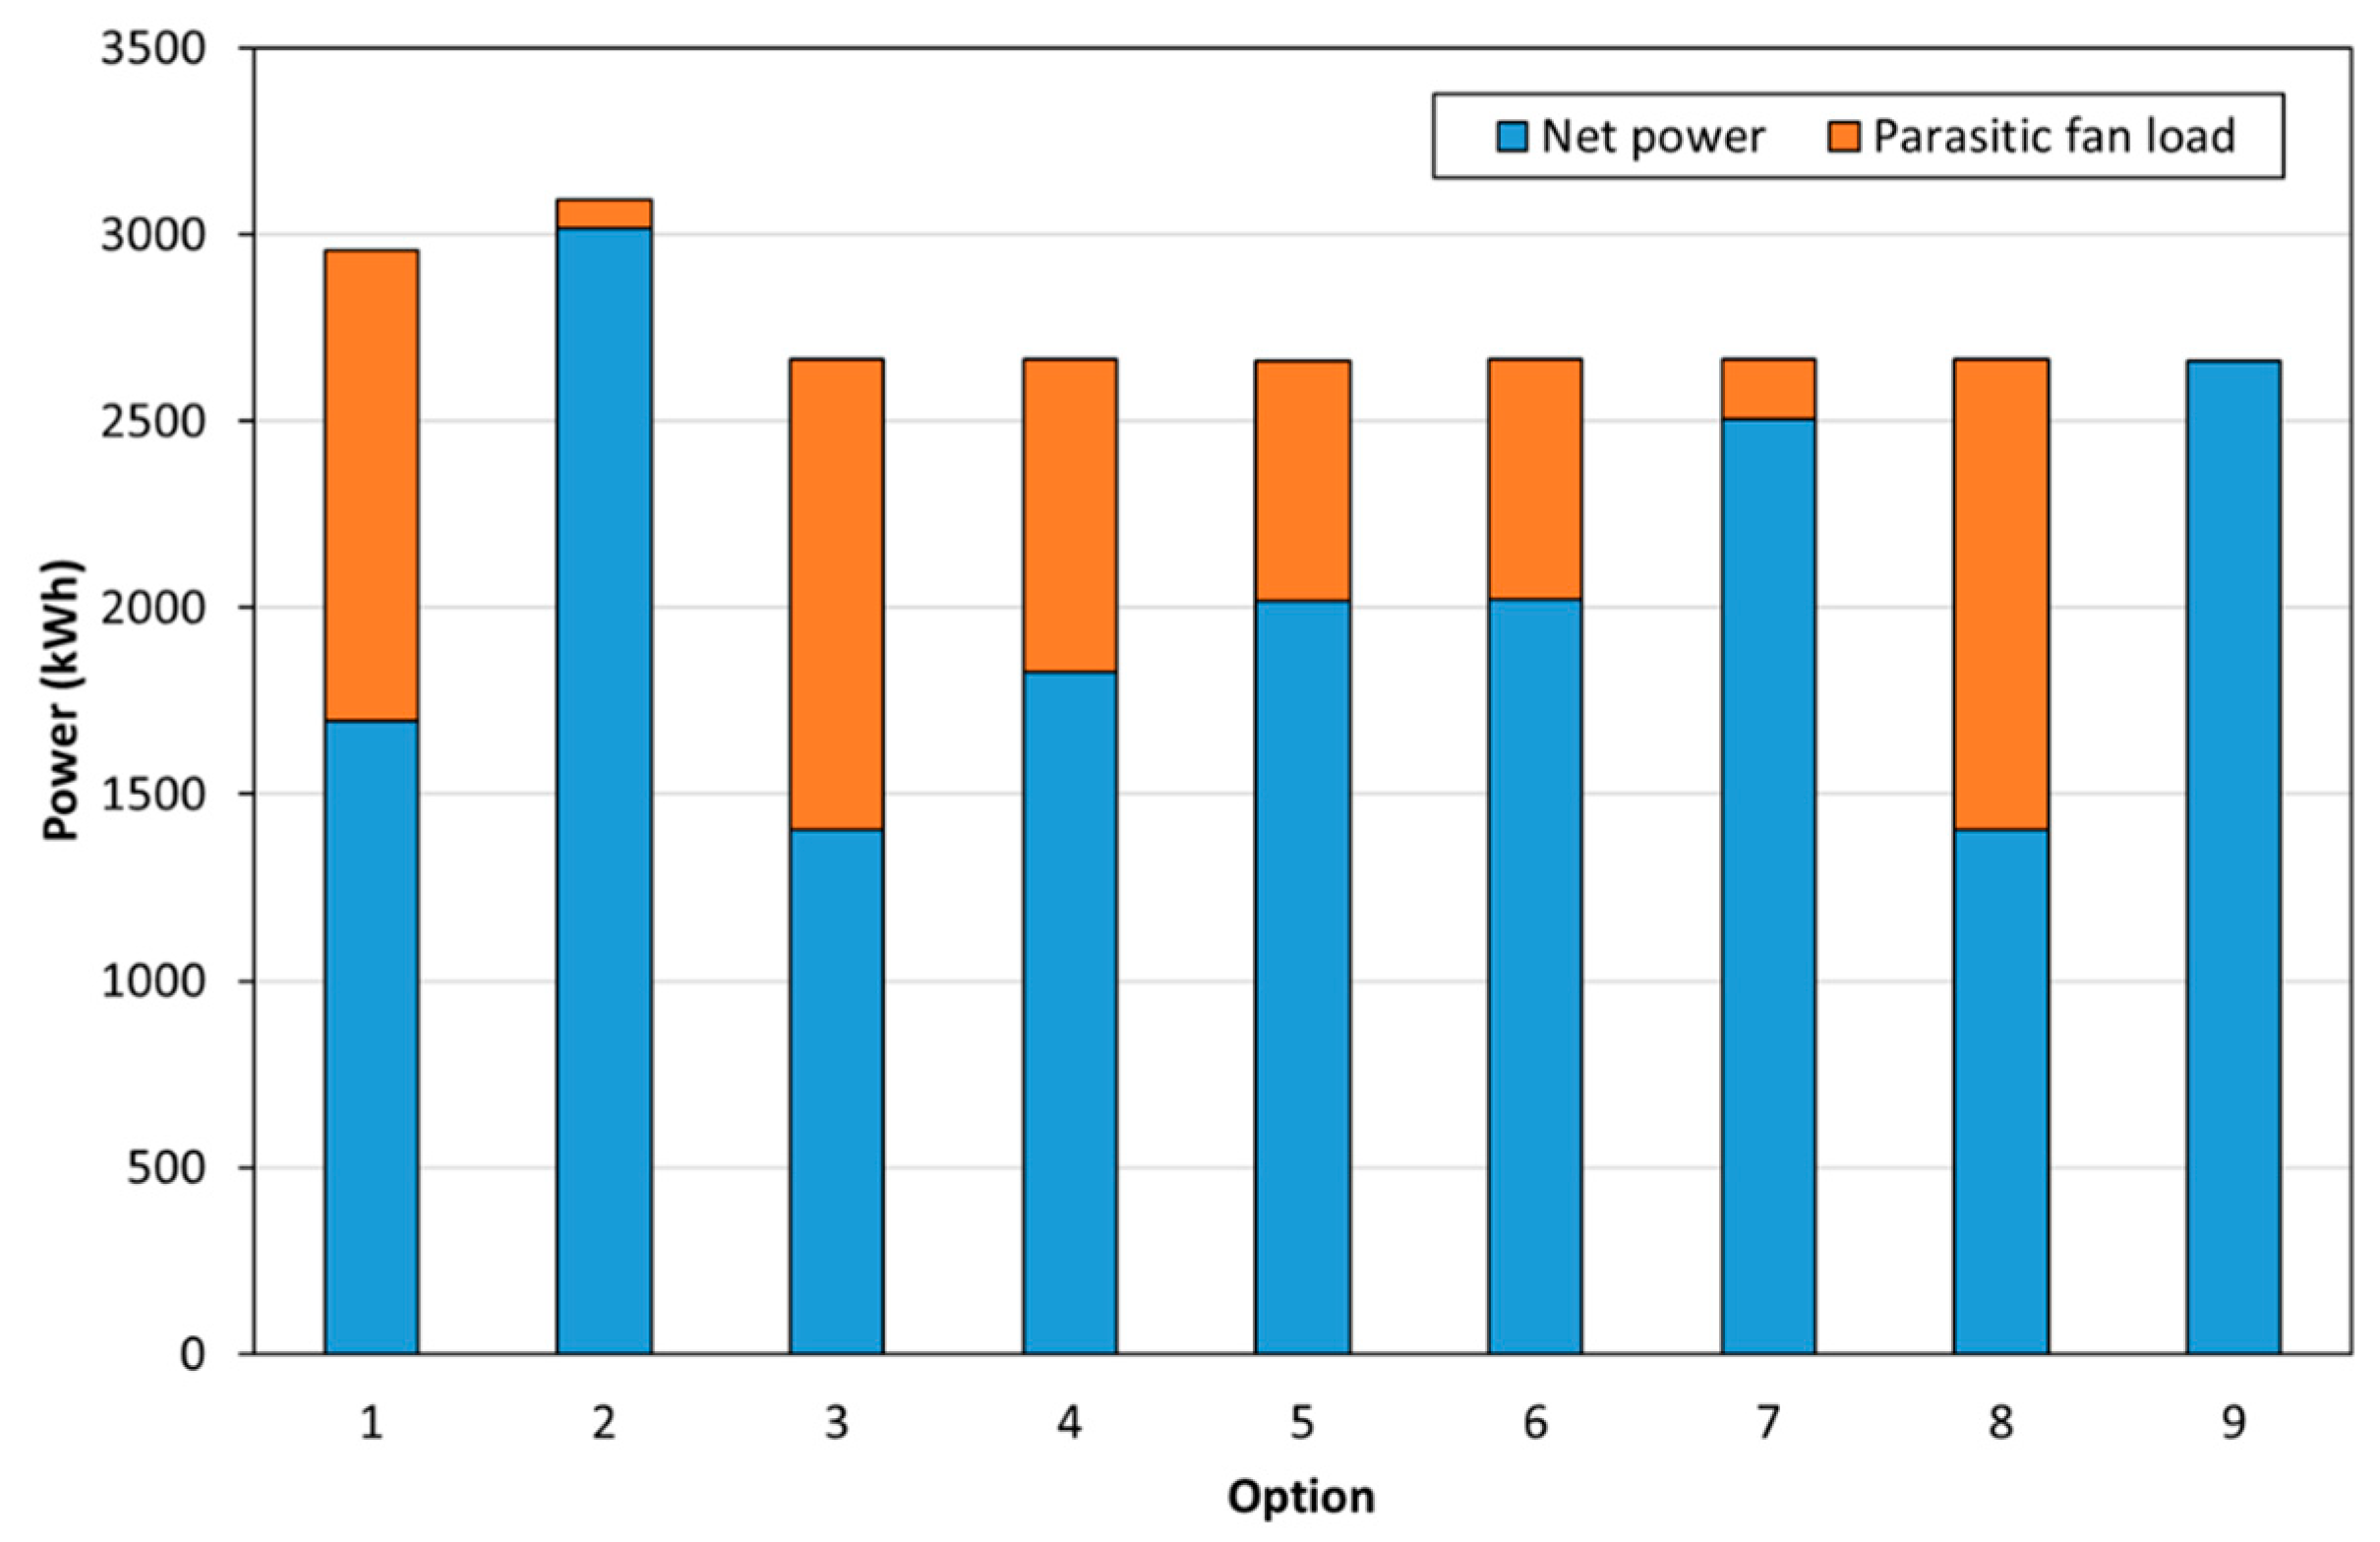
  • The net output of the FlexEnergy turbine in a 1 MWt plant was 333 kW.
  • Carbonation occurred at 850 °C.
  • Calcination occurred at 950 °C.
  • 100% CO2 was used for carbonation.
The key information obtained from the process modelling included the following:
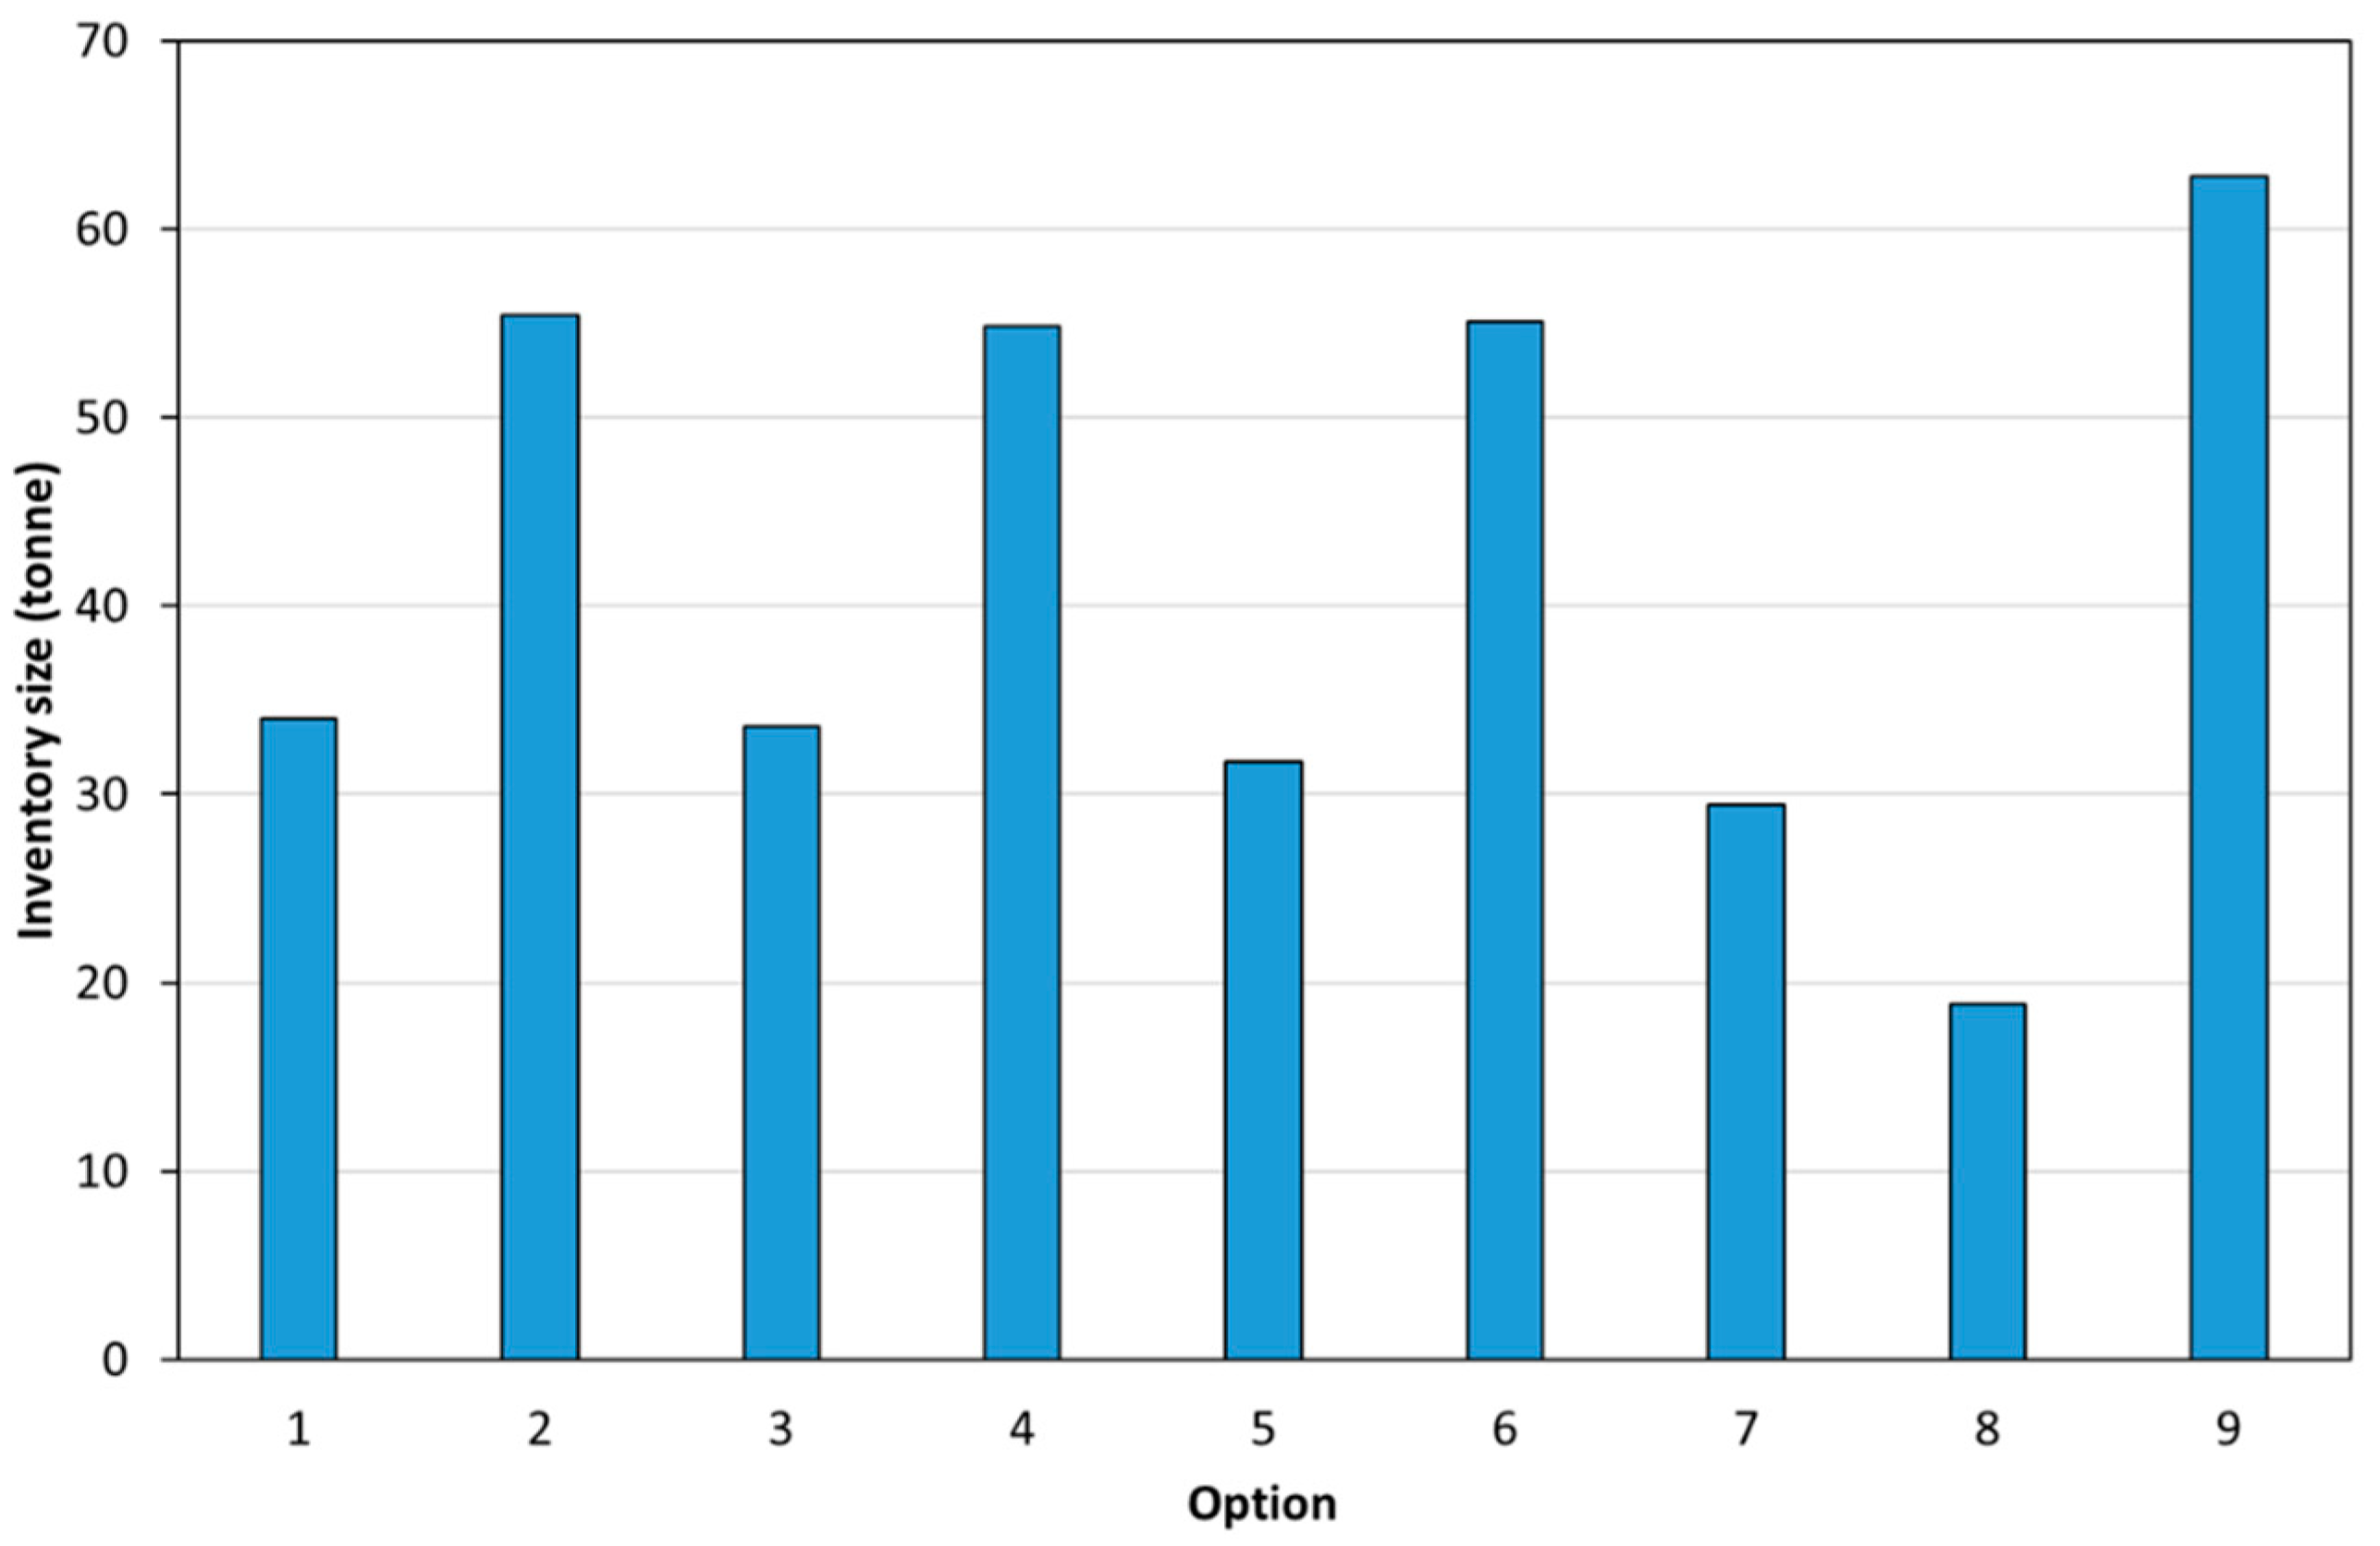
  • Inventory size (i.e., the mass of calcium carbonate required): the inventory size determined the size of the fluid bed.
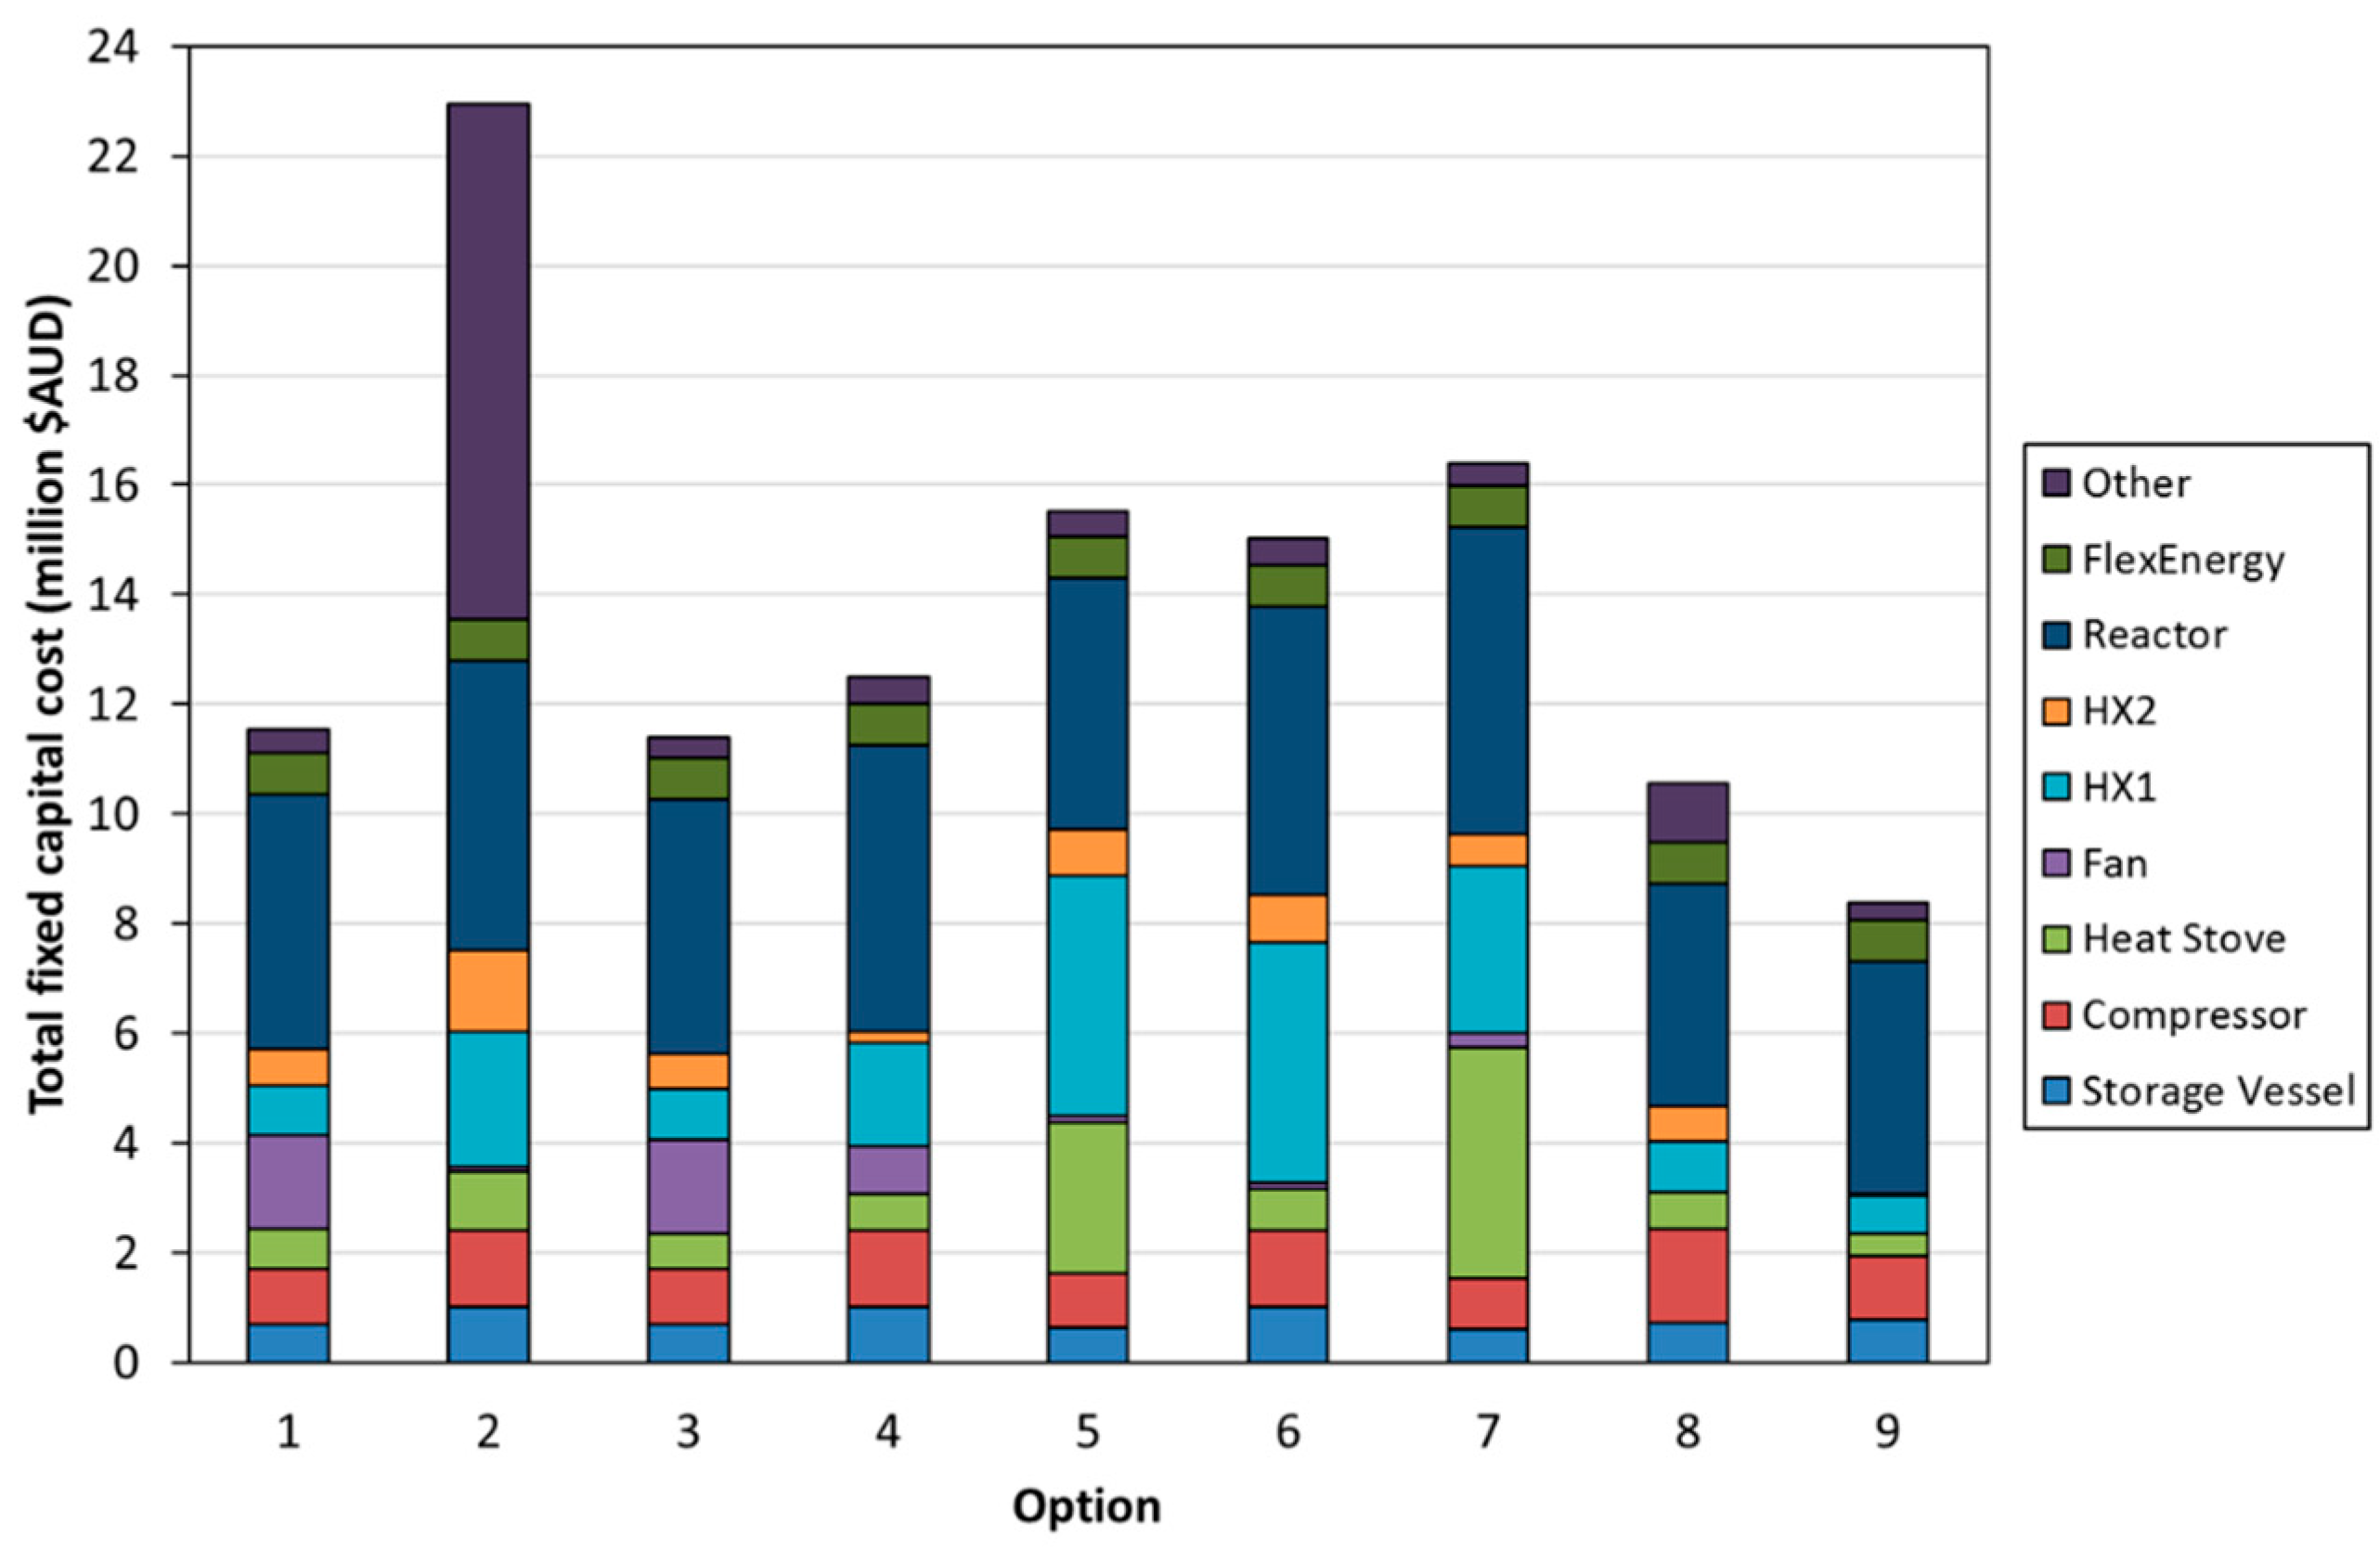
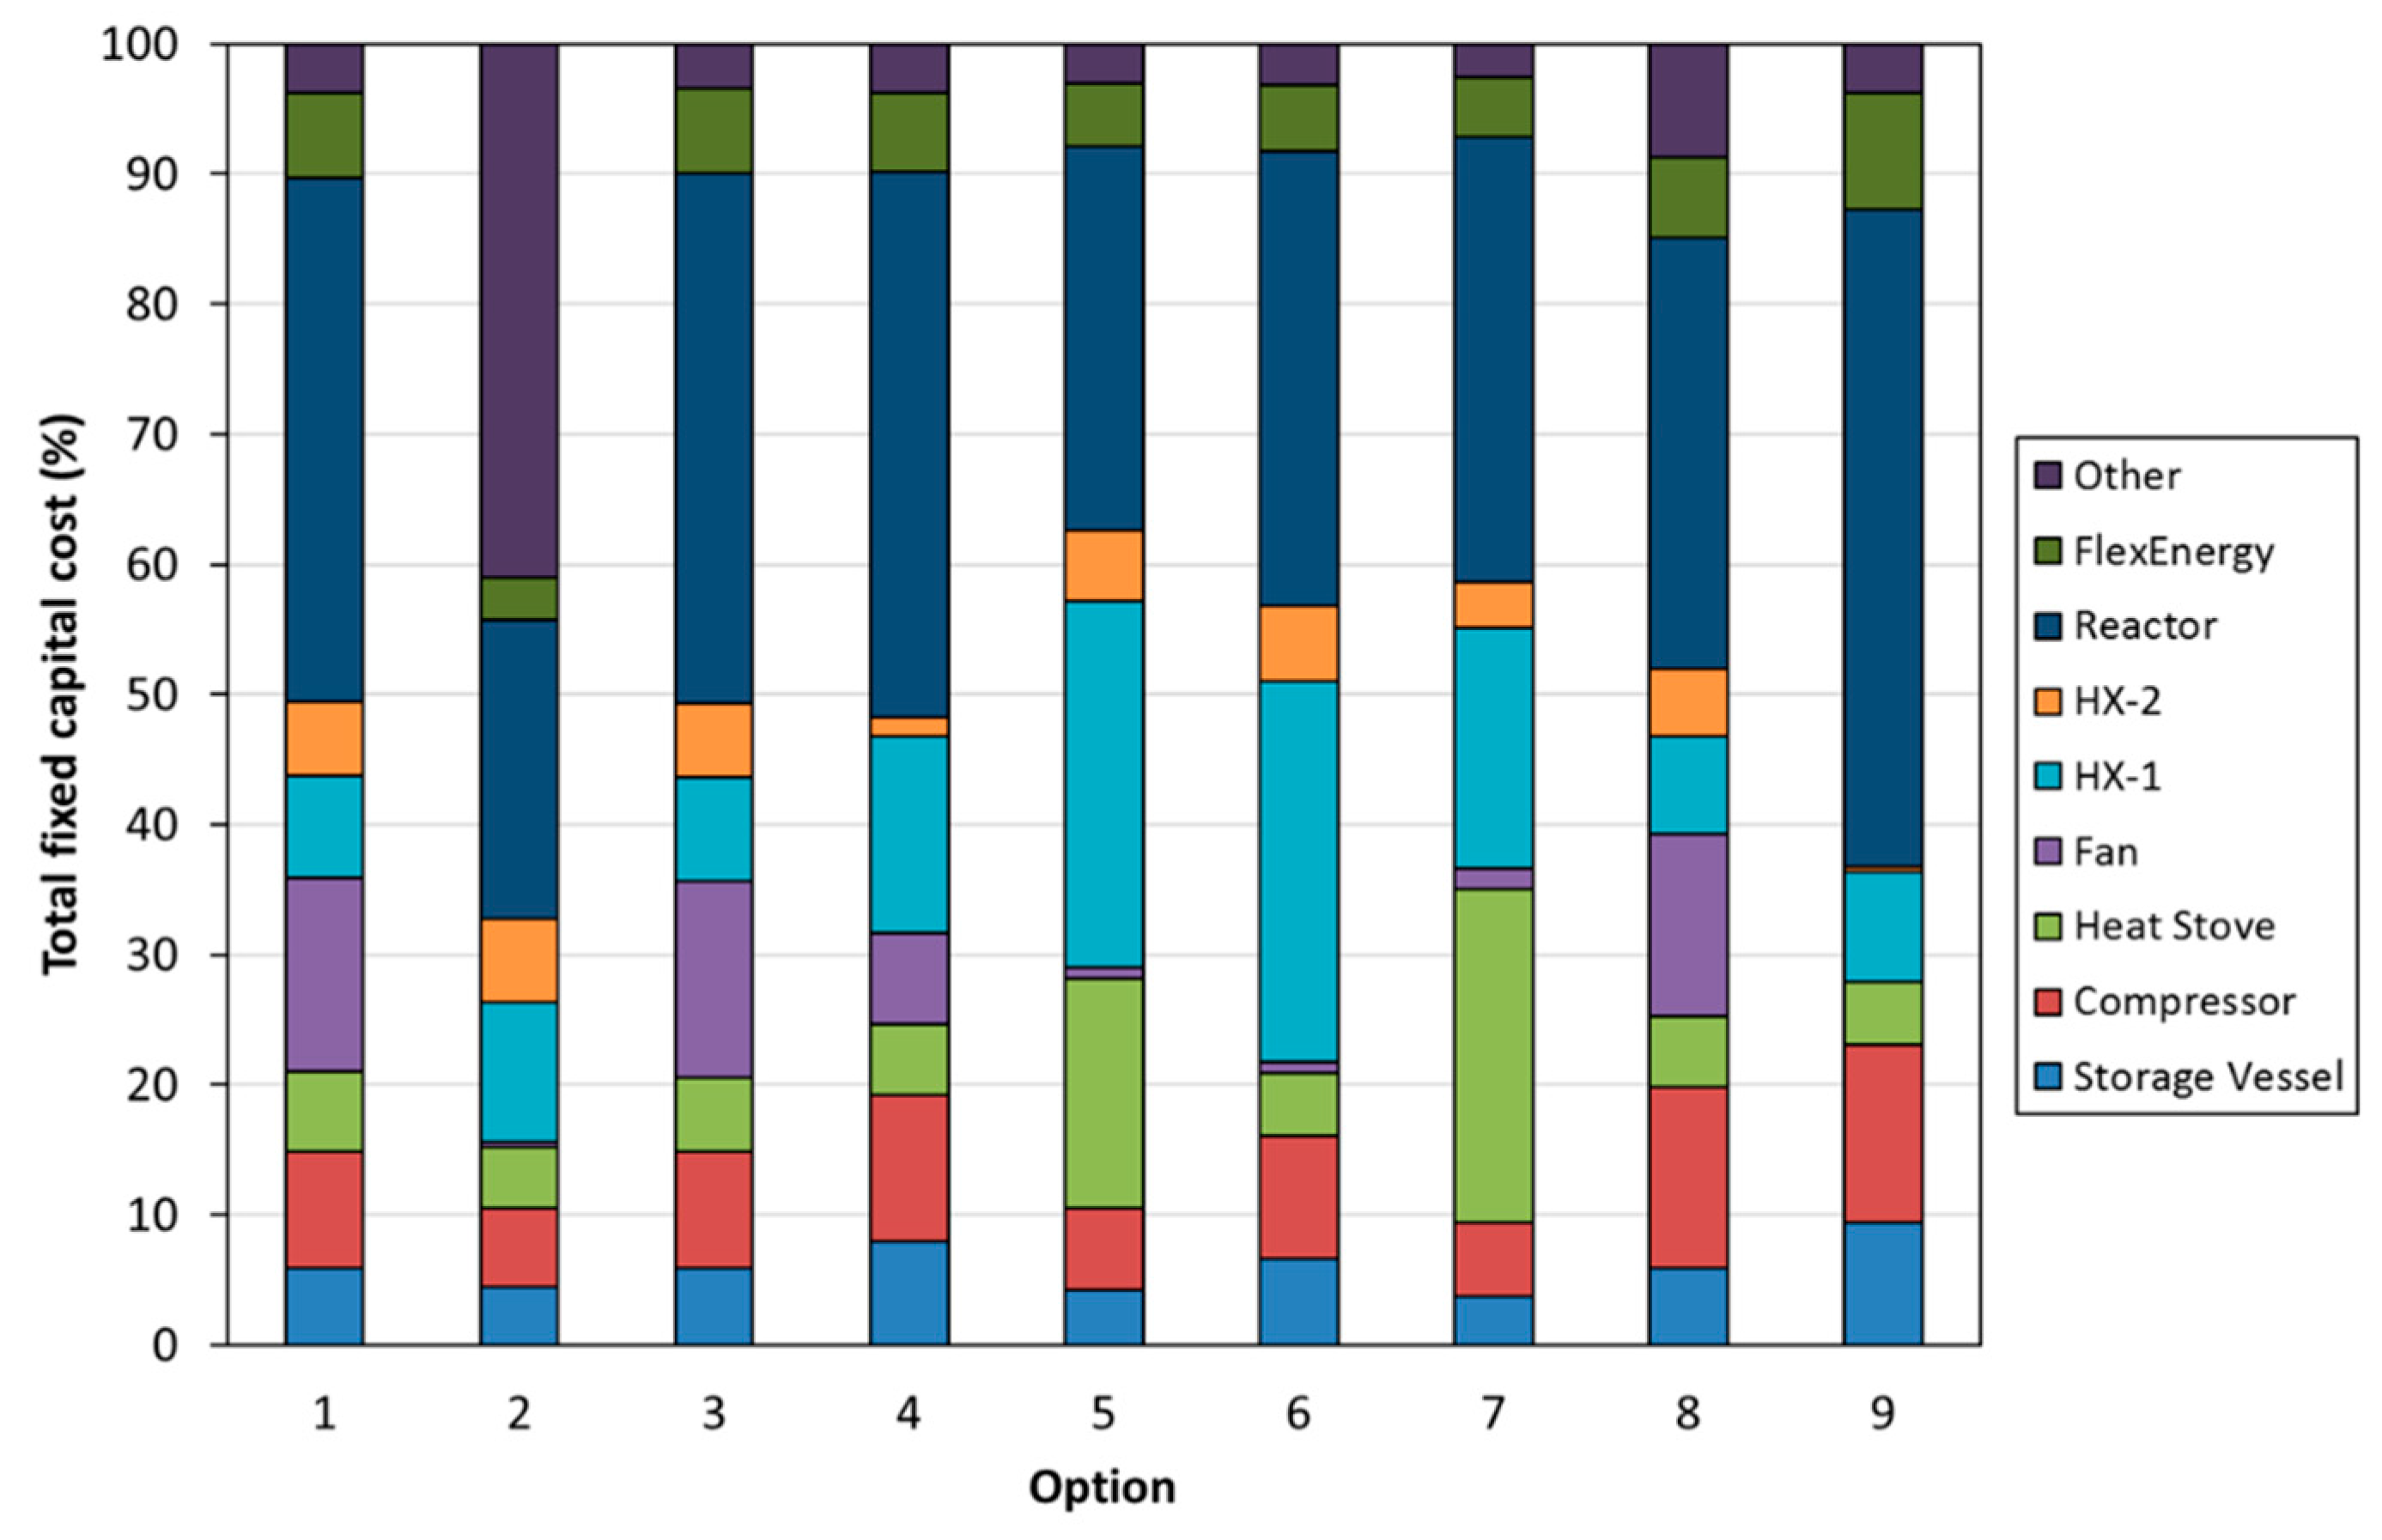
  • Heat duties for the reactor (i.e., fluid bed or molten salt reactor), heat exchangers, and heat stoves.
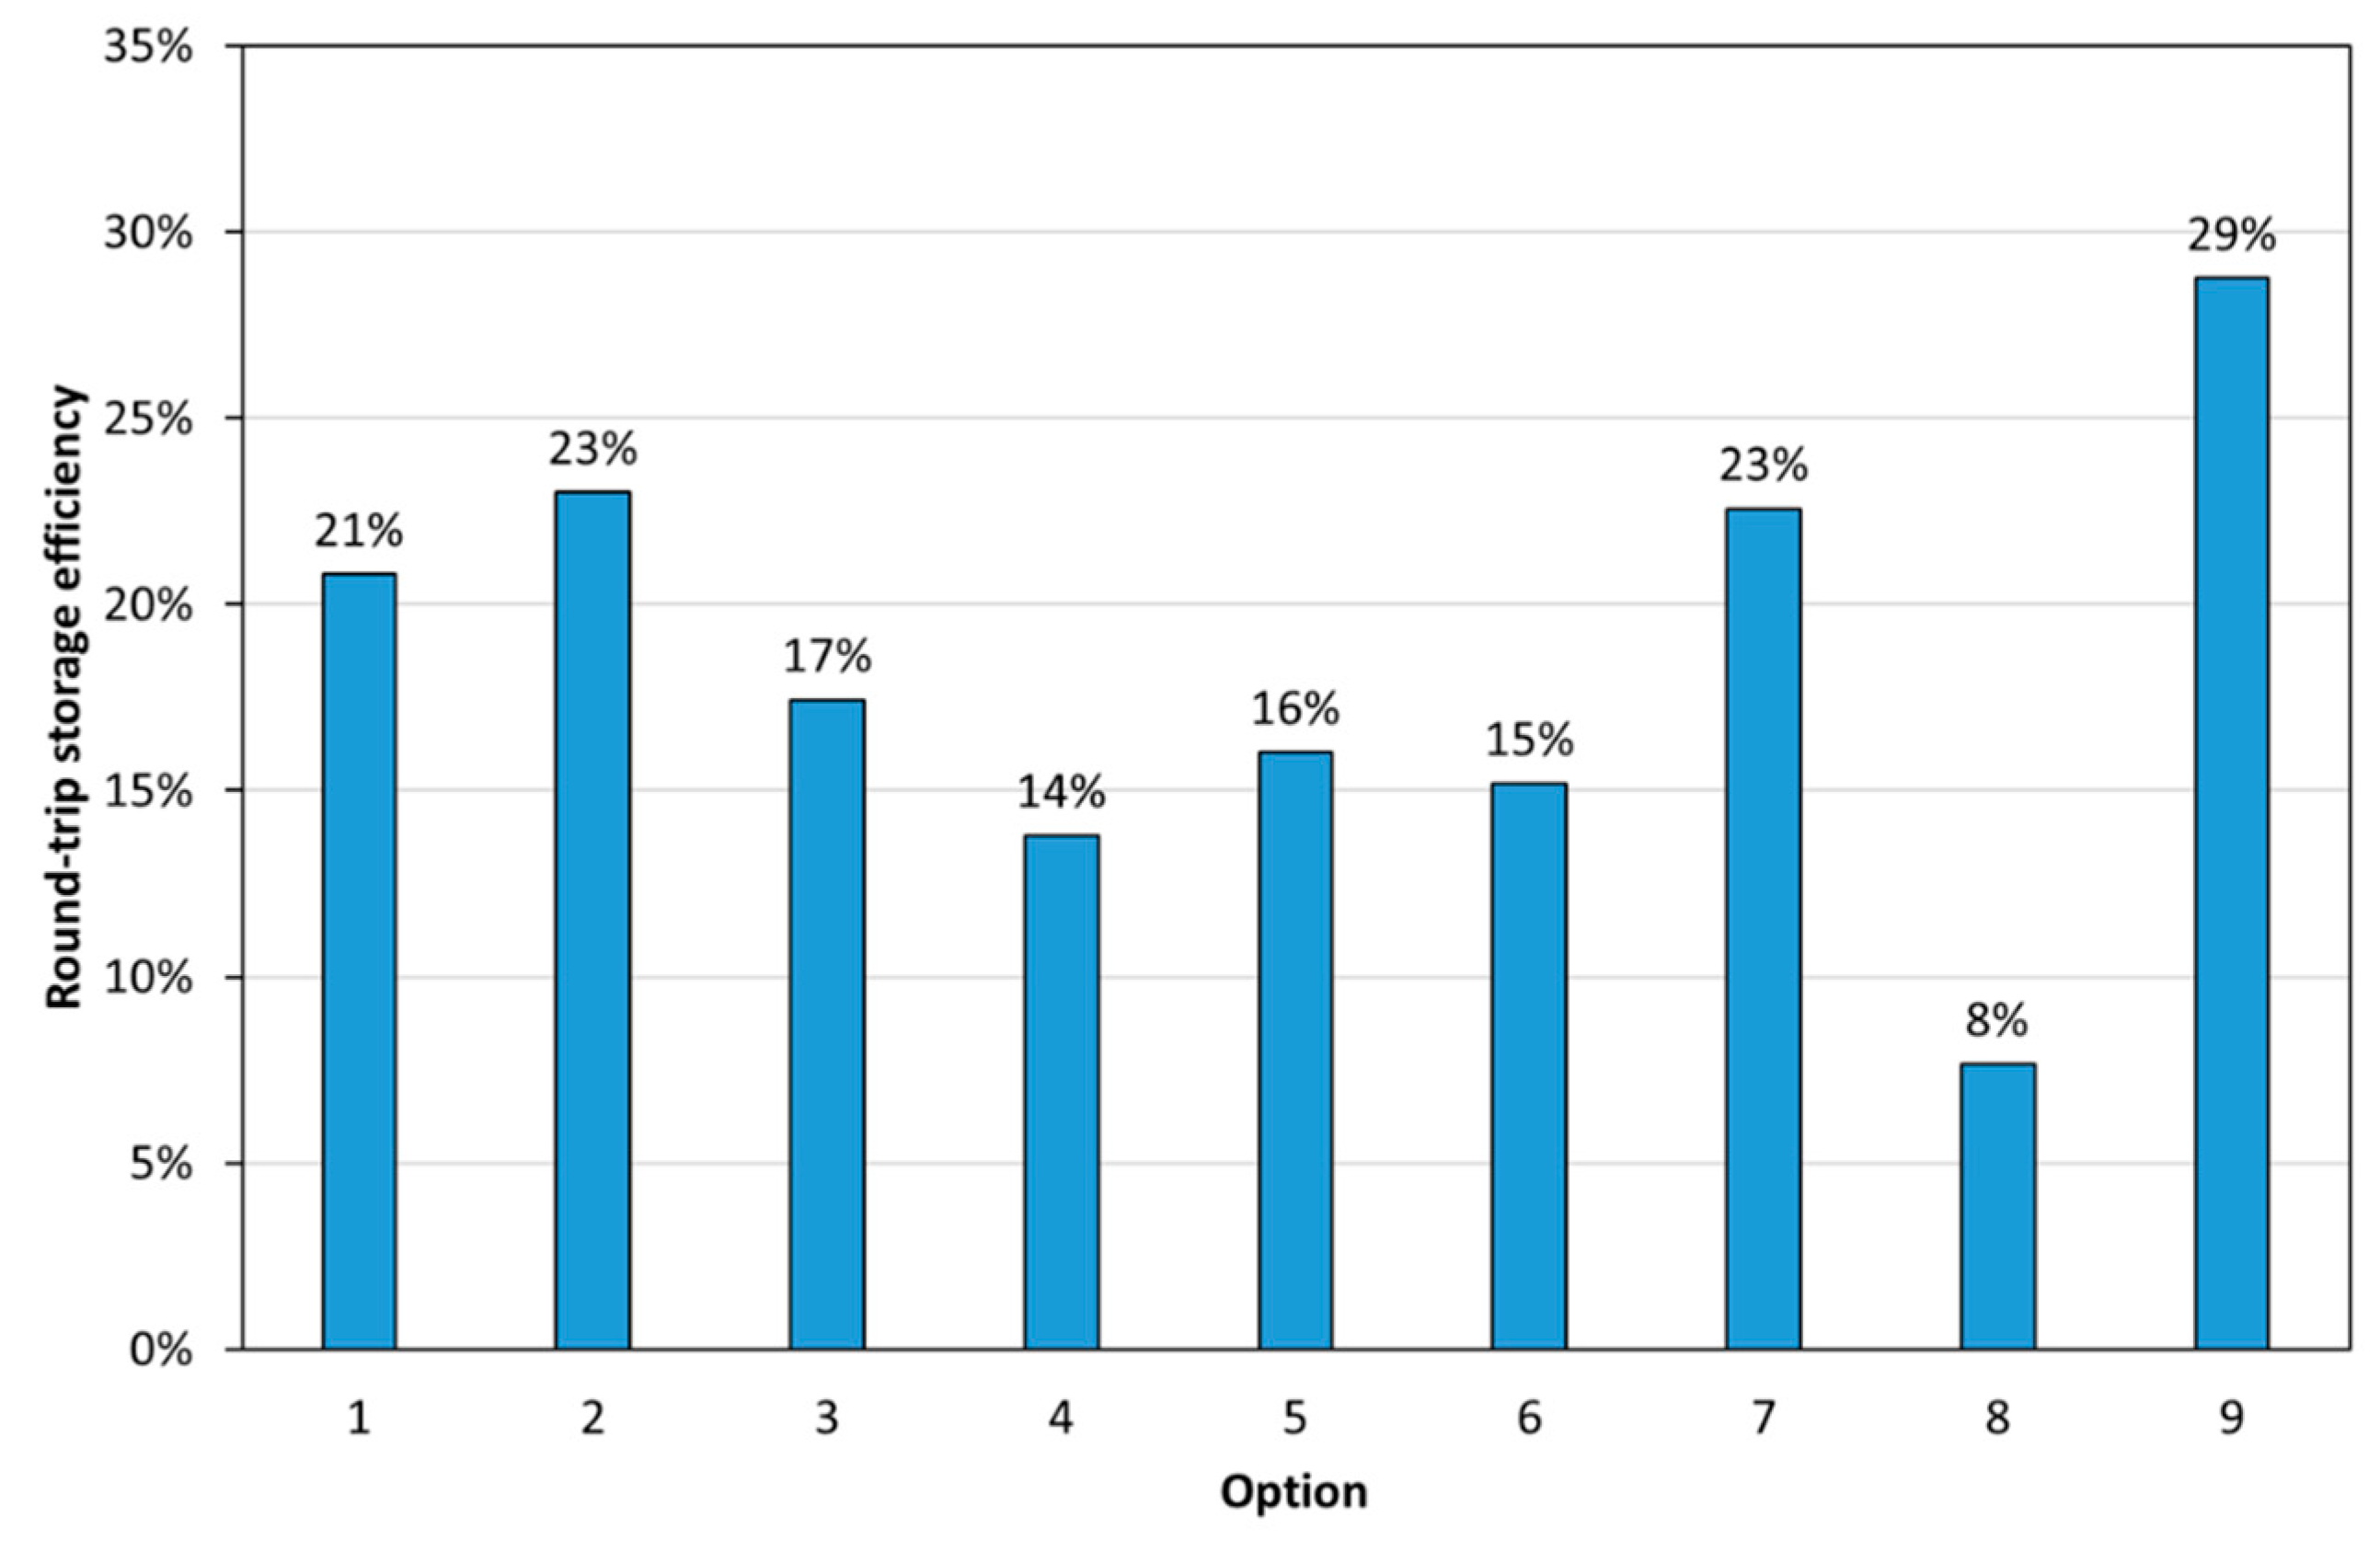
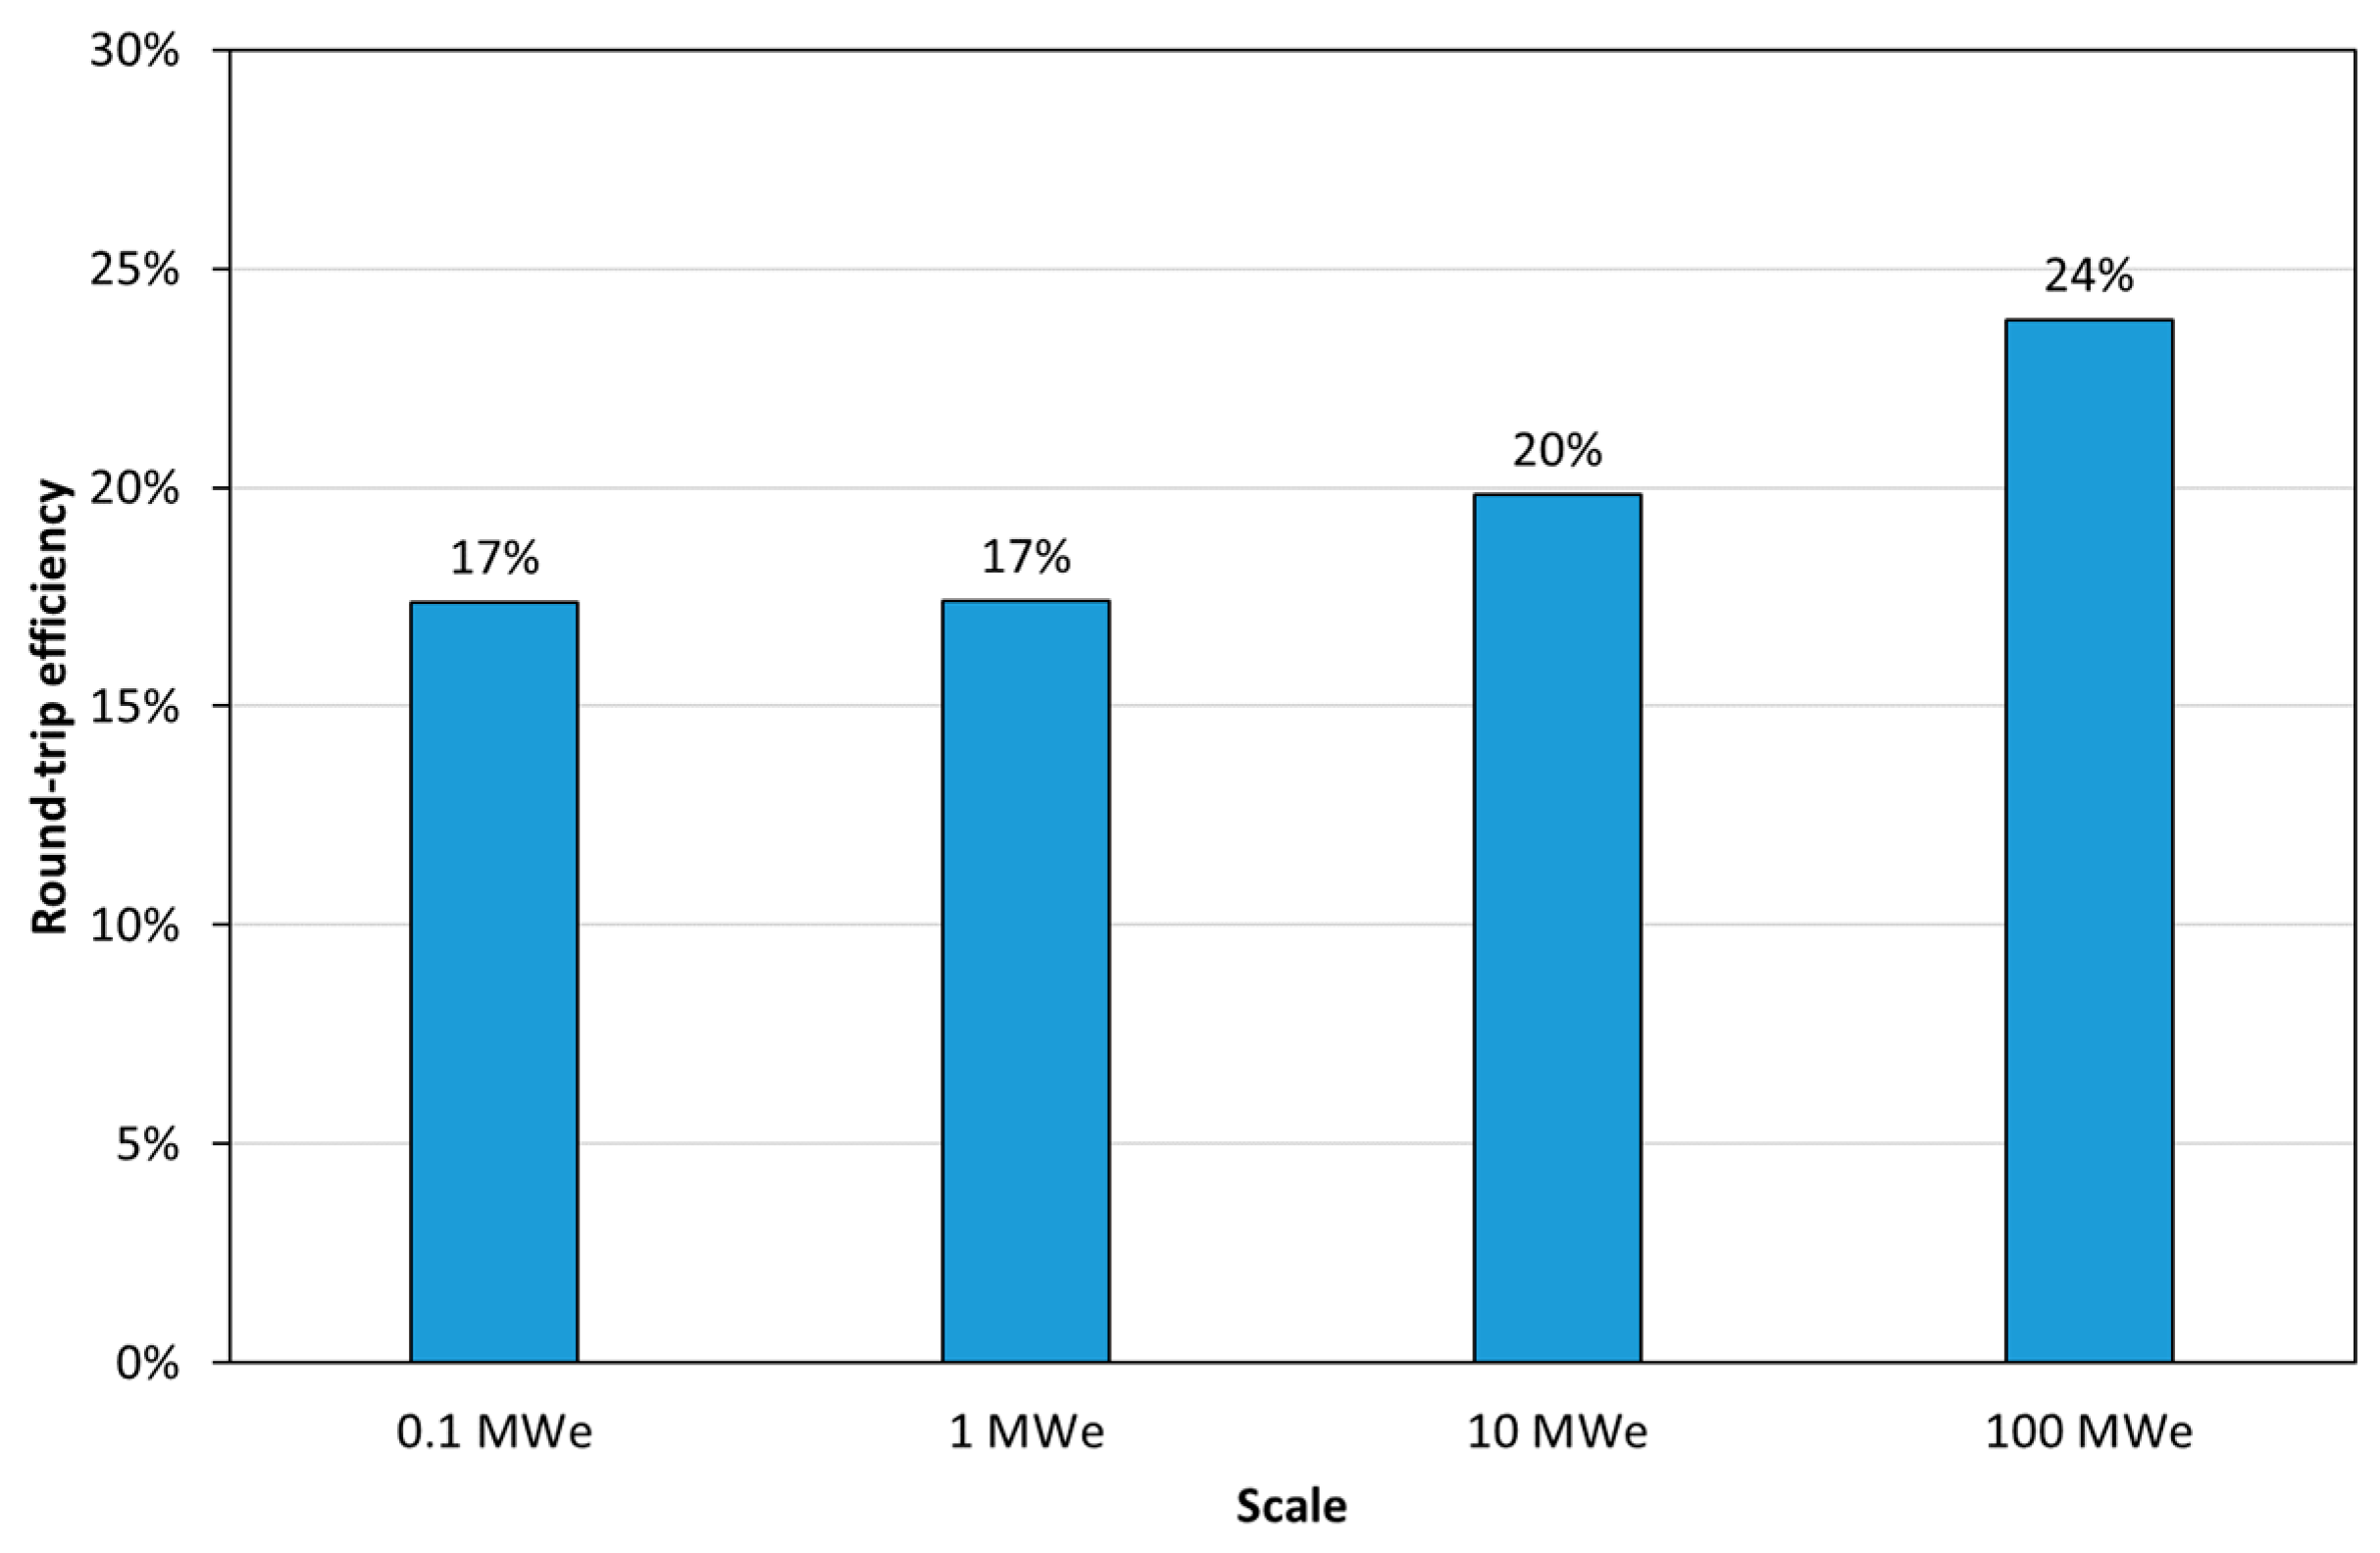
  • Round-trip efficiency of the PRC2 process.
Key information from the process modelling is provided in Section 2, with summaries for each option provided in Appendix A.
The inventory size requirements of each process configuration are presented in Figure 13. The inventory size requirement was greatest for Option 9 (molten salt approach), followed by Options 2, 4, and 6. The hydrator configuration (Option 8) had the lowest inventory size requirement. The large inventory requirement, for Option 9, was due to the assumption that the calcium carbonate is dissolved into the molten salt at 25 wt%; hence, the inventory size is a combination of calcium carbonate and molten salt.
The total power production for each of the process configurations during the peak period (8 h of carbonation) is presented in Figure 14. Options 3–9 produced the same amount of total power, with the only difference being the parasitic loads of each of the different configurations. Options 1 and 2 produced more total power than the other options, as these options had an additional turbine to make use of the expanding gas leaving the CO2 gas storage tank, whereas the other options only had the FlexEnergy 333 kWe turbine in their process configurations. Option 2 (direct power generation) produced the most power of the options considered, which was attributed to the additional power generation from the extra turbine and the additional heat recovery used in the direct power generation configuration. The process configuration of Option 2 meant it had a very small parasitic load. Option 9, the molten salt approach, produced the second-highest amount of net power. Option 9 had no parasitic loads, as the process configuration did not require a circulation fan for CO2. The fluid bed options (Options 1 to 8) required a fan to circulate CO2 during carbonation to maintain fluidization. The driving force for the molten salt option was the high pressure of the stored carbon dioxide. Options 1, 3, and 8 had the largest parasitic loads due to the use of high-temperature fans to circulate CO2 during the carbonation process. The use of a low-temperature fan in Options 2, 4, 5, and 6 resulted in significantly lower parasitic loads. Implementation of a pressure-swing configuration further reduced the parasitic load, as the pressure in the system reduced the energy requirement for CO2 circulation.
The electricity consumed in the off-peak period for each of the options is presented in Figure 15. Option 8 required the least amount of inventory; however, it was found to be the most energy-intensive option during the off-peak period. This was due to the hydration/dehydration process, which required additional Joule heating to reheat the bed from the hydration temperature of 450 °C to the carbonation temperature of 850 °C. Options 2, 4, 5, and 6 required the most energy for calcination, while Options 1 and 3 required the least.
The round-trip efficiency of each of the options investigated is presented in Figure 16. Option 9, the molten salt approach, offered the best round-trip efficiency, at 29%, which was attributed to the lack of parasitic loads during carbonation (Figure 14) and a moderate energy requirement for calcination (Figure 15). Option 8 (Option 3 with a hydration step) offered the lowest round-trip efficiency, at 8%, due to the significant amount of Joule heating required for calcination and hydration, as well as a significant parasitic load from the high-temperature fan in the configuration. Options 4–6 were relatively similar in terms of round-trip efficiency, showing that the implementation of a low-temperature fan decreased the overall round-trip efficiency, and the implementation of an additional heat stove (Option 5) had little effect on the round-trip efficiency. Option 5 and Option 7 had the same process configuration; however, these options were operated as temperature swing and pressure-swing processes, respectively. The pressure-swing approach (Option 7) had a significantly higher round-trip efficiency of 23%, in comparison to 16% for Option 5. This was due to the lower parasitic load for the pressure-swing configuration (Figure 14). For Option 3, a 4% drop in round-trip efficiency occurred when the additional turbine unit was removed from Option 1. Utilizing a direct power generation cycle, as in Option 2, increased the round-trip efficiency by 2% in comparison to Option 1, which used an indirect cycle.

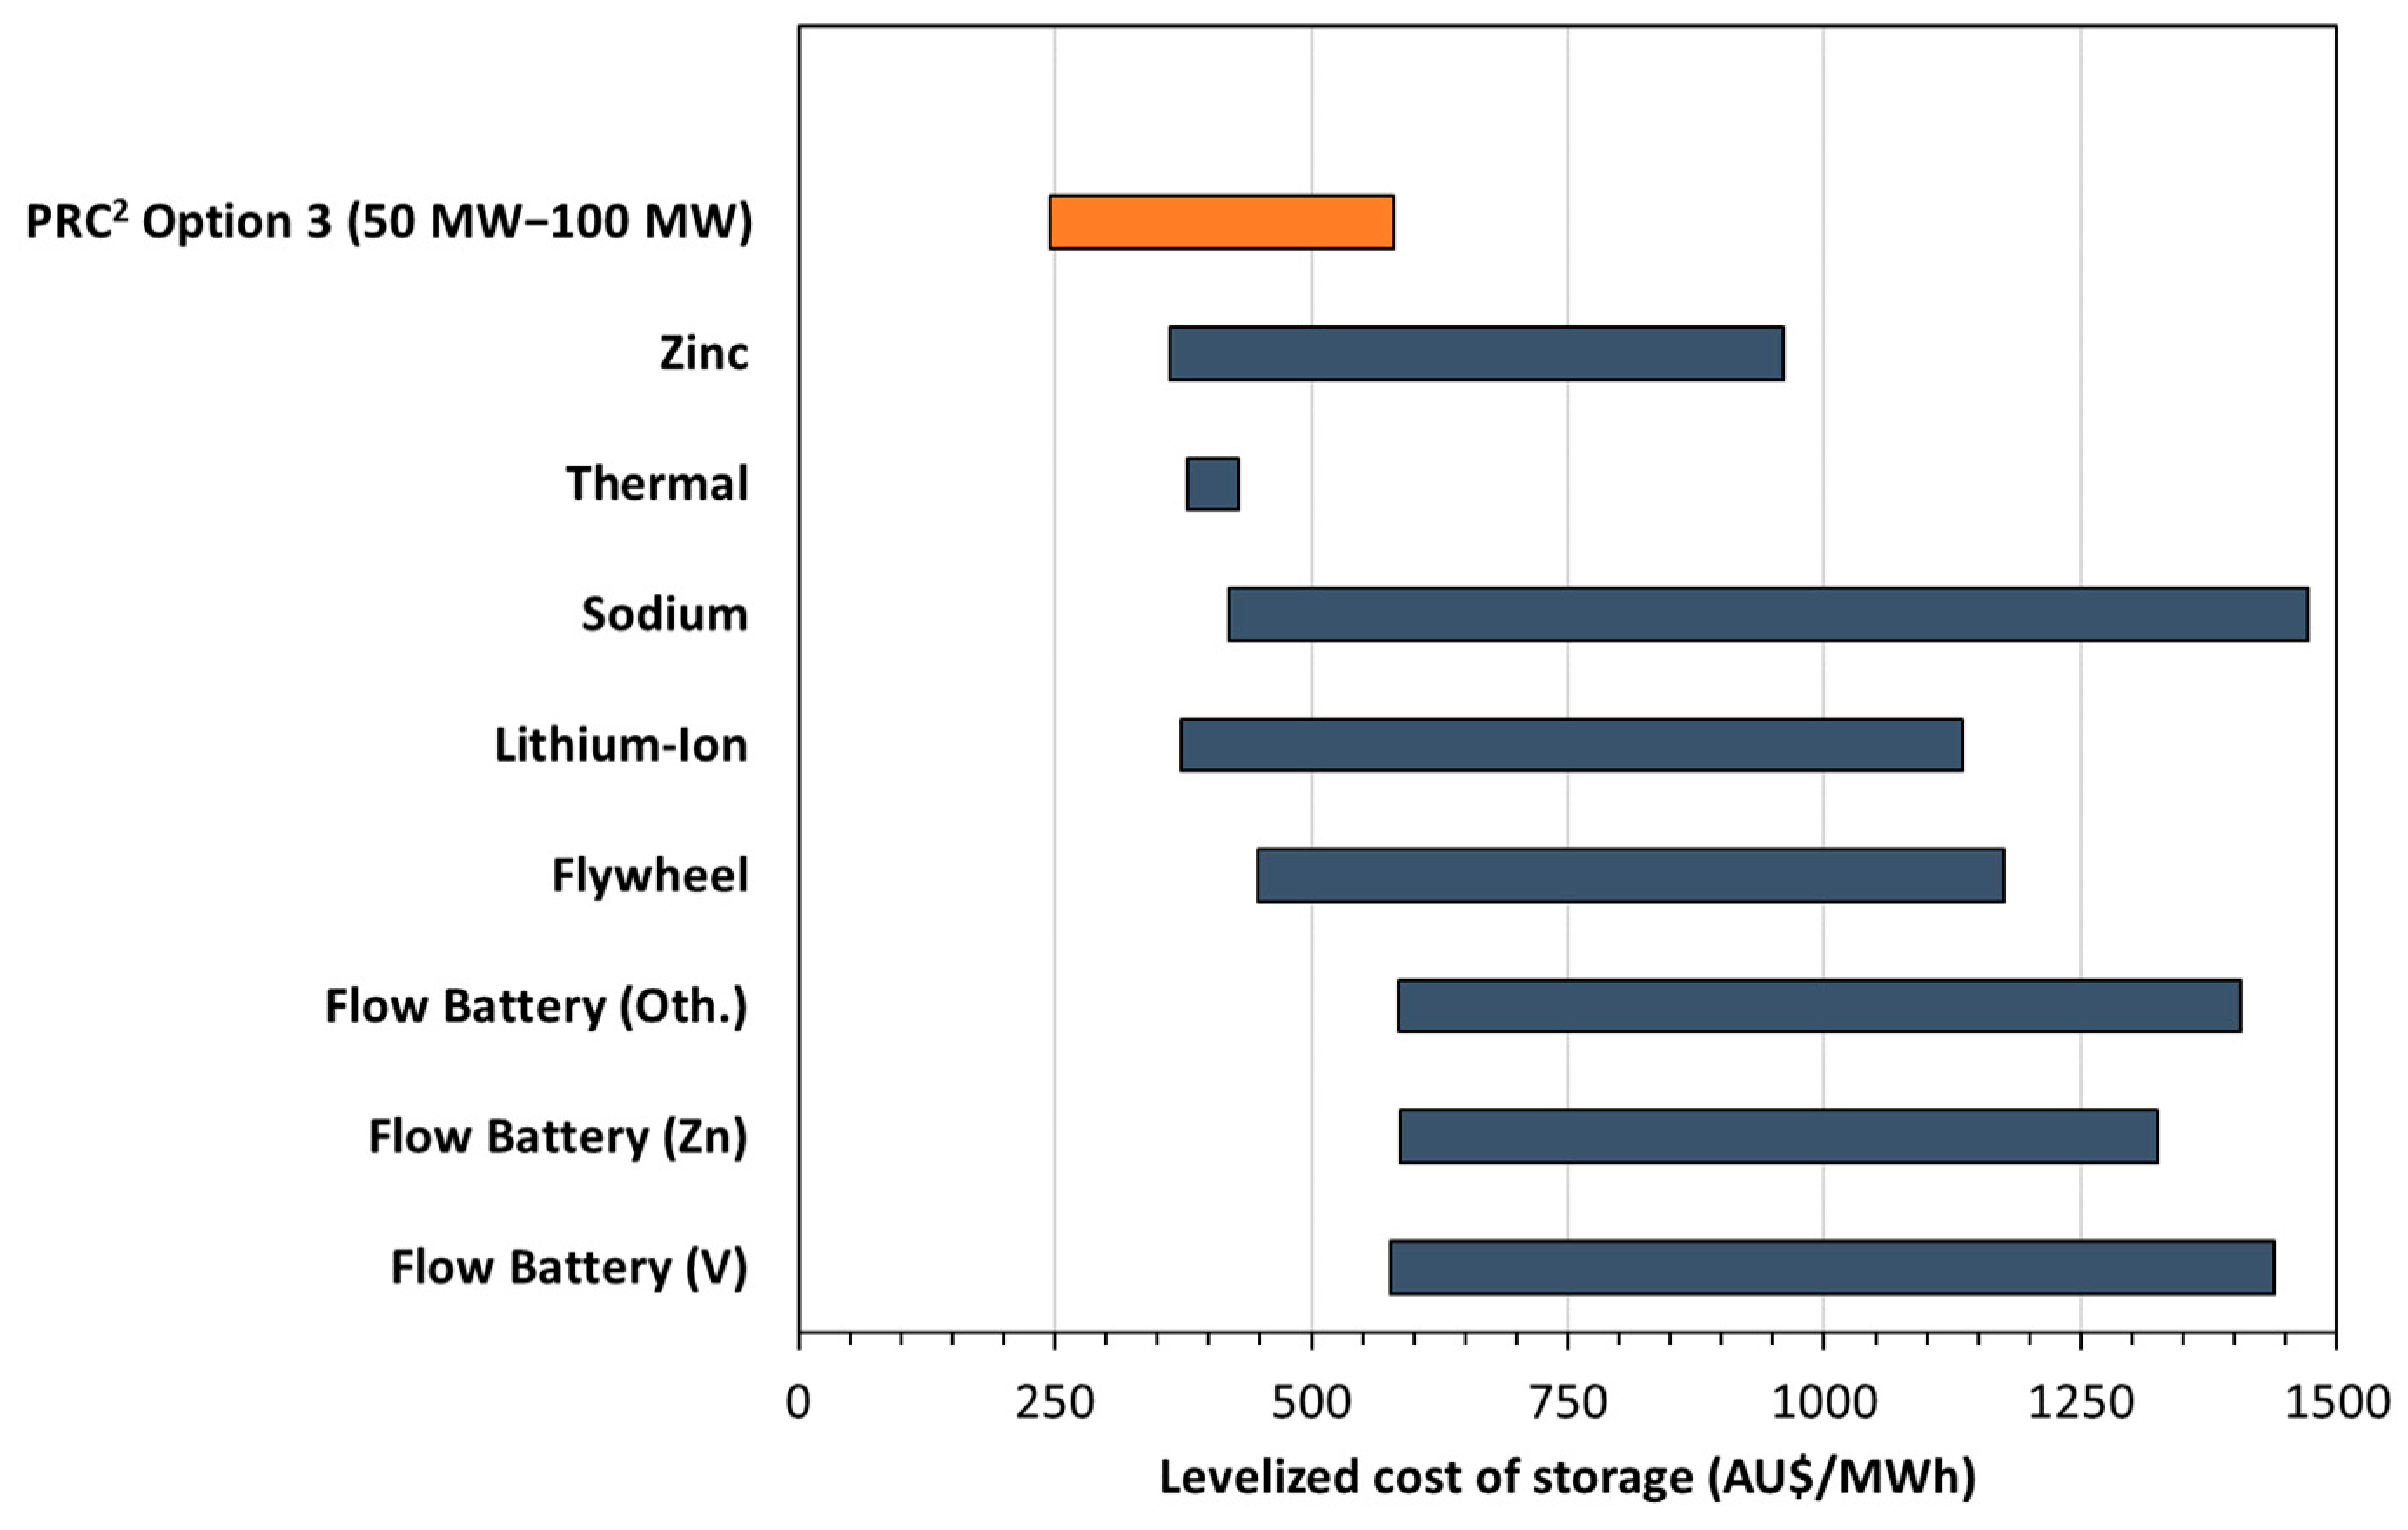
3.3. Techno-Economic Assessment

As option analysis, a techno-economic assessment of the nine different process configurations under investigation in this study was conducted using data from process modelling (for a 1 MWt plant). Figure 17 presents the total fixed capital cost (TFCC) for each of the different PRC2 configurations, as well as a breakdown for the total cost for each of the major unit operations in the process. Option 2 was the most expensive option, with the TFCC being dominated by ‘Other’ costs. For Option 2, the major contributor to the ‘Other’ category was the cost of Heat Exchanger 3 (HX3), which was approximately AUD 8.9 million and was the single most expensive item in the Option 2 configuration. The high capital cost of HX3 was attributed to the small temperature difference across HX3, which required a large surface area, 200 times greater than for any of the other the PRC2 process configuration options.
Figure 18 presents a breakdown of the percentage contributions of each major unit of operations in the process to the TFCC. Excluding Option 2, the TFCC was dominated by the reactor (30–40%) and heat exchanger (HX1 and HX2) costs (10–30%). For all options, the CO2 storage vessel and compressor costs were relatively constant.
The levelized cost of storage (LCOS) for each of the process configuration options was calculated according to Equation (7) and is presented in Figure 19. The LCOS considers the TFCC and operating expenses (OPEX) over the expected life of the plant. The purpose of the techno-economic assessment was the comparison between options. The LCOS values reported for the options should not be used for comparisons with other storage technologies. The LCOS was calculated for a demonstration-scale plant and not for a commercial-scale plant. The LCOS for a commercial-scale plant was calculated and is reported in the next section.
The LCOS was greatest for Option 2 (direct power generation option) and lowest for Option 9 (molten salt option). The LCOSs for the remaining options were similar. Utilizing low-temperature fans (Options 4, 5, and 6) did not improve the LCOS, compared with high-temperature fan options (Options 1 and 3). The results suggest that using multiple high-temperature fans in series will result in a lower LCOS, compared with a single low-temperature fan and additional heat exchangers. The pressure-swing approach (Option 7) did not result in a lower LCOS, as compared with the temperature swing options, even though the round-trip efficiency was greater. The greater LCOS was attributed to the higher capital costs of pressurized reactors and heat exchangers. The difference between the LCOSs of various options was not as significant as the differences between the capital costs of various options (Figure 17). At the demonstration scale, OPEX dominates the LCOS calculation. The OPEX for each option is primarily related to labor costs, which were assumed to be the same for all options. Hence, over a 25-year project life, the differentiation between the LCOS values for each option is not a true reflection of the benefits of one option over another. Consideration of both the capital costs and the round-trip efficiency provides a more accurate differentiation between options.
As to the effects of scaling, based on the process modelling and techno-economic assessment completed, Option 9 (the molten salt approach) offers the best configuration in terms of capital costs, round-trip efficiency, and LCOS. However, the molten salt approach is still in the research and development stage and cannot be scaled to a demonstration unit in the near future, due to the need for highly engineered reactors and the specialized synthesis methods used for molten salt production on a large scale, which are not currently available. The next-best configuration, in terms of round-trip efficiency and LCOS, is Option 1. However, the additional turbine unit adds complications and costs not necessary for an initial demonstration plant. In addition, the technical and engineering challenges associated with the operation and procurement of a high-temperature fan were deemed too complex for the initial demonstration plant. For this reason, Option 3 was chosen as the desired configuration for a future demonstration plant and the option used to perform the scaled-up and scaled-down techno-economic assessment presented in this section. The round-trip efficiency as well as a techno-economic assessment of scaled-up and scaled-down versions of Option 3 are presented in this section. The electrical outputs for the scaled-up and scaled-down versions were 0.1, 1, 10, and 100 MWe. Analyses for both the scaled-up and scaled-down versions were required to determine the scale at which the technology would be competitive with other storage technologies.
The round-trip efficiency of Option 3 at four electrical outputs is shown in Figure 20. As the electrical output increased, so too did the round-trip efficiency, which reached a maximum of 24% for 100 MWe. The increase in round-trip efficiency with increasing scale was primarily attributed to an increase in the efficiency of the turbine at greater power output and the lower parasitic fan loads as the scale of the plant increased.
Figure 21 presents a breakdown of the contributions of the different process components to the TFCC of the Option 3 configuration at four different scales. As the scale increased, both the reactor and fan costs became a less significant portion of the TFCC, with the two components comprising 69% at 0.1 MWe but only 28% at 100 MWe.
Figure 22 presents the LCOS of Option 3 at the four different scales. The change in LCOS with increasing electrical output is significant; with the LCOS at 10 Mwe, it was AUD 808 per MWh and at 100 MWe it was AUD 245 per MWh, which is on par with batteries for peak power replacement applications (LCOS for lithium-ion batteries has been reported as AUD 370 per MWh [23]; see also Figure 23). As discussed earlier, in small-scale implementations, the PRC2 process does not offer a competitive LCOS, primarily due to the dominance of OPEX in the calculation. However, as the scale is increased the OPEX component is less dominant due to the non-linear increase in labor costs, while the TFCC becomes proportionally greater, resulting in a lower LCOS for the grid-scale configuration of the PRC2 process.

4. Conclusions

Nine different configurations were proposed for the PRC2 process. For each of the nine options, process modelling and a techno-economic assessment were completed. Among these, Option 9, the molten salt approach, was identified as the most promising approach, having superior round-trip efficiency and LCOS. However, the molten salt approach is still in its infancy and requires significant research and development before it can be implemented at a demonstration scale. For a demonstration-scale plant, Option 3, which involves indirect power generation using a fluid bed reactor, was considered the best option. In conjunction with the modelling investigations, an experimental campaign was undertaken to determine the suitability of carbonate materials for the PRC2 process. Specifically, the reactivity and carbon dioxide capture efficiency of carbonate materials over multiple cycles were investigated, in addition to particle attrition studies at various temperatures and under a complete carbon dioxide atmosphere. It was concluded that the carbon dioxide capture efficiency of CaCO3 significantly decreased over multiple cycles under operating conditions pertinent to the PRC2 process, reaching a minimum of 8%. In relation to particle attrition, there was found to be no reduction in particle size after 12 weeks of fluidization under carbon dioxide at 850 °C; there was evidence of sintering in the particles. For the PRC2 process, it is important to find a suitable CaCO3 source that has sufficient carbon dioxide capture efficiency, in the order of 25%, to ensure reactor and fan costs are kept to a minimum. Alternatively, a purge-and-make-up approach could be implemented to maintain a reasonable conversion efficiency and minimize the inventory, and consequently the fluid bed size.

Author Contributions

Conceptualization, B.M.; methodology, B.M. and P.T.; formal analysis, P.T.; investigation, P.T. and J.W.; resources, P.T. and J.W.; writing—original draft preparation, B.M. and P.T.; writing—review and editing, B.M. and P.T.; supervision, B.M.; project administration, B.M.; funding acquisition, B.M. and J.W. All authors have read and agreed to the published version of the manuscript.

Funding

This research was funded by Jord International Pty Ltd., grant number G1700899.

Data Availability Statement

The raw data supporting the conclusions of this article will be made available by the authors on request.

Acknowledgments

The authors thank their colleagues Andrew Maddocks, Adrian Seyfaee, Cheng Zhou, and Khadijeh Paymooni from the University of Newcastle (Australia) for their assistance with various experimental and modelling activities associated with this project.

Conflicts of Interest

Author John Warner was employed by the company Jord International Pty Ltd. The remaining authors declare that the research was conducted in the absence of any commercial or financial relationships that could be construed as a potential conflict of interest.

Appendix A

Processes 12 01778 i001
Processes 12 01778 i002
Processes 12 01778 i003
Processes 12 01778 i004
Processes 12 01778 i005
Processes 12 01778 i006
Processes 12 01778 i007
Processes 12 01778 i008
Processes 12 01778 i009

Appendix B

Table A1. Summary of assumptions used for techno-economic assessment.
No.EquipmentMethod of SizingScaling EquationAssumptionsReference
1CO2 Storage TankShell mass, m (kg)11,600 + 34 × m0.85
(1)
Horizontal vessel;
(2)
Length is equal to diameter;
(3)
Carbon steel;
(4)
20% extra cost to include the heads.
  • Towler, Gavin, and Ray K. Sinnott. Chemical engineering design: principles, practice and economics of plant and process design, 2012. [9]
2CompressorAverage exponent335,000 × (m/484)0.65
(1)
The average exponent is calculated using the vendor pricing and our own experience based on the type of process using CO2 flow rate;
(2)
Two Inter-Stage cooling.
  • Towler, Gavin, and Ray K. Sinnott. Chemical engineering design: principles, practice and economics of plant and process design, 2012. [9]
  • Vendor: Q-Boss Pty Ltd.
3Filter--
(1)
Bag filter.
  • Vendor: LUEHR FILTER
4Heat StovesMATLAB code to find number of heat stoves and shell mass, m (kg) for cost estimationno. of heat stoves × (11,600 + 34 × m0.85)
(1)
Vertical vessel;
(2)
Stainless steel pipe as body;
(3)
Length is twice of diameter;
(4)
Gravel is used as storage medium.
  • Towler, Gavin, and Ray K. Sinnott. Chemical engineering design: principles, practice and economics of plant and process design, 2012. [9]
  • Developed MATLAB code
5Heat exchangersHeat transfer area, A (ft2)1.218 × fd fm fp CbFor:
(1)
Shell-and-tube, fixed head;
(2)
Stainless steel 304 or Monel 400.
(3)
fd = exp [−1.156 + 0.0906(lnA)]
(4)
fm = 0.8193 + 0.15984(lnA)
(5)
fp = 0.771 + 0.04981(lnA)
(6)
Cb = exp [8.821 − 0.30863(lnA) + 0.0681(lnA)2]
  • Couper, James R., W. Roy Penney, and James R. Fair. Chemical Process Equipment-Selection and Design (Revised 2nd Edition), 2009. [23]
  • Towler, Gavin, and Ray K. Sinnott. Chemical engineering design: principles, practice and economics of plant and process design, 2012. [9]
6CO2 turbinesPower, HP (hp)0.378 × (HP)0.62
(1)
Pressure discharge.
  • Couper, James R., W. Roy Penney, and James R. Fair. Chemical Process Equipment-Selection and Design (Revised 2nd Edition), 2009. [24]
7FanNumber of fans based on the estimated pressure drop at process temperatureno. of fans × ΔP
(1)
Number of fans is calculated based on maximum temperature, using vendor information.
  • Vendor: AirEng Pty Ltd.
8CycloneMass flow to cyclone-
(1)
Stainless steel.
9ReactorCross section area, A (m2) for fluidized bed options/Rule of thumb estimation for Molten Salt option4,600,000 × (A/10)0.25
(1)
Stainless steel;
(2)
Vertical cylinder;
(3)
Shell-and-tube reactor in Molten Salt option;
(4)
15% cost excluded for heaters.
  • Branan, Carl R. Rules of thumb for chemical engineers: a manual of quick, accurate solutions to everyday process engineering problems, 2002. [25]
  • Woods, Donald R. Rules of thumb in engineering practice, 2007. [26]
10Heating elementsDuty (kW)/No. of heating elementsC × (heat duty/500)n
C × (no. elem./48)n
(1)
Silicon carbide-enclosed electrodes;
(2)
Cost of controls (C = 96,000, n = 0.2);
(3)
Cost of heating elements (C = 116,000, n = 1);
(4)
Constant cost for engineering and delivery.
  • Vendor: WIN Technologies Australia Pty. Ltd.
  • Towler, Gavin, and Ray K. Sinnott. Chemical engineering design: principles, practice and economics of plant and process design, 2012. [9]

References

  1. Mirmoghtadaei, G.; Mehrpooya, M.; Mahmoudi, M.; Ganjali, M.R. Integration of CaO/CaCO3-CaCl2 thermochemical energy storage system with solid oxide iron-air redox battery. Energy Convers. Manag. 2023, 290, 117213. [Google Scholar] [CrossRef]
  2. Zheng, H.; Liu, X.; Xuan, Y.; Ding, Y.; Flamant, G. Efficient direct solar-driven thermochemical energy storage of (AlMgFeMn)OxCaCO3 pellets in a fluidized bed reactor. Energy Convers. Manag. 2023, 285, 116990. [Google Scholar] [CrossRef]
  3. Xu, Q.; Wang, L.; Li, Z.; Shi, L. A calcium looping system powered by renewable electricity for long-term thermochemical energy storage, residential heat supply and carbon capture. Energy Convers. Manag. 2023, 276, 116592. [Google Scholar] [CrossRef]
  4. Wu, S.; Zhou, C.; Tremain, P.; Doroodchi, E.; Moghtaderi, B. A phase change calcium looping thermochemical energy storage system based on CaCO3/CaO-CaCl2. Energy Convers. Manag. 2021, 227, 113503. [Google Scholar] [CrossRef]
  5. Wu, S.; Zhou, C.; Doroodchi, E.; Moghtaderi, B. Techno-economic analysis of an integrated liquid air and thermochemical energy storage system. Energy Convers. Manag. 2020, 205, 112341. [Google Scholar] [CrossRef]
  6. Wu, S.; Zhou, C.; Doroodchi, E.; Moghtaderi, B. Thermodynamic analysis of a novel hybrid thermochemical-compressed air energy storage system powered by wind, solar and/or off-peak electricity. Energy Convers. Manag. 2019, 180, 1268–1280. [Google Scholar] [CrossRef]
  7. Materic, V.; Smedley, S.I. High Temperature Carbonation of Ca(OH)2. Ind. Eng. Chem. Res. 2011, 50, 5927–5932. [Google Scholar] [CrossRef]
  8. Kunii, D.; Levenspiel, O. CHAPTER 6—Bubbling Fluidized Beds. In Fluidization Engineering, 2nd ed.; Butterworth-Heinemann: Boston, MA, USA, 1991; pp. 137–164. [Google Scholar]
  9. Towler, G.; Sinnott, R. Chemical Engineering Design, 2nd ed.; Butterworth-Heinemann: Boston, MA, USA, 2012. [Google Scholar]
  10. Julch, V. Comparison of electricity storage options using levelised cost of storage (LCOS) method. Appl. Energy 2016, 183, 1594–1606. [Google Scholar] [CrossRef]
  11. Valverde, J.M.; Perejon, A.; Medina, S.; Perez-Maqueda, L.A. Thermal decomposition of dolomite under CO2: Insights from TGA and in situ XRD analysis. Phys. Chem. Chem. Phys. 2015, 17, 30162–30176. [Google Scholar] [CrossRef] [PubMed]
  12. González, B.; Grasa, G.S.; Alonso, M.; Abanades, J.C. Modeling of the Deactivation of CaO in a Carbonate Loop at High Temperatures of Calcination. Ind. Eng. Chem. Res. 2008, 47, 9256–9262. [Google Scholar] [CrossRef]
  13. Bhatia, S.K.; Perlmutter, D.D. Effect of the product layer on the kinetics of the CO2-lime reaction. AIChE J. 1983, 29, 79–86. [Google Scholar] [CrossRef]
  14. Abanades, J.C.; Alvarez, D. Conversion Limits in the Reaction of CO2 with Lime. Energy Fuels 2003, 17, 308–315. [Google Scholar] [CrossRef]
  15. Sun, R.; Li, Y.; Liu, H.; Wu, S.; Lu, C. CO2 capture performance of calcium-based sorbent doped with manganese salts during calcium looping cycle. Appl. Energy 2012, 89, 368–373. [Google Scholar] [CrossRef]
  16. Lysikov, A.I.; Salanov, A.N.; Okunev, A.G. Change of CO2 Carrying Capacity of CaO in Isothermal Recarbonation−Decomposition Cycles. Ind. Eng. Chem. Res. 2007, 46, 4633–4638. [Google Scholar] [CrossRef]
  17. Broda, M.; Pacciani, R.; Müller, C.R. CO2 Capture via Cyclic Calcination and Carbonation Reactions. In Porous Materials for Carbon Dioxide Capture; Lu, A.-H., Dai, S., Eds.; Springer: Berlin/Heidelberg, Germany, 2014; pp. 181–222. [Google Scholar]
  18. Valverde, J.M.; Medina, S. Crystallographic transformation of limestone during calcination under CO2. Phys. Chem. Chem. Phys. 2015, 17, 21912–21926. [Google Scholar] [CrossRef] [PubMed]
  19. Chacartegui, R.; Alovisio, A.; Ortiz, C.; Valverde, J.M.; Verda, V.; Becerra, J.A. Thermochemical energy storage of concentrated solar power by integration of the calcium looping process and a CO2 power cycle. Appl. Energy 2016, 173, 589–605. [Google Scholar] [CrossRef]
  20. Valverde, J.M. Ca-based synthetic materials with enhanced CO2 capture efficiency. J. Mater. Chem. A 2013, 1, 447–468. [Google Scholar] [CrossRef]
  21. Manovic, V.; Anthony, E.J. Carbonation of CaO-Based Sorbents Enhanced by Steam Addition. Ind. Eng. Chem. Res. 2010, 49, 9105–9110. [Google Scholar] [CrossRef]
  22. Donat, F.; Florin, N.H.; Anthony, E.J.; Fennell, P.S. Influence of High-Temperature Steam on the Reactivity of CaO Sorbent for CO2 Capture. Environ. Sci. Technol. 2012, 46, 1262–1269. [Google Scholar] [CrossRef] [PubMed]
  23. Lazard. Lazard’s Levelized Cost of Storage Analysis, version 3.0; 2017. Available online: https://www.actu-environnement.com/media/pdf/news-29972-etude-cout-stockage-lazard.pdf (accessed on 26 July 2018).
  24. Couper, J.R.; Penney, W.R.; Fair, J.R.; Walas, S.M. Chemical Process Equipment-Selection and Design, 2nd ed.; Elsevier: Amsterdam, The Netherlands, 2009. [Google Scholar]
  25. Branan, C.R. Rules of Thumb for Chemical Engineers: A Manual of Quick, Accurate Solutions to Everyday Process Engineering Problems; Elsevier: Amsterdam, The Netherlands, 2002. [Google Scholar]
  26. Woods, D.R. Rules of Thumb in Engineering Practice; Wiley & Sons: Hoboken, NJ, USA, 2007. [Google Scholar]
Figure 1. CaCO3/CaO/CO2 equilibrium curve.
Processes 12 01778 g001
Figure 2. Preliminary concept design for PRC2 type plant.
Processes 12 01778 g002
Figure 3. Particle attrition experimental setup. Tube furnace and quartz reactor (left) and quartz reactor loaded with CaCO3 particles (right).
Processes 12 01778 g003
Figure 4. HP-TGA experimental data for experiment 4; 30 calcination–carbonation cycles performed at 1.2 bar, 100% CO2, and calcination and carbonation temperatures of 950 °C and 850 °C, respectively.
Processes 12 01778 g004
Figure 5. Effect of calcination temperature on conversion efficiency of CaCO3 over 30 calcination–carbonation cycles conducted at 1.2 bar, 100% CO2, and a carbonation temperature of 850 °C.
Processes 12 01778 g005
Figure 6. Effect of CO2 concentration and pressure-swing conditions on conversion efficiency of CaCO3 for multiple calcination–carbonation cycles.
Processes 12 01778 g006
Figure 7. Effect of CO2 concentration on conversion efficiency of CaMg(CO3)2 for multiple calcination–carbonation cycles.
Processes 12 01778 g007
Figure 8. Mass change of limestone sample with temperature and time during 5 calcination–hydration–carbonation cycles. The calcination, hydration, and carbonation temperatures were set at 950 °C, 450 °C, and 850 °C, respectively. In this experiment, 100% CO2 was used for calcination and carbonation, and 90% steam and 10% N2 was used for hydration. The cooling and heating intervals were performed under 100% N2.
Processes 12 01778 g008
Figure 9. Mass changes of limestone sample with temperature and time during 5 calcination–hydration–carbonation cycles. The calcination, hydration, and carbonation temperatures were set at 950 °C, 450 °C, and 850 °C, respectively. In this experiment, 100% CO2 was used for calcination and carbonation, and 90% steam and 10% CO2 was used for hydration. The cooling and heating intervals were performed under 100% CO2.
Processes 12 01778 g009
Figure 10. Conversion efficiency of limestone samples as a function of number of cycles obtained from hydration experiments 5 and 6 in which pure nitrogen and pure CO2 were used, respectively, for the hydration steps at 450 °C. The calcination and carbonation temperatures were identical for both experiments.
Processes 12 01778 g010
Figure 11. Volume density distribution as a function of size range for samples obtained from the attrition experiments continuously fluidizing at 850 °C using 1 NL/min of pure CO2: (A) entire PSD; and (B) closeup of lower size fractions.
Processes 12 01778 g011
Figure 12. SEM images of fresh CaCO3 at magnifications of (A) 100×, (C) 1000×, and (E) 10,000×, and SEM images of the Week 8 sample obtained from the attrition experiment at magnifications of (B) 100×, (D) 1000×, and (F) 10,000×.
Processes 12 01778 g012
Figure 13. Required CaCO3 inventory size for the different PRC2 process configuration options. Option 9 is a combination of CaCO3 and molten salt.
Processes 12 01778 g013
Figure 14. Net power produced and parasitic loads for the different PRC2 process configuration options.
Processes 12 01778 g014
Figure 15. Electricity consumption in the off-peak period for the different PRC2 process configuration options.
Processes 12 01778 g015
Figure 16. Round-trip storage efficiency of each of the PRC2 process configuration options investigated.
Processes 12 01778 g016
Figure 17. Total fixed capital cost for the different PRC2 process configuration options.
Processes 12 01778 g017
Figure 18. Percentage contributions of the different process components to the total fixed capital costs for the different PRC2 process configuration options.
Processes 12 01778 g018
Figure 19. Levelized cost of storage for the different PRC2 process configuration options.
Processes 12 01778 g019
Figure 20. Round-trip efficiency of Option 3 at different electrical output scales.
Processes 12 01778 g020
Figure 21. Percentage contributions of the different process components to the total fixed capital cost of Option 3 at different electrical output scales.
Processes 12 01778 g021
Figure 22. Levelized cost of storage Option 3 at different electrical output scales.
Processes 12 01778 g022
Figure 23. Levelized cost of storage for PRC2 (Option 3), versus several other energy storage technologies.
Processes 12 01778 g023
Table 1. Summary of multicycle experimental conditions; please note: Calc. = Calcination; Carb. = Carbonation; Hyd. = Hydration.
Exp. No.Reaction Temperature (˚C)Gas Mixture
(mol %)
Pressure
(bar)
No. of CyclesCarbonate Material
Calc. Carb. Hyd.Calc./Carb.Hyd.Calc.Carb.Hyd.
1900850-100% CO2-1.21.2-5CaCO3
21000850-100% CO2-1.21.2-5CaCO3
31000850-100% CO2-1.21.2-50CaCO3
4950850-100% CO2-1.21.2-30CaCO3
5950850-50% CO2, 50% Air-1.21.2-30CaCO3
6900800-50% CO2, 50% Air-1.21.2-15CaCO3
7850750-25% CO2, 75% Air-1.21.2-15CaCO3
8950850-100% CO2-1.21.2-30CaMg(CO3)2
9900800-50% CO2, 50% Air-1.21.2-30CaMg(CO3)2
10850750-25% CO2, 75% Air-1.21.2-30CaMg(CO3)2
11950950-100% CO2-1.24-5CaCO3
12950950-100% CO2-1.24-15CaCO3
13950850450100% CO2, N2 cooling90% H2O, 10% N21.21.225CaCO3
14950850450100% CO2, CO2 cooling90% H2O, 10% CO21.21.225CaCO3
Table 2. XRF analysis of calcium carbonate and dolomite samples used in this study.
SampleComposition (wt%)
CaOAl2O3SiO2MgOFe2O3MnOTiO2K2ONa2O
CaCO398.520.371.060.810.310.030.0880.053<0.01
CaMg(CO3)238.153.731.6722.551.870.040.290.141.05
Table 3. Key assumptions used in the process modelling.
Assumptions
1Heat stoves recovered 80% of the waste heat available for storage
2The isentropic efficiency of all fans, compressors, and turbines was 80%
3The reactivity of calcium carbonate ranged from 25% for Options 1 to 7, to 60% for Option 8, and 75% for Option 9
4A multi-stage compressor was used to compress the CO2 into the storage vessel
5The temperature approach for high-temperature heat exchangers: 50 °C
6The performance of the FlexEnergy turbine was based on ISO conditions (59 °F [15 °C], sea level, 60% RH)
7The pressure drop across the fluid bed was 25 kPa
8Carbonation time (8 h) and calcination time (16 h), except for Option 8 (carbonation/calcination times of 8 h, with hydration/dehydration times of 4 h each)
9Carbonation temperature 850 °C, calcination temperature 950 °C, hydration temperature 450 °C
Table 4. A summary of measured specific surface areas and mean diameters for samples obtained from particle attrition experiments.
SampleWeekSpecific Surface Area (m2/kg)dSauter (µm)d10 (µm)d50 (µm)d90 (µm)
Fresh061.698165288471
Sample 1124.6244160278461
Sample 2223.9252163282464
Sample 3322.4268173292471
Sample 4421.8275180297475
Sample 5621.5279183301483
Sample 6822.7265171287467
Sample 71022.1271174296485
Sample 81222.9262167287476
Disclaimer/Publisher’s Note: The statements, opinions and data contained in all publications are solely those of the individual author(s) and contributor(s) and not of MDPI and/or the editor(s). MDPI and/or the editor(s) disclaim responsibility for any injury to people or property resulting from any ideas, methods, instructions or products referred to in the content.

