Abstract
The modeling of fibrotic effects on fluid flow and metabolism in the liver can be computationally challenging. This paper combines innovative concepts based on fundamental physics to address such issues at the level of the liver functional unit, the lobule, and upscales and extends this to a multi-lobule tissue scale analysis. Fibrosis effects on fluid flow and metabolism are introduced using percolation theory and its consequences are explored for single lobule and multi-lobule patterns, without and with distortion.
1. Introduction—Liver Inflammation Response and Fibrosis
The liver, the body’s primary metabolic organ, operates across multiple time and spatial scales. Anatomically, the liver consists of three vascular networks: two supply trees stemming from the portal vein and hepatic artery, and one drainage tree leading to the hepatic vein. These blood vessels undergo several levels of branching down to the terminal arterioles and venules, which are organized into portal tracts alongside a terminal bile duct. Surrounding these terminal vessels are liver cells known as hepatocytes, arranged in plates that are interspersed with sinusoids, which serve as the liver’s capillaries, and the spaces of Disse, representing the liver’s extravascular spaces. Blood is eventually collected and drained by the hepatic venules.
At a microscopic level, the liver plays a critical role in the biotransformation of xenobiotics, including drugs, aiding in their elimination from the body. Its primary function is to prevent the accumulation of various chemical compounds in the bloodstream by converting them into forms suitable for excretion. However, these vital processes can potentially damage liver tissue and impair its function. Research on hepatic clearance has shown that the efficiency of substance extraction is influenced not only by damaged hepatocytes but also by the liver’s intrinsic enzymatic ability to eliminate drugs, the resistance to drug transport from the blood to the liver cells, and the hepatic blood flow itself. Alterations in hepatic blood flow, such as those caused by diseases like cirrhosis or by aging, can significantly affect the systemic clearance of harmful substances. Therefore, a quantitative understanding of the relationship between liver structure and function, which can be achieved through computational modeling, is highly valuable. In silico modeling of liver performance and structural integrity can, for instance, aid in predicting the hepatotoxicity of drug candidates. Given the liver’s complex architecture, developing models for blood flow within it is a challenging task that necessitates multi-scale approaches.
Fluid flow effects range from large vascular conduits (portal vein and hepatic artery to hepatic vein) to the small sinusoidal capillary networks. Temporal variations in these processes range from milliseconds for changes in metabolic processes (like oxygen and glucose) to minutes or hours for drug metabolism and enzyme activity, and even to days or months for structural changes in the liver (such as fibrosis, steatosis, or hepatitis). In silico techniques hold the potential to quantify these processes and seamlessly integrate them across these multiple scales.
Liver fibrosis is a pathological condition characterized by the excessive accumulation of extracellular matrix proteins, particularly collagen, in response to chronic liver injury. This condition represents the liver’s attempt to repair damaged tissue; however, the continuous cycle of injury and repair leads to the scarring of liver tissue. Over time, this scarring disrupts the normal architecture of the liver, impeding its ability to function properly. The primary causes of liver fibrosis include chronic hepatitis, prolonged alcohol abuse, and non-alcoholic fatty liver disease, among others. As fibrosis progresses, the liver becomes increasingly stiff, leading to impaired blood flow and reduced liver function.
If left unchecked, liver fibrosis can advance to cirrhosis, a severe and irreversible stage of liver disease where the organ becomes extensively scarred and may eventually fail. Cirrhosis can result in life-threatening complications, including portal hypertension, liver cancer, and liver failure. The progression from fibrosis to cirrhosis is influenced by the balance between tissue repair and scar formation, which, when disrupted, favors the accumulation of fibrotic tissue. Understanding the underlying mechanisms of fibrosis is crucial for developing therapeutic strategies aimed at halting or even reversing its progression, thereby preventing the devastating consequences associated with advanced liver disease.
As fibrosis develops, the liver’s architecture becomes increasingly distorted [1]. The excessive buildup of collagen and other matrix proteins leads to the formation of fibrous bands that encase liver cells, disrupting the normal liver structure and impairing its blood flow. This disruption has significant implications for liver function, as the liver’s ability to filter blood, produce essential proteins, and detoxify harmful substances is compromised. The progression of fibrosis is typically silent, with few or no symptoms in the early stages, making it difficult to detect until the disease has advanced. Over time, if the underlying cause of the liver injury is not addressed, fibrosis can evolve into cirrhosis, characterized by irreversible scarring, loss of liver function, and a heightened risk of liver cancer. This progression underscores the importance of early diagnosis and intervention to prevent the severe consequences of advanced liver fibrosis.
We begin by summarizing the liver’s basic inflammation response leading to fibrosis and chronic liver injury [2,3,4]. Inflammation of the liver begins with agent attack on hepatocytes. This agent can be naturally occurring (non-alcoholic fatty liver disease (NFALD), hepatitis B virus (HBV), hepatitis C virus (HCV)) or an artificially injected agent (ethanol (EtOH), thioacetamide (TAA), carbon-tetrachloride (CCl4), acetaminophen (APAP)). The latter substances are often used for research characterization of the inflammation response.
The “injured” hepatocytes thereafter chemically signal Kupffer cells (also called macrophages—15% of lobule cell types) to begin the inflammation response. These cells produce both pro-inflammatory (e.g., tumor necrosis factor alpha (TNFa)) and anti-inflammatory (e.g., transforming growth factor beta (TGFb)) as soluble-diffusing cytokines. As production of TGFb tends to inhibit the production of further TNFa, typically there is a rapid spike in TNFa production followed by a significant decline as TGFb levels increase and stabilize. This is characterized by an extended period of TGFb availability.
Hepatic stellate cells (HSC—5% of lobule cell types) are converted to myo-fibroblasts and portal fibroblasts in the presence of the pro-inflammatory TNFa, and these cells in turn generate collagen when stimulated by the anti-inflammatory TGFb agent. Portal fibroblasts are naturally located near the portal inlet zones and are responsible for high fibrotic responses (e.g., portal hyper-tension), while myo-fibroblasts are more randomly distributed throughout the lobule. Collagen deposition typically occurs over a much longer time frame than the initial pro-inflammatory response. We note that increased fibrosis can limit O2 distribution in the lobule, and as O2 is naturally lower near the central outlet, we can expect increased hypoxia and cell necrosis here with fibrosis.
A mechanistic simulation model that considers flow would address all aspects of this wound response process. In Supplementary Material S1, we provide an initial approach to time-dependent collagen deposition modeling. In the main text, we employ a more phenomenological inflammation approach to explore aspects of increased fibrosis on flow and metabolism. This can be furthermore coupled with increased matrix stiffness effects of fibrosis as we have discussed previously [5]. Aspects of this problem related to deformation are illustrated in Supplementary Material S2. As such, we are essentially ignoring the early time wound healing stages while focusing on the longtime consequences. Our earlier review article [5] presents a comprehensive overview of experimental and modeling issues associated with liver fibrotic behavior.
2. Methods: Single DLA Lobule Including Fibrosis Effects
A fine-scale idealized model of an isolated lobule with statistically varying properties forms a basis for our analysis [6,7]. A more realistic hexagonal lobule model utilizing diffusion-limited aggregation (DLA) methods [8] is then introduced to create complex sinusoid (Figure 1A) and fibrotic patterns (Figure 1B), again affecting fluid flow and metabolism. Gaudio et al. [9] give some indication of the fractal nature of lobule sinusoidal networks without and with cirrhosis that motivate this approach. Model properties are calculated from basic physics concepts. Basic flow and mechanical properties of this unit are summarized in Table 1 and Table 2. Details of basic model equations and computational approach can be found in our earlier papers, especially [8].
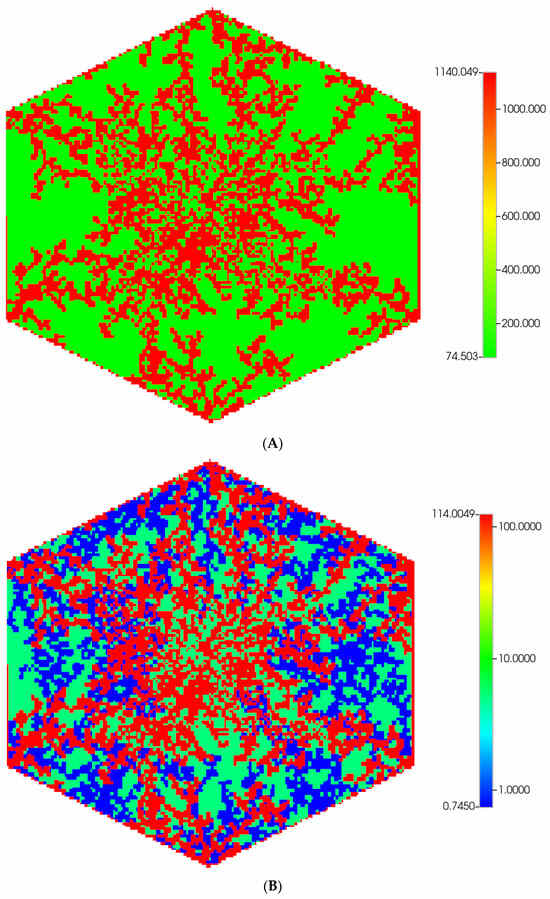
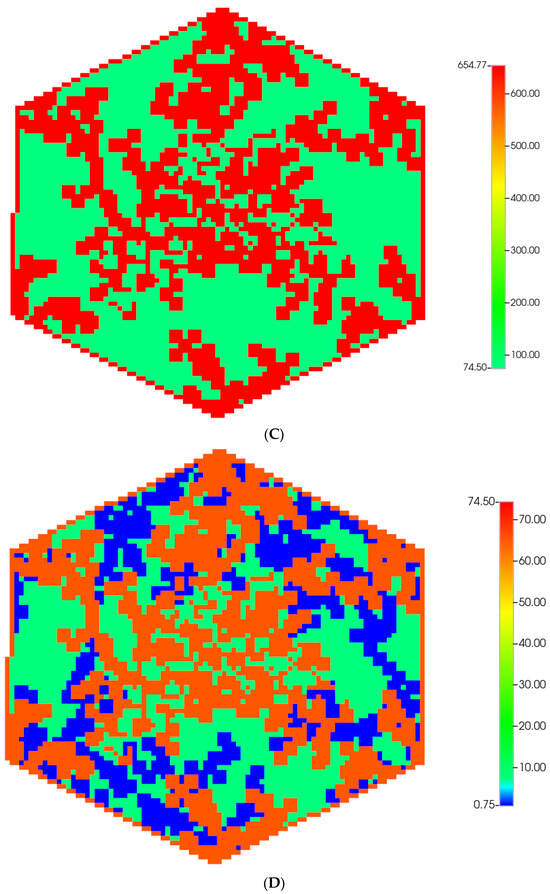
Figure 1.
(A) A regular base case (270 × 270 × 49 grid) hexagonal lobule with DLA sinusoids: permeability distribution (units mD) where red are sinusoids and green are normal tissue. (B) A regular base case (270 × 270 × 49 grid) hexagonal lobule with explicit DLA progressive fibrosis: permeability distribution (units mD) where red are sinusoids, blue are explicit fibrotic tissue, and green are implicit fibrotic tissue. (C) A regular upscaled (90 × 90 × 37 grid) hexagonal lobule with DLA sinusoids: permeability distribution (units mD) where red are sinusoids, and green are implicit fibrotic tissue. (D) A regular upscaled (90 × 90 × 37) grid hexagonal lobule with explicit DLA progressive fibrosis: permeability distribution (units mD) where red are sinusoids, blue are explicit fibrotic tissue, and green are implicit fibrotic tissue.

Table 1.
Geometrical and fluid properties of a single DLA lobule (original vs. upscaled).
Table 2.
Implicit and explicit fluid properties of a single DLA lobule (original vs. fibrotic).
Numerous other authors [10,11,12,13] have presented analogous single lobule perfusion models and analysis, as the lobule represents the liver’s basic functional unit. These models did not consider explicit sinusoid flow path representations and instead used averaged “porous media” flow properties. Ricken et al. [14,15,16] extended this average perfusion approach to consider mechanical and metabolic processes for the lobule. In contrast, Debbaut’s group have furthermore studied normal and cirrhotic liver tissue at the sub-lobule scale, defining explicit sinusoid network paths by both experimental and computational approaches [17,18,19].
Our flow protocol used first simulates reactive–convective–diffusive for O2 distribution, using developed models for O2 utilization. The resulting lobule O2 profile is assumed to determine the spatial patterns of a metabolizing CYP enzyme. (O2 distribution is thought to be a major determinant of liver lobule zonation for multiple processes [20,21], including fibrosis itself [22]. Paclitaxel reactive–convective–diffusive drug metabolism is then predicted, based on the enzyme distribution. This basic hexagonal lobule model protocol is here utilized to include fibrotic patterns, again utilizing DLA methods (Figure 1B). Fluid flow and metabolism are directly affected by fibrosis as we now explore. Our dynamic model considers non-steady, spatially non-uniform flows, and metabolite distributions in principle (solution of partial differential equations), although approach to steady state can often occur quite rapidly, especially in the absence of fibrotic effects.
Inflammation-induced fibrosis can lead to several severe liver pathologies (hepatitis, cirrhosis, liver cancer). For this reason, a great deal of effort has been made to quantify such effects experimentally [19,23,24,25] and theoretically [18]. Our earlier review article [5] presents a comprehensive overview of experimental and modeling issues associated with liver fibrotic behavior. Details of our modeling approach within the context of the work of other authors are presented in the next section.
2.1. Scale-Dependent Modeling of Collagen Fibrosis: Concepts
Collagen is a triple helix dominated by the amino acid glycine, proline, and hydroxyproline. Basic molecular tropocollagen forms a triple helix of amino acids of total length 300 nm and 1.5 nm diameter. Numerous studies of the self-assembly of type I collagens, rod-like proteins, to form elongated fibrils have been conducted. These fibrils vary in length from 300 to 1000 nm with diameters from 20 to 200 nm. Further aggregation of these fibrils into larger collagen fibers can then occur. Earliest fibril packing theories propose a staggered stacking of 5 units over integral multiples of a repeat distance of D = 67 nm, with a quasi-hexagonal packing perpendicular to this major axis [26,27]. Silver et al. [28] investigated fibril formation using a cylinder model of tropocollagen plus a simple binding rule with a 3.4 D overlap coiling adjacent molecules into concentric layers. Buehler [29,30] developed computational approaches to fibril self-assembly based on advanced molecular dynamics models that allowed upscaling to continuum mechanical modeling.
A model of collagen fibrogenesis based on DLA has been proposed by Parkinson et al. [31,32], later generalized to include stress responses [33]. These models again recognized the staggered stacking with repeat distance of D = 67 nm and generated structures of collagen fibrils including the elongated morphology and tip growth observed in experiments. Fractal dimensions and aggregate densities are estimated with this method. The size of the fibrils generated (50,000 molecules) are limited by the lattice grid size used (approximately 16 nm) and computer limitations.
We follow the DLA method here in part but recognize the necessary scale dependence of the desired fibrotic effects. First, the collagen network of normal tissue is handled implicitly through assumed porosity/permeability properties. This follows theories on fibrous porous media discussed further below. Next, we estimate the effects of additional fibrotic changes caused by inflammation via a two-step approach. Recognizing the spatial grid scale utilized by Parkinson et al. (~5 nm) in their DLA approach is much smaller than that treated here (~5 um) requires considering both an explicit and implicit fibrosis treatment. Explicit fibrotic grid regions are created using the DLA growth method for larger-scale collagen fibers. Our method further recognizes they are more likely to form in grid regions adjacent to sinusoids emerging from portal veins, leading to portal hypertension. This is based on histopathological features observed in liver sections from rats treated with carbon tetrachloride (CCl4) (see [9,34]). Conversely, implicit fibrotic changes (corresponding to smaller scale fibrils) are quantified by rescaling our fibrous porous media flow properties, as illustrated next. Here we note that our previous (unpublished) work analyzing flow on [19] fibrotic/cirrhotic liver images at this smaller scale gave overall flow reduction factors of 0.20 based on the ratio of healthy to cirrhotic flows.
2.2. Fibrotic Effects on Permeability
Theories on flow in fibrous porous media have been discussed by many authors, basically correlating permeability change with porosity change. Conceptually, this porosity change with fibrosis is related to extra collagen deposition (as discussed in Supplementary Material S1). Here the standard porous media concept of “permeability” quantifies the relative ease of fluid flow through porous media and has units of length2. (Permeability is rescaled with geometric factors and fluid viscosity to calculate fluid flow for specific situations).
Standard porous media flow correlations relating porosity and permeability include the Kozeny–Carmen equation [35], as used in STARS) originally developed to model packed beads and sand grains:
where “p” is an adjustable power. STARS default is p = 3 but we will use p = 4 here.
The aforementioned can be compared with alternate fibrous media correlations, such as that by Jackson and James (1986):
Later idealized modeling of fibrous matrices [36,37,38] confirm the correctness and limitations of such correlations. Interestingly, Costa [39] and Zhu et al. [40] both emphasize that CK-type correlations can usefully be applied to fibrous beds as well. We take this approach here.
For our correlations, we assume for fibrous tissue ϕtis-f = 0.1424, while for fibrous sinusoids ϕsin-f = 0.6020 in order to generate K = 0.1K0 for both sinusoids and tissues based on an extensive level of collagen deposition of ρc = 0.4002 in tissue and ρc = 0.2335 in sinusoids. We correspondingly assume an extensive permeability reduction of 1/100 for the grid cells with extensive explicit fibrosis.
Moderate fibrosis can be treated similarly using these same equations. Thus, for the case of moderate implicit fibrosis, tissue ϕ = 0.1667, while for fibrous sinusoids ϕ = 0.6607 in order to generate K/K0 = 0.2, based on a moderate level of collagen deposition of ρc = 0.3000 in tissue and ρc = 0.1588 in sinusoids. We correspondingly assume a less extensive permeability reduction of 1/50 for the grid cells with moderate explicit fibrosis.
These parameter choices are discussed further in Supplementary Material S1.
2.3. Fibrotic Effects on Diffusion
Reactive drug transport requires the additional consideration of diffusive flows and reactions. These effects are typically characterized by two dimensionless numbers: the Peclet number describing the ratio of convective to diffusive transport, and the Damkohler number describing the ratio of reactive rates to diffusive transport [35]. Resultant observed behavior can vary widely when these dimensionless variables change significantly. Changing fibrosis effects can impact these processes at multiple scales as we discuss next.
Effective diffusion is impacted by the presence of tissue fibers and depends on three factors—concentration of fibers cf = (1 − ϕ), fiber radius rf (often estimated as square root of tissue permeability), and molecule size rs (molecular radius). Ogston [41] gave a first representation of such effects with s = rs/rf:
where Dm is molecular diffusion constant in water or blood. Here fiber size rf is usually expressed as (K/ϕ)0.5 where the permeability is also a function of porosity as we discussed previously. Thus, the Ogston expression results in:
where generally we still might need perm as a function of ϕ (e.g., Carmen–Kozeny expression or [42] estimation of fibrous permeability).
Johnson et al. [43] compare these expressions and other effective medium expressions to experiment. Note using ratios of these expressions for different fiber volume fractions allows estimations of changing levels of fibrosis on diffusion.
A simpler expression [44], assuming a fixed solute size and a fixed fiber radius, might be:
with the tortuosity approximated by τ = 1 − 0.5 ln(ϕ), for example. If we ignore this latter dependence, we obtain the idea that Deff is approximately Deff ≈ Dm ϕ.
These ideas can also be used to rescale the diffusion coefficient through changing levels of fibrosis, e.g., assume a linear relation:
where generally we still might need perm as a function of ϕ, e.g., Carmen–Kozeny or Jackson and James.
- As a reference, our basic models for PAC used previously [8]:
- Deff-0 = Dm for sinusoids (with ϕ0 = 0.7854)
- Deff-0 = 0.1 Dm for tissue (with ϕ0 = 0.2382)
So, these are reasonable adjustments of molecular diffusion for these ϕ choices.
These lead to a linear porosity adjustment with fibrosis as:
Deff = (ϕ/ϕ0) Deff-0 for each of our tissue and sinusoid choices for Deff-0 (with Deff-0 = 0.1 Dm and Deff-0 = Dm, respectively). Typically, we have for an extensive fibrosis:
for tissue and sinusoid, respectively. For a moderate fibrosis, the ratio will be as follows:
2.4. Fibrotic Effects on Reaction
The role of fibrosis (or fiber deposition) on our kinetic rate processes is to limit accessibility, as the fibers are not involved directly in the reactions of interest. The continuum assumption of complete mixing which defines the base reaction rate can be expected to overestimate the rate as fibrosis levels increase. This concept has been discussed in detail when upscaling porous media bimolecular reactions by [45,46].
More concretely, non-classical fractal reaction kinetics can be expected with behavior on percolation networks [47,48,49,50,51] which generally takes two forms: rate constants with power law time dependence for transient processes, and anomalous reaction orders (very high powers) for steady state kinetics. These have been demonstrated with explicit drug metabolism application cases by numerous authors [52,53,54,55].
3. Methods: Upscaling Flow and Metabolism Properties for Single Lobule
Our original structure was a 256 × 256 × 49 DLA lobule with the dimensions of 6 × 10−4 × 6 × 10−4 × 6 × 10−4 cm3, see Table 1 and Table 2 for details. The z-layer alternates between the sinusoid layer with a thickness of 6 × 10⁻⁴ cm and tissue layer with a thickness of 12 × 10−4 cm. Because of the DLA method used for sinusoid generation, each realization can result in a small but observable variation of flow results and spatial profiles. These comments also hold for any upscaling, fibrosis realizations, and deformation models we present below. When comparing models, we always ensure that initial volumes in place are compatible, although not specifically presented.
We use a standard DLA algorithm that randomly clusters a specified number of particles (here Npar) with aggregation particle size (dp × dp − pixel2). As shown in Figure 1A, green dots represent no particle on that site (to be used as hepatocytes) and red dots represent a particle on the site (to be used as sinusoids). For this case, we used Npar = 350 and dp = 1 pixel for both central and corner sinusoid networks. A more detailed explanation of the process is described in [8].
To address fibrosis in the lobule, we introduced two different scales of fibrosis, implicit and explicit fibrotic properties. All sites, regardless of sinusoid or hepatocytes, will have implicit fibrotic properties to account for fine scale (smaller than grid size) collagen fibril deposition.
Explicit fibrotic grid cells (collagen fibers on the scale of grid size) are introduced using the same DLA algorithm with the two conditions: (a) they are hepatocyte cells and (b) are in proximity of the sinusoid networks [56]. As shown in Figure 1B, blue dots represent the cells with explicit fibrotic properties. Depending on the severity of fibrosis, the value of Npar will be different to produce different fibrotic structures. Here Npar = 1000. This value has been calculated based on the percentage of number of explicit fibrotic sites to sum of explicit and implicit hepatic sites. For all extreme cases that are discussed here, the percentage is about 30%.
Note that in our DLA method, we always simulate aggregation of a particle with a size 1 pixel2 for both sinusoid and fibrotic structures. Parkinson et al. [31,32] discussed how the final aggregated structure would change by increasing the particles’ size. Specifically, they increased the particle size in one direction (e.g., 1 × 10 pixel2) and found that the resulting structures were aggregated in one direction rather than spreading out areally, as expected in a normal DLA distribution.
Creating a 7-lobule structure with the above dimensions is computationally demanding. Therefore, we decided to upscale our geometry in order to represent an actual lobule but in a smaller size. This should be done carefully as the new smaller lobule is required to have similar geometrical and fluid properties as the original one. The process of upscaling also affects the fluid properties used in a grid as it now flows through different grid size structures. Therefore, it is necessary to upscale the sinusoidal properties such as permeability, porosity, and diffusion to effective values that reproduce similar results as the original structures. It is worthwhile to note that in this scenario, the tissue properties (including tissue diffusion coefficients and reaction rates) would not be expected to change as there is no flow upscaling in tissue cells.
To preserve the same volume as the original 256 × 256 × 49 lobule, we created a 90 × 90 × 37 lobule with an upscaled dimension for each grid cell as 17 × 10−4 × 17 × 10−4 × 13 × 10−4 cm3 (x × y × z, respectively).
We note that in the upscaling process, one needs to upscale the corresponding parameters aerially and vertically, capturing the geometrical properties of the lobule. As stated, the lobule structure is generated in layers with variable thicknesses.
Therefore, for aerial upscaling of the sinusoidal permeability:
and for the vertical upscaling of the sinusoidal permeability:
Here, 17 × 10−4 cm is divided into 6 × 10⁻⁴ cm for sinusoid and 11 × 10−4 cm for tissue thicknesses.
Furthermore, the porosity will be modified as:
Here α, β, and γ are exponents determined by the geometry properties of the structure and = = . Since our lobule structures are generated by DLA algorithm, we follow [57] to upscale these properties properly. Again, after many rounds of simulation, we find the best parameters that approximately reproduce the original non-scaled results can be obtained by choosing α ≈ 5, β ≈ 2, and γ ≈ 0.3. See Table 1 and Table 2 for calculated values.
4. Methods: Comparison Simulations for Single Lobule
Starting with our original fine-scale DLA single lobule model (270 × 270 × 49 grid [8]), we consider upscaling both non-fibrotic and fibrotic cases. After many rounds of simulation, we find the best parameter choice to encompass a sinusoid upscaled structure will be a DLA model with a 90 × 90 × 37 DLA lobule with the dimensions described in Table 1 and Table 2. The notation (270 × 270 × 49) and upscaled (90 × 90 × 37) indicates the base 3D Cartesian grid dimensions considered, although the areal shapes are converted to hexagonal lobule-like patterns using null non-active grid cells—see Supplementary Materials S1 and S2 for explicit representations of this technique. As discussed more completely in our original 3D DLA model [8], the third-dimension accounts for varying densities of sinusoids vertically, and are created independently using the DLA method. The different grid sizes contain the same lobule volumes in all our comparative 3D models.
We compare in Figure 1, the permeability spatial distribution for a single base case regular hexagonal lobule with six portal veins and one central artery at our two levels of discretization, without and with fibrosis. Here, a DLA-created sinusoid network is shown along with two levels of DLA-explicit fibrosis densities: (1A) 0%, (1B) 50%. Note the change in scale maximum (i.e., reduction) with fibrosis (Figure 1A versus Figure 1B) for the fine-scale model as well as the coarse-scale versions (Figure 1C versus Figure 1D). In our simulations, we have considered numerous levels of fibrosis up to a very cirrhotic liver, but we report only a typical fibrotic state here. The case with zero fibrosis has been analyzed in detail in our previous paper [8].
To generate DLA structures for the upscaled lobule, we used Npar = 40 and dp = 1 pixel for both central and corner sinusoid networks. A similar method has been used for the fibrotic cases.
Figure 2 shows the resultant effects of fibrosis on reactive O2 spatial distribution for these comparative cases, following the methods and oxygen parameters of our earlier paper. It is clear our upscaling methods produce essentially equivalent profiles. The impacts of these O2 profiles on drug distributions and reactions are explored in detail in the following sections using our appropriately upscaled multi-lobule models. Here, steady O2 profiles essentially distribute quite evenly throughout the lobule in the non-fibrotic base case (see Figure 2A,C), due in part to the large O2 diffusion coefficient. In contrast, low levels of O2 distribute in the fibrotic example, (see Figure 2B,D), run under the same pressure gradient boundary condition. Again, importantly, our upscaling method predicts equivalent profiles.
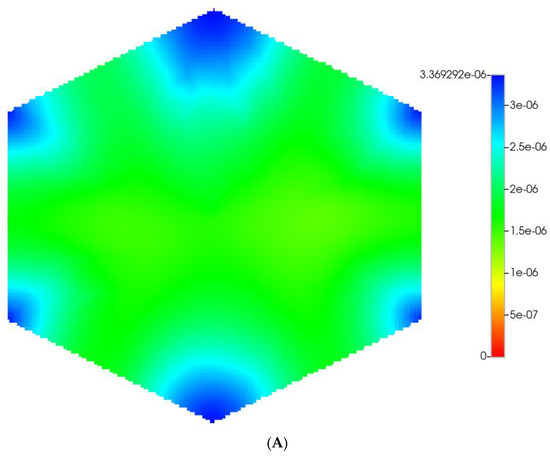
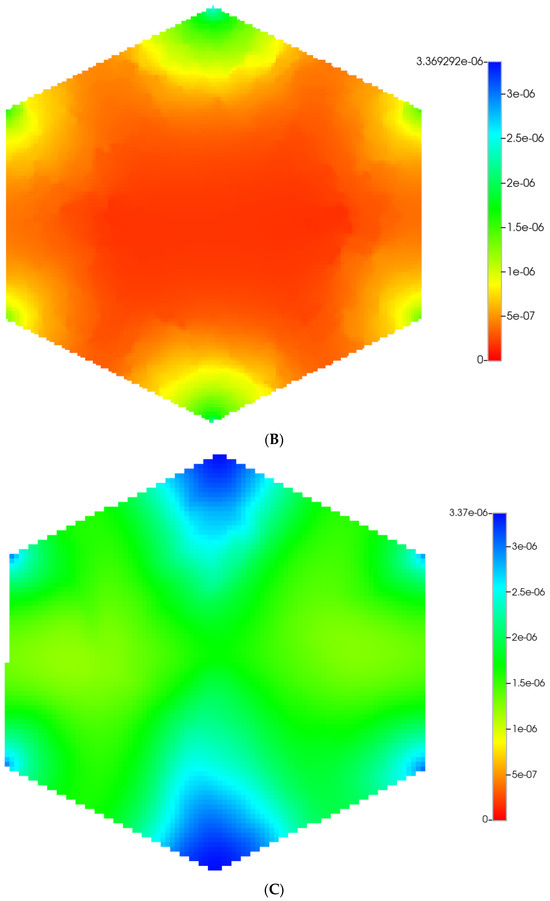
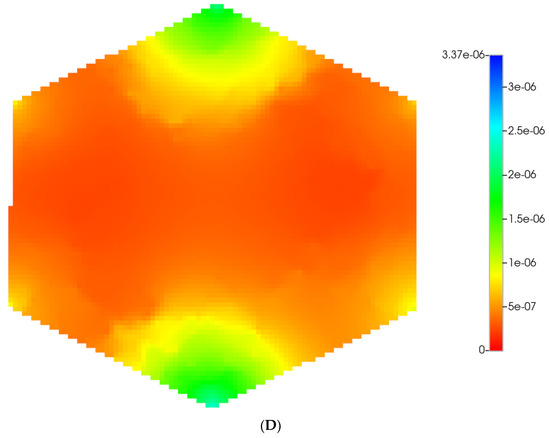
Figure 2.
(A) Reactive O2 spatial profiles, concentration (units mole-fraction), for regular base case (270 × 270 × 49 grid) hexagonal lobule. (B) Reactive O2 spatial profiles, concentration (units mole-fraction), for regular (270 × 270 × 49 grid) hexagonal lobule with progressive fibrosis. (C) Reactive O2 spatial profiles, concentration (units mole-fraction), for regular upscaled (90 × 90 × 37 grid) hexagonal lobule. (D) Reactive O2 spatial profiles, concentration (units mole-fraction), for regular upscaled (90 × 90 × 37 grid) hexagonal lobule with progressive fibrosis.
Figure 3 shows the resultant effects of fibrosis effects on overall flow and O2 production behavior, again utilizing a matched pressure boundary condition. Here, as demonstrated in Figure 3A, fibrosis significantly reduces the flow rate across the lobule for a given specified injection/production pressure gradient, dependent on fibrosis level. Correspondingly, Figure 3B shows the level of produced O2 also varies with fibrosis level and applied boundary condition. Low fibrotic flow rates lead to low O2 production while matched flow rates lead to high O2 production and lower O2 utilization. This is consistent with the steady O2 distributions across the lobule as shown in Figure 2. Although not shown explicitly, the flows shown in Figure 3 for the upscaled single lobule models are essentially identical with the fine-scale model flows. The impacts of these changes with fibrosis on convective and dispersive flows on drug distributions and reactions are also highlighted in the following multi-lobule sections.
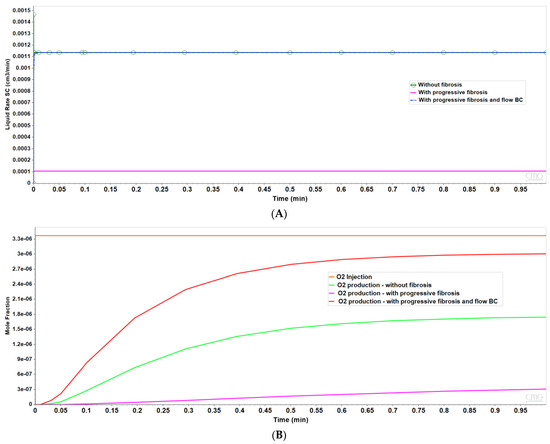
Figure 3.
(A) Flow rates comparing base case and upscaled regular lobule with and without fibrosis. (B) Metabolized O2 production rates comparing base case and upscaled regular lobule with and without fibrosis.
Two idealized flow boundary conditions can be envisioned to capture the effects of fibrosis and contrast with the non-fibrosis base case. The first is to maintain the same pressure differential as with no fibrosis, as shown in Figure 2 and Figure 3. This results in predicted flow rates that are significantly reduced, with the reduction dependent on the amount of fibrosis. A second boundary condition approach is to specify flow rates comparable to the non-fibrosis case. This results in large increases in portal injection pressures, with the pressure increase dependent on the amount of fibrosis. This also results in different O2 utilization. The first boundary condition (pressure gradient fixed to non-fibrotic gradient) and the second boundary condition (flow rates fixed to non-fibrotic rates) can be used to illustrate different fibrosis consequences in the multiple lobule cases.
Clinically observed fibrosis effects can be expected to be a combination of both effects. Indeed, the liver utilizes various mechanisms to overcome fibrotic flow restrictions. This includes the induction of vasio-active chemicals such as nitric oxide, and a redistribution of hepatic artery to portal vein flows (see [58]). Both would lead to time-dependent flow behavior, indicating a change in appropriate boundary conditions at different stages of fibrosis. A switch from pressure boundary conditions to flow boundary conditions might occur as these mechanisms become active. This latter mechanism can even lead to oscillatory rate/pressure flow behavior [58], which could provide a third mixed-boundary condition we might consider in the future.
Although our simulations have considered both methods, here we will display selected results from either case while commenting on the missing behaviors in order to save space. The next section considering the regular 7-lobule pattern will highlight the matched pressure boundary condition results, while the following section considering the irregular distorted lobule pattern will highlight results utilizing the matched flow boundary condition. While differing in detail, behaviors from missing plots in each section can be visualized by utilizing the corresponding plots from the alternate section.
5. Multi-Lobule Upscaled Tissue Model—Fibrosis and No Distortion
To extend this analysis to tissue-like scale, we next develop a multi-lobule hexagonal tissue model invoking seven connected DLA hexagonal lobules into a hexagon tissue pattern. Other authors have considered flows on a similar hexagon tissue pattern [15]. Again, a base Cartesian grid is considered with null non-active grid cells utilized to convert the areal shape to a 7-hexagonal lobule-like pattern, as shown below. DLA-derived independent sinusoid densities are generated in the third dimension for each lobule.
To construct seven regular hexagonal lobule systems, we implemented a method based on the technique discussed on the ‘Red Blob Games’ website for creating a hexagonal grid system (Ref: https://www.redblobgames.com/grids/hexagons/ (accessed on 10 April 2022)). We started by selecting a set of points indicating corners for the central hexagon and then proceeded to construct the neighboring hexagons as a result.
Here, we first utilize the same DLA techniques outlined above to generate sinusoid and explicit fibrotic patterns for the 7-hexagonal lobule pattern. This is conducted at the same scale as our upscaled single lobule system, implying that the upscaled parameters previously derived are used directly here. Figure 4A,B illustrate the resulting multi-lobule spatial patterns. Note for the multi-lobule case, there are 24 injector (portal) wells with 7 peri-central production wells, all of which are affected by the variable near-well sinusoidal patterns. These again result in O2 spatial distributions reflecting the impact of fibrosis. In the interest of conciseness, these distributions are not shown explicitly here.
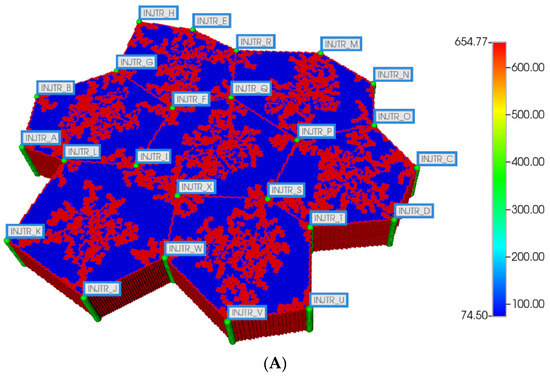
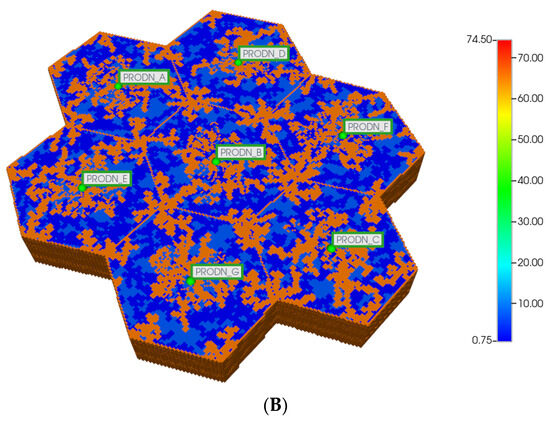
Figure 4.
(A) Regular 7-hexagonal lobules with DLA sinusoids: permeability distribution (units mD) where red are sinusoids and blue are normal tissue. (B) Regular 7-hexagonal lobules with progressive fibrosis: permeability distribution (units mD) where orange are sinusoids, dark blue are explicit fibrotic tissue, and light blue are implicit fibrotic tissue.
All multi-lobule spatial plots have all these injector/producer sites active, although normally not indicated for simplicity. Here, Figure 4A also indicates explicitly the injector well locations while Figure 4B indicates explicitly the producer well locations.
However, as discussed in detail by others and our earlier paper [8], O2 distribution directly impacts metabolic zonation of the liver lobules. In particular, CYP drug-metabolizing enzymes are zoned, such that higher enzyme levels can be expected in the peri-central region of each lobule. Figure 5A,B demonstrate the predicted relative spatial distributions of this enzyme for the non-fibrotic and progressive fibrotic cases, using matched pressure boundary condition. (Note the negligible CYP levels in sinusoid areas). Inter-lobule variability of enzyme expression is seen clearly in Figure 5A, where higher levels of CYP expression, corresponding to lower O2 distribution, are noted in three of the seven lobules. With higher fibrosis levels, a general increase in CYP enzyme expression is observed, especially in the peri-portal regions of each lobule (Figure 5B) under pressure boundary conditions. This is attributed to the overall decrease in O2 availability with this boundary condition. In contrast, the flow boundary condition results in much higher levels of oxygen leading to overall low expression of the CYP enzyme (not shown explicitly).
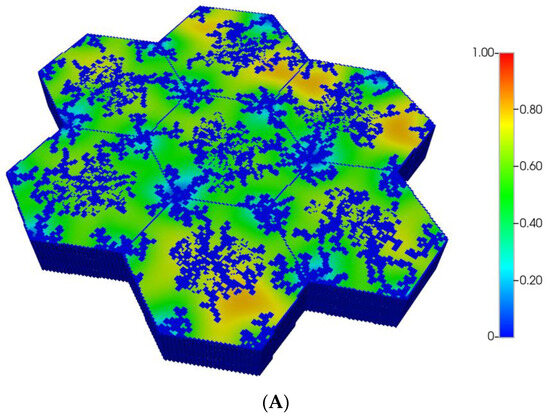
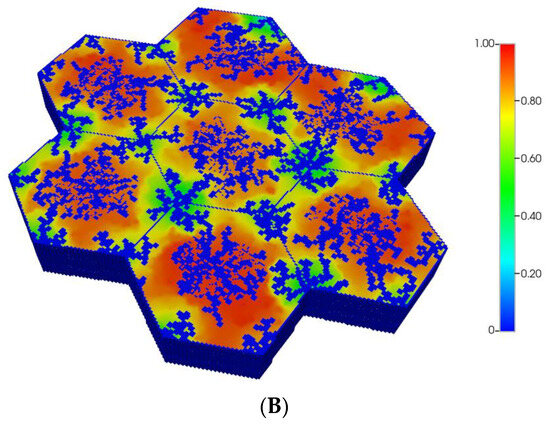
Figure 5.
(A) CYP enzyme spatial profiles, concentration (units normalized), for regular 7-hexagonal lobules. (B) CYP enzyme spatial profiles, concentration (units normalized), for regular 7-hexagonal lobules with progressive fibrosis.
Based on these distributions, Figure 6A,B demonstrate the predicted relative spatial distributions of the PAC-reacted metabolite PACOH for the non-fibrotic and progressive fibrotic cases, respectively. In Figure 6A, the unreacted PAC distributions are the mirror images of these distributions, such that the sum of these two values equal the injected PAC concentration locally (assumed 1.8 × 10⁻⁸ mole fraction injected) as steady concentration profiles are achieved. Figure 6A shows high levels of unreacted PAC (low levels of PACOH) surrounding all portal injection points. Generally, there is extensive conversion to PACOH throughout the remaining portions of the multi-lobule regions.
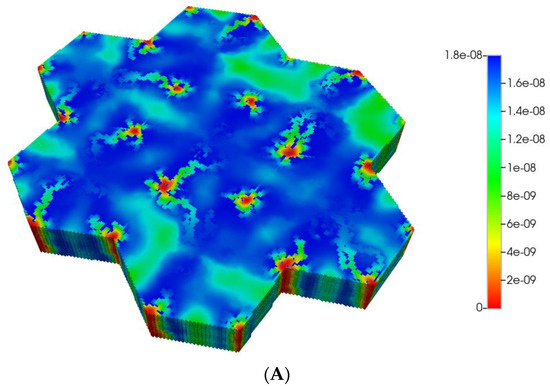
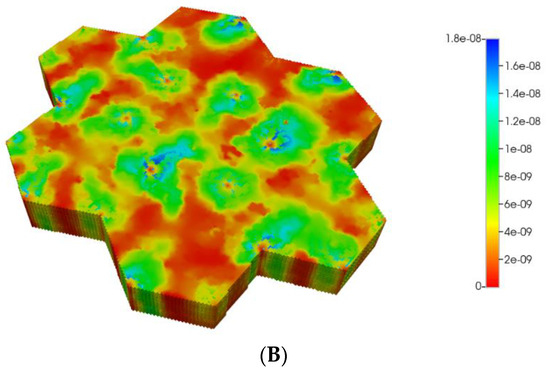
Figure 6.
(A) Reactive PACOH spatial profiles, concentration (units mole-fraction), for regular 7-hexagonal lobules and diffusion. (B) Reactive PACOH spatial profiles, concentration (units mole-fraction), for regular 7-hexagonal lobules with progressive fibrosis and diffusion.
Steady profiles are not yet achieved for the fibrotic case of Figure 6B as much as lower levels of injected PAC occur by this same time point due to the lower fibrotic flow rates. Spatial zonation is still obvious, however. The lower O2 distributions caused by fibrosis should eventually lead to a higher expression of the zoned CYP enzyme and thus an increased metabolic conversion of PAC to PACOH. The use of a matched flow boundary condition increases the reactive PACOH distribution significantly.
The magnitude of diffusion flow has a further large impact on the zonation profiles. The above spatial profiles assume essentially molecular diffusion constants for PAC and PACOH (and that fibrosis has a minor effect on these values). Alternatively, we could assume nanoparticle-sized drug delivery vehicles for PAC, employed to overcome the very low molecular solubility of PAC in water or blood. Examples of such nanoparticles include the standard Taxol micelle vehicle (with size 13 nm diameter [59]) or other even larger nanoparticle formulations with sizes approaching 200 nm [60], or other block co-polymer formulations [61].
Such formulations would imply an almost negligible diffusion contribution to flow, both with and without fibrosis (see our earlier discussion on diffusion of large particles through porous media). Figure 7A,B show the predicted PACOH metabolite distributions under the condition of negligible diffusive flows and matched pressure boundary condition, with a further marked reduction in PACOH levels. This is especially apparent for the fibrotic case. Again, however, there is still an observable zonation effect throughout. The use of a matched flow boundary condition increases the reactive PACOH distribution significantly, approaching more closely that of the non-fibrosis case. The spatial distributions are different, however, as fibrosis alters flow paths.
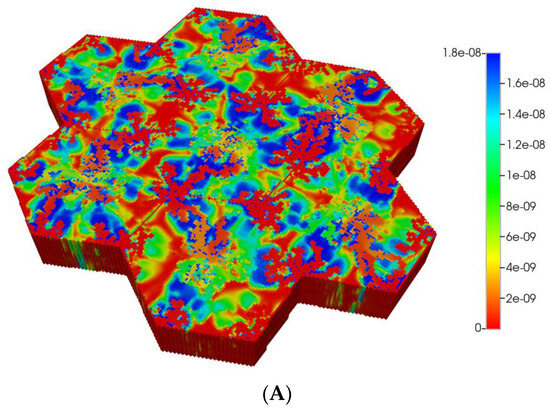
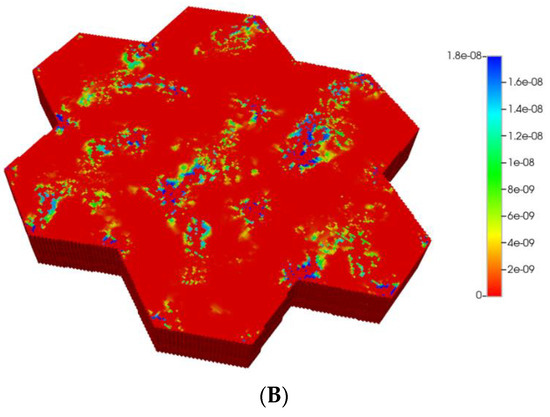
Figure 7.
(A) Reactive PACOH spatial profiles, concentration (units mole-fraction), for regular 7-hexagonal lobules with limited diffusion. (B) Reactive PACOH spatial profiles, concentration (units mole-fraction), for regular 7-hexagonal lobules with progressive fibrosis and limited diffusion.
Figure 8A compares observed flow rates for the seven peri-central producers for the non-fibrotic and fibrotic cases. Summation of these individual well rates would produce curves equivalent to Figure 3A, except with total rates approximately 7 times the earlier single lobule results (not shown explicitly). Figure 8A further illustrates that the fibrotic case with pressure gradient matching the non-fibrotic case results in significantly reduced flows. Alternatively, the fibrotic case employing matched flow boundary conditions results in increased peri-portal injection pressures for all 24 injectors with some individual variability (Figure 8B).
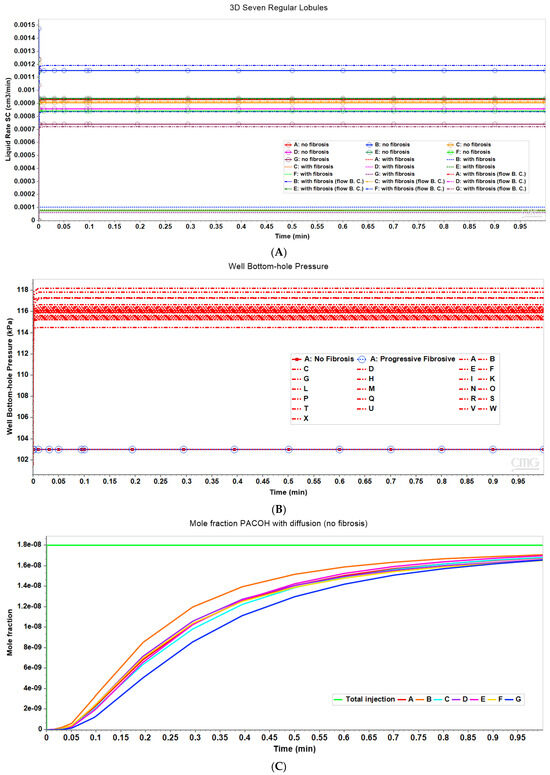
Figure 8.
(A) Production flow rates comparing regular 7-hexagonal lobules with and without fibrosis. (B) Peri-portal injection pressures comparing regular 7-hexagonal lobules with and without fibrosis. (C) Metabolized PACOH drug production rates (with diffusion) for regular 7-hexagonal lobules without fibrosis.
Figure 8C shows PACOH production behavior with diffusion for non-fibrotic case. The variation between producer well concentrations are a result of the variation in individual well flow rates shown in Figure 8A. Similar concentration production plots for the non-fibrotic case with limited diffusion (not shown explicitly) demonstrate similar behavior but with concentration levels approximately one-third that of that shown in Figure 8C. Note the flow rates shown in Figure 8A are applicable to both cases.
With matched pressure gradient boundary condition, the corresponding comparative PACOH plots for the fibrotic case over the same time period show concentration levels roughly equivalent to the first 1/10th time period of Figure 8C. This is again due to fibrotic flow rates being approximately 1/10th that of the non-fibrotic case (see Figure 8A). Conversely, the matched flow boundary condition results in PACOH production profiles similar to Figure 8C, except that fibrosis can somewhat alter the ordering of the dominant PACOH producing wells. These plots are not shown explicitly here.
6. Multi-Lobule Upscaled Tissue Model—Fibrosis with Distortion
Lobule distortion is a normal characteristic of liver structure—see [62]. Furthermore, normal body motion can cause further distortion of the relatively soft liver organ. Here, we investigate the flow consequences of the distorted multi-lobule hexagonal tissue patterns.
Using the constructed platform for the seven regular hexagonal lobule systems as discussed above, the irregular lobule is created by randomly relocating corners of each hexagon. The new location of corners of seven hexagons is determined by an input parameter setting a maximum offset value. Each corner will be displaced randomly from the original regular hexagon locations within the range of zero to the maximum offset.
We then utilize the same DLA techniques outlined above to generate sinusoid and explicit fibrotic patterns for the distorted 7-hexagonal lobule pattern. Figure 9A,B illustrate the resulting multi-lobule spatial patterns. These again result in O2 spatial distributions reflecting the impact of fibrosis (not shown explicitly). As mentioned previously, all multi-lobule spatial plots also have all injector/producer sites active, although normally not indicated for simplicity. Here, Figure 9A also indicates explicitly the injector well locations while Figure 9B indicates explicitly the producer well locations.
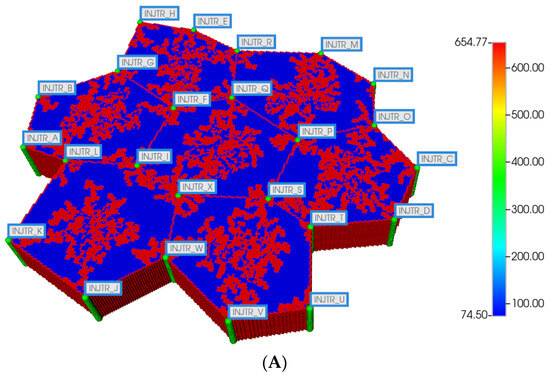
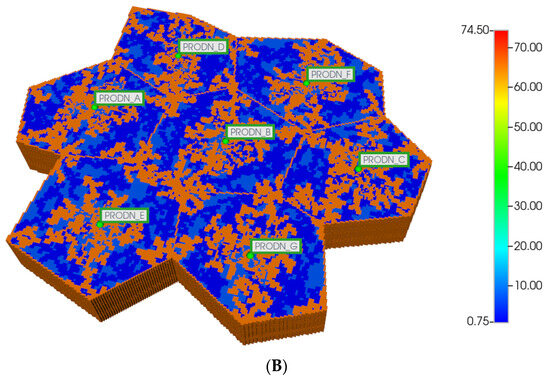
Figure 9.
(A) Distorted 7-hexagonal lobules with DLA sinusoids: permeability distribution (units mD) where red are sinusoids and blue are normal tissue. (B) Distorted 7-hexagonal lobules with progressive fibrosis: permeability distribution (units mD) where orange are sinusoids, dark blue are explicit fibrotic tissue, and light blue are implicit fibrotic tissue.
The resultant predicted relative spatial distributions of the CYP enzyme for the non-fibrotic and progressive fibrotic cases are shown in Figure 10A,B, employing the matched flow boundary condition. In addition to the negligible CYP levels in sinusoid areas, all cases illustrate larger inter-lobule variability of enzyme expression in the distorted 7-lobule pattern relative to the regular 7-lobule case, especially in one corner lobule. With higher fibrosis level, the flow boundary condition results in much higher levels of oxygen leading to overall low expression of the CYP enzyme (see Figure 10B), except in one corner lobule. In contrast, a general increase in CYP enzyme expression is observed, especially in the peri-portal regions of each lobule under pressure boundary conditions. This is attributed to the overall decrease in O2 availability with this boundary condition.
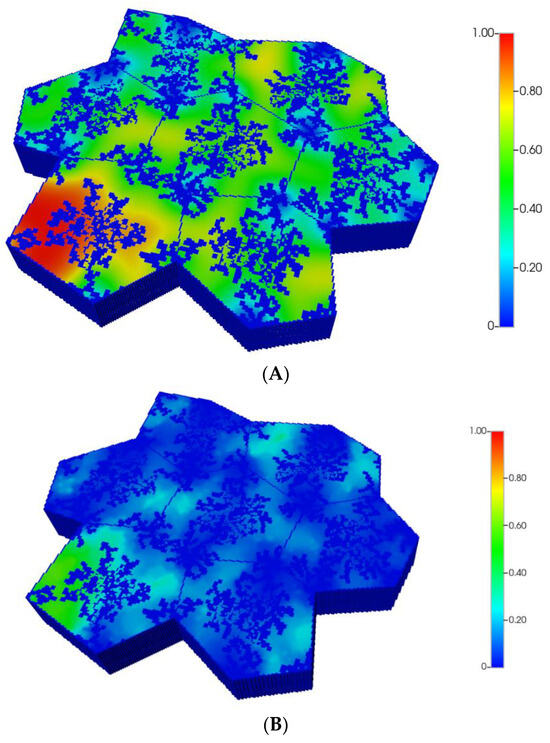
Figure 10.
(A) CYP enzyme spatial profiles, concentration (units normalized), for distorted 7-hexagonal lobules. (B) CYP enzyme spatial profiles, concentration (units normalized), for distorted 7-hexagonal lobules with progressive fibrosis (flow B. C.).
Based on these distributions, Figure 11A,B demonstrate the predicted relative spatial distributions of the PAC-reacted metabolite PACOH for the non-fibrotic and progressive fibrotic cases, utilizing matched flow boundary condition. Spatial zonation is clearly observed with the non-fibrotic case. The fibrotic case shows similar but redistributed lower levels of PACOH. Using the pressure boundary condition, lower levels of PACOH are observed in the fibrotic case at this time point, attributed to less injected PAC due to its lower flow rate.
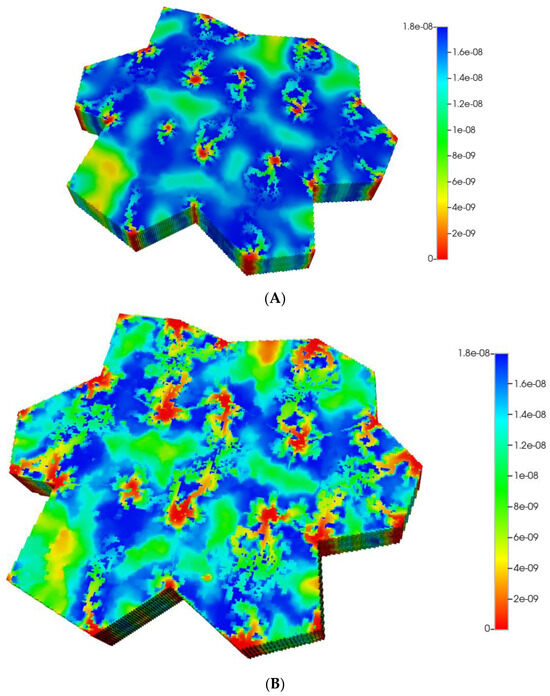
Figure 11.
(A) Reactive PACOH spatial profiles, concentration (units mole-fraction), for distorted 7-hexagonal lobules with diffusion (no fibrosis). (B) Reactive PACOH spatial profiles, concentration (units mole-fraction), for distorted 7-hexagonal lobules with progressive fibrosis and diffusion (flow BC).
The magnitude of diffusion flow is also investigated here. The above profiles assume essentially molecular diffusion constants for PAC and PACOH. The alternative case of negligible diffusion contribution to flow, with and without fibrosis, are shown for comparison in Figure 12A,B, here applying the matched flow boundary condition. These clearly show near injection well contributions to the overall spatial profiles. The reactive PACOH distribution with fibrosis is similar to that of the non-fibrosis case. The spatial distributions are different, however, as fibrosis alters flow paths. With the matched pressure boundary condition, low levels of PACOH are seen throughout the lobules.
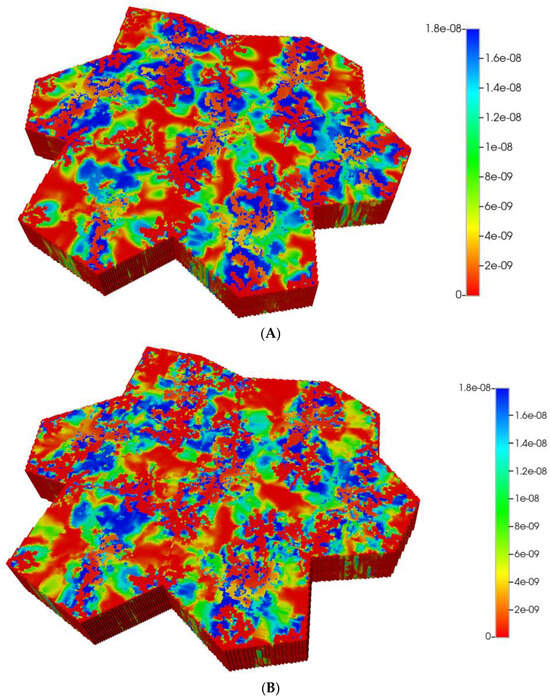
Figure 12.
(A) Reactive PACOH spatial profiles, concentration (units mole-fraction), for distorted 7-hexagonal lobules with limited diffusion. (B) Reactive PACOH spatial profiles, concentration (units mole-fraction), for distorted 7-hexagonal lobules with progressive fibrosis and limited diffusion (flow B. C.).
Figure 13A compares observed flow rates for the 7 peri-central producers for the non-fibrotic and fibrotic cases. A wider variation in flows is seen between the individual wells, relative to the undistorted 7-hexagonal lobule pattern. Again, summation of these individual well rates would produce curves equivalent to Figure 3A, except with total rates approximately 7 times the earlier single lobule results (not shown explicitly).
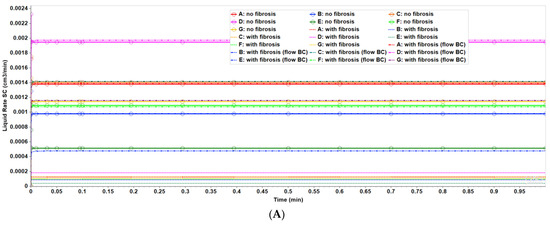
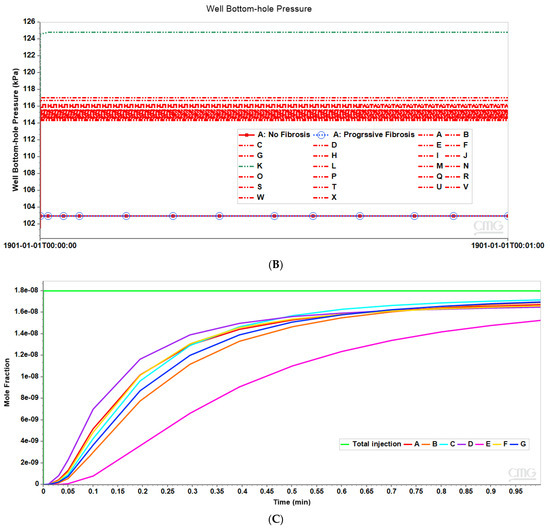
Figure 13.
(A) Production flow rates comparing distorted 7-hexagonal lobules with and without fibrosis. (B) Peri-portal injection pressures comparing distorted 7-hexagonal lobules with and without fibrosis. (C) Metabolized PACOH drug production rates with diffusion for distorted 7-hexagonal lobules without fibrosis.
Figure 13A further illustrates that the fibrotic case with pressure gradient matching the non-fibrotic case results in significantly reduced flows, while the fibrotic case with matched flows results in increased peri-portal injection pressures for all 24 injectors with some individual variability (Figure 13B). In particular, injector K shows a significantly higher peri-portal pressure, attributed to a combination of local reduced sinusoid connectivity plus local distortion. The distinct spatial distributions of various species around this well have been noted above.
Figure 13C shows PACOH production behavior with diffusion for the non-fibrotic case. The wider variation between producer well concentrations relative to the regular 7-hexagonal case are a result of the wider variation in individual well flow rates shown in Figure 13A. Similar concentration production plots for the non-fibrotic case with limited diffusion (not shown explicitly) demonstrate similar behavior but with concentration levels approximately one-third that of that shown in Figure 13C. Note the flow rates shown in Figure 13A are applicable to both cases.
When applying a matched pressure gradient boundary condition, the corresponding comparative PACOH plots for the fibrotic case over the same time period show concentration levels roughly equivalent to the first 1/10th time period of Figure 13C. This is again due to fibrotic flow rates being approximately 1/10th that of the non-fibrotic case (see Figure 13A). Conversely, the matched flow boundary condition results in PACOH production profiles similar to Figure 13C, except that fibrosis can significantly alter the ordering of the dominant producing location—here, production well D and production well E reverse their roles of dominant and least dominant PACOH producers, for example. These plots are not shown explicitly here.
Comparing the multi-lobule liver functional unit results, without and with distortion, gives a good indication of wider variation of inter-lobule variability with distortion (see particularly Figure 8A,B, versus Figure 13A,B). This seems reasonable physically, but because of the inherent variation in DLA property calculation, a more detailed analysis of model generation and statistics is required to completely establish this conclusion.
7. Conclusions
This paper explores the effects and basic consequences of fibrosis on fundamental liver processes (fluid flow, metabolism), presented at the scale of a multi-lobule liver functional unit utilizing several upscaling concepts. While faster computers can continuously allow larger gridded problems to be simulated, the use of consistent upscaling concepts allows a more complete understanding of the fundamental physical processes underlying any calculated result.
Multi-scale modeling approaches to fibrosis has been previously reviewed in depth [63,64]. In this article, we have emphasized how liver fibrosis and deformation affects fluid flow paths, zonation, and drug metabolism/toxicity. This has been conducted by a careful and consistent upscaling of single lobule results to a multi-lobule unit, both without and with deformation. Our analysis focuses on the consequences of fibrosis at two hypothetical time points (pre-fibrous and long-time fibrous state), applying contrasting boundary conditions which may also vary over time. Similarly, deformation is treated as an instantaneous process with no further dynamical responses.
Our grid-based approach to the fibrosis modeling approach considers two scales of fibrosis—implicit (rescaling of grid flow parameters) and explicit (DLA generated localized fibrotic grid cells). With these assumptions, we have investigated the consequences of fibrosis and deformation on drug distribution and metabolism. Oxygen distribution can affect zonation which affects drug metabolism. Fibrosis effects on flow and diffusion can affect both oxygen and drug distribution, leading to feedback loops. Deformation further distorts these interacting processes.
Our multi-lobule results indicate that upscaling single lobule process representations require a distribution of reactive flow parameters to capture the variability of multi-lobule behavior. Consideration of deformed structures results in a further increase in variability. Our deformed multi-lobule pattern provides a useful, efficient upscaling methodology to capture the interactions of a large number of factors, some of which we have treated here. While there are a multitude of mechanisms involved in how the liver responds to inflammation and fibrosis, we feel each must be represented in a numerical model to best quantify their individual contributions. To date, our results indicate the liver lobule system is remarkably flexible and resilient to various instabilities generated via inflammation (within reason) by redistribution of flows.
We recognize that novel mechanistic details provided by recent experiments on liver tissue constructs form a useful basis for future quantitative analysis of fibrosis and fibrotic evolution [23,24,25]. Although conducted at spatial scales approximately consistent with a single lobule size, these experiments do not incorporate the effects of sinusoidal flow paths. Instead, they rely on simple diffusional transport of compounds and hence omit a critical temporal feature. Our numerical approach will provide a useful method to incorporate such missing flow effects.
Two appendices provide a further perspective on how our current modeling approach fits into a more extensive investigation of the implication of fibrosis on drug response. The dynamic evolution of fibrosis over weeks/months requires a more mechanistic model, dynamically tracking numerous extra species (e.g., collagen, cytokines, and cell types) as described in Supplementary Material S1. The mechanical application of instantaneous loads and the further dynamic evolution of deformation via stress relaxation is described simply in Supplementary Material S2. Both areas are topics for future work and can be computationally intensive.
Further extension to larger tissue and organ scales in a computationally efficient manner requires a dual continuum upscaling technique to efficiently capture all mechanisms, as we have recently demonstrated [65].
Supplementary Materials
The following supporting information can be downloaded at: https://www.mdpi.com/article/10.3390/pr12091789/s1, File S1: Simple mechanistic fibrosis model—single DLA lobule; File S2: Mechanical loading response—single DLA lobule with fibrosis. References [66,67,68,69,70,71,72,73,74,75,76,77,78,79,80,81] are cited in the supplementary materials.
Author Contributions
V.R.: Coding and performing simulations, writing, analysis; C.W.: Coding; D.C.: Writing, analysis; J.A.T.: Writing, analysis. All authors have read and agreed to the published version of the manuscript.
Funding
This research received no external funding.
Conflicts of Interest
Author Dennis Coombe was employed by the Computer Modeling Group Inc., Calgary. The remaining authors declare that the research was conducted in the absence of any commercial or financial relationships that could be construed as a potential conflict of interest.
List of Variables
| Concentration (/cm3) | c |
| Density (mole/cm3) | ρ |
| Diffusion constant (cm2/min) | D |
| Permeability (cm2) | K |
| Areal permeability (cm2) | KH |
| Vertical permeability (cm2) | KV |
| Porosity | ϕ |
| Radius (cm) | r |
| Tortuosity | τ |
References
- Hernandez-Gea, V.; Friedman, S.L. Pathogenesis of Liver Fibrosis. Annu. Rev. Pathol. Mech. Dis. 2011, 6, 425–456. [Google Scholar] [CrossRef] [PubMed]
- Schuppan, D.; Afdhal, N. Liver cirrhosis. Lancet 2008, 371, 838–851. [Google Scholar] [CrossRef]
- Li, N.Y.K.; Verdolini, K.; Clermont, G.; Mi, Q.; Rubinstein, E.N.; Hebda, P.A.; Vodovotz, Y. A Patient-Specific in silico Model of Inflammation and Healing Tested in Acute Vocal Fold Injury. PLoS ONE 2008, 3, e2789. [Google Scholar] [CrossRef]
- Georges, P.C.; Hui, J.-J.; Gombos, Z.; McCormick, M.E.; Wang, A.Y.; Uemura, M.; Mick, R.; Janmey, P.A.; Furth, E.E.; Wells, R.G. Increased stiffness of the rat liver precedes matrix deposition: Implications for fibrosis. Am. J. Physiol. Liver Physiol. 2007, 293, G1147–G1154. [Google Scholar] [CrossRef] [PubMed]
- Rezania, V.; Coombe, D.; Tuszynski, J. Liver bioreactor design issues of fluid flow and zonation, fibrosis and mechanics: A computational perspective. J. Funct. Biomater. 2019, 11, 13. [Google Scholar] [CrossRef] [PubMed]
- Rezania, V.; Marsh, R.; Coombe, D.; Tuszynski, J. A physiologically-based flow network model for hepatic drug elimination I: Regular lattice lobule model. Theor. Biol. Med Model. 2013, 10, 52. [Google Scholar] [CrossRef]
- Rezania, V.; Marsh, R.; Coombe, D.; Tuszynski, J. A physiologically-based flow network model for hepatic drug elimination II: Variable lattice lobule models. Theor. Biol. Med Model. 2013, 10, 53. [Google Scholar] [CrossRef]
- Rezania, V.; Coombe, D.; Tuszynski, J.A. A physiologically-based flow network model for hepatic drug elimination III: 2D/3D DLA lobule models. Theor. Biol. Med Model. 2016, 13, 9. [Google Scholar] [CrossRef]
- Gaudio, E.; Chaberek, S.; Montella, A.; Pannarale, L.; Morini, S.; Novelli, G.; Borghese, F.; Conte, D.; Ostrowski, K. Fractal and Fourier analysis of the hepatic sinusoidal network in normal and cirrhotic rat liver. J. Anat. 2005, 207, 107–115. [Google Scholar] [CrossRef]
- Bonfiglio, A.; Leungchavaphongse, K.; Repetto, R.; Siggers, J.H. Mathematical Modeling of the Circulation in the Liver Lobule. J. Biomech. Eng. 2010, 132, 111011. [Google Scholar] [CrossRef]
- Siggers, J.H.; Leungchavaphongse, K.; Ho, C.H.; Repetto, R. Mathematical model of blood and interstitial flow and lymph production in the liver. Biomech. Model. Mechanobiol. 2014, 13, 363–378. [Google Scholar] [CrossRef] [PubMed][Green Version]
- Debbaut, C.; Vierendeels, J.; Siggers, J.; Repetto, R.; Monbaliu, D.; Segers, P. A 3D porous media liver lobule model: The importance of vascular septs and anisotropic permeability for homogeneous perfusion. Comput. Methods Biomech. Biomed. Eng. 2014, 17, 1295–1310. [Google Scholar] [CrossRef]
- Hu, J.; Lü, S.; Feng, S.; Long, M. Flow dynamics analyses of pathophysiological liver lobules using porous media theory. Acta Mech. Sin. 2017, 33, 823–832. [Google Scholar] [CrossRef]
- Ricken, T.; Dahmen, U.; Dirsch, O. A biphasic model for liver perfusion remodeling after outflow obstruction. Biomech. Model. Mechanobiol. 2010, 9, 435–450. [Google Scholar] [CrossRef] [PubMed]
- Ricken, T.; Werner, D.; Holtzhutter, H.; Konig, M.; Dahmen, U.; Dirsch, O. Modeling function-perfusion behaviour in liver lobules including tissue, blood, glucose, lactate and glycogen by use of a coupled two-scale PDE-ODE approach. Biomech. Model. Mechanobiol. 2015, 14, 515–536. [Google Scholar] [CrossRef] [PubMed]
- Ricken, T.; Lambers, J. On computational approaches of liver lobule function and perfusion simulation. GAMM-Mitteilungen 2019, 42, e201900016. [Google Scholar] [CrossRef]
- Debbaut, C.; Vierendeels, J.; Casteleyn, C.; Cornillie, P.; Van Loo, D.; Simoens, P.; Van Hoorebeke, L.; Monbaliu, D.; Segers, P. Perfusion Characteristics of the Human Hepatic Microcirculation Based on Three-Dimensional Reconstructions and Computational Fluid Dynamic Analysis. J. Biomech. Eng. 2012, 134, 011003. [Google Scholar] [CrossRef]
- Peeters, G.; Debbaut, C.; Cornillie, P.; De Schryver, T.; Monbaliu, D.; Laleman, W.; Segers, P. A Multilevel Modeling Framework to Study Hepatic Perfusion Characteristics in Case of Liver Cirrhosis. J. Biomech. Eng. 2015, 137, 051007. [Google Scholar] [CrossRef]
- Peeters, G.; Debbault, C.; Friebal, A.; Cornillie, P.; DeVos, W.; Favere, K.; VanderElst, I.; Vandercasteele, T.; Johann, T.; VanHoorebeke, L.; et al. Quantitative analysis of hepatic macro- and microvasculature alterations during cirrhogenesis in the rat. J. Anat. 2018, 232, 485–496. [Google Scholar] [CrossRef]
- Jungermann, K.; Keitzmann, T. Zonation of Parenchymal and Nonparenchymal Metabolism in Liver. Annu. Rev. Nutr. 1996, 16, 179–203. [Google Scholar] [CrossRef]
- Keitzmann, T. Metabolic zonation of the liver: The oxygen gradient revisited. Redox. Biol. 2017, 11, 622–630. [Google Scholar] [CrossRef] [PubMed]
- Rosmorduc, O.; Housset, C. Hypoxia: A link between fibrogenesis, angiogenesis, and carcinogenesis in liver disease. Semin. Liver Dis. 2000, 30, 258–270. [Google Scholar] [CrossRef] [PubMed]
- Ma, X.; Qu, X.; Zhu, W.; Li, Y.S.; Yuan, S.; Zhang, H.; Liu, J.; Wang, P.; Lai, C.S.E.; Zanella, F.; et al. Deterministic patterned biomimetic human iPSC-derived hepatic model via rapid 3D bioprinting. Proc. Natl. Acad. Sci. USA 2016, 113, 2206–2211. [Google Scholar] [CrossRef]
- Norona, L.; Nguyen, D.; Gerber, D.; Presnell, S.; LeCluyse, E. Modeling compound-induced fibrogenesis in vivo using three-dimensional bioprinted human liver tissues. Toxicol. Sci. 2016, 35, 1709–1721. [Google Scholar]
- Norona, L.; Nguyen, D.; Gerber, D.; Presnell, S.; Mosedale, M.; Watkins, P. Bioprinted liver provides early insight into the role of Kupffer cells in TGF-b1 and methotrexate-induced fibrogenesis. PLoS ONE 2019, 14, e0208958. [Google Scholar] [CrossRef] [PubMed]
- Hulmes, J.; Miller, A. Quasi-hexagonal packing in collagen fibrils. Nature 1979, 282, 878–880. [Google Scholar] [CrossRef] [PubMed]
- Hulmes, J.; Wess, T.; Prockop, D.; Fratzi, P. Radial packing, order, and disorder in collagen fibrils. Biophys. J. 1995, 68, 1661–1670. [Google Scholar] [CrossRef]
- Silver, D.; Miller, R.; Harrison, R.; Prockop, D. Helical model of nucleation and propagation to account for the growth of type I collagen fibrils from the symmetrical pointed tips. Proc. Natl. Acad. Sci. USA 1992, 689, 9860–9864. [Google Scholar] [CrossRef]
- Buehler, M. Atomistic and continuum modeling of mechanical properties of collagen: Elasticity, fracture and self-assembly. J. Mater. Res. 2006, 21, 1947–1961. [Google Scholar] [CrossRef]
- Buehler, M.J. Nature designs tough collagen: Explaining the nanostructure of collagen fibrils. Proc. Natl. Acad. Sci. USA 2006, 103, 12285–12290. [Google Scholar] [CrossRef]
- Parkinson, J.; Kadler, K.; Brass, A. Self-assembly of rodlike particles in two dimensions: A simple model for model of collagen fibrogenesis. Phys. Rev. E 1994, 50, 2963–2966. [Google Scholar] [CrossRef]
- Parkinson, J.; Kadler, K.; Brass, A. Simple Physical Model of collagen fibrogenesis based on diffusion limited aggregation. J. Mol. Biol. 1994, 247, 823–831. [Google Scholar] [CrossRef]
- Parkinson, J.; Brass, A.; Canova, G.; Brechet, Y. The mechanical properties of simulated collagen fibrils. J. Biomech. 1997, 30, 549–554. [Google Scholar] [CrossRef] [PubMed]
- Onori, P.; Morini, S.; Franchitto, A.; Sferra, R.; Alvaro, D.; Gaudio, E. Hepatic microvascular features in experimental cirrhosis: A structural and morphometrical study in CCl4-treated rats. J. Hepatol. 2000, 33, 555–563. [Google Scholar] [CrossRef] [PubMed]
- Bear, J. Dynamics of Fluids in Porous Media; Elsevier: New York, NY, USA, 1972. [Google Scholar]
- Tsai, D.; Streider, W. Effective conductivities of random fibrous beds. Chem. Eng. Commun. 1986, 40, 207–218. [Google Scholar] [CrossRef]
- Higdon, J.J.L.; Ford, G.D. Permeability of three-dimensional models of fibrous porous media. J. Fluid Mech. 1996, 308, 341–361. [Google Scholar] [CrossRef]
- Pedersen, J.A.; Boschetti, F.; Swartz, M.A. Effects of extracellular fiber architecture on cell membrane shear stress in a 3D fibrous matrix. J. Biomech. 2007, 40, 1484–1492. [Google Scholar] [CrossRef] [PubMed]
- Costa, A. Permeability-porosity relationship: A reexamination of the Kozeny-Carman equation based on a fractal pore-space geometry assumption. Geophys. Res. Lett. 2006, 33, L02318. [Google Scholar] [CrossRef]
- Zhu, Z.; Wang, Q.; Wu, Q. On the examination of the Darcy permeability of soft fibrous porous media; new correlations. Chem. Eng. Sci. 2017, 173, 525–536. [Google Scholar] [CrossRef]
- Ogston, A.G.; Preston, B.N.; Wells, J.D. On the transport of compact particles through solutions of chain-polymers. Proc. R. Soc. London. Ser. A. Math. Phys. Sci. 1973, 333, 297–316. [Google Scholar] [CrossRef]
- Jackson, G.W.; James, D.F. The permeability of fibrous porous media. Can. J. Chem. Eng. 1986, 64, 364–374. [Google Scholar] [CrossRef]
- Johnson, E.; Berk, D.; Jain, R.; Deen, W. Hindered diffusion in agarose gels: Test of effective medium model. Biophys. J. 1996, 70, 1017–1023. [Google Scholar] [CrossRef]
- Makie, J.; Meares, P. The diffusion of electrolytes in a cation-exchange resin membrane I. Theoretical. Proc. R. Soc. London. Ser. A. Math. Phys. Sci. 1955, 232, 498–509. [Google Scholar]
- Porta, G.M.; Chaynikov, S.; Thovert, J.-F.; Riva, M.; Guadagnini, A.; Adler, P.M. Numerical investigation of pore and continuum scale formulations of bimolecular reactive transport in porous media. Adv. Water Resour. 2013, 62, 243–253. [Google Scholar] [CrossRef]
- Porta, G.; Ceriotti, G.; Thovert, J.F.; Riva, M.; Guadagnini, A.; Adler, P. Comparative assessment of continuum-scale models of bimolecular reactive transport in porous media under pre-asymptotic conditions. J. Contam. Hydrol. 2016, 185–186, 1–13. [Google Scholar] [CrossRef] [PubMed]
- Kopelman, R. Rare processes on fractals: Theory, simulation, and experiments. J. Stat. Phys. 1986, 42, 185–200. [Google Scholar] [CrossRef]
- Newhouse, J.S.; Kopelman, R. Reaction kinetics on clusters and islands. J. Chem. Phys. 1986, 85, 6804–6806. [Google Scholar] [CrossRef]
- Anacker, L.W.; Kopelman, R. Steady-state chemical kinetics on fractals: Segregation of reactants. Phys. Rev. Lett. 1987, 58, 289–291. [Google Scholar] [CrossRef]
- Kopelman, R. Fractal reaction kinetics. Science 1988, 241, 1620–1626. [Google Scholar] [CrossRef]
- Berry, H. Monte Carlo Simulations of Enzyme Reactions in Two Dimensions: Fractal Kinetics and Spatial Segregation. Biophys. J. 2002, 83, 1891–1901. [Google Scholar] [CrossRef]
- Fruite, J.; Marsh, R.; Tuszynski, J. Fractal pharmcokinetics of the drug mibefradil in the liver. Phys. Rev. E 2002, 66, 021904-1–021904-11. [Google Scholar]
- Kosmidis, K.; Karalis, V.; Argyrakis, P.; Macheras, P. Michaelis-Menten Kinetics under Spatially Constrained Conditions: Application to Mibefradil Pharmacokinetics. Biophys. J. 2004, 87, 1498–1506. [Google Scholar] [CrossRef]
- Chelminiak, P.; Marsh, R.; Tuszynski, J.; Dixon, J.; Vos, K. Asymptotic time dependence in the fractal pharmcokinetics of a two-compartment model. Phys. Rev. E 2005, 72, 031903-1–031903-7. [Google Scholar] [CrossRef] [PubMed]
- Marsh, R.E.; Tuszyński, J.A. Fractal Michaelis-Menten Kinetics Under Steady State Conditions: Application to Mibefradil. Pharm. Res. 2006, 23, 2760–2767. [Google Scholar] [CrossRef]
- Dutta-Moscato, J.; Solovyev, A.; Mi, Q.; Nishikawa, T.; Soto-Gutierrez, A.; Fox, I.J.; Vodovotz, Y. A Multiscale Agent-Based in silico Model of Liver Fibrosis Progression. Front. Bioeng. Biotechnol. 2014, 2, 18. [Google Scholar] [CrossRef] [PubMed]
- Meakin, P. Diffusion-controlled cluster formation in 2-6 dimensional space. Phys. Rev. A 1983, 27, 1495–1507. [Google Scholar] [CrossRef]
- Monbaliu, D.R.; Debbaut, C.; Hillewaert, W.J.; Laleman, W.J.; Sainz-Barriga, M.; Pirenne, J.; Segers, P. Flow Competition between Hepatic Arterial and Portal Venous flow during Hypothermic Machine Perfusion Preservation of Porcine Livers. Int. J. Artif. Organs 2012, 35, 119–131. [Google Scholar] [CrossRef]
- Chen, D.; Song, D.; Wientjes, M.G.; Au, J.L.-S. Effect of dimethyl sulfoxide on bladder tissue penetration of intravesical paclitaxel. Clin. Cancer Res. 2003, 9, 363–369. [Google Scholar] [PubMed]
- Kim, T.; Kim, D.; Chung, J.; Shin, S.; Kim, S.; Heo, D.; Kim, N.; Bang, J. Phase 1 and pharmacokinetic study of genexol_PM, a cremophor-free, polymeric micelle-formulated paclitaxel, in patients with advanced malignancies. J. Cont. Release 2001, 72, 3708–3716. [Google Scholar]
- Loverde, S.; Klein, M.; Discher, D. Nanoparticle shape improves delivery: Rational coarse grain dynamics (RGG-MD) of taxol in worm-like PEG-PCL micelles. Adv. Mater. 2011, 24, 3823–3830. [Google Scholar] [CrossRef]
- Teusch, H. The modular microarchitecture of human liver. Hepatology 2005, 42, 317–327. [Google Scholar] [CrossRef] [PubMed]
- Ben Amar, M.; Bianca, C. Towards a unified approach in the modeling of fibrosis: A review with research perspectives. Phys. Life Rev. 2016, 17, 61–85. [Google Scholar] [CrossRef]
- Ben Amar, M.; Bianca, C. Multiscale modeling of fibrosis-What’s next? Reply to Comments on “Towards a unified approach in the modeling of fibrosis: A review with research perspective” by Martine Ben Amar and Carlo Bianca. Phys. Life Rev. 2016, 17, 118–123. [Google Scholar] [CrossRef]
- Coombe, D.; Rezania, V.; Tuszynski, J.A. Dual continuum upscaling of liver lobule flow and metabolism to the full organ scale. Front. Syst. Biol. 2022, 2, 926923. [Google Scholar] [CrossRef]
- Bhattacharya, S.; Shoda, L.; Zhang, Q.; Woods, C.; Howell, B.; Siler, S.; Woodhead, J.; Yang, Y.; McMullen, P.; Watkins, P.; et al. Modeling drug- and chemical-induced hepatoxicity with systems biology approaches. Front. Physiol. 2022, 3, 462. [Google Scholar]
- Lettmann, K.; Hardtke-Wolenski, M. The importance of liver microcirculation in promoting autoimmune hepatitis via maintaining an inflammatory cytokine milieu a mathematical model study. J. Theor. Biol. 2014, 348, 33–46. [Google Scholar] [CrossRef]
- Brown, B.; Price, I.; Toapanta, F.; DeAlmeida, D.; Wiley, C.; Ross, T.; Oury, T.; Vodovotz, Y. An agent-based model of inflammation and fibrosis following particulate exposure in the lung. Math. Biosci. 2011, 231, 186–196. [Google Scholar] [CrossRef] [PubMed]
- Hao, W.; Marsh, C.; Friedman, A. A Mathematical Model of Idiopathic Pulmonary Fibrosis. PloS ONE 2015, 10, e0135097. [Google Scholar] [CrossRef] [PubMed]
- Biot, M.A. General Theory of Three-Dimensional Consolidation. J. Appl. Phys. 1941, 12, 155–164. [Google Scholar] [CrossRef]
- Mow, V.C.; Kuei, S.C.; Lai, W.M.; Armstrong, C.G. Biphasic creep and stress relaxation of articular cartilage in compression? Theory and experiments. J. Biomech. Eng. 1980, 102, 73–84. [Google Scholar] [CrossRef]
- Suh, J.K.; Spilker, R.L. Indentation analysis of biphasic articular cartilage: Nonlinear phenomena under finite deformation. J. Biomech. Eng. 1994, 116, 1–9. [Google Scholar] [CrossRef] [PubMed]
- Raghunathan, S.; Evans, D.; Sparks, J.L. Poroviscoelastic modeling of liver biomechanical response in unconfined compression. Ann. Biomed. Eng. 2010, 38, 1789–1800. [Google Scholar] [CrossRef] [PubMed]
- Perepelyuk, M.; Chin, L.; Cao, X.; van Oosten, A.; Shenoy, V.B.; Janmey, P.A.; Wells, R.G. Normal and Fibrotic Rat Livers Demonstrate Shear Strain Softening and Compression Stiffening: A Model for Soft Tissue Mechanics. PloS ONE 2016, 11, e0146588. [Google Scholar] [CrossRef] [PubMed]
- van Oosten, A.S.G.; Vahabi, M.; Licup, A.J.; Sharma, A.; Galie, P.A.; MacKintosh, F.C.; Janmey, P.A. Uncoupling shear and uniaxial elastic moduli of semiflexible biopolymer networks: Compression-softening and stretch-stiffening. Sci. Rep. 2016, 6, 19270. [Google Scholar] [CrossRef]
- Tran, D.; Settari, A.; Nghiem, L. New iterative coupling between a reservoir simulator and a geomechanics module. SPE J. 2004, 9, 362–369. [Google Scholar] [CrossRef]
- Goulet, G.C.; Hamilton, N.; Cooper, D.M.L.; Coombe, D.; Tran, D.; Martinuzzi, R.; Zernicke, R.F. Influence of vascular porosity on fluid flow and nutrient transport in loaded cortical bone. J. Biomech. 2008, 41, 2169–2175. [Google Scholar] [CrossRef]
- Goulet, G.C.; Cooper, D.M.L.; Coombe, D.; Zernicke, R.F. Influence of cortical canal architecture on lacunocanalicular pore pressure and fluid flow. Comput. Methods Biomech. Biomed. Eng. 2008, 11, 379–387. [Google Scholar] [CrossRef]
- Goulet, G.C.; Cooper, D.M.L.; Coombe, D.; Zernicke, R.F. Poroelastic evaluation of fluid movement through the lacunocanicular system. Ann. Biomed. Eng. 2009, 37, 1390–1402. [Google Scholar] [CrossRef]
- Goulet, G.C.; Cooper, D.M.L.; Coombe, D.; Zernicke, R.F. Validation and application of iterative coupling to poroelastic problems in bone fluid flow. Bull. Appl. Mech. 2009, 5, 6–17. [Google Scholar]
- Louman-Gardiner, K.M.; Coombe, D.; Hunter, C.J. Computational models simulating notochordal cell extinction during early aging of an intervertebral disk. Comput. Methods Biomech. Biomed. Eng. 2011, 14, 1071–1077. [Google Scholar] [CrossRef]


Disclaimer/Publisher’s Note: The statements, opinions and data contained in all publications are solely those of the individual author(s) and contributor(s) and not of MDPI and/or the editor(s). MDPI and/or the editor(s) disclaim responsibility for any injury to people or property resulting from any ideas, methods, instructions or products referred to in the content. |
© 2024 by the authors. Licensee MDPI, Basel, Switzerland. This article is an open access article distributed under the terms and conditions of the Creative Commons Attribution (CC BY) license (https://creativecommons.org/licenses/by/4.0/).