Article

Acid-Etched Fracture Conductivity with In Situ-Generated Acid in Ultra-Deep, High-Temperature Carbonate Reservoirs

1
Engineering Technology Research Institute of Xinjiang Oilfield Company, Karamay 834000, China
2
State Key Laboratory of Petroleum Resources and Engineering, China University of Petroleum, Beijing 102249, China
3
Petroleum Engineering Technology Research Institute, SINOPEC Jianghan Oil field Company, Wuhan 433124, China
*
Author to whom correspondence should be addressed.
Processes 2024, 12(9), 1792; https://doi.org/10.3390/pr12091792
Submission received: 30 July 2024 / Revised: 12 August 2024 / Accepted: 21 August 2024 / Published: 23 August 2024

Abstract

:
In situ-generated acid is commonly employed in ultra-deep, high-temperature carbonate reservoirs during acid fracturing to increase the effective acid penetration distance. However, the variation pattern of acid-etched fracture conductivity with in situ-generated acid has not been systematically studied. This paper investigates the evolution of the conductivity of primary and secondary fractures through a series of experiments involving in situ acid displacement and acid-etched fracture conductivity measurement. Based on the experimental results, a calculation model for the conductivity of acid-etched fractures with in situ-generated acid was established. The study indicates that after acid etching, rough particulate points and grooved dissolution patterns form on the surfaces of primary and secondary fractures, respectively. The dissolution volume in primary fractures is greater than that in secondary fractures, with both showing a linear increase over time. Due to the presence of dissolution grooves on the surfaces of secondary fractures, their conductivity is higher than that of primary fractures under the same acid–rock contact time. The conductivity of both primary and secondary fractures increases with the acid–rock contact time. However, beyond approximately 70 min of contact time, the conductivity of primary fractures shows no significant increase. The conductivity of primary and secondary fractures with in situ-generated acid is slightly lower than that with gelled acid under the same contact time, but significantly higher than that with crosslinked acid. This study provides guidance for the design and parameter optimization of acid fracturing in ultra-deep, high-temperature carbonate reservoirs.

1. Introduction

Acid fracturing is one of the primary stimulation techniques for ultra-deep, high-temperature carbonate reservoirs [1,2]. One of the main challenges in the acid fracturing of these ultra-deep wells is the rapid acid–rock reaction rate, which limits the penetration distance of the acid. In situ-generated acid, or self-generating acid, is a system that is neutral or weakly acidic at surface temperatures but gradually releases hydrogen ions under high reservoir temperatures, increasing its acidity [3]. Due to these characteristics, in situ-generated acid not only provides excellent corrosion inhibition for casing or tubing but also generates acid within the fracture, thereby extending the effective acid penetration distance and enhancing deep fracture conductivity [4,5,6]. It offers significant advantages over conventional acid systems in medium- to high-temperature carbonate reservoirs and is particularly suitable for the ultra-deep wells of high-temperature carbonate reservoirs.
The conductivity of acid-etched fractures is a crucial indicator for evaluating the effectiveness of acid fracturing in carbonate reservoirs, as well as that of hydraulic fracturing in unconventional reservoirs [7,8]. It has been extensively studied both domestically and internationally. Scholars have experimentally examined the impact of geological factors such as temperature, acid leak-off, and closure stress, as well as engineering factors like pumping rate, acid systems, and injection mode on the conductivity of acid-etched fractures. The acid-etched fracture conductivity in reservoirs with complex lithology tends to decrease with the temperature as the degree of differential dissolution of various minerals on the fracture surface decreases, leading to more uniform dissolution [9]. However, the temperature has no obvious effect on the limestone formation [10,11]. With the increase in closure stress, the protrusions on the rough fracture surface tend to crush, which reduces the width of the flow channel, resulting in a decrease in conductivity [12,13,14]. Acid type is also a key factor determining the conductivity of acid-etched fractures. For each type of reservoir, it is possible to identify the most suitable acid type and contact time to achieve sufficient fracture conductivity [15,16]. The in situ-generated acid can release H+ in concentrations as high as 3.18–4.17 mol/L under temperatures of 90–140 degrees. The fracture conductivity with in situ-generated acid is slightly lower than that with gelled acid, but higher than that with the crosslinked acid [17,18,19]. On the other hand, other researchers have focused on developing mathematical models for predicting the conductivity of acid-etched fractures [20,21,22,23]. Treating the rough acid-etched fracture surface as the combination of individual protrusions of varying heights, the ‘nail bed’ model, cylinder model, and other models have been devolved.
Though in situ-generated acid has been studied extensively, the main focus has mostly been on the acid-releasing performance [18,24,25,26] and kinetics of acid rock reaction [17,27]. The conductivity created by in situ-generated acid is only compared with conventional acid, without considering the effect of time, acid concentration, and fracture type. Thus, several areas of acid-etched fracture conductivity with in situ-generated acid still need further exploration: (1) the variation patterns of acid-etched fracture conductivity with in situ-generated acid under conditions of high temperatures (above 160 °C) and high closure stresses; (2) comparative analysis between the fracture conductivity with in situ-generated acid and conventional acids; (3) the variation patterns in conductivity for different types of fractures (primary and secondary fractures) when using in situ-generated acid; and (4) the development of an empirical model for the conductivity of fractures treated with in situ-generated acid. To address these issues, this study conducted a series of acid displacement and conductivity experiments using in situ-generated acid under high-temperature conditions. The study involved selecting appropriate fracture widths for both primary and secondary fractures, consistent with field conditions and typical acid–rock contact times. The surface morphologies of rock plates representing primary and secondary fractures after acid displacement are analyzed. The variation patterns in the conductivity of primary and secondary acid-etched fractures with in situ-generated acid are thoroughly examined. Additionally, the results were compared with those obtained from crosslinked and gelled acids, providing guidance for optimizing the design of acid fracturing in ultra-deep, high-temperature carbonate reservoirs.

2. Acid-Etched Fracture Conductivity Experiment

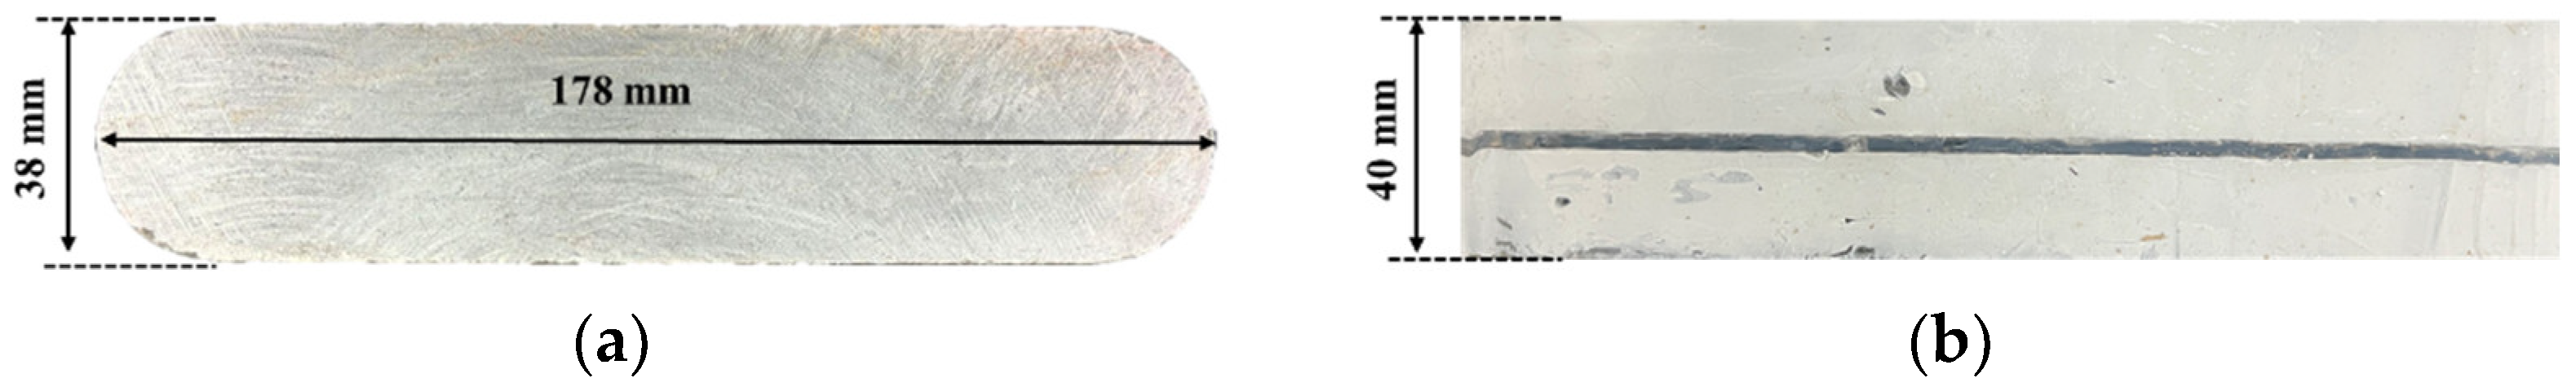
2.1. Specimen Preparation

The sample for the conductivity experiment was collected from the Yijianfang Formation, Tarim Basin, China, with a depth ranging from 8000 m to 8200 m. The X-ray diffraction test was performed to identify the mineral composition of the core sample. The results showed that the core was almost devoid of clay minerals and had an extremely high carbonate mineral content, predominantly calcite, comprising over 90% of the total mineral content. The detailed properties of the rock sample are listed in Table 1. In such high-purity limestone formation, conventional acid fluids rapidly lose reactivity as they flow through fractures, resulting in short effective acid-etched fracture lengths. The core was then processed into slabs the size of the API standard, as shown in Figure 1a. To prevent undesirable acid etching, the slabs were sealed with acidic silicone sealant, with only one side of the surfaces left uncovered. The two rock slabs were placed together with the unsealed surfaces facing each other, and four stainless steel pillars of a certain thickness were used to support them in the middle, thereby forming a fracture between the slabs, as shown in Figure 1b. The fracture was then saturated with brine for 24 h.
The in situ-generated acid used in the experiment is an organic ester-based retarded acid developed by Sinopec Northwest Branch, Urumqi, China. It is formulated by mixing a certain proportion of ester substances such as polyethyl acetate, polylactic acid ester, and methyl formate with ammonium chloride. The in situ-generated acid solution is prepared by mixing 30% of the retarded acid with water and 0.8% thickener. And the gelled acid is formulated with 20% hydrochloric acid and 0.8% thickener. To prepare the crosslinked acid, an additional 0.5% of the crosslinker is added to the gelled acid.

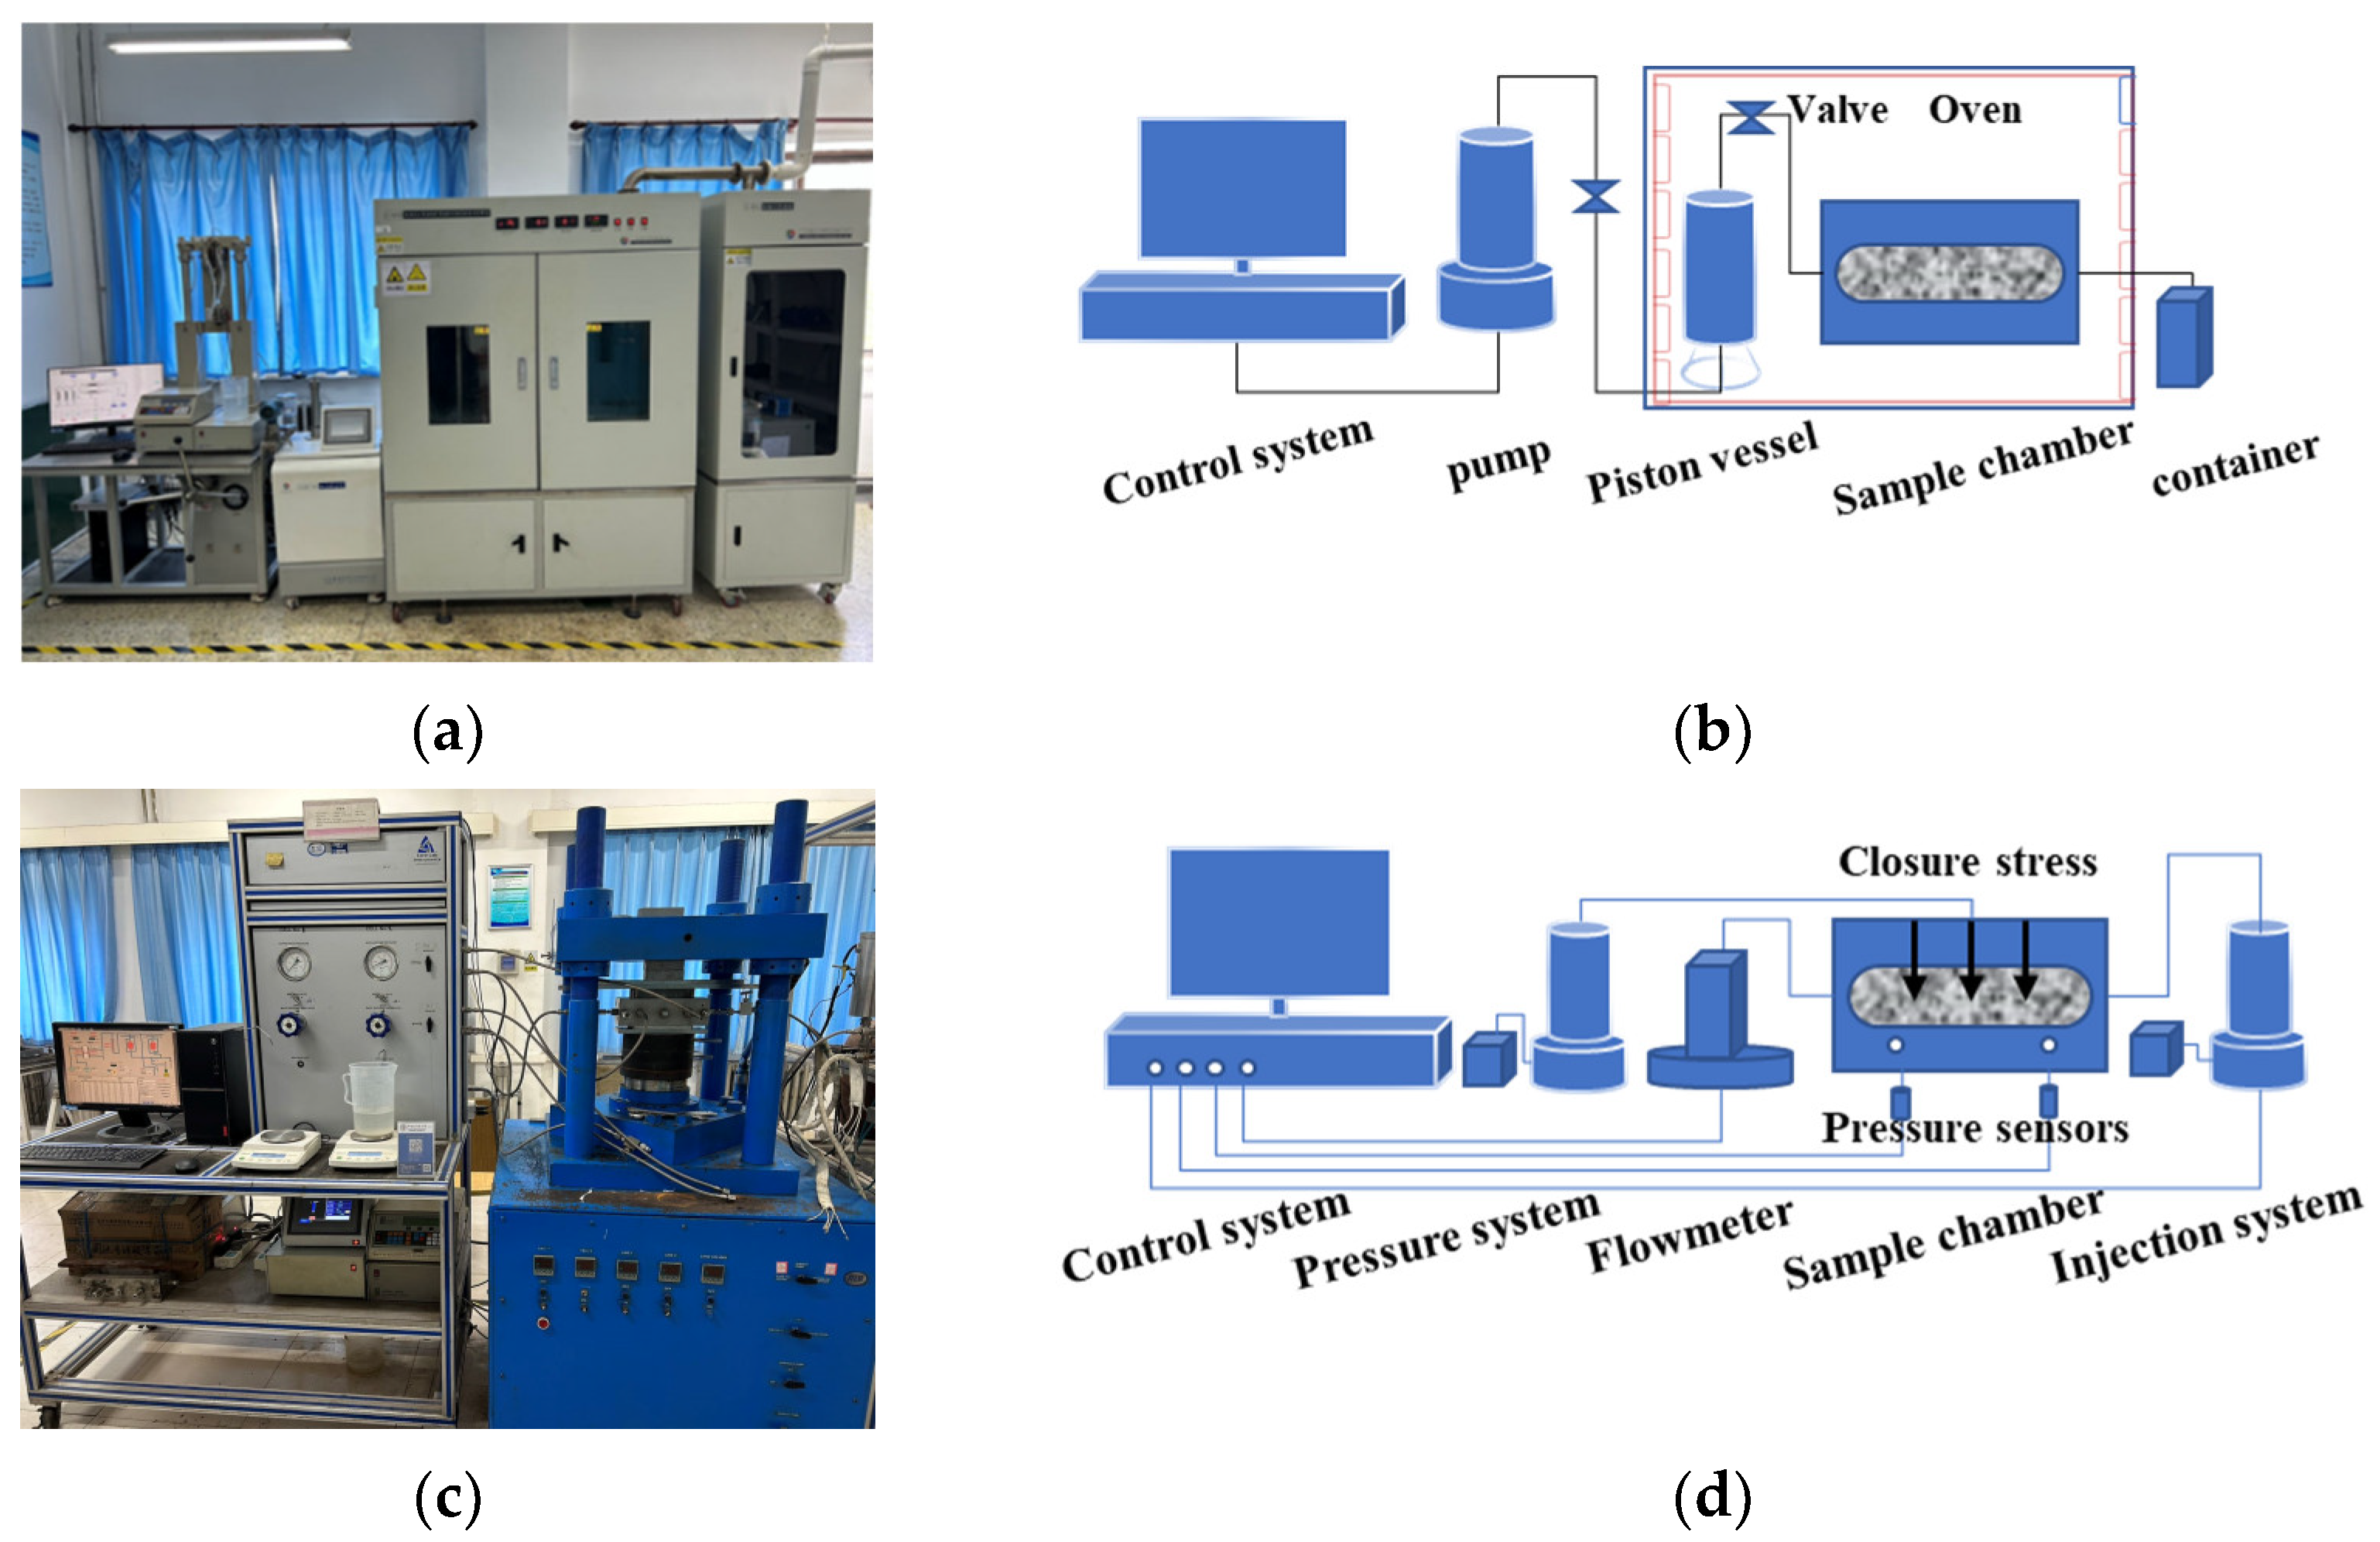
2.2. Experimental Equipment and Procedures

The experiment consists of two parts: (1) In situ-generated acid displacement experiment. In situ-generated acid is prepared and injected at a constant rate into the fracture between the two slabs under the designed temperature. (2) Conductivity test: The conductivity of the acid-etched fracture between two rock plates with in situ-generated acid is measured under different closure stresses to determine the variation pattern of fracture conductivity. In the acid displacement experiment, the high-temperature acid displacement apparatus made by Haian was employed to etch the fracture. The maximum allowed temperature was 200 degrees, and the maximum injection rate was 200 mL/min, as shown in Figure 2a. The main components and their schematic diagram are shown in Figure 2b. The FCES-100 conductivity testing devices made by Core Lab are used for the conductivity test, as shown in Figure 2c. Two key parameters to determine the fracture conductivity are obtained: flowrate through the fracture and the pressure difference between the inlet and outlet through the pressure sensor and flowmeter, as shown in Figure 2d. The fracture conductivity then can be calculated according to Darcy’s law. The equation is presented in Equation (1):
K w f = 5.55 Q u Δ P
where Kwf is the fracture conductivity, D·cm; Q is the flowrate measured by the flowmeter, cm3/min; u is the fluid viscosity, mPa·s; and ∆P is the pressure difference, KPa. For the detailed experiment procedure, readers can refer to [28].

2.3. Experimental Schemes

In order to simulate the ultra-deep high-temperature reservoir condition during acid fracture, parameters related to the fracture type, width, acid concentration, injection rate, and acid–rock contact time should be determined.
(1)
Fracture types: Due to the natural fracture development in the ultra-deep reservoirs, two types of fractures are expected to form during acid fracturing: (i) primary acid-etched fractures, which extend from the wellbore and have a larger aperture and (ii) secondary acid-etched fractures, which are natural fractures with a small aperture and etched by the leak-off acid during the propagation of the primary fracture. This study simulates these fractures by varying the experimental fracture width and acid concentration at the fracture entrance.
(2)
Fracture width in the experiment: The fracture widths of the primary fracture and the secondary fracture are obtained through numerical simulation using a fracture propagation model. The input geological parameters and engineering parameters used in the simulation are the typical values of the Shunbei oil field in the Tarim basin, China [29]. Based on the numerical simulation results of complex fractures, the typical widths of primary and secondary fractures were set at 5 mm and 0.5 mm, respectively.
(3)
Experiment temperature: The experimental temperature was set to the typical temperature of 160 °C in the Yijianfang formation. After the experiment temperature reached the target value, it was maintained for 3 h to ensure thorough heating of the acid fluid and rock slabs.
(4)
Acid concentration at the secondary fracture entrance: Given the strong uncertainty and randomness in the distribution of natural fractures, the concentration of acid at the entrance to the secondary fractures (intersection of primary and secondary fractures) is difficult to predict. In the experiment, the acid concentration at the entrance to the secondary fractures was set to half of that at the entrance to the primary fractures.
(5)
Acid injection rate: The injection rate is determined according to the flow regime similarity [19]. The Reynold’s number of the acid flowing in the fracture in the field condition can be calculated through Equation (2):
N R e , f = ρ a q f 2 μ a h f
where NRe,f is the Reynold’s number; ρa is the density of the acid, kg/m3; ua is the viscosity of acid, Pa·s; qf is the pumping rate, m3/min; and hf is the fracture height, m. The typical fracture height in the Shunbei oil field is 120 m, the pumping rate is 5 m3/min, ua is 0.1 Pa·s, and the density of the acid is 1100 kg/m3. Based on the field data, NRe,f = 229 is obtained, which indicates that the acid flow in the fracture is in the laminar conditions. If the same Reynold’s number is aimed for in the experiment, the injection rate should be 0.46 L/min, which far exceeds the maximum limit of the commonly used laboratory injection pump. The injection rate mainly affects the acid penetration distance. Since we are using rock plates with a length of less than 0.2 m, the whole plate can be etched by the three acid systems, so the influence of the injection rate on the acid penetration distance can be neglected. Based on the analysis, the injection rate is set as 50 mL/min in the experiment. Under such conditions, the acid flow between the rock plates is also in the laminar condition, and a reasonable dissolution volume can also be achieved.
(6)
Acid–rock contact time (injection time) and injection rate: Based on typical acid–rock contact times during field operations, the acid–rock contact times in the experiment were set to range from 20 to 90 min.
In this study, the fracture type, injection time, and acid type were considered, and 16 sets of acid-etched fracture conductivity tests were performed. Samples 1#–8# were tested to explore the in situ acid etching patterns and the conductivity of primary fractures. Samples 9#–12# were tested to examine the in situ acid etching patterns and conductivity of secondary fractures. Samples 13#–16# were tested to compare the effects of the acid type on the fracture conductivity. The detailed experiment scheme is listed in Table 2.

3. Experimental Results and Analysis

The acid-etched fracture conductivity is directly related to the fracture surface morphology after acid etching [30]. Three types of etching patterns have been identified by scholars, i.e., the etching channel, the uniform etching, and the pitted etching. The fracture surface morphology depends on various factors, including acid type, viscosity, injection rate, and rock type [31]. In this experimental study, the injection rate and the rock type are the same for all the samples. The acid type and the viscosity are the main contributors to the acid-etched fracture surface morphology. More specifically, the acid type and viscosity affect the overall acid–rock reaction speed, leading to different dissolution volumes. Thus, in the following analysis, the dissolution volume and the acid-etched surface morphology are discussed in the first place, and then the corresponding acid-etched fracture conductivity is analyzed.

3.1. Variation Pattern of Acid-Etched Fracture Conductivity in Primary Fractures with In Situ-Generated Acid

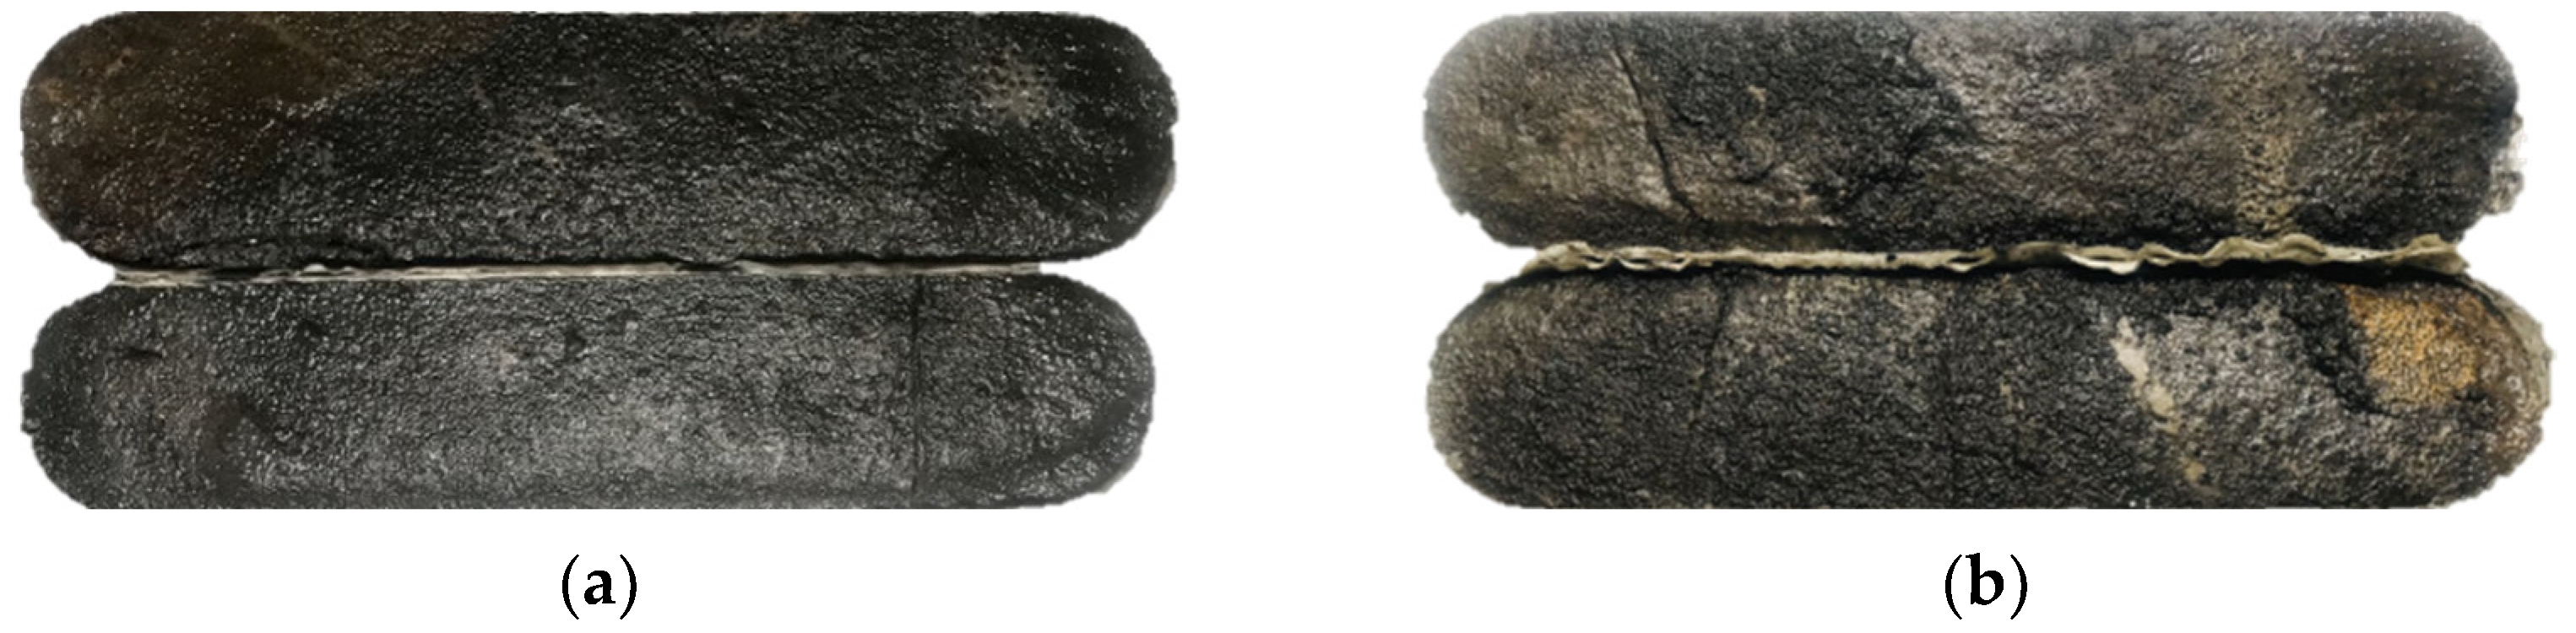
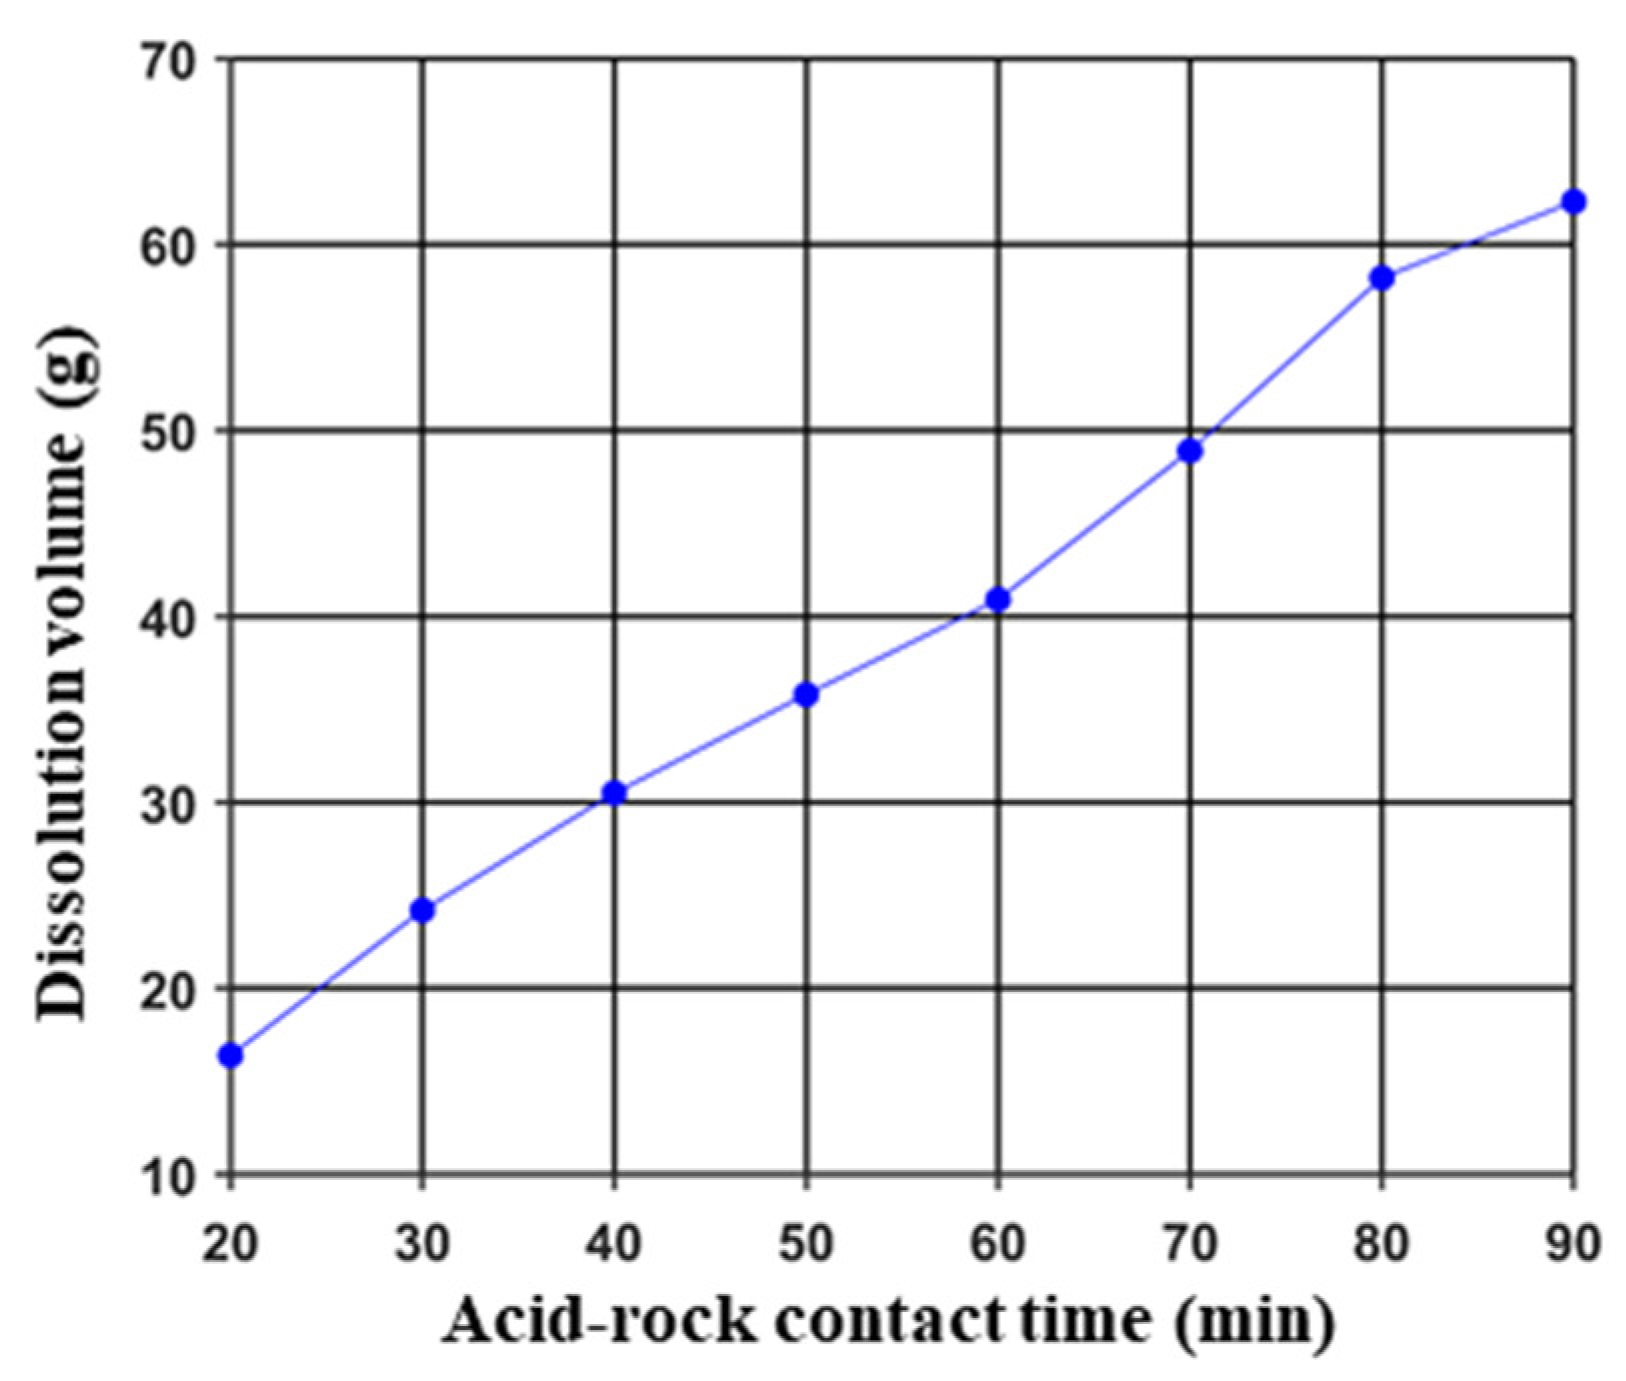
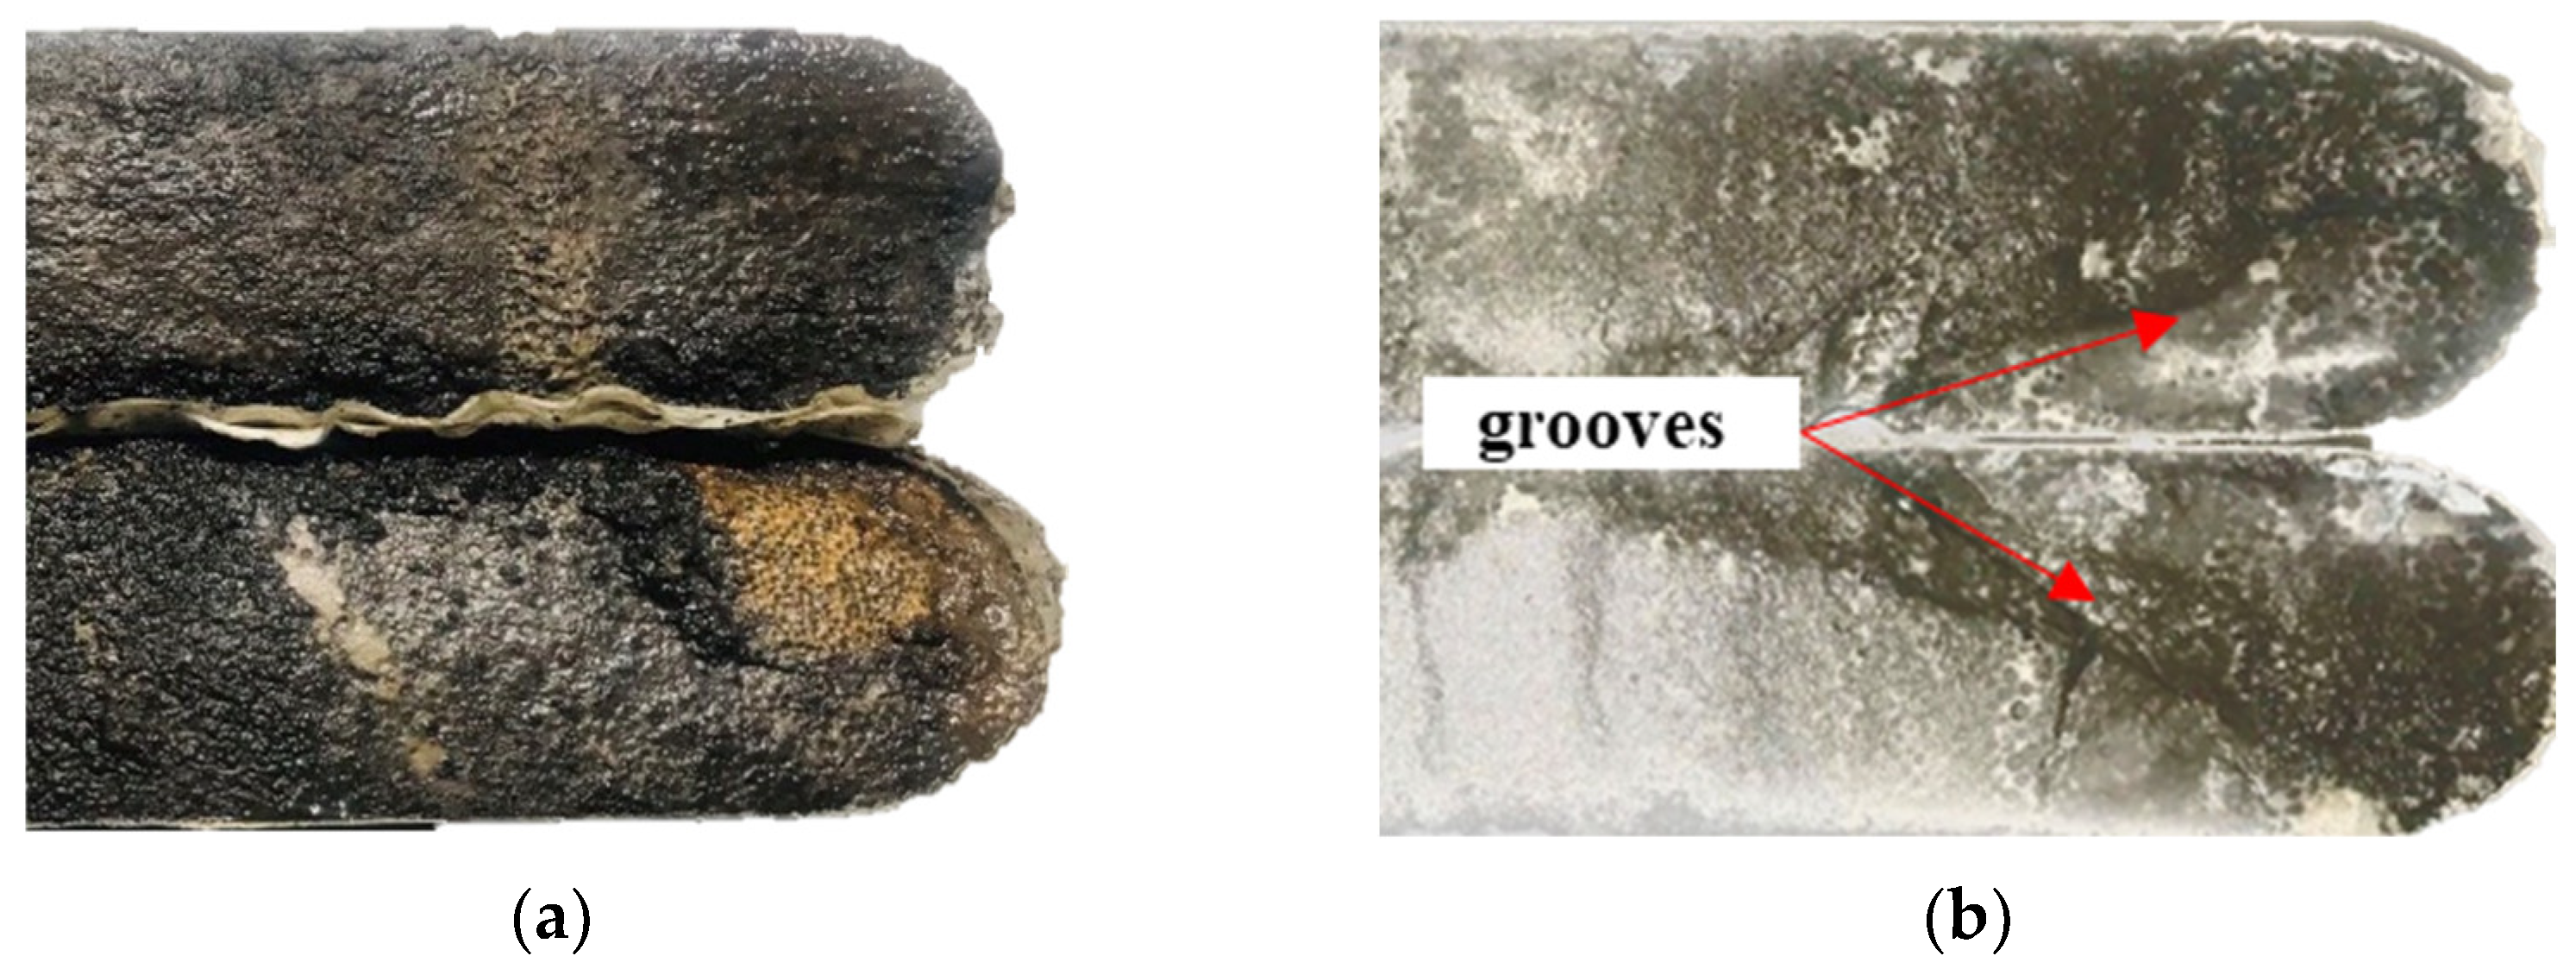
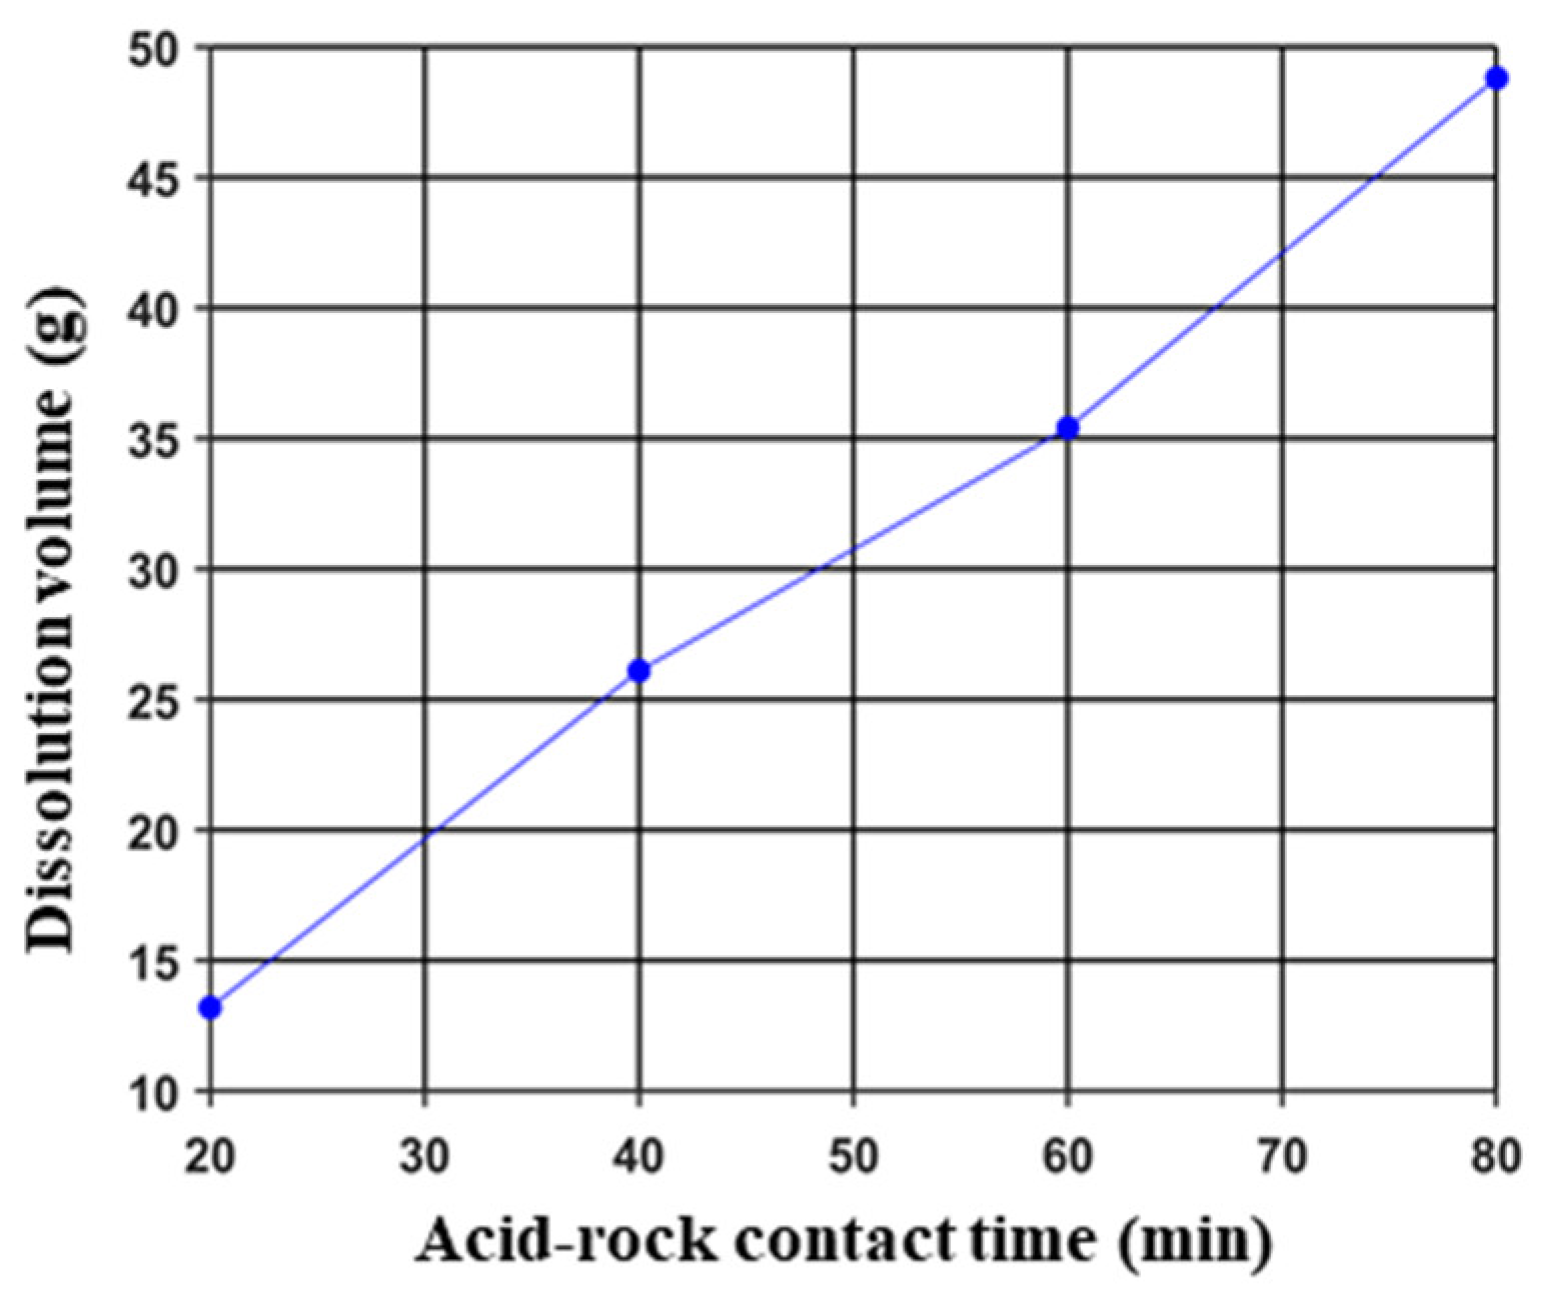
3.1.1. Acid-Etched Surface Morphology and Dissolution Volume

The surface morphology of primary fractures after etching with in situ-generated acid is shown in Figure 3. The fracture surface becomes rougher after acid displacement, with a large number of densely packed particulates forming. As the acid–rock contact time increases from 20 min to 90 min, the dissolution volume increases, and the roughness of the rock surface rises significantly.
The dissolution volume in the primary fractures increases with the acid–rock contact time, showing an approximately linear trend, as illustrated in Figure 4. As the contact time increases from 20 min to 90 min, the dissolution volume of the primary fractures rises from 16.4 g to 62.3 g. The dissolution volume at 80 min is slightly higher than the trend predicted, which is caused by the heterogeneity of the rock plates.

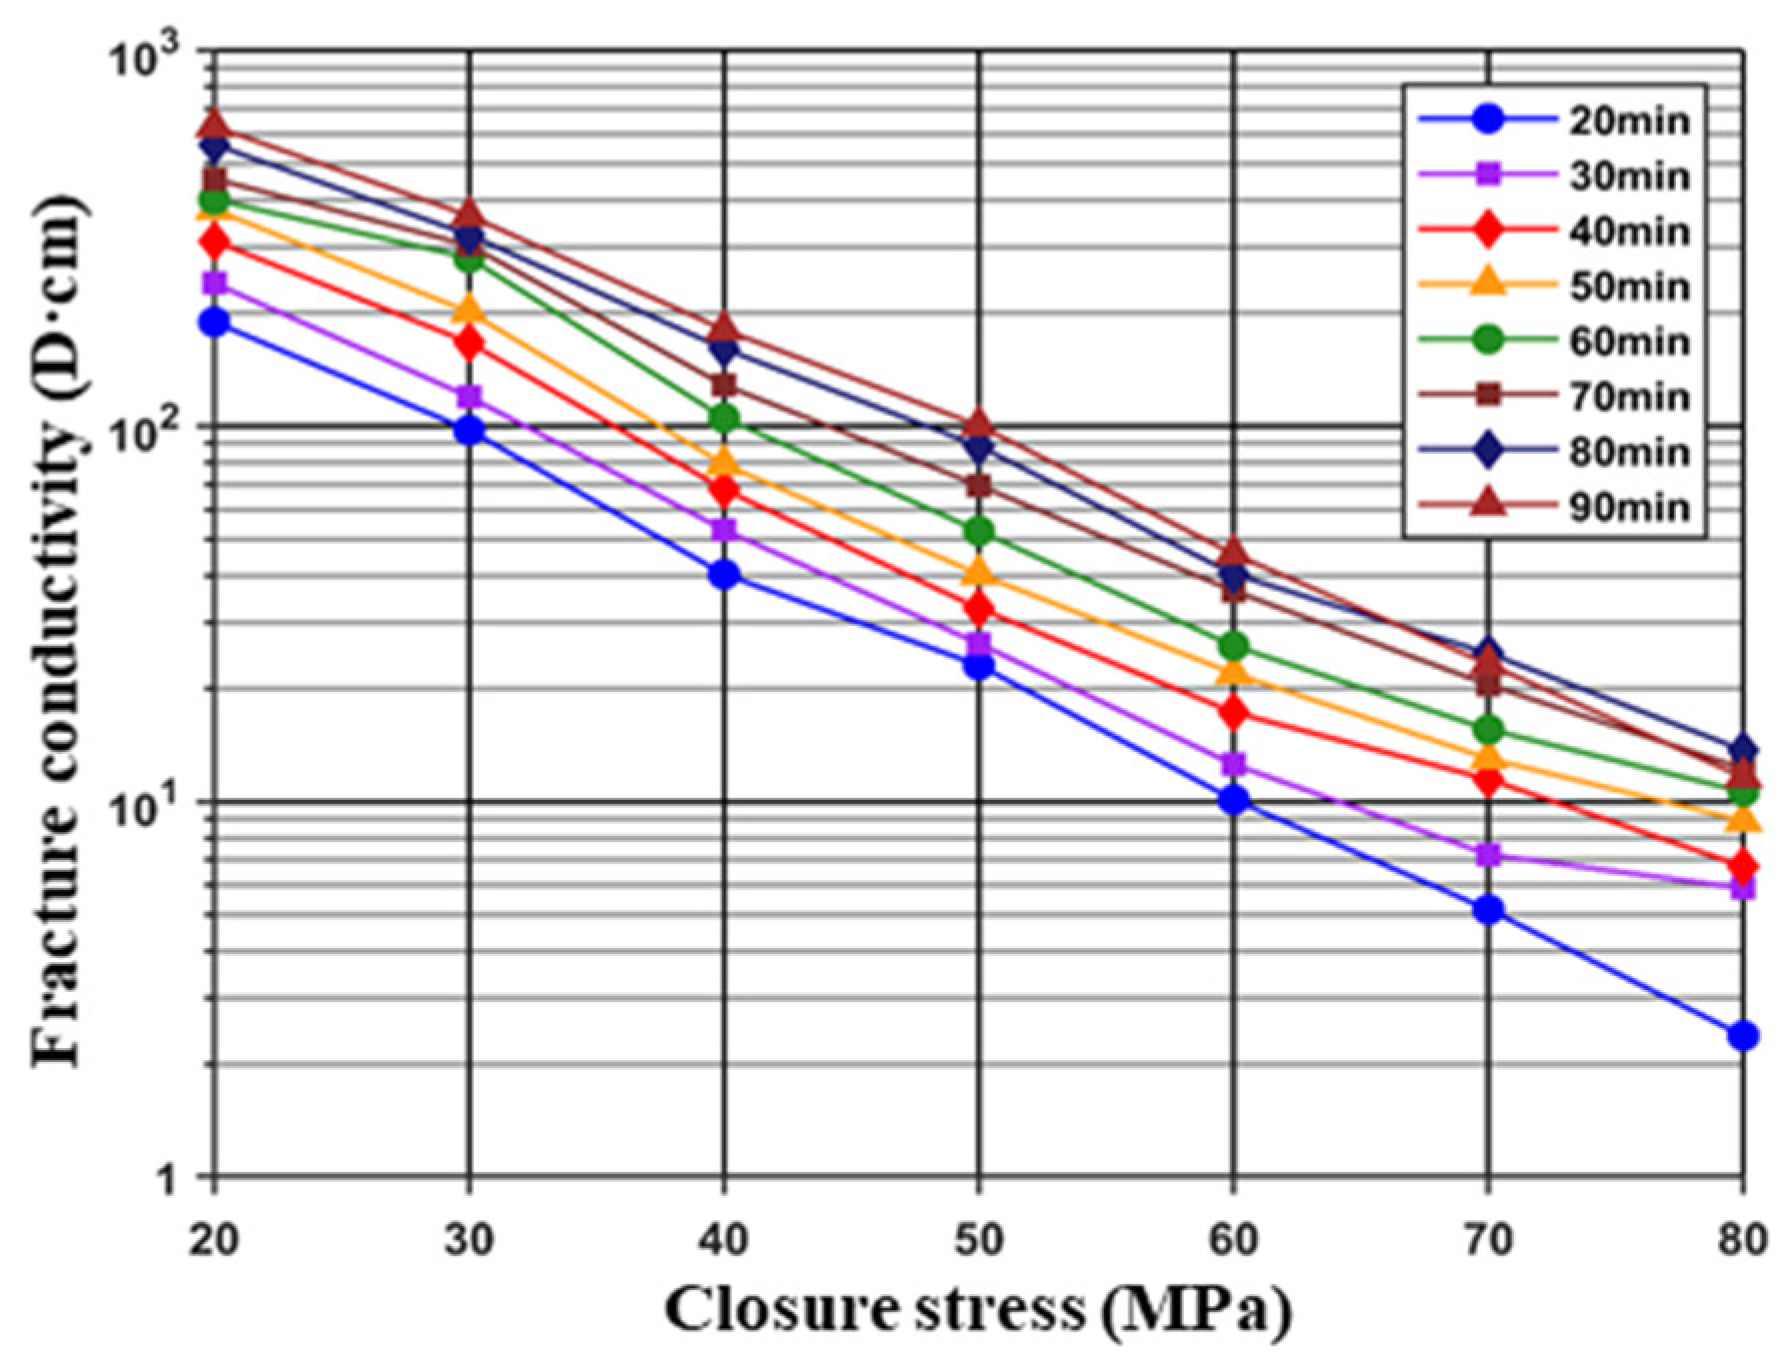
3.1.2. Acid-Etched Fracture Conductivity

The conductivity of the primary fractures increases with the acid–rock contact time, as shown in Figure 5. However, beyond 70 min of contact time, the increase in conductivity becomes less pronounced. The reason is that once a certain amount of dissolution is reached, further dissolution does not significantly increase the roughness of the acid-etched fracture surface. This indicates that the acid–rock contact time in the middle of the fracture should exceed 60 min to ensure a high conductivity of the acid-etched fracture. The conductivity of primary fractures decreases rapidly with closure stress. At low closure stress (20 MPa), the highest conductivity reaches 600 D·cm, while at high closure stress (80 MPa), it drops to 10 D·cm. Under the typical effective closure stress of 60 MPa of the ultra-deep reservoir, the primary fracture conductivity can reach 40 D·cm.

3.2. Variation Pattern of Acid-Etched Fracture Conductivity in Secondary Fractures with In Situ-Generated Acid

3.2.1. Acid-Etched Surface Morphology and Dissolution Volume

The comparison of etched surface morphologies of the primary and secondary fractures after 60 min of acid etching with in situ-generated acid is shown in Figure 6. There is a noticeable difference in the etching patterns: the surface of the primary fracture exhibits dense particulate etching, while the secondary fracture shows distinct dissolution grooves (marked by red arrows). This phenomenon is related to the fracture width: the primary fracture has a larger width, allowing the entire rock surface to come into contact with the acid during displacement, leading to relatively uniform dissolution. In contrast, the secondary fracture has a narrower width, causing more intense competition for acid flow and dissolution. Initially, the rock surface is planar, but after acid dissolution, the width varies significantly across different areas. Wider areas come into contact with more acid, resulting in greater dissolution, which in turn forms grooves on the surface of the secondary fracture.
The dissolution volume of the secondary fractures with in situ-generated acid is illustrated in Figure 7. Similar to the primary fractures, the dissolution volume in secondary fractures generally shows a linear increase with increasing acid–rock contact time. Due to the lower acid concentration used in the displacement process for secondary fractures, the dissolution volume in the secondary fractures is smaller. As the acid–rock contact time increases from 20 min to 80 min, the dissolution volume in the secondary fractures rises from 13.2 g to 48.8 g.

3.2.2. Acid-Etched Fracture Conductivity

The comparison of the conductivity of secondary fractures and primary fractures is shown in Figure 8. Despite the lower dissolution volume in secondary fractures under the same acid–rock contact time, they exhibit significantly higher conductivity. After 20 min of contact, the conductivity of secondary fractures is nearly an order of magnitude higher than that of primary fractures. At other contact times, the conductivity of secondary fractures exceeds that of primary fractures by three to five times. This difference is attributed to the surface morphology of the acid-etched fractures; the grooves formed on the surface of secondary fractures due to competitive acid dissolution are resistant to closure under confining stress, contributing significantly to their higher conductivity.

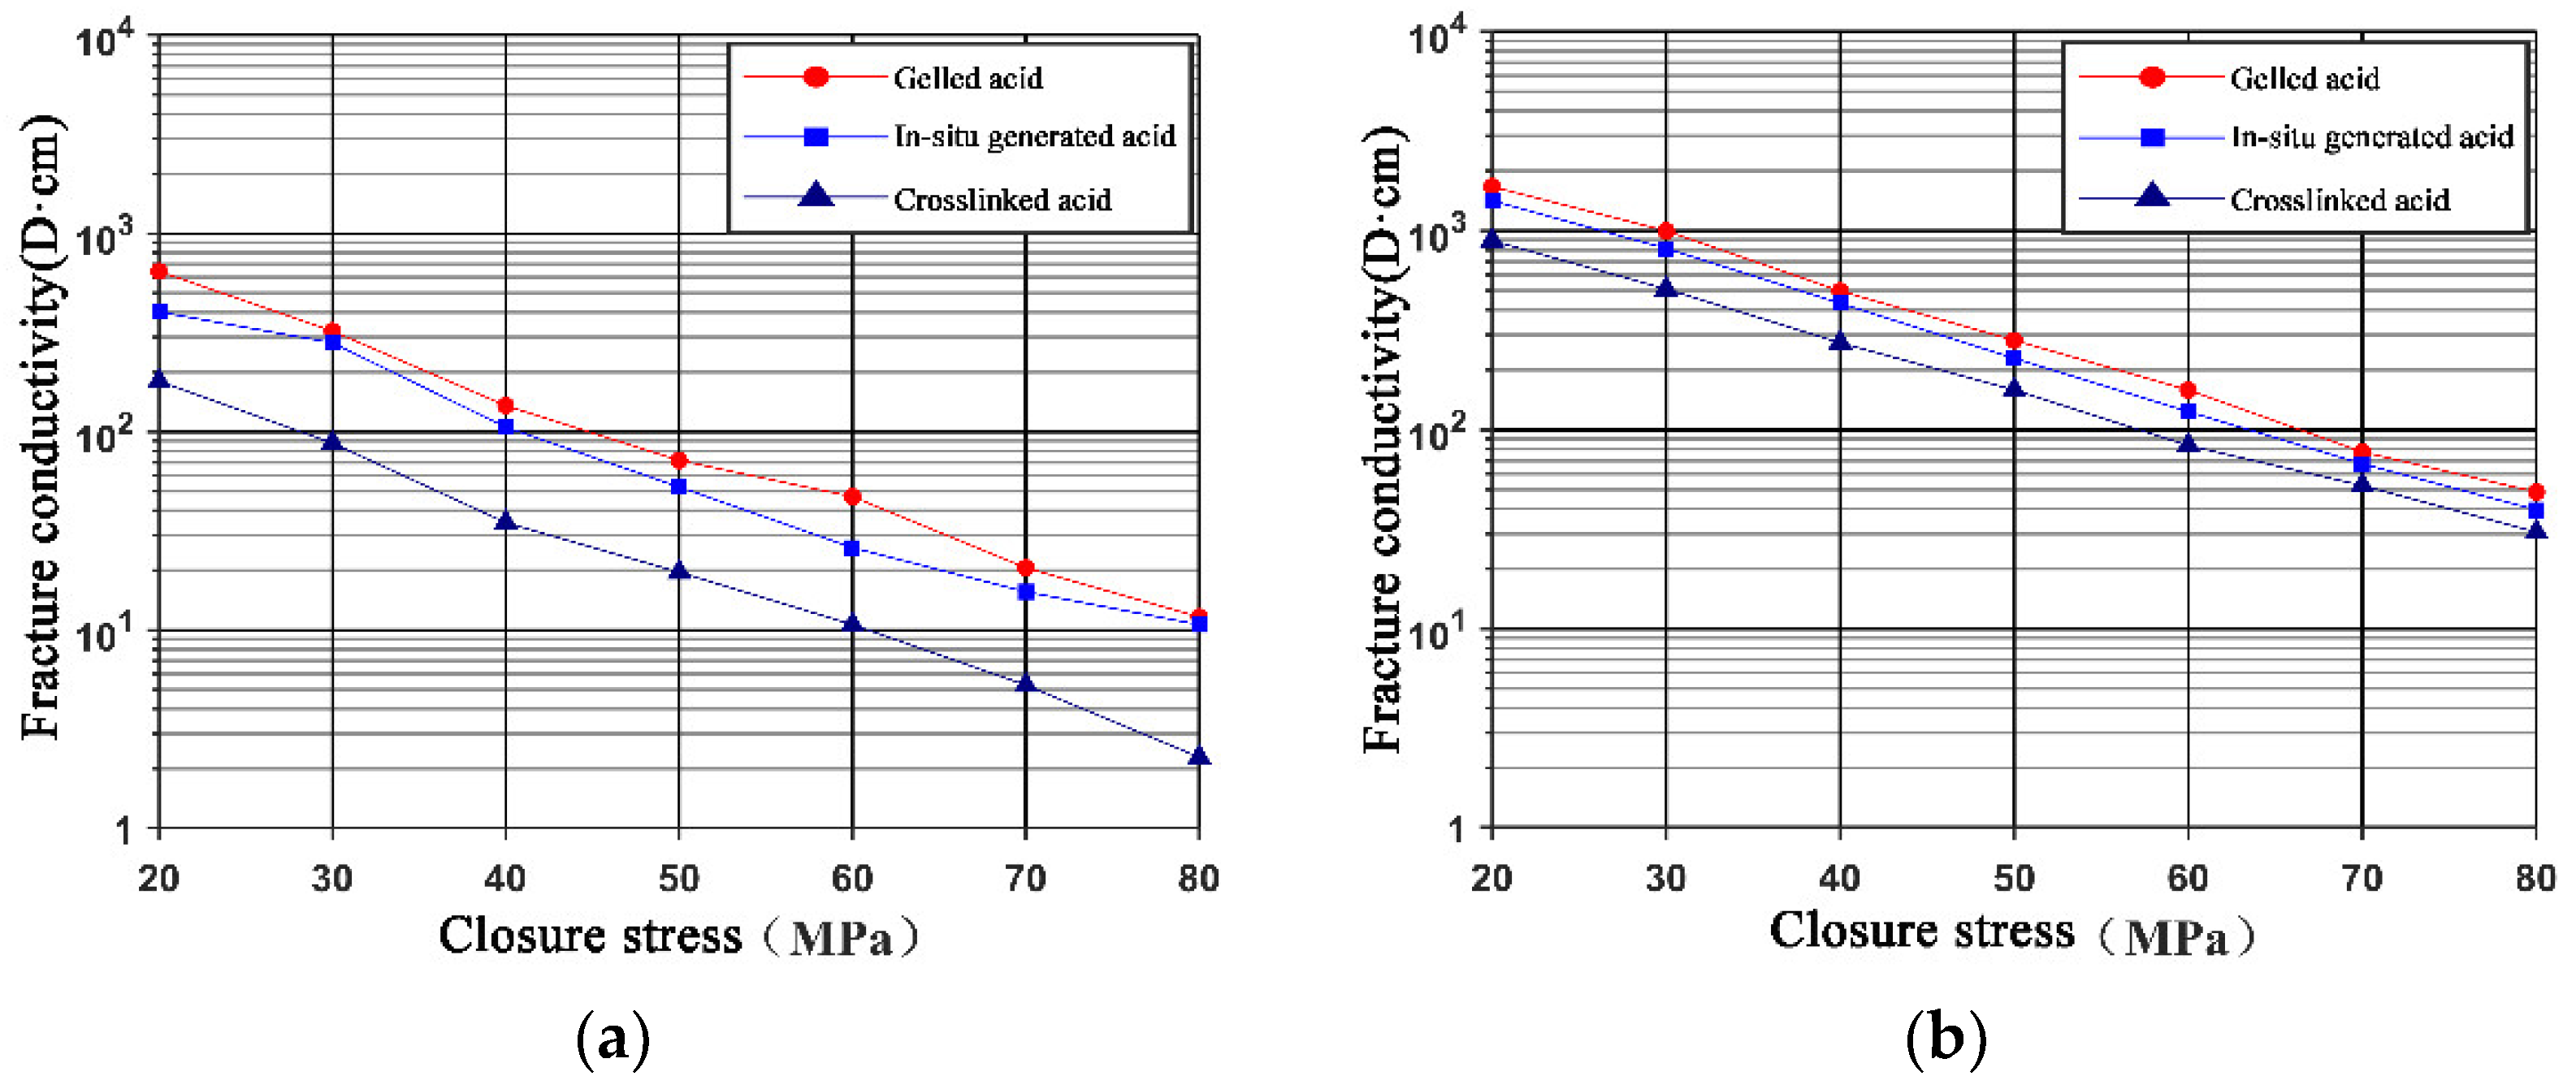
3.3. Comparison of Fracture Conductivity between In Situ-Generated Acid and Conventional Acid Systems

To evaluate the conductivity of acid-etched fractures created by in situ-generated acid, this study compares the conductivity of primary and secondary fractures etched by in situ-generated acid with those etched by conventional acid systems (gelled acid and crosslinked acid). The comparison of conductivity between in situ-generated acid and conventional acids (cross-linked acid, gelling acid) after 60 min acid–rock contact is shown in Figure 9. For primary fractures, the conductivity resulting from in situ-generated acid is slightly lower than that from gelling acid, but significantly higher than that from crosslinked acid. Given the similar rock plates used in the experiments, the rock dissolution volumes and the corresponding fracture surface morphologies caused by different acids account for this phenomenon. The crosslinked acid is more viscous than that of the gelled acid and in situ-generated acid, leading to the lowest rock disillusion volume among the three acid systems. The gelled acid has nearly the same viscosity as the in situ-generated acid, except that the acid concentration of the gelled acid is 2.5 mol/L higher than that of the in situ-generated acid. Thus, the gelled acid has the highest dissolution volume. The dissolution of in situ-generated acid is intermediate among the three. The higher dissolution volume in the similar rock plates leads to a rougher fracture surface and a wider acid fracture width, which contributes to the higher conductivity.
For secondary fractures, the acid-etched fracture conductivity with in situ-generated acid is lower than that with gelled acid and higher than that with crosslinked acid, although the differences are relatively small. Due to the groves formed in the secondary fracture surface, the difference in the conductivity is relatively small compared with that of the primary fractures.

4. Empirical Model of Acid-Etched Fracture Conductivity with In Situ-Generated Acid

The surface morphology of acid-etched fractures is complex, characterized by irregular distribution and deformation under confining stress, making the theoretical calculation of fracture conductivity challenging. Nierode and Kruk [21] developed an empirical model for calculating conductivity, known as the N-K model, by analyzing extensive experimental data. The theoretical basis of the model is that the conductivity of acid-etched fractures and confining stress exhibit a linear relationship on a semi-logarithmic coordinate system. Consequently, an exponential function can describe the variation in conductivity with confining stress. The conductivity of rough fractures can be approximated using the formula for flow conductivity in a parallel plate channel, kfw = w3/12, allowing the conductivity calculation formula to be expressed as
k f w = ( k f w ) 0 e c σ c
( k f w ) 0 = a w i b
w i = Δ m ρ A
In the above equations, kfw represents the acid-etched fracture conductivity, D·cm; (kfw)0 is the fracture conductivity at zero confining stress, D·cm; a, b, and c are constants, and c indicates the influence of confining stress on fracture conductivity; wi is the average fracture width calculated from to the dissolution volume, cm; Δm is the dissolution rock mass, g; ρ is the density of the rock, g/cm3; A is the surface area of the fracture, cm2; and σc is the confining stress, MPa. Substitute Equation (4) into Equation (3), and one can obtain
k f w = a w i b e c σ c
Taking the logarithm of both sides of Equations (3) and (4) gives
ln ( k f w ) = ln [ ( k f w ) 0 ] c σ c
ln [ ( k f w ) 0 ] = ln a + b ln w i
Based on Equations (7) and (8) and combined with the previous experimental data, Figure 10 and Figure 11 were obtained using the least square method. The slope and intercept were used to obtain a, b, and c. The final empirical model for the acid-etched fracture conductivity with in situ-generated acid of the primary fracture and secondary fracture are as follows.
( k f w ) p r i m a r y = 5287 w i 0.9 e 0.066 σ c
( k f w ) s e c o n d a r y = 9967 w i 0.444 e 0.061 σ c

5. Conclusions

In this study, a series of experimental investigations were conducted on the acid-fracture conductivity of in situ-generated acid in ultra-deep, high-temperature reservoirs of the Tarim basin. The following conclusions were obtained.
(1)
After in situ-generated acid etching, the surface morphologies of the primary and secondary fractures showed significant differences. The primary fracture surface presented a dense particulate pattern, while the secondary fracture surface exhibited distinct grooves. Due to grooves formed on the secondary fracture surfaces, the secondary fractures exhibited higher conductivity than the primary fractures.
(2)
The conductivity of acid-etched fractures increased with the acid–rock contact time. However, when the acid–rock contact time exceeded approximately 70 min, the rate of increase in conductivity slowed down, which suggests that a minimum contact time of 70 min should be achieved during field operation.
(3)
The conductivity of both primary and secondary fractures treated with in situ-generated acid was lower than that treated with gelled acid but higher than with crosslinked acid. A combination of gelled acid and in situ-generated acid is conducive to a deep penetration distance and high fracture conductivity.

Author Contributions

Conceptualization, J.M.; Investigation, H.J., H.P., J.W. and J.L.; Methodology, X.C.; Project administration, J.M.; Visualization, B.G. and H.P.; Writing—original draft, H.J. and H.P.; Writing—review and editing, B.G., H.P. and X.C. All authors have read and agreed to the published version of the manuscript.

Funding

This paper is supported by the project of Research and Application of Key Technologies for the Exploration and Development of Continental Medium and High-Maturity Shale Oil (Grant No. 2019E-26) provided by Xinjiang Oilfield Company.

Data Availability Statement

The original contributions presented in the study are included in the article, further inquiries can be directed to the corresponding author.

Conflicts of Interest

Authors Haizheng Jia, Jianming Li, Junchao Wang, Xi Chen were employed by the company Engineering Technology Research Institute of Xinjiang Oilfield Company. Author Hongyuan Pu was employed by the SINOPEC Jianghan Oil field Company. The remaining authors declare that the research was conducted in the absence of any commercial or financial relationships that could be construed as a potential conflict of interest. The companies had no role in the design of the study; in the collection, analyses, or interpretation of data; in the writing of the manuscript, or in the decision to publish the results.

References

  1. Hou, F.; Xu, Y.; Zhang, A.; Lv, J. Research and application of autogenic acid deep penetration acid fracturing technology for ultra-deep high temperature carbonate rocks. Drill. Prod. Technol. 2018, 41, 3+35–37. [Google Scholar]
  2. Liu, Y.; Zhang, Y.; Wang, D.; Xiong, Y. Self-generating hydrochloric acid system for carbonate reservoir. Pet. Sci. Technol. Forum 2015, 34, 165–167+196. [Google Scholar]
  3. Luo, J.; Cao, C.; Hu, W. Self-generating acid system suitable for Tahe oilfield. Petrochem. Ind. Technol. 2015, 22, 199+207. [Google Scholar]
  4. Yang, R. The Study of Gelled Self-Generating Acid System in High Temperature Carbonate Reservoir Acidification. Master’s Thesis, Southwest Petroleum University, Chengdu, China, 2015. [Google Scholar]
  5. Fang, Y.; Zhang, Y.; Yang, F.; Hou, F. Performance evaluation of a high temperature in-situ self-generating acid system. Oilfield Chem. 2014, 31, 191–194+198. [Google Scholar]
  6. Ye, J.; Yang, J.; Geng, S.; Li, Y. Development and evaluation of a new type of self-generated acid fracturing fluid. Petrochem. Ind. Appl. 2019, 38, 8–13. [Google Scholar]
  7. Li, Q.; Wang, Y.; Wang, F. Effect of thickener and reservoir parameters on the filtration property of CO2 fracturing fluid. Energy Sources 2020, 42, 1705–1715. [Google Scholar] [CrossRef]
  8. Li, Q.; Li, Y.; Cheng, Y.; Li, Q.; Wang, F.; Wei, J. Numerical simulation of fracture reorientation during hydraulic fracturing in perforated horizontal well in shale reservoirs. Energy Sources 2018, 40, 1807–1813. [Google Scholar] [CrossRef]
  9. Guo, J.; Li, L.; Peng, H. Experimental study on the factors affecting the conductivity of dolomite acid etching fractures in eastern sichuan carboniferous. Drill. Prod. Technol. 2003, 3, 3+45–47. [Google Scholar]
  10. Liu, L.; Fu, Z. Acid-etched fracture conductivity of carbonate reservoir of Tazhong 1 gas field. J. Chengde Pet. Coll. 2010, 12, 1–4+28. [Google Scholar]
  11. Duan, M. Experimental test on flow conductivity of acid-etching fracture for carbonate rock. Nat. Gas Explor. Dev. 2013, 36, 61–63+74+87. [Google Scholar]
  12. Li, N.; Zhao, L.; Zhang, Q.; Ren, X.; Liu, P. Study on the conductivity of acid corrosion cracks during acid fracturing. Oil Drill. Prod. Technol. 2008, 6, 59–62+168. [Google Scholar]
  13. Liu, Y.; Wang, L.; Xiong, Y.; Wu, W.; Zhang, Y. Study on authigenic acid system of high temperature carbonate rocks. Chem. Eng. Oil Gas 2011, 40, 325+367–369. [Google Scholar]
  14. Abass, H.H.; Al-Mulhem, A.A.; Alqam, M.H.; Khan, M.R. Acid fracturing or proppant fracturing in carbonate formation? A rock mechanics view. In Proceedings of the SPE Annual Technical Conference and Exhibition? San Antonio, TX, USA, 24–27 September 2006; p. 102590-MS. [Google Scholar]
  15. Wang, M.; Wu, Y.; Sun, H.; Chen, P.; Jia, X. Influence of acid on the conductivity of acid corrosion fracture. Spec. Oil Gas Reserv. 2019, 26, 153–158. [Google Scholar]
  16. Nasr-El-Din, H.A.; Al-Driweesh, S.M.; Metcalf, A.S.; Chesson, J.B. Fracture Acidizing: What Role Does Formation Softening Play in Production Response? Soc. Pet. Eng. 2008, 23, 103344-PA. [Google Scholar] [CrossRef]
  17. Li, L.; Zhang, R.; Li, P.; Yang, Z. An experimental study on the RD self-generating acid performance in acid-fracturing. Appl. Chem. Ind. 2014, 43, 9–12. [Google Scholar]
  18. Hao, W.; Yin, X.; Huang, W.; Wu, X.; Che, X. Experimental study on evaluation of authigenic acid system. Petrochem. Ind. Appl. 2020, 39, 96–101. [Google Scholar]
  19. Gou, B.; Guan, C.; Li, X. Acid-etching fracture morphology and conductivity for alternate stages of self-generating acid and gelled acid during acid-fracturing. J. Pet. Sci. Eng. 2021, 200, 108358. [Google Scholar] [CrossRef]
  20. Kamali, A.; Pournik, M. Fracture closure and conductivity decline modeling–Application in unpropped and acid etched fractures. J. Unconv. Oil Gas Resour. 2016, 14, 44–55. [Google Scholar] [CrossRef]
  21. Nierode, D.E.; Kruk, K.F. An evaluation of acid fluid loss additives, retarded acids, and acidized fracture conductivity. In Proceedings of the SPE Annual Technical Conference and Exhibition? Las Vegas, NV, USA, 30 September–3 October 1973; p. 4549. [Google Scholar]
  22. Walsh, J.B. Effect of pore pressure and confining pressure on fracture permeability. Int. J. Rock Mech. Min. Sci. 1981, 18, 429–435. [Google Scholar] [CrossRef]
  23. Mou, J. Modeling Acid Transport and Non-Uniform Etching in a Stochastic Domain in Acid Fracturing. Ph.D. Thesis, Texas A&M University, College Station, TX, USA, 2009. [Google Scholar]
  24. Pan, B.; Chen, Y.; Yang, D.; Liu, X.; Li, H. Study of authigenic acid for Chuandongbei high temperature carbonate reservoir. Guangdong Chem. Ind. 2017, 41, 45–46. [Google Scholar]
  25. Qu, X.; Ti, Y.; Cui, H.; Wang, C.; Yang, X. Preparation and performance evaluation of a polybasic organic authigenic acid. Contemp. Chem. Ind. 2023, 52, 1895–1898+1953. [Google Scholar]
  26. Gao, Y.; Lian, S.; Shi, Y.; Yang, X.; Zhou, F.; Xiong, C.; Li, F.; Han, X.; Zhang, N. A new acid fracturing fluid system for high temperature deep well carbonate reservoir. In Proceedings of the SPE Asia Pacific Hydraulic Fracturing Conference, Beijing, China, 24–26 August 2016; p. 181823-MS. [Google Scholar]
  27. Jia, G.; Jiang, X.; Li, Y. Research and application of self-generating acid fracturing technology in Tahe Oilfield. Complex Hydrocarb. Reserv. 2017, 10, 73–75. [Google Scholar]
  28. Xia, X.; Mou, J.; Zhang, S.; Li, Y. Study on the conductivity of acid etched fractures in mixed-lithologic reservoir of Daniudi gas field. Fault-Block Oil Gas Field 2024, 5, 125–133. [Google Scholar]
  29. Guo, T.; Lv, M.; Luo, P.; Yang, X.; Che, M.; Weng, D.; Qu, Z.; Liu, Y. Assessment and optimization of fracture-karst cave connectivity in horizontal well hydraulic fracturing of carbonate reservoirs. Rock Mech. Bull. 2024, 3, 100112. [Google Scholar] [CrossRef]
  30. Mou, J.; Zhu, D.; Hill, A.D. Acid-etched channels in heterogeneous carbonates—A newly discovered mechanism for creating acid-fracture conductivity. SPE J. 2009, 15, SPE-119619-PA. [Google Scholar]
  31. Malagon, C.; Pournik, M.; Hill, A.D. The texture of acidized fracture surfaces—Implications for acid fracture conductivity. In Proceedings of the Presented at the SPE Annual Technical Conference and Exhibition, San Antonio, TX, USA, 24–27 September 2006; p. SPE-102167-MS. [Google Scholar]
Figure 1. Core slabs and fracture configuration: (a) dimension of the slab; (b) the fracture between two slabs.
Processes 12 01792 g001
Figure 2. Experimental equipment acid-etched fracture conductivity test: (a) high-temperature acid displacement apparatus; (b) the schematic diagram of the acid displacement apparatus; (c) FCES-100 conductivity testing devices; and (d) the schematic diagram of the conductivity testing devices.
Processes 12 01792 g002
Figure 3. Surface morphology of main fracture after in situ-generated acid displacement: (a) surface morphology after acid–rock contact time of 20 min; (b) surface morphology after acid–rock contact time of 60 min, which is rougher than that after 20 min acid–rock reaction.
Processes 12 01792 g003
Figure 4. Dissolution volume of primary fractures after in situ-generated acid displacement, which shows a linear trend with contact time.
Processes 12 01792 g004
Figure 5. Primary fracture conductivity with in situ-generated acid, which increases with the injection time and decreases with closure stress.
Processes 12 01792 g005
Figure 6. Surface morphology of main fracture after in situ-generated acid displacement: (a) relatively uniform etching surface formed in the primary fractures; (b) groves formed in the secondary fractures.
Processes 12 01792 g006
Figure 7. Dissolution volume of secondary fractures after in situ-generated acid displacement, which shows a liner trend with acid–rock contact time.
Processes 12 01792 g007
Figure 8. Comparison of conductivity between primary fractures and secondary fractures: (a) acid–rock contact time of 20 min; (b) acid–rock contact time of 40 min; (c) acid–rock contact time of 60 min; and (d) acid–rock contact time of 80 min.
Processes 12 01792 g008
Figure 9. Comparison of conductivity of primary and secondary fractures of three acid systems: (a) primary fractures; (b) secondary fractures.
Processes 12 01792 g009
Figure 10. A fitting empirical model for the conductivity of primary fractures with in situ-generated acid: (a) determination of variable c; (b) determination of variable a and b.
Processes 12 01792 g010
Figure 11. Fitting results of an empirical model for the conductivity of secondary fractures with in situ-generated acid (a) determination of variable c; (b) determination of variable a and b.
Processes 12 01792 g011
Table 1. Properties of the rock sample.
Sample Size
(mm)
Permeability
(mD)
Density
(g/cm3)
Mineralogy (%)
CalciteDolomiteQuartzFeldspar
178 × 38 × 200.012.71095.31.62.50.6
Table 2. Experimental scheme.
No.Acid TypeInjection Time
(min)
Acid Concentration
(%)
Fracture Type
1#in situ-generated acid2020primary fractures
2#30
3#40
4#50
5#60
6#70
7#80
8#90
9#2010secondary fractures
10#40
11#60
12#80
13#gelled acid6020primary fractures
14#10secondary fractures
15#crosslinked acid20primary fractures
16#10secondary fractures
Disclaimer/Publisher’s Note: The statements, opinions and data contained in all publications are solely those of the individual author(s) and contributor(s) and not of MDPI and/or the editor(s). MDPI and/or the editor(s) disclaim responsibility for any injury to people or property resulting from any ideas, methods, instructions or products referred to in the content.

