
Simulation Study on Rock Crack Expansion in CO2 Directional Fracturing


Abstract
:1. Introduction
2. Materials and Methods
2.1. Parameter Calibration
2.1.1. Samples for Laboratory Testing
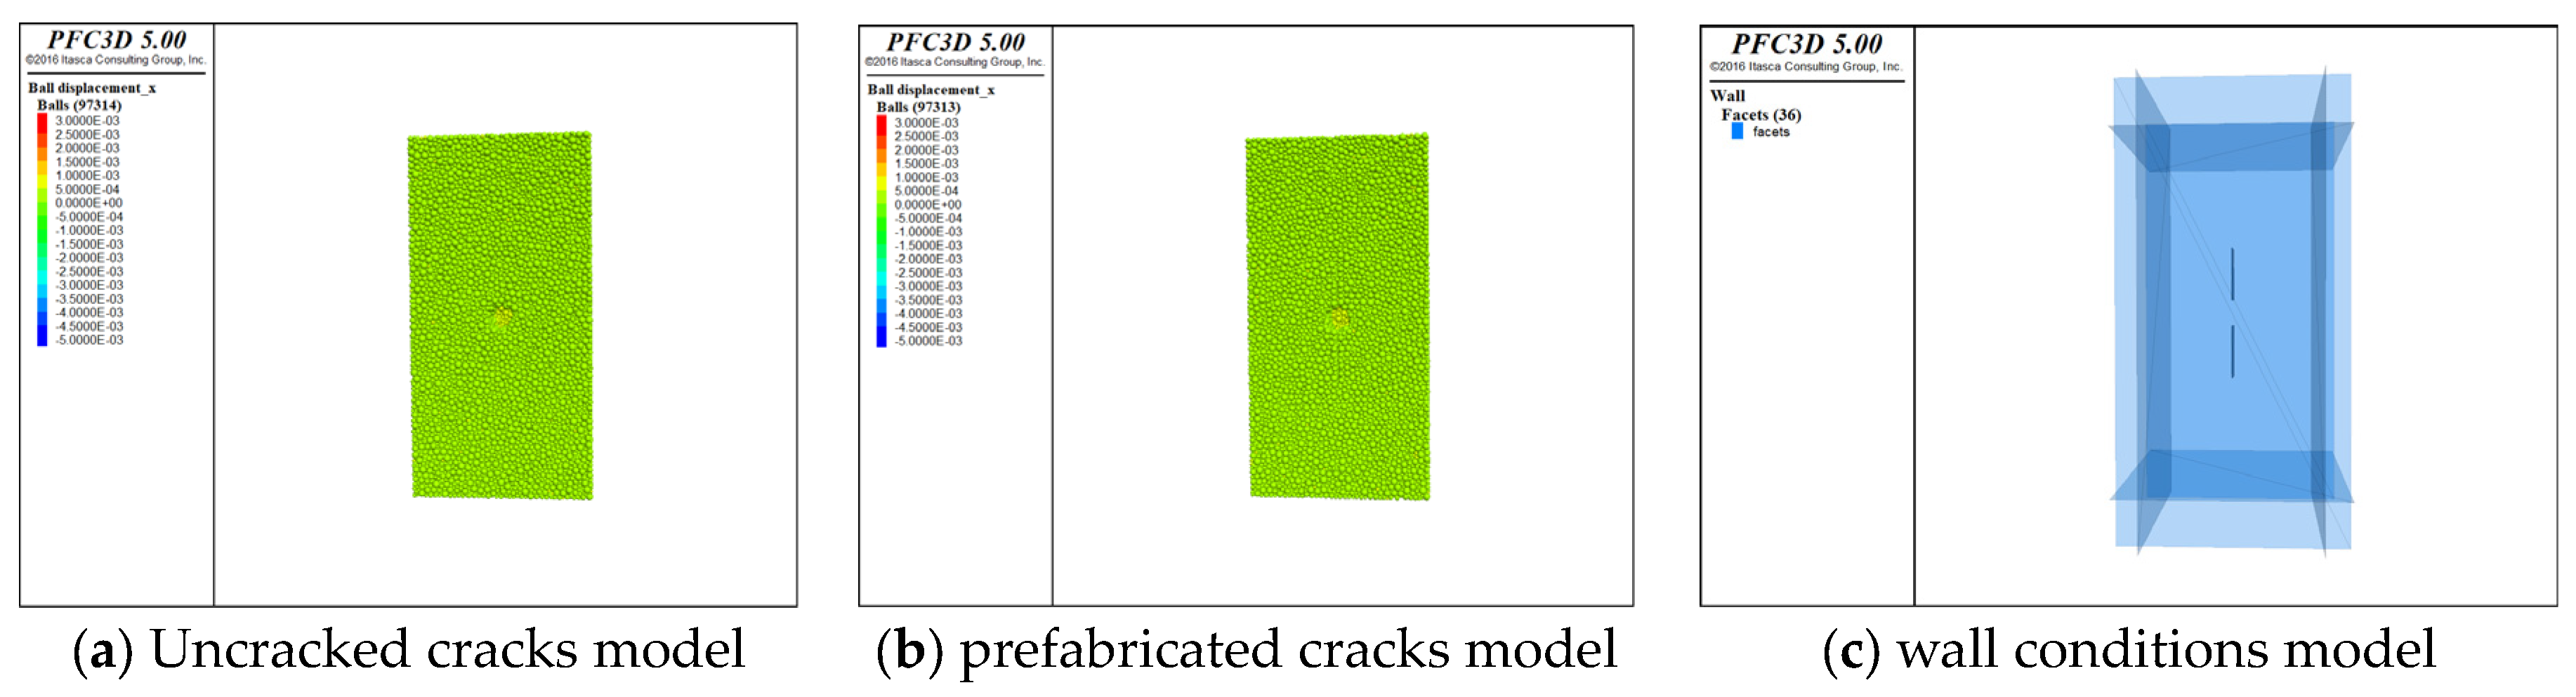
2.1.2. Samples for Numerical Simulation
2.2. Model Establishment
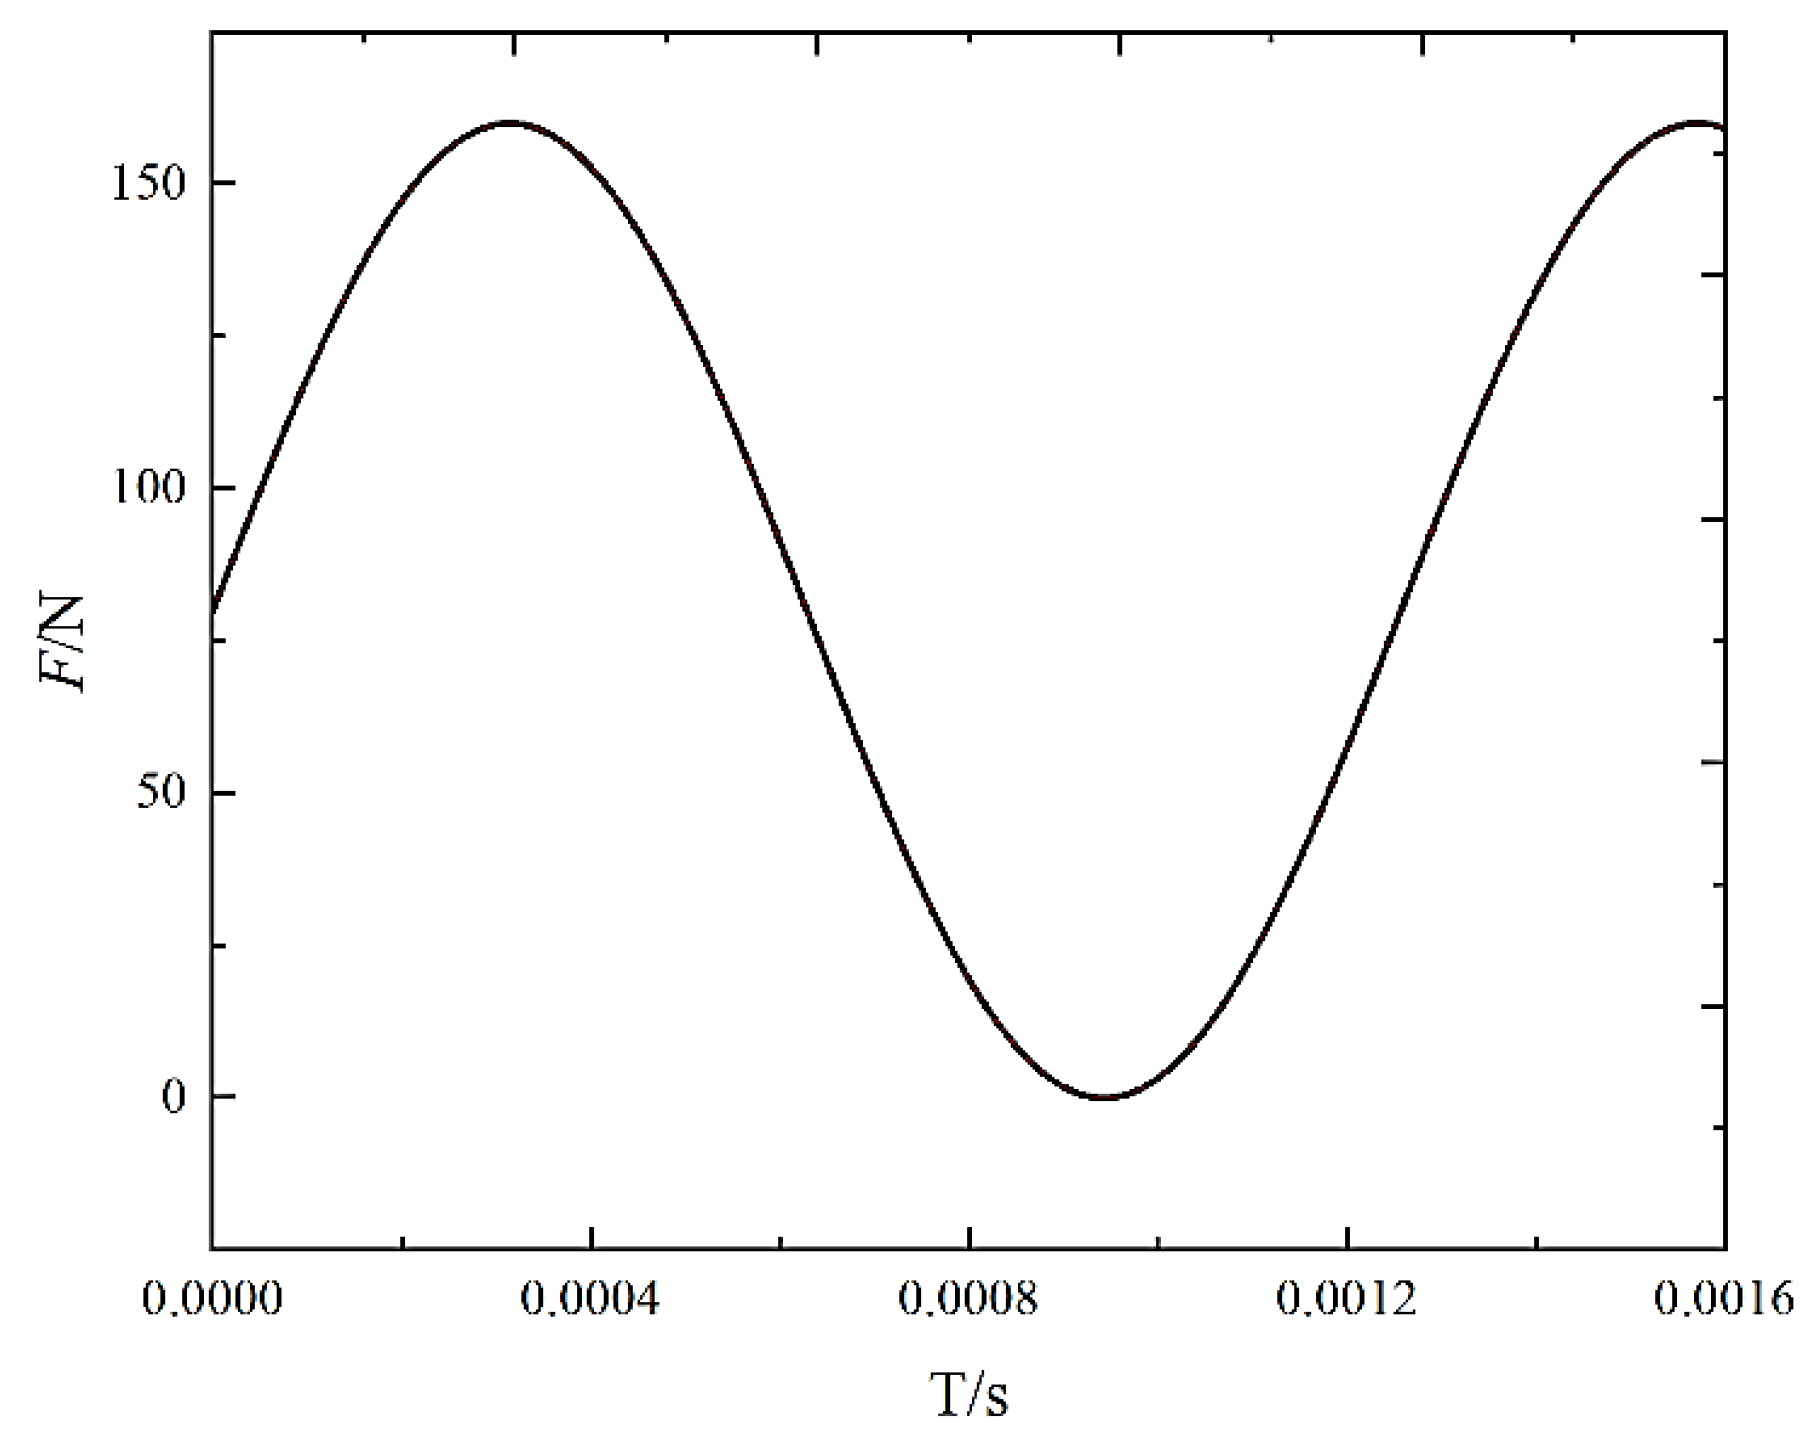
2.3. CO2 Fracturing Loading Settings
2.3.1. CO2 Dynamics Loading
2.3.2. Dynamic Boundary Conditions
3. Results and Discussion
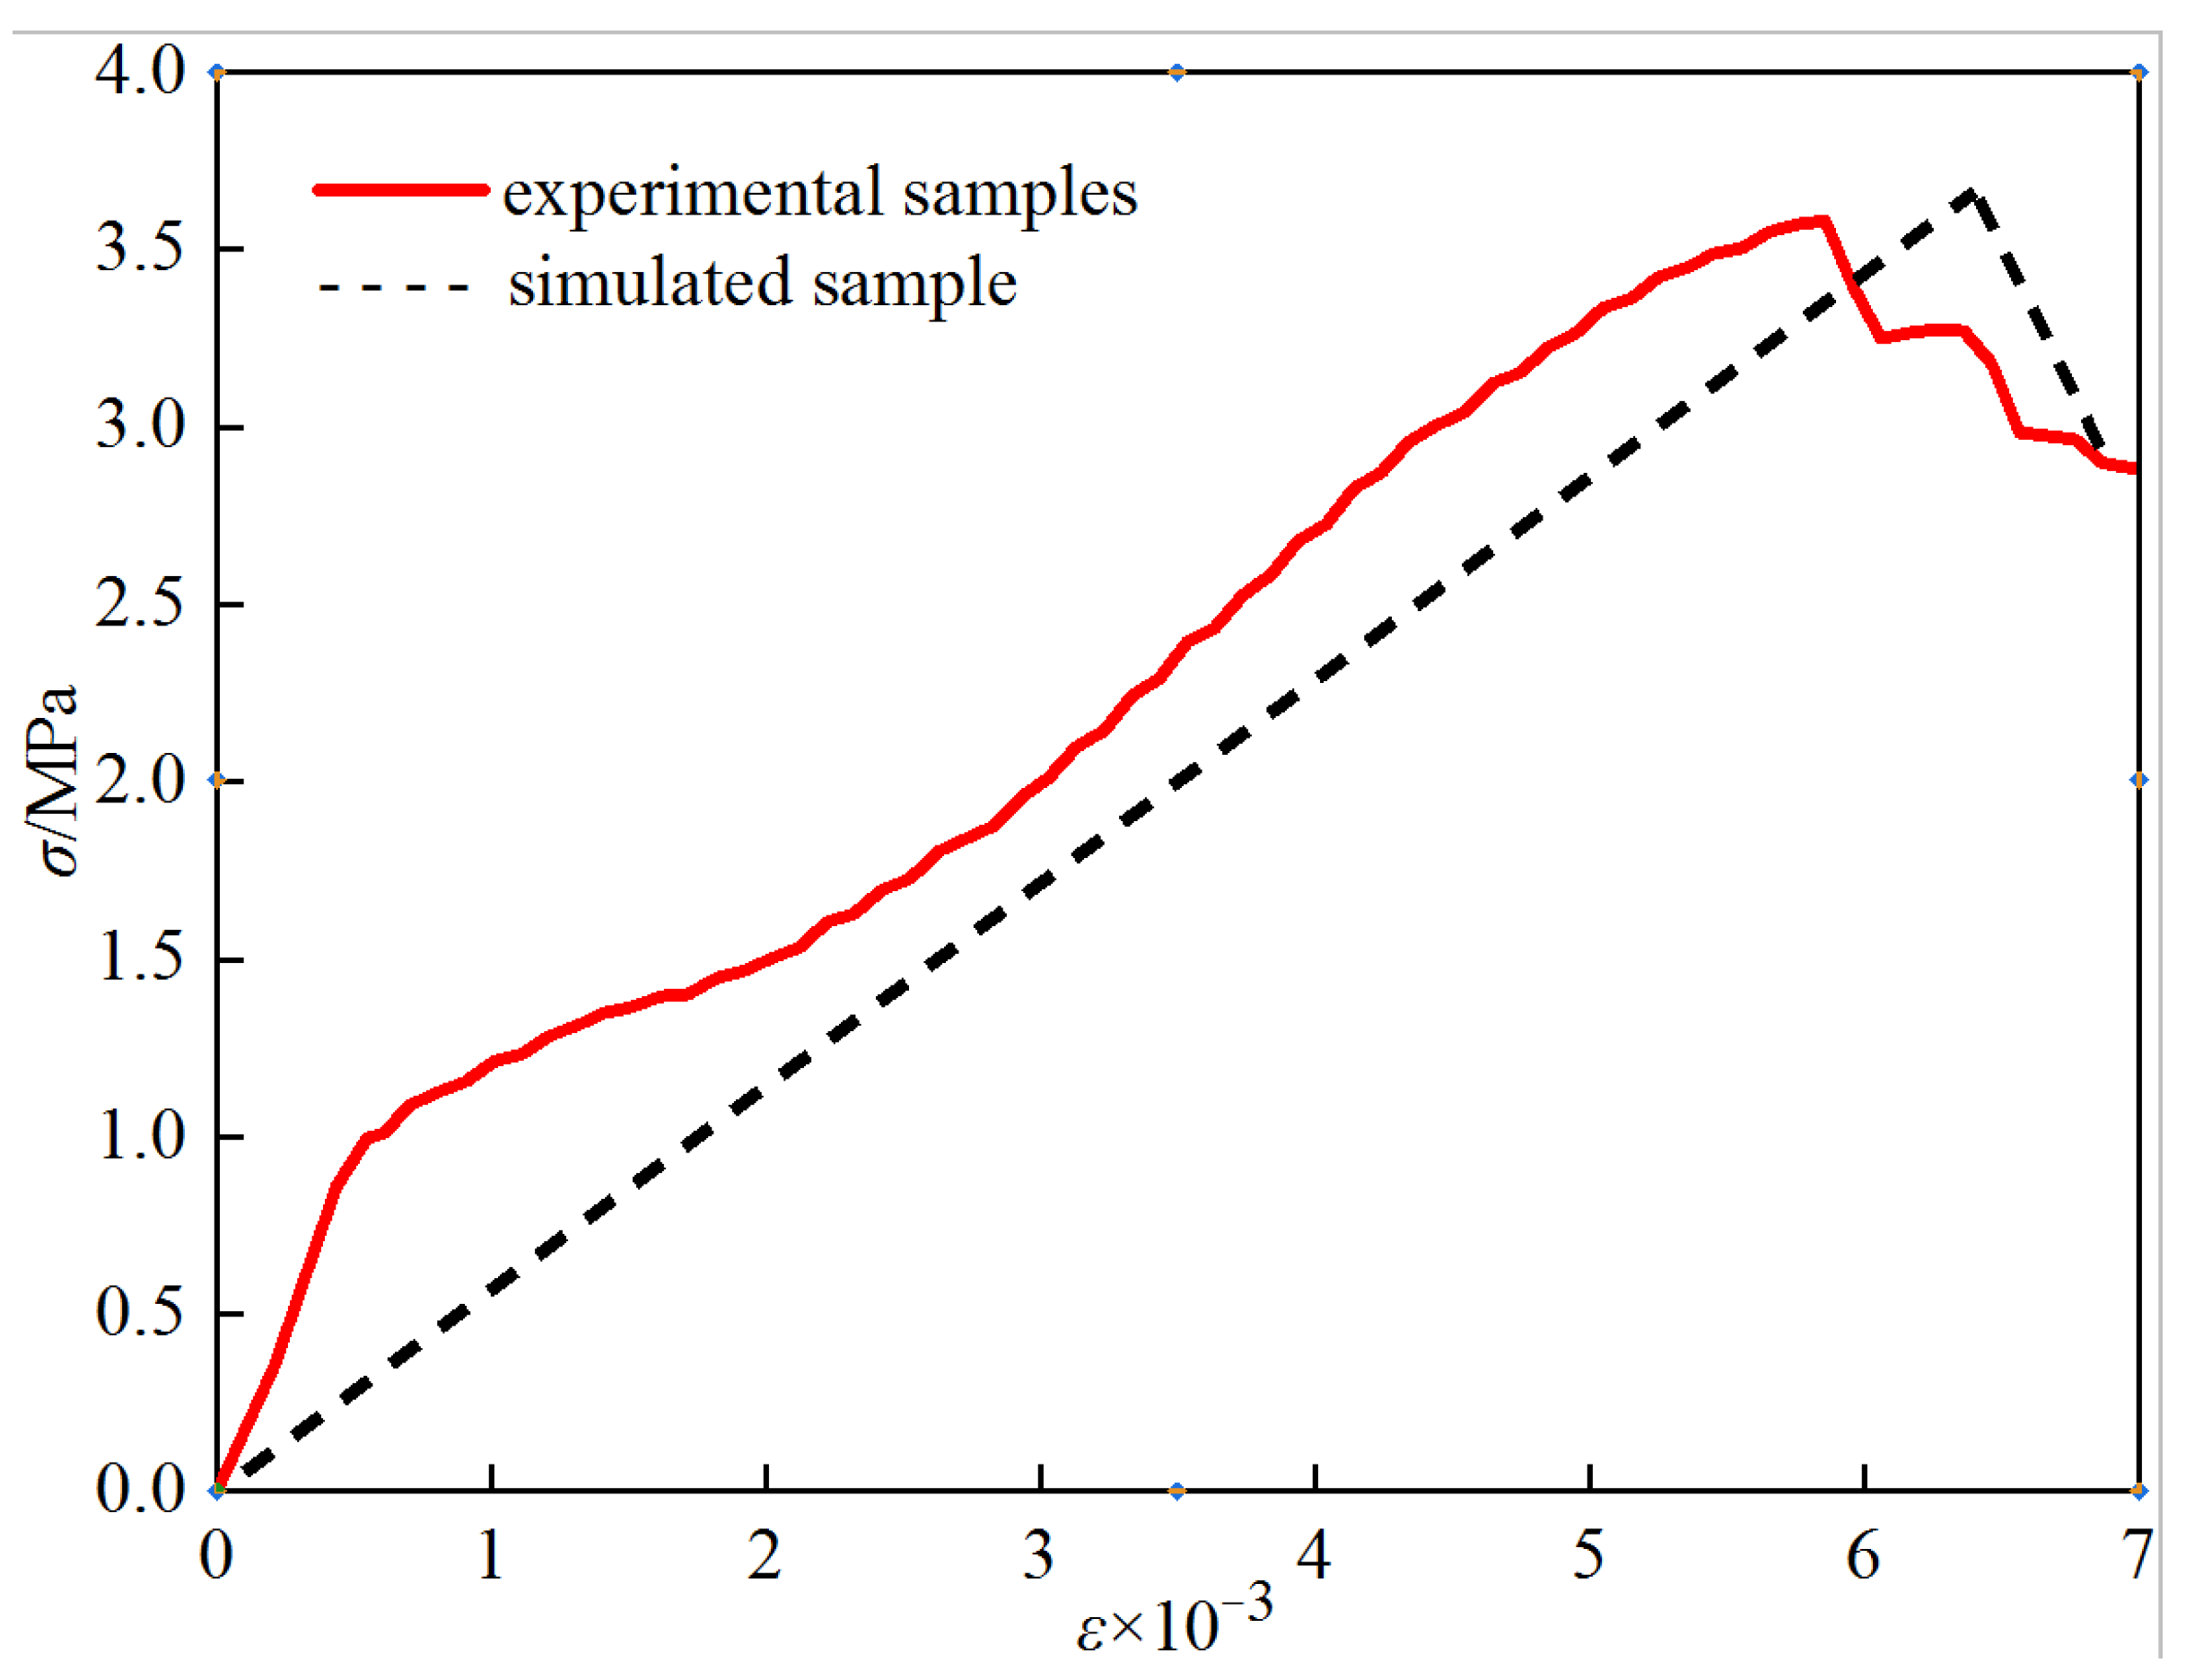
3.1. Model Validation
3.2. Characteristics of Crack Network
- (1)
- Direction Influence: In samples without directional cracks, crack formation around the blasting borehole is random and primarily depends on the weak structure of the material. Directional cracks cause the crack direction to deviate, mainly expanding along the prefabricated cracks.
- (2)
- Development Promotion: Directional cracks promote the development of larger failure areas with a greater extension range, resulting in a more concentrated crack network.
- (3)
- Increased Microcracks: The sample without directional cracks generated 184,514 microcracks, whereas the sample with directional cracks generated 186,173 microcracks. This shows that prefabricated cracks significantly impact crack propagation, resulting in a deeper internal crack network in the oriented crack specimen.
3.3. Surface Displacement
3.4. Vertical Section Displacement of the Blast Hole
3.5. Radial Vertical Section Displacement
4. Limitations and Future Work
5. Conclusions
- (1)
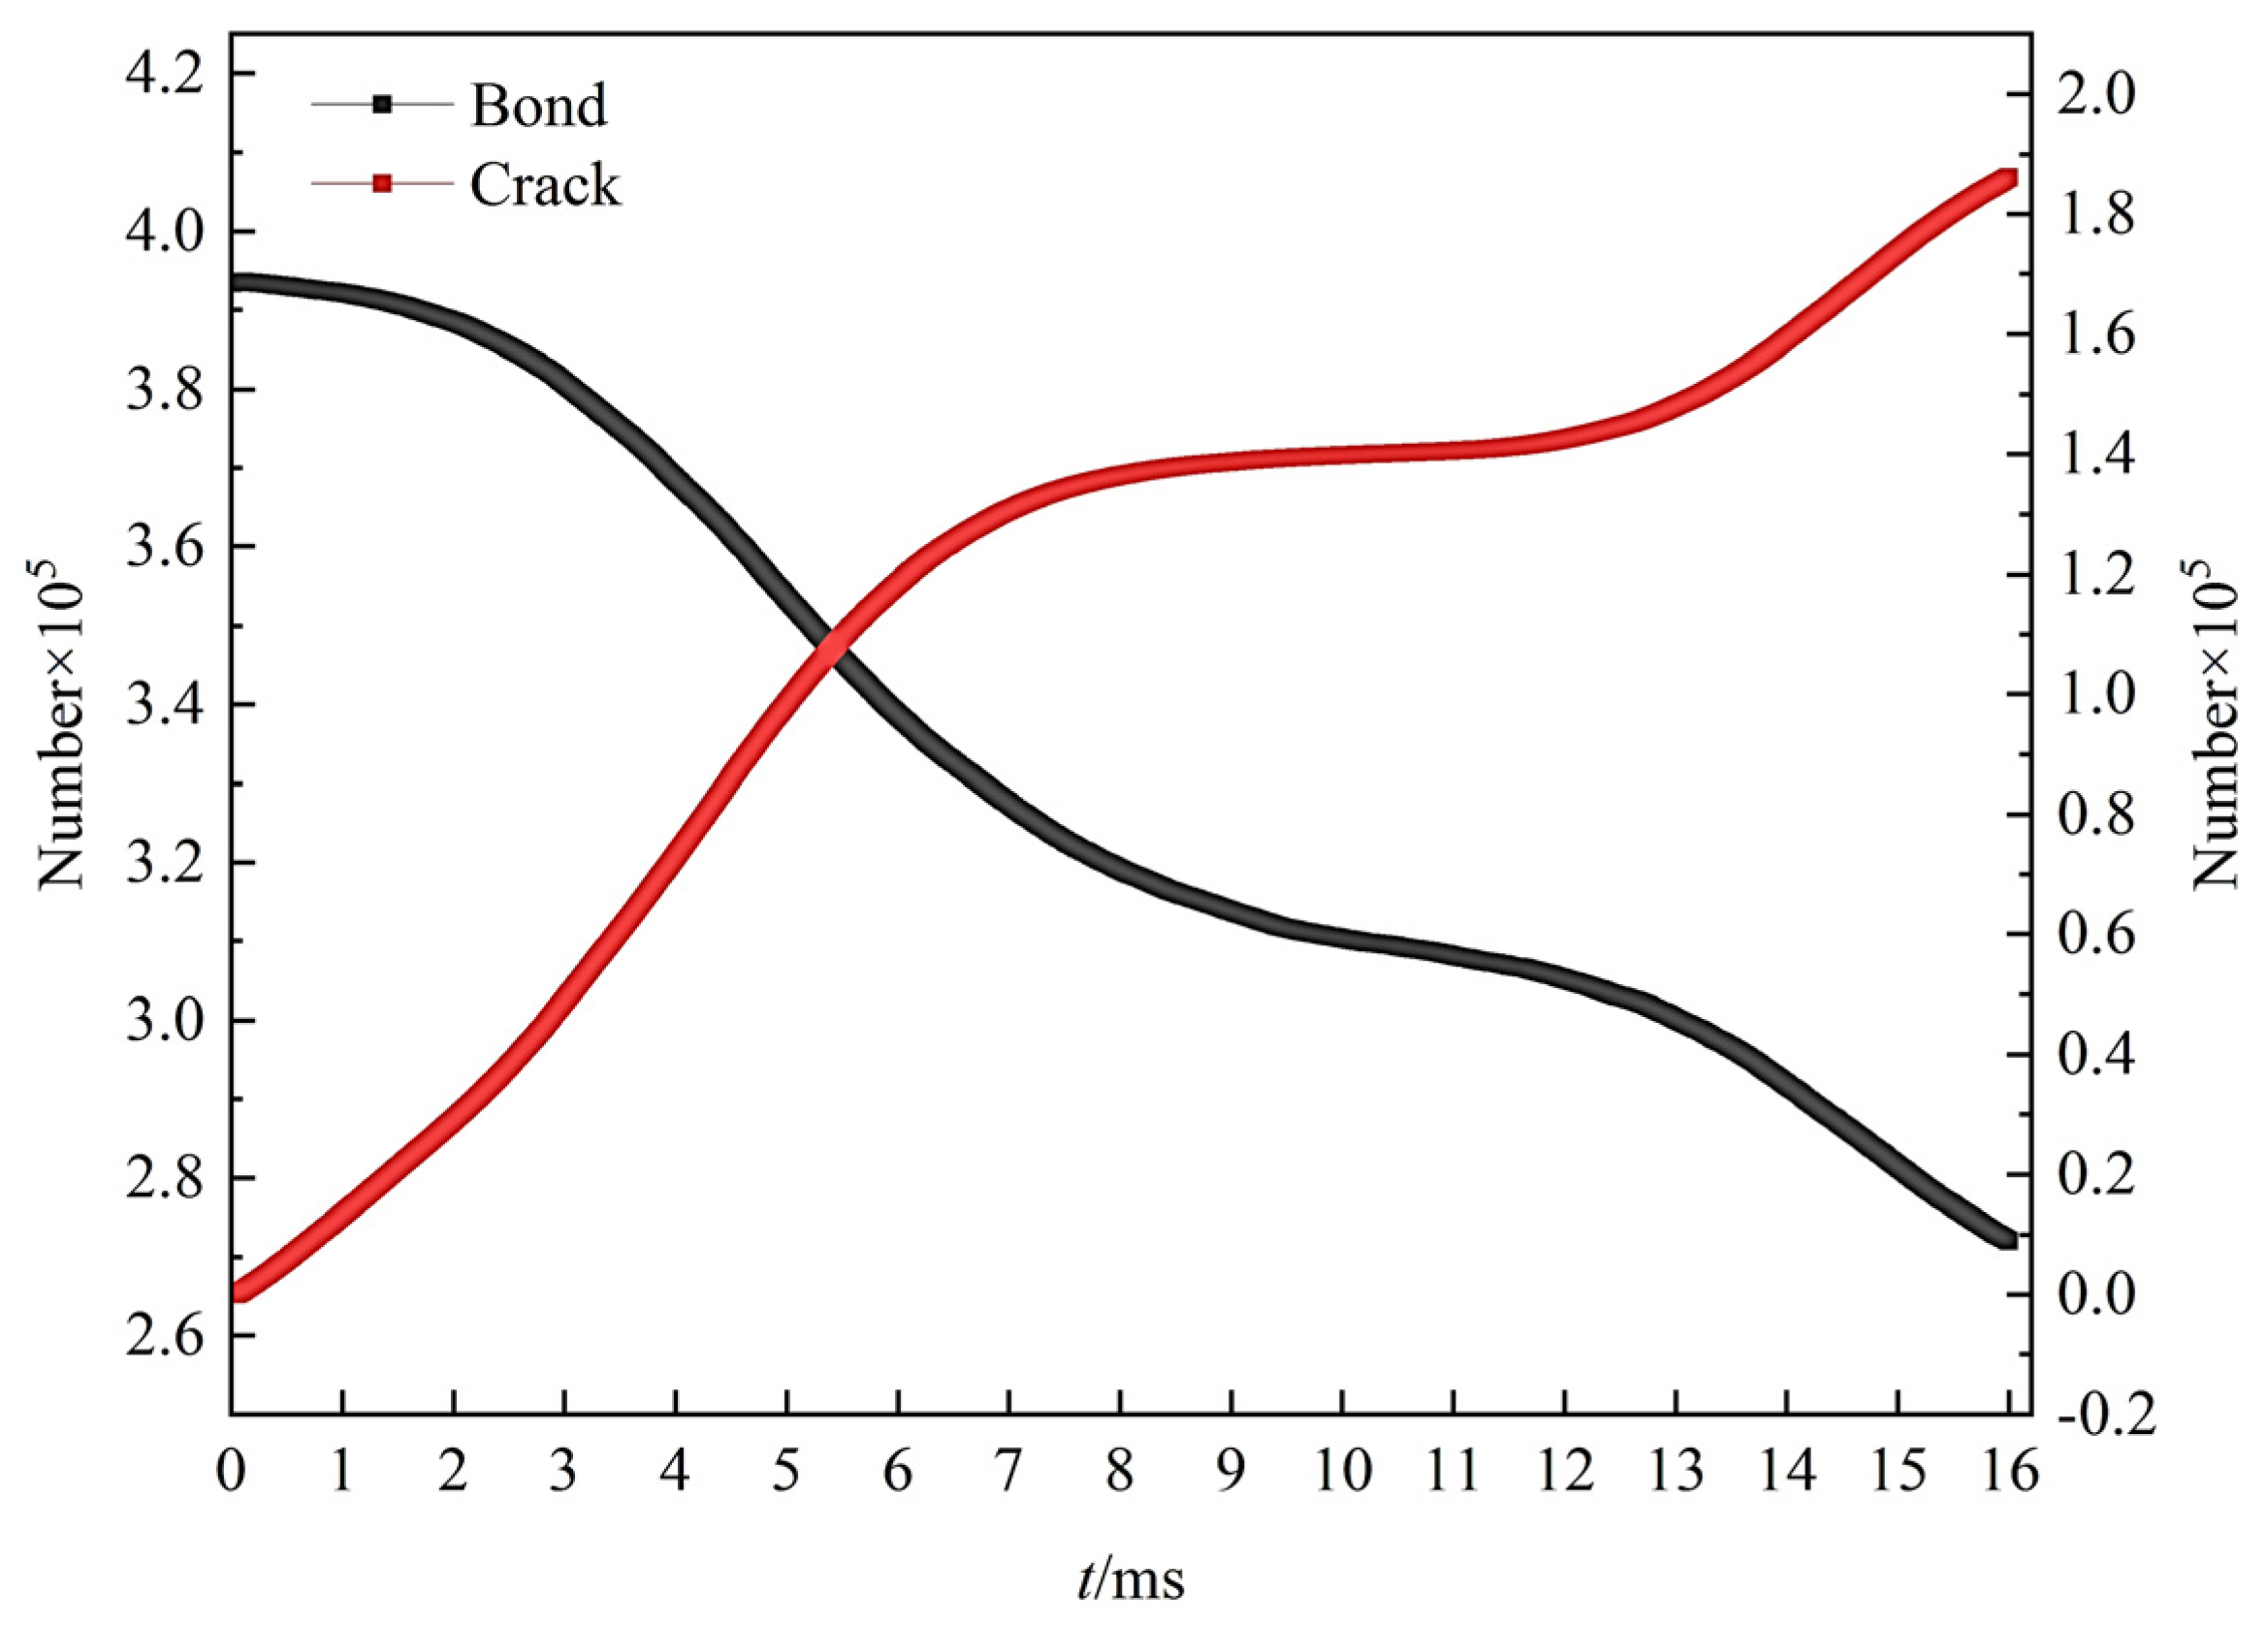
- In samples without directional cracks, cracks around the blasting borehole form randomly, largely influenced by the weak structure of the rock material. Introducing directional cracks causes cracks to propagate along the prefabricated crack direction. In the simulated conditions, the directional crack model showed a reduction in bonding keys to 2.72 × 10⁵, indicating an increase of 1659 cracks compared to the non-directional crack model.
- (2)
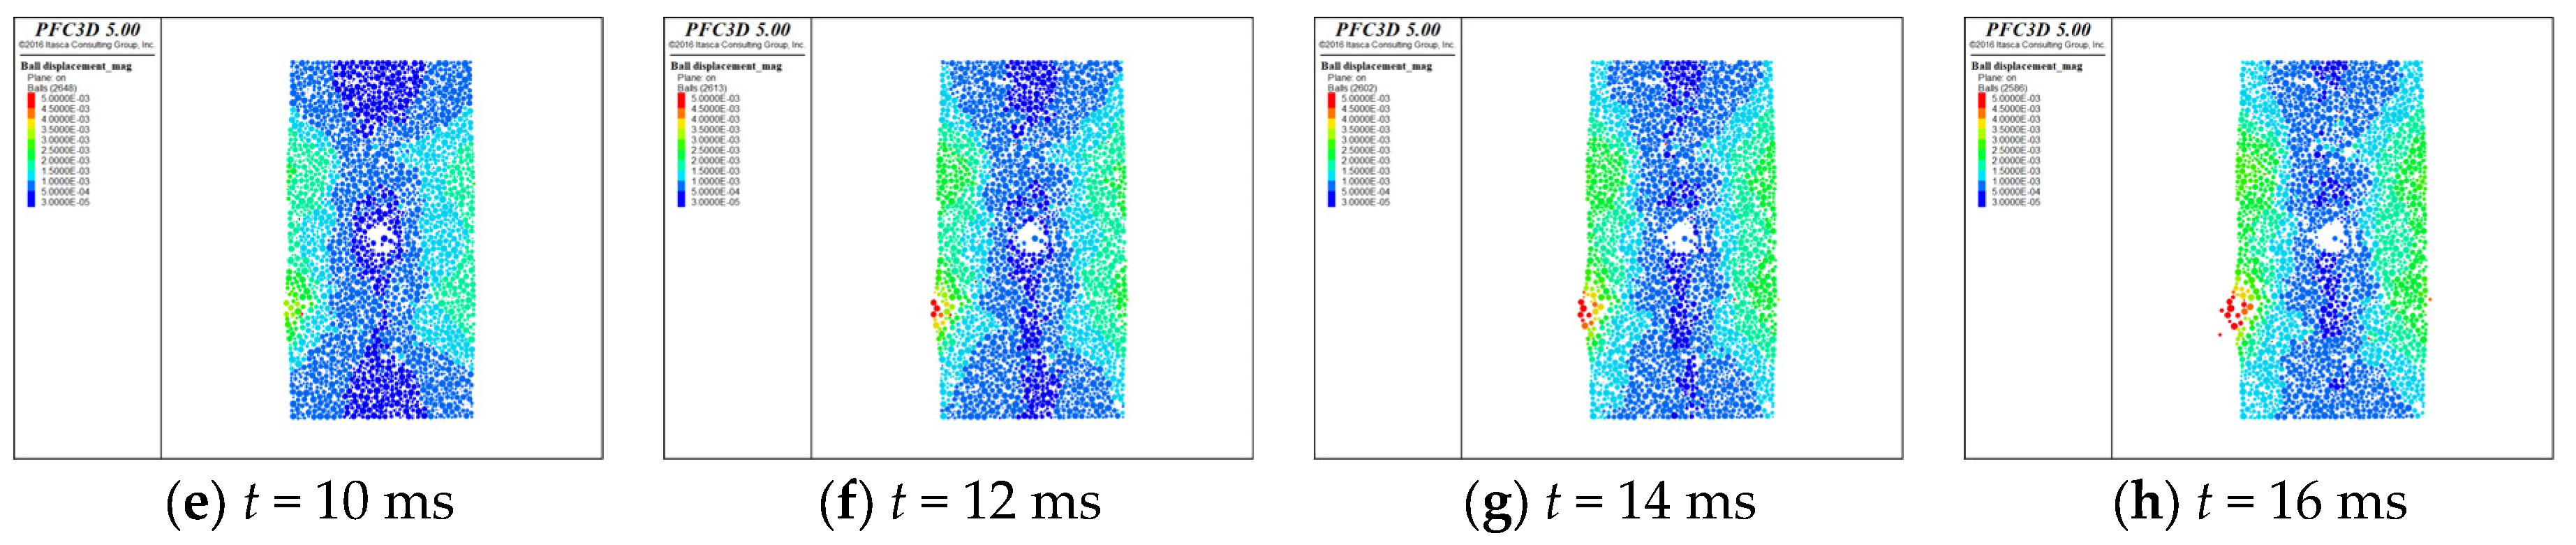
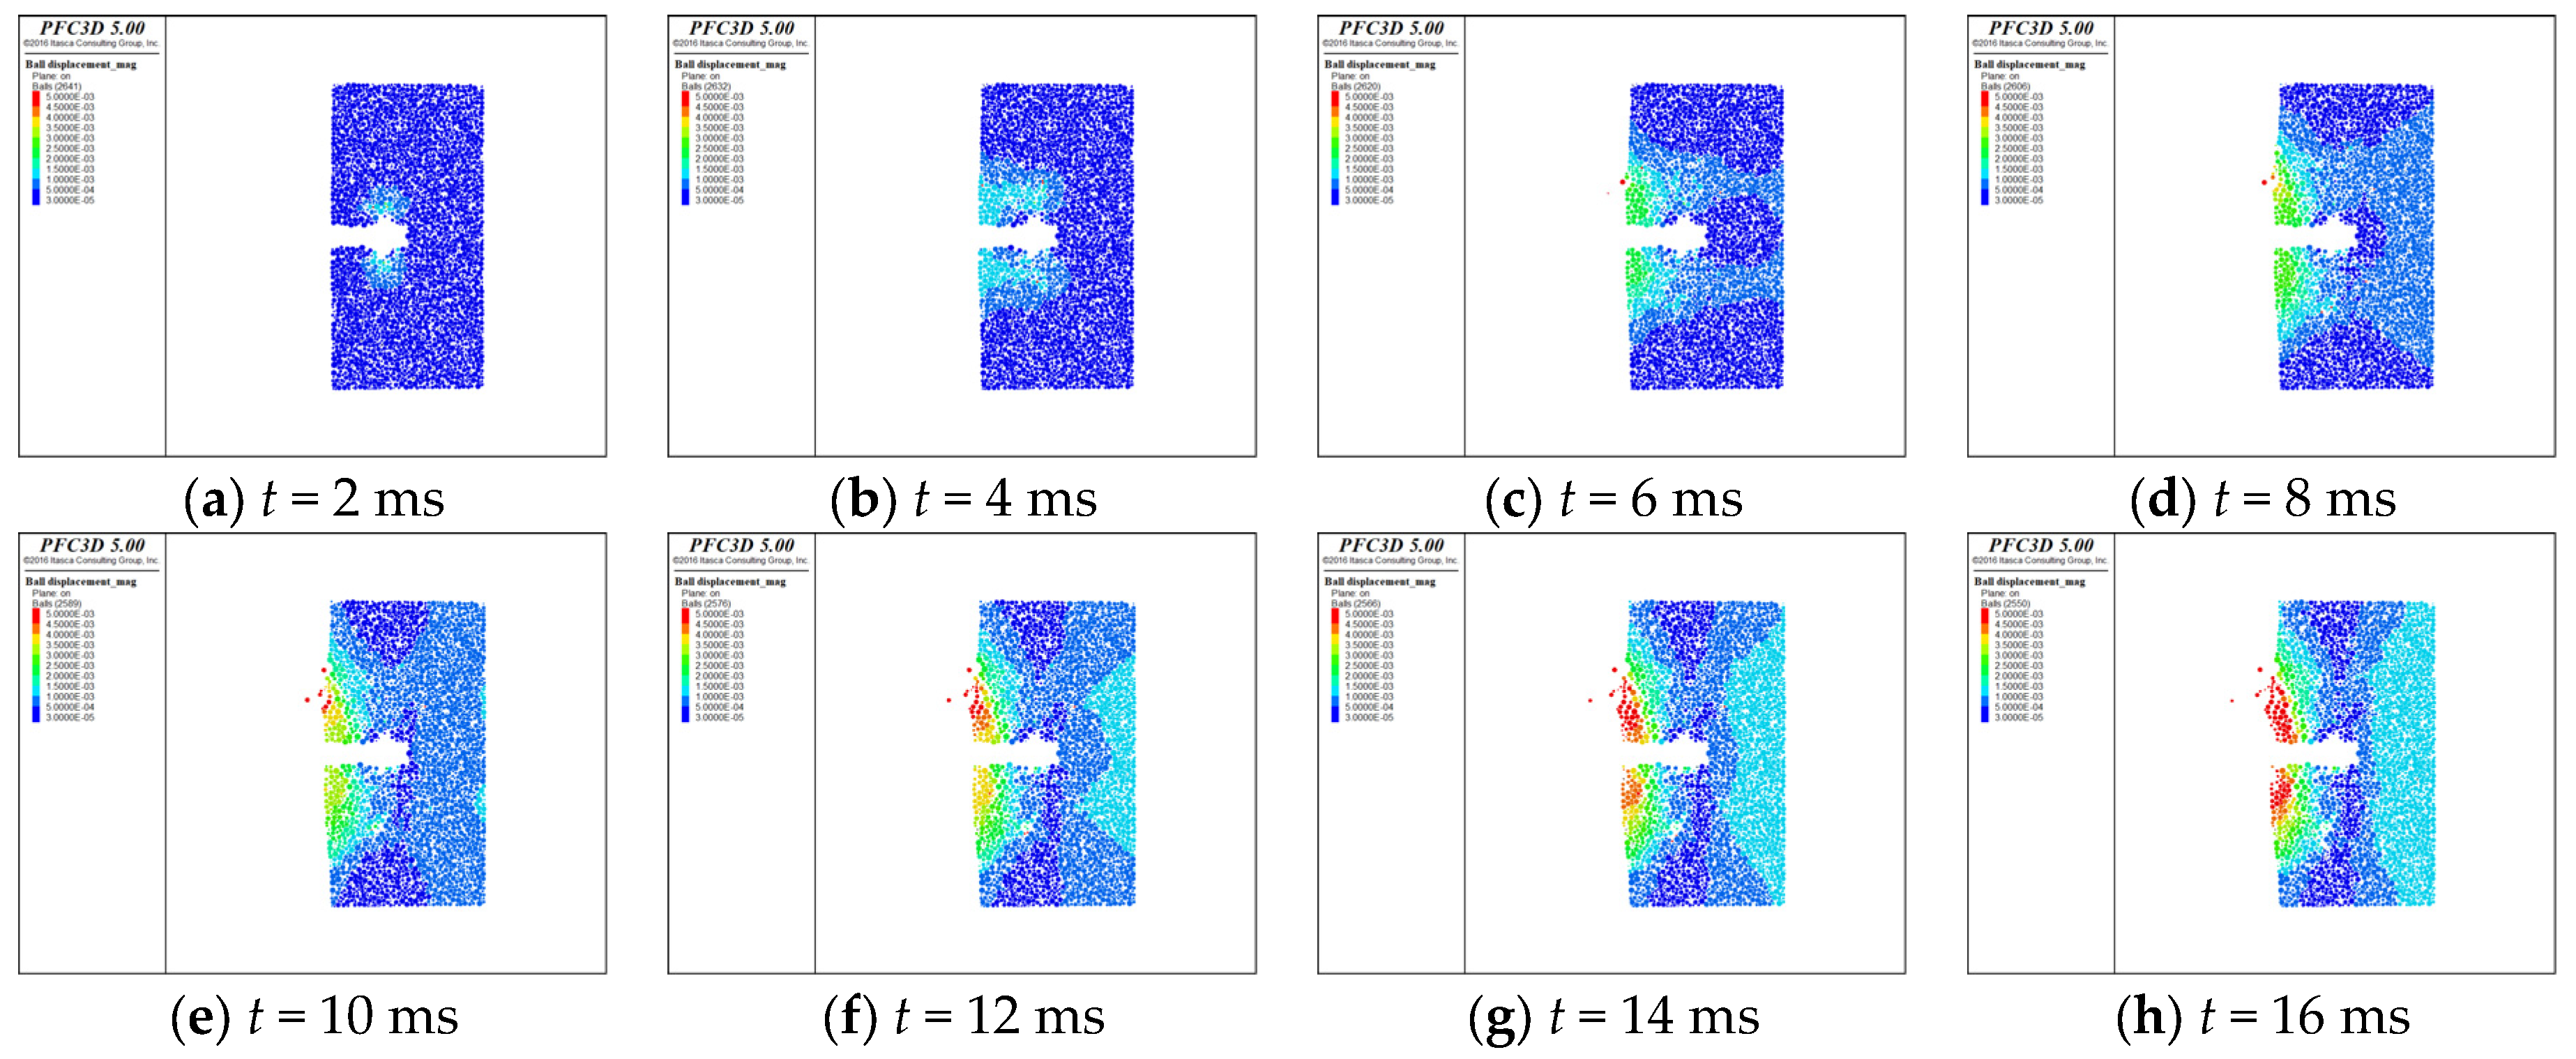
- As fracturing progresses, the tip of the directional crack initially shows an elliptical displacement pattern on the specimen’s surface. This pattern gradually transitions into an umbrella-shaped distribution of progressive failure, symmetrically developing. The maximum displacement reaches −4.153 mm.
- (3)
- Based on the simulation results, using the discrete element method effectively replicates the dynamic expansion of fracture networks throughout each stage of the CO2 fracturing process. This method serves as a foundation for studying the mechanism behind CO2-induced rock fracturing.
Author Contributions
Funding
Data Availability Statement
Acknowledgments
Conflicts of Interest
References
- Pleshko, M.; Nikolaev, P.; Davydenko, A.; Pankratenko, A. Analysis of Water Leakage Through Tunnel Lining During Subway Construction. Transp. Infrastruct. Geotechnol. 2024. [Google Scholar] [CrossRef]
- Alejandro Velastegui-Cáceres, L.; Guevara-Bonifaz, B.; Velastegui-Cáceres, J.; Carretero Poblete, P.A. Tecnologías Geoespaciales Para La Documentación Digital 3D De Las Construcciones Subterráneas Patrimoniales: Catacumbas De Sicalpa Viejo, Ecuador. Arqueología Iberoamericana 2024, 53, 104. [Google Scholar]
- Sahabandu, K. Advances in Design and Construction of Deep Excavations and Foundations in Sri Lanka. Indian Geotech. J. 2024, 1–17. [Google Scholar] [CrossRef]
- Berger, A.; Ruppert, S.; Torakai, D. Four Frankfurt—New high-rise buildings in Frankfurt am Main. Beton-Und Stahlbetonbau 2024, 119, 605–614. [Google Scholar] [CrossRef]
- Adenova, D.; Sarsekova, D.; Absametov, M.; Murtazin, Y.; Sagin, J.; Trushel, L.; Miroshnichenko, O. The Study of Groundwater in the Zhambyl Region, Southern Kazakhstan, to Improve Sustainability. Sustainability 2024, 16, 4597. [Google Scholar] [CrossRef]
- Chen, R.; Meng, F.; Li, Z.; Ye, Y.; Ye, J. Investigation of response of metro tunnels due to adjacent large excavation and protective measures in soft soils. Tunn. Undergr. Space Technol. 2016, 58, 224–235. [Google Scholar] [CrossRef]
- He, M.; Sui, Q.; Li, M.; Wang, Z.; Tao, Z. Compensation excavation method control for large deformation disaster of mountain soft rock tunnel. Int. J. Min. Sci. Technol. 2022, 32, 951–963. [Google Scholar] [CrossRef]
- Liu, H.; Li, W.; Guan, W.; Zhao, H.; Junhui, Y.; Yingyuan, W. Mechanistic Study of a Microwave Field-Controlled Static Crushing Agent for Efficient Rock Breaking. ACS Omega 2022, 7, 29344–29355. [Google Scholar] [CrossRef]
- Armaghani, D.J.; Hajihassani, M.; Mohamad, E.T.; Marto, A.; Noorani, S.A. Blasting-induced flyrock and ground vibration prediction through an expert artificial neural network based on particle swarm optimization. Arab. J. Geosci. 2014, 7, 5383–5396. [Google Scholar] [CrossRef]
- Middleton, R.S.; Carey, J.W.; Currier, R.P.; Hyman, J.D.; Kang, Q.; Karra, S.; Jiménez-Martínez, J.; Porter, M.L.; Viswanathan, H.S. Shale gas and non-aqueous fracturing fluids: Opportunities and challenges for supercritical CO2. Appl. Energy 2015, 147, 500–509. [Google Scholar] [CrossRef]
- Zeng, Y.; Li, H.; Xia, X.; Deng, S.; Zuo, H.; Yue, H.; Luo, H. Research on Time-frequency Characteristics for Blasting Vibration Signal of CO2 Blasting by Frequency Slice Wavelet Transform. Eng. Lett. 2020, 28, 1047. [Google Scholar]
- Vasyliev, L.; Malich, M.; Vasyliev, D.; Katan, V.; Rizo, Z. Improving a technique to calculate strength of cylindrical rock samples in terms of uniaxial compression. Min. Miner. Depos. 2023, 17, 43–50. [Google Scholar] [CrossRef]
- Winkler, M.B.; Frühwirt, T.; Marcher, T. Elastic Behavior of Transversely Isotropic Cylindrical Rock Samples under Uniaxial Compression Considering Ideal and Frictional Boundary Conditions. Appl. Sci. 2023, 14, 17. [Google Scholar] [CrossRef]
- Fujii, Y.; Alam, A.; Li, Z.; Du, F.; Wei, W. Implementing a simple 2D constitutive model for rocks into finite element method. Comput. Geotech. 2024, 167, 106095. [Google Scholar]
- Zhang, Z.; Liu, G.; Lin, J.; Barakos, G.; Chang, P. Fractal Evolution Characteristics on the Three-Dimensional Fractures in Coal Induced by CO2 Phase Transition Fracturing. Fractal Fract. 2024, 8, 273. [Google Scholar] [CrossRef]
- Li, Q.; Liu, X.; Wu, Z.; Xie, X. Application of liquid CO2 phase change rock breaking technology in metro foundation pit excavation. J. Railw. Sci. Eng. 2018, 15, 163–169. [Google Scholar]
- Sampath, K.; Perera, M.; Ranjith, P.; Matthai, S.; Dong-Yin, L. Qualitative and quantitative evaluation of the alteration of micro-fracture characteristics of supercritical CO2-interacted coal. J. Supercrit. Fluids 2019, 147, 90–101. [Google Scholar] [CrossRef]
- Wang, K.; Pan, H.; Fujii, Y. Study on energy distribution and attenuation of CO2 fracturing vibration from coal-like material in a new test platform. Fuel 2024, 356, 129584. [Google Scholar] [CrossRef]
- Skoczylas, N.; Dutka, B.; Sobczyk, J. Mechanical and gaseous properties of coal briquettes in terms of outburst risk. Fuel 2014, 134, 45–52. [Google Scholar] [CrossRef]
- Tian, Y.; Liu, H.; Liu, Q.; Tang, Z.; Liu, Y.; Zhang, J.; Guo, J.; Huang, X. Scale effect of rock discontinuity considering all morphological information. Geomech. Geophys. Geo-Energy Geo-Resour. 2024, 10, 124. [Google Scholar] [CrossRef]
- Xu, X.; Zhou, Y.; Yang, J.; Gao, Y.; Zhu, C.; Wang, Y.; Fu, Q. An Innovative Mechanism of Directional Rock Cracking Mechanics and Mine Pressure Control Method for Energy-Gathering Blasting. Rock Mech. Rock Eng. 2024, 1–21. [Google Scholar] [CrossRef]
- Zhou, J.; Gao, S.; Luo, P.; Fan, J.; Zhao, C. Optimization of Blasting Parameters Considering Both Vibration Reduction and Profile Control: A Case Study in a Mountain Hard Rock Tunnel. Buildings 2024, 14, 1421. [Google Scholar] [CrossRef]
- Qiu, Y.; Zhou, J.; He, B.; Armaghani, D.J.; Huang, S.; He, X. Evaluation and interpretation of blasting-induced tunnel overbreak: Using heuristic-based ensemble learning and gene expression programming techniques. Rock Mech. Rock Eng. 2024, 1–29. [Google Scholar] [CrossRef]
- Zhu, B.; Jiang, N.; Yao, Y.; Luo, X. SPH numerical simulation of SC-CO2 directional fracturing and emulsion explosives for rock breaking. Gas Sci. Eng. 2024, 124, 205277. [Google Scholar] [CrossRef]
- Arjomand, E.; Salimzadeh, S.; Mow, W.S.; Movassagh, A.; Kear, J. Geomechanical modelling of ground surface deformation induced by CO2 injection at In Salah, Algeria: Three wells, three responses. Int. J. Greenh. Gas Control 2024, 132, 104034. [Google Scholar] [CrossRef]
- Sun, K.M.; Wang, J.Y.; Xin, L.W. Research on the law of secondary cracks propagation in coal and rock caused by gas wedging during supercritical CO2 explosion under different stress differences. Chin. J. Appl. Mech. 2019, 36, 466–472. [Google Scholar]
- Zhang, Y.; Deng, J.; Deng, H.; Ke, B. Peridynamics simulation of rock fracturing under liquid carbon dioxide blasting. Int. J. Damage Mech. 2019, 28, 1038–1052. [Google Scholar] [CrossRef]
- Peng, P.; Ju, Y.; Wang, Y.; Wang, S.; Gao, F. Numerical analysis of the effect of natural microcracks on the supercritical CO2 fracturing crack network of shale rock based on bonded particle models. Int. J. Numer. Anal. Methods Geomech. 2017, 41, 1992–2013. [Google Scholar] [CrossRef]
- Lin, B.; Wang, R.; Qiao, S. Characteristics and mechanism of multistage fluctuation of coal-breaking caused by high-pressure gas-liquid two-phasel jet. J. China Coal Soc. 2018, 43, 124–130. [Google Scholar]
- Zhang, D.M.; Bai, X.; Yin, G.Z.; Li, S.; Rao, Z.; He, Q. Mechanism of breaking and fracture expansion of liquid CO2 phase change jet fracturing in low-permeability coal seam. J. China Coal Soc. 2018, 43, 3154–3168. [Google Scholar]
- Jiao, K.; Han, D.; Li, J.; Bai, B.; Gong, L.; Yu, B. A novel LBM-DEM based pore-scale thermal-hydro-mechanical model for the fracture propagation process. Comput. Geotech. 2021, 139, 104418. [Google Scholar] [CrossRef]
- Li, X.; Li, C.; Cao, W.; Tao, M. Dynamic stress concentration and energy evolution of deep-buried tunnels under blasting loads. Internaltional J. Rock Mech. Min. Sci. 2018, 104, 131–146. [Google Scholar] [CrossRef]
- Zhu, H. PFC and application case of caving study. Chin. J. Rock Mech. Eng. 2006, 25, 1927–1931. [Google Scholar]
- Liu, B.; Yao, J.; Sun, H.; Zhang, L. Effects of natural fracture reopening on proppant transport in supercritical CO2 fracturing: A CFD-DEM study. Geoenergy Sci. Eng. 2024, 238, 212906. [Google Scholar] [CrossRef]
- Zhang, B.; Zhang, C.; Ma, Z.; Zhou, J.; Liu, X.; Zhang, D.; Ranjith, P. Simulation study of micro-proppant carrying capacity of supercritical CO2 (Sc-CO2) in secondary fractures of shale gas reservoirs. Geoenergy Sci. Eng. 2023, 224, 211636. [Google Scholar] [CrossRef]
- Wang, B.; Li, H.; Xing, H.; Li, X. Modelling of gas-driven fracturing and fragmentation in liquid CO2 blasting using finite-discrete element method. Eng. Anal. Bound. Elem. 2022, 144, 409–421. [Google Scholar] [CrossRef]
- Pan, H.; Wang, K.; Zhang, T.; Qin, B.; Zhang, Z. Particle flow simulation of CO2 explosion fracture evolution in coal seam with control holes. J. Xi’an Univ. Sci. Technol. 2021, 41, 230–236. [Google Scholar]
- Wang, G.; Wu, M.; Wang, R.; Xu, H.; Song, X. Height of the mining-induced fractured zone above a coal face. Eng. Geol. 2017, 216, 140–152. [Google Scholar] [CrossRef]
- Maqsood, Z.; Koseki, J.; Ahsan, K.; Shaikh, M.; Kyokawa, H. Experimental study on hardening characteristics and loading rate dependent mechanical behaviour of gypsum mixed sand. Constr. Build. Mater. 2020, 262, 119992. [Google Scholar] [CrossRef]
- Maqsood, Z.; Koseki, J.; Miyashita, Y.; Xie, J.; Kyokawa, H. Experimental study on the mechanical behaviour of bounded geomaterials under creep and cyclic loading considering effects of instantaneous strain rates. Eng. Geol. 2020, 276, 105774. [Google Scholar] [CrossRef]
- Yin, P.F.; Yang, S.Q.; Gao, F.; Tian, W.L. Experiment and DEM simulation study on mechanical behaviors of shale under triaxial cyclic loading and unloading conditions. Geomech. Geophys. Geo-Energy Geo-Resour. 2023, 9, 10. [Google Scholar] [CrossRef]
- Li, H.; Li, S.; Xiao, W. Star power factor correction architecture. IEEE Trans. Power Electron. 2022, 38, 3531–3545. [Google Scholar] [CrossRef]
- Okubo, S.; Fukui, K. Complete stress-strain curves for various rock types in uniaxial tension. Int. J. Rock Mech. Min. Sci. Geomech. Abstr. 1996, 33, 549–556. [Google Scholar] [CrossRef]
- Shi, C.; Zhang, Q.; Wang, S. Particle Flow Code (PFC5.0): Numerical Simulation Technology and Application; China Architecture & Building Press: Beijing, China, 2018. [Google Scholar]
- Li, M.; Zhang, F.; Zhuang, L.; Zhang, X.; Ranjith, P. Micromechanical analysis of hydraulic fracturing in the toughness-dominated regime: Implications to supercritical carbon dioxide fracturing. Comput. Geosci. 2020, 24, 1815–1831. [Google Scholar] [CrossRef]
- McCraw, C.; Edlmann, K.; Miocic, J.; Gilfillan, S.; Haszeldine, R.S.; McDermott, C.I. Experimental investigation and hybrid numerical analytical hydraulic mechanical simulation of supercritical CO2 flowing through a natural fracture in caprock. Int. J. Greenh. Gas Control 2016, 48, 120–133. [Google Scholar] [CrossRef]
- Tatomir, A.; Tomac, I.; Sauter, M. A Parametric Sensitivity Study on CO2 Injection in Deep Saline Aquifers Accounting for Hydro-Mechanical Microfracturing; Energy Geotechnics: Kiel, Germany, 2016; pp. 223–230. [Google Scholar]
- Gheibi, S.; Vilarrasa, V.; Holt, R.M. Numerical analysis of mixed-mode rupture propagation of faults in reservoir-caprock system in CO2 storage. Int. J. Greenh. Gas Control 2018, 71, 46–61. [Google Scholar] [CrossRef]


| Particle Parameter | Values | Bonding Parameter | Values |
|---|---|---|---|
| Minimum particle radius (mm) | 0.5 | knContact | 0.8 × 10⁶ |
| Maximum particle radius (mm) | 1.5 | ksContact | 0.6 × 10⁶ |
| Particle density (kg/m3) | 1500 | pbkncontact | 3.0 × 10¹⁰ |
| Contact damping | 0.7 | pbkscontact | 4.0 × 10¹⁰ |
| Friction coefficient | 0.5 | tenPbond | 1.0 × 10⁶ |
| cohPbond | 1.1 × 10⁶ | ||
| fapbond | 30 | ||
| gapbond | 1.0 × 10⁻⁶ | ||
| fricContract | 0.2 |
| Model | Destructive Forms | |
|---|---|---|
| Real | Numerical | |
| non-prefabricated cracks | 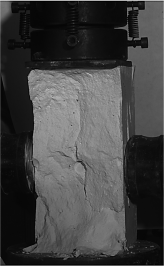 |  |
| prefabricated cracks |  |  |
| Model | Frontal Section | Lateral Section |
|---|---|---|
| non-prefabricated cracks |  |  |
| prefabricated cracks | 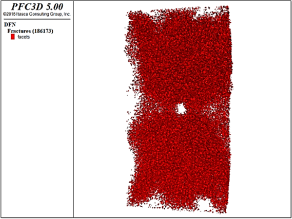 | 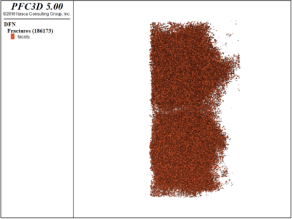 |
Disclaimer/Publisher’s Note: The statements, opinions and data contained in all publications are solely those of the individual author(s) and contributor(s) and not of MDPI and/or the editor(s). MDPI and/or the editor(s) disclaim responsibility for any injury to people or property resulting from any ideas, methods, instructions or products referred to in the content. |
© 2024 by the authors. Licensee MDPI, Basel, Switzerland. This article is an open access article distributed under the terms and conditions of the Creative Commons Attribution (CC BY) license (https://creativecommons.org/licenses/by/4.0/).
Share and Cite
Wang, K.; Chang, C. Simulation Study on Rock Crack Expansion in CO2 Directional Fracturing. Processes 2024, 12, 1813. https://doi.org/10.3390/pr12091813
Wang K, Chang C. Simulation Study on Rock Crack Expansion in CO2 Directional Fracturing. Processes. 2024; 12(9):1813. https://doi.org/10.3390/pr12091813
Chicago/Turabian StyleWang, Kang, and Chunguang Chang. 2024. "Simulation Study on Rock Crack Expansion in CO2 Directional Fracturing" Processes 12, no. 9: 1813. https://doi.org/10.3390/pr12091813