1. Introduction
Shale oil, as an important unconventional oil and gas resource, is widely developed in North America and Eurasia [
1]. China’s shale oil resources are mainly distributed in the Bohai Bay Basin, Junggar Basin, Ordos Basin, and Songliao Basin. The poor tectonic environment and variable depositional environments led to a number of challenges in China’s continental-phase shale oil exploration and development [
2,
3,
4,
5].
Liquid hydrocarbons in shale usually exist in three phases, namely, free, adsorbed, and dissolved phases [
6], and are distributed in shale formations in the form of spots or layers. Adsorbed and dissolved oils are usually associated with kerogen or solid asphalt, with a high content of asphaltene and non-hydrocarbon fractions; free oils are usually stored in mineral pores, with a high content of saturated hydrocarbon fractions [
7]. Under certain technical conditions, the free oil can be extracted generally, which belongs to movable oil [
8]. Nuclear magnetic resonance (NMR), as a non-destructive measurement technology, is widely used in the field of oil and gas mobilization research [
9,
10,
11], and the NMR becomes a mature technical strategy to study the mobility of shale oil [
12]. The one-dimensional scanning of NMR
T2 spectrum and the two-dimensional scanning of
T1–
T2 spectrum can better respond to the shale oil distribution status, mobilization range, and so on [
13,
14,
15,
16,
17]. The shale skeleton itself also features the NMR signal’s intensity, and its background signals should be fully considered when shale oil movability analysis is conducted [
18,
19]. According to the differences of the NMR spectra, the oil production status and oil production quantity can be quantitatively characterized [
20,
21].
Shale pore structure, degree of fracture development, and formation pressure are key factors in qualitatively evaluating shale oil mobility [
22]. Shale oil is mainly enriched in pores smaller than 100 nm, in which the lower limit of pore size for free oil enrichment is 5 nm [
23]. By analyzing the changes in oil content and pore structure of shale before and after soluble organic matter extraction, Zhu et al. concluded the following critical conditions: the content of movable oil should be greater than 0.7%, and average pore size should be greater than 12.1 nm [
24]. Han et al. compared the change in the aperture of the pores in shale before and after the soluble organic matter extraction, and found that the micropores’ volume of the sample increased significantly after extraction, which led to the conclusion that shale oil is mainly stored in micropores with pore sizes below 2 nm [
25]. NMR technology is also unique in characterizing shale pore structure. Using the combined characterization of high-pressure mercury pressure, gas adsorption, and NMR, the conversion between transverse relaxation time and pore radius can be effectively realized [
26]. Based on the combined characterization of multi-testing methods, the pores in porous media reservoirs can be accurately classified. Hu et al. classified the pores in the tight sandstone reservoirs as micron-sized macropores, micron-sized micropores, submicron pores, and nano-pore types [
27]; Peng et al. classified the pores in tight limestone into micropores, small pores, medium pores, and large pores [
28]; and Wang et al. classified the pores in tight sandstone reservoirs into three types, namely, completely immobile pores, partially mobile pores, and completely mobile pores based on the mobility characteristics [
29]. In recent years, Li et al. finely classified the fluid-distributed pores in different types of tight sandstones with the NMR
T2 spectra and fractal theory [
30,
31,
32].
In this study, the shale samples collected from Chang 7 Member of the Yanchang Formation in Ordos Basin were obtained as the research object, with detailed measurements of properties and petrology of the shale samples, 14 d saturation of dodecane measurements were launched with the NMR technology under 20 MPa and 60 °C; combined with an enhanced classification method of the fluid distribution pore spaces, the shale oil saturation characteristics in various pores and fractures were quantitatively characterized.
2. Methodology
2.1. Samples Collection
The shale samples for this study were collected from the Chang 7 Member of the Yanchang Formation in Ordos Basin. There are three different types of shale in the Chang 7 Member: shale-type shale, textured shale, and interbedded shale. The shale-type shale features as shale structure, the slit-sandstone and mudstone in the textured shale presents as interlayered, and the interbedded shale features the similar characteristics of the textured shale, while the thickness of slit-sandstone and mudstone commonly exceeds 10 cm. The shale sample used in this study are shale-type shale, and the shale samples were collected from a full-diameter core to avoid possible errors. The shale-type shale is tight, with an extremely low porosity of 1.00%. However, the permeability of the shale-type shale is larger due to the presence of certain shale fractures, and the permeability of shale gas measurements is generally more than 0.10 × 10
−3 μm
2 (
Table 1). Clay minerals, plagioclase feldspar, and quartz are the main inorganic minerals, and carbonate minerals (calcite and dolomite) and other brittle minerals such as pyrite are very low. In addition, the clay minerals are dominated by illite/smectite formation (
Table 1).
2.2. Experimental Procedures
Firstly, the shale samples were pre-treated to remove the crude oil and water before the measurements. Conventional organic solvents such as benzene or carbon tetrachloride are used for pre-treatment of tight sandstone samples. However, the shale features a high content of clay minerals, and conventional organic chemical solvents can easily lead to shale hydration during the cleaning procedures, which may damage the shale samples. Therefore, the pre-treatment of shale samples was carried out by heating in a drying oven under 80 °C in this study. The standard plunger samples obtained by low-speed wire cutting were placed in the drying box. The shale samples were weighed every 24 h using a high-precision balance, and the shale samples were considered to be dried when the quality of the shale samples varied within ±0.001 g.
Low-velocity drive saturation is a common method for saturating tight sandstones with fluids. However, shale-type shale is extremely tight, and conventional saturated fluid methods are difficult to apply. In this study, the method of saturating fluids under stratigraphic temperature (60 °C) and pressure (20 MPa) conditions was used to saturate the shale samples with fluids. A self-designed high-temperature and high-pressure containment device was used to saturate the shale oil; the maximum temperature and pressure can reach 120 °C and 60 MPa respectively. The size of the high-temperature and high-pressure closed vessel is φ 100 mm × 3000 mm, and the outside of the vessel is wrapped with an insulating device, with a temperature control accuracy of ±0.1 °C, and the simulated oil used for the experiment is dodecane. The experimental procedures are as follows:
- (1)
Close the outlet end of the high-temperature and high-pressure containment device, the deionized water is injected into the high-temperature and high-pressure containment device from the injection end at a speed of 0.1 mL/min. The valve of the injection end would be closed when the pressure reaches 20 MPa, the instrument would be maintained for 24 h to check the sealing.
- (2)
Launch the NMR T2 spectrum of the pre-treated standard plunger core to obtain the NMR T2 spectrum of the dry core.
- (3)
Place the shale core in a high-temperature and high-pressure containment device, the measurement pressure and temperature would be set as 20 MPa and 60 °C, respectively; the NMR T2 spectrum scanning would be launched when the core sample is saturated for 48 h.
- (4)
Repeat step (3) with a step length of 2 d, and carry out NMR T2 spectra scanning of the shale core at different saturation times: 2 d, 4 d, 6 d, 8 d, 10 d, 12 d, and 14 d, and consider the core saturated when there is no obvious change in the NMR T2 spectra curve.
2.3. Selection of NMR Instrument Parameters
As a non-destructive measurement technique, NMR can realize multiple scans of the same sample to ensure the continuity and integrity of the experimental results. However, the selection of NMR instrument parameters has an important influence on the accuracy of the sample. The NMR instrument used in this study is the PQ001 NMR instrument produced by Niumai, which adopts a permanent magnet with a magnetic field strength of 0.28 ± 0.03 T, an RF pulse frequency range of 1 MHz~30 MHz, and an RF frequency control accuracy of 0.1 Hz, with a probe coil diameter of 25 mm. Before conducting the NMR test, the sampling frequency (SW), waiting time (TW), preamplification gain (PRG), number of scans (NS), and number of echoes (NECH) were selected.
SW should not be less than 100 KHz in most cases, the smaller SW is easy to lead to the loss of some effective signals in the samples, and usually the SE value should not be lower than 100 KHz. In this study, the SW was set to 125 KHz, 200 KHz, 250 KHz, 333 KHz, and 500 KHz. The fast relaxation signal and high signal amplitude of nanopore space are used as the criteria for selecting the preferred SW parameter, and the optimal SW value of 250 KHz is screened out. The PRG can improve the signal lightness of the samples effectively, and it is usually enough to reach 70% of the saturation value of the receiver, and it is better to set the PRG value of 1 in the present study. According to the principle of the highest preference for the consistency of the morphology of the NMR
T2 spectra and the signal-to-noise ratio, TW, NS, and NECH values were screened to be 2500 ms, 64, and 5000 (
Figure 1).
2.4. Classification of Fluid Distribution Pores
The shale features porous medium characteristics, meaning the shale presents fractal characteristics. The NMR transverse relaxation time
T2 corresponds to the aperture of pores in the shale, which can be utilized to feature the fractal characteristics of the shale,
where
Svi is the cumulative signal amplitude percentage below
T2i, %;
Di is the fractal dimension at
T2i, dimensionless;
T2i is the transverse relaxation time, ms; and the
T2max is the maximum transverse relaxation time in the measurements, ms.
Equation (1) can be utilized to initially delineate the large-scale fracture and small-scale pore-seam systems in shale samples. In addition, the correlation coefficient
Ri2 mutation point of lg(
Svi) and lg(
T2i) under different lateral relaxation times can be used to further distinguish the fluid distribution pores,
where
is the correlation coefficient between lg(
Svi) and lg(
T2i) at
T2i,
j = 1, 2, with 1 representing the small-scale pore-fracture system and 2 representing the large-scale fracture;
is the correlation coefficient between lg(
T2i+1) and lg(
Svi+1) under the transverse chilling time
T2i+1.
Combined with Equations (1) and (2), the types of fluid distribution pores in shale can be distinguished, and the differences of saturated oil in various types of pore-fracture systems can be quantitatively characterized.
3. Results and Discussion
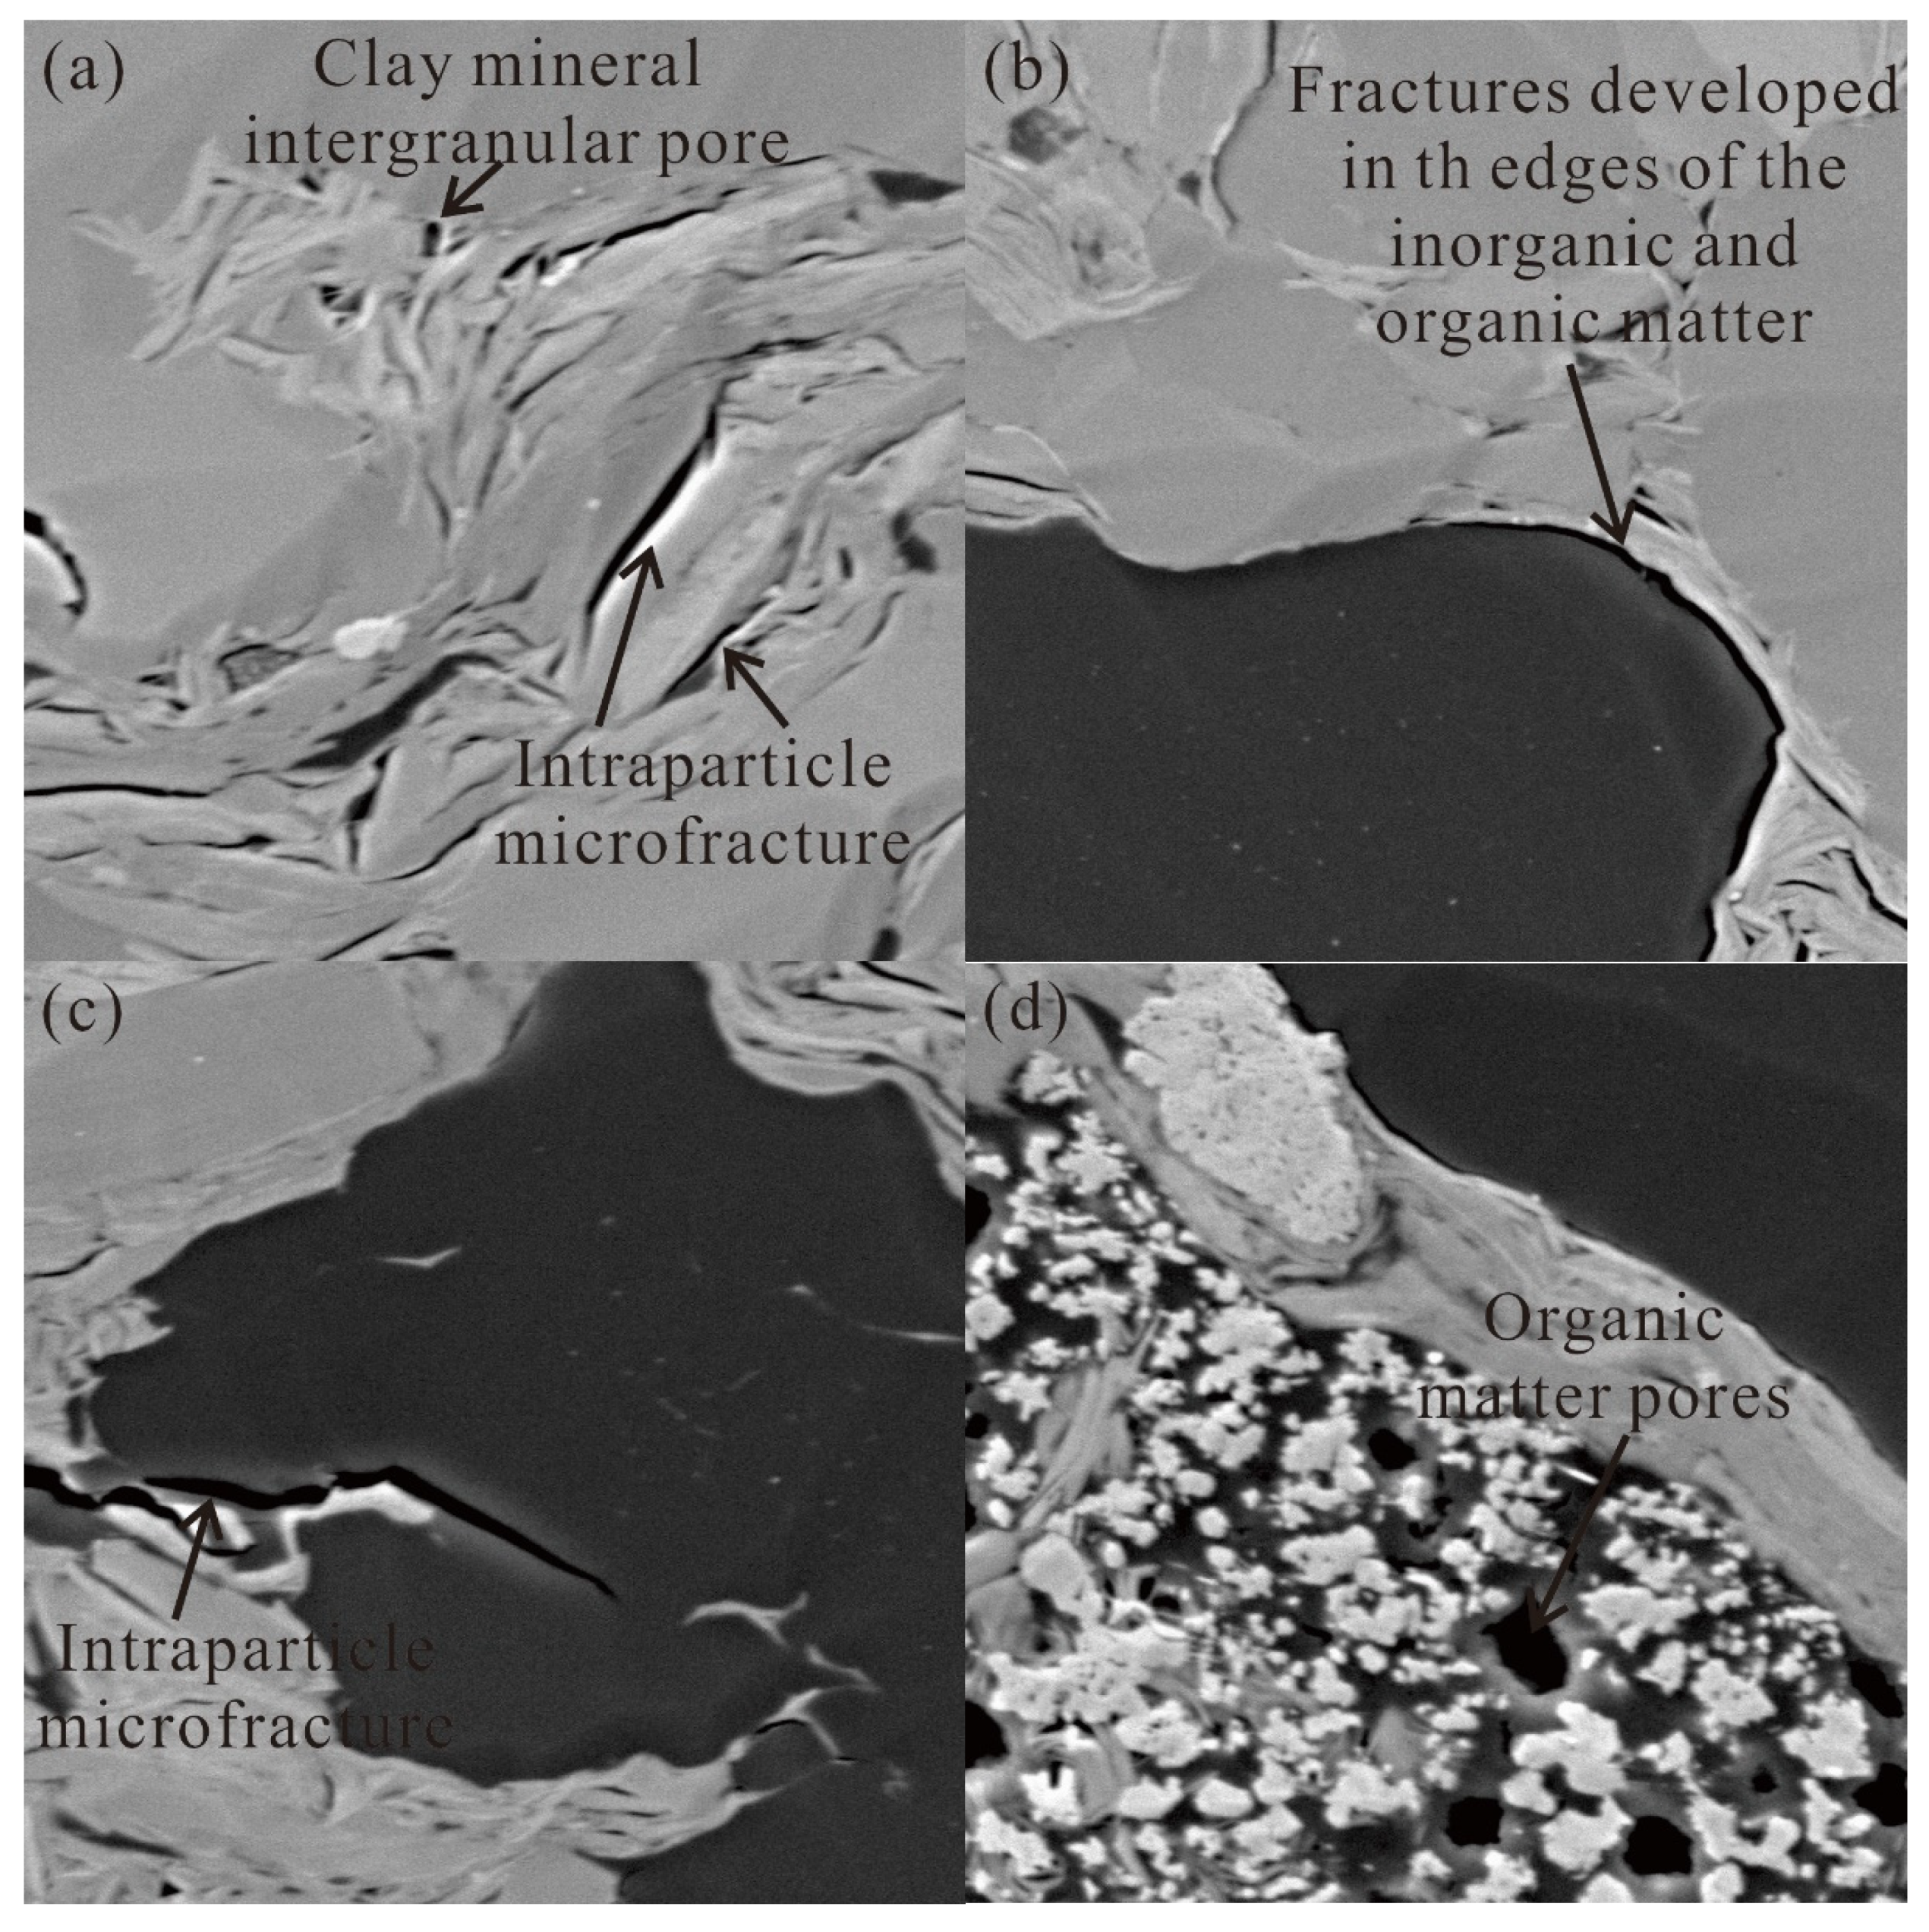
3.1. Pore Types in Shale
There are many types of pores in shale, and there are more classification methods, the more typical ones are the pore classification methods of Loucks et al., Slatt and O’Neal, and Yu et al. [
33,
34,
35]. Based on the previous pore classification for shale, it can be found that the storage space in the Chang 7 Member shale can be roughly distinguished into several types, such as clay mineral intergranular pores, intraparticle microfractures, organic matter pores, organic matter fractures, and fractures developed in the edges of the inorganic and organic matter with the MIRA3 high-resolution field-emitting electron microscopy produced in the Czech Republic (
Figure 2).
3.2. Shale Oil Saturation Characteristics
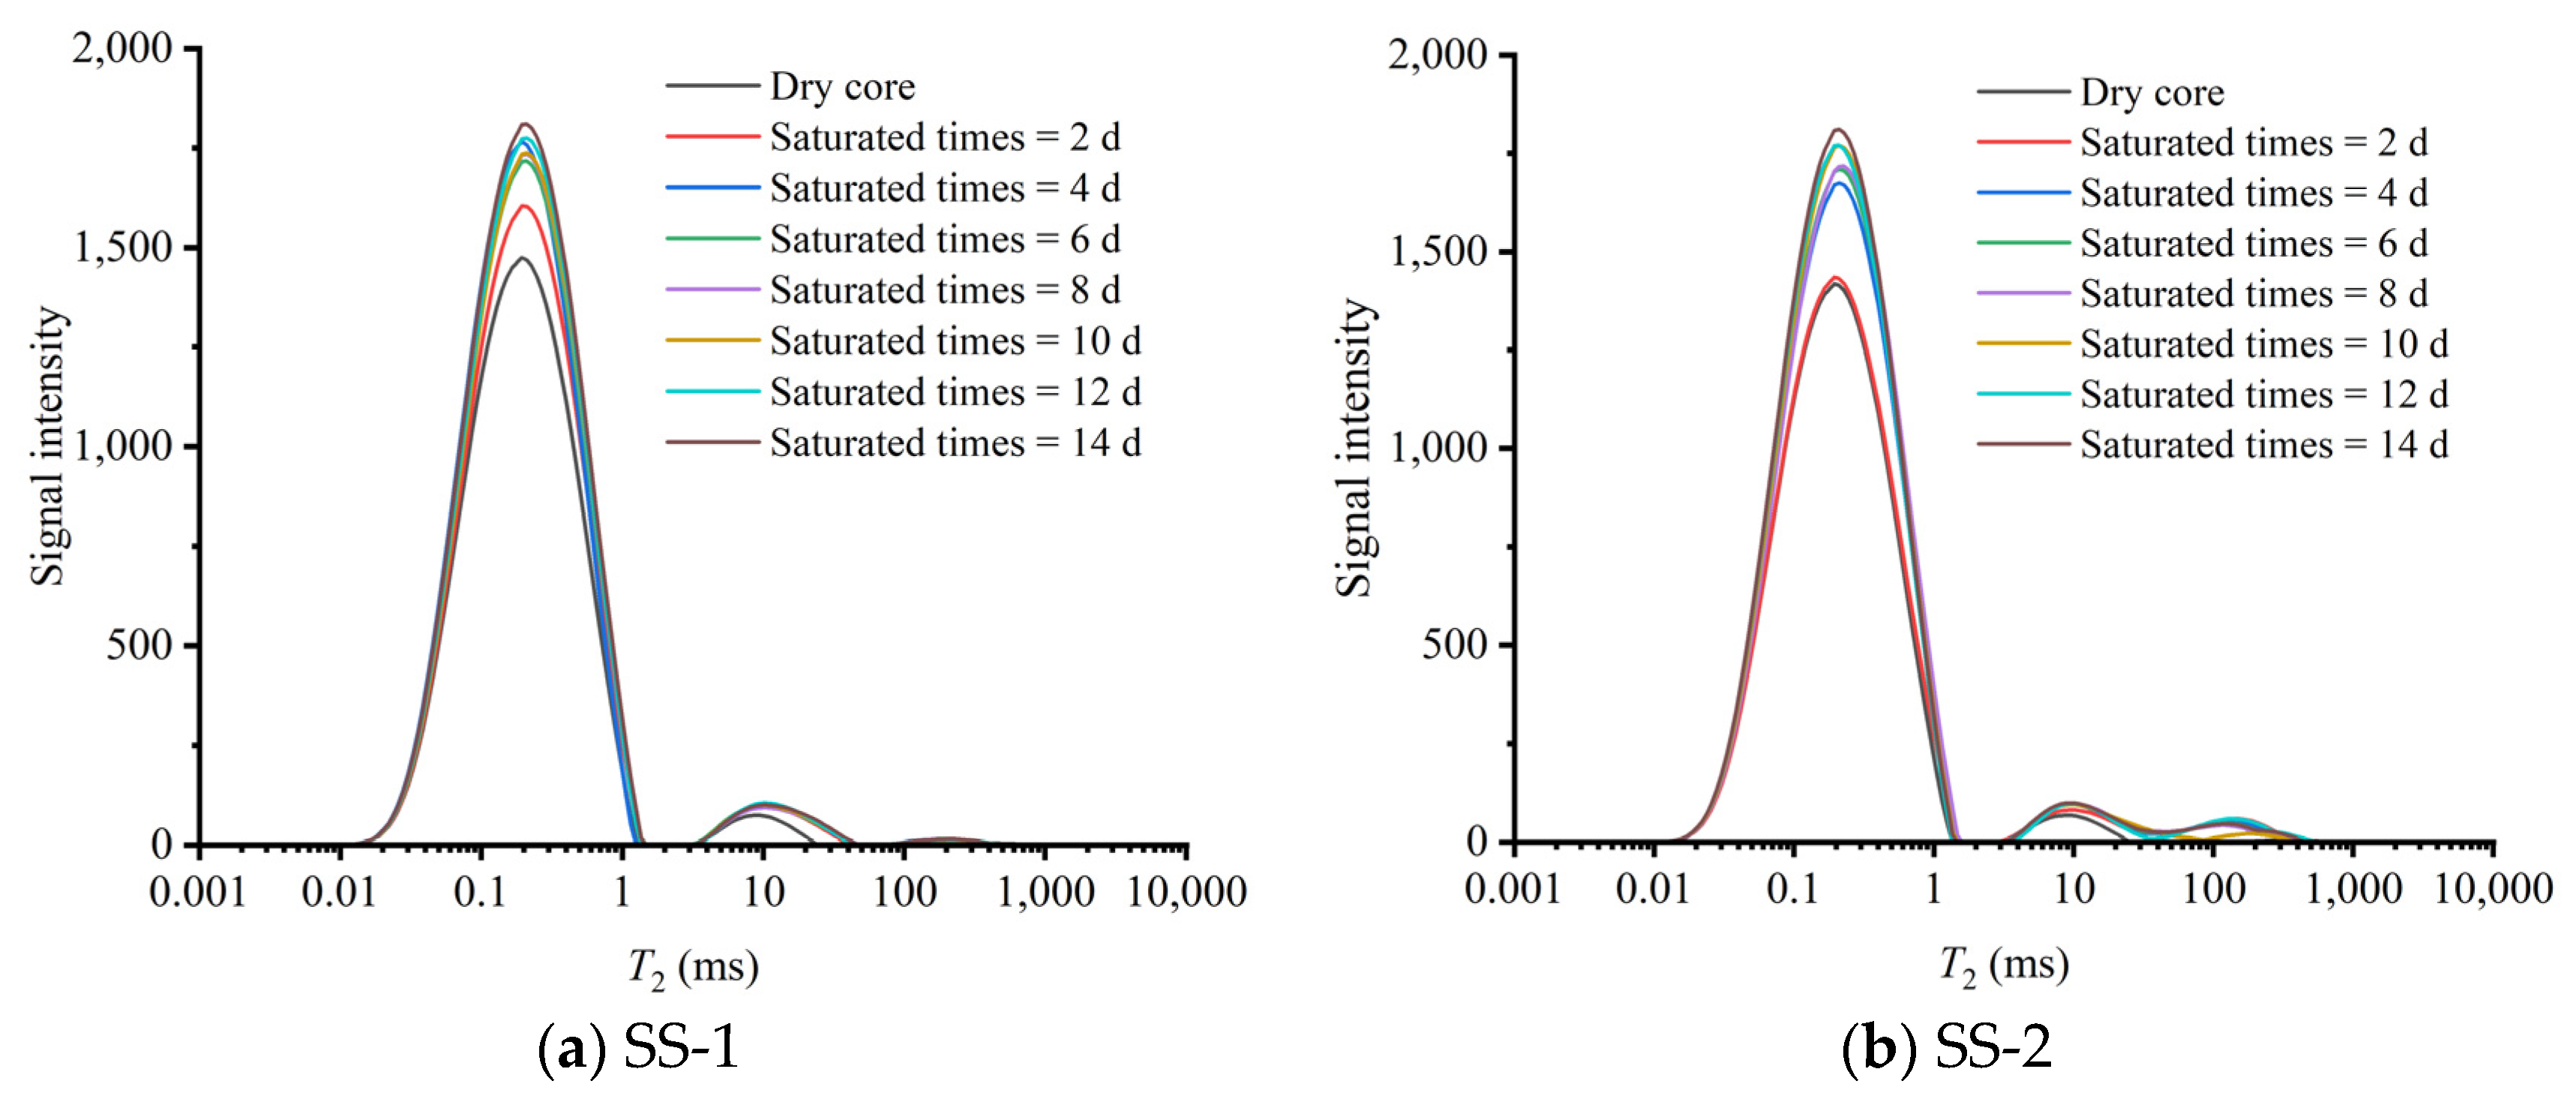
Shale itself contains a certain amount of organic matter, and the dry core also shows a more pronounced NMR signal intensity. The NMR
T2 spectrum of the dry shale core shows an obvious double-peak pattern; the left peak (
T2 < 2 ms) is extremely developed, while the right peak (
T2 > 2 ms) has a small distribution range and weak signal intensity, which is a typical NMR
T2 spectrum characteristic of shale. The left peak of the NMR
T2 spectrum represents smaller-sized pores in the shale, indicating that the shale is tight, while the right peak indicates that there are a certain number of microfractures in the shale [
36,
37]. The layer fractures were sharply saturated by the dodecane hydrocarbons at the initial 2 days as shown in
Figure 3, and the signal intensity of the left peak features a continuous increase with the increase in saturation time, especially at the initial 4 days. Subsequently, its features slowly increase, and it tends to be stable after 14 days of saturation (
Figure 3).
During the process of shale core saturation with dodecane hydrocarbons using a high-temperature and high-pressure containment device, the dodecane hydrocarbons entering the core can be regarded as movable hydrocarbons in shale. To effectively calculate the amount of movable hydrocarbons in shale at different saturation times, the concept of liquid hydrocarbon saturation is proposed in this study to quantitatively characterize it,
where
S is the liquid hydrocarbon saturation, %;
Si is the shale NMR
T2 spectral area at day
i of saturation,
i = 2, 4, 6, 8, 10, 12, 14, dimensionless;
Sd is the shale dry core NMR
T2 spectral area, dimensionless.
In addition, to quantitatively characterize the differences in the degree of dodecane hydrocarbon saturation at different saturation times, the concept of liquid hydrocarbon saturation degree was used to characterize it,
where
η is the degree of liquid hydrocarbon saturation, %;
Si+1 is the shale NMR
T2 spectral area at day
i + 1 of saturation,
i = 2, 4, 6, 8, 10, 12, 14, dimensionless;
Si is the shale NMR
T2 spectral area at day
i of saturation, dimensionless.
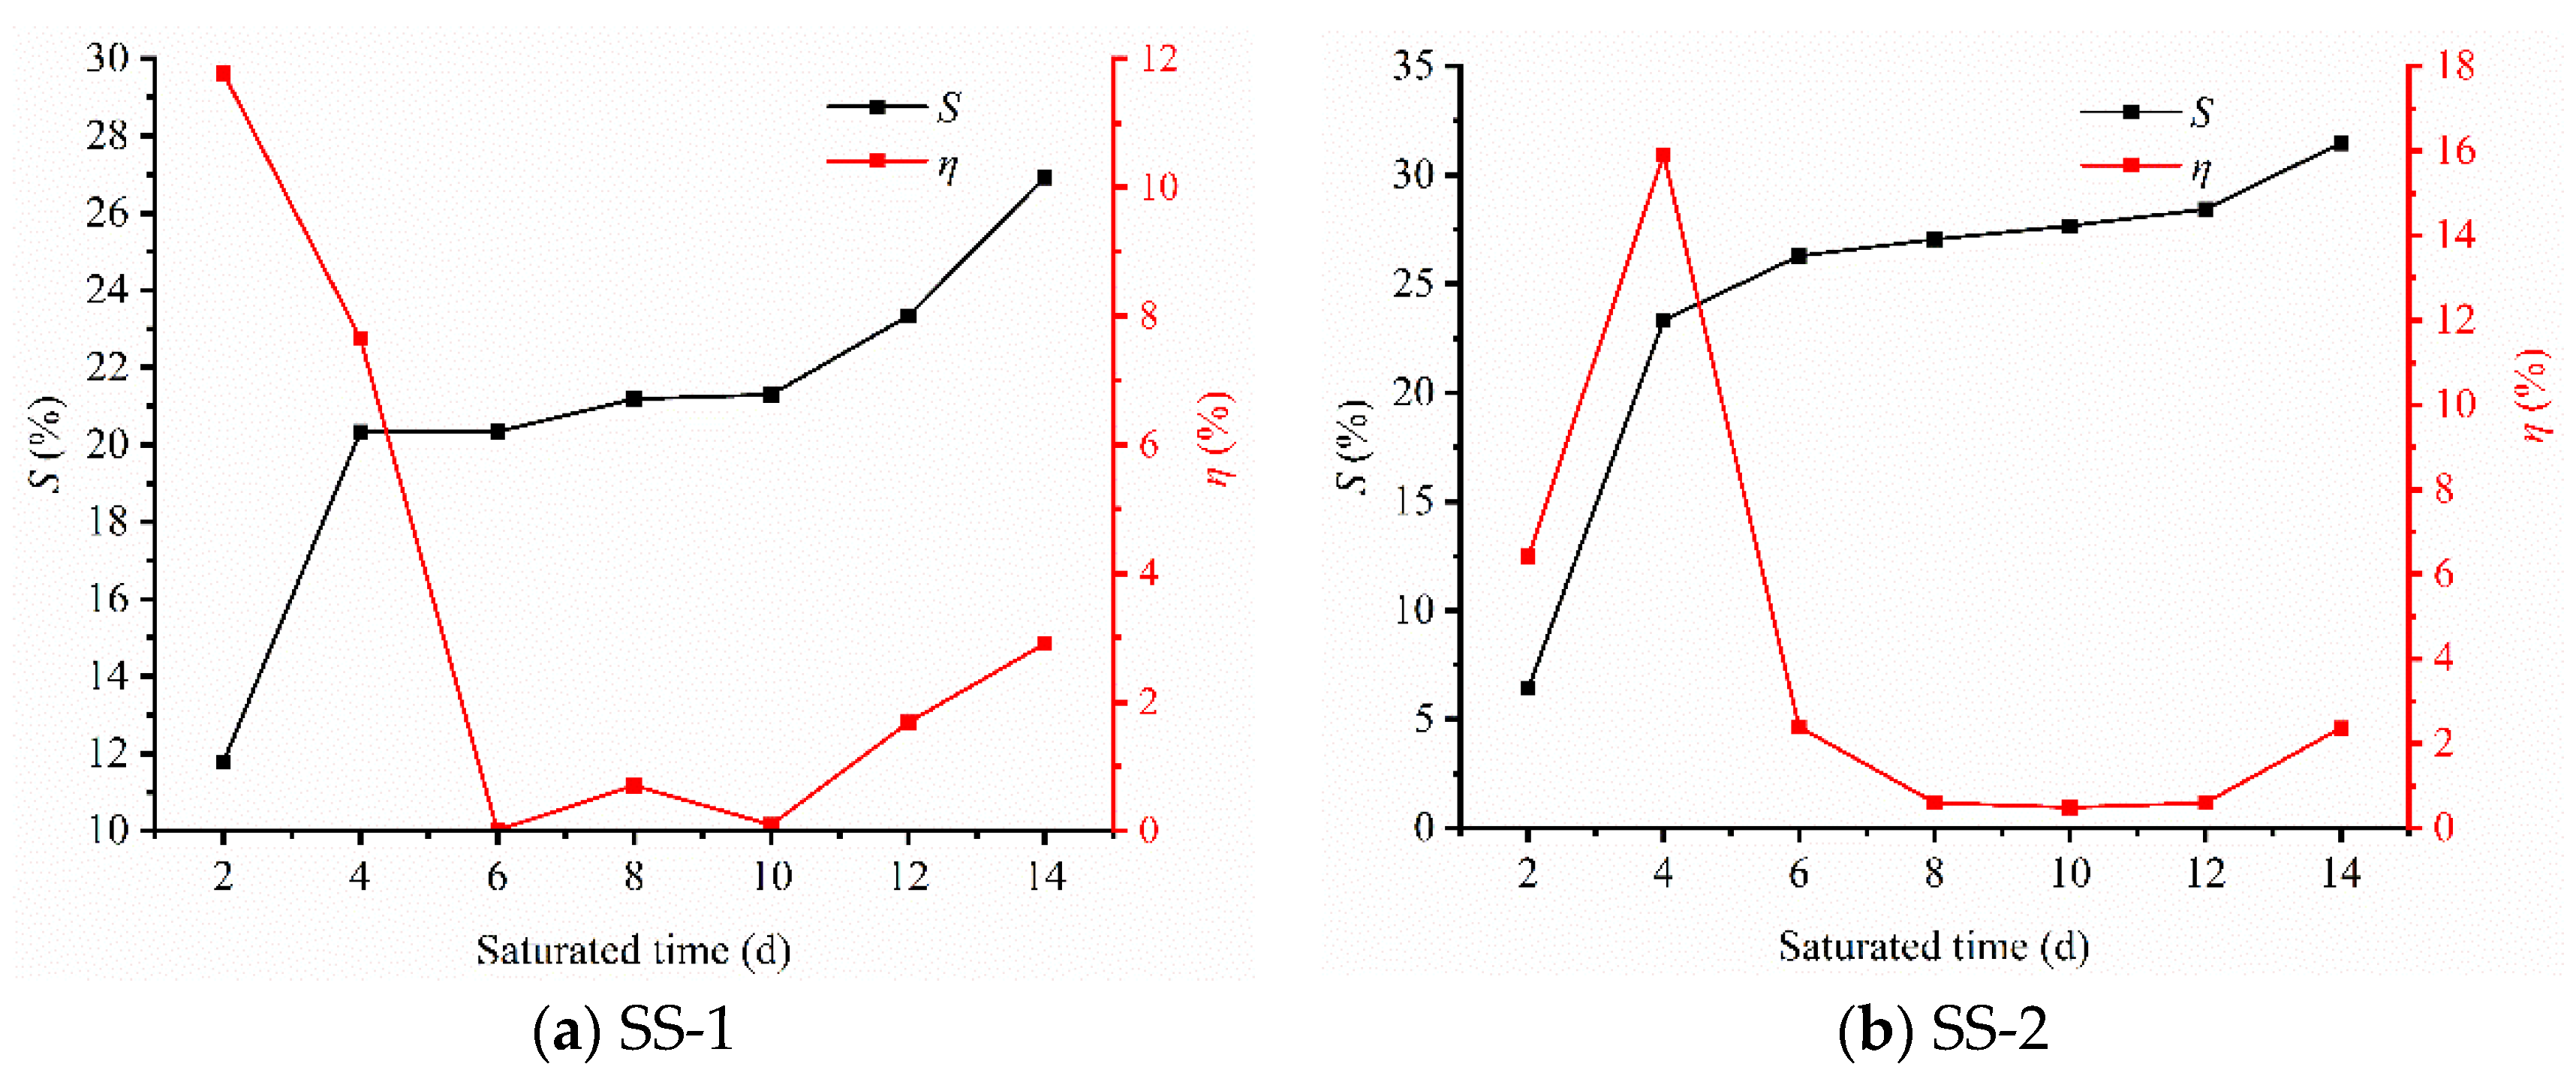
The liquid hydrocarbon saturation of SS-1 and SS-2 shale samples showed an obvious three-stage structure with the continuation of the saturation time. The liquid hydrocarbon saturation showed a rapid increase in the first 4 d of dodecane hydrocarbon saturation, then the liquid hydrocarbon saturation showed a slow increase, and after the liquid hydrocarbon saturation time of more than 10 d showed a rapid increase in the liquid hydrocarbon saturation, the SS-1 and SS-2 shale samples were finally saturated with 26.92% and 31.46% of the liquid hydrocarbon saturation. The SS-1 and SS-2 shale-type shale samples showed high liquid hydrocarbon saturation, while the absolute amount of liquid hydrocarbons was still low considering the low porosity of the shale. As for the liquid hydrocarbon saturation degree, it shows significantly V-shape, which is similar to the liquid hydrocarbon saturation degree (
Figure 4).
3.3. Fluid Distribution Pore Division
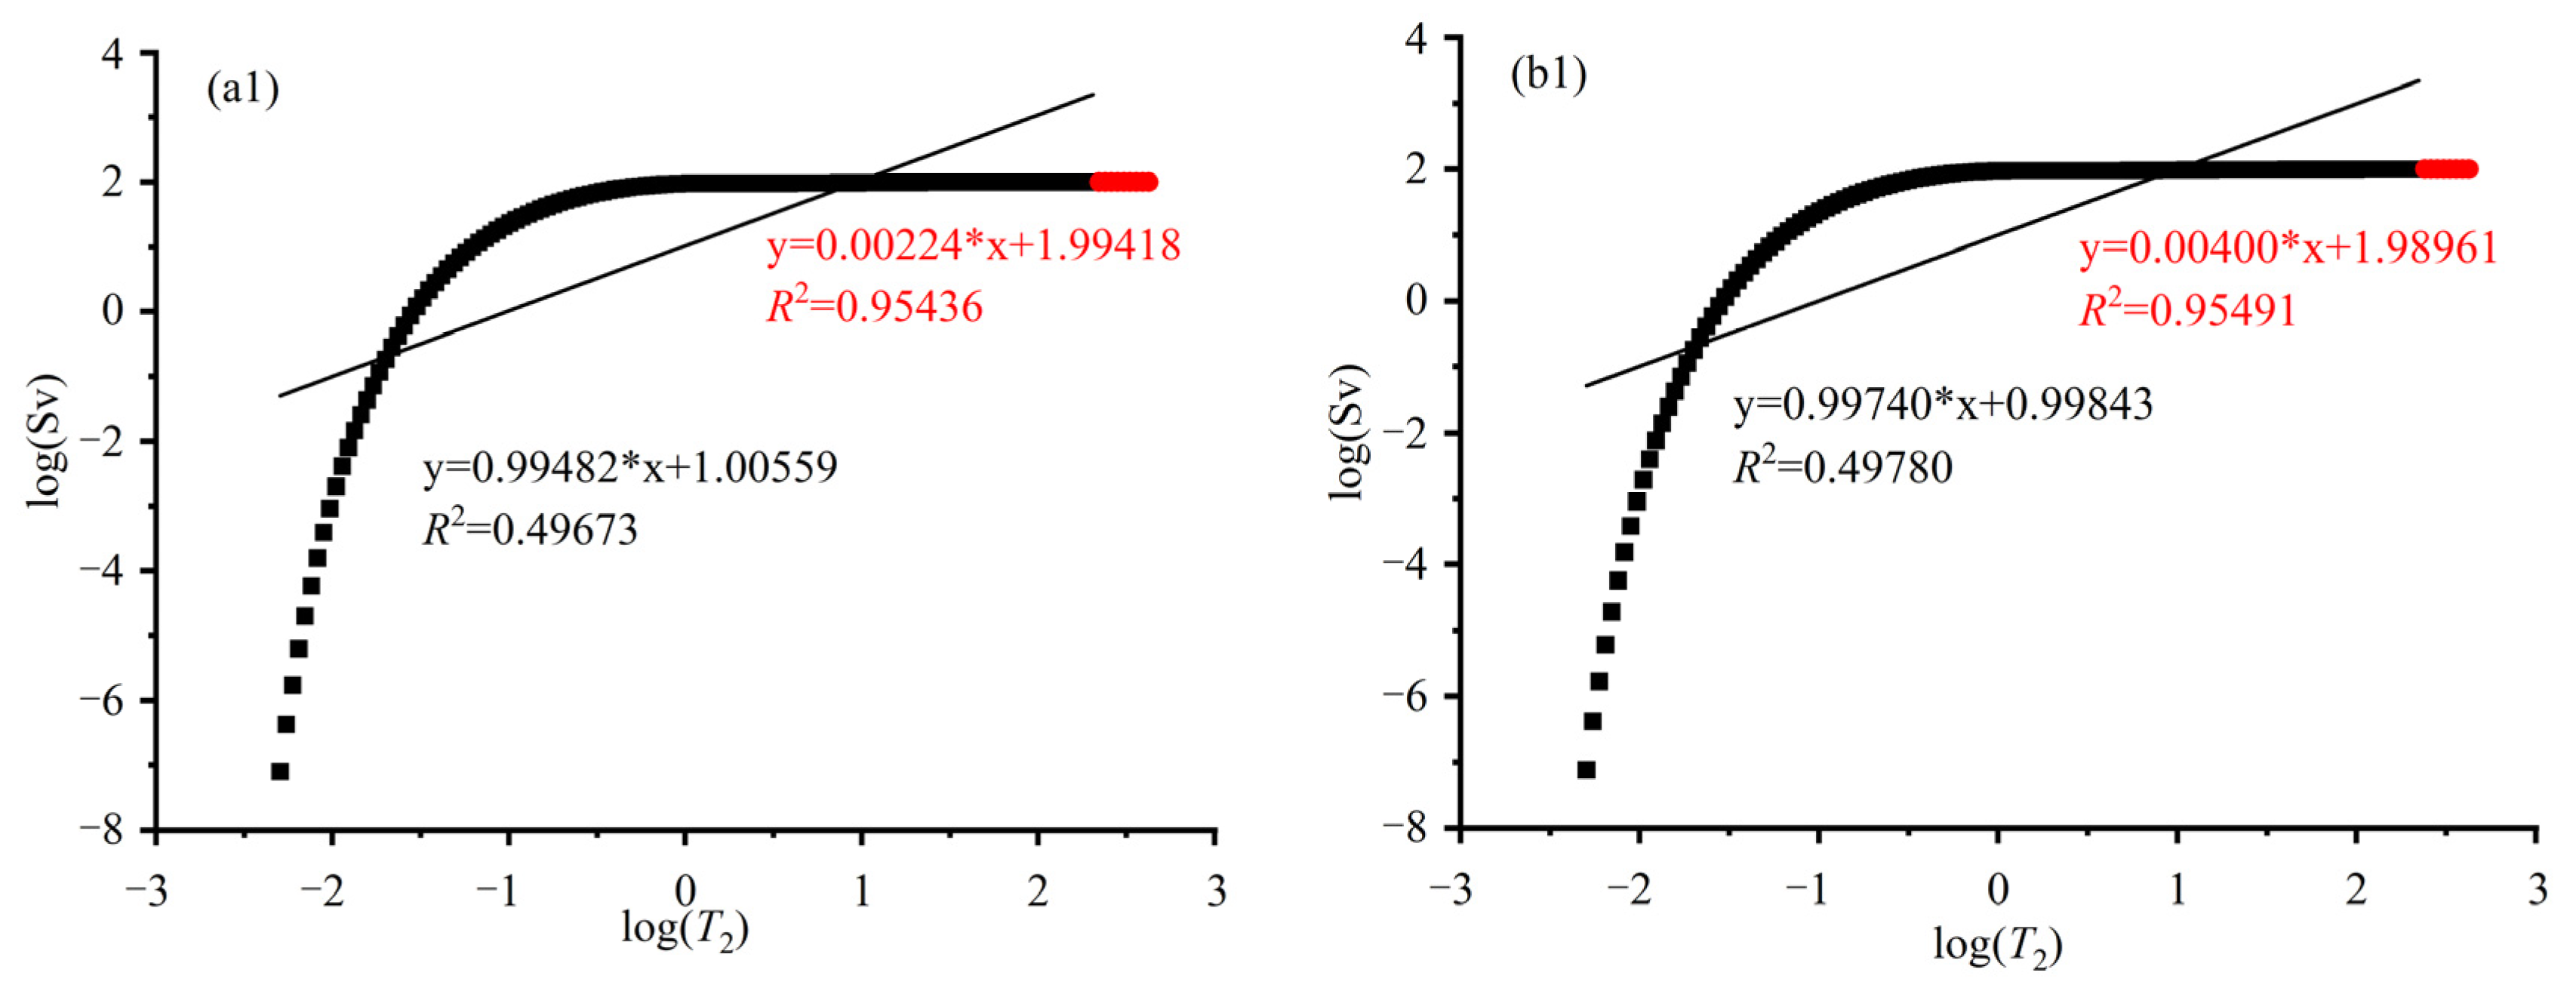
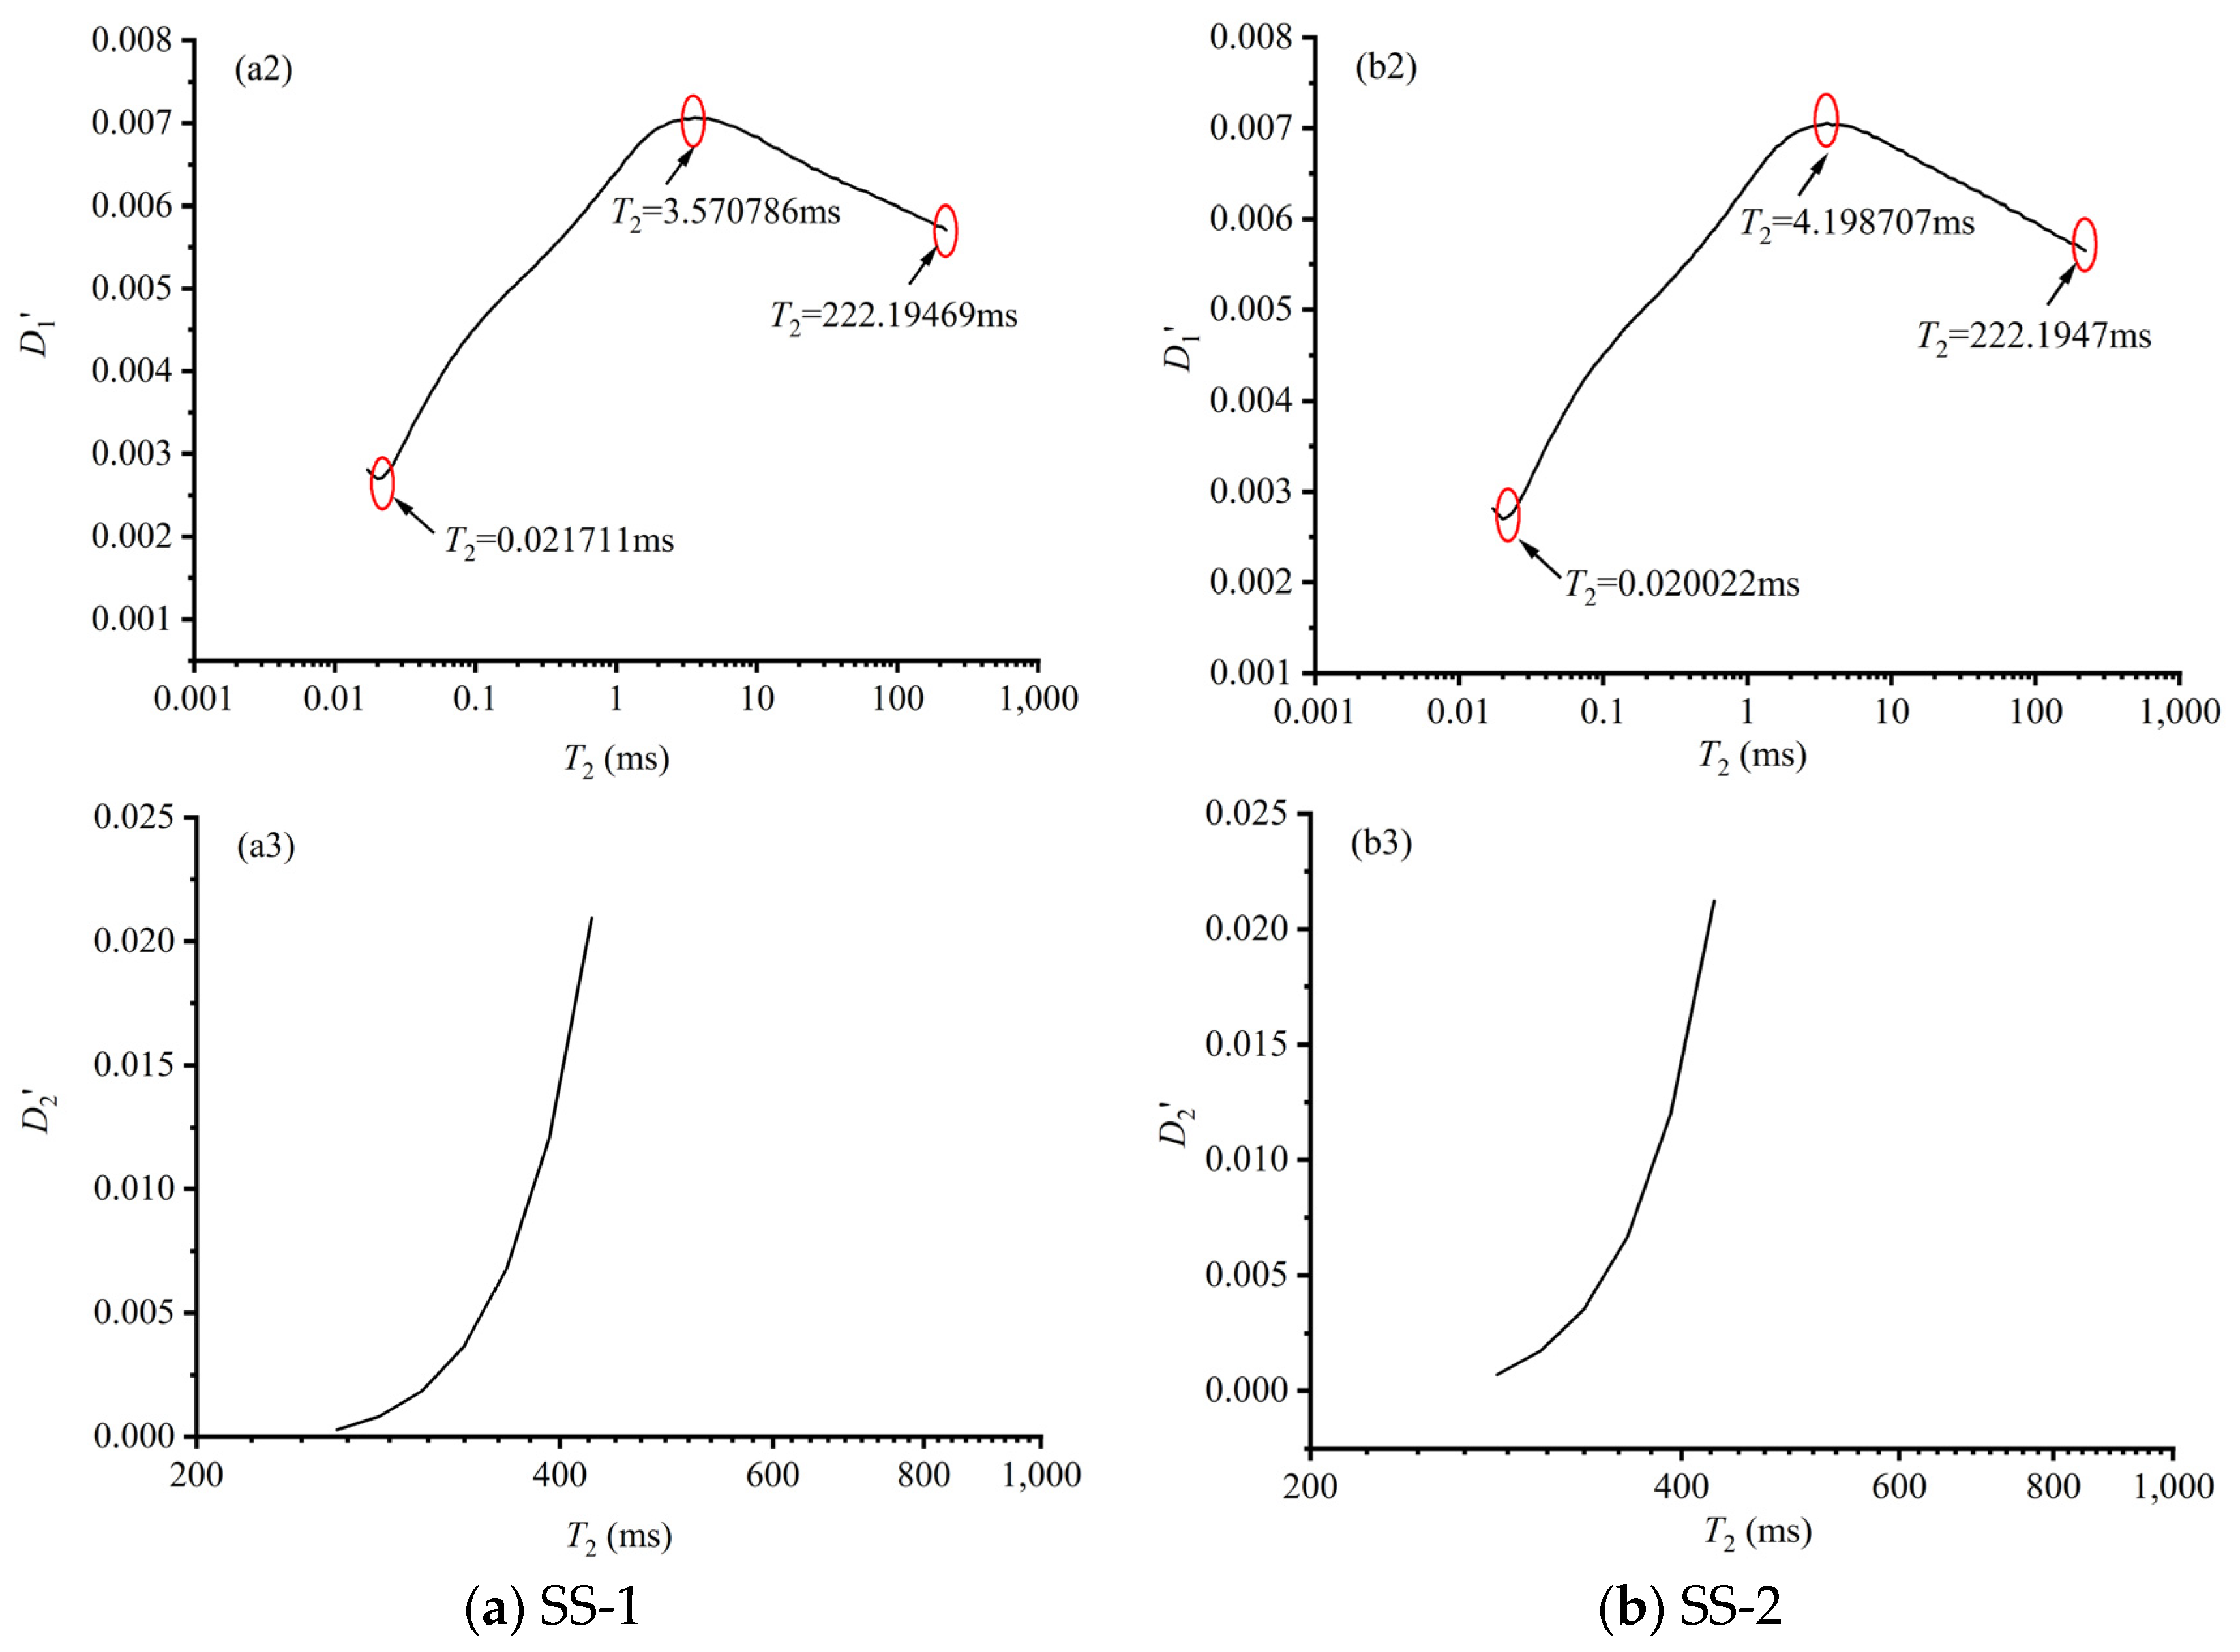
The pore structure of porous media features fractal characteristics, with the pore fractal dimension
D = 2 as the boundary, combined with Equation (1); the fluid distribution pores in the shale samples can first be divided into two major categories (
Figure 5(a1,b1)): larger-size fracture systems and smaller-size pore systems. With Equations (2) and (3), the larger-size fractures and smaller-size pores can be further finely divided to obtain the lateral relaxation times corresponding to different types of pore seams (
Figure 5). It can be found that the pores with smaller apertures can be divided into three external types under various
T2 values (
Figure 5(a2,b2)); however, the larger-size fracture systems feature is more simple (
Figure 5(a3,b3)).
Based on the enhanced classification of fluid distribution pores, the transverse relaxation time corresponding to larger-sized fractures in SS-1 and SS-2 are
T2 ≥ 222.19469 ms and
T2 ≥ 222.19470 ms, respectively, and there is no significant difference in the transverse relaxation time corresponding to larger-sized fractures in the shale-type shales. Further, the refined division of smaller-sized pore-fracture systems shows that SS-1 and SS-2 shale samples can be further distinguished into three different types, with the lateral relaxation times corresponding to the fine division of fluid-distributed pores in SS-1 shale samples being
T2 = 0.021711 ms and
T2 = 3.570786 ms, respectively, and those corresponding to fluid-distributed pores in SS-2 shale samples being
T2 = 0.020022 ms and
T2 = 4.198707 ms, respectively (
Figure 5).
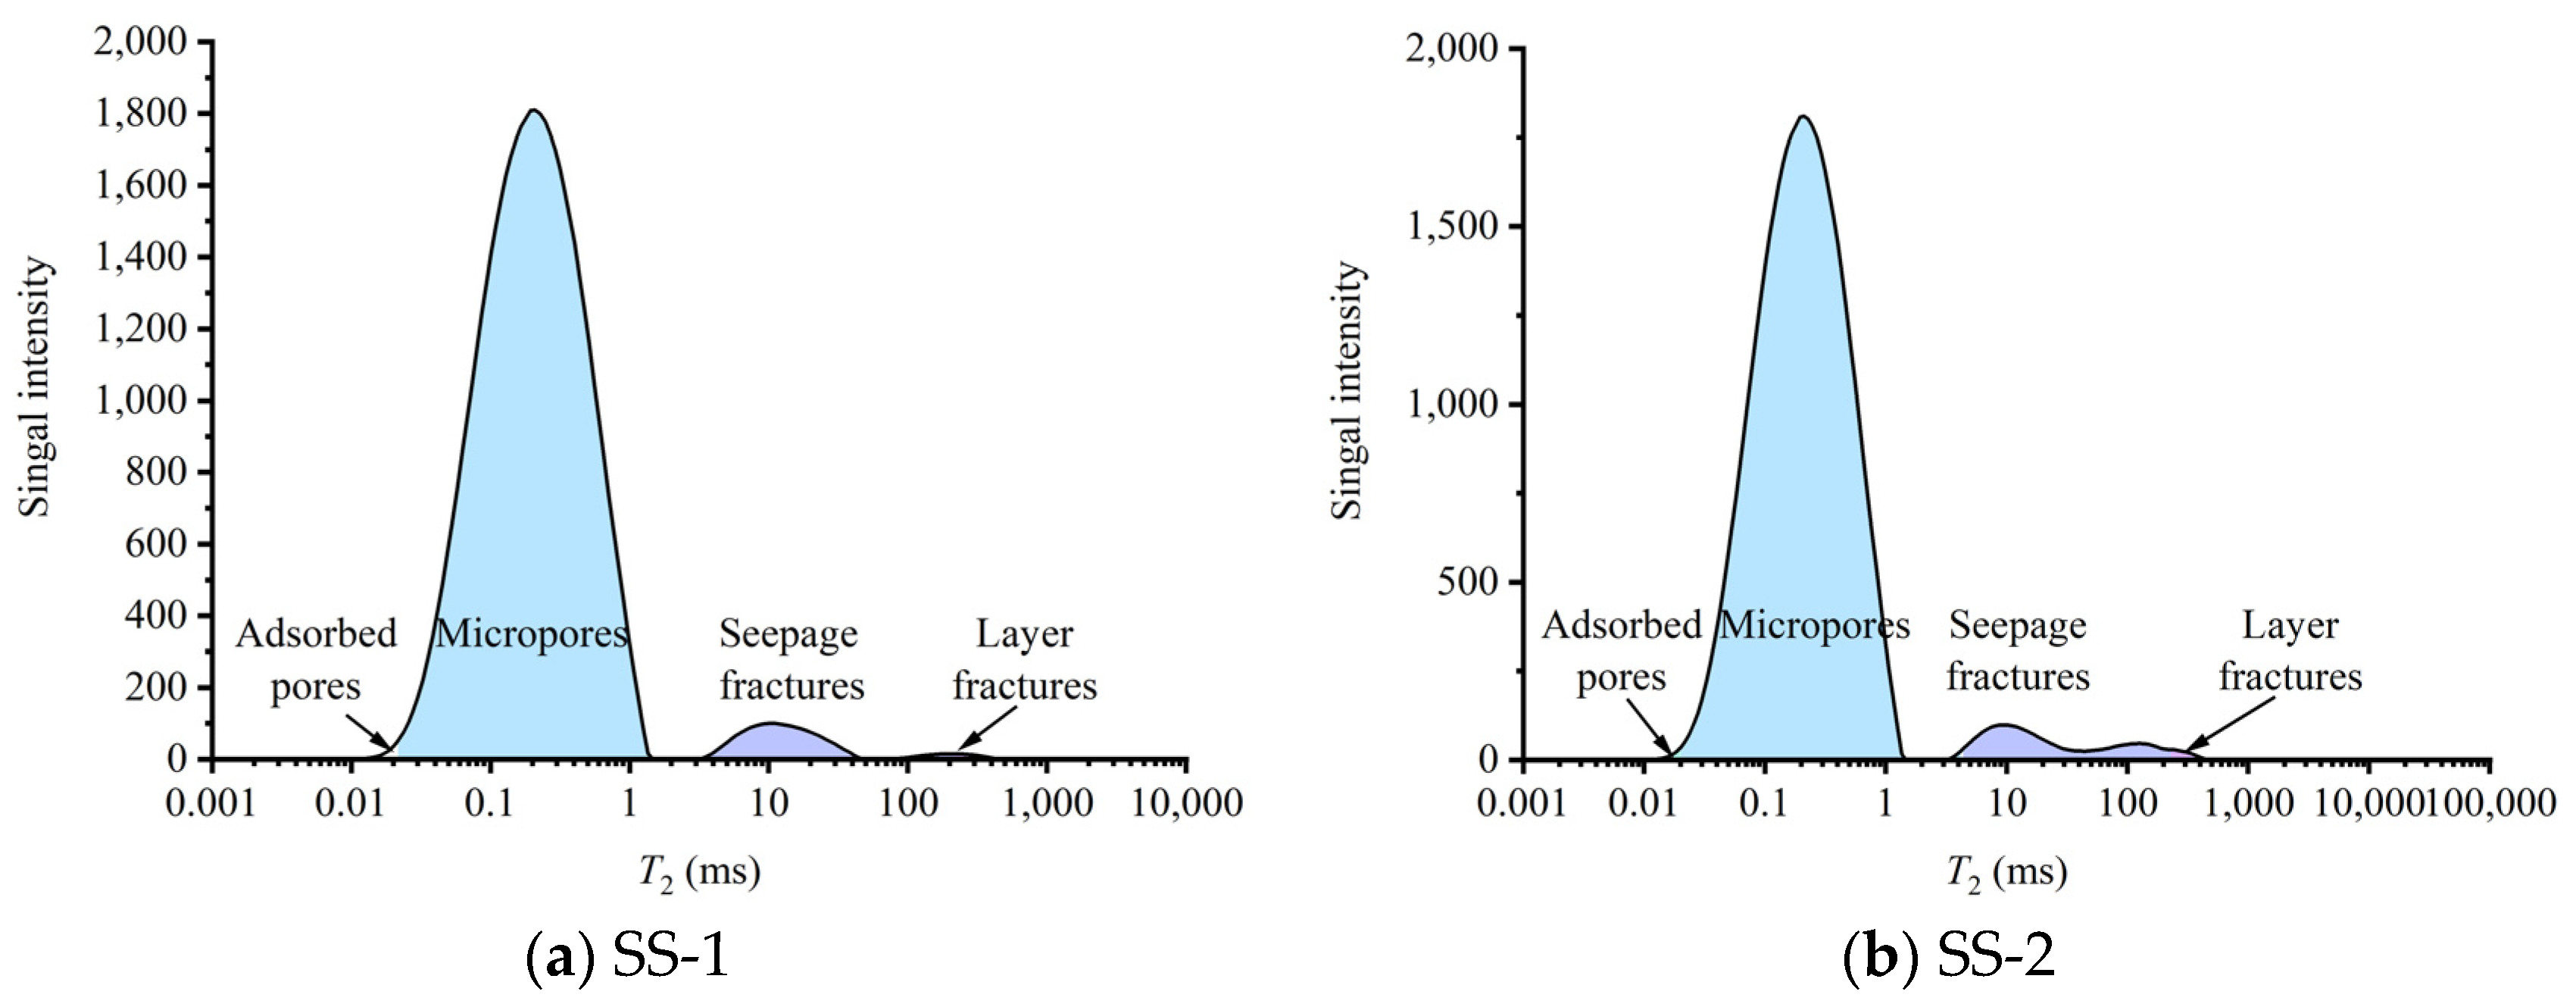
With the enhanced fluid distribution pore classification method, four different types of pores in shale were distinguished. Larger-sized fractures correspond to layer fractures in shale, while smaller-sized pore-seam systems can be distinguished mainly as seepage fractures, micropores, and adsorption pores (
Figure 6). Layer fractures are larger in size, and fluids in layer fractures are mainly free-flowing by gravity; seepage fractures are inorganic and organic fractures in shale, which can flow to a certain extent by overcoming capillary forces under certain external stresses; fluids in micropores are more comfortable with capillary forces, and fluids in adsorbent pores are almost immovable. Comparing SS-1 and SS-2 shale samples, it can be found that liquid hydrocarbons are mainly stored in micropores and seepage fractures, and micropores are the main storage space for liquid hydrocarbons; the number of layer fractures and adsorption pores is less, and the amount of liquid hydrocarbons that can be stored in them is also less (
Figure 6).
3.4. Characteristics of Fluid Differential Saturation in Different Types of Pore Spaces
Based on the pore type division of fluid distribution in shale samples, fluid differential saturation characteristics in four different types of pores, including adsorption pores, micropores, seepage fractures, and layer fractures, were characterized with the help of Equation (3).
Overall, the differential saturation of liquid hydrocarbons in the pore-fracture system can be roughly categorized into three types. Type I is the liquid hydrocarbons distributed in the layer fractures. The layer fractures are the fracture features as the centimeter level, where the fluid in this part of spaces is weakly influenced by the capillary force. On the contrary, it is more likely affected by the change in external stress. Therefore, the mobility of shale oil in the layer fractures features as a fluctuation (
Figure 7(d1,d2)). Type II is represented by liquid hydrocarbons in adsorption pores and seepage fractures, and the saturation characteristics of liquid hydrocarbons in these two types of storage spaces feature as V-shape (
Figure 7(a1,a2,c1,c2)), reflecting the dynamic equilibrium between capillary force and external stress. The seepage fractures in the SS-2 shale sample are much more developed than that in SS-1 shale sample, and the retention effect of capillary force features is stronger than that of the external stress on liquid hydrocarbon. Therefore, SS-2 sample needs a longer time to achieve equilibrium (
Figure 7(c1,c2)). The adsorption pores showed strong retention of liquid hydrocarbons for SS-1 and SS-2 shale samples (
Figure 7(a1,a2)). Type III is the fluid distributed in the micropores, which features the smaller pore aperture. As the main storage space for liquid hydrocarbon, the saturation of liquid hydrocarbon shows a continuous increase (
Figure 7(b1,b2)).
Micropores and seepage fractures are the dominant fluid-rich spaces in the shale, and it finally determines the fluid saturation degree. Fluid saturation in micropores shows a trend of steadily increasing. However, that in seepage seams shows an overall V-shape, which can be divided into three different stages according to the various saturation rates, rapid saturation stage, adjustment stage, and post-adjustment growth stage. For the SS-1 shale sample, the shale oil saturation in the micropores increases steadily from 55.97% on the 4th day to 63.54% on the 10th day, and it increases rapidly to 76.15% until saturation (
Figure 8a). As a comparison, the shale oil saturation in the micropores of the SS-2 shale sample reaches 67.29% on the initial 4 days, and then basically reaches to 82.77% on the 8th day (
Figure 8b). It can be found that the saturation of shale oil in the micropores of the SS-2 shale sample is significantly better than that of the SS-1 shale sample, and the saturation of shale oil in the micropores of SS-1 and SS-2 shale samples is V-shaped in both. The saturation of shale oil in the seepage fractures of the SS-1 shale sample at the 4th day is only 70.05% (
Figure 8a), and that for the SS-2 shale sample is 92.48% (
Figure 8b). However, the oil saturation for microfractures in the SS-2 shale sample is negative at the 10th day, which may be related to the shale oil being discharged from microfractures to the layer fractures in the shale.
3.5. Implications of Fluid Saturation for Shale Oil Production
The shale-type shale is developed in the Chang 7 Member of the Ordos Basin, and the resource of shale oil is also abundant. However, the content of brittle minerals (such as quartz, feldspar, and calcite) in the shale reservoir is low, and the shale oil in the shale matrix after fracturing relies on spontaneous imbibition to be continuously discharged outward under the formation temperature and pressure conditions, and its discharge characteristics determine the oil production efficiency of the shale reservoir.
In this study, the saturated procedures of liquid hydrocarbon in the shale can be regarded as the reverse procedures of spontaneous imbibition for shale oil. During the initial period of the spontaneous imbibition of shale oil, the shale oil in the layer fractures could be discharged sharply, and it features as a fluctuation. However, the shale oil present in the seepage fractures decreases sharply in the initial period, and it tends to be stable with the increased time. This is mainly due to the resistance of the capillary force, and it features as the self-adjustment. The discharge of shale oil in micropores is mainly affected by the capillary force, and it presents as stable. As for the discharge of shale oil in the adsorption pores, it is similar to that in the seepage fractures. However, it should be noticed that the quantity of shale oil in the adsorption pores is less, and the contribution of the shale oil movability can be ignored. As the dominant storage spaces in the shale-type shale, the movability of shale oil in micropores and seepage fractures would finally determine the shale oil movability. It can be found that movability of shale oil features contrary to the micropores and seepage fractures, and the existence of seepage seams can enhance the shale oil movable degree. Therefore, it would become an important research direction to transform part of the micropores into seepage fractures, which can be utilized to increase the mobility of shale oil in shale-type shale.
4. Conclusions
Shale-type shale shows good liquid hydrocarbon saturation under formation temperature and pressure conditions, and the shale oil saturation can reach up to 31.46%.
The fluid distribution pores in shale-type shale can be classified into four types: adsorption pores, micropores, seepage fractures, and layer fractures, and the micropores and seepage fractures are the dominant storage spaces for the liquid hydrocarbon in shale-type shale.
The liquid hydrocarbon saturation degree of the shale-type shale shows a three-stage pattern, while the liquid hydrocarbon saturation degree exhibits a V-shaped characteristic, which is closely related to the differential saturation effect of the two dominant types of storage spaces, micropores and seepage fractures.


