Article

Investigations into Hydraulic Instability during the Start-Up Process of a Pump-Turbine under Low-Head Conditions

1
Pumped Storage Technological & Economic Research Institute of State Grid Xinyuan Co., Ltd., Beijing 100761, China
2
School of Electrical and Power Engineering, Hohai University, Nanjing 211100, China
3
College of Agricultural Science and Engineering, Hohai University, Nanjing 210098, China
*
Author to whom correspondence should be addressed.
Processes 2024, 12(9), 1876; https://doi.org/10.3390/pr12091876
Submission received: 22 June 2024 / Revised: 26 August 2024 / Accepted: 29 August 2024 / Published: 2 September 2024

Abstract

:
To investigate the hydraulic characteristics during the start-up process of a full-flow pumped storage unit under low-head conditions, numerical simulations were conducted to study the dynamic characteristics during the process, providing a detailed analysis of the dynamic behavior of the internal flow field during the transition period as well as the associated variation in external performance parameters. Study results revealed a vortex-shedding phenomenon during the initial phase of the start-up process. These vortices restrict the flow, initiating a water hammer effect that abruptly elevates the upstream pressure within the runner. As the high-pressure water hammer dissipated, the flow rate rapidly increased, leading to a secondary but relatively weaker water hammer effect, which caused a momentary drop in pressure. This series of events ultimately resulted in significant oscillations in the unit’s head. After the guide vanes stop opening, the vortex structures at the runner inlet and outlet gradually weaken. As the runner torque continues to decline, the unit gradually approaches a no-load condition and enters the S-shaped region. Concurrently, pressure pulsations intensify, and unstable vortex formations reemerge along the leading and trailing edges of the runner blades. The escalated flow velocity at the runner’s exit contributes to the elongation of the vortex band within the draft tube, ultimately configuring a double-layer vortex structure around the central region and the pipe walls. This configuration of vortices precipitates the no-load instability phenomenon experienced by the unit.

1. Introduction

With the rapid growth of global new energy generation and the continuous rise in electricity demand, there has been a gradual increase in the peak-valley disparity within power systems. As a consequence, pumped storage power stations have emerged as the primary means of rapid peak load regulation and frequency control [1,2]. To meet the dynamic operating requirements of power systems, the pump-turbines within pumped storage power stations undergo frequent changes in operating conditions. These conditions encompass a wide range along the entire pump-turbine characteristic curve, rendering them more susceptible to entering the unstable region, here referred to as the “S” characteristic region [3,4]. Consequently, these are unable to attain stabilization as rapidly as conventional turbines, resulting in unstable phenomena such as torque oscillation, thereby jeopardizing the safe operation of the units. The instability observed during the low-head power generation and grid connection process represents a common challenge faced by numerous pumped storage hydropower stations. When the unit speed ventures into the unstable region, the “S” characteristic region, the guide vanes and the runner region experience unstable flow patterns. Improper simultaneous coordination between the device and the governor can lead to the unit’s inability to connect to the grid. Thus, undertaking research on the hydraulic instability characteristics during the low-head start-up process of pump-turbines holds significant engineering value in guiding the stable operation of pumped storage units.
Considerable research has been conducted by scholars both domestically and internationally regarding the unstable characteristics and formation mechanism of the S-shaped region in pump-turbines [5]. Pejovic et al. [6] were the first to discover the potential system load instability caused by the “S” characteristics of pump-turbines. Through the injection of bubbles, Hasmatuchi et al. [7] visualized the high-speed flow in the vaneless region of a pump-turbine model operating in the S-shaped region, measured the pressure, and characterized its fluctuations. Weber et al. [8] proposed a transient model testing method for pump-turbines to reduce the upstream pressure to bring the pump-turbine into the S-shaped region, able to capture the transient flow characteristics of the S-shaped region. Zeng et al. [9], through dynamic testing of load rejection processes in a pumped storage system, found that the water hammer pressure is related to the “S” characteristics of the pump-turbine and the closing pattern of the guide vanes during load rejection. Wang et al. [10], through numerical simulations of the S-shaped region operating conditions of pump-turbines, discovered that the pressure fluctuations in the braking and reverse pump operating conditions are related to the backflow between the runner blades and the periodic rotation of the vortex in the vaneless region with the rotation of the runner. Yang et al. [11], using four pump-turbines with different specific speeds, simulated the uncontrolled transient processes under turbine operating conditions and analyzed and compared the flow patterns and pressure fluctuations among the pump-turbines. Zhang et al. [12] employed a one-dimensional and three-dimensional (1D–3D) coupled computational method to simulate the transient process of pump-turbine instability in a pumped storage power station model. Zhang et al. [13], through numerical simulations of pump-turbines in five operating conditions, namely the turbine, runaway, braking, low-flow, and reverse pump conditions, analyzed the pressure fluctuations in the S-shaped region and their correlation with different phenomena, such as rotor–stator interaction, rotational stall, and vortex rope. Using a one-dimensional characteristic line method, Rezghi et al. [14] numerically simulated the transition process of two parallel pump-turbines in the S-shaped region, and the results indicated that the asymmetrical piping between the two pump-turbines exacerbated the instability of the units in the S-shaped region.
Currently, research on the start-up process of pump-turbines mainly employs experimental [15] and numerical simulation methods [16]. The utilized numerical simulation methods include three-dimensional numerical simulation and one-dimensional-three-dimensional (1D–3D) coupled methods.
As for the experimental approaches used to study pumped storage units, field tests and model tests are the most utilized. Among many others, Gagnon et al. [17] reduced the fatigue damage of the runner during the start-up process by modifying the opening pattern of the guide vanes. Through model tests, Tanaka et al. [18] investigated the dynamic characteristics of high-head pump-turbine runners and the issue of alternating stresses and determined the influencing factors of hydraulic excitation forces. Trivedi et al. [19] conducted tests on a high-head pump-turbine under different start-up and shutdown scenarios. The results showed that the total head variation could reach up to 9% during the start-up process of the pump-turbine.
The three-dimensional numerical simulation method is widely known to better simulate the flow characteristics during the start-up process of pumped storage units. Nevertheless, the one-dimensional-three-dimensional (1D–3D) coupled method combines the one-dimensional approach for simulating the water conveyance pipeline with the three-dimensional characteristics of the unit, thereby improving computational efficiency. This can be seen through different published works [20,21,22,23]. The calculation of pressure changes and stress concentration caused by flow turbulences during the start-up process of a high-head pump-turbine under turbine mode has been successfully conducted by Yin et al. [24] Jin et al. [25,26], on the other hand, using the one-dimensional-three-dimensional coupled method, simulated the transient process of pump-turbine start-up and visualized the high-value points of flow energy dissipation (FED) in various components. As for the study by He et al. [27], a full-flow three-dimensional analysis model was established to analyze the transient hydraulic excitation characteristics of the entire flow passage of a pump-turbine under five different operating conditions near the resonance region. Study results identified the main cause of the recorded resonance as the fact that the hydraulic excitation caused by the dynamic–static interference corresponded to the natural frequency of the runner. Nicolle et al. [28,29], through numerical simulations of the low-head start-up process of pump-turbines, identified the deterioration of grid quality caused by the movement of the guide vanes as one of the major challenges in their study and analyzed several flow phenomena occurring during the start-up process.
Based on the above literature, many studies have primarily focused on the unit’s flow characteristics during the start-up process, the stress characteristics of the runner, and operational stability. However, research on the instability and its mechanisms during the start-up process in low-head conditions is relatively limited. Therefore, this paper aims to investigate the low-head start-up process of a pump-turbine in the full-flow system of a certain pumped storage power station, using three-dimensional numerical simulation methods. This study provides a detailed analysis of the spatial and temporal evolution of the complex hydraulic flow structure within the unit and reveals the reasons for changes in external characteristic parameters, offering a theoretical foundation and optimization direction for further hydraulic control of complex transition processes in pumped storage units. The aim is to provide a reference for improving the success rate of start-up and grid connection of pumped storage units under low head conditions.
The comparison of existing work with state-of-the-art technology is shown in Table 1.

2. Computational Model and Numerical Simulation Setup Methods

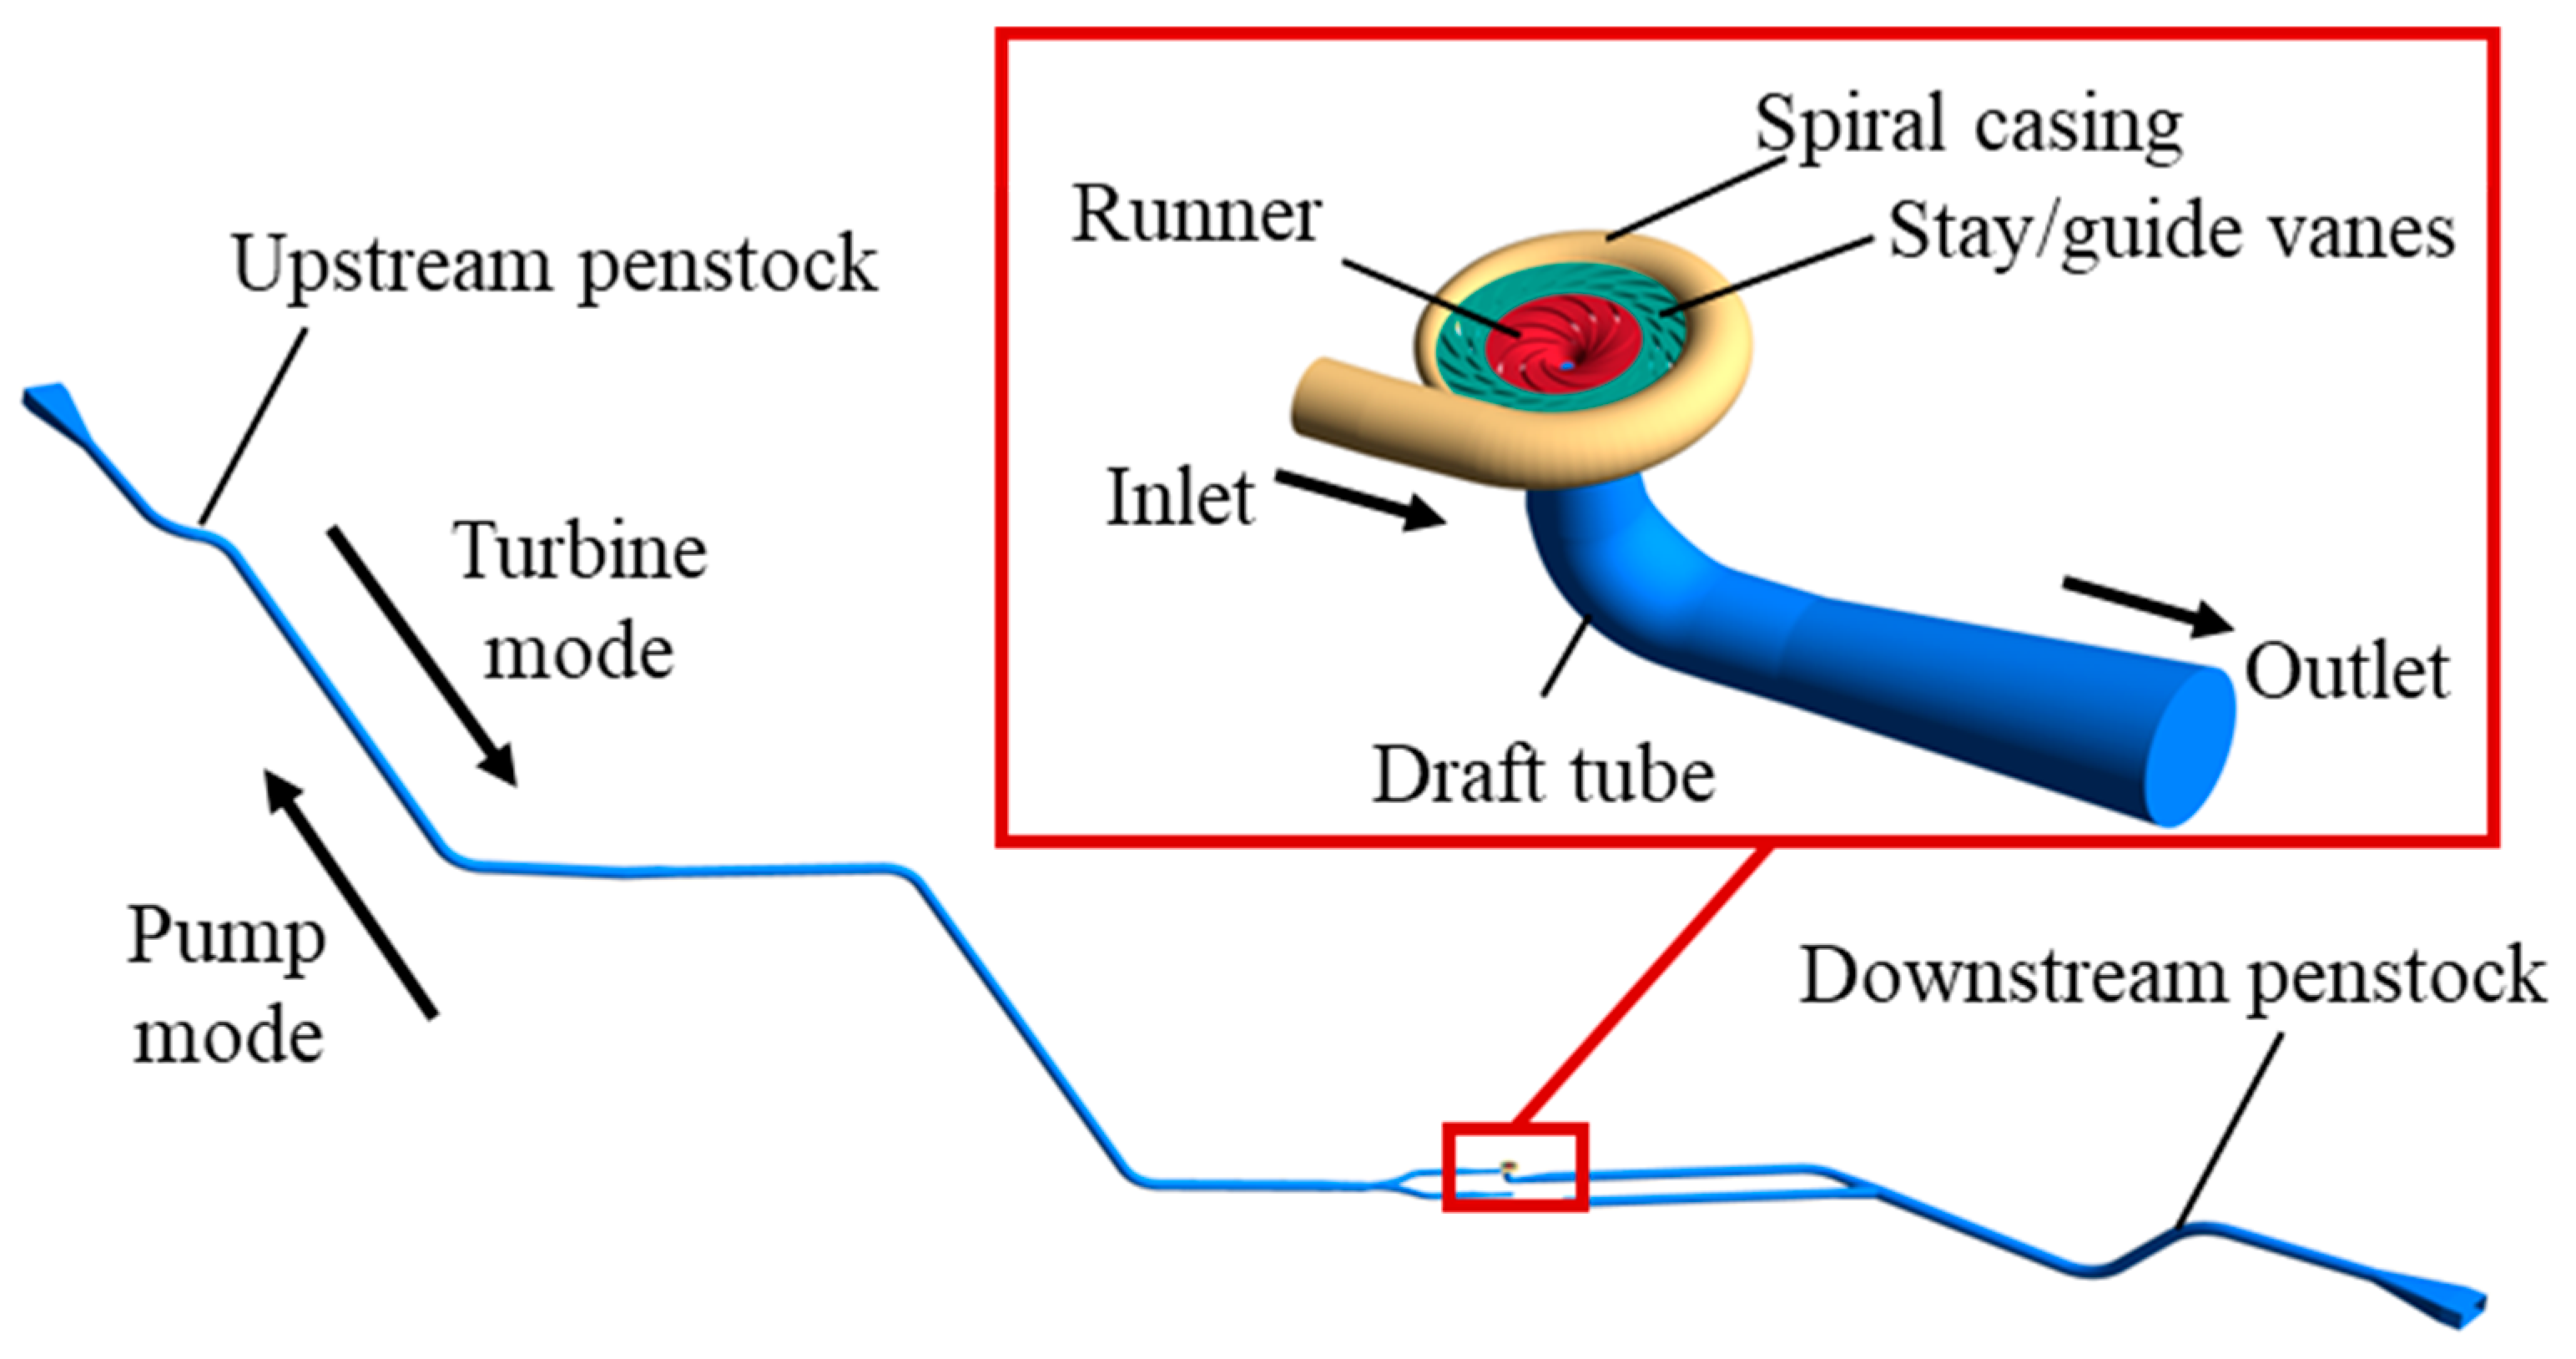
2.1. Full-Flow System Model of a Pumped Storage Power Station

This study considers a full-length prototype of a specific pumped storage power station as the study object. Its computational model primarily consists of the upstream penstock, the pump-turbine unit section, and the downstream penstock. The flow components in the pump-turbine unit section include the spiral casing, stay vanes, guide vanes, runner, and draft tube. Figure 1 illustrates the three-dimensional model of the full-length pumped storage power station model, while Table 2 presents the basic parameters of the whole pumped storage system.

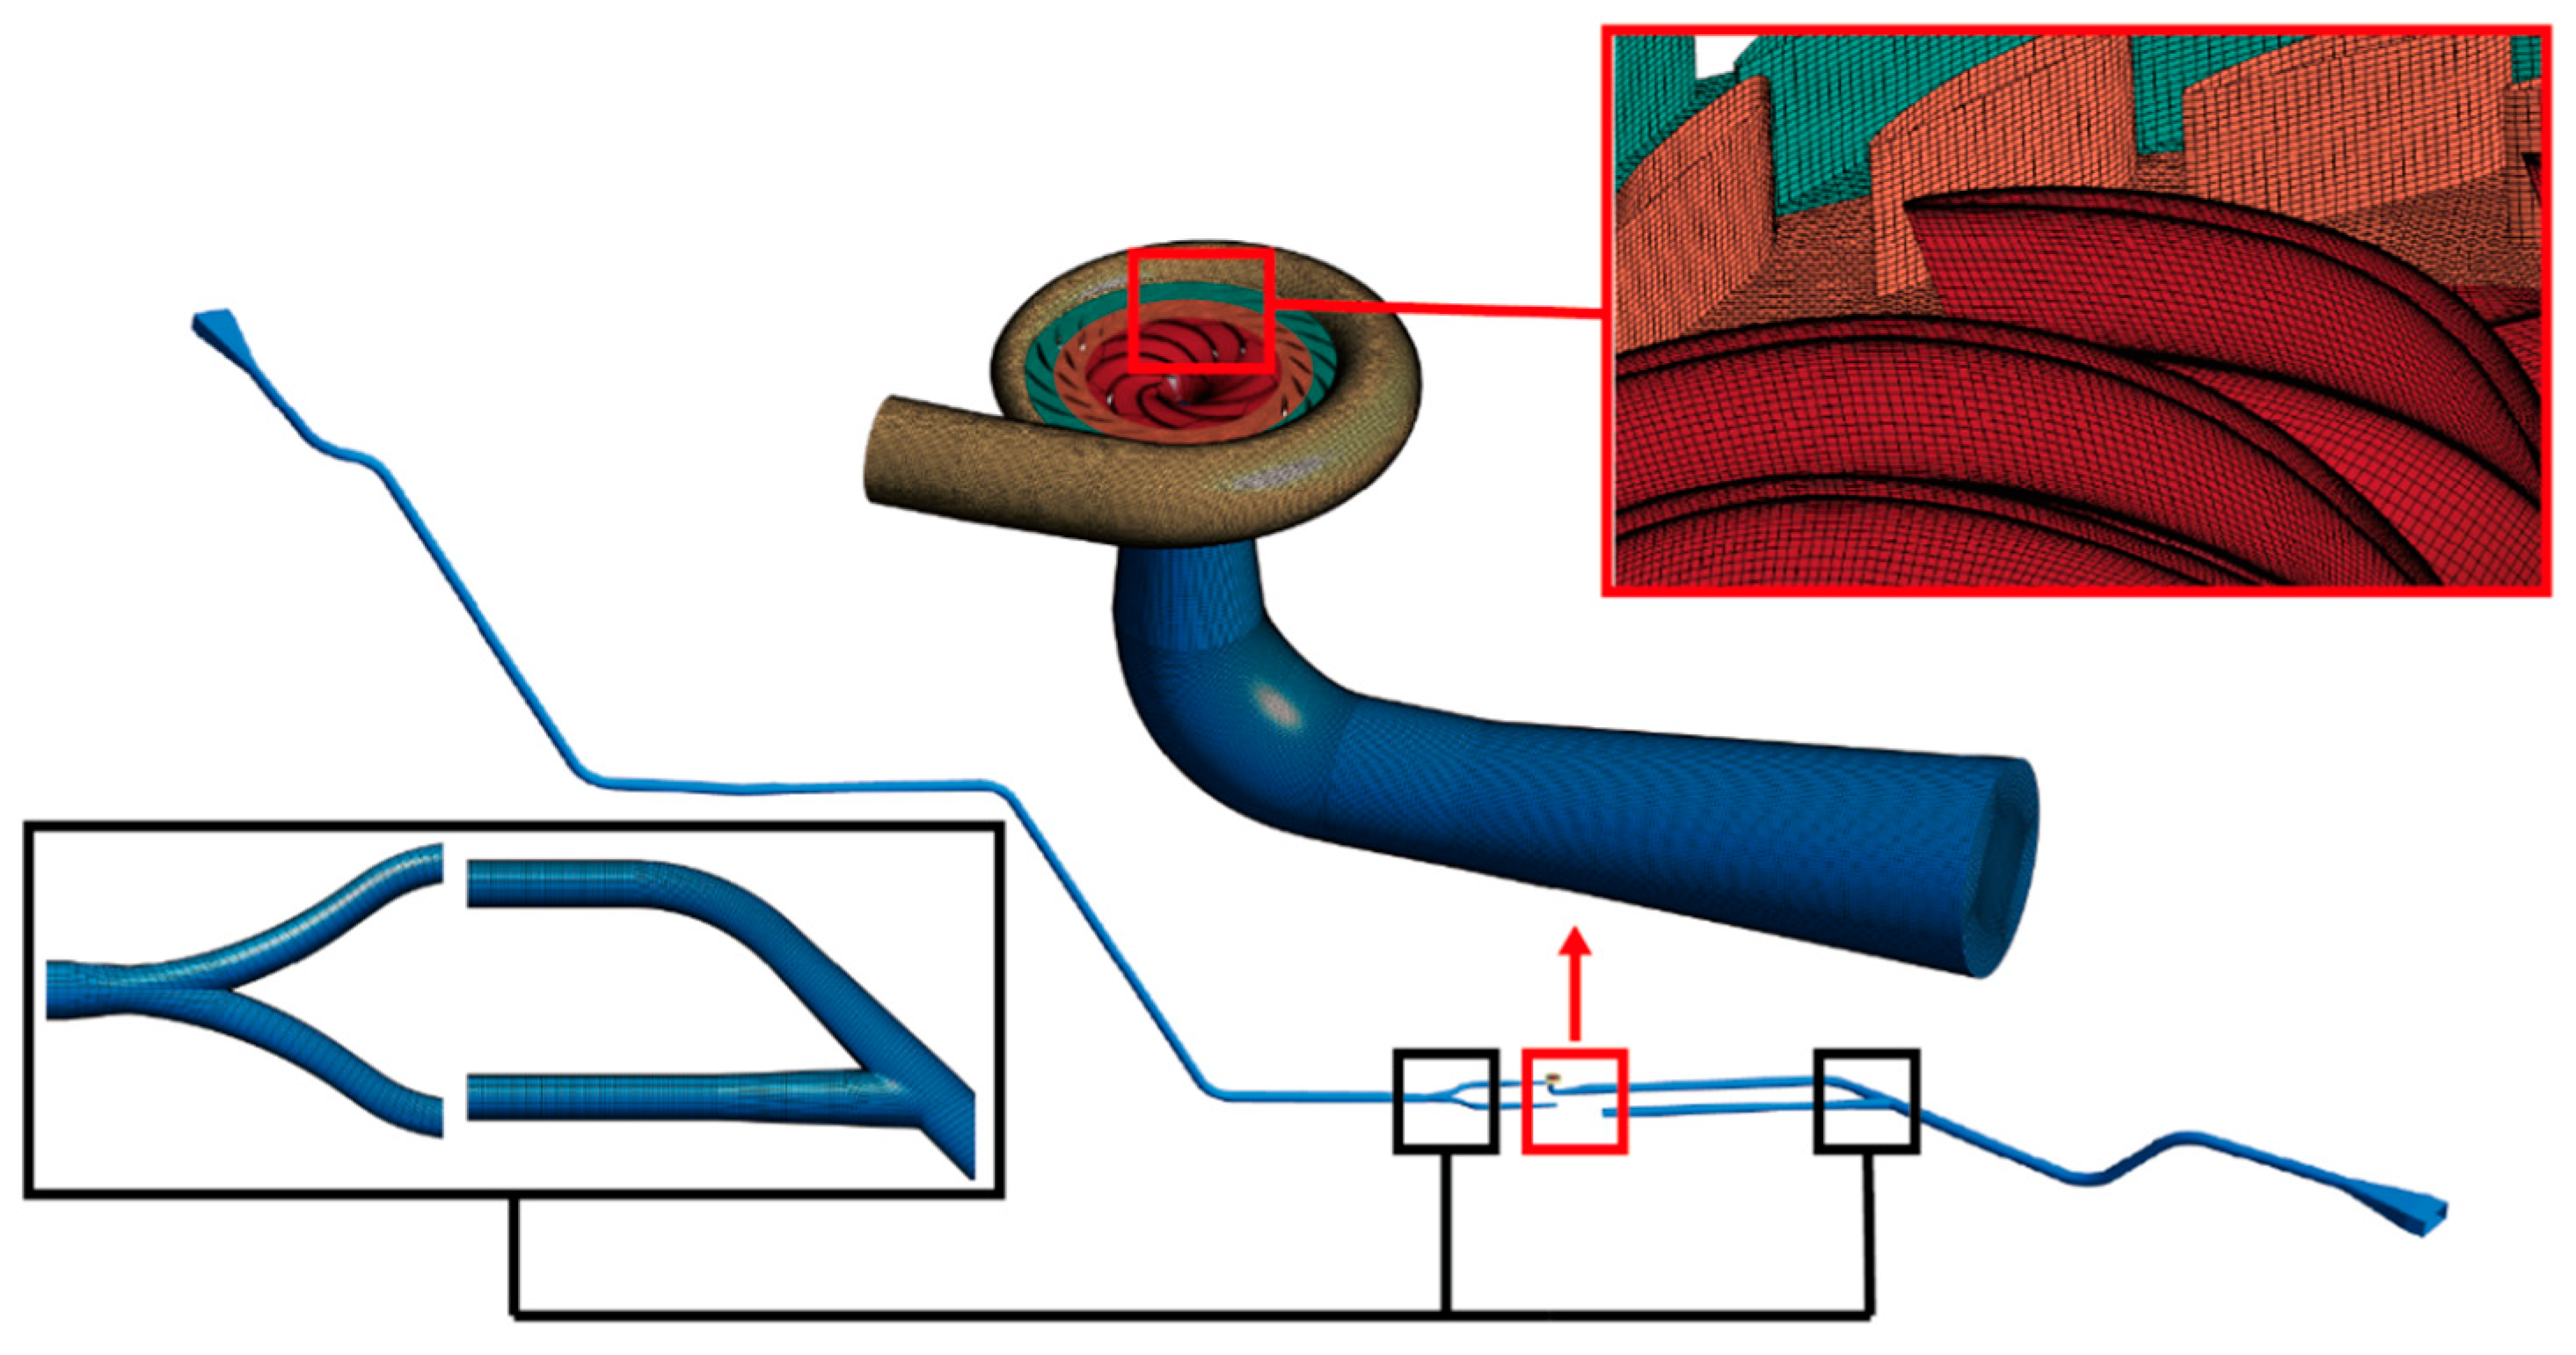
2.2. Grid Partitioning and Grid Independence Verification

In this study, the ANSYS ICEM 2022 R1 software was used to generate the grid on the full-flow system. As shown in Figure 2, the upstream penstock and downstream penstock were divided using structured grids. The spiral casing region on the pump-turbine section was divided using unstructured grids. Considering that guide vanes are meant to move throughout the simulation, a dynamic grid is required. Therefore, a prism grid was generated using surface grid stretching. The runner and draft tube were partitioned using structured grids [30,31].
In this study, the grid convergence index (GCI) [32] was used to evaluate the accuracy of the validated grid. The formula is as follows:
G C I 21 = F s e a 21 r 21 p 1
where Fs stands for the safety factor, the value of which is 1.25. The e a 21 represents the approximate relative error, the formula of which is as follows:
e a 21 = | ϕ 1 ϕ 2 ϕ 1 |
r represents the grid refinement factor. The calculation formula is as follows:
r 21 = N 1 N 2 3
p is the convergence accuracy. The calculation formula is as follows:
p = 1 ln ( r 21 ) | ln | ε 32 / ε 21 | + q ( p ) |
q ( p ) = ln ( r 21 p s r 32 p s )
s = 1 sgn ( ε 32 / ε 21 )
where ε21 and ε32 represent the differences in numerical solutions between two sets of grids.
In this study, the model was divided into grids, and three different grid schemes were selected. Specifically, Scheme 1 consisted of 7 million nodes, Scheme 2 consisted of 5.91 million nodes, and Scheme 3 consisted of 4.96 million nodes. The unit head and runner torque were chosen as testing parameters used for grid accuracy verification. When the grid count was 7 million, the grid independence verification criteria for unit head and runner torque were 2.00% and 1.57%, respectively. These criteria were both below 3%, indicating that the accuracy requirements for Scheme 1 (7 million nodes) were satisfied. Table 3 presents the grid partitioning schemes, and Table 4 provides the grid accuracy verification results.

2.3. Boundary Conditions and Numerical Solution Method

To investigate the starting characteristics of the full-flow system of a pumped storage unit under low-head conditions, the upper reservoir water level is set at 699 m and the lower reservoir water level at 299 m, resulting in a water level difference of 400 m. In order to simulate the full-flow system of the pumped storage power station as realistically as possible, pressure boundary conditions that increase with water depth are applied at the inlet of the upstream penstock and the outlet of the downstream penstock, as shown in Figure 3 [33].
The SST k-ω turbulence model, used in the Reynolds time-averaged numerical simulation (RANS) method, is selected due to its consideration of turbulent shear stress in the turbulent viscosity coefficient, which ensures high accuracy and convergence in high Reynolds number flows and near-wall boundary layer flows. The SIMPLC method is employed to decouple the velocity and pressure equations, utilizing a first-order implicit scheme for the time term and a second-order upwind scheme for the convective and diffusive terms. Data exchange interfaces manage the interfaces between different structures. The reference pressure is set to atmospheric pressure, and the wall conditions are defined as no-slip walls.

2.4. Start-Up Implementation Methods

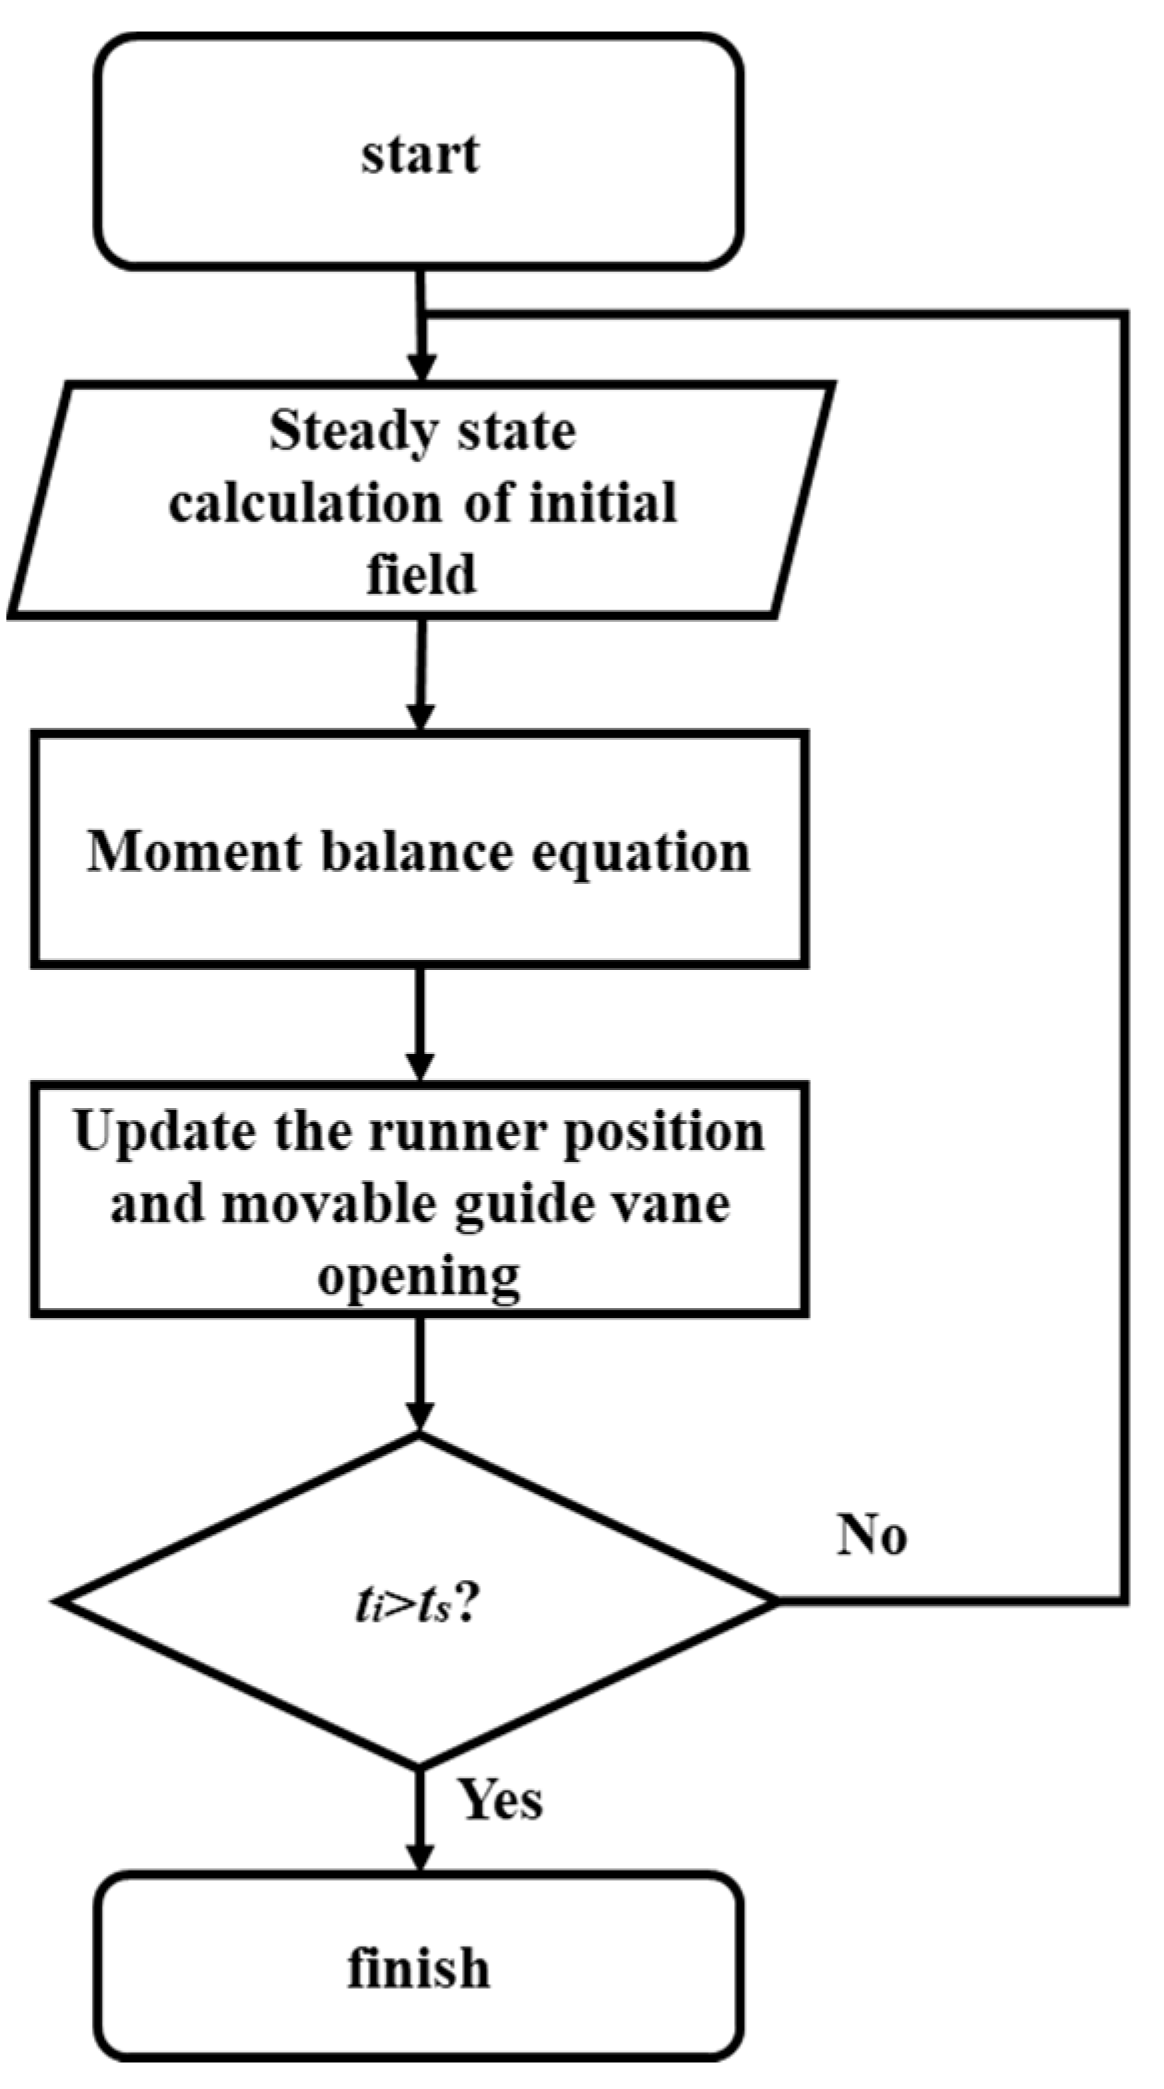
2.4.1. Moment Balance Equation

During the start-up process of the pumped storage unit, the rotational speed of the runner changes due to the resultant torque acting on the runner. This speed variation follows the torque balance equation (Equation (7)). In the numerical simulation calculation, the change in runner speed is implemented through a user-defined function (UDF) program, as shown in Figure 4; ts represents the opening time to reach the no-load condition.
M = J d ω d t
The difference is a discrete equation
M i J = ω i + 1 ω i t i + 1 t i
ω i + 1 = ω i + M i J ( t i + 1 t i )
where M represents the resultant torque acting on the runner, measured in kN·m; ω represents the angular velocity of the runner, measured in rad/s; J represents the moment of inertia of the runner, measured in kg·m2; ti, ti+1 represents time, measured in s.

2.4.2. Moving Grid Technique

In the numerical simulation of the full-flow system of the pumped storage unit, the system model consists of both stationary and moving flow components. The stationary components include the water in the upstream penstock, spiral casing, stay vanes, draft tube, and downstream penstock. The moving components include the rotating runner and the deforming guide vanes. To simulate the motion of these components, different dynamic coordinate or grid models are commonly used in ANSYS FLUENT 2022 R1, including the multiple reference frame (MRF), sliding mesh (SM), and dynamic mesh (DM) models [34,35].
In this study, the MRF model was used for steady-state calculations in the runner region, while the SM model was employed for transient calculations. For the opening of the guide vanes during the start-up process of the pump-turbine, the DM model was utilized, and the grid in the guide vane region was dynamically updated in real time through spring smoothing and local reconstruction techniques.

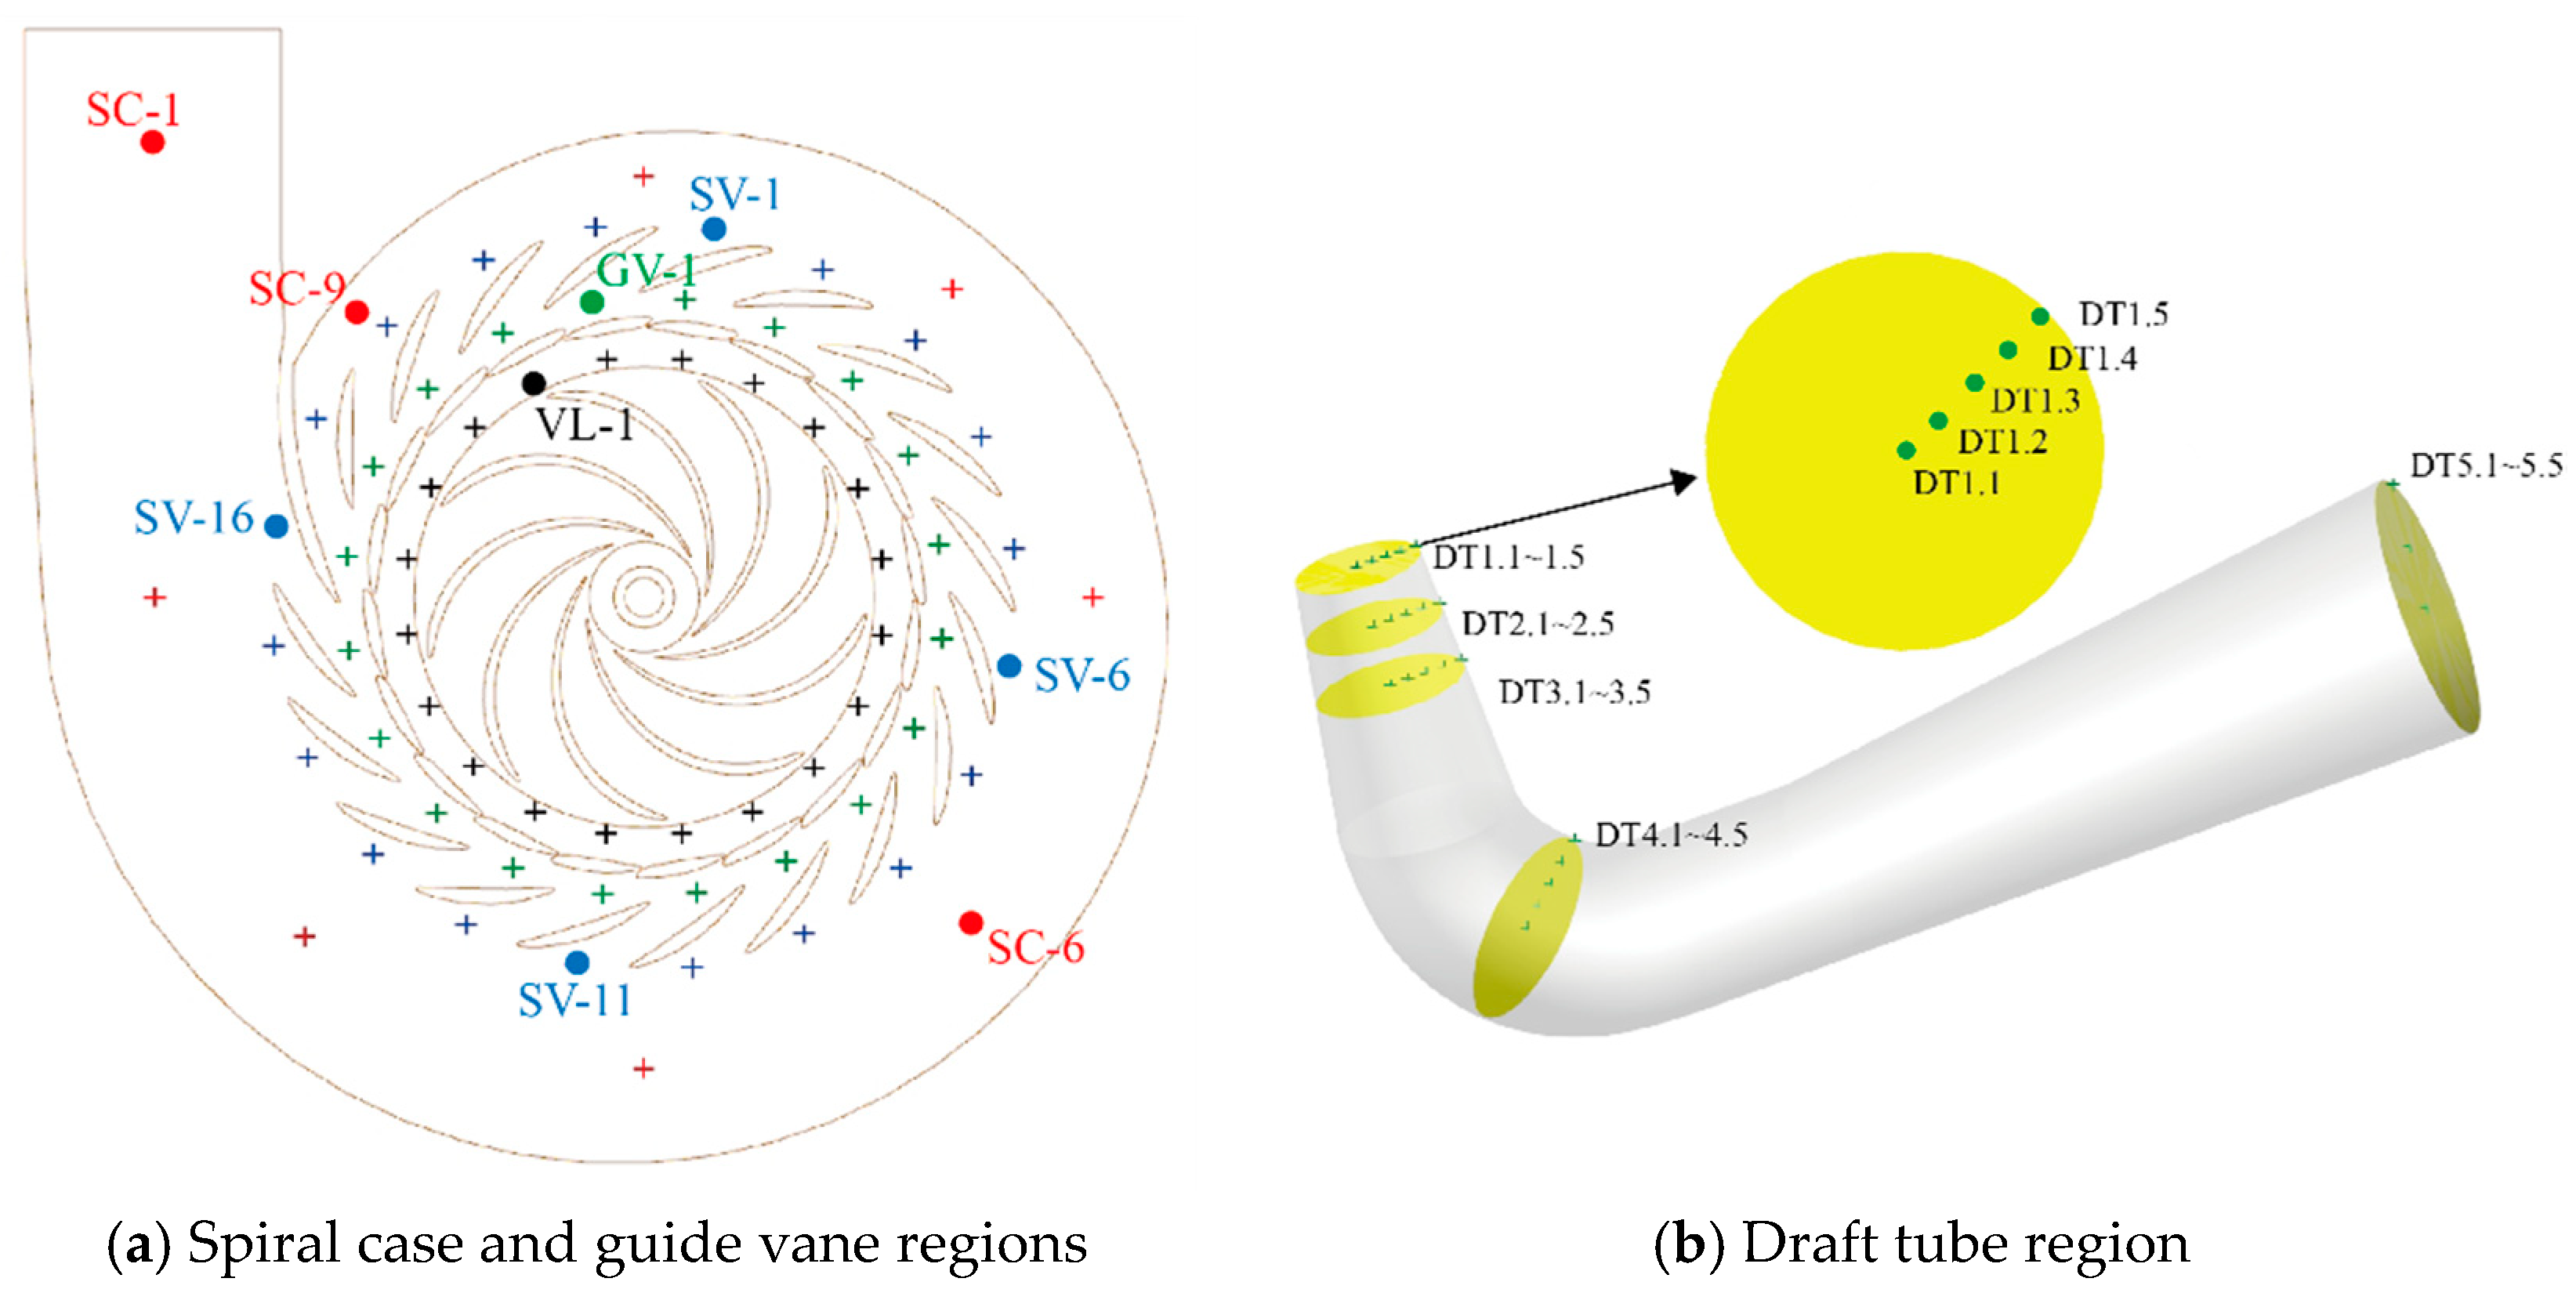
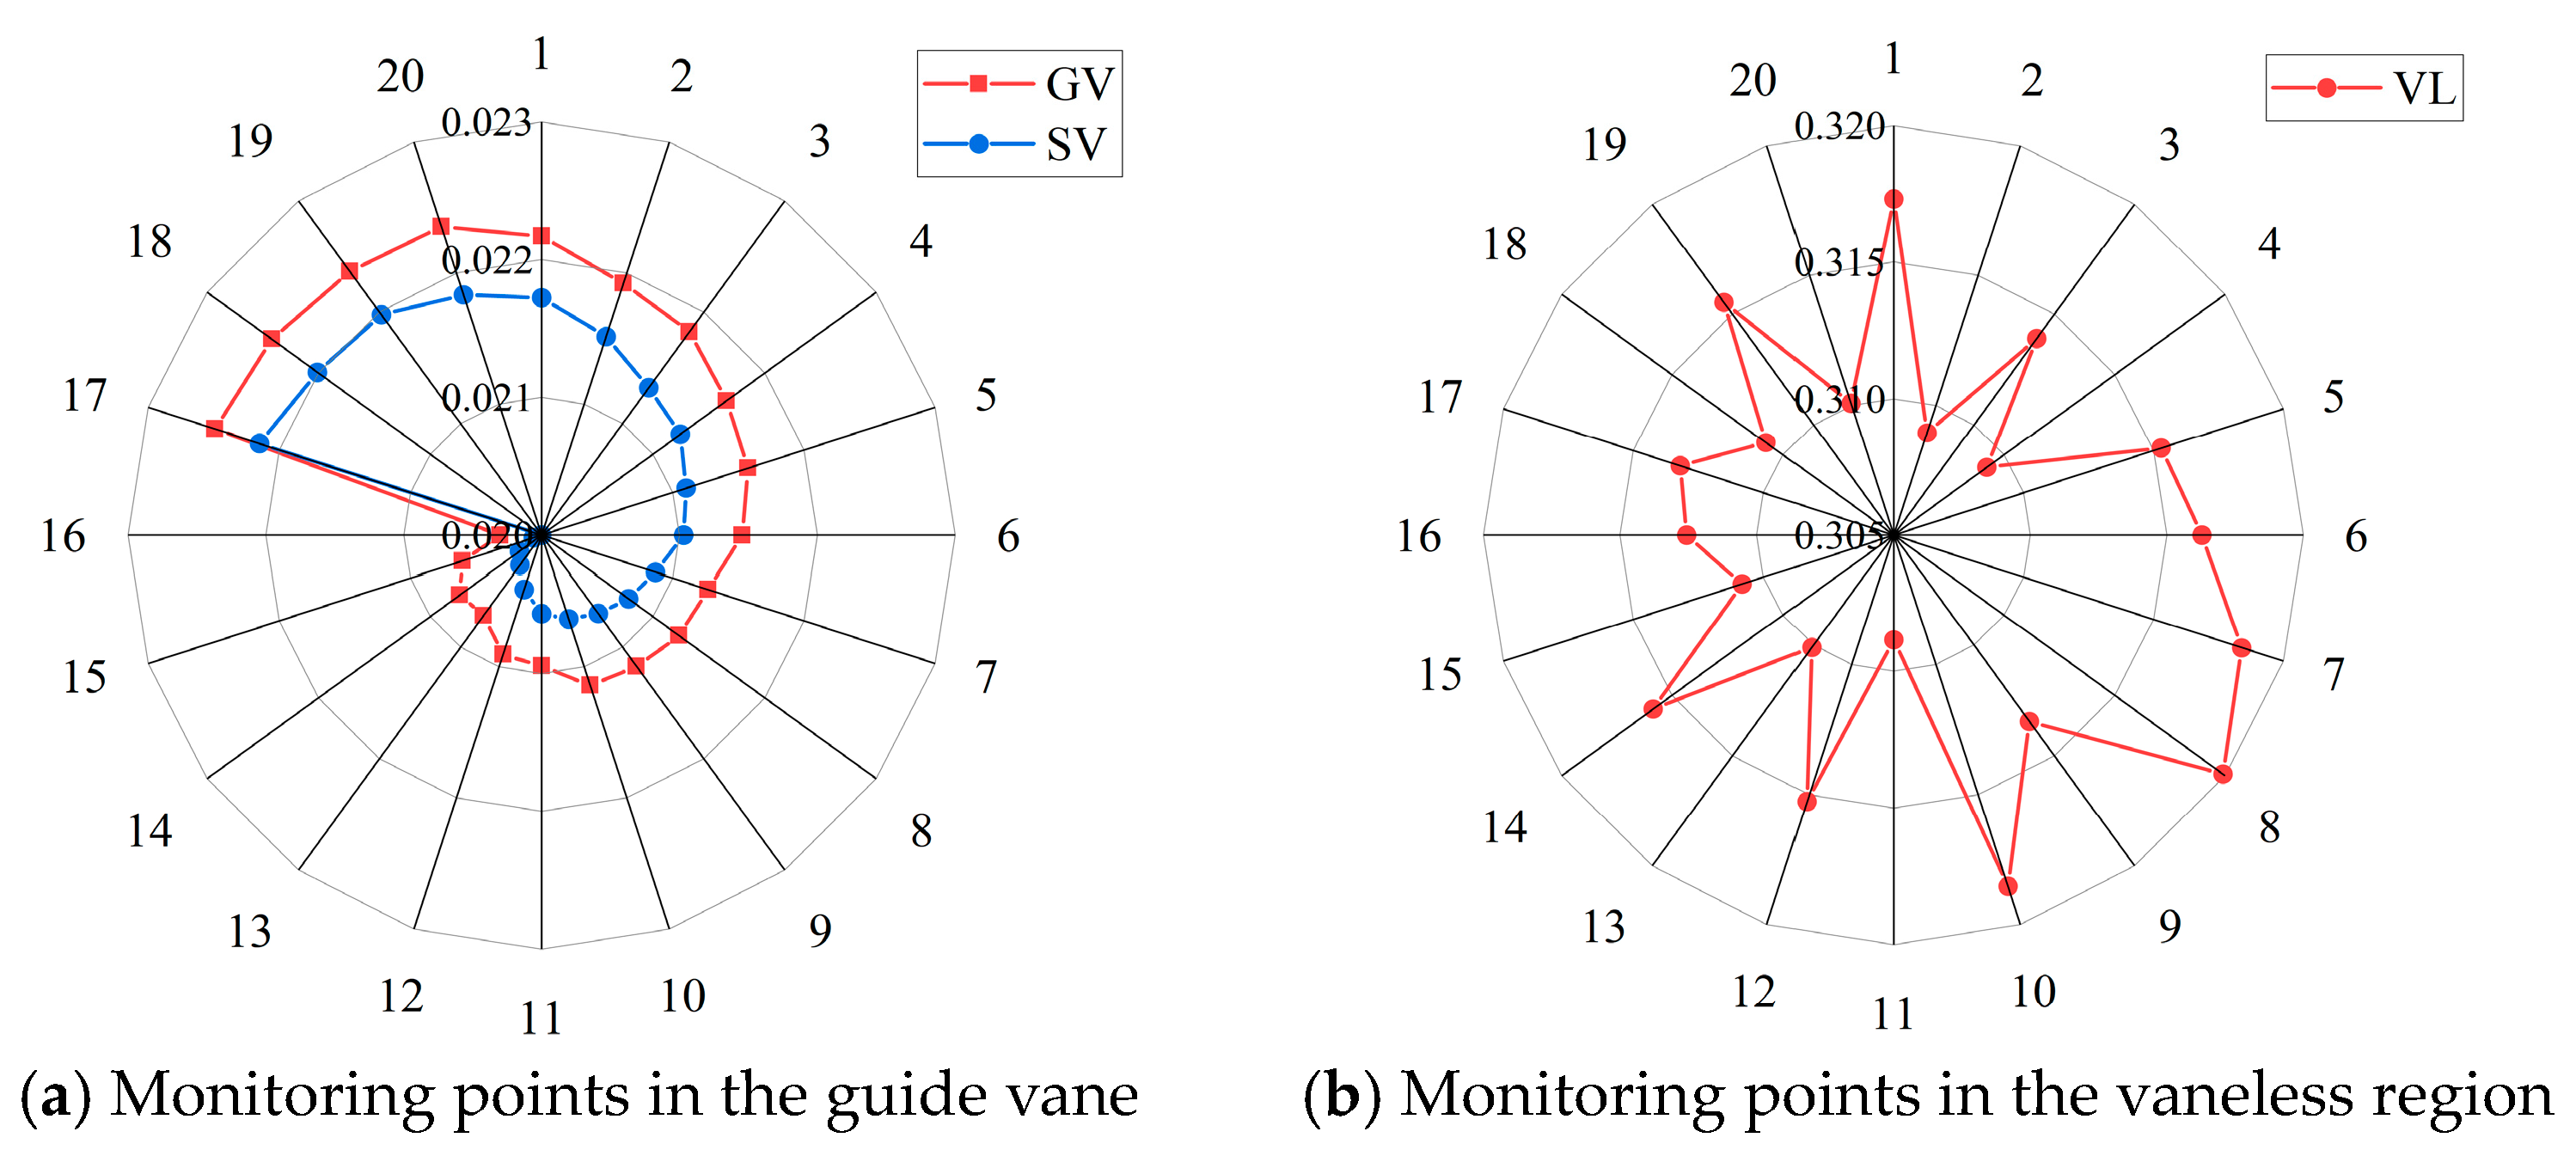
2.5. Setting of Pressure Monitoring Points

To investigate the pressure pulsation characteristics under the S-shaped operating conditions at different guide vane openings, pressure monitoring points were set during the transient computation of the unit, as shown in Figure 5. Figure 5a illustrates the schematic diagram of the monitoring point arrangement in the volute and guide vane regions. In these regions, the monitoring points are positioned on the central plane of the guide vanes. Nine monitoring points (SC–1 to SC–9) are arranged along the flow direction within the volute, monitoring points SV1 to SV20 are positioned outside the fixed guide vanes, GV–1 to GV–20 are set between the fixed and movable guide vanes, and VL–1 to VL–20 are placed in the vaneless space between the movable guide vanes and the runner. Figure 5b shows the schematic diagram of the monitoring point arrangement in the draft tube region. Monitoring points are set at cross-sections located 0D (D being the runner radius, D = 2.31 m), 0.5D, 1D, the bend axis of the draft tube, and the draft tube outlet. At each cross-section, five monitoring points (for instance DT–1.1 to DT–1.5 on cross-section No.1) are evenly distributed from the center to the wall.
By performing a short-time Fourier transform on the dimensionless pressure pulsation Cp data from each monitoring point, frequency domain plots were obtained to analyze the frequency characteristics of each operating condition.
C p = P P ¯ ρ g H
In Equation (10), p represents the measured pressure, p ¯ represents the average pressure, ρ represents the density of water, g represents the acceleration due to gravity, and H represents the head for the specific operating condition.

3. Results and Discussion

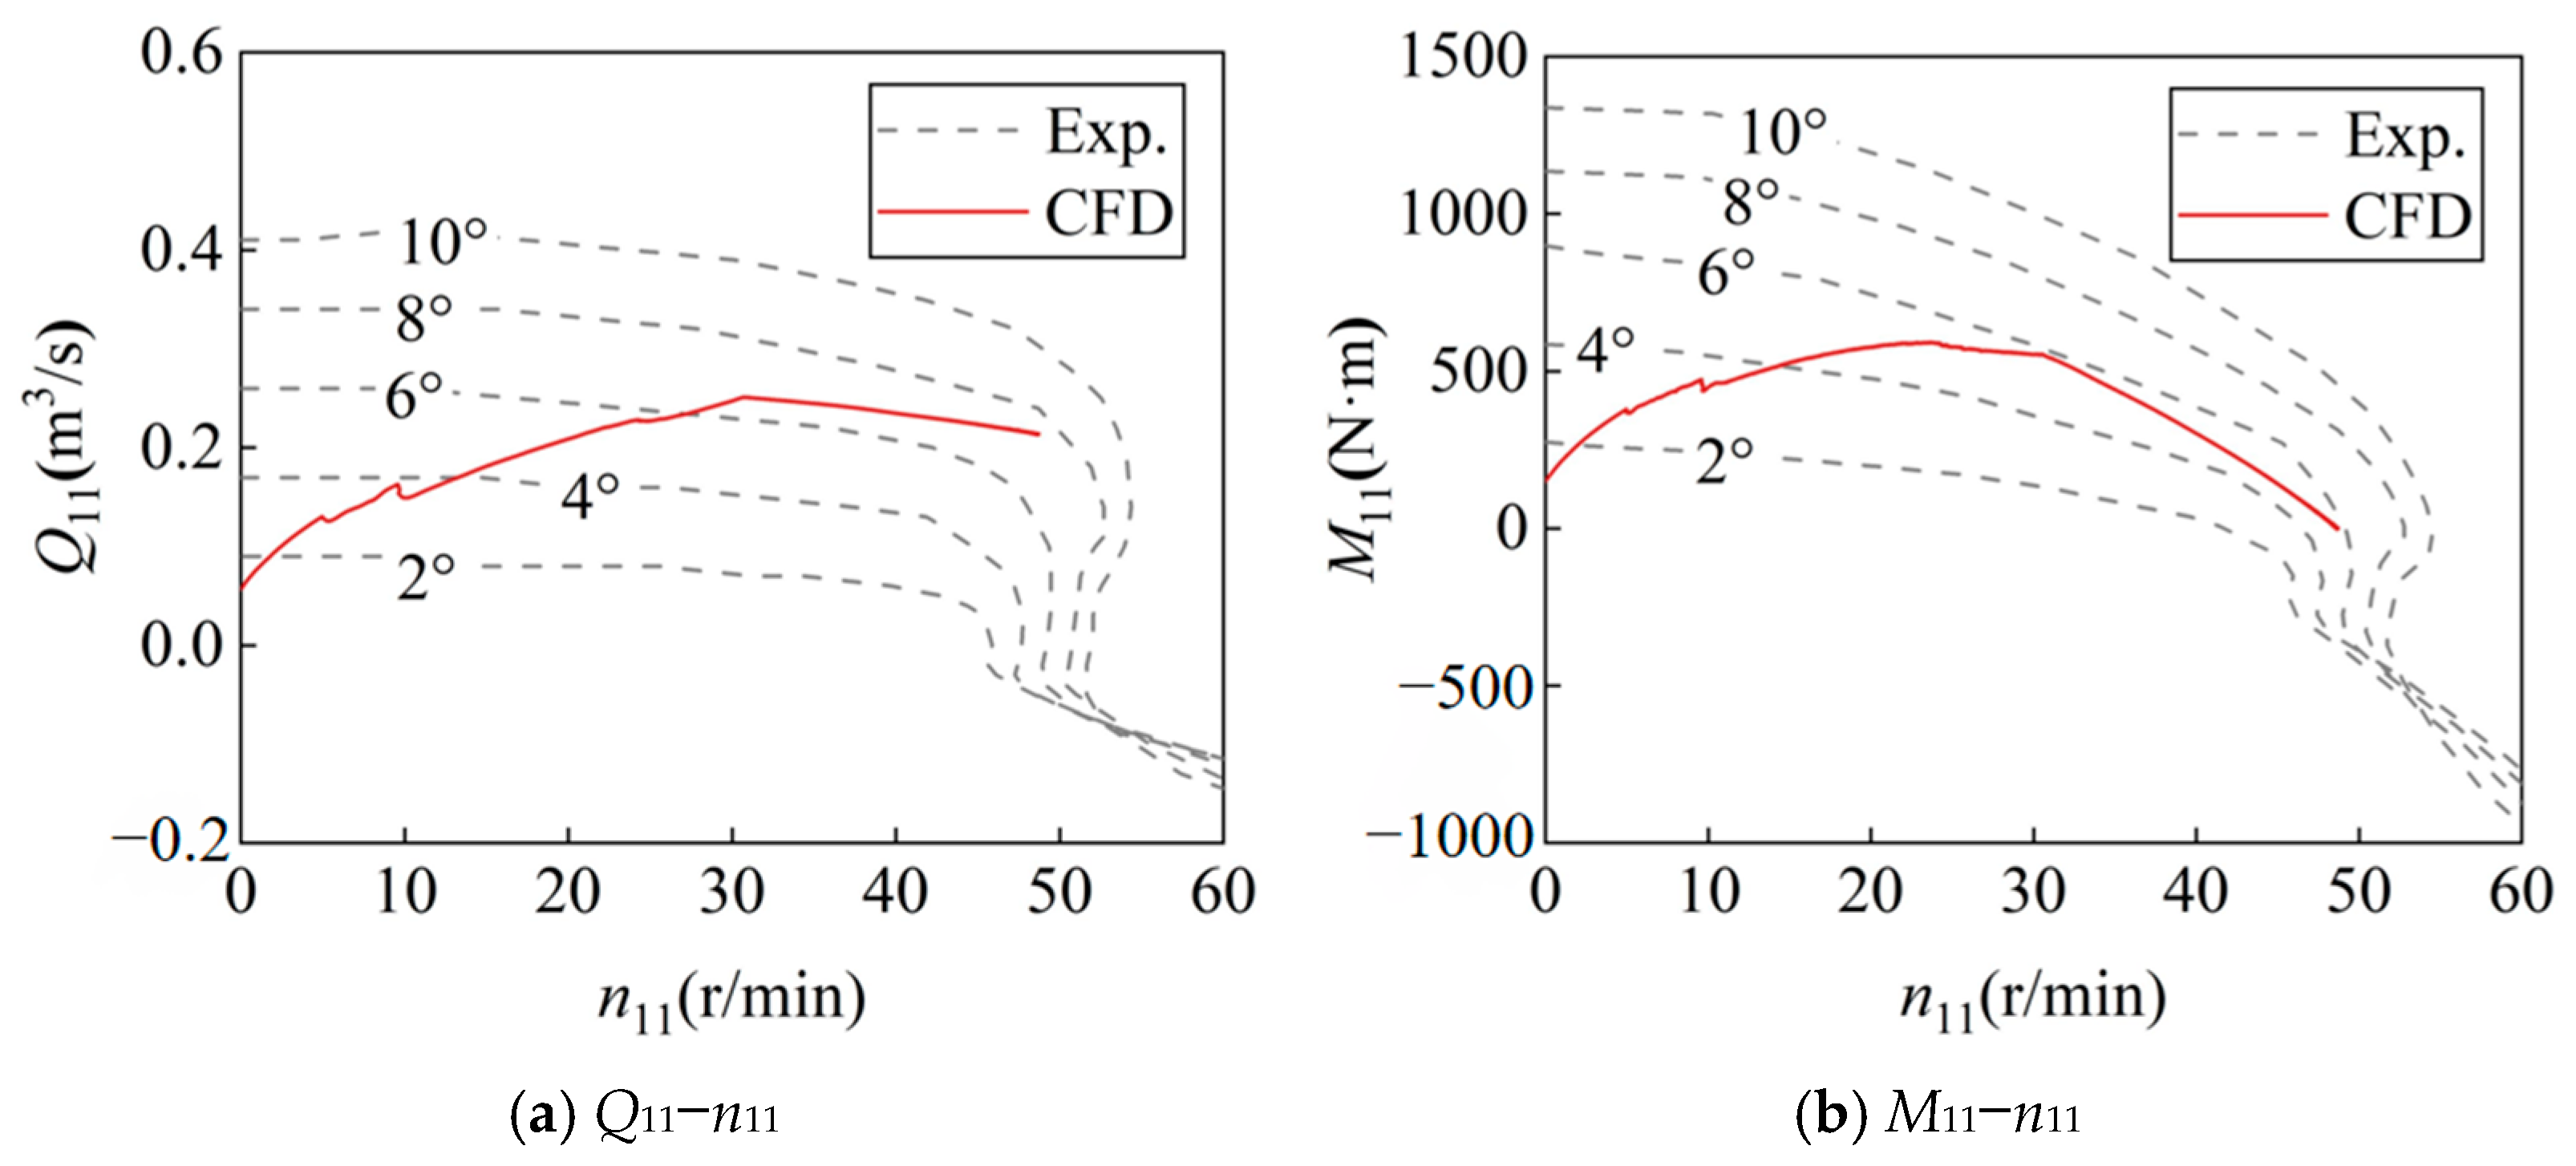
3.1. Numerical Simulation Validation

The variation during the start-up process of the pump-turbine on the full characteristic curves graph is shown in Figure 6. With the opening of the guide vanes, the unit characteristic curve gradually extends from the small opening line to the large opening line. When the guide vanes are opened to 6°, a significant inflection point appears in the unit characteristic curve. Beyond this point, the unit speed continues to increase while the unit flow rate and unit torque begin to decrease and eventually stabilize. In the unit speed-unit flow rate graph, the final operating conditions of the numerical simulation stop between 6° and 8°, whereas in the unit speed unit torque graph, the final operating condition of the numerical simulation stops at 6°, which is relatively consistent with the actual set angle of the numerical simulation.

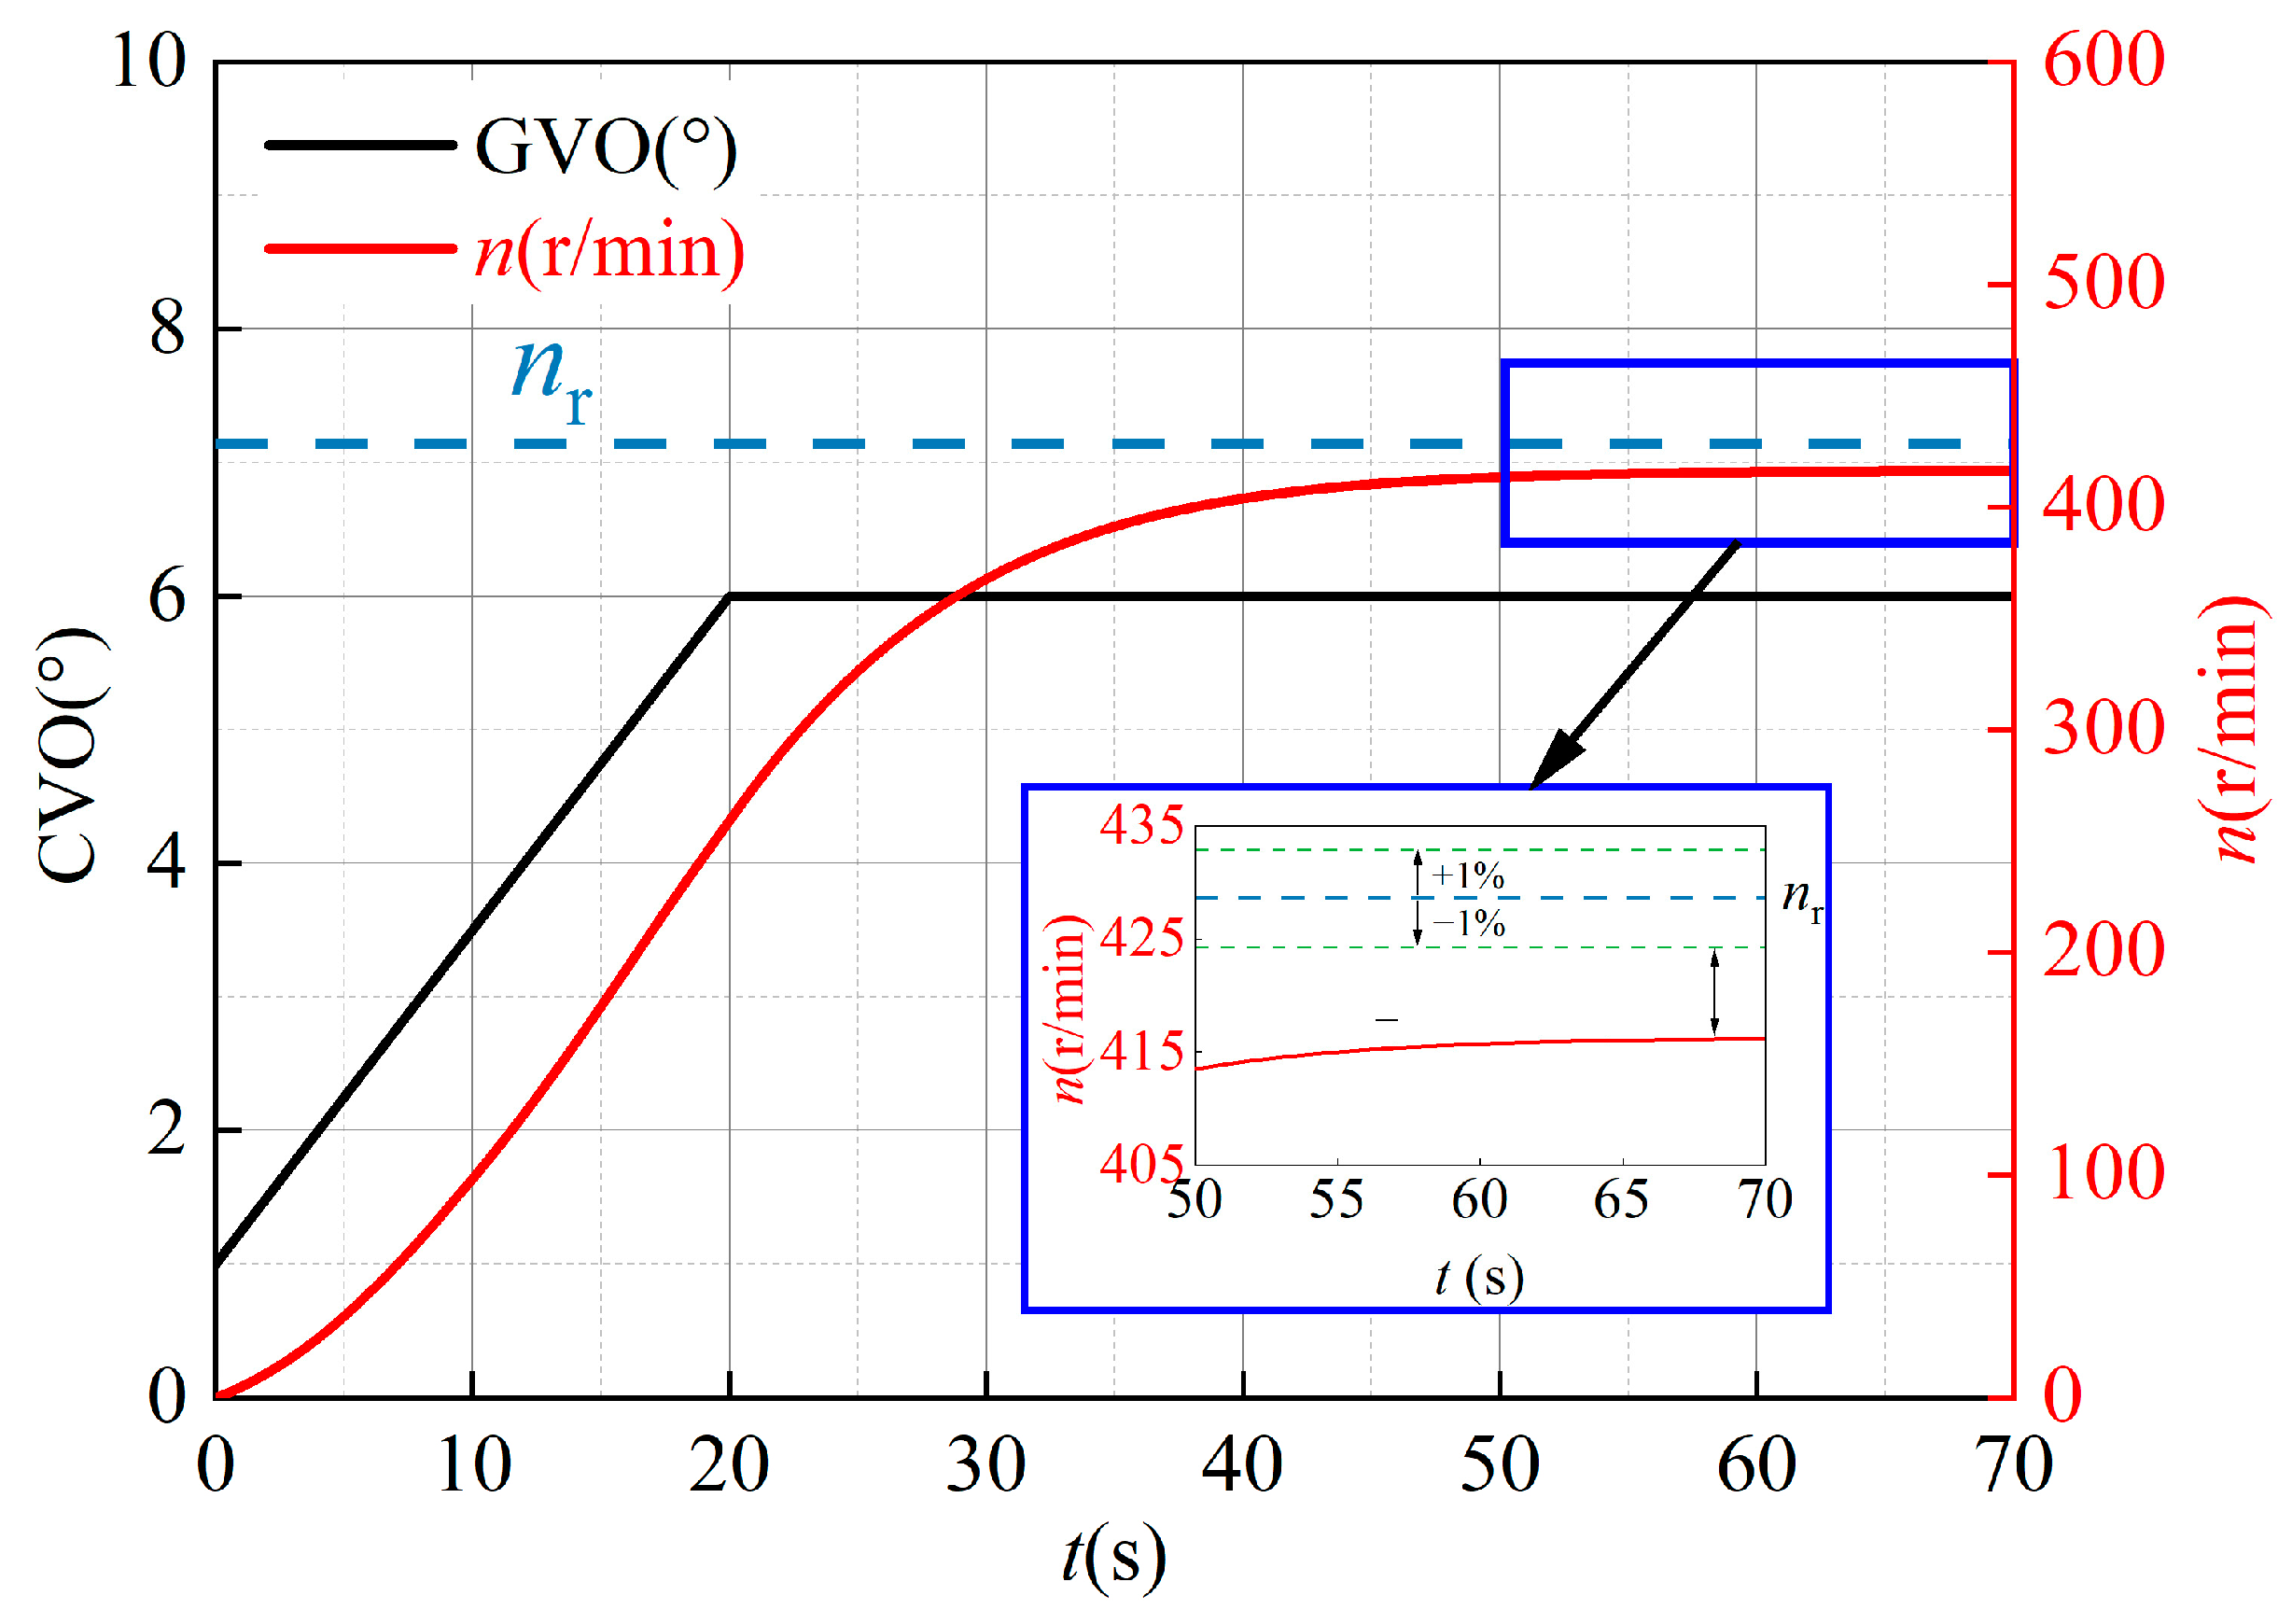
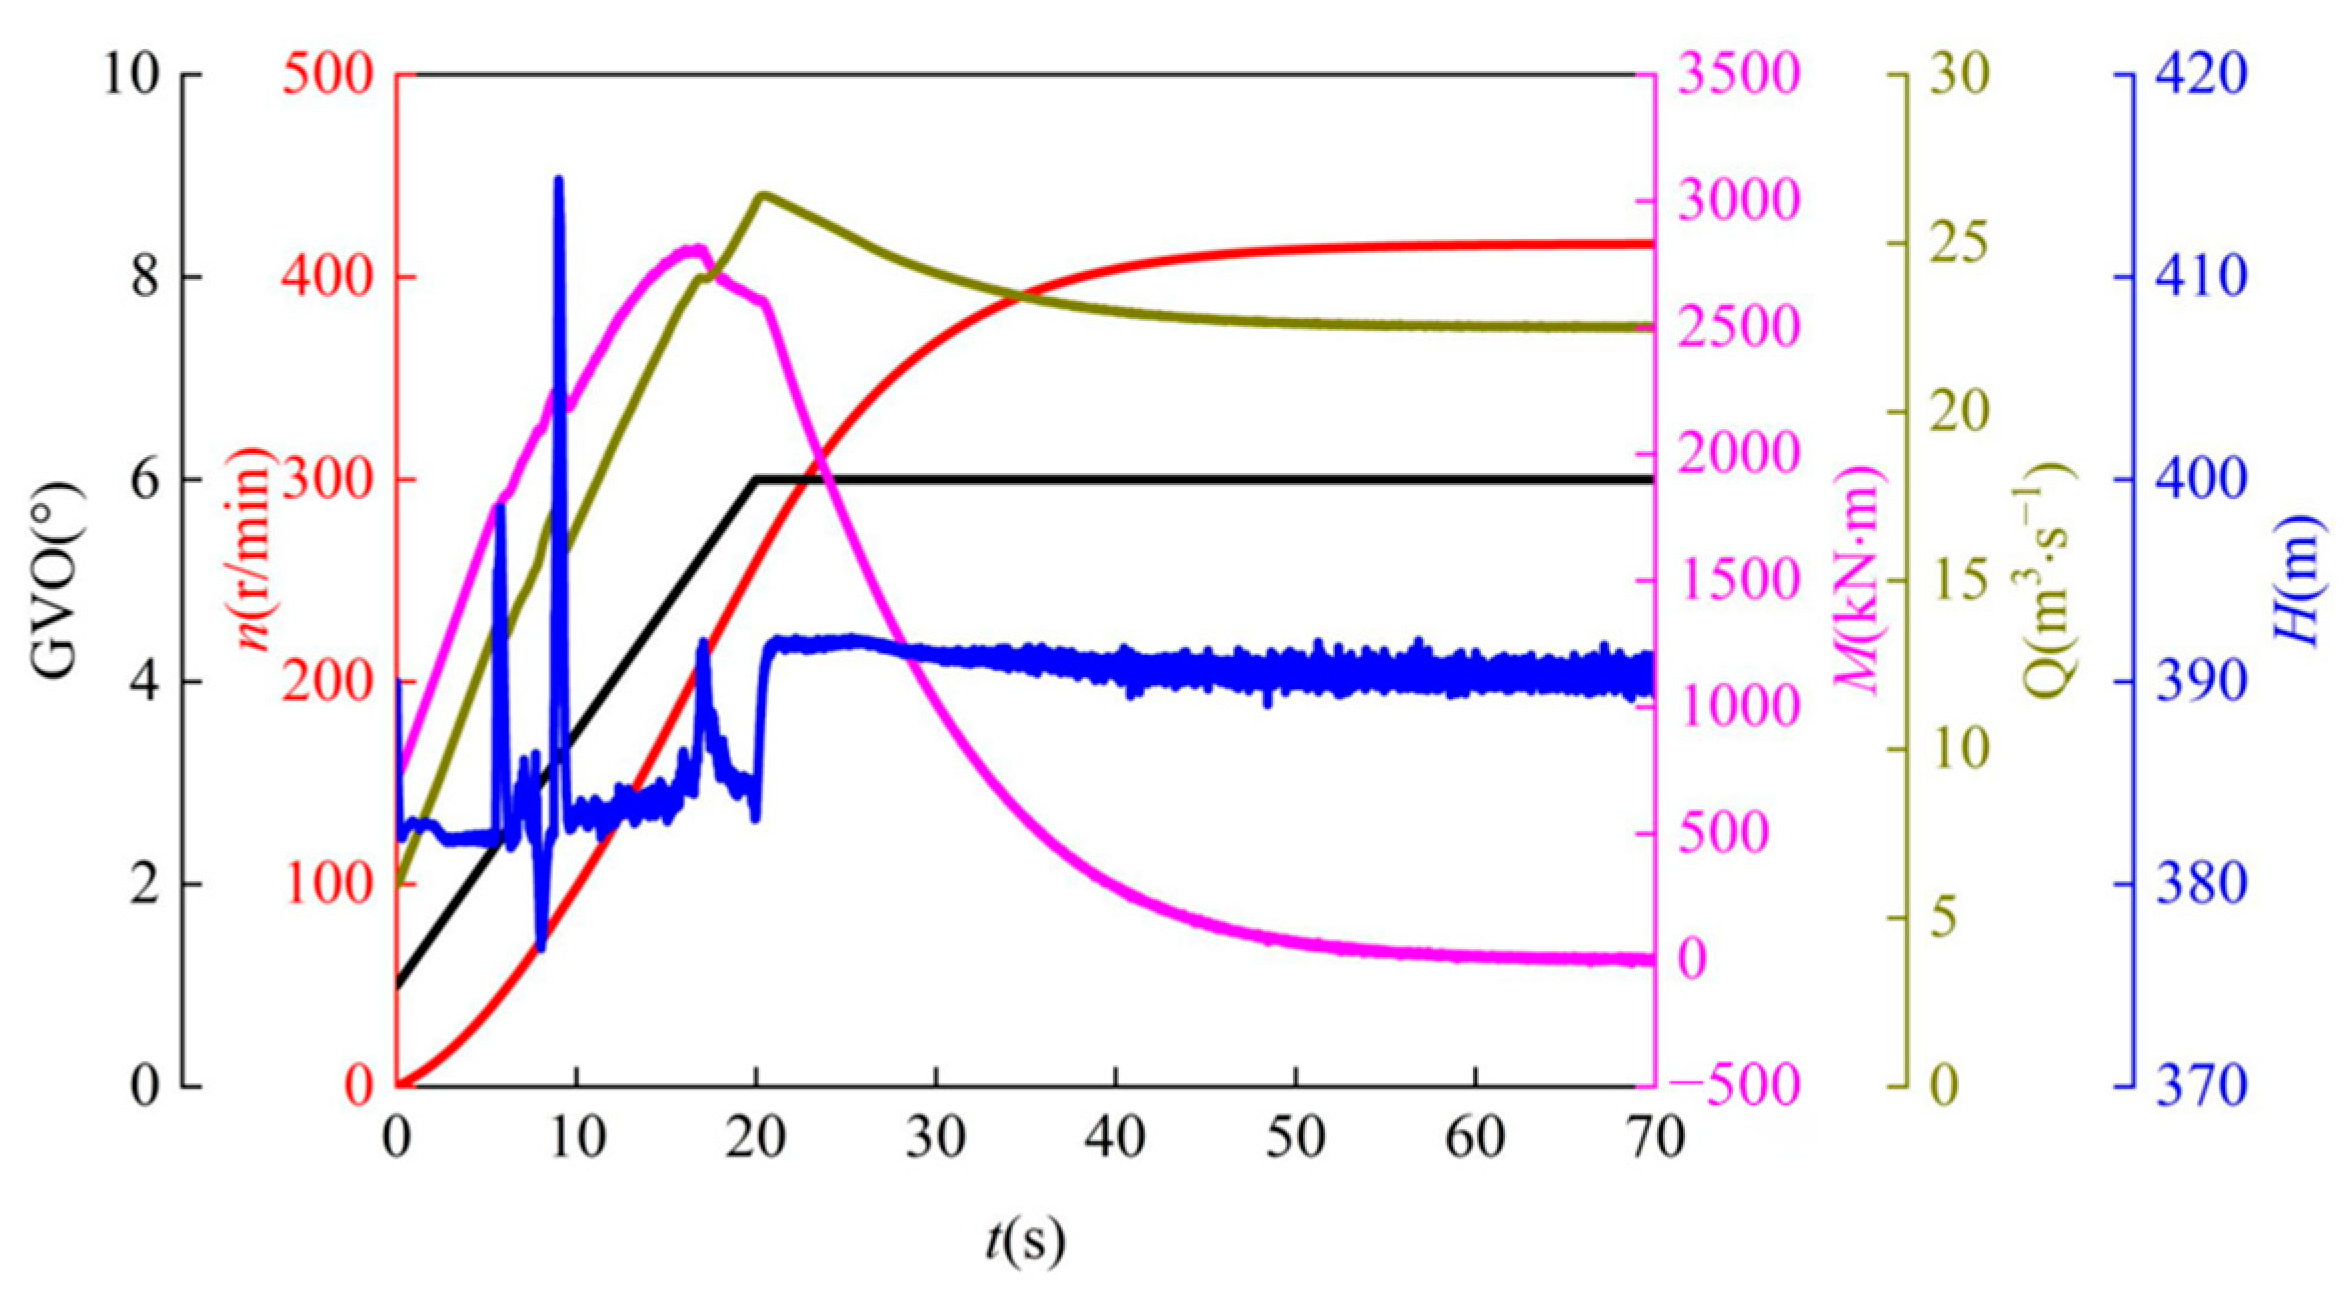
3.2. Analysis of the Unit’s External Characteristics

The variation of the opening (GVO) angle of the guide vanes was referenced from the actual operational pattern of guide vane opening observed in an existing power plant. In order to ensure proper mesh reconstruction and maintain the quality of the guide vane mesh during the vane opening process, the opening angle of the guide vanes starts from 1° and increases at a constant rate to 6° within the first 20 s. After 20 s, the opening angle of the guide vanes remains constant, as shown in Figure 7. As depicted in the figure, with the opening of the guide vanes, the rotational speed of the unit continuously increases. Once the movement of the guide vanes ceases, the rate of change in the rotational speed gradually diminishes, eventually stabilizing at around 416.2 r/min. The relative error with respect to the unit speed nr is approximately 2.89%.
Figure 8 illustrates the variation of external characteristic parameters during the start-up process. As shown in this figure, significant changes occur in the unit’s runner speed, runner torque, flow rate, and head during the start-up process of the pump-turbine. From 0 to 5 s, the unit is in the initial stage of start-up, with the guide vanes opening. During this stage, the flow rate, runner torque, and runner speed start to increase. The unit head remains stable without significant fluctuations. From 5 to 10 s, the parameters enter a rising phase. The unit head exhibits intense fluctuations, reaching a minimum fluctuation value of 377.0 m at 8.0 s and a maximum fluctuation value of 414.8 m at 9 s. This also leads to slight fluctuations in the runner torque and flow rate. From 10 to 20 s, this stage represents the later period of guide vane opening. The unit head gradually increases with slight fluctuations, while the runner torque rapidly increases, reaching a maximum value of 2804 kN·m at 16.6 s and then starts to decrease. At this point, the runner speed reaches its maximum rate of increase. The flow rate of the unit continues to increase and reaches its maximum value at 20 s when the guide vanes stop moving. From 20 to 70 s, the guide vanes remain stationary. At 20 s, the unit head rapidly rises from 383.2 m to 391.5 m. This is primarily due to the opening of the guide vanes during the start-up process, causing a negative water hammer effect and resulting in a pressure decrease. When the guide vanes stop moving, the pressure quickly recovers to normal levels. The unit head then gradually decreases and stabilizes, fluctuating around 390.0 m. The flow rate of the unit reaches its maximum value of 26.4 m3/s at 20.5 s and then gradually decreases, eventually stabilizing at 22.5 m3/s. The runner torque decreases rapidly and stabilizes near 0 kN·m. The runner speed continues to increase, but the rate of increase decreases, ultimately stabilizing at 416.2 r/min.

3.3. Analysis of Unit Pressure Pulsation Characteristics

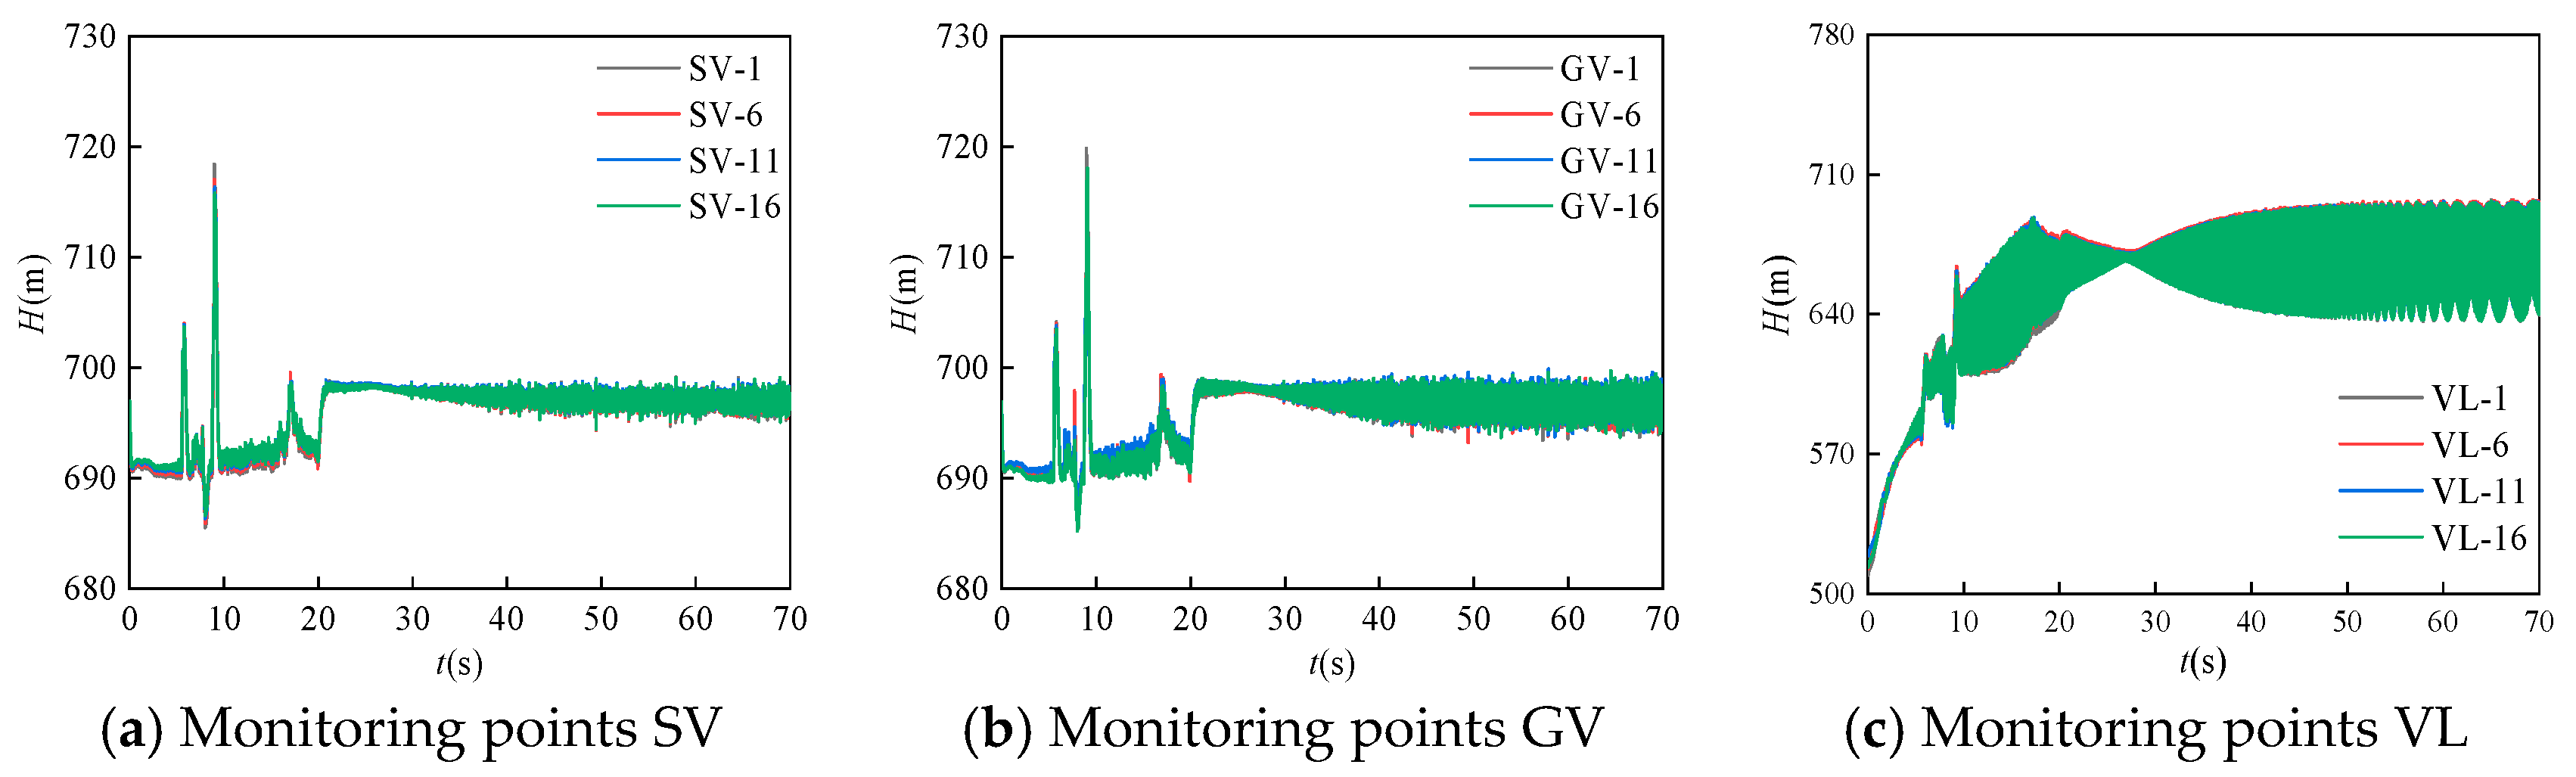
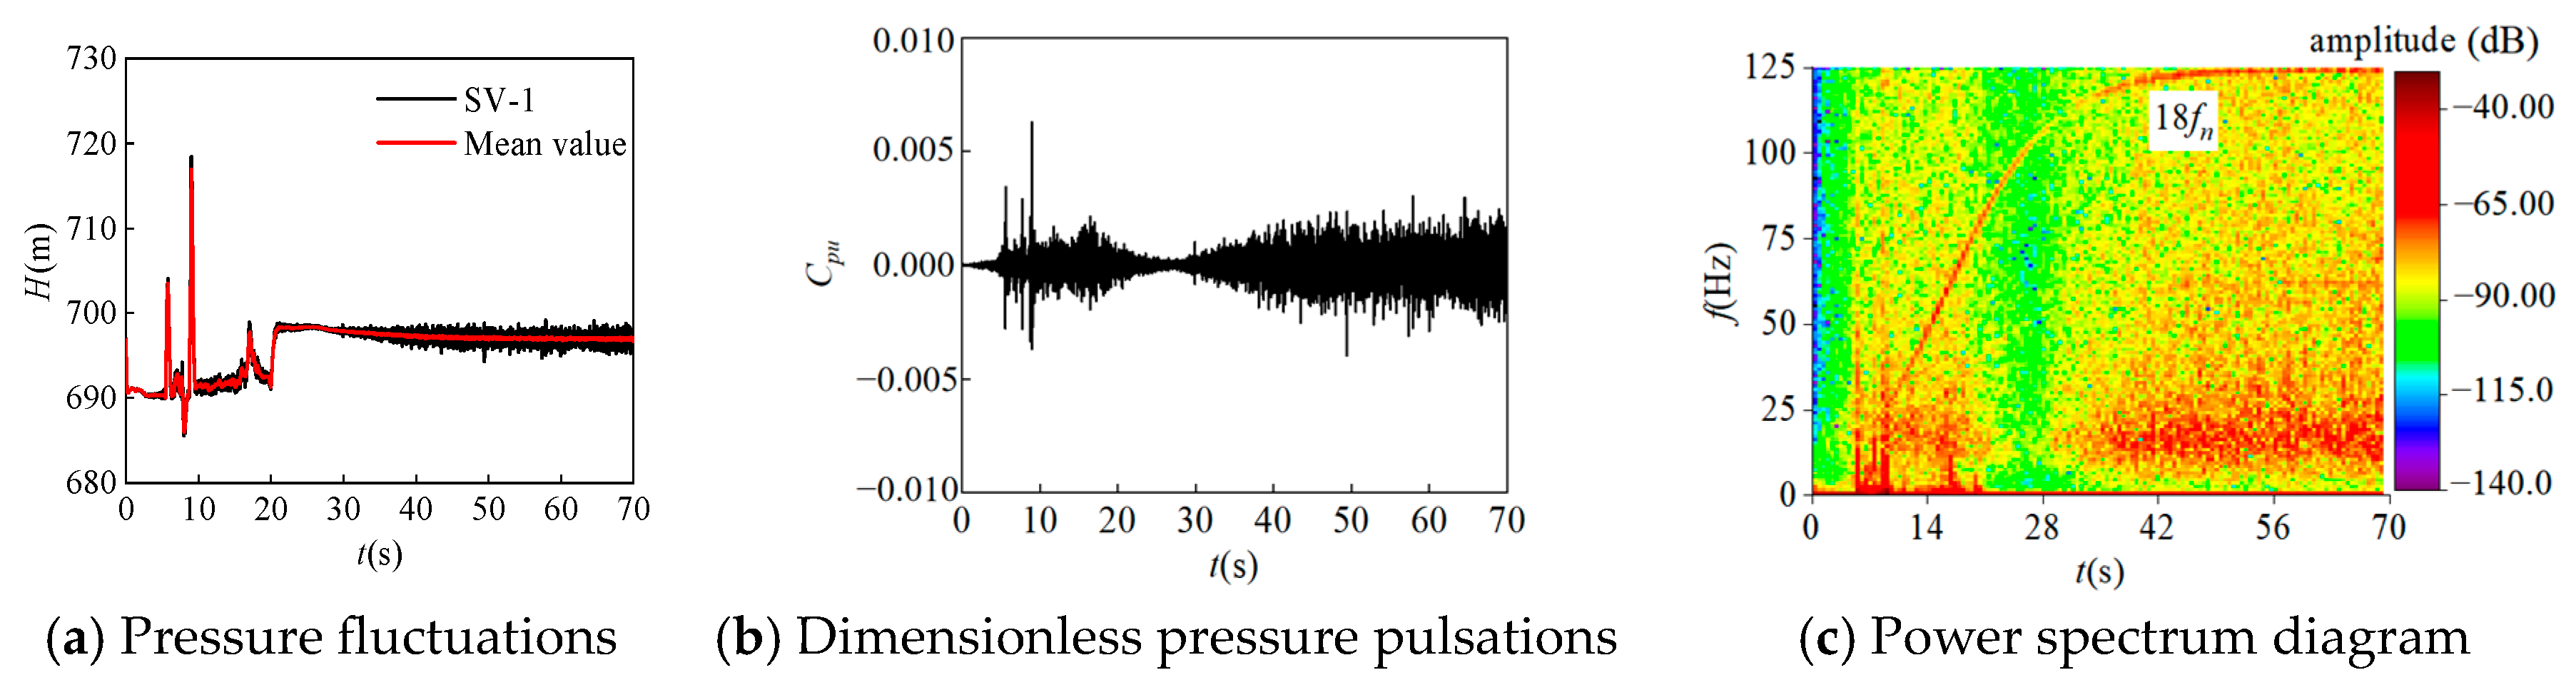
3.3.1. Analysis of Pressure Pulsations in the Guide Vane and Runner Areas

To analyze the pressure pulsation characteristics and circumferential pressure distribution in the guide vane and runner areas, the measured pressure data are processed using Equation (11) to obtain the pressure non-uniformity coefficient Cpn.
C p n = ( i = 1 n ( p i p ¯ ) n 1 2 ρ ω 2 r 2 ) = 2 ρ ω 2 r 2 i = 1 n ( p i p ¯ ) n
where pi represents the measured pressure, p ¯ denotes the average pressure, n represents the total number of measured pressure data points, ρ represents the density of water, ω represents the rated angular velocity of the runner, and r represents the radius of the runner.
Figure 9a represents the distribution of pressure non-uniformity in the guide vane region. As shown in the figure, the pressure non-uniformity amplitude at the outer monitoring points GV1~20 of the guide vanes is greater than that at the outer monitoring points SV1~20 of the fixed guide vanes. This is primarily because the GV monitoring points are closer to the runner and experience more intense pressure fluctuations due to the smaller opening angle of the guide vanes compared to the SV monitoring points. In the circumferential direction, the pressure non-uniformity at both SV and GV monitoring points gradually increases in the flow direction from SV (GV)–16. It reaches its maximum value at SV (GV)–17. The main reason for this variation is the gradual reduction in the cross-sectional area of the volute casing in the flow direction, resulting in increased flow velocity and pressure fluctuations, leading to an increase in pressure non-uniformity. The monitoring points located on the tongue side exhibit the highest pressure non-uniformity. Figure 9b shows the distribution of pressure non-uniformity at the vaneless region. It can be observed that the amplitude of pressure non-uniformity in the vaneless region is significantly higher than that in the guide vane region. This is mainly because the monitoring points in the vaneless region are closer to the runner and are strongly influenced by the rotation of the runner. Additionally, the smaller opening angle of the guide vanes during the start-up process of the pump-turbine leads to the formation of a high-velocity water ring in the vaneless region, causing intense pressure fluctuations. In the circumferential direction, there is significant variation in the amplitude of pressure non-uniformity in the vaneless region without any apparent pattern.
Figure 10 displays the pressure fluctuations at the monitoring points in the guide vane and vaneless regions. As shown in the figure, there is no significant circumferential difference in pressure fluctuations among the SV and GV monitoring points in the guide vane region. The pressure fluctuations exhibit similar trends and magnitudes at each measurement point, which are consistent with the variations in the unit’s hydraulic head. The maximum amplitude of pressure fluctuation is 720 m, while the minimum is 685 m. In the vaneless region, the pressure fluctuations do not exhibit significant circumferential variations. The maximum amplitude of pressure fluctuation is 700 m, while the minimum is 510 m.
Figure 11, Figure 12 and Figure 13 show the pressure pulsation characteristics at monitoring points SV–1, GV–1, and VL–1, respectively. In Figure 11b and Figure 12b, the dimensionless pressure pulsation amplitude at SV-1 is primarily distributed between −0.003 and 0.003, with a maximum value of 0.0085. During the initial 20 s of the guide vane opening phase, the pressure pulsation amplitude gradually increases. After the guide vanes stop moving, the amplitude decreases first and then increases, reaching its minimum value at 27 s. The dimensionless pressure pulsation distribution at GV–1 is similar to that at SV–1, but with slightly larger amplitudes. As shown in Figure 11c and Figure 13c, the dominant frequency at SV–1 is 18fn, while at GV–1, it is 9fn and 18fn. This is caused by the propagation of dynamic and static interference signals generated by the runner and guide vanes, which propagate upstream. Due to energy attenuation during propagation, the signal amplitude at the fixed guide vane monitoring point is significantly smaller than that in the guide vane region. In Figure 13b, the dimensionless pressure pulsation amplitude at vaneless region monitoring point VL–1 is primarily distributed between −0.05 and 0.05. During the initial 0 to 3 s of the pump-turbine start-up, when the runner speed and flow velocity in the vaneless region are low, there are no significant pressure fluctuations, resulting in smaller pulsation amplitudes. From 3 to 27 s, as the runner speed rapidly increases, a high-velocity water ring forms in the vaneless region, leading to increased pressure pulsation amplitudes. After 27 s, when the runner speed reaches its maximum and stabilizes, the unit operates under no-load conditions. The fluctuation of the runner torque near zero leads to increased flow instability and intense pressure pulsations. As shown in Figure 13c, the pressure signal at vaneless region monitoring point VL−1 primarily consists of frequencies 9fn and 18fn, with significant amplitudes. This is mainly attributed to the increase in runner speed and the dynamic and static interference between the runner and guide vanes. Additionally, within the first 20 s, there are smaller amplitude pressure pulsations at a frequency of 27fn, which gradually decreases to 9fn after 20 s, indicating its association with the opening of the guide vanes.

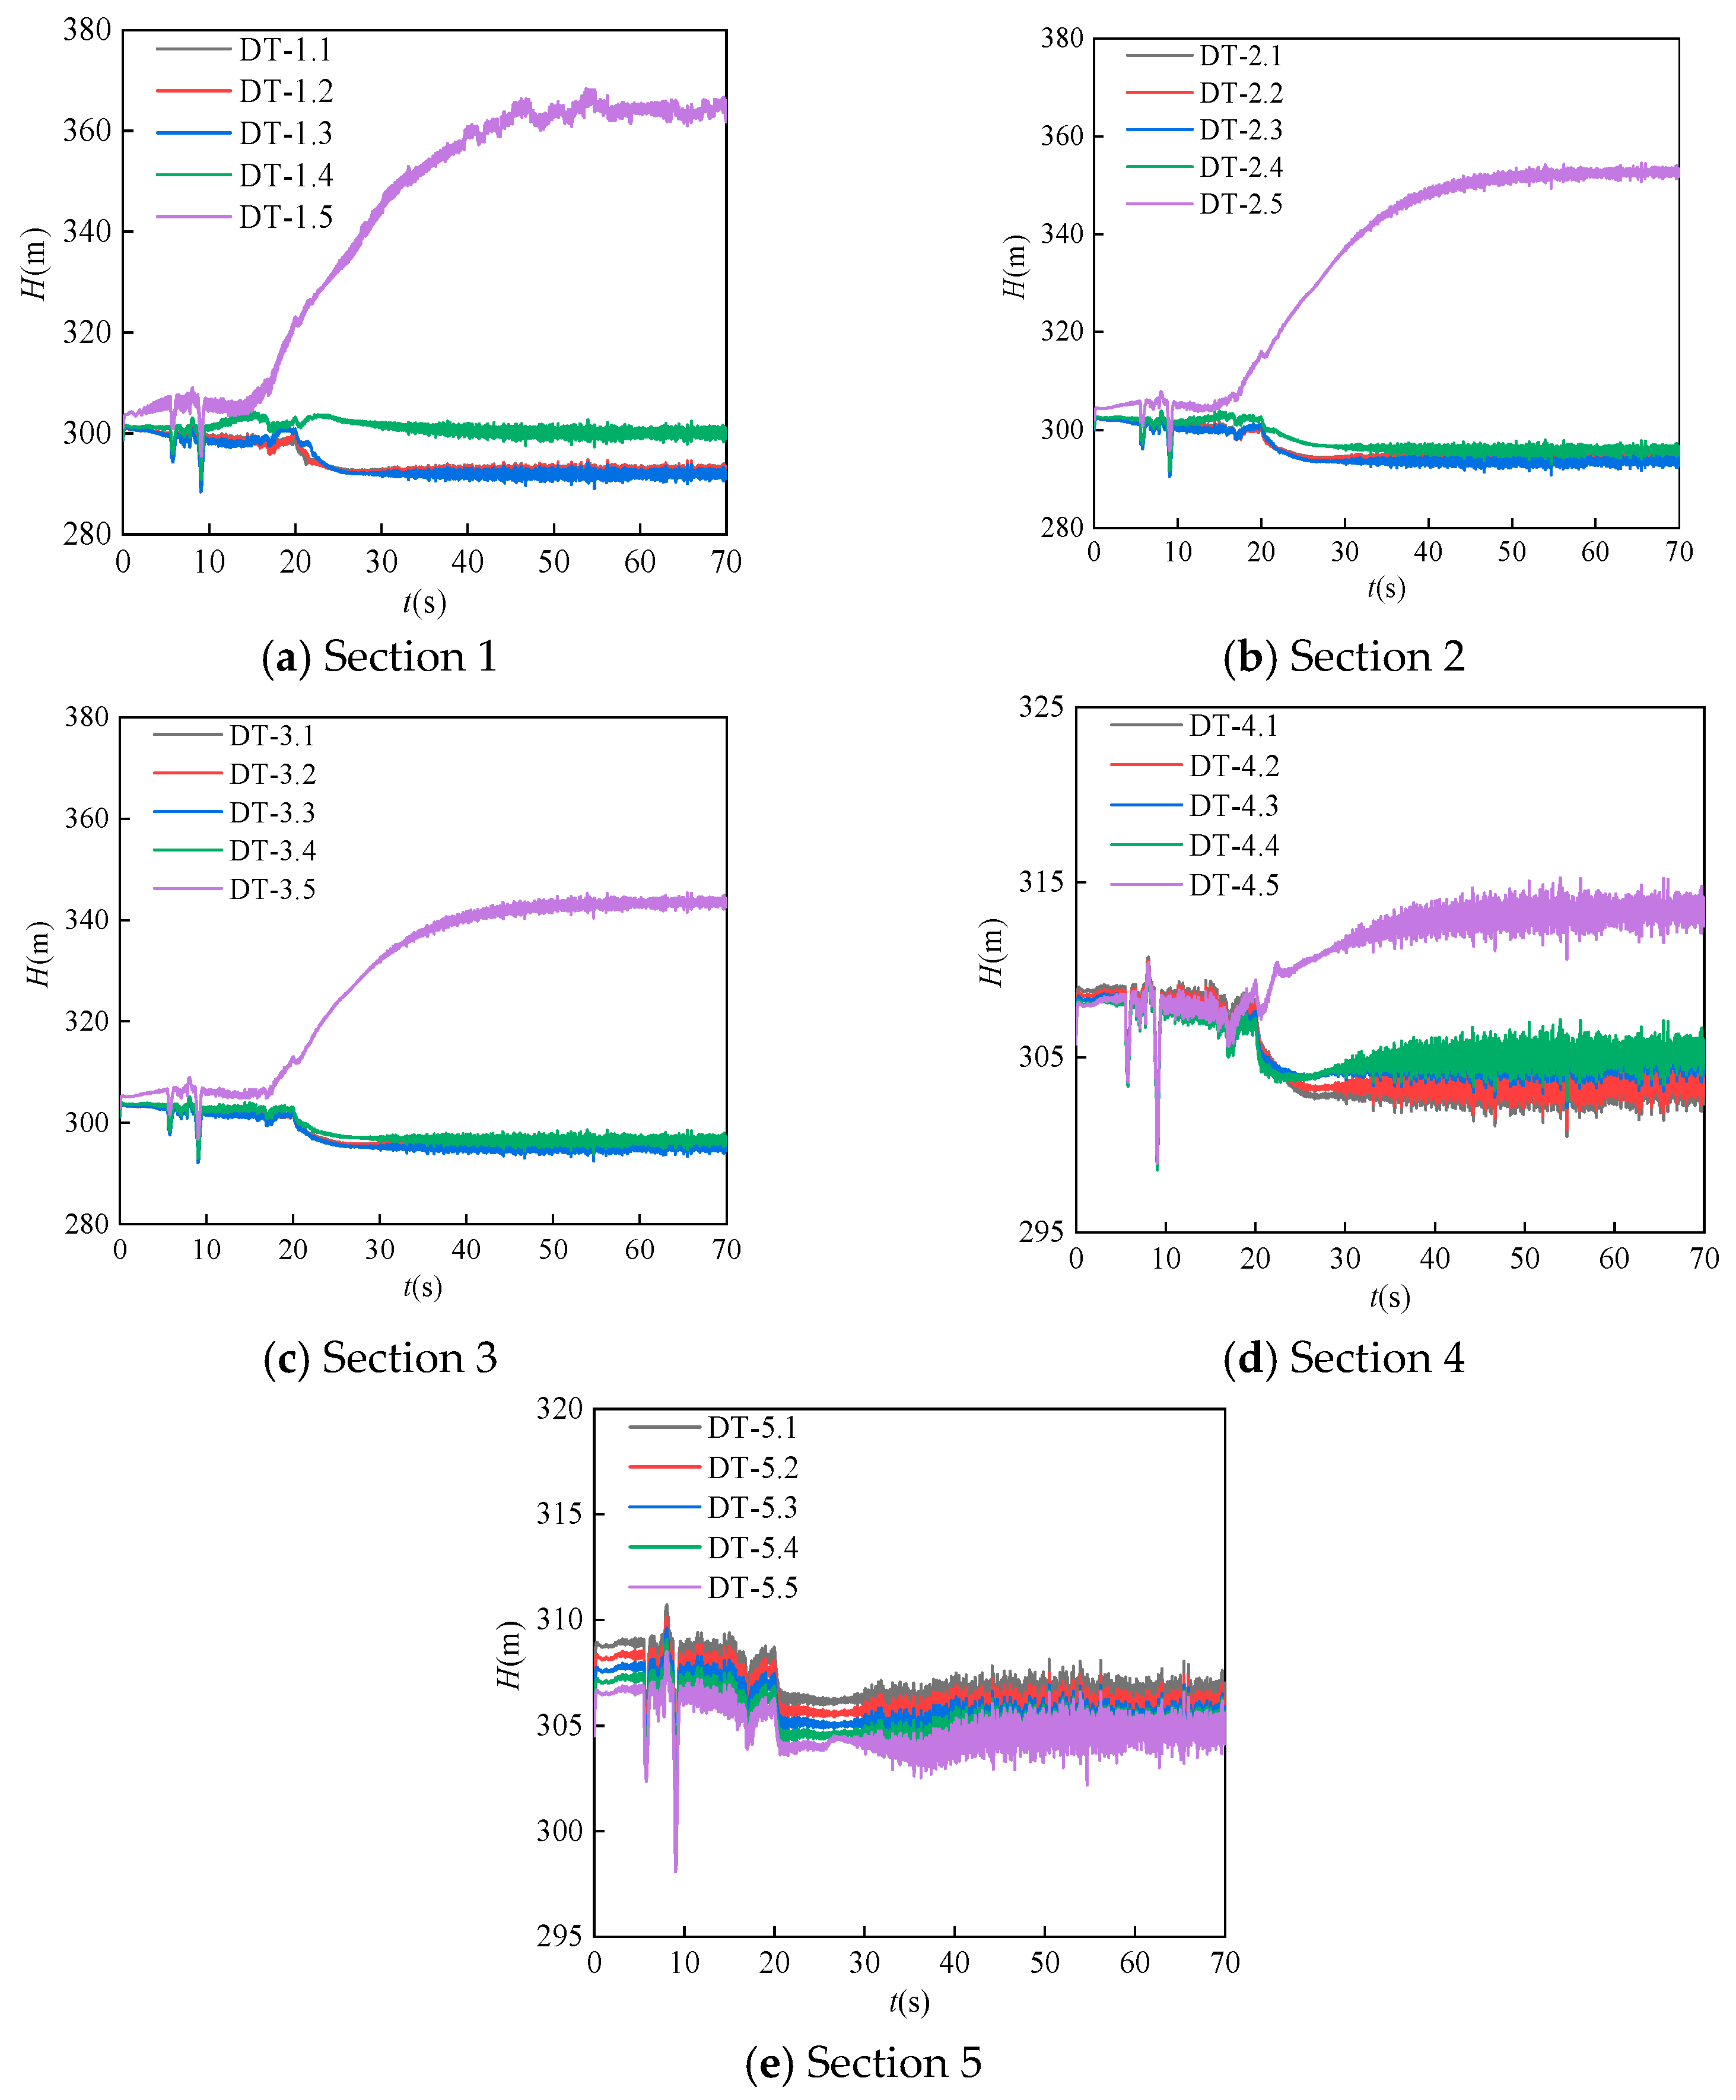
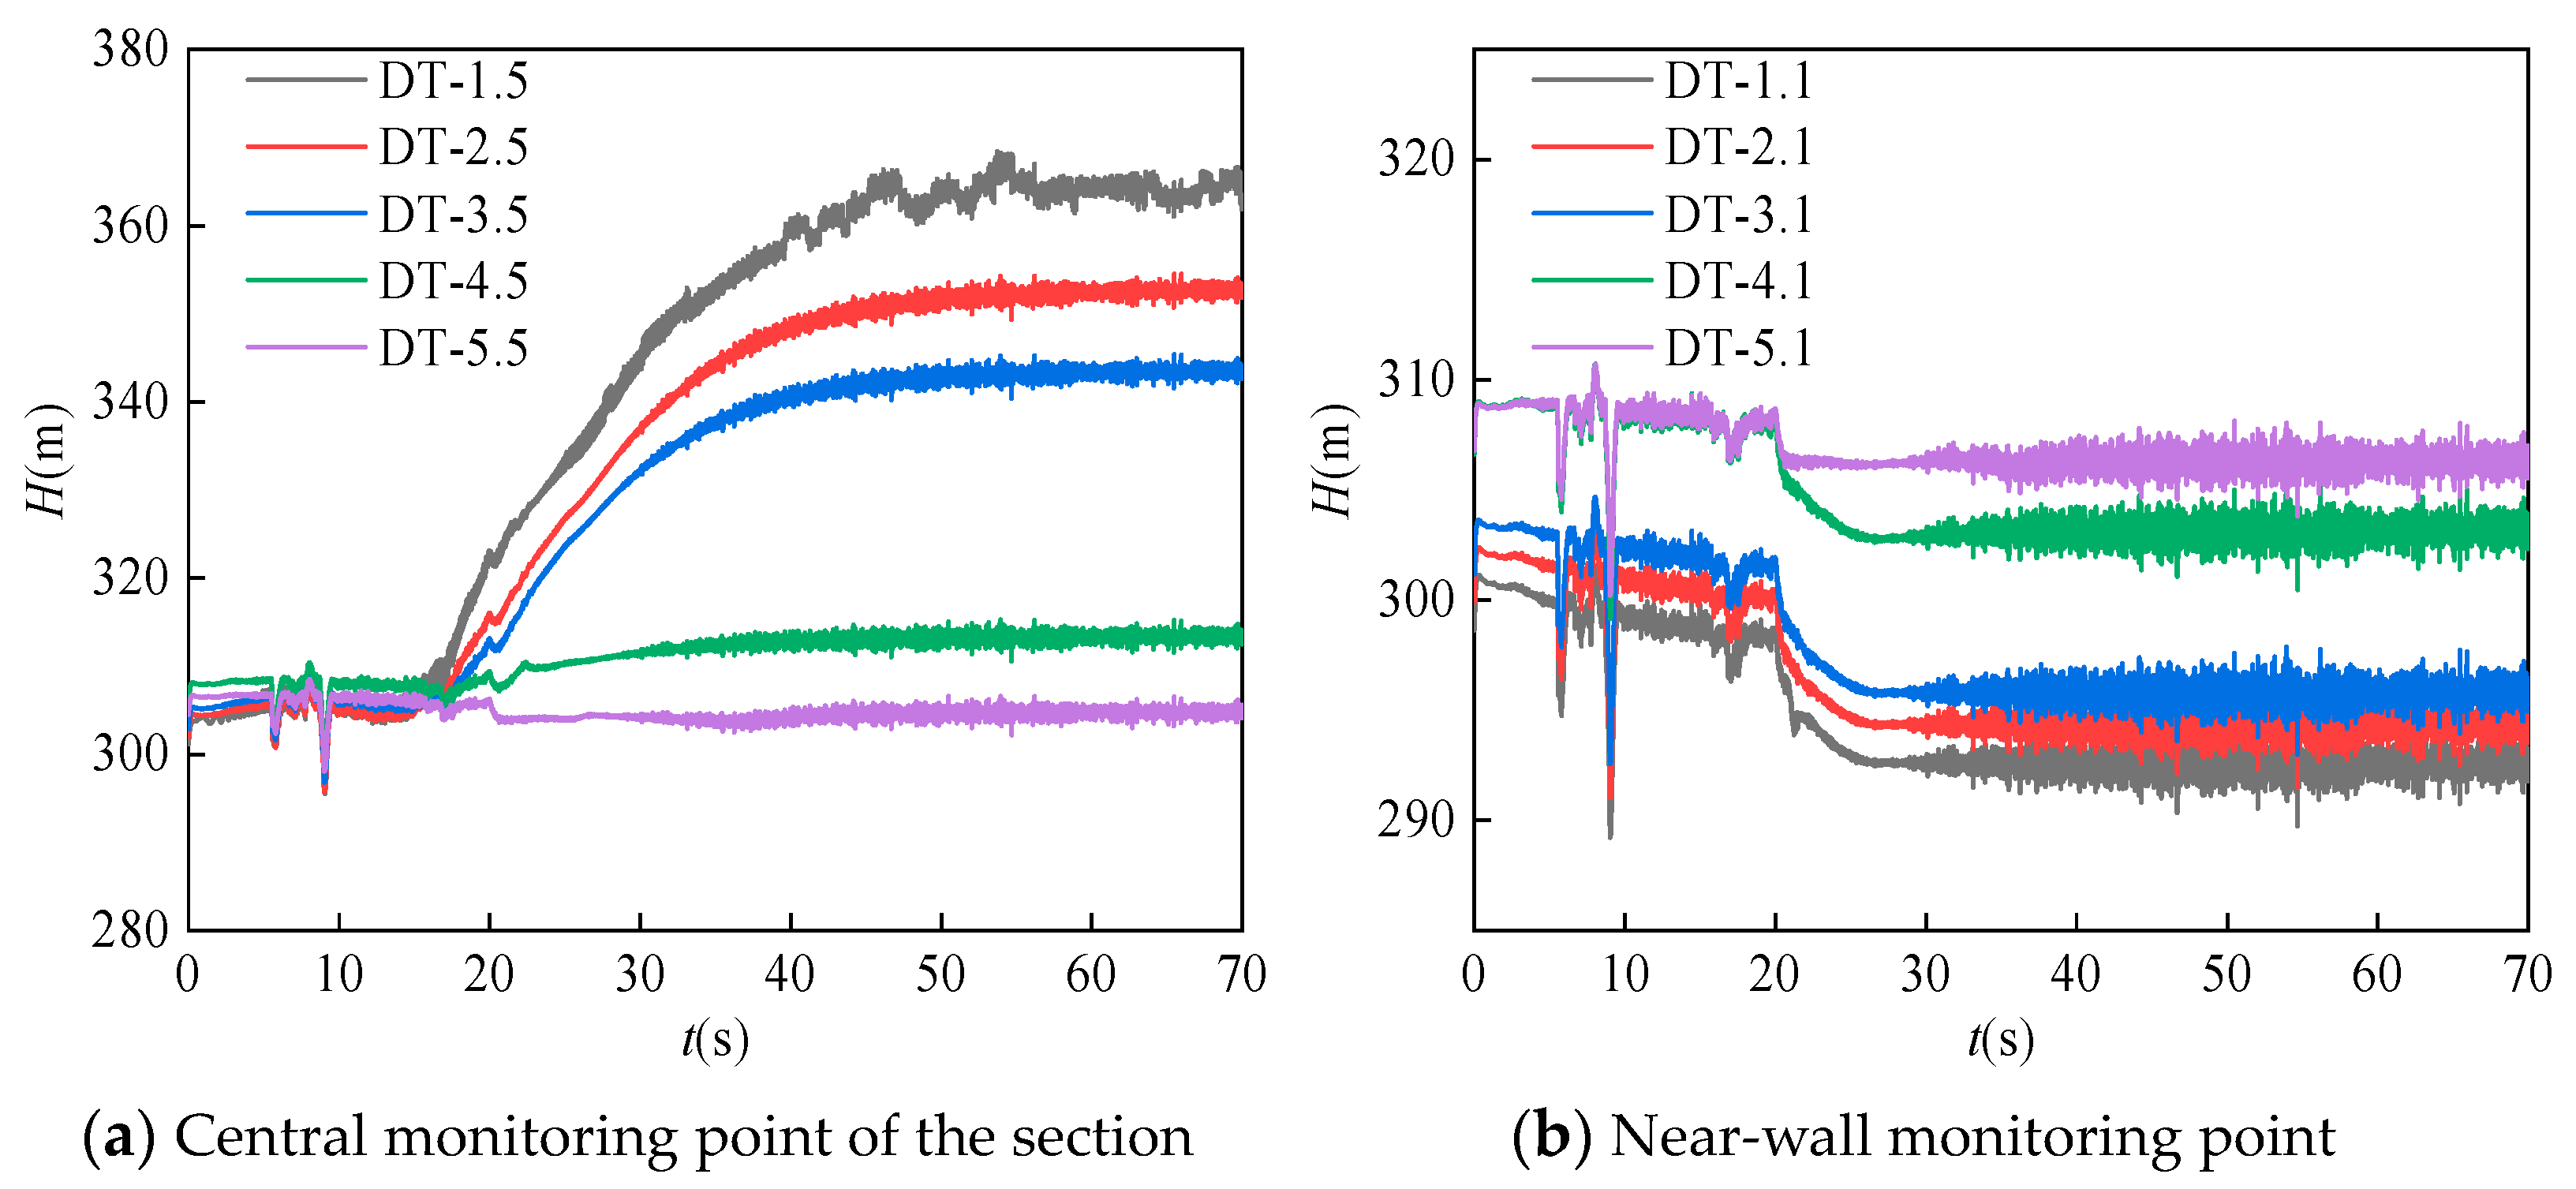
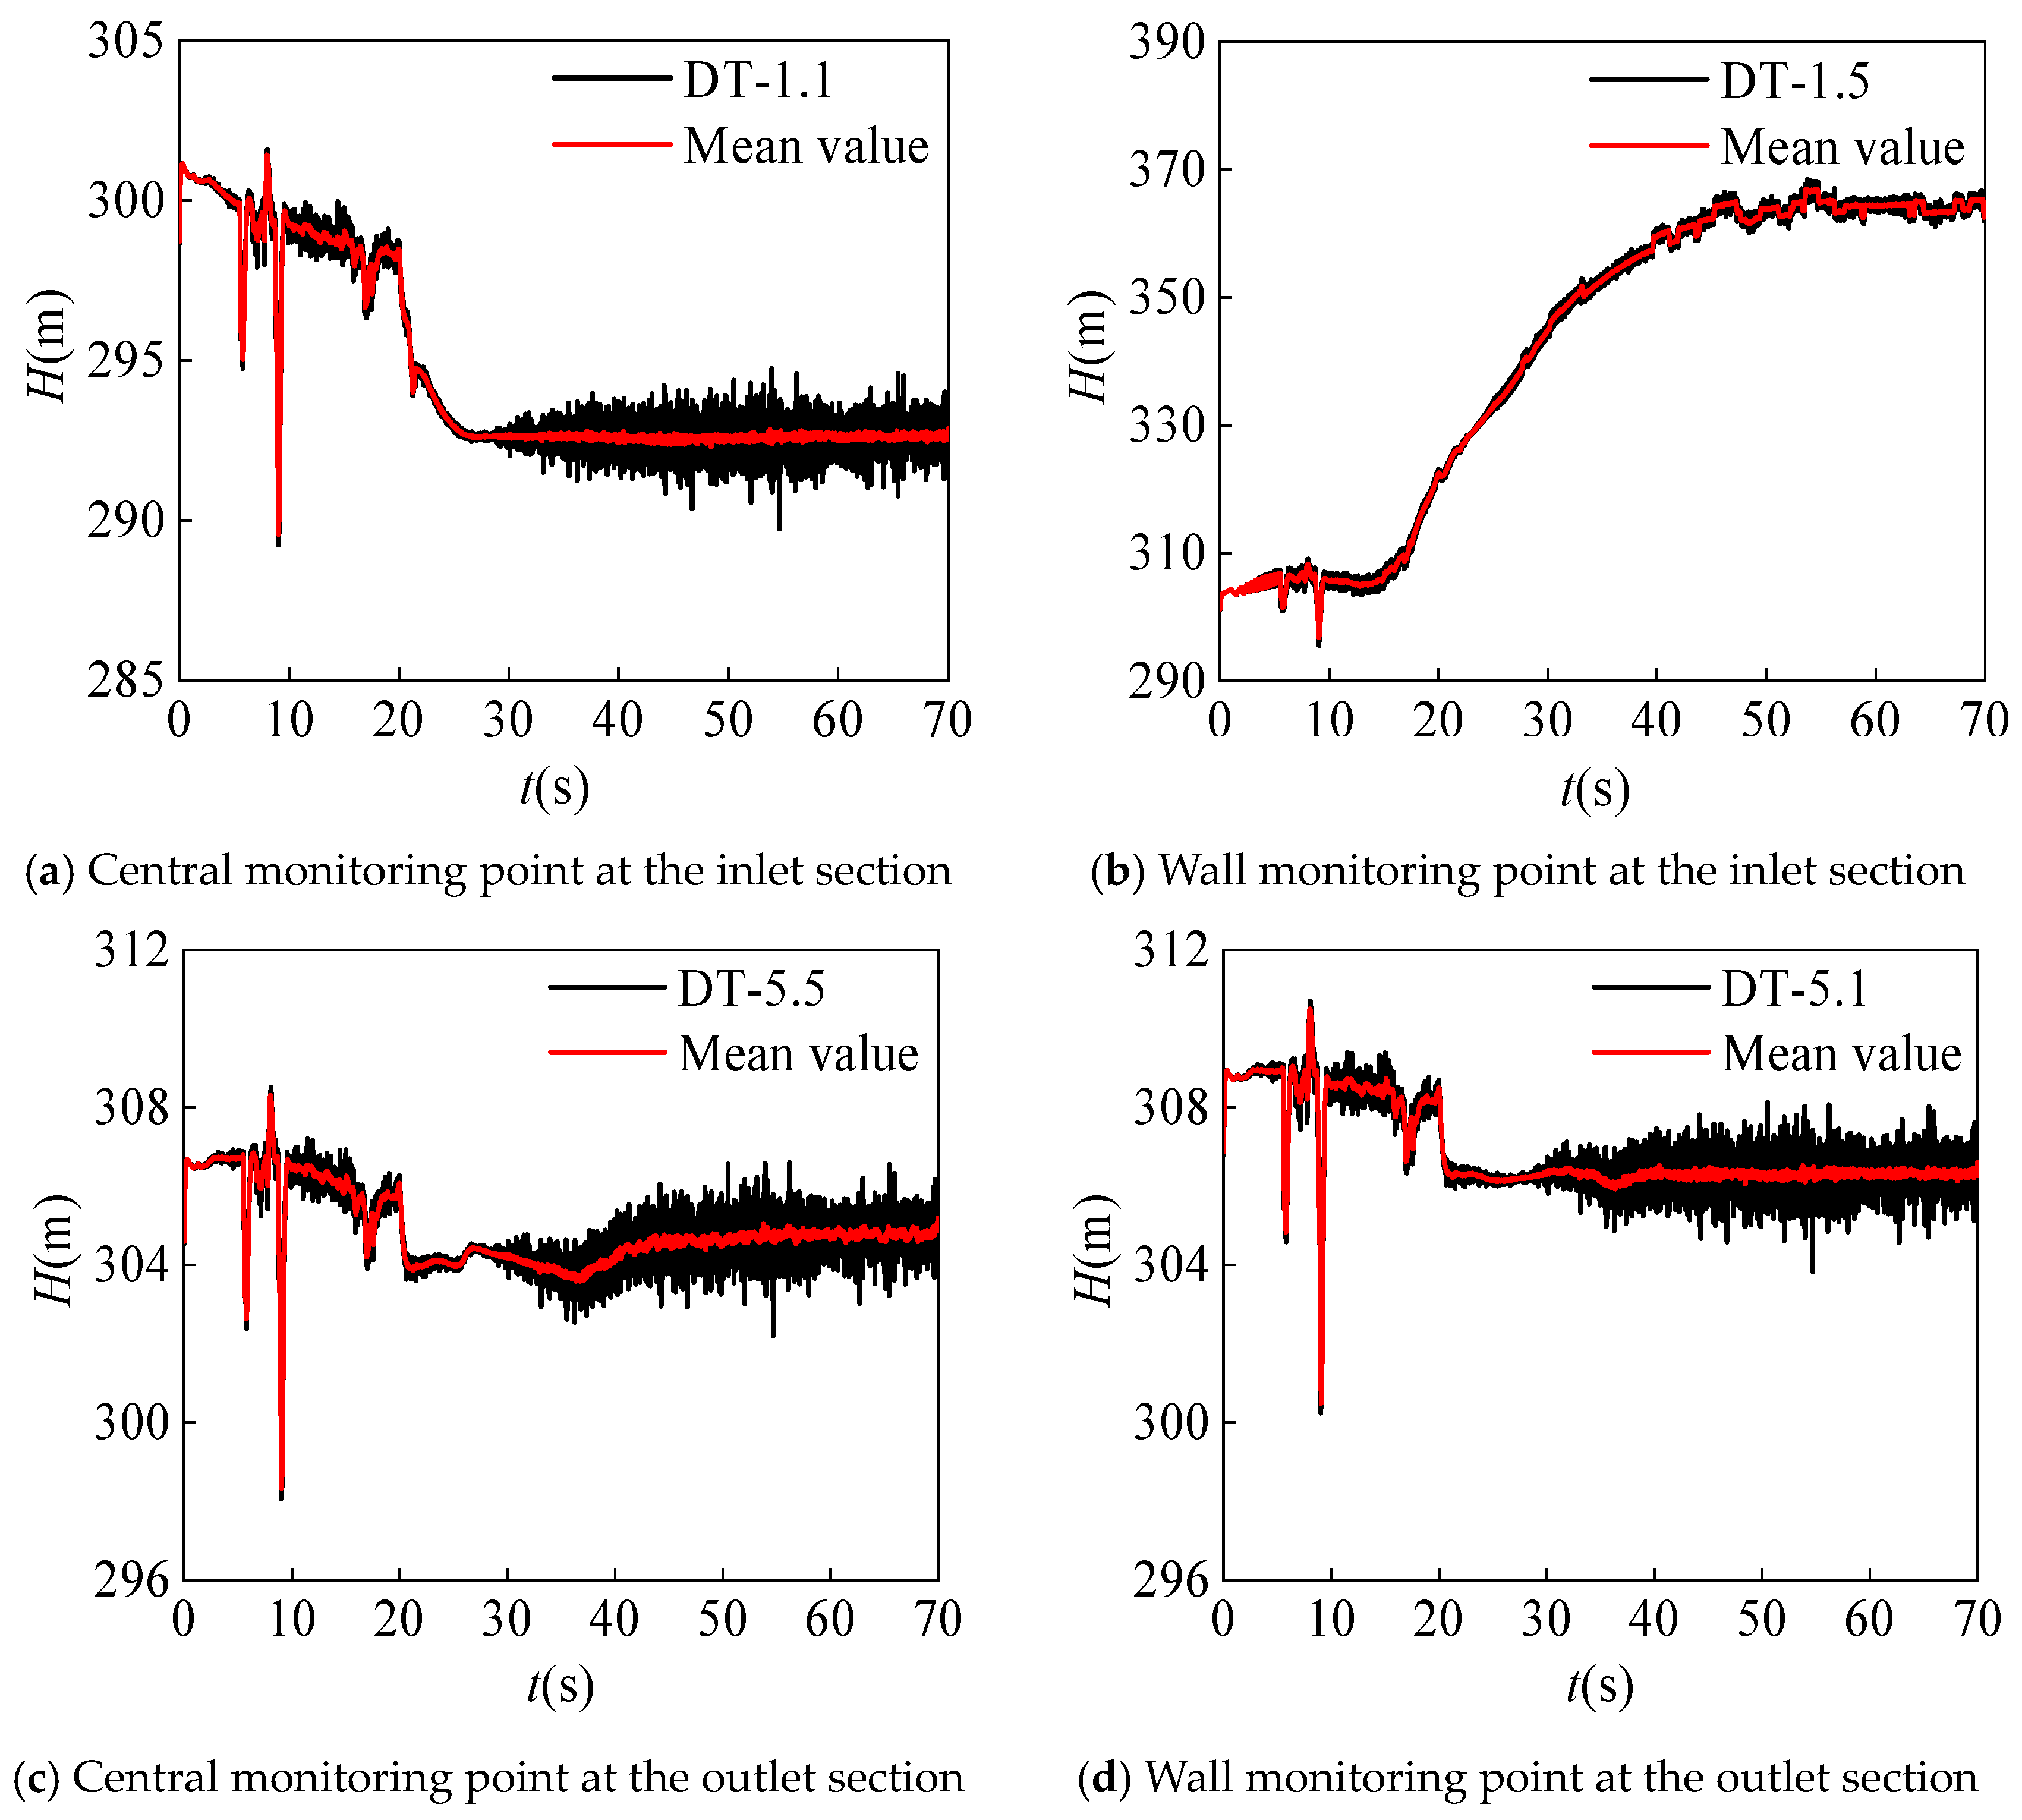
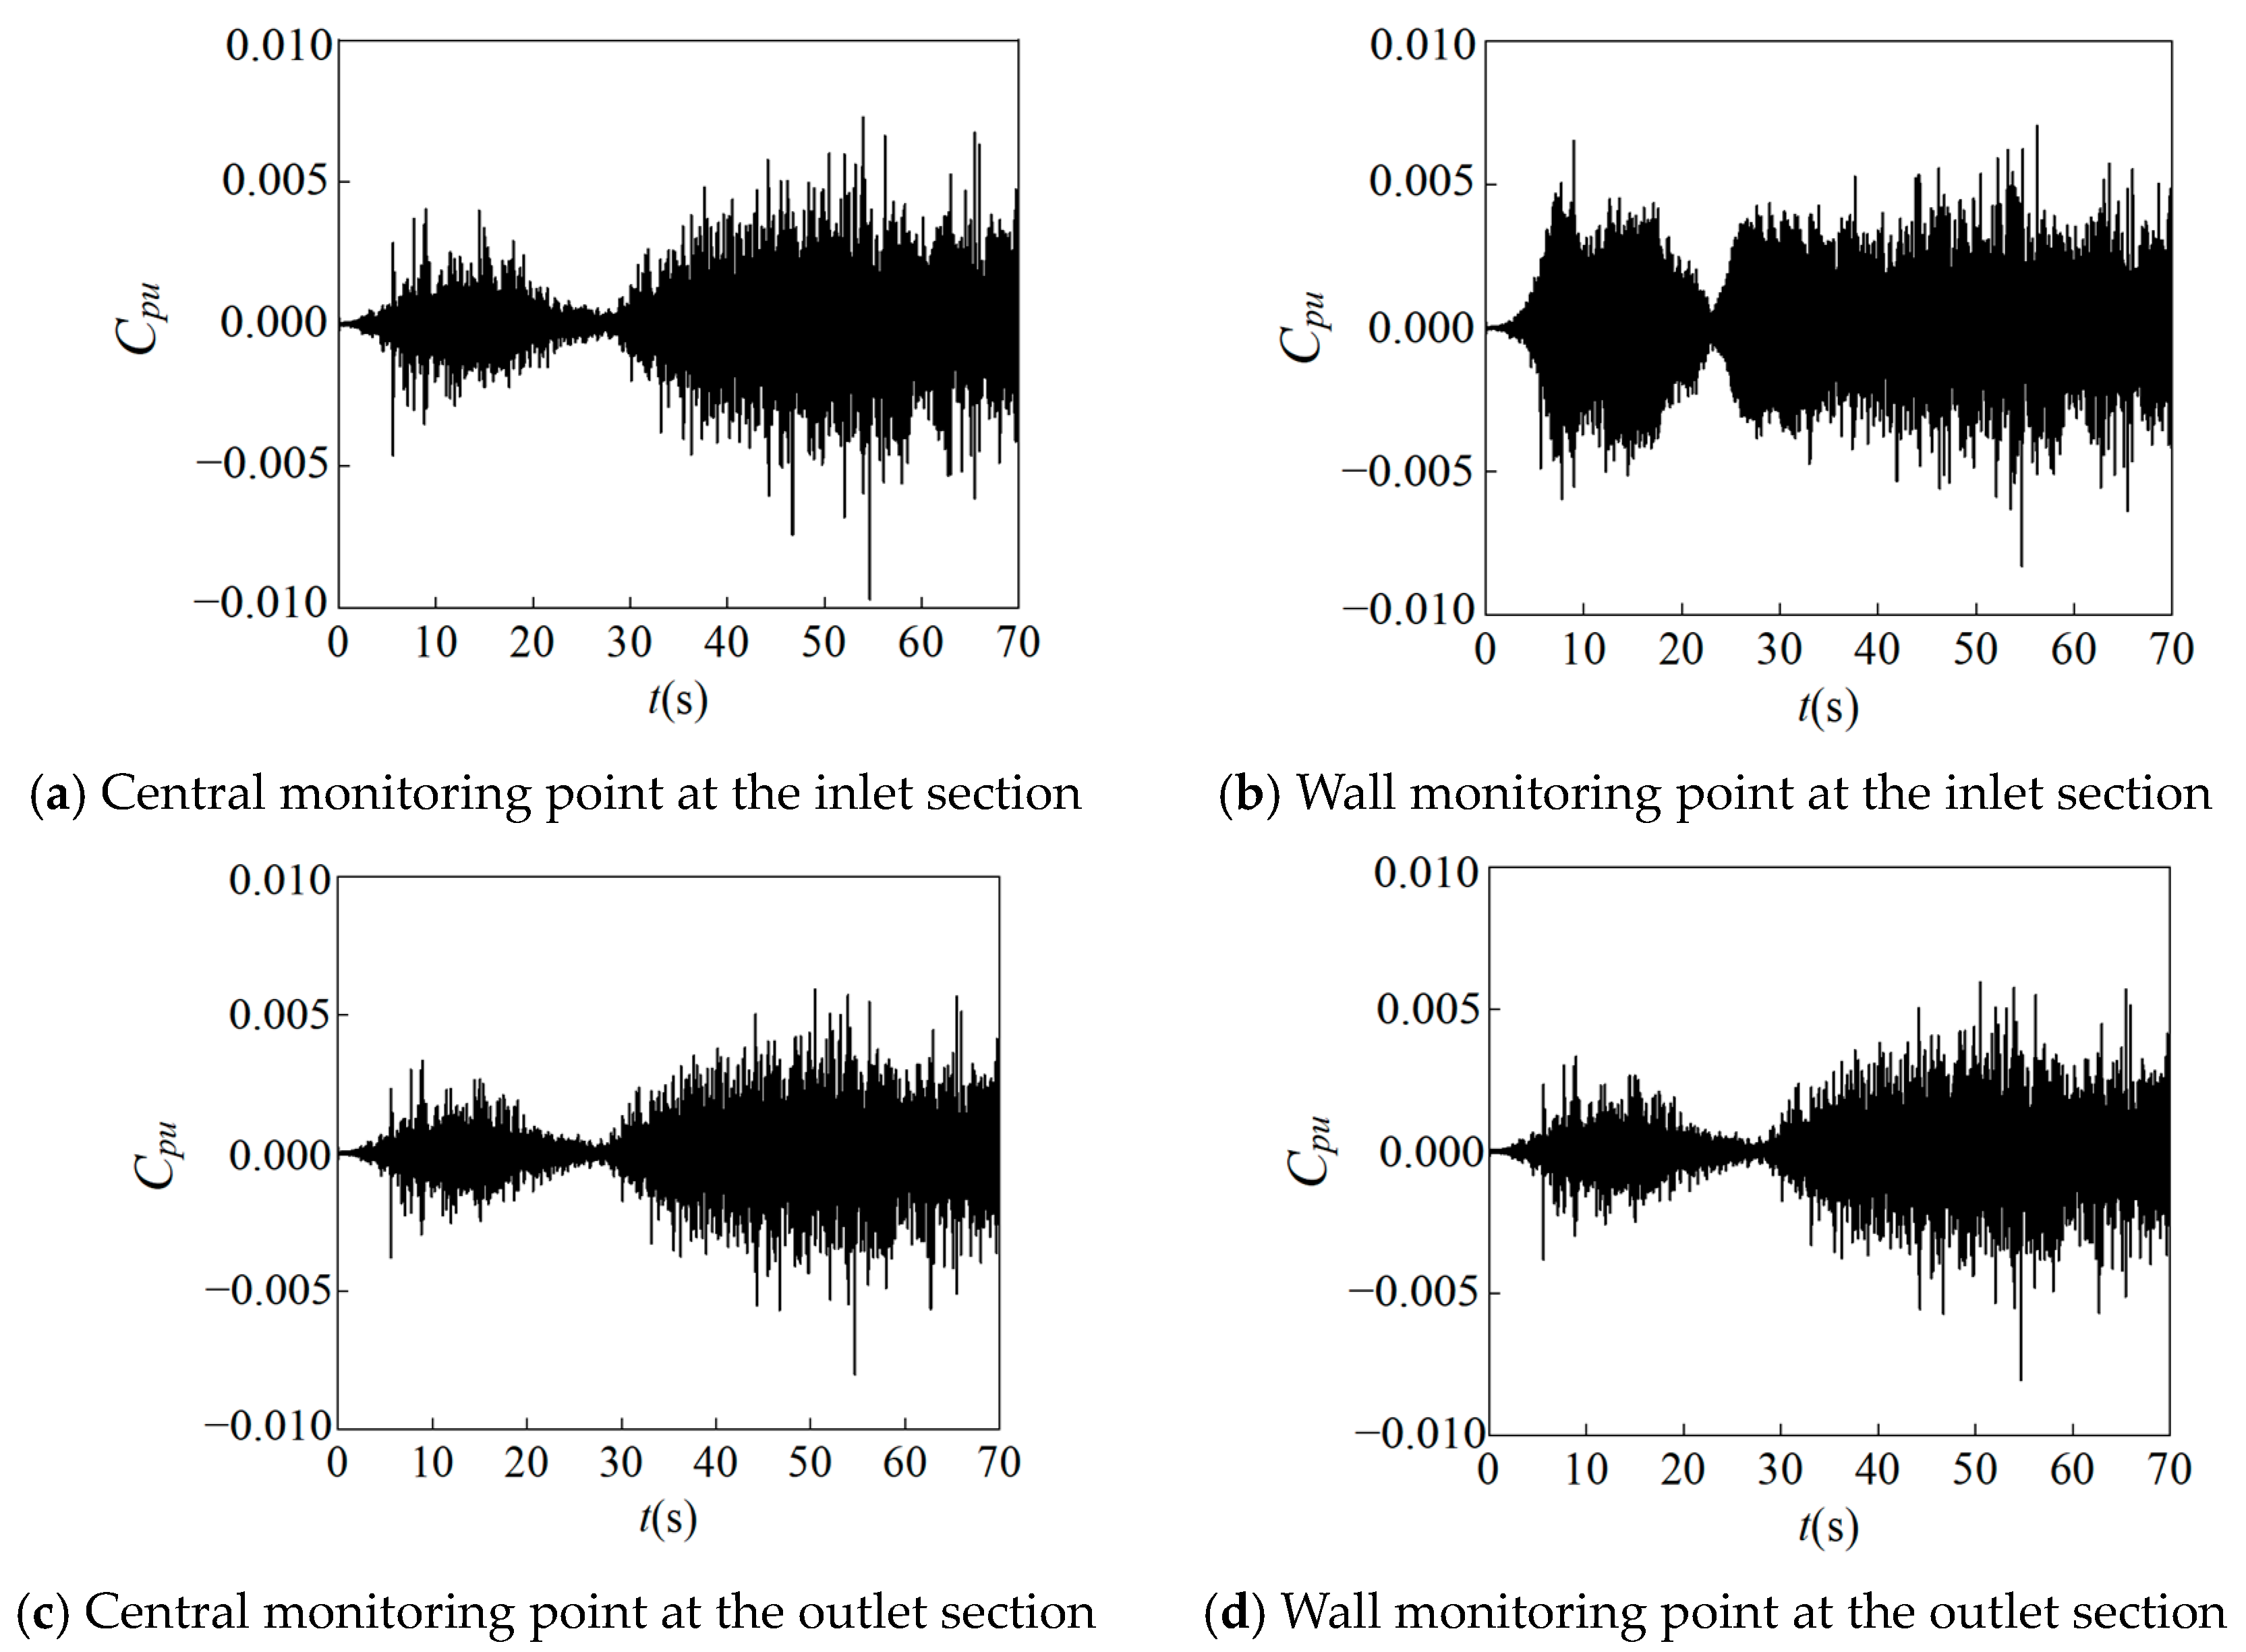
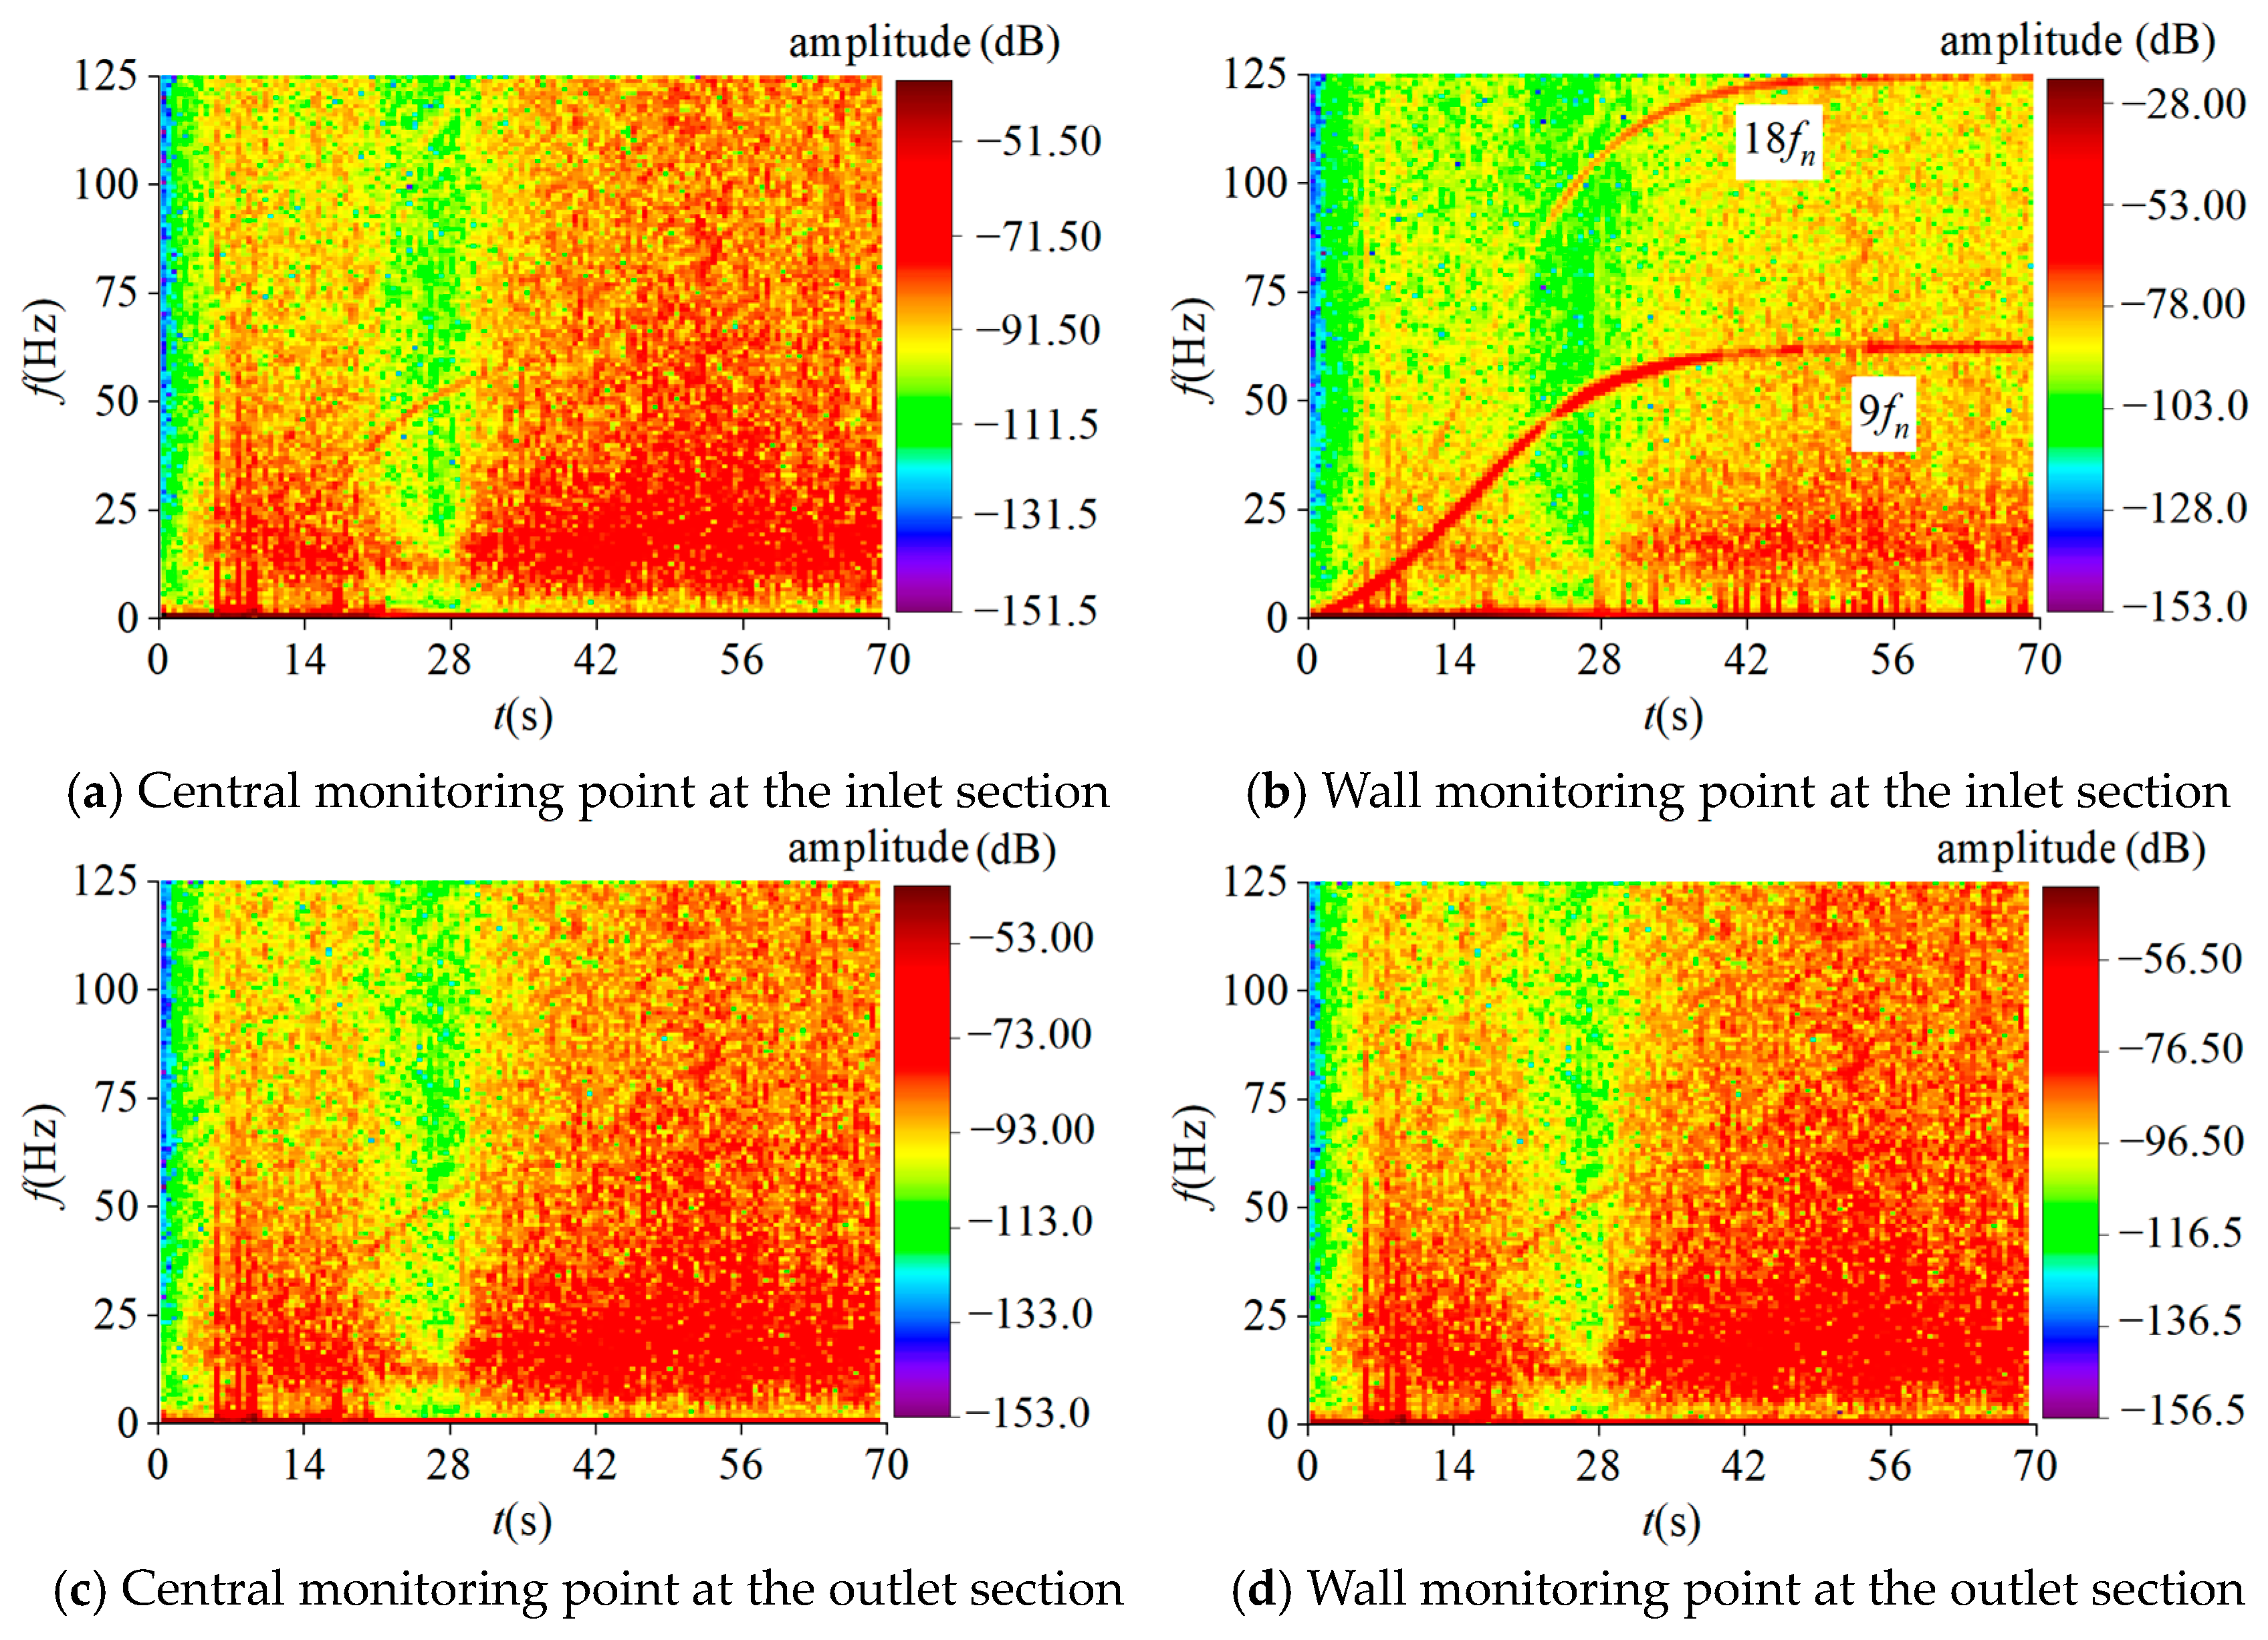
3.3.2. Pressure Pulsation Characteristics in the Draft Tube Region

Figure 14 displays the pressure fluctuations at monitoring points in different sections of the draft tube region. As shown in the figure, in the same section, the pressure at monitoring points near the wall is higher than the pressure at the central monitoring point of the section. Before the pump-turbine start-up process for the initial 15 s, the pressure fluctuations at different monitoring points in the same section show minor differences. After 15 s, the pressure at monitoring points near the draft tube wall rapidly increases and eventually stabilizes, while the pressure at the monitoring point near the center of the section rapidly decreases and eventually stabilizes after the guide vanes stop moving at 20 s.
As shown in Figure 15b, the closer the monitoring point is to the downstream section, the later the wall monitoring point starts to increase in pressure, and the smaller the amplitude of the increase. The monitoring point at the draft tube outlet maintains a relatively constant pressure, primarily because it is less influenced by the increase in runner speed. From Figure 14e, it can be observed that the pressure fluctuations at various monitoring points on the draft tube outlet section exhibit the same trend, with an increase in pressure only due to the increased depth of the monitoring point. Comparing Figure 15a,b, it can be observed that the closer the section is to the downstream, the higher the pressure at the central monitoring point, while the near-wall monitoring points exhibit the opposite behavior, with lower pressure at the downstream monitoring points compared to the upstream.
Figure 16 and Figure 17 display the pressure fluctuations and dimensionless pressure pulsations at the inlet and outlet sections of the draft tube region. It can be observed that the dimensionless pressure pulsation amplitudes at the four monitoring points are mainly distributed between −0.005 and 0.005. Within the first 30 s, the wall monitoring point DT–1.5 exhibits larger pressure pulsation amplitudes compared to the central monitoring point DT–1.1. After 50 s, when the runner speed stabilizes, the range of maximum dimensionless pressure pulsation amplitudes at the central monitoring point DT–1.1 is slightly larger than that at the wall monitoring point DT–1.5. Due to their proximity to the downstream, the pressure pulsation characteristics at the two monitoring points on the outlet section show minimal differences.
Figure 18 displays the power spectrum diagrams at the monitoring points in the inlet and outlet sections of the draft tube region. In the power spectrum diagram of the central monitoring point DT–1.1 at the inlet section, there are numerous low-frequency signals with high amplitudes. In the power spectrum diagram of the wall monitoring point DT–1.5 at the inlet section, the pressure signals mainly consist of the 9fn and 18fn pressure signals propagating from the draft tube cone to the downstream, along with a small portion of low-frequency signals. As the monitoring point at the outlet section is located closer to the downstream, its power spectrum diagram is similar to that of the central monitoring point at the inlet section, with a significant presence of low-frequency signals. These widely present low-frequency pressure signals are associated with the vortices in the draft tube section.

3.4. Analysis of Internal Flow Characteristics

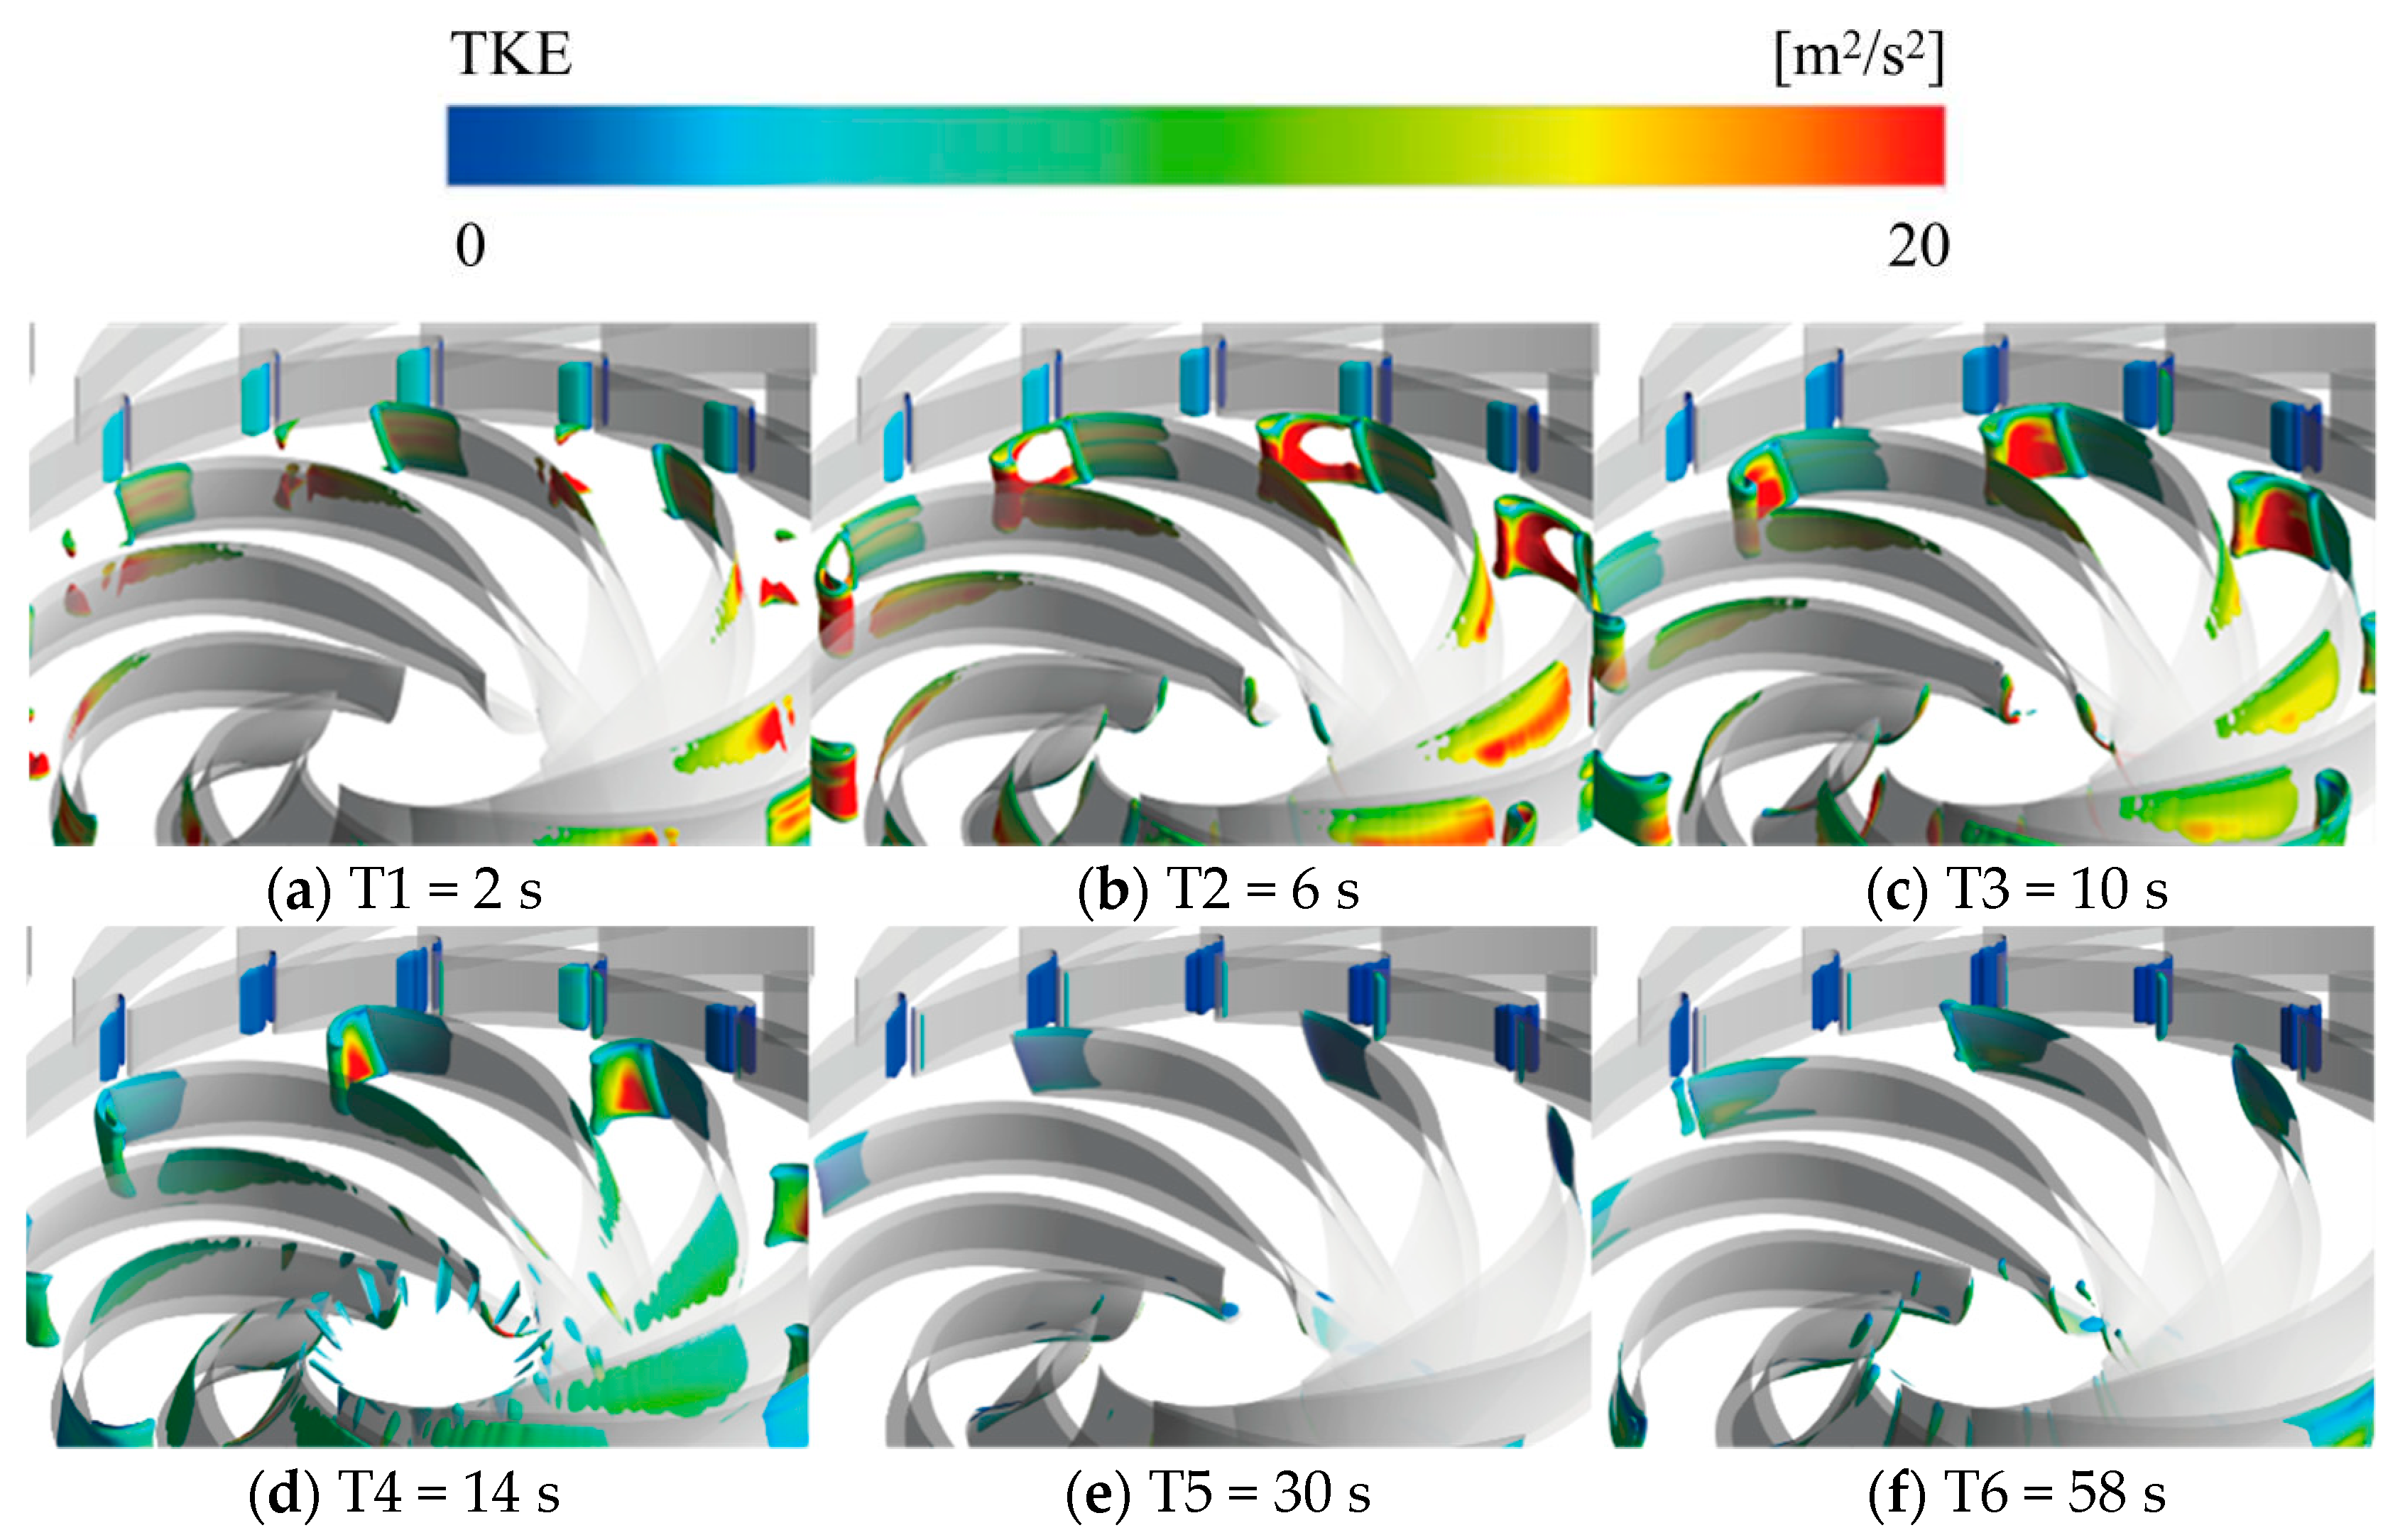
3.4.1. Analysis of Guide Vane and Runner Flow Characteristics

During the start-up process of a pump-turbine, the guide vanes open and the runner speed undergoes significant changes, resulting in complex flow conditions in the region of the guide vanes and the runner. Figure 19 depicts the energy loss, pressure distribution, velocity distribution, and relative velocity distribution in the region of the guide vanes and the runner. The relative velocity refers to the velocity of the water relative to the runner.
At time T1, which corresponds to the initial stage of the pump-turbine start-up, the opening angle of the guide vanes is small. The water flows from the draft tube cone towards the leading edge of the blade on the pressure side, creating a high-pressure zone at the leading edge of the blade. After contacting the blade, some of the water flows towards the adjacent flow passage along the leading edge of the blade. From Figure 19d, the absolute velocity distribution diagram, it can be observed that there is a high-velocity region corresponding to the blade’s leading edge in the draft tube cone. Another portion of the water flows downstream along the blade, while being tangential to the reverse flow from the suction side of the blade, forming large-scale vortices within the flow passage and creating a low-pressure zone. The entropy production rate caused by turbulence dissipation (EPTD) primarily occurs on the pressure side of the blade and the back surface of the guide vanes. During time intervals T2 to T4, the opening angle of the guide vanes gradually increases, leading to an increase in runner speed and internal water flow velocity. The water impinges on the blade’s leading edge from the draft tube cone, causing the high-pressure zone on the runner’s pressure side to extend into the flow passage. The pressure difference between the blade’s pressure side and suction side increases, resulting in an increase in the runner torque. As the runner speed increases, the water flow from the draft tube to the runner also increases. A high-velocity region forms on the blade’s suction side, where the water flow changes direction after reaching the leading edge of the blade and flows along the pressure side of the adjacent blade towards the downstream. The region of high entropy production within the runner gradually moves downstream. At times T5 and T6, the internal flow within the runner becomes relatively stable, with a uniform pressure distribution and reduced pressure difference across the runner blades. There are no significant vortices, and the energy loss is minimized. At the same time, the water flow velocity rapidly increases. This is because the pump-turbine is in the stage of decreasing torque, resulting in reduced work done by the water on the runner. As a result, the increase in runner speed slows down, allowing the water to acquire a higher flow velocity, thereby improving the water ring phenomenon in the draft tube cone.
Figure 20 shows the distribution of vortex structures in the region of the runner and guide vanes, identified using the Q-criterion with an iso-surface of vorticity at 30,000 s−1. During the start-up process of the pump-turbine, the vortex structures are mainly concentrated in the region of the guide vanes and the runner. In the initial stage of the pump turbine start-up, when the opening angle of the guide vanes is small, the water flows from the low-speed region of the guide vanes into the draft tube cone, creating a large velocity gradient and being accelerated by the high-speed circulating flow in the draft tube cone. Vortex structures form on the surface in the leading edge region of the guide vanes, and a flow analysis region forms at the rear of the guide vanes. As the opening angle of the guide vanes increases, the turbulence intensity of the vortex structures in the guide vane region decreases.
At the runner inlet, the water flow from the draft tube cone flows towards the pressure side of the runner blades, driving the acceleration of the runner. Some of the water flows from the leading edge of the blades towards the adjacent blades, resulting in flow separation and the formation of vortex structures at the leading edge position. At the same time, water flows from the draft tube cone into the inter-blade region, creating unstable flow with higher turbulence intensity. At the runner outlet, vortex structures are formed due to flow separation at the trailing edge of the blades.
At times T2 and T3, the vortex structures at the runner inlet are widely distributed and have higher turbulence intensity, coinciding with the period of intense fluctuations in the hydraulic head. At time T4, the area and intensity of the vortex structures at the runner inlet begin to decrease, and the distribution of pressure-side vortex structures starts to shift toward the runner outlet. At times T5 and T6, the guide vanes stop moving, and the runner operation tends to stabilize, with vortex structures concentrated at the leading and trailing edges of the blades.
By combining Figure 19 and Figure 20, it can be observed that during the open-loop stage, the main cause of hydraulic head fluctuations in the turbine section is the presence of vortex blockages in the runner inlet and within the runner blades. These vortices reduce the flow rate, leading to a positive water hammer, resulting in a rapid increase in upstream pressure and a rapid decrease in downstream pressure. Once the vortex structures reduce due to the decrease in high-pressure water hammer, the flow passage becomes unobstructed, and the flow rate rapidly increases, causing a small amplitude of negative water hammer and low pressure.

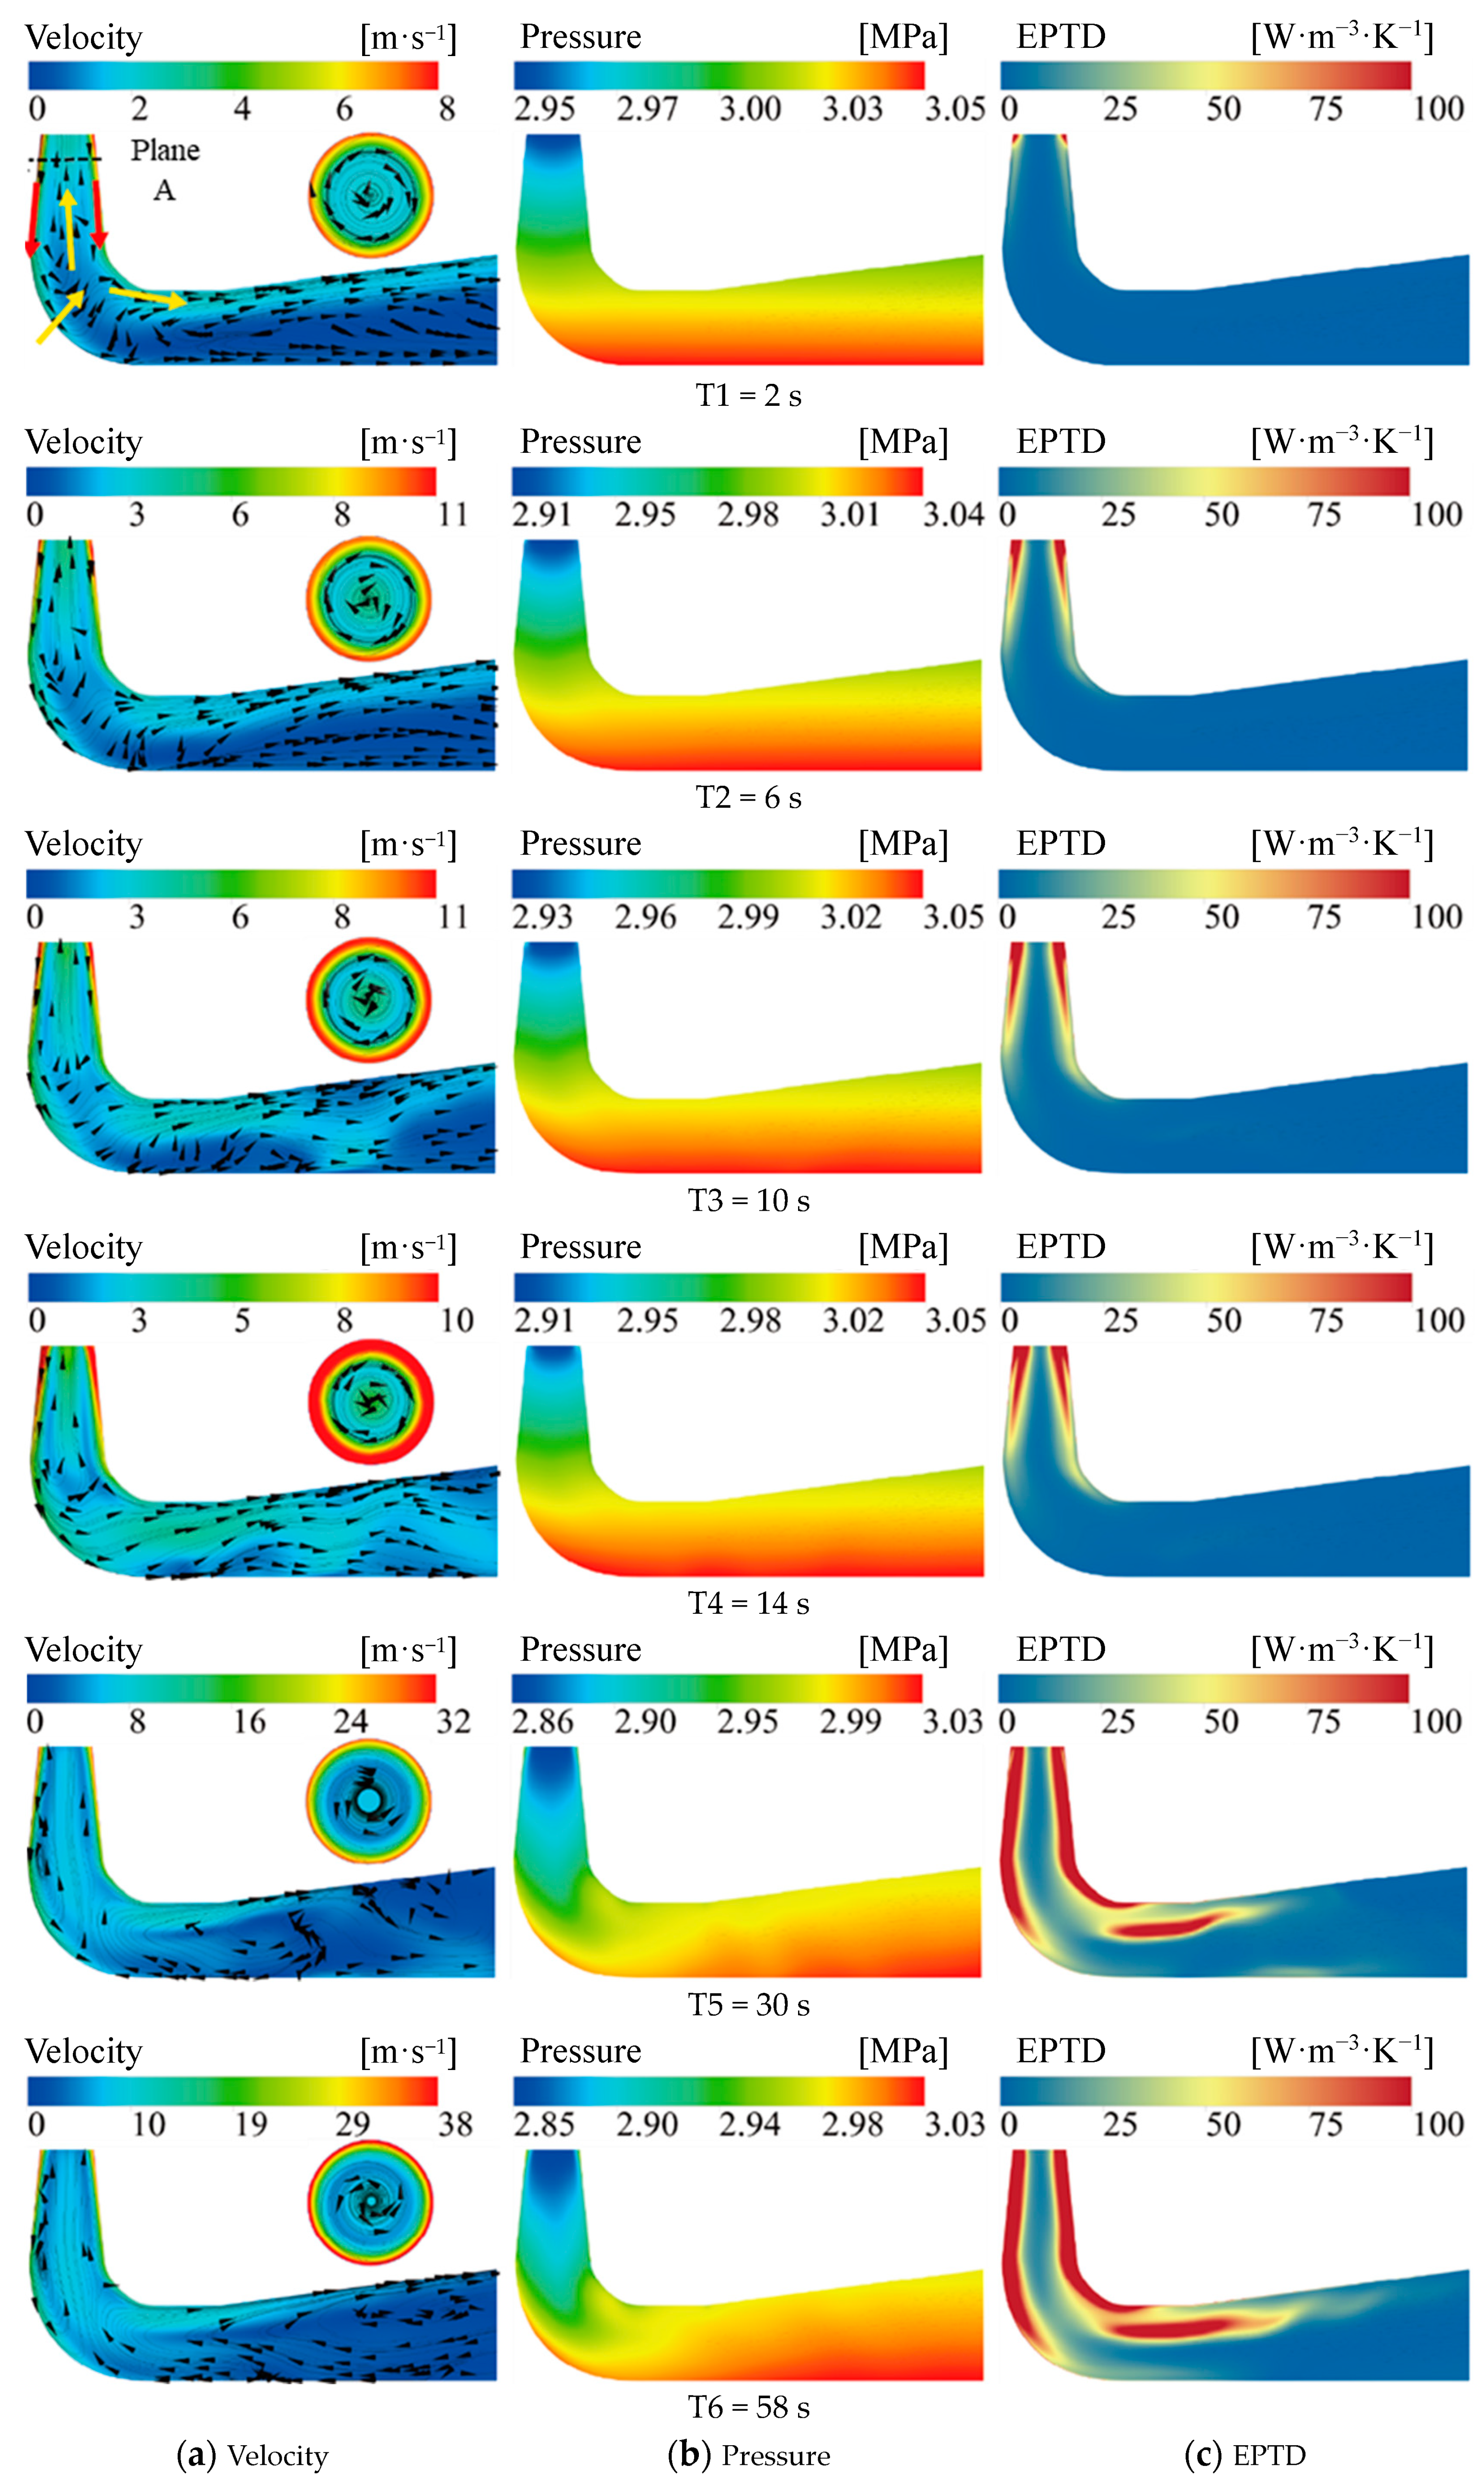
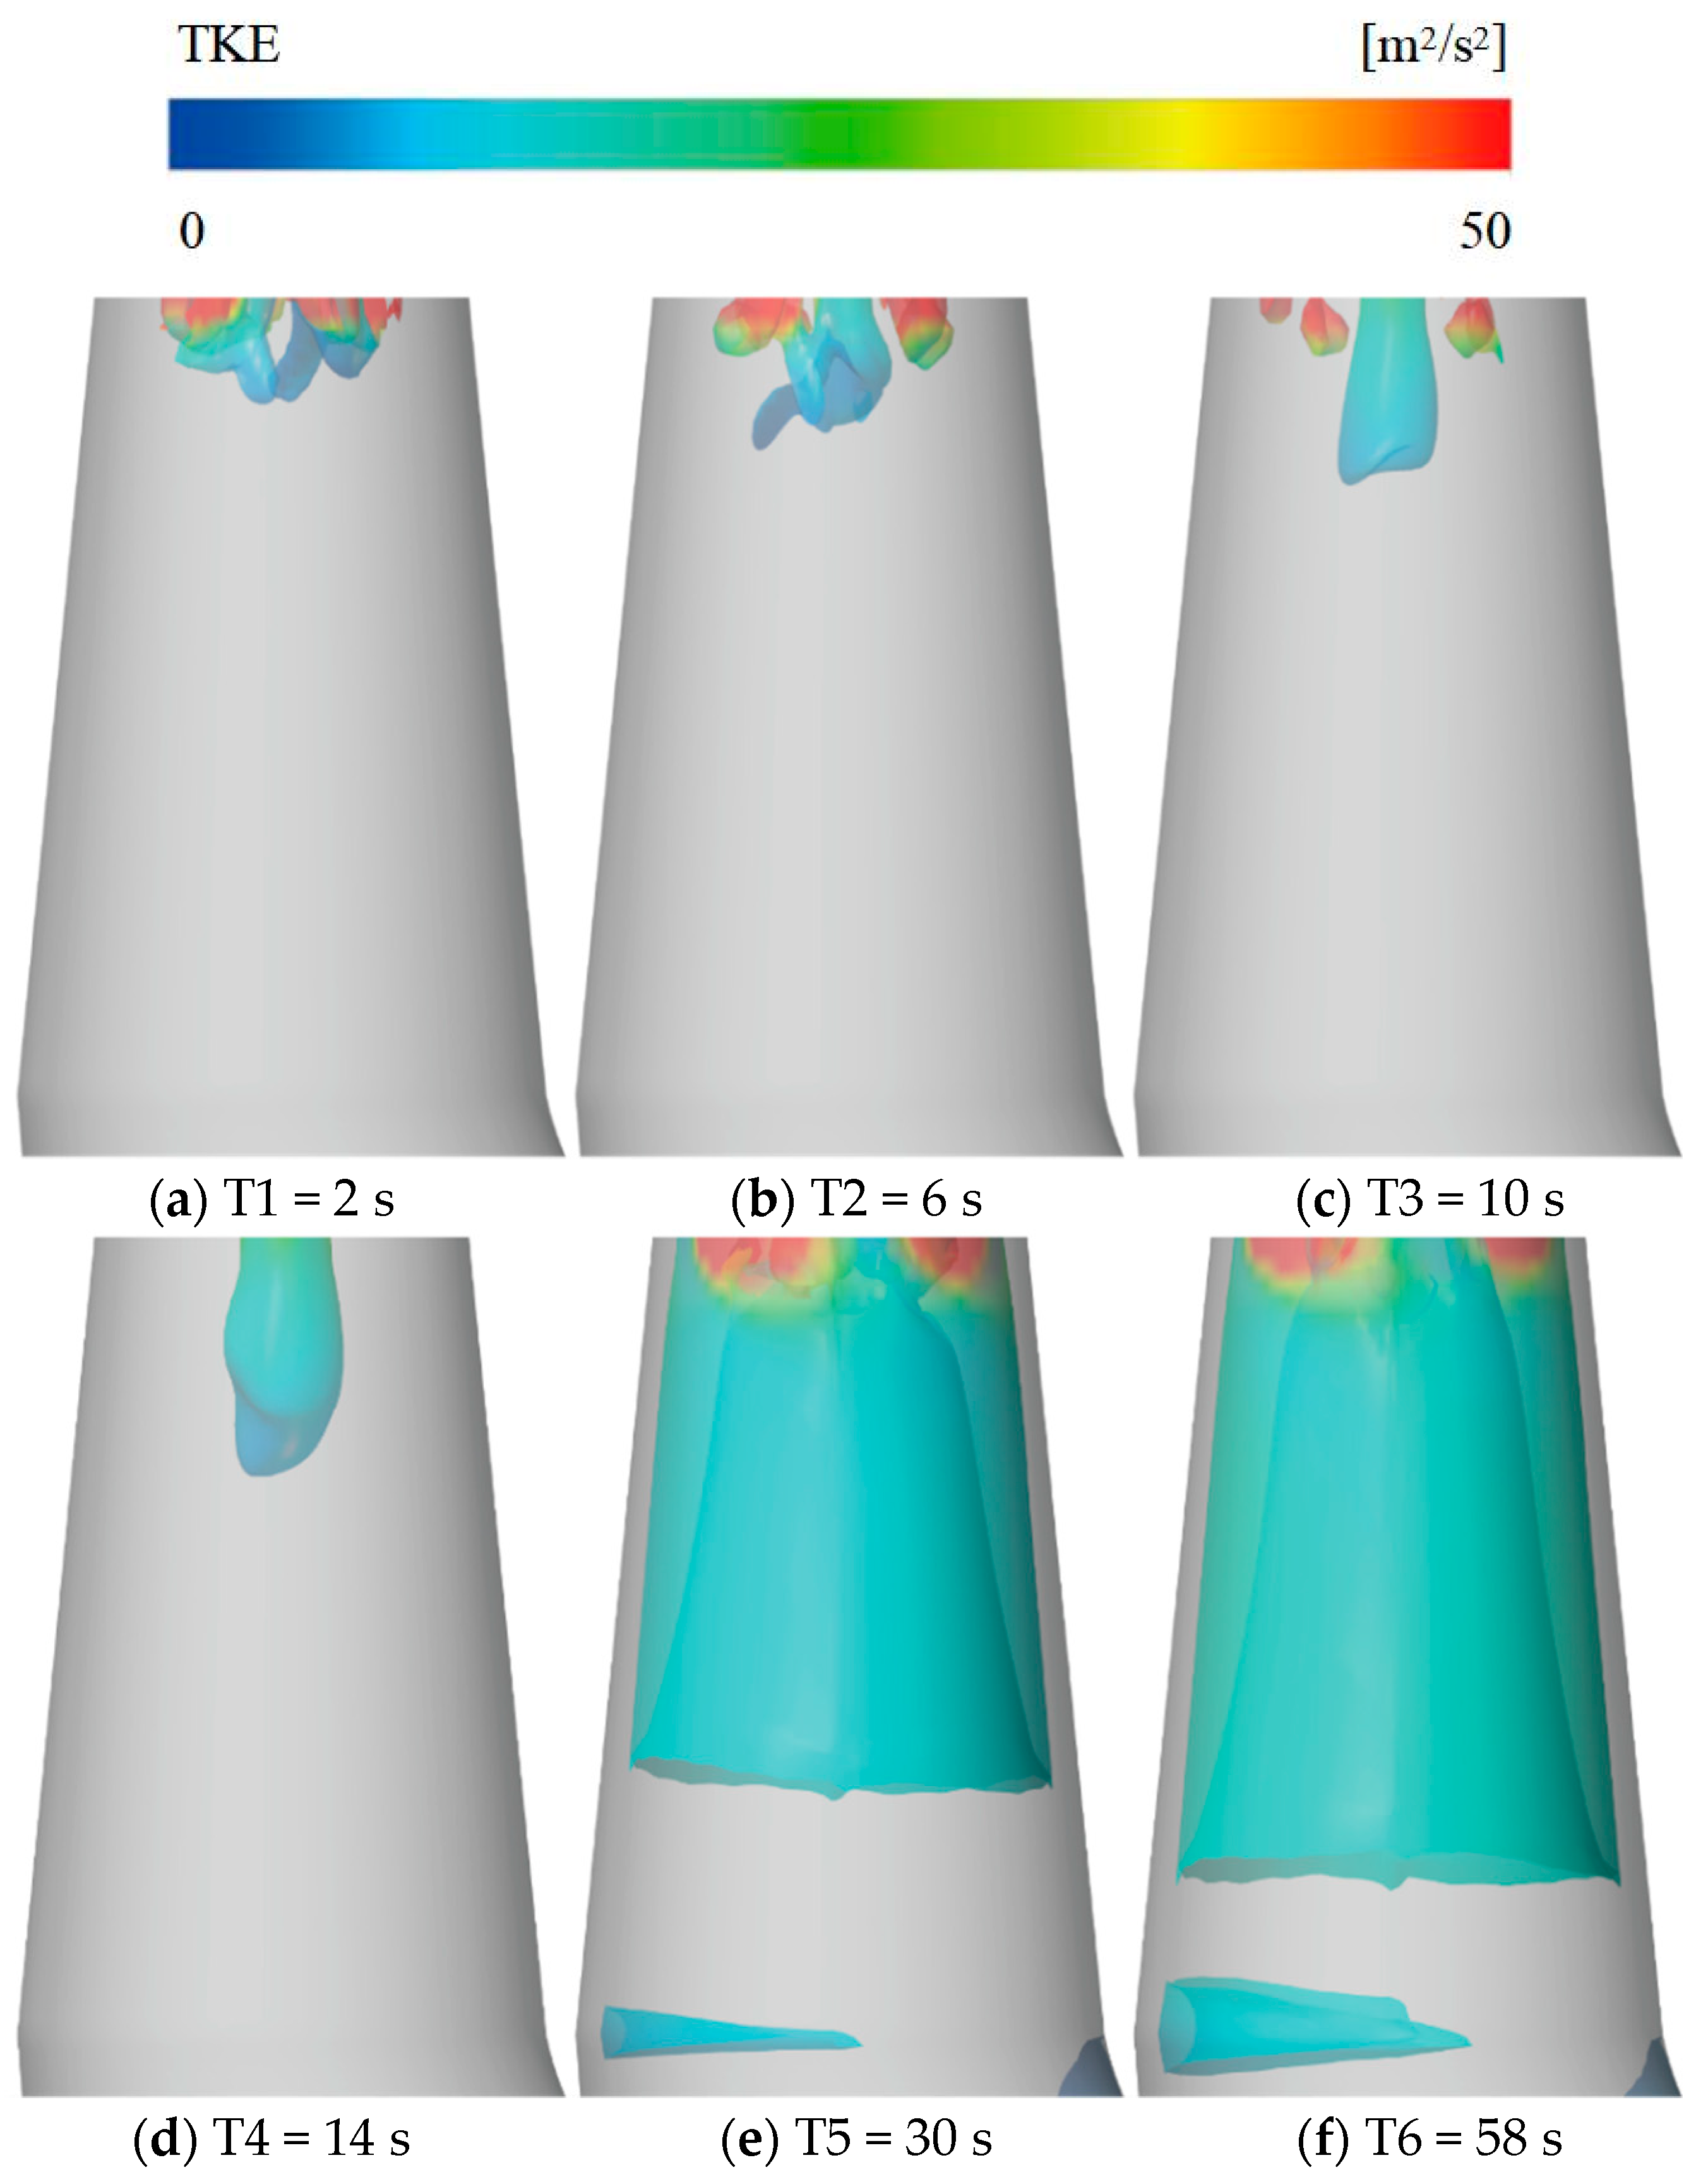
3.4.2. Analysis of Flow Characteristics in the Draft Tube

Figure 21 shows the flow distribution and entropy production loss in the draft tube. To analyze the energy loss and flow variations in the draft tube, plane A was selected at a distance of 0.5D (D = 2.31 m) from the inlet of the draft tube. At time T1, the water flow from the runner outlet follows the wall of the draft tube, as indicated by the red arrows in Figure 21a. Due to the increasing pressure along the depth of the draft tube, the flow of water transitions from the outer side to the inner side in the bend section of the draft tube. A portion of the water flow generates a return flow along the centerline in the bend section, while another portion flows downstream, as indicated by the yellow arrows in Figure 21a. From plane A, it can be observed that the water flow moves in a clockwise direction, and the entropy production loss is mainly concentrated near the wall of the draft tube inlet.
At times T2 to T4, as the rotational speed of the runner increases, the water flow from the runner outlet to the draft tube intensifies. The outflow along the wall of the tapered section and the return flow along the centerline of the draft tube become tangential, forming large-scale vortices. The high entropy production rate region extends downstream along the wall of the tapered section. Observing plane A, the flow direction gradually stratifies, with clockwise flow in the inner layer and counterclockwise flow in the outer layer. The main reason for this phenomenon is the increase in runner speed, which alters the absolute velocity direction of the water flow that originally flowed clockwise along the direction of the runner blade outlet at high rotational speeds.
At times T5 and T6, the runner speed reaches its maximum value. The low-pressure region at the inlet of the draft tube expands downstream, and backflow appears at the outlet of the draft tube. Large-scale vortices form in both the tapered and diffusion sections of the draft tube. On plane A, the flow direction changes from clockwise to counterclockwise, opposite to the initial start-up stage. Due to the significant velocity difference between the near-wall flow and the center flow, the entropy production loss is mainly concentrated near the wall in the tapered and bend sections of the draft tube.
The evolution of vortex structures in the draft tube during the start-up process of the pump-turbine is shown in Figure 22. The identification method used is the Q-criterion, with an iso-surface of vorticity at 100 s−1 to display the vortex structures.
At times T1 to T4, the rotational speed of the runner increases rapidly, but the flow velocity in the draft tube does not increase significantly. This is mainly due to the work performed by the flow on the runner, which increases the rotational speed of the runner. As the flow exits the runner outlet, its velocity is relatively low. However, the increased rotational speed of the runner enhances the reverse pumping capability of the suction side of the blades. The flow along the centerline of the draft tube, moving towards the runner, experiences an increase in velocity and flow rate. It intersects with the flow along the wall, gradually forming vortex structures, which extend downstream as the guide vanes open. At times T5 and T6, the guide vanes stop moving, and the rotational speed of the runner increases slowly. The work done by the flow on the runner decreases. The water flow exiting the runner outlet experiences a significant increase in axial and tangential velocities. The flow adheres closely to the wall of the draft tube’s tapered section, flowing downstream. A double-layered vortex structure forms near the wall and on the inner side of the flow.

4. Conclusions

The hydraulic instability during the low-head start-up and grid connection process of a pump-turbine unit is a common challenge in many pumped storage power plants. In this study, a three-dimensional model of the entire flow system of a pump-turbine unit was established, and numerical simulations were conducted to investigate the “S” characteristics and low-head start-up process of the pump-turbine unit. The main findings are as follows:
(1)
During the low-head start-up process of the pump-turbine unit, in the phase of guide vane opening, flow vortical structures emerged, blocking flow passages specifically at the runner inlet, within the runner inter-blade channels, and at the draft tube inlet. This led to a decrease in flow rate and the generation of the water hammer effect, causing a rapid increase in pressure upstream of the runner. After the reduction of high-pressure due to the water hammer, the flow rate rapidly increased, causing a small negative water hammer and resulting in significant fluctuations in the head of the unit.
(2)
After the guide vanes stopped moving, the intensity of vortex structures at the runner inlet and outlet decreased. As the torque of the runner continued to decrease, the unit entered the S-shaped region and approached the no-load condition, leading to an enhancement of pressure pulsation. In addition, unstable vortex structures reappeared at the leading and trailing edges of the runner blades.
(3)
During the start-up process of the pump-turbine unit, unstable vortex structures formed in the draft tube region, at the intersection of the inflow along the wall of the tapered section and the backflow along the centerline of the draft tube. At the stage of increasing runner torque, as the flow worked on the runner, the rotational speed of the runner increased while the inflow velocity in the draft tube remained constant. The increased work on the suction side of the runner led to the extension of vortex structures from the center position of the tapered section downstream. At the stage of decreasing runner torque, the inflow velocity in the draft tube increased, and the vortex structures in the draft tube evolved into a double-layered structure near the center and near the wall, respectively. This vortex structure is also the source of low-frequency pressure pulsation in the draft tube and the instability of the unit under no-load conditions.
This study mainly investigated the pressure pulsation and flow characteristics inside the guide vanes, runner, and draft tube of the pump-turbine unit. However, the flow characteristics inside the spiral case also have a significant impact on the stability of the unit operation. Therefore, the analysis of pressure pulsation and flow characteristics in the entire flow system of the pump-turbine unit is a promising direction for future research.

Author Contributions

Conceptualization, K.K.; methodology, K.K.; software, H.Y.; validation, T.W.; formal analysis, T.W. and H.Y.; investigation, T.W., C.Y. and H.Y.; resources, Y.Z. (Yilin Zhao) and Y.Z. (Yibo Zhou); data curation, Y.Z. (Yilin Zhao) and Y.Z. (Yibo Zhou); writing—original draft preparation, H.Y.; writing—review and editing, T.W., C.Y., Y.Z. (Yilin Zhao), H.L., D.Z. and K.K.; visualization, H.Y.; supervision, D.Z. and K.K.; project administration, D.Z. and K.K.; funding acquisition, D.Z. and K.K. All authors have read and agreed to the published version of the manuscript.

Funding

This work was supported by the Science and Technology Project of State Grid Co., Ltd. (Grant No. SGXYKJ-2023-050).

Data Availability Statement

The datasets presented in this article are not readily available because the data are part of an ongoing study and due to some CFD technical limitations. Requests to access the datasets should be directed to contact the corresponding author.

Conflicts of Interest

Authors Tingzheng Wang, Chuqiao Yu, Yilin Zhao, Yibo Zhou were employed by the company State Grid Xinyuan Co., Ltd. The remaining authors declare that the research was conducted in the absence of any commercial or financial relationships that could be construed as a potential conflict of interest. The State Grid Xinyuan Co., Ltd. had no role in the design of the study; in the collection, analyses, or interpretation of data; in the writing of the manuscript, or in the decision to publish the results.

References

  1. Hoffstaedt, J.; Truijen, D.; Fahlbeck, J.; Gans, L.; Qudaih, M.; Laguna, A.; De Kooning, J.; Stockman, K.; Nilsson, H.; Storli, P.T.; et al. Low-head pumped hydro storage: A review of applicable technologies for design, grid integration, control and modelling. Renew. Sustain. Energy Rev. 2022, 158, 112119. [Google Scholar] [CrossRef]
  2. Guo, W.; Wu, F. Hydraulic-mechanical coupling vibration performance of pump-storage power station with two turbine units sharing one tunnel. J. Energy Storage 2022, 53, 105082. [Google Scholar] [CrossRef]
  3. Xia, L.; Cheng, Y.; Yang, J.; Cai, F. Evolution of flow structures and pressure fluctuations in the S-shaped region of a pumpturbine. J. Hydraul. Res. 2018, 60, 836–851. [Google Scholar]
  4. Li, D.; Fu, X.; Zuo, Z.; Wang, H.; Li, Z.; Liu, S.; Wei, X. Investigation methods for analysis of transient phenomena concerning design and operation of hydraulic-machine systems—A review. Renew. Sustain. Energy Rev. 2019, 101, 26–46. [Google Scholar] [CrossRef]
  5. Zuo, Z.; Fan, H.; Liu, S.; Wu, Y. S-shaped characteristics on the performance curves of pump-turbines in turbine mode—A review. Renew. Sustain. Energy Rev. 2016, 60, 836–851. [Google Scholar] [CrossRef]
  6. Pejovic, S.; Krsmanovic, L.J.; Jemcov, R.; Crnkovic, P. Unstable Operation of High-Head Reversible Pump-Turbines. In Proceedings of the IAHR 8th Symposium, Section for Hydraulic Machinery Equipment and Cavitation, St. Petersburg, Russia, 6–9 September 1976; pp. 283–295. [Google Scholar]
  7. Hasmatuchi, V.; Farhat, M.; Roth, S.; Botero, F.; Avellan, F. Experimental Evidence of Rotating Stall in a Pump-Turbine at Off-Design Conditions in Generating Mode. J. Fluids Eng. 2011, 133, 5. [Google Scholar] [CrossRef]
  8. Weber, W.; Kahler, J.; Magnoli, M.; Koutnik, J. Transient approach for identification of the S-shape region of pump-turbines. In IOP Conference Series: Earth and Environmental Science; IOP Publishing: Bristol, UK, 2019; Volume 240, p. 072037. [Google Scholar]
  9. Zeng, W.; Yang, J.; Hu, J. Pumped storage system model and experimental investigations on s-induced issues during transients. Mech. Syst. Signal Process. 2017, 90, 350–364. [Google Scholar] [CrossRef]
  10. Wang, H.; Wang, J.; Gong, R.; Shang, C.; Li, D.; Wei, X. Investigations on Pressure Fluctuations in the S-Shaped Region of a Pump–Turbine. Energies 2021, 14, 6683. [Google Scholar] [CrossRef]
  11. Yang, Z.; Liu, Z.; Cheng, Y.; Zhang, X.; Liu, K.; Xia, L. Differences of Flow Patterns and Pressure Pulsations in Four Prototype Pump-Turbines during Runaway Transient Processes. Energies 2020, 13, 5269. [Google Scholar] [CrossRef]
  12. Zhang, X.; Cheng, Y.; Yang, Z.; Chen, Q.; Liu, D. Influence of rotational inertia on the runner radial forces of a model pump-turbine running away through the S-shaped characteristic region. IET Renew. Power Gener. 2020, 14, 1883–1893. [Google Scholar] [CrossRef]
  13. Zhang, W.; Chen, Z.; Zhu, B.; Zhang, F. Pressure fluctuation and flow instability in S-shaped region of a reversible pump-turbine. Renew. Energy 2020, 154, 826–840. [Google Scholar] [CrossRef]
  14. Rezghi, A.; Riasi, A. The interaction effect of hydraulic transient conditions of two parallel pump-turbine units in a pumped-storage power plant with considering “S-shaped” instability region: Numerical simulation. Renew. Energy 2018, 118, 896–908. [Google Scholar] [CrossRef]
  15. Ciocan, G.D.; Iliescu, M.S.; Vu, T.C.; Nennemann, B.; Avellan, F. Experimental study and numerical simulation of the FLINDT draft tube rotating vortex. J. Fluids Eng. 2007, 129, 146–158. [Google Scholar] [CrossRef]
  16. Lais, S.; Liang, Q.; Henggeler, U.; Weiss, T.; Escaler, X.; Egusquiza, E. Dynamic analysis of Francis runners-experiment and numerical simulation. Int. J. Fluid Mach. Syst. 2009, 2, 303–314. [Google Scholar] [CrossRef]
  17. Gagnon, M.; Tahan, S.A.; Bocher, P.; Thibault, D. Impact of startup scheme on Francis runner life expectancy. IOP Conf. Ser. Earth Environ. Sci. 2010, 12, 012107. [Google Scholar]
  18. Tanaka, H. Vibration Behavior and Dynamic Stress of Runners of Very High Head Reversible Pumpturbines. Int. J. Fluid Mach. Syst. 2011, 4, 289–306. [Google Scholar] [CrossRef]
  19. Trivedi, C.; Cervantes, M.; Gandhi, B.; Dahlhaug, O. Experimental investigations of transient pressure variations in a high head model Francis turbine during start-up and shutdown. J. Hydrodyn. Ser. B 2014, 26, 277–290. [Google Scholar]
  20. Kan, K.; Chen, H.; Zheng, Y.; Zhou, D.; Binama, M.; Dai, J. Transient characteristics during power-off process in a shaft extension tubular pump by using a suitable numerical model. Renew. Energy 2021, 164, 109–121. [Google Scholar] [CrossRef]
  21. Kan, K.; Yang, Z.; Lyu, P.; Zheng, Y.; Shen, L. Numerical study of turbulent flow past a rotating axial-flow pump based on a level-set immersed boundary method. Renew. Energy 2021, 168, 960–971. [Google Scholar] [CrossRef]
  22. Sun, X.; Xia, G.; You, W.; Jia, X.; Manickam, S.; Tao, Y.; Xuan, X. Effect of the arrangement of cavitation generation unit on the performance of an advanced rotational hydrodynamic cavitation reactor. Ultrason. Sonochem. 2023, 99, 106544. [Google Scholar] [CrossRef]
  23. Xia, G.; You, W.; Manickam, S.; Yoon, J.Y.; Xuan, X.; Sun, X. Numerical simulation of cavitation-vortex interaction mechanism in an advanced rotational hydrodynamic cavitation reactor. Ultrason. Sonochem. 2024, 105, 106849. [Google Scholar] [CrossRef]
  24. Yin, X.; Huang, X.; Zhang, S.; Bi, H.; Wang, Z. Numerical Investigation of Flow and Structural Characteristics of a Large High-Head Prototype Pump–Turbine during Turbine Start-Up. Energies 2023, 16, 3743. [Google Scholar] [CrossRef]
  25. Jin, F.; Wang, H.; Luo, Y.; Presas, A.; Bi, H.; Wang, Z.; Lin, K.; Lei, X.; Yang, X. Visualization research of energy dissipation in a pump-turbine unit during turbine mode’s starting up. Renew. Energy 2023, 217, 119172. [Google Scholar] [CrossRef]
  26. Jin, F.; Luo, Y.; Wang, H.; Wang, Z.; Lin, K.; Lei, X.; Yang, X. Dynamic response of a pump-turbine runner during turbine’s mode starting up. J. Energy Storage 2023, 74, 109339. [Google Scholar] [CrossRef]
  27. He, L.; Wang, Z.; Kurosawa, S.; Nakahara, Y. Resonance investigation of pump-turbine during startup process. IOP Conf. Ser. Earth Environ. Sci. 2014, 22, 32024. [Google Scholar] [CrossRef]
  28. Nicolle, J.; Morissette, J.F.; Giroux, A.M. Transient CFD simulation of a Francis turbine startup. In IOP Conference Series: Earth and Environmental Science; IOP Publishing: Bristol, UK, 2012; Volume 15, p. 062014. [Google Scholar]
  29. Nicolle, J.; Giroux, A.M.; Morissette, J.F. CFD configurations for hydraulic turbine startup. IOP Conf. Ser. Earth Environ. Sci. 2014, 22, 032021. [Google Scholar] [CrossRef]
  30. Kan, K.; Zhao, F.; Xu, H.; Feng, J.; Chen, H.; Liu, W. Energy Performance Evaluation of an Axial-Flow Pump as Turbine under Conventional and Reverse Operating Modes Based on an Energy Loss Intensity Model. Phys. Fluids 2023, 35, 015125. [Google Scholar] [CrossRef]
  31. Kan, K.; Xu, Z.; Chen, H.; Xu, H.; Zheng, Y.; Zhou, D.; Muhirwa, A.; Maxime, B. Energy loss mechanisms of transition from pump mode to turbine mode of an axial-flow pump under bidirectional conditions. Energy 2022, 257, 124630. [Google Scholar] [CrossRef]
  32. Celik, I.B.; Ghia, U.; Roache, P.J.; Freitas, C.J.; Coleman, H.; Raad, P.E. Procedure for estimation and reporting of uncertainty due to discretization in CFD applications. J. Fluids Eng. 2008, 130, 078001. [Google Scholar]
  33. Ye, H.; Xuan, X.; Wang, M.; Sun, J.; Yang, M.; Zhang, X.; Guo, L.; Sun, X. Structural Optimization of Reactor for the Enhancement of CO2 Electrochemical Reduction Based on Gas-Liquid Mixing Flow Model. Energy Technol. 2024, 12, 2301142. [Google Scholar] [CrossRef]
  34. Qin, D.; Wu, X.; Zhang, J.; Wang, X.; Yan, N. Hydraulic optimisation design of axial flow pump based on blade velocity distribution. Int. J. Hydromechatron. 2023, 6, 311–324. [Google Scholar] [CrossRef]
  35. Zhu, D.; Xiao, R.; Liu, W. Influence of leading-edge cavitation on impeller blade axial force in the pump mode of reversible pump-turbine. Renew. Energy 2021, 163, 939–949. [Google Scholar] [CrossRef]
Figure 1. Full-length three-dimensional model of the pumped storage power station.
Processes 12 01876 g001
Figure 2. Grid partitioning of the full-flow system.
Processes 12 01876 g002
Figure 3. Pressure distribution at the inlet of the upstream penstock.
Processes 12 01876 g003
Figure 4. Schematic illustration of the transition process in the pumped storage unit.
Processes 12 01876 g004
Figure 5. Schematic diagram of pressure monitoring point arrangement.
Processes 12 01876 g005
Figure 6. Diagram of full characteristic.
Processes 12 01876 g006
Figure 7. Variation in unit speed during start-up process.
Processes 12 01876 g007
Figure 8. Variation of external performance parameters during start-up process.
Processes 12 01876 g008
Figure 9. Distribution of pressure non-uniformity at monitoring points in the guide vane and runner areas.
Processes 12 01876 g009
Figure 10. Pressure fluctuations at monitoring points in the guide vane and vaneless regions.
Processes 12 01876 g010
Figure 11. Pressure pulsation characteristics at monitoring point SV–1 in the guide vane region.
Processes 12 01876 g011
Figure 12. Pressure pulsation characteristics at monitoring point GV–1 in the guide vane region.
Processes 12 01876 g012
Figure 13. Pressure pulsation characteristics at monitoring point VL–1 in the vaneless region.
Processes 12 01876 g013
Figure 14. Pressure fluctuations at monitoring points in various sections of the draft tube region.
Processes 12 01876 g014
Figure 15. Pressure fluctuations at monitoring points in different locations of the draft tube region.
Processes 12 01876 g015
Figure 16. Pressure pulsations at monitoring points in the inlet and outlet sections of the draft tube region.
Processes 12 01876 g016
Figure 17. Dimensionless pressure pulsations at monitoring points in the inlet and outlet sections of the draft tube region.
Processes 12 01876 g017
Figure 18. Power spectrum diagrams at monitoring points in the inlet and outlet sections of the draft tube region.
Processes 12 01876 g018
Figure 19. EPTD, pressure, relative velocity, and absolute velocity distribution in the region of guide vanes and runner.
Processes 12 01876 g019
Figure 20. Distribution of vortex structures in the region of runner and guide vanes.
Processes 12 01876 g020
Figure 21. Velocity pressure and EPTD in the draft tube.
Processes 12 01876 g021
Figure 22. The evolution of vortex structures in the draft tube.
Processes 12 01876 g022
Table 1. Comparison of existing work with state-of-the-art technology.
Present WorkExisting State-of-the-Art
Numerical simulation methodThree-dimensional model (3D)3D and 1D–3D coupled methods
Main research contentResearch on the instability and its mechanisms during the start-up process in low-head conditionPrimarily focuses on the unit’s flow characteristics.
Analytical methodsAnalyze the internal flow state using a combination of entropy production theory and vortex identification methods.Only the external characteristics are analyzed, with less attention given to the relationship between internal flow states and changes in external characteristics.
ConclusionExplain the mechanisms of changes in external characteristics and pressure pulsation characteristics during the startup process and identify the causes of hydraulic instability in pump storage units at low-head conditions during start-up.Existing literature addresses this aspect only briefly.
Table 2. Basic parameters of the pumped storage power station.
ParametersValue
Normal upper reservoir water level716.0 m
Upper reservoir dead water level691.0 m
Normal lower reservoir water level299.0 m
Lower reservoir dead water level262.0 m
Pump-turbine modelHLNA1518-LJ-412
Rated output under turbine operating conditions306.1 MW
Maximum input under pump operating conditions≤325 MW
Rated speed428.6 r/min
Rotational inertia of generator 6000 t·m2
Rotational inertia of pump-turbine240 t·m2
Guide vane centerline elevation192.0 m
Number of runner blades9
Number of guide vanes20
Number of stay vanes20
Table 3. Grid partitioning schemes.
Flow ComponentsNumber of Nodes/104
Upstream penstock68.8
Spiral case104.2
Stay vanes52.7
Guide vanes136.5
Runner182.3
Draft tube86.5
Downstream penstock69.0
Total700.0
Table 4. Grid accuracy verification results.
Parametersφ = H (m)φ = M (kN·m)
Number of grids N1700
Number of grids N2591
Number of grids N3496
Grid refinement factor r211.06
Grid refinement factor r321.06
Numerical solution φ13905476
Numerical solution φ2387.55445
Numerical solution φ33845400
Safety factor Fs1.251.25
Convergence accuracy p5.776.4
Grid convergence index GCI212.00%1.57%
Grid convergence index GCI322.82%2.29%
Disclaimer/Publisher’s Note: The statements, opinions and data contained in all publications are solely those of the individual author(s) and contributor(s) and not of MDPI and/or the editor(s). MDPI and/or the editor(s) disclaim responsibility for any injury to people or property resulting from any ideas, methods, instructions or products referred to in the content.

