Article

Probing Internal Damage in Grey Cast Iron Compression Based on Acoustic Emission and Particle Flow

1
School of Mechanical Engineering, Inner Mongolia University of Science and Technology, Baotou 014010, China
2
School of Civil Engineering, Inner Mongolia University of Science and Technology, Baotou 014010, China
*
Author to whom correspondence should be addressed.
Processes 2024, 12(9), 1893; https://doi.org/10.3390/pr12091893 (registering DOI)
Submission received: 6 June 2024 / Revised: 7 July 2024 / Accepted: 10 July 2024 / Published: 4 September 2024
(This article belongs to the Section Particle Processes)

Abstract

:
Grey cast iron releases energy in the form of stress waves when damaged. To analyse the evolution of the physical and mechanical properties and acoustic emission characteristics of grey cast iron under uniaxial compression, acoustic emission signals were collected at different rates (0.5, 1, and 2 mm/s). Combined with load-time curves, damage modes were identified and classified using the parametric RA-AF correlation analysis method. The results indicate the loading rate effects on the strength, deformation, acoustic emission (AE), and energy evolution of grey cast iron specimens. The acoustic emission counts align with the engineering stress–strain response. To better illustrate the entire failure process of grey cast iron, from its internal microstructure to its macroscopic appearance, X-ray diffraction (XRD) and optical microscopy (OM) were employed for qualitative and quantitative analyses of the material’s internal microstructural characteristics. The equivalent crystal model of grey cast iron was constructed using a Particle Flow Software PFC2D 6.00.30 grain-based model (GBM) to simulate uniaxial compression acoustic emission tests. The calibration of fine parameters with indoor test results ensured good agreement with numerical simulation results. Acoustic emission dynamically monitors the compression process, while discrete element particle flow software further analyses the entire damage process from the inside to the outside. It provides a new research method and idea for the study of crack extension in some metal materials such as grey cast iron.

Graphical Abstract

1. Introduction

Grey cast iron HT150 is a high-strength, high-hardness pearlitic grey cast iron. Carbon exists in cast iron in the form of flake graphite. The fracture is grey. It has good casting and cutting performance. It is used in the manufacture of racks, boxes, and so on. Because of the high carbon content (2.7–4.0%), it can be seen as a carbon–steel matrix plus flake graphite, and the internal matrix organisation is pearlite–ferrite. The microstructure primarily consists of a pearlitic matrix and flake graphite. It finds widespread use in mechanically significant castings such as cylinder stators, cylinder blocks, pistons, gears, engine bases, pressure valve bodies, and other components [1,2,3]. The mechanical properties of grey cast iron materials hinge on the matrix organisation and the morphology of lead-like structures. The presence of flake graphite within the matrix interrupts its continuity, causing stress concentration at the sharp corners of the graphite. This, in turn, impacts the static strength and fatigue behaviour of the matrix. Therefore, a detailed and thorough investigation of the damage mechanisms and characteristics of grey cast iron throughout the compression process is essential.
In recent years, scholars have conducted research on the compression or tensile damage and fracture of cast iron in different environments, exploring the links with its microstructure. Chaus et al. [4] investigated the as-cast microstructure of ductile iron (DI) using optical microscopy (LM) and scanning electron microscopy (SEM). The effects of plastic strain in the range of 20–80% and 1000 °C thermoplastic extrusion on the transformation of the microstructure and mechanical properties of castings were further investigated. The results indicated that compression significantly influenced the shear deformation and shear fracture of the specimens. Fan et al. [5] investigated the effects of microstructural effects on the tensile static strength of HT200 grey cast iron samples. The microstructure was observed using a scanning electron microscope. A static load failure test was conducted on grey cast iron HT200 cylinder block specimens. Subsequently, the Energy Density Zone (EDZ) model was employed to simulate the fracture process of the specimens. The results indicate that the energy density zone model can more accurately describe the fracture process of brittle materials like grey cast iron. Furthermore, computational results demonstrate that microscopic effects do influence the static strength of grey cast iron materials. However, these methods only provide a surface level view of microstructural changes and do not effectively assess structural damage.
Acoustic emission (AE) has proven to be a valuable solution to this issue. Acoustic emission technology monitors the deformation and damage within a material by capturing the stress waves released from the dissipation of strain energy during the deformation and damage process [6]. It is extensively employed in the detection of damage and fracture behaviour in civil structures, coal mines, new light metal metallic materials, gears, and steel structures [7,8,9,10,11]. Grey cast iron, akin to other brittle materials like rock, soil, coal, and concrete, has been the subject of extensive research by scholars. They have conducted significant investigations into the static and dynamic mechanical properties and damage mechanisms of coal, rock, and soil, considering loading rates, and have derived valuable conclusions. Ma and colleagues [12] conducted uniaxial compression tests and numerical simulations on in-house coal–rock composite specimens at five different loading rates. The results revealed noticeable loading rate effects on the strength, deformation, acoustic emission (AE), and energy evolution of the coal–rock composite specimens. Zheng and colleagues [13] investigated the damage and acoustic emission characteristics of anthracite coal under various loading rates and particle sizes. The results indicate that acoustic emission is minimal in the early stage of compression. It becomes more active during the transition from elastic deformation to plastic deformation, as evidenced by an increase in the number of acoustic emission events with higher loading rates. Xu and colleagues [14] investigated the extent of rock damage under different loading rates from the perspective of material energy change. Indoor experiments allow for the analysis of characteristic parameters such as acoustic emission, macroscopic cracks, and stress–strain trends during material damage from a macroscopic standpoint. However, they are unable to depict the entire process from material microcracks to macroscopic ones and the spatial–temporal evolution of acoustic emission. The particle flow method (PFC) is a numerical computation method based on establishing micromechanical properties between granular units. By creating an interaction force model between particles, it can simulate the complex dynamic behaviour of granular media under external forces or deformation and provide numerical solutions for various physical quantities. Mori et al. [15] used the PFC to simulate the acoustic-emission-generated characteristics during rock rupture and compared them with the results of indoor tests. The PFC-derived acoustic emission events, amplitudes, frequencies, and b values [16] (defined as the log-linear slope of frequency magnitude distribution of acoustic emissions) were able to accurately simulate actual rock damage. The simulated rock burst signals closely correlated with acoustic emission measurements obtained from triaxial compression tests on rocks. Saadat et al. [17] constructed a granite equivalent crystal model, GBM (grain based model, GBM), and numerical calculation model based on particle flow software PFC2D 6.00.30, calibrated the fine-scale parameters through the results of indoor tests, and simulated the uniaxial compression acoustic emission tests of granite specimens. Despite the extensive research into various materials by scholars, there have been limited investigations into cast iron.
In this study, uniaxial compression tests were conducted on grey cast iron at different rates, employing acoustic emission to examine the entire damage process, damage mechanisms, and mechanical properties. An additional analysis was performed from an energy perspective. To better illustrate the deformation of grey cast iron at the micro and fine levels, macroscopic parameters obtained from experiments were used to construct microscopic structure equivalents of grey cast iron with different crystals in the GBM numerical model using PFC. The study delves into the fine and microscopic perspectives of grey cast iron, providing a detailed expression of the crack generation process and the spatio-temporal evolution of acoustic emission. Additionally, the study compares the results with experimental data from an energy perspective to verify the findings.

2. Analysis Steps

2.1. Material Selection and Preparation

The material for this experiment was cast iron HT150 purchased from Wuhan Pilot Times Technology Co., Ltd., Wuhan, China. Its chemical composition is shown in Table 1. The specimens selected for the experiment were cylindrical blocks with a diameter of 15 mm and a height of 25 mm. To ensure consistency in material parameters, the compression specimens were all lathe-turned from a cast iron rod with a diameter of 25 mm and a height of 2 m. And three specimens were selected to be cut along the axis, and the specimens were roughly and finely ground and polished before etching using a solution of 4% nitric acid in ethanol (Fujian, China), which was used for the subsequent metallurgical analysis of the materials.

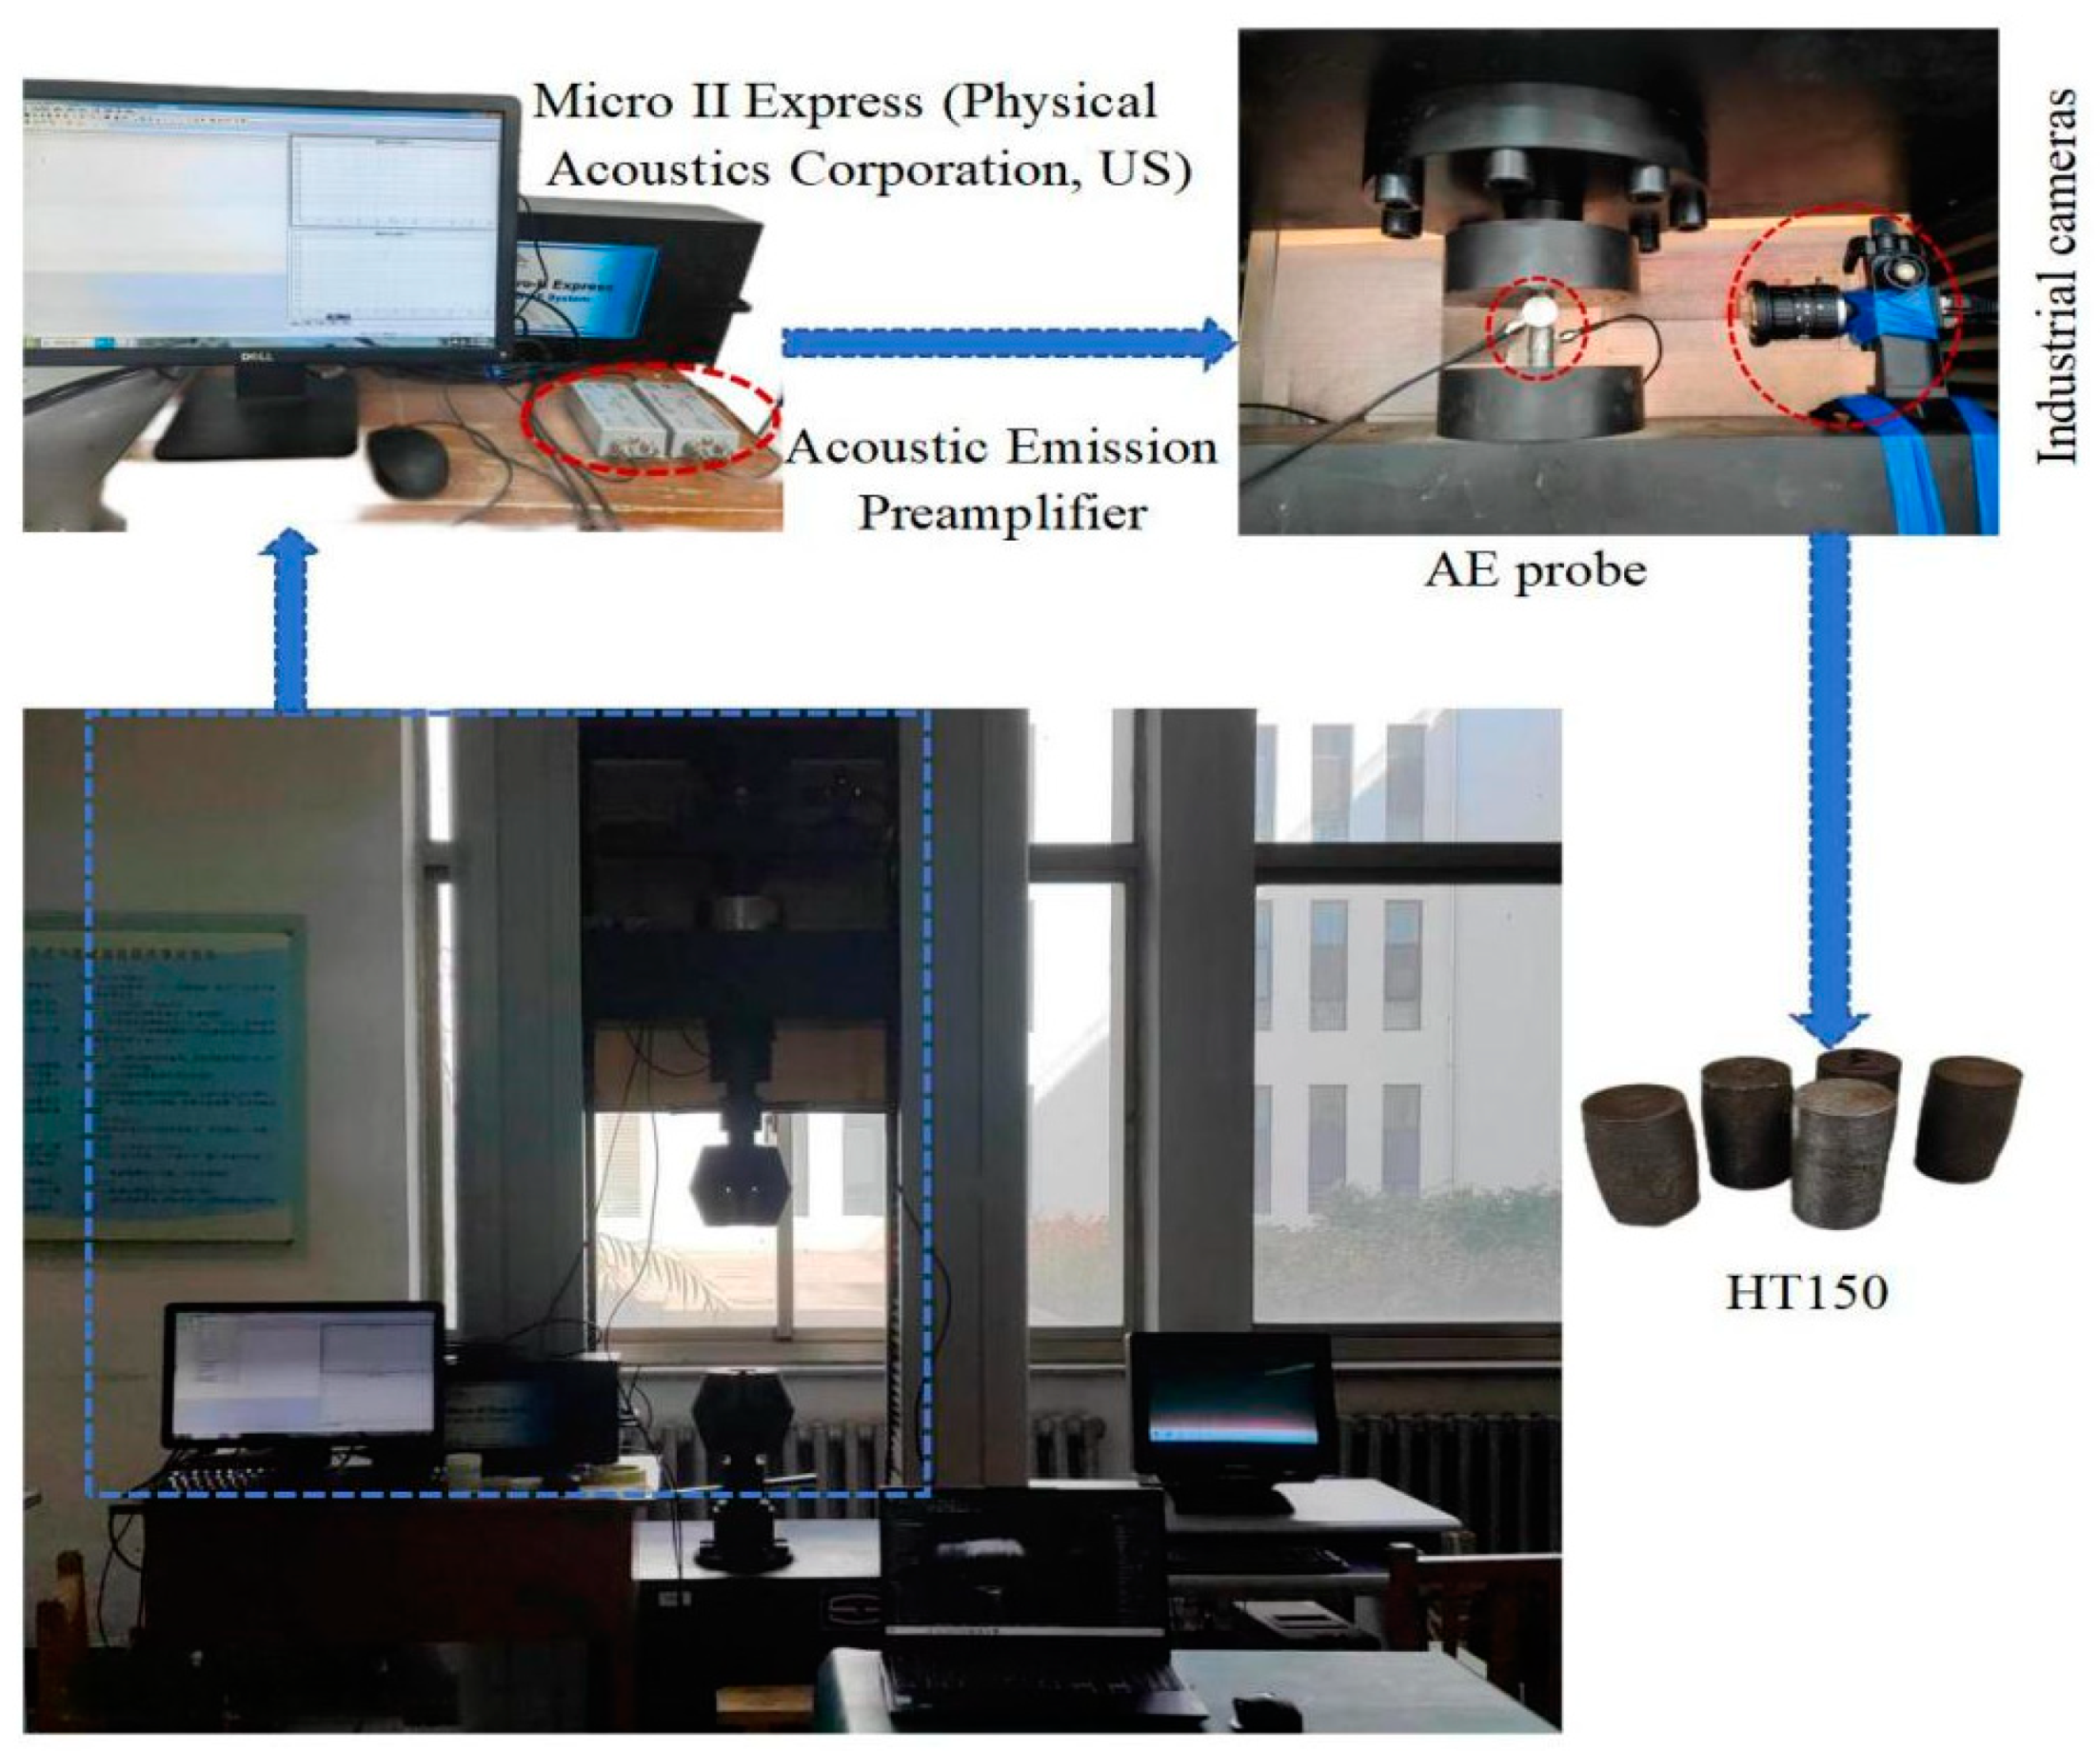
2.2. Compression Experiments and Acoustic Emission Detection

The experimental setup, as shown in Figure 1, involved uniaxial compression tests conducted on a WDW-200D electronic universal testing machine, following the indoor test methods specified in [18] GB/T 228.1 for metal materials. The compression speeds used were 0.5 mm/s, 1 mm/s, and 2 mm/s. The experimental equipment is capable of automatically recording and storing real-time data, including pressure, displacement, acoustic emission signals, and time during operation. The required experimental data can then be obtained through subsequent calculations. To ensure the uniform loading of the samples and to minimise the influence of boundary conditions on the experimental results, lubricant (machine oil) was applied between the sample surface and the compression platen. Each experiment was repeated three times, resulting in a total of nine specimens, to ensure the statistical reliability of the experimental data.
The acoustic emission system utilised in this study was the Micro II Express (Physical Acoustics Corporation, West Windsor Township, NJ, USA). This system is a multi-channel, fully digital acoustic emission system capable of collecting and storing waveform signals simultaneously during signal acquisition. The composition and installation of the experimental equipment are referenced in Figure 1. The preamplifier was set to 40 dB, and two probes, R6α and R15α, were used to collect acoustic emission signals. Their operating frequency ranges were 40–100 kHz and 50–400 kHz [19], respectively. The digital bandpass filter for the R6α probe was set to 20–100 kHz, while for the R15α probe, it was set to 100 kHz–1 MHz [9]. This setup ensures the better coverage of the entire frequency range of grey cast iron damage and fracture processes. The acoustic emission probes are coupled to the material using a coupling agent, and the probes are secured with transparent tape to ensure an effective reception of stress waves. A pencil lead break (PLB) test was also conducted and a reasonable threshold of 40 dB was determined after noise testing.

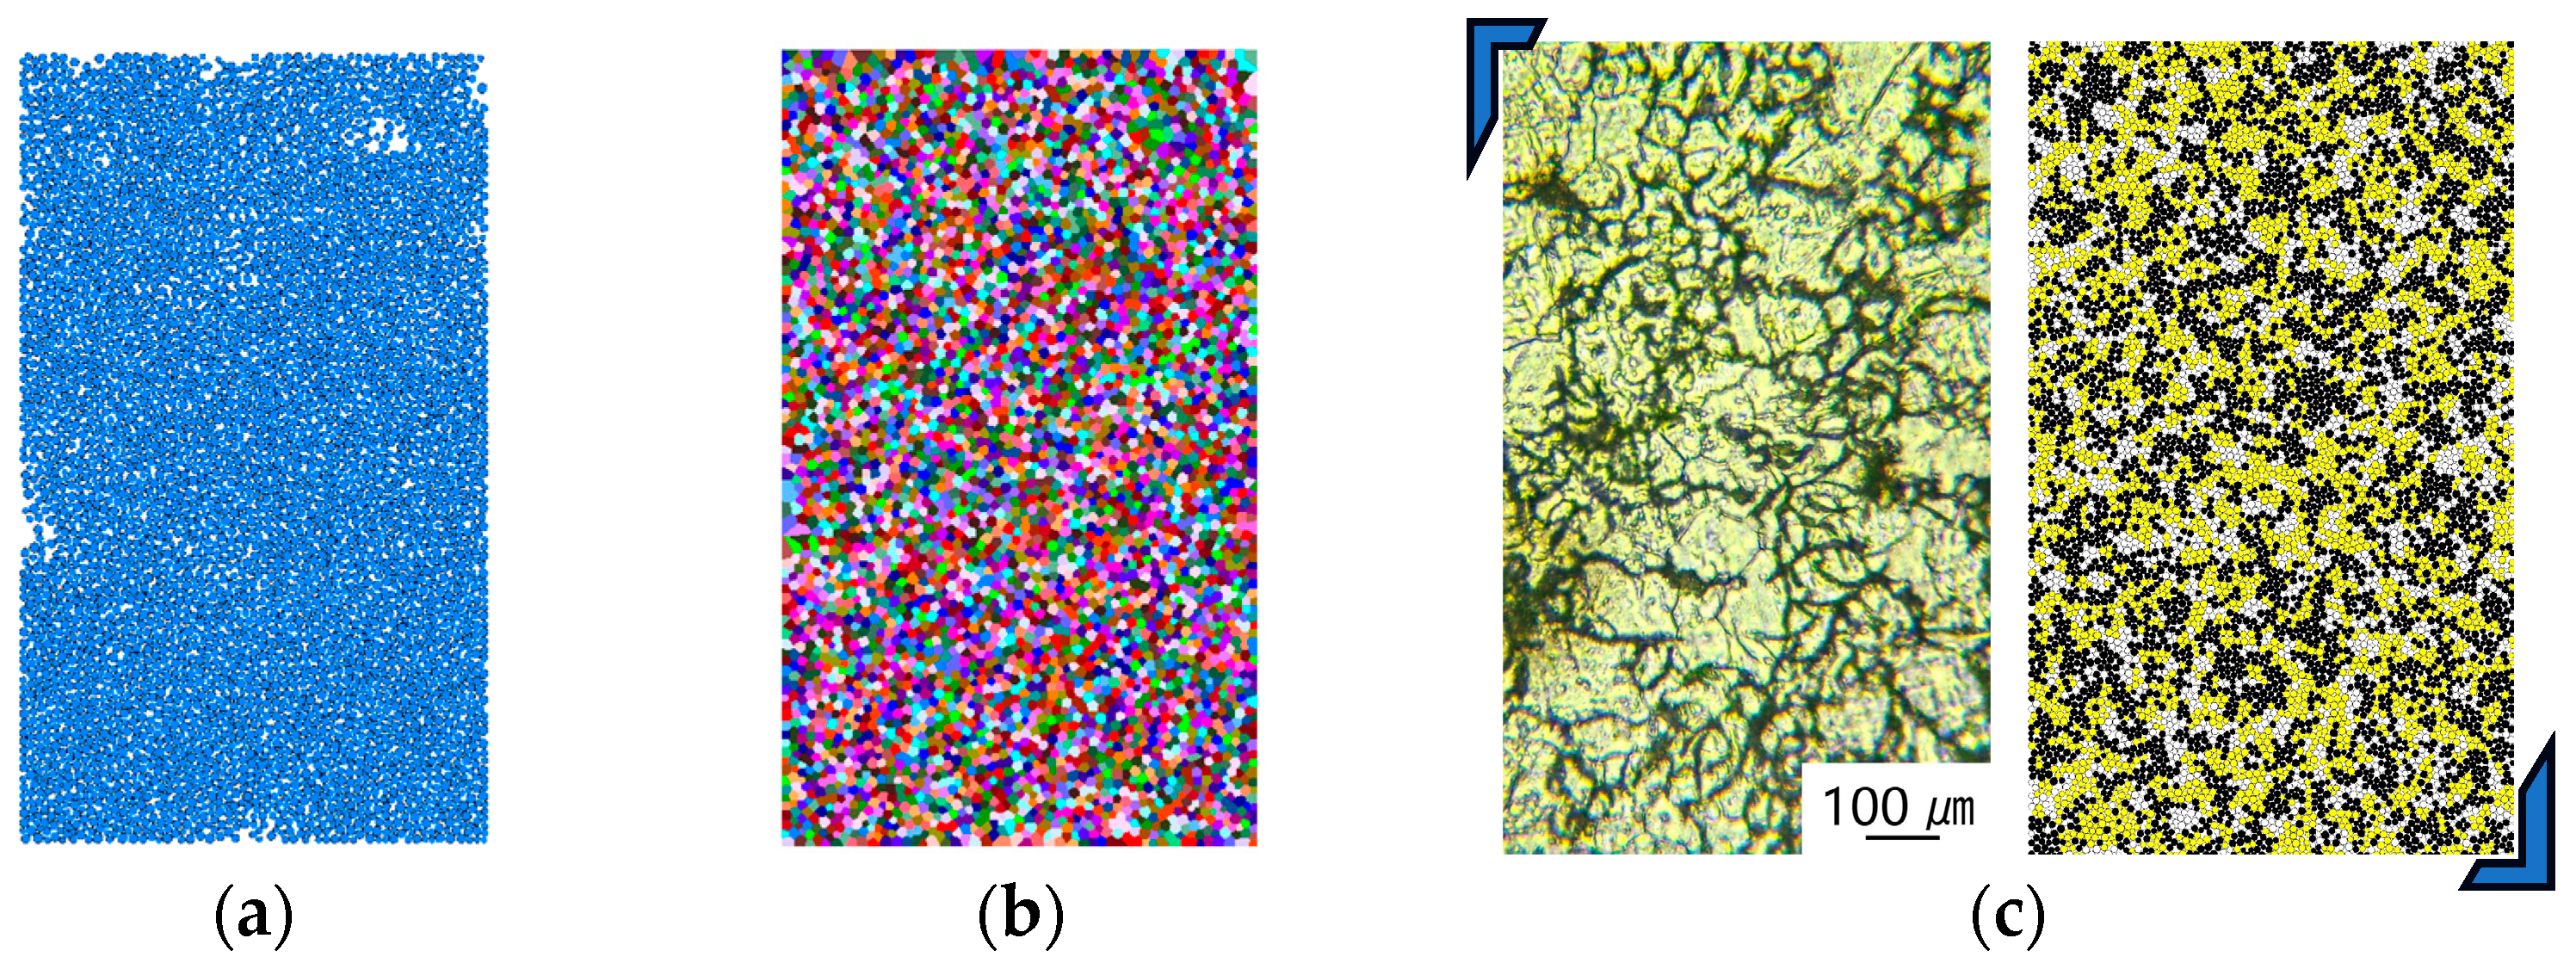
2.3. Metallographic Analysis

Using the OLMPUS-PME3 optical microscope from Shanghai Sunhan Optoelectronics Technology Co., Ltd., metallographic analysis was conducted on the samples that had been ground, polished, etched, cleaned, and dried, in accordance with the metallographic standards for grey cast iron specified in [20] GB/T 7216-2009. The specimens were observed using an optical microscope with a magnification of 200×. Each specimen was randomly photographed in no fewer than 20 fields of view. The optical system magnified the microstructure of the samples to the required level to extract detailed structural information. The specific operational steps were as follows: place the specimen on the microscope stage, select the appropriate magnification by adjusting the objective lens, analyse the sample’s morphology, and take photographs. The X-ray diffractometer used in this experiment was the XRD-7000S model. The experimental conditions for the X-ray diffraction analysis of the samples are as follows: target material: Cu, filter: Ni, tube voltage: 40 kV, tube current: 40 mA, scanning range: 20~90°, and scanning speed: 2°/min.
The metallographic analysis of the material was conducted using a combination of X-ray diffraction (XRD) and optical microscopy (OM). By comparing with existing research results [21,22], the experimentally obtained metallographic micrographs were integrated with the XRD diffractograms for a comprehensive analysis. From Figure 2a, it can be observed that the XRD pattern of the specimen shows the presence of Cr0.40Fe1.60 (Cr0.2Fe0.8), C4 (graphite), and Fe2.00 (Iron). Upon consulting the data for comparison, the SEM image in Figure 2c illustrates the erosion of worm-like graphite due to a corrosive solution, orange ferrite, and traces of lamellar pearlite. The results from the XRD patterns were analysed and combined with the findings of previous researchers. Cr0.40Fe1.60 (Cr0.2Fe0.8) was identified as α-Fe, representing ferrite in this thesis. Fe2.00 (Iron) is associated with ferrite, having carburite penetration pearlitic characteristics and residual austenite. The mass ratios of its phases were calculated using engineering software, as depicted in Figure 2b. These results will be utilised for subsequent modelling.

2.4. Discrete Meta-Analytical Models

In PFC2D, material is constructed through the bonding between particles upon contact. The macroscopic mechanical behaviour of the material is expressed by the properties and contacts of the particles. The most commonly used approach is the Linear Parallel Bond Model (PBM) to simulate particle contacts (see Figure 3a). It provides two types of interface behaviour: one is an infinitesimal, linear elastic, frictional interface capable of transmitting forces, and the other is a finite, linear elastic, cohesive interface capable of transmitting both forces and moments [23]. Tian et al. proposed the grain-based model (GBM) [24], in which the specimen is composed of deformable, destructible, polygonal grains. These grains are made up of multiple particles, with internal particle bonds connected by the Linear Parallel Bond Model, while grain boundaries are connected using the Smooth Joint Model (SJM) (see Figure 3b). It can be used to simulate bonding, friction, and fracture behaviours among internal micro-grains within the specimen. The GBM is commonly employed to determine the mechanical behaviour of grains within rocks.
To better depict the microstructural evolution of cast iron during uniaxial compression rupture and damage, a grain-based model (GBM) was developed using a crystal unit generation algorithm. Initially, an initial particle flow model was established with dimensions of 15 × 25 mm (diameter × height), and particles ranging in radius from 0.06 to 0.10 mm were generated within the model. Subsequently, the distribution of particles was continually adjusted within the model using the radius expansion method until internal stresses reached equilibrium, as depicted in Figure 4a. Following this, the Rblock method with Voronoi was employed to randomly partition crystals within the model region, primarily utilising the ‘from-balls’ command in the Rblock construct, as illustrated in Figure 4b. These segmented crystal unit particles form various clusters of unit particles, known as cluster units. Utilising XRD for qualitative and quantitative analyses of the metallographic composition within cast iron HT150, the microstructural morphology was characterised with reference to the OM image in Figure 2c. The simulated grey cast iron grains were divided into graphite flakes (24% black), pearlite (36% yellow), and the rest of the internal micro-components (40% white matrix) [24,25], as shown in Figure 4c. Throughout the modelling process, the research by Goran Ljustina et al. [26] was consulted to acquire static material data regarding the components involved in the microstructure of cast iron. Subsequently, fine-scale parameters were attributed to each cluster cell in the PFC, using an iterative trial and error approach to accurately reflect the findings of the experimental data, as outlined in Table 2 and Table 3 and depicted in Figure 4c.
In PFC, the uniaxial compression process is simulated by employing a wall mechanism, in which the upper wall is assigned a specific downward velocity and calculations are halted once 70% of the peak stress has been attained. From a microscopic perspective, acoustic emission during the uniaxial compression of cast iron primarily arises from fragmentation, bonding, and fracture between the material’s microstructures. In PFC simulation, although the particles themselves do not realistically fracture, when the normal or shear stresses applied to the interparticle bonding material exceed their corresponding bond strength, the parallel bond breaks. Subsequently, the bonding material, along with the associated forces, moments, and stiffness, is removed from the model, causing the interparticle contact model to degrade into a linear contact model. In PFC simulations, the formation of microcracks in actual materials under compression is simulated by the breakage of bonds between particles, while the number of bond breakages is used to represent the acoustic emission events recorded during the experiment [27]. Each microcrack produced is counted as an acoustic emission number. The number of bond breaks in the same interval time step is continuously monitored during the calculation process, and by counting the number of interparticle bond breaks it can be approximated as a metric of the cast iron acoustic emission number to express the acoustic emission events in the chamber experiments [27,28,29].

3. Results and Discussion

3.1. Results of the Experiment

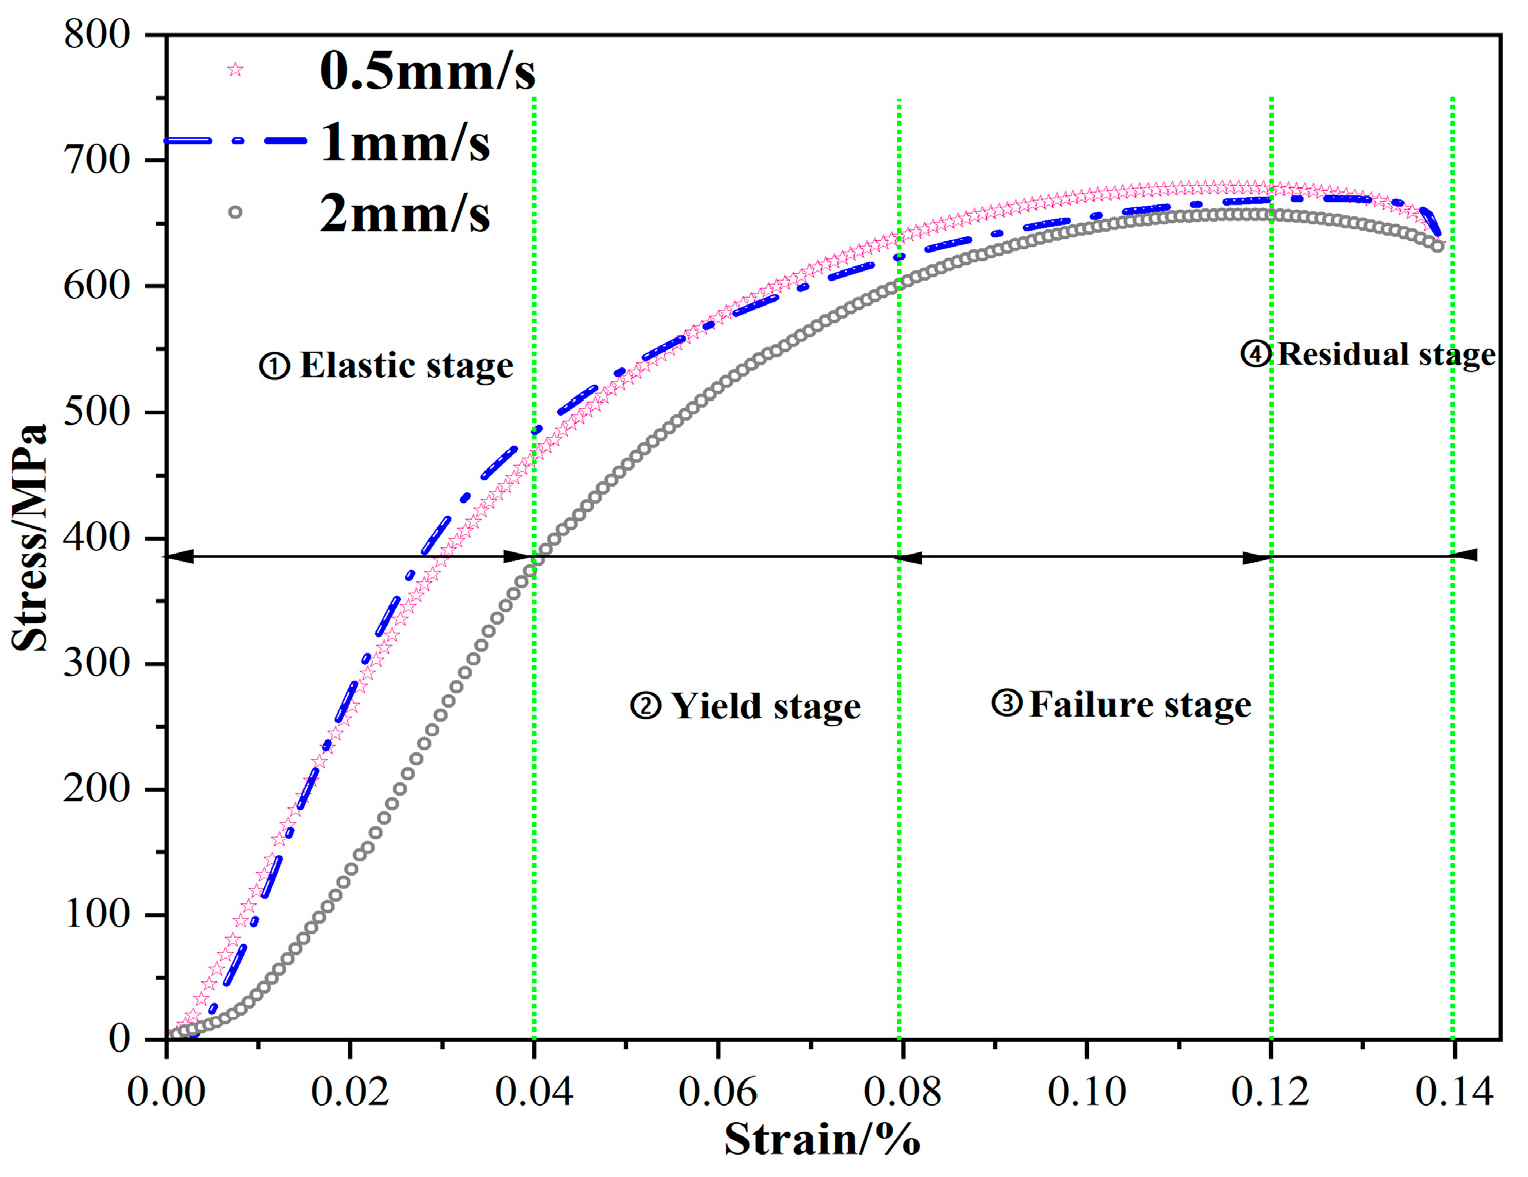
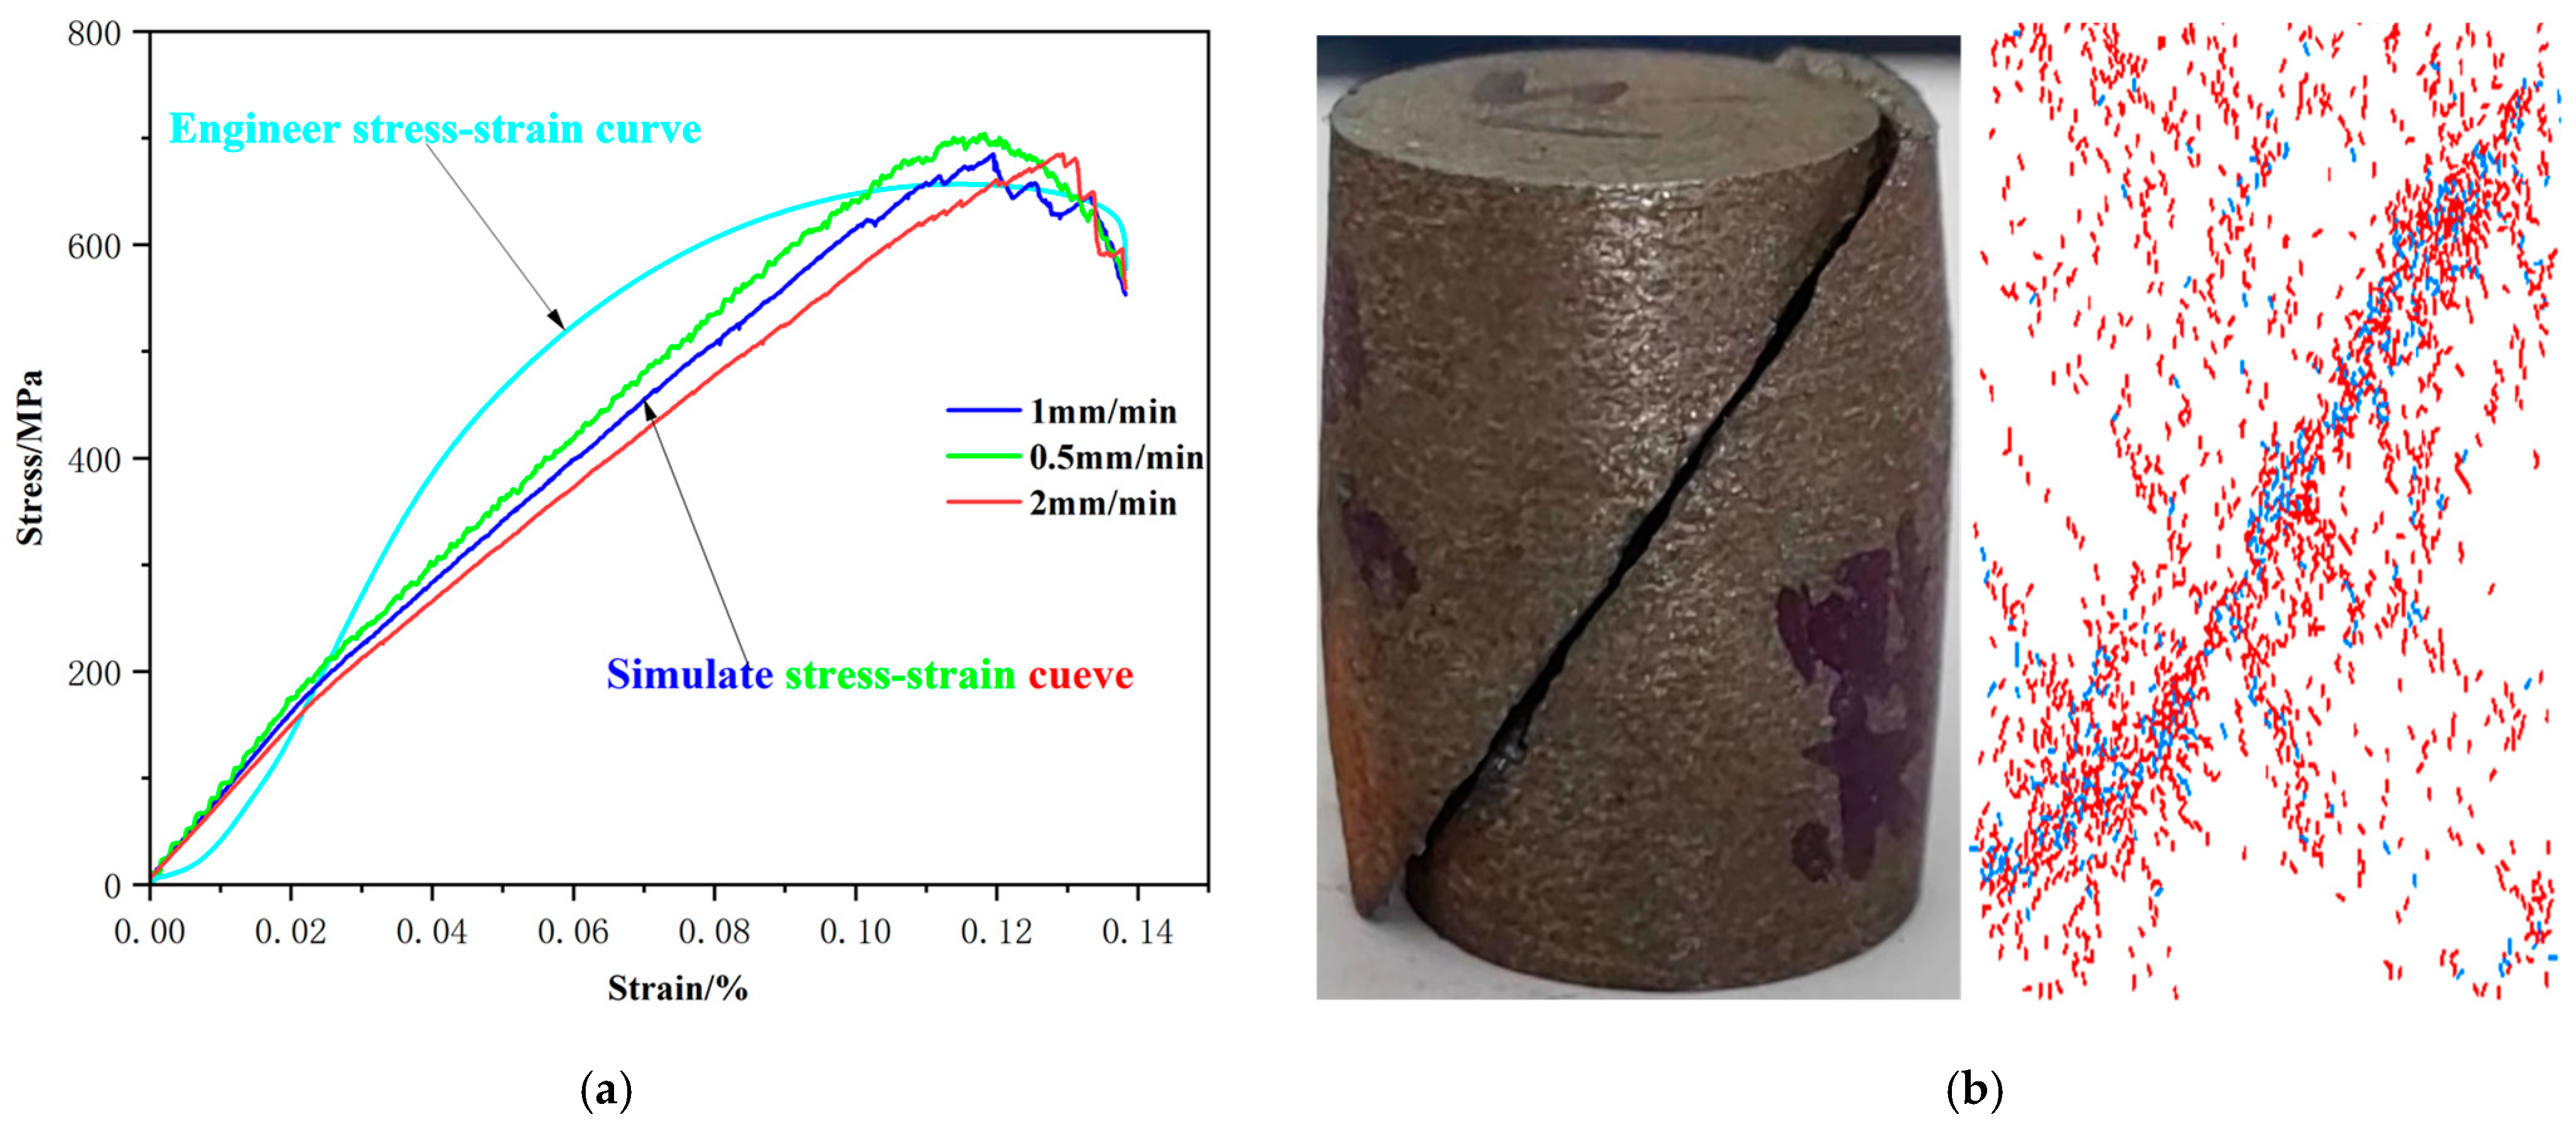
3.1.1. Engineering Stress–Strain Curve Analysis

Based on the observation of acoustic emission data and experimental stress–strain curves, the overall process of cast iron compression failure was analysed. Typical stress–strain curves of cast iron under different loading rates are shown in Figure 5. Due to the negligible difference in strain displacement among various loading rates and the close resemblance in characteristic trends of stress–strain curves under different loading rates, the stress–strain curves were divided at strains of 0.04, 0.08, and 0.12 to facilitate a better analysis and comparison of acoustic emission characteristics in each stage. The stress–strain curves can be divided into four stages [30]: I. Elastic stage: During this phase, stress and strain exhibit linear growth, and the stress–strain curve remains essentially straight with a constant slope, indicating the compaction of some micro-pores within the cast iron. II. Yielding stage: During this phase, the slope of the stress–strain curve gradually decreases as the original voids within the cast iron are completely compacted, and some minor cracks begin to form. III. Failure stage: In this phase, the slope of the stress–strain curve approaches zero, and the curve takes on a convex shape. At this point, micro-cracks within the cast iron will have rapidly formed, and internal fissures will undergo unstable expansion, resulting in significant macroscopic fracturing of the material. IV. Residual stage: At this point, the material specimen will have completely fractured, and the stress strain curve will begin to decline. There will be no distinct yield points in the elastic and yielding stages [31]. Overall, the stress growth rates and stress peaks will be higher at lower rates than at high compression rates. This indicates that the compressive strength of cast iron in compression will have a negative strain rate sensitivity over the range of loading rates studied. This phenomenon is consistent with the conclusions drawn in reference [32]. Apart from the elastic stage, subsequent stages show slow changes in stress, with minor differences in stress observed at different rates. This suggests that the effect of strain rate on the failure stage of cast iron after yielding is relatively small, further indicating its internal structure’s relative similarity.

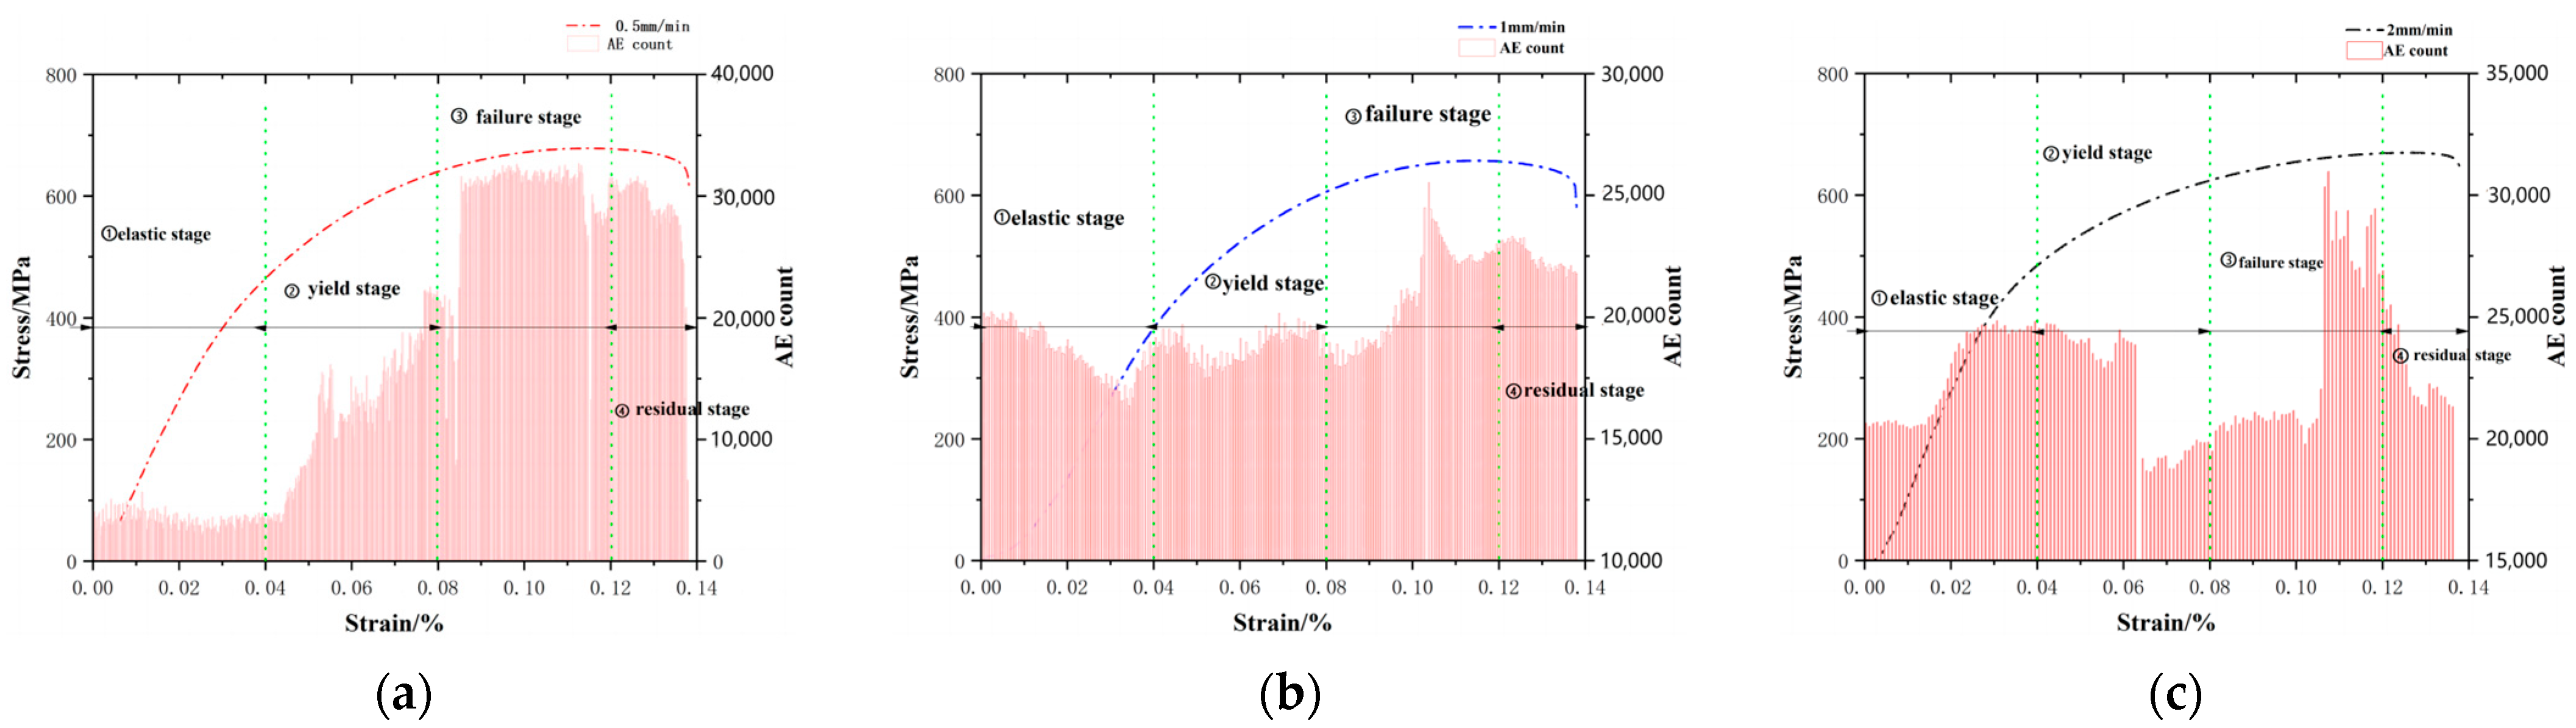
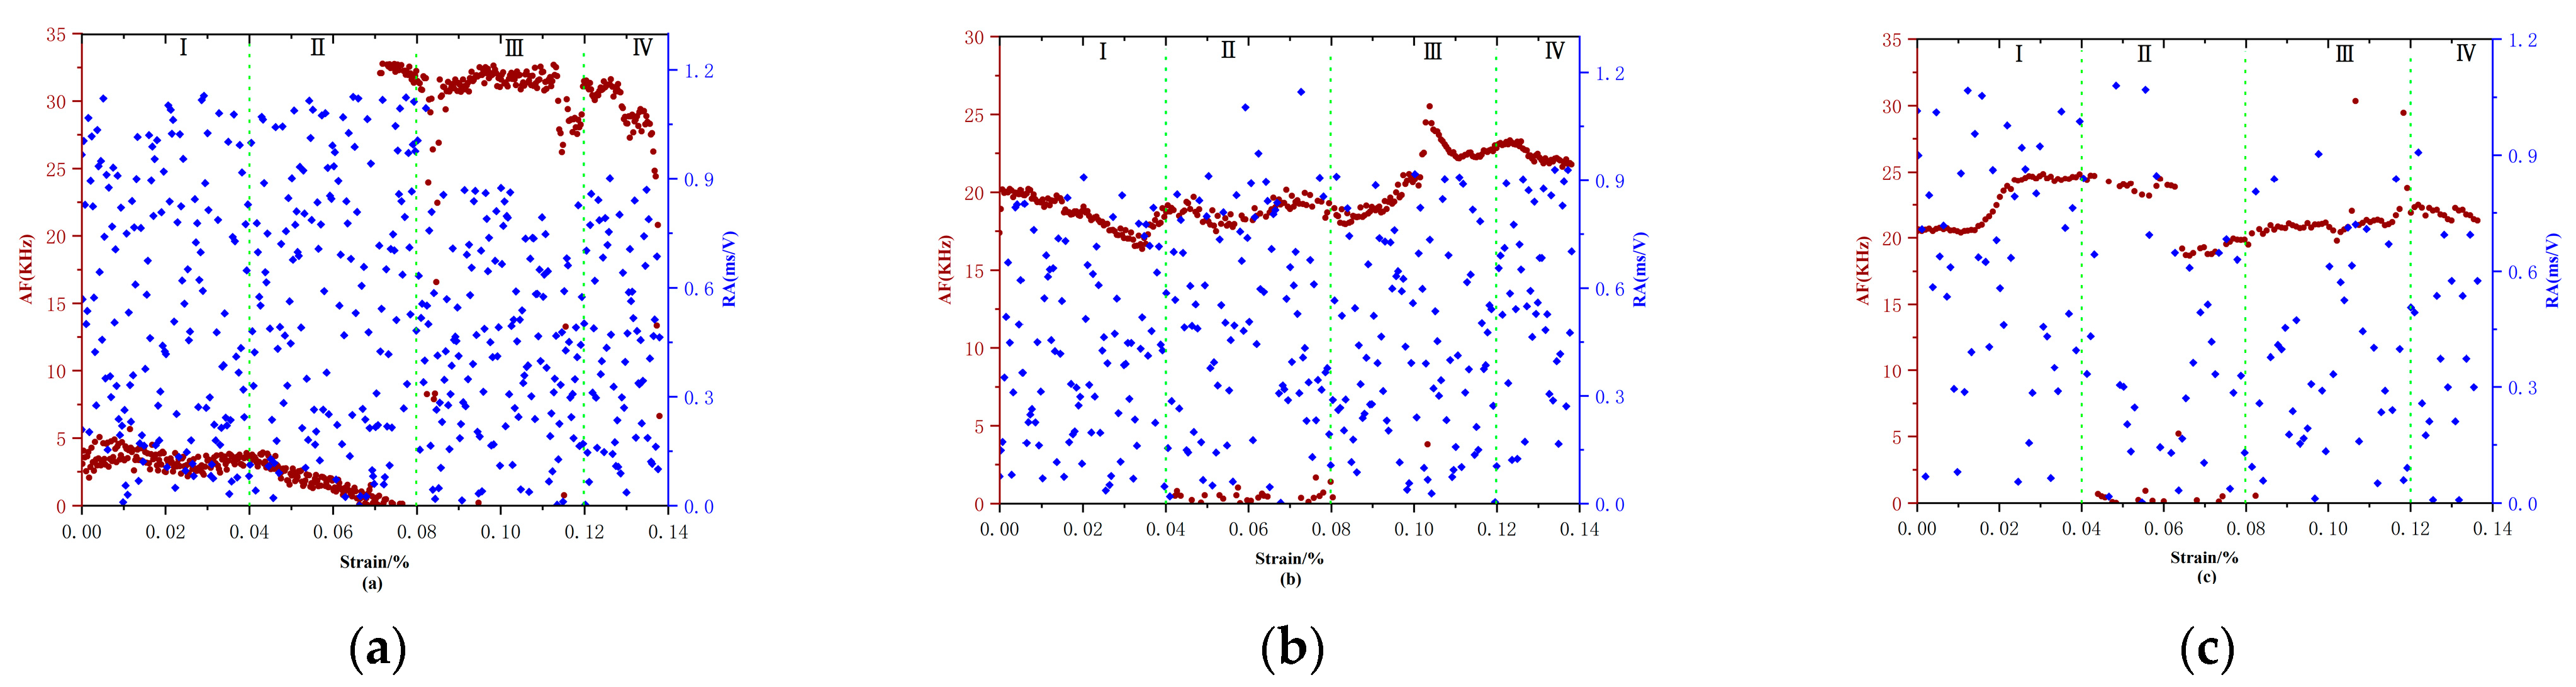
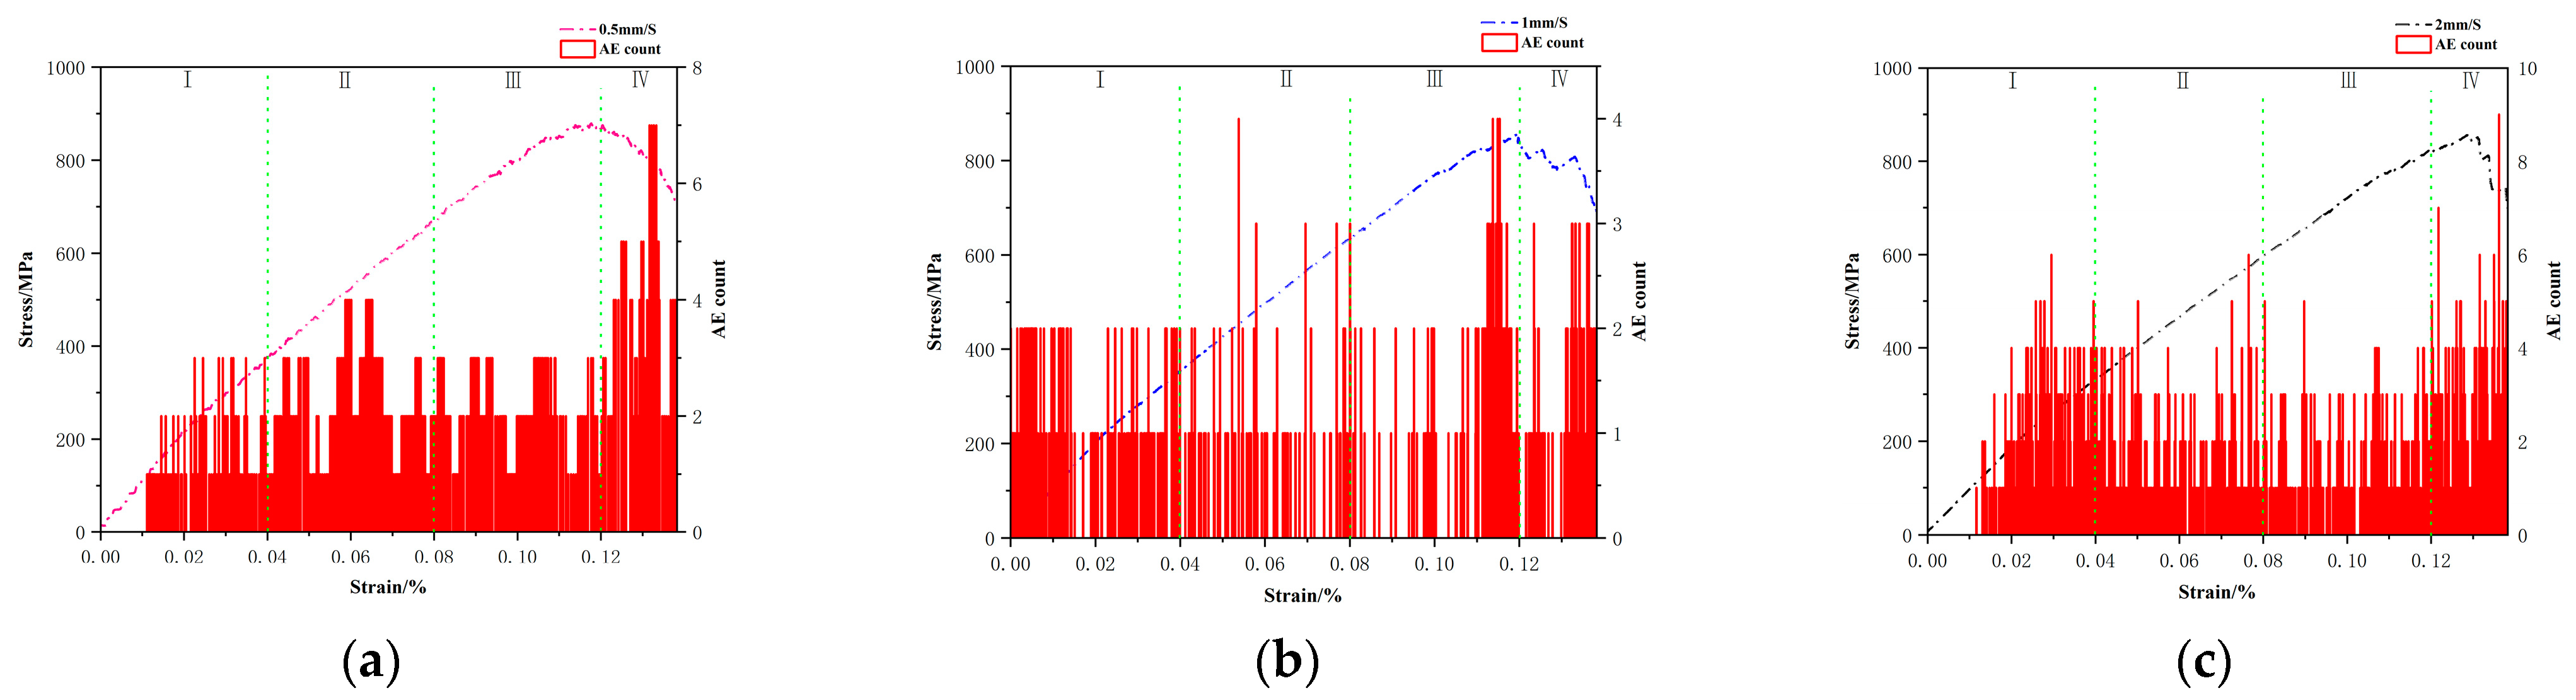
3.1.2. Damage Analysis of Cast Iron HT150 Based on Acoustic Emission Parameters

The acoustic emission count refers to the number of oscillations after the signal exceeds the set threshold value and is widely used to evaluate micro-scale acoustic emission activity. Figure 6 illustrates the relationship between acoustic emission count and engineering stress and strain under different compression rates. During the elastic stage, as the loading point contacts the specimen, original microcracks, defects, and air pockets are compacted, and the material enters the linear elastic stage, generating a small amount of stress waves and acoustic emission events. In the yielding stage, with increasing load, micro-cracks are formed in different regions of the material due to stress concentration and the deformation of graphite flakes [26]. At this point, the acoustic emission count increases, and stress waves become active. The phenomenon of fluctuating acoustic emission counts due to different stress concentrations in different time domains caused by different loads is observed. This is because the expansion time of cracks varies under different loading rates, with shorter times required for crack expansion under higher loading rates. Additionally, during casting, the material itself generates a large number of shrinkage voids and tiny gaps. With an increasing load, more sudden signals occur, and a large number of internal voids in the material are rapidly compacted, producing numerous acoustic emission signals. This indicates a certain correlation between the intensity of acoustic emission signals during the compression of cast iron and the loading rate. This phenomenon aligns with the conclusions drawn in reference [33]. This explains the varying trends in acoustic emission under different compression rates. The patterns observed during the failure and residual stages are similar: prior to approaching the peak load, there is an increase in acoustic propagation along grain boundaries to form macroscopic fracture surfaces at a 45° angle, marking the macroscopic fracture of the cast iron. As loading continues, numerous micro-cracks persist in the residual stage, leading to continued activity in the acoustic emission count.

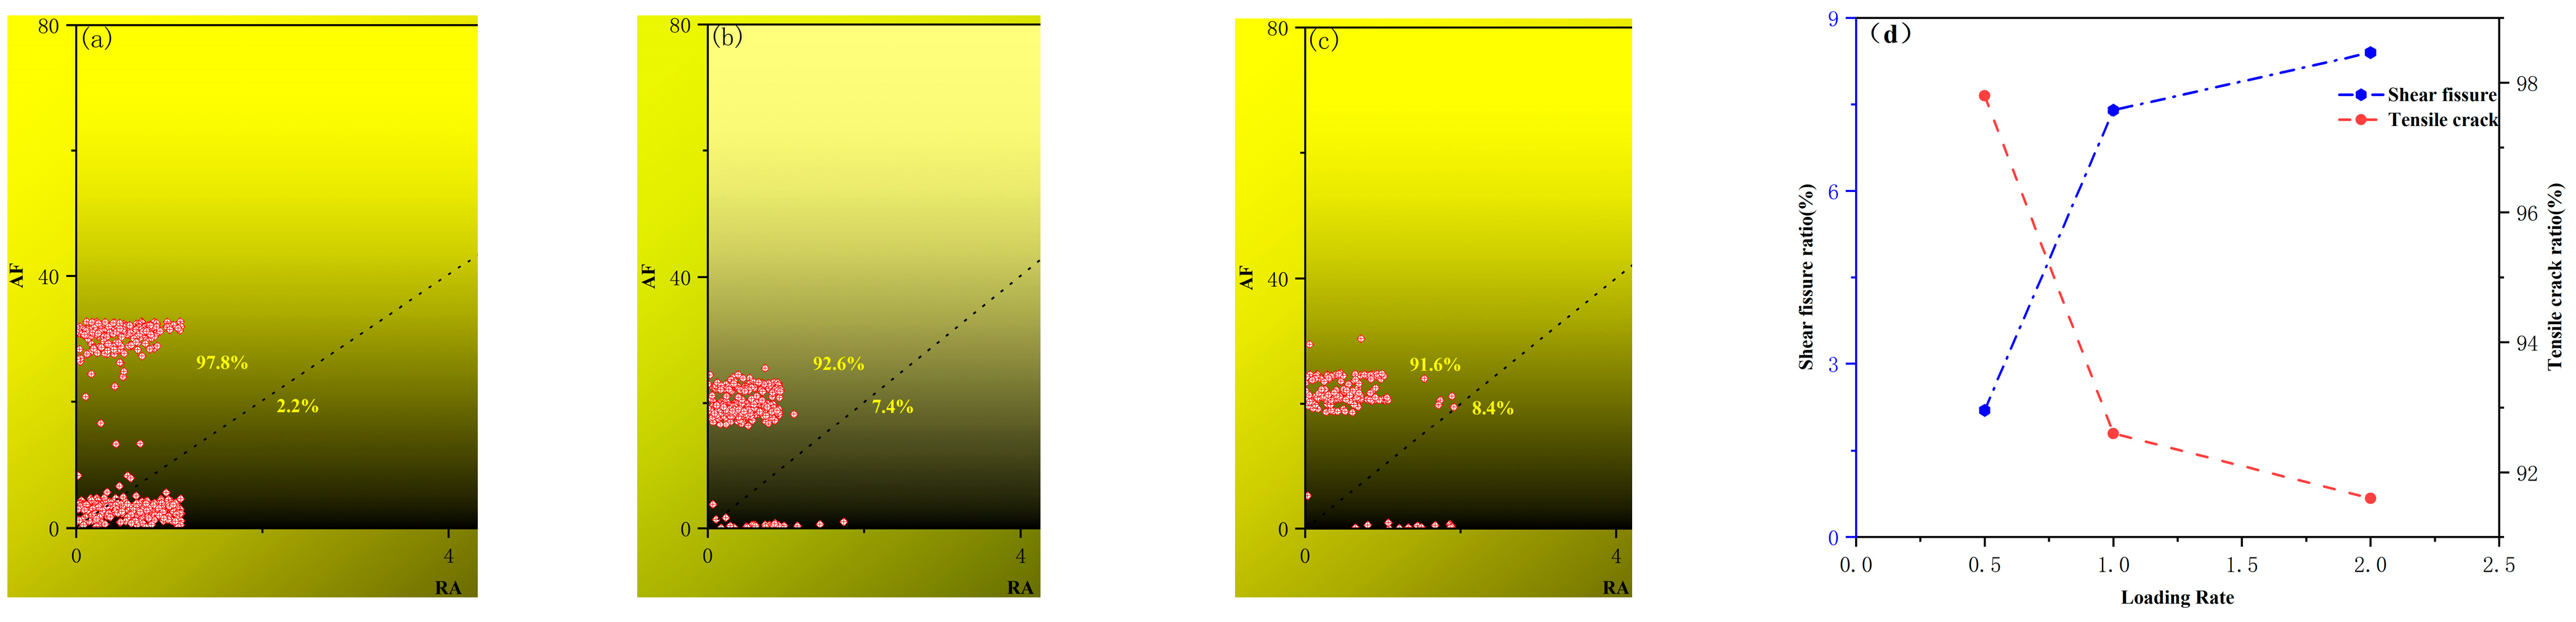
3.1.3. Failure of Pattern Recognition

In order to explore the damage mechanisms of cast iron HT150 under uniaxial compression, fracture modes during the failure process of cast iron HT150 were identified based on acoustic emission signals [34]. Two distinct fracture modes can be generated by acoustic emission during loading and cracking processes. These two fracture modes can be qualitatively classified based on the rise angle (RA) and average frequency (AF) parameters, defined as follows:
RA =   R i s e   T i m e M a x i m u m   A m p l i t u d e
AF = R i n g e r   C o u n t D u r a t i o n
Studies have shown [35] that crack propagation under tension mode exhibits characteristics of high AF values and low RA values. Conversely, crack propagation under shear mode demonstrates low AF values and high RA values.
According to Figure 7, cast iron HT150 exhibits specific patterns in RA and AF distributions at various stages under different loading rates. In Stage I, the majority of AF values are distributed within the range of 2–5 kHz, while most RA values are below 1.2 ms/V. This indicates that during this stage, the material primarily undergoes tensile failure, with shear failure being a secondary type. The compaction damage of cracks and voids is mainly caused by tensile failure. Stage II shows slight changes, with some RA values exceeding AF values in the latter half, indicating the onset of shear failure, which becomes the predominant type. This suggests that damage and micro cracks in Stage II are mainly caused by both tensile and shear failure. Occasionally, Stage III shows RA values exceeding AF values, similar to Stage II, where shear and tensile failures occur simultaneously. These two types of failure lead to damage and micro-cracks, ultimately forming macroscopic cracks. Stage IV is similar to Stage I, with tensile failure predominating. From the graph, it can be observed that the AF values gradually decrease in Stage IV, indicating that the material has undergone complete failure and fracture in this stage. Throughout the loading process, tensile failure predominates, which is a common phenomenon in uniaxial compression experiments [36]. Shear failure mainly occurs in the elastic stage, with only a small amount occurring in the failure stage.
Additionally, according to the observations from Figure 8, as the loading rate in-creases, the proportion of tensile cracks gradually decreases (from 97.8% to 91.6%), while the proportion of shear cracks gradually increases, and the proportion of tensile cracks gradually increases (from 2.2% to 8.4%). This is because cast iron contains flake graphite, and when the loading rate is increased, there is a significant stress concentration at the edges of the graphite flakes. These stresses exceed the yield strength of the metal matrix, leading to plastic deformation and the detachment of the metal matrix along the graphite edges, thereby initiating the formation of shear cracks.

3.2. Results of Discrete Element Analysis

3.2.1. Numerical Simulation of Stress Curves and Analysis of Damage Results

The numerical simulation results align with the experimental data, and the peak stress gradually decreases with the increase in the loading rate. In the experiment, a macroscopic crack of 45 degrees appeared in the material after loading, and the particle model in the numerical simulation produced a similar oblique crack band, as shown in Figure 9. This simulation result is in good agreement with experimental results, validating the microscopic parameters of the model by showing that they can better reflect the internal microscopic properties of the cast iron material.

3.2.2. A Closer Look at Evolution

The moment tensor acoustic emission theory, established in the literature [16] based on the particle flow programme PFC2D, can simulate the acoustic emission of rocks during the damage process to obtain information such as the time and space of acoustic emission generation, rupture intensity, and the number of contained cracks. In this study, this method was employed to analyse the acoustic emission gestation evolution of grey cast iron HT150 specimens under different loading rates. The aim is to reveal the cracks within the rock, the characteristics of acoustic emission gestation development, and the generation of the relative calm period from a fine-grained perspective. As shown in Figure 10, the stress and acoustic emission counts in the numerical simulation model at different rates align closely with the experimental trend (Figure 6). The undulation and fluctuation of acoustic emission counts at various loading stages are in good agreement, emphasising that the parameters of the current model effectively capture the internal organisational and physical properties of the cast iron material. This can be used to simulate the compression damage of grey cast iron HT150.
When the two end surfaces of the specimen are subjected to loading, contact forces are generated when the particles come into contact with each other, and these dense contact forces intertwine with each other to form a chain of force transmission, i.e., a chain of contact forces. The contact force chain can provide a visualisation of the force distribution of the specimen during the loading process. The thickness of the force chain reflects the magnitude of the contact force, and its evolution demonstrates the change in the contact force distribution between particles. As shown in the upper panel of Figure 11, there is a significant difference in particle morphology at different time points under uniaxial compression conditions. The selected time points correspond to axial strains of 0.04%, 0.08%, 0.11%, and 0.13% for the analysis, respectively. The number of strong and weak force chains does not change much until the strain is 0.08%; after the strain exceeds 0.11%, the number of both strong and weak force chains decreases significantly as the pressure increases and some of the particles begin to rupture from each other. The force chains begin to break and reorganise; some strong force chains break directly to generate weak force chains, some long force chains break to generate short-range force chains, and the strong force chains gather near the 45-degree crack line, which plays a huge role in the compression damage of the model. When the internal structure or external loading changes, the force chain between particles also changes. As can be seen from Figure 11, the contact force chain of the model is uniformly and densely distributed under uniaxial compression with a strain of 0.04%. When the strain increases to 0.08%, the number of force chains increases and their strength increases. As the loading continues, the contact force of the force chains increases, some strong and weak force chains near the cracks undergo fragmentation and reorganisation (more fragmentation), and a large number of coarse force chains appear to form the main crack band, indicating that the particles in the model have begun to fracture, and the model undergoes damage. The change in the number of force chains can also be seen in the initial number of 22,151, which was eventually reduced to 18,672.
Figure 12 shows the displacement distribution and pattern of the composite during the damage process, where the red line segments represent microcracks and the arrows indicate ball movements. In Figure 12a, the balls on both sides of the crack move in opposite directions and separate, perpendicular to the direction of crack extension, forming a tensile crack. Correspondingly, the spheres on both sides of the crack move in opposite directions parallel to the crack propagation direction, forming a shear crack, as shown in Figure 12b. In Figure 12c, the ball moves in a vertical direction to form a mixed tensile shear crack. As depicted in Figure 13, shear cracks initially outnumbered tensile cracks, but soon after, tensile cracks became predominant. Overall, tensile cracking prevailed throughout the entire process, consistent with the experimental findings.
The essence of deformation damage in cast iron lies in the dissipation and release of internal energy. Each stress deformation stage exhibits distinct characteristics of energy release, and acoustic emission energy serves to monitor the energy release pattern throughout the entire damage process [37]. Utilising acoustic emission energy to characterise energy dissipation represents a rational approach [38].
As shown in Figure 14, at the beginning of loading, the cast iron starts to deform elastically internally and most of the absorbed energy is converted into elastic energy. As loading proceeds, the elastic energy begins to be released in the form of dissipated energy, and the energy is randomly increased due to the large number of voids in the material itself. Afterwards, as the pores and other areas become compact, the acoustic emission energy of the cast iron decreases further and begins to stabilise. When the strain energy reaches a significant level and the cast iron experiences destabilising damage, a substantial conversion of elastic energy into dissipative energy occurs, leading to a sharp rise in acoustic emission energy and the complete conversion of all energy into dissipative energy. Following the cessation of loading, the acoustic emission energy gradually decreases.
From an energy perspective, acoustic emission arises from the deformation, friction, or cracking of internal particles within the grey cast iron model under external forces [39]. Therefore, in order to further investigate the generation mechanism of the relatively quiet period of acoustic emission, the change in energy inside the specimen during the acoustic emission evolution is analysed from the energy point of view based on PFC2D. Assuming that the heat exchange from the specimen to the outside world is not considered, the work carried out by the outside world on the specimen is as follows [39]:
U b = U e + U d
where U b is the boundary energy; U e is the strain energy generated during the loading of the specimen; and U d is the dissipated energy released during the loading of the cast iron specimen.
In PFC2D, the boundary energy is the work carried out by loading the specimen on the upper and lower walls (wall); the strain energy includes the strain energy of the particles themselves ( U s ) and the strain energy of the parallel bond model ( U e p ); and the dissipated energy includes the slip energy between particles (Usl), the damping energy ( U d ), and the kinetic energy ( U k ), etc. [40].
U e = U s + U e p U s = 1 2 F n 1 2 K n + F s 1 2 K s   U e p = 1 2 F ¯ n 2 K ¯ n . A ¯ + F s ¯ 2 K s ¯ . A ¯ + M t ¯ 2 K s ¯ . J ¯ + M b ¯ 2 K n ¯ . I ¯
where F n 1 and F s 1 , ( F n ¯ ) and ( F s ¯ ) are the normal and tangential bonding forces for linear contact and parallel-bonded contact between particles, respectively; K n and K S , ( k n ¯ ) and ( k s ¯ ) are the normal and tangential stiffnesses of the linear contact and parallel-bonded contact between particles, respectively; ( M t ¯ ) is the torque for parallel-bonded contact; ( M b ¯ ) is the bending moment of the parallel-bonded contact; A ¯ is the contact area; I ¯ is the moment of inertia of the contact; and J ¯ is the contact polar moment of inertia [41].
The energy-monitoring feature in the PFC 6.00.30 software was utilised to track energy variations during uniaxial compression tests on grey cast iron specimens. The analysis of the simulation results, depicted in Figure 14, revealed a gradual increase in bonding energy with loading until the formation of a crack band, reaching its peak value, followed by a gradual decline, mirroring the experimental energy trends. Conversely, frictional energy increased upon model fracture, suggesting the initiation of particle slip along the 450 oblique angle, contrasting the trend observed in bonding energy. The micro-mechanism of energy evolution in the PFC simulation is that the axial force work continues to make the model absorb energy in the form of total energy, which is stored and accumulated in the form of bond energy and strain energy, and some bond energy is released by cracking when the bond breaks. When the number of model cracks increases or breaks, the bonding energy is released sharply, resulting in a rapid increase in energy. After the loading stops and the model is destroyed, the energy dissipation decreases [42]. This mechanism resembles the energy collected by acoustic emission in the experiment, and the trend of the evolution curve follows a similar pattern.

4. Conclusions

The uniaxial compression of grey cast iron HT150 specimens under different compression rates was simulated by the GBM established by PFC2D and acoustic emission experiments, and the cracks, acoustic emission spatio-temporal evolution process, and energy change characteristics were analysed, and the following conclusions were drawn.
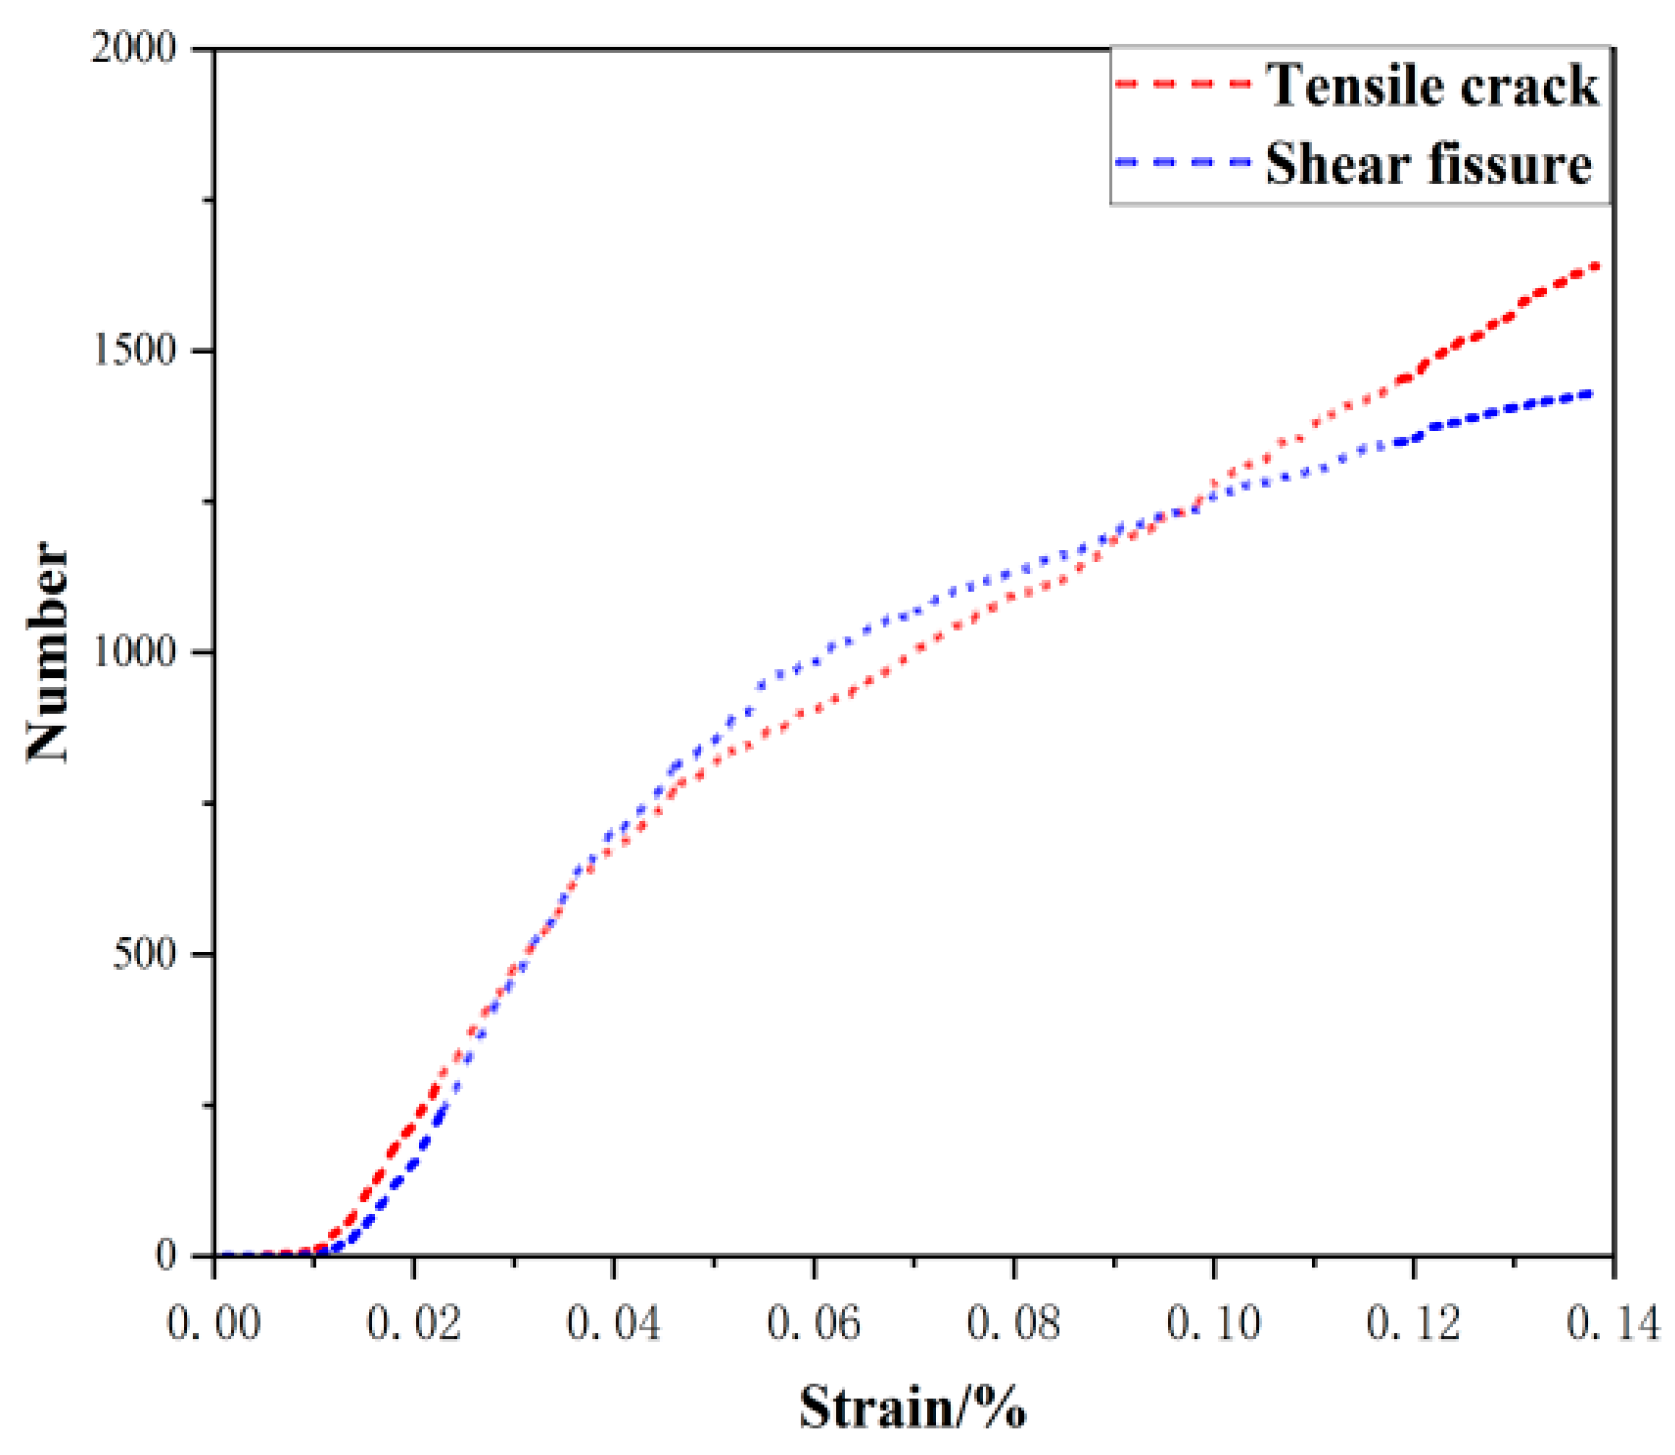
  • With the increase in loading rate, the compressive strength of the specimen decreases, and the damage displays 45 degrees diagonal columnar splitting, mainly dominated by tensile damage.
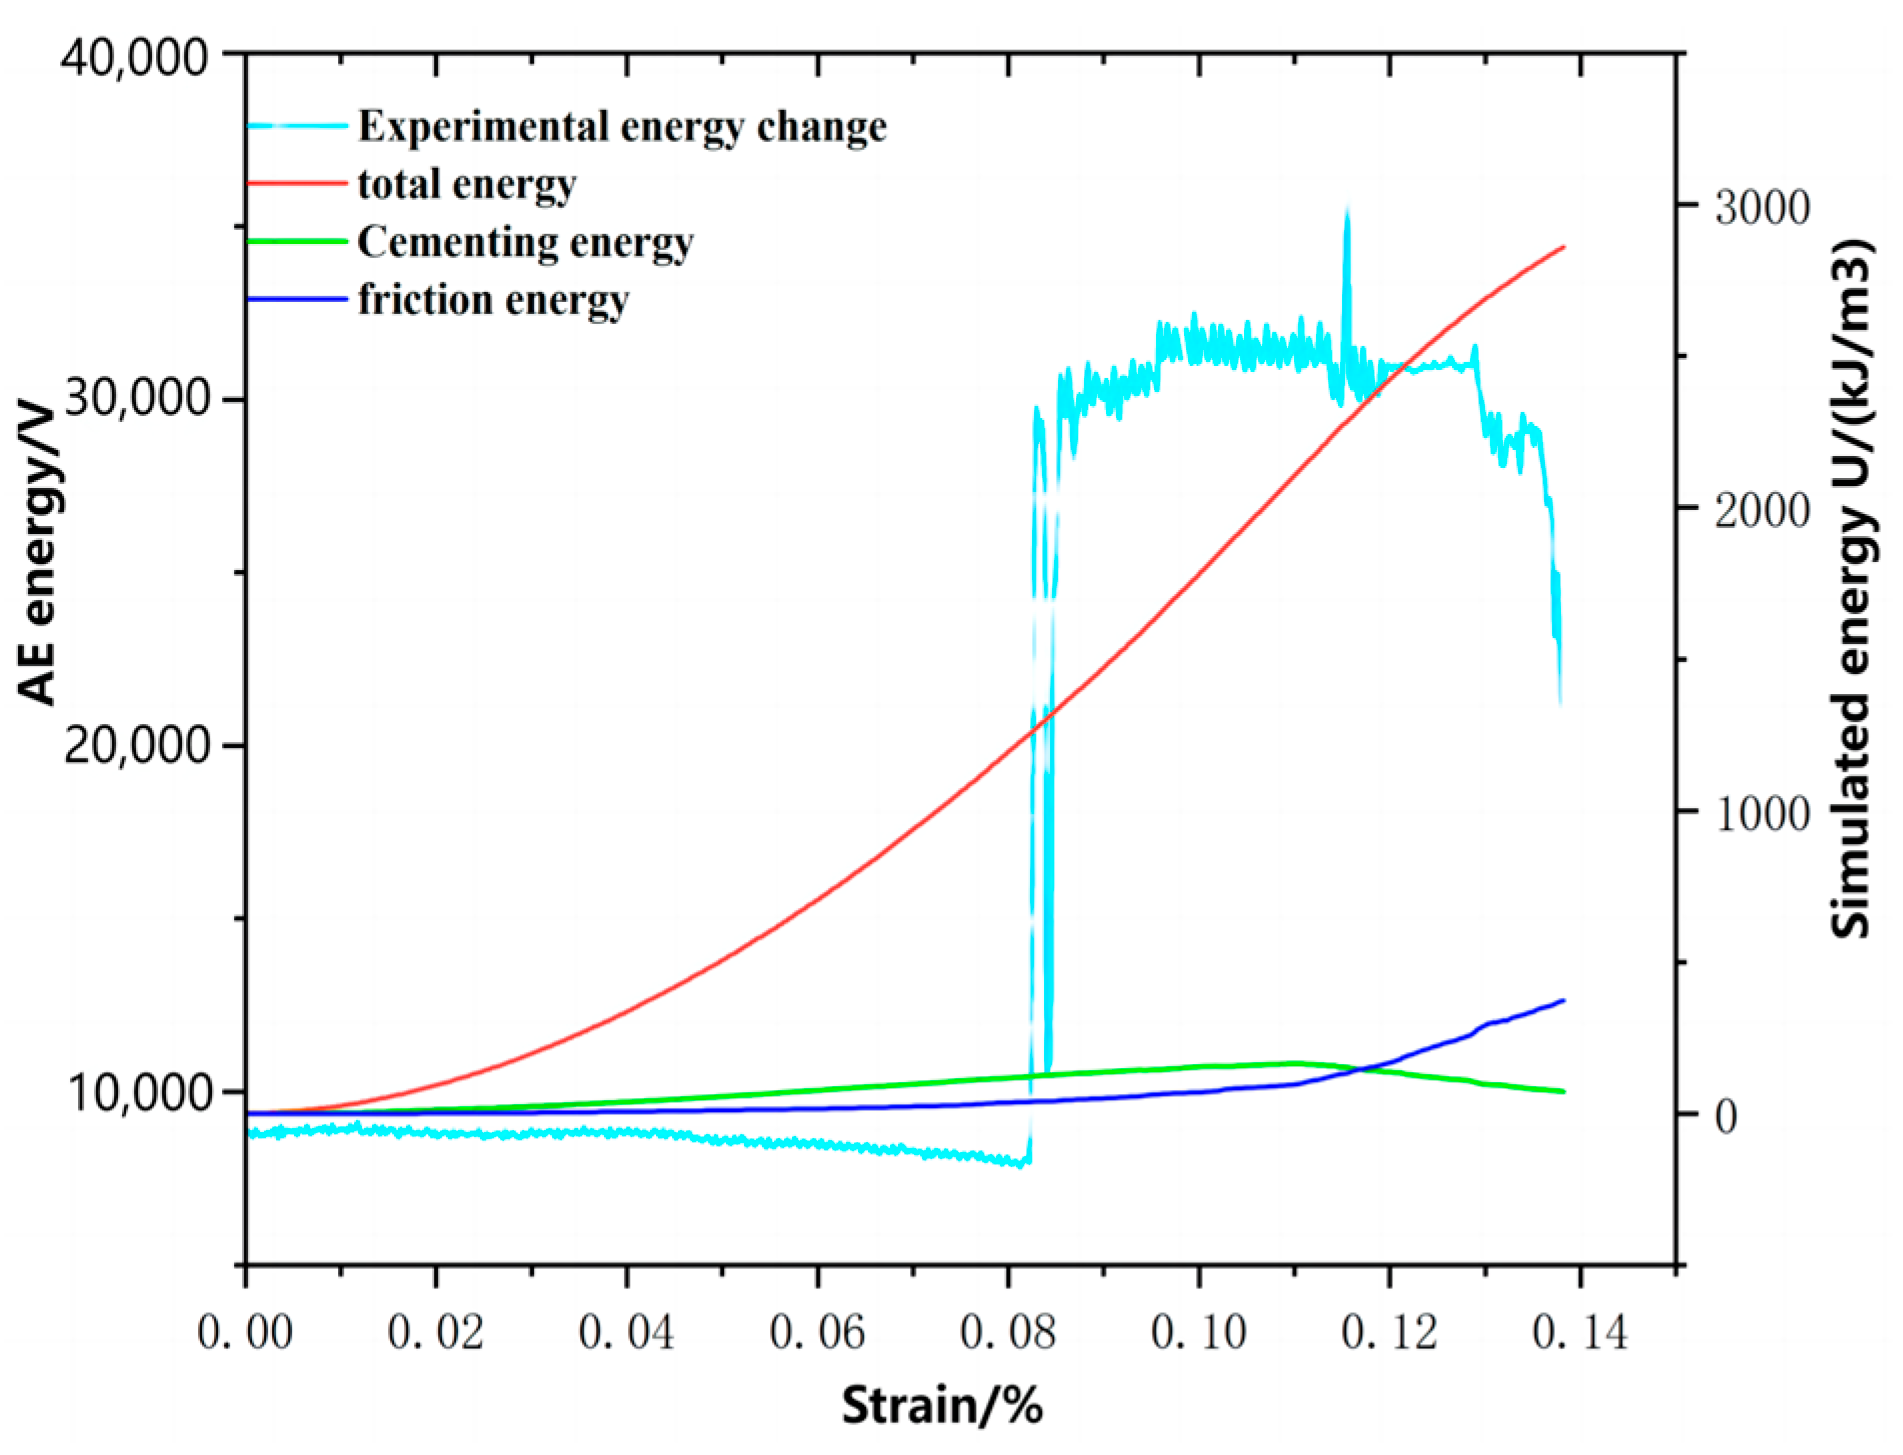
  • In the PFC2D simulation of the compression process, the acoustic emission increases before the stress peak and gradually decreases after reaching the maximum value, in agreement with the experimental data
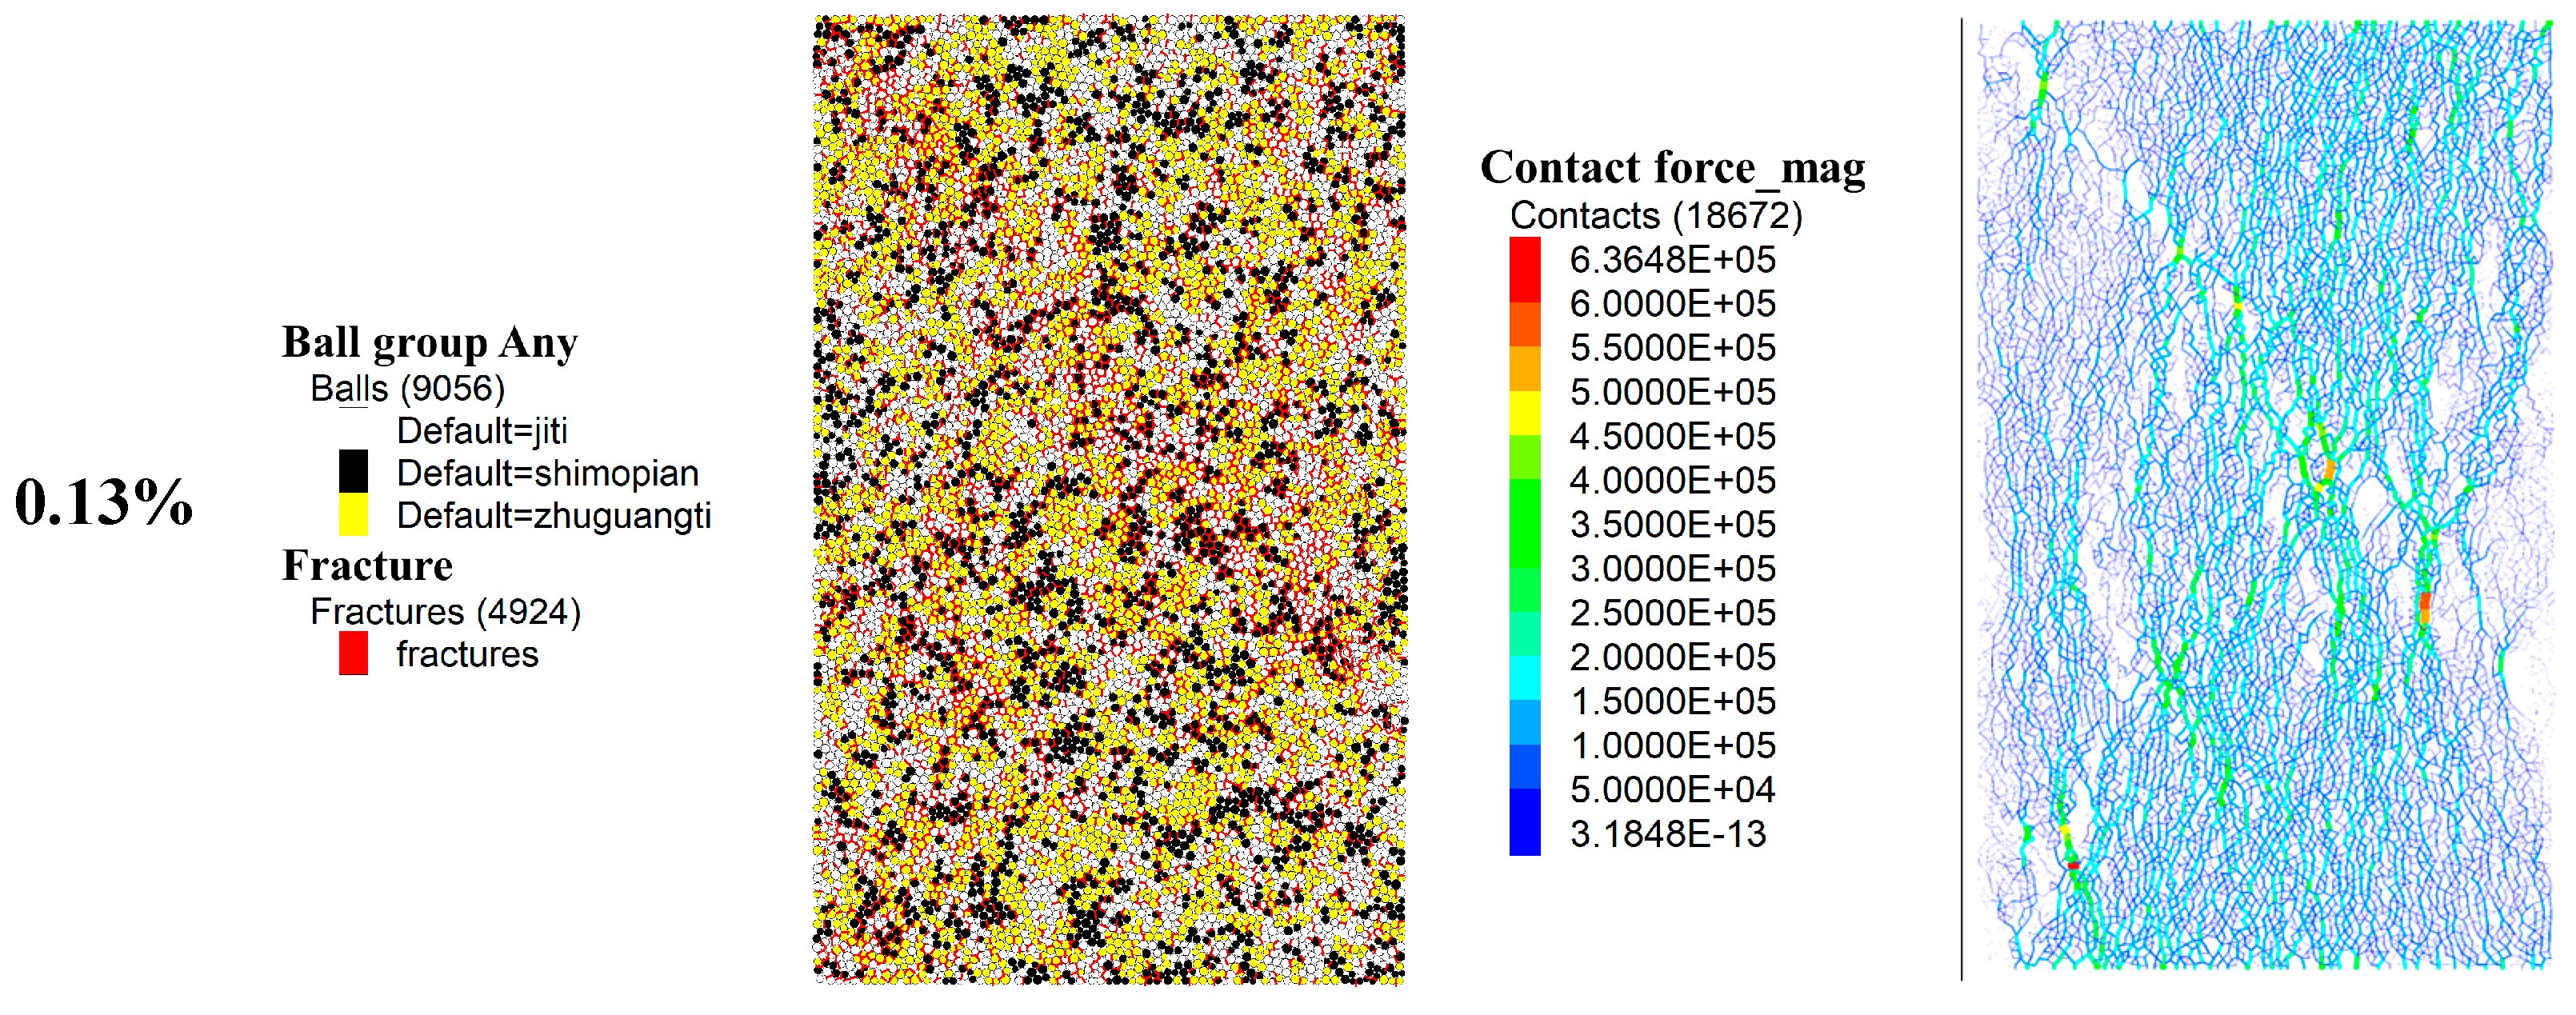
  • The uniaxial compressive stress–strain curves are divided into four stages, elastic, yield, damage, and residual, and the strong and weak force chains at different strains are analysed, and it is found that the strength of the force chain varies the most near the main crack line.
  • The essence of cast iron deformation and failure lies in the dissipation and release of internal energy. Utilising acoustic emission energy to monitor the energy release law throughout the entire damage process is a reasonable approach. Data analysis has revealed that the trends in bonding energy monitored by the GBM align with the energy collected through acoustic emission, effectively capturing the variation in acoustic emission energy observed in experiments.
In summary, the GBM established by PFC2D can effectively express the micro-damage mechanism and mode of uniaxial compression of grey cast iron HT150 specimens, providing a powerful method for the future micro-damage research of metal materials.

Author Contributions

Methodology, Z.L. (Zhen Li); Resources, S.X., H.S., B.L. and Z.Q.; Writing—original draft, Z.L. (Zhao Lei). All authors have read and agreed to the published version of the manuscript.

Funding

(1) Supported by the National Natural Science Foundation of China (NSFC) under the project title “Research on the evolution mechanism of force chain arch effect during dense moulding process of shiitake mushroom slag”, project approval number 52366018. (2) Ordos Science and Technology Bureau, “Research on Key Technology of Integrated Heat Supply by Combustion of Sandy Shrubs and Straw Mixed Grain”, Project No. YF20232302.

Data Availability Statement

The data that support the findings of this study are available on request from the corresponding author. The data are not publicly available due to privacy or ethical restrictions.

Conflicts of Interest

The authors declare that they have no known competing financial interests or personal relationships that could have appeared to influence the work reported in this paper.

References

  1. König, T.; Kimpel, T.; Kürten, D.; Kailer, A.; Dienwiebel, M. Influence of atmospheres on the friction and wear of cast iron against chromium plated steel at high temperatures. Wear 2023, 522, 204695. [Google Scholar] [CrossRef]
  2. Gómez, T.; Cuesta, I.; Alegre, J. Mechanical Property Prediction Based on Casting Process Simulation for Structural Parts in the Wind Gearbox Sector. Int. J. Met. 2023, 17, 3032–3052. [Google Scholar] [CrossRef]
  3. Hamilton, J.D.; Sorondo, S.; Li, B.; Qin, H.; Rivero, I.V. Mechanical behavior of bimetallic stainless steel and gray cast iron repairs via directed energy deposition additive manufacturing. J. Manuf. Process. 2023, 85, 1197–1207. [Google Scholar] [CrossRef]
  4. Chaus, A.S.; Čaplovič, Ľ.; Pokrovskii, A.I.; Sobota, R. Microstructure and ProPerties evaluation of ductile cast iron subjected to Hot Plastic deforMation and aMbient teMPerature coMPression. Arch. Metall. Mater. 2023, 68, 639–647. [Google Scholar] [CrossRef]
  5. Fan, L.; Hu, H.; Tang, X.; He, J.; Chen, W. Influence of microscopic effects on the static tensile strength of gray cast iron ht200 specimens. Adv. Mater. Sci. Eng. 2021, 2021, 6629413. [Google Scholar] [CrossRef]
  6. Du, K.; Li, X.; Tao, M.; Wang, S. Experimental study on acoustic emission (AE) characteristics and crack classification during rock fracture in several basic lab tests. Int. J. Rock Mech. Min. Sci. 2020, 133, 104411. [Google Scholar] [CrossRef]
  7. Li, S.; Wu, Y.; Li, W.; Li, P. Shear test on damage evolution of brick masonry based on acoustic emission technique. Constr. Build. Mater. 2021, 273, 121782. [Google Scholar] [CrossRef]
  8. Ma, S.; Liu, K.; Guo, T.; Yang, J.; Li, X.; Yan, Z. Experimental and numerical investigation on the mechanical characteristics and failure mechanism of cracked coal & rock-like combined sample under uniaxial compression. Theor. Appl. Fract. Mech. 2022, 122, 103583. [Google Scholar] [CrossRef]
  9. Song, Q.; Shi, J.; Chen, X. Acoustic Emission Characterization Analysis of Quasi-Static and Fatigue Compression Properties of Aluminum Foam. Processes 2023, 11, 998. [Google Scholar] [CrossRef]
  10. Park, H.; Hong, K.; Kang, J.S.; Um, T.; Knapek, M.; Minárik, P.; Sung, Y.-E.; Máthis, K.; Yamamoto, A.; Kim, H.-K. Acoustic emission analysis of the compressive deformation of iron foams and their biocompatibility study. Mater. Sci. Eng. C 2019, 97, 367–376. [Google Scholar] [CrossRef]
  11. Brown, J.A.; Vendra, L.J.; Rabiei, A. Bending properties of Al-steel and steel-steel composite metal foams. Metall. Mater. Trans. A 2010, 41, 2784–2793. [Google Scholar] [CrossRef]
  12. Ma, Q.; Tan, Y.-l.; Liu, X.-s.; Zhao, Z.-h.; Fan, D.-y.; Purev, L. Experimental and numerical simulation of loading rate effects on failure and strain energy characteristics of coal-rock composite samples. J. Cent. South Univ. 2021, 28, 3207–3222. [Google Scholar] [CrossRef]
  13. Zheng, J.; Jin, X.; Tian, K.; Zhou, Y. Acoustic emission and damage characteristics of anthracite under different conditions. Mater. Technol. 2021, 55, 213–218. [Google Scholar] [CrossRef]
  14. Xu, X.; Chen, L.; Gao, F.; Zhang, Z. Studies on loading rate effects and energy mechanism of granite. Chin. J. Solid Mech. 2015, 36, 154–163. [Google Scholar] [CrossRef]
  15. Mori, T.; Inuzuka, T.; Ismail, M.A.M.; Shaalan, H. AE Measurement via Rock Triaxial Compression Test and Rock Failure Simulation using PFC Analysis. In Proceedings of the ISRM International Symposium-Asian Rock Mechanics Symposium, Singapore, 29 October–3 November 2018; p. ISRM–ARMS10-2018-2155. [Google Scholar]
  16. Mirgal, P.; Singh, R.K.; Banerjee, S. Acoustic and fracture energy correlation in mode I fracture with concrete damage plasticity model and three-point bend experiment. J. Mater. Civ. Eng. 2023, 35, 04023002. [Google Scholar] [CrossRef]
  17. Saadat, M.; Taheri, A. Modelling micro-cracking behaviour of pre-cracked granite using grain-based distinct element model. Rock Mech. Rock Eng. 2019, 52, 4669–4692. [Google Scholar] [CrossRef]
  18. GB/T 228. 1-2010; Metallicmaterials—Tensiletesting—Partl: Method of Testat Room Temperature. Standards Press of China: Beijing, China, 2010.
  19. Liu, W.; Zhou, W.; Li, H. Acoustic emission characteristics of Pykrete under uniaxial compression. Cold Reg. Sci. Technol. 2022, 202, 103645. [Google Scholar] [CrossRef]
  20. ISO 945-1:2008; Microstructure of Cast Irons. Standards Press of China: Beijing, China, 1987.
  21. Tian, J.; Ye, F.; Li, Z.; Xu, Y. Investigation on Microstructure and Mechanism of In-situ Producing Grey Cast Iron Matrix Composite. Hot Work. Technol. 2013, 42, 97–99. [Google Scholar] [CrossRef]
  22. Xing, J.; Wang, Q. Study of Bainite/Martensite Structure in Grey Cast Iron. Hot Work. Technol. 2006, 35, 12–13. [Google Scholar] [CrossRef]
  23. Lei, B.; Zuo, J.; Coli, M.; Yu, X.; Li, Y.; Liu, H. Investigation on failure behavior and hydraulic fracturing mechanism of Longmaxi shale with different bedding properties. Comput. Geotech. 2024, 167, 106081. [Google Scholar] [CrossRef]
  24. Tian, W.; Yang, S.; Huang, Y.; Yin, P.; Zhu, Z.; Sun, B. Meso-fracture mechanism of granite specimens under high temperature and confining pressure by numerical simulation. Chin. J. Rock Mech. Eng 2022, 41, 1810–1819. [Google Scholar] [CrossRef]
  25. Lachart, P.; Tonn, B.; Stolz, E.; Esderts, A.; Masendorf, R. Prediction of Cross-Section-Dependent ADI Microstructures by Experimental Heat Treatment Simulation. Int. J. Met. 2024, 1–12. [Google Scholar] [CrossRef]
  26. Ljustina, G.; Larsson, R.; Fagerström, M. A FE based machining simulation methodology accounting for cast iron microstructure. Finite Elem. Anal. Des. 2014, 80, 1–10. [Google Scholar] [CrossRef]
  27. Li, X.; Li, Y.; Yang, C.; Zhang, L.; Li, Z.; Huang, T. Acoustic emission response characteristics and numerical simulation of soil failure under uniaxial compression. J. Appl. Geophys. 2024, 222, 105310. [Google Scholar] [CrossRef]
  28. Niu, Z.; Wang, X.; Zhang, L.; Wang, J.; Chang, Z.; Qian, C.; Chen, X. Investigation into the Failure Characteristics and Mechanism of Rock with Single Elliptical Defects under Ultrasonic Vibrations. Fractal Fract. 2024, 8, 261. [Google Scholar] [CrossRef]
  29. Song, X.; Yuan, Q.; Wang, S.; Dong, Z.; Hao, Y. Analysis on mechanical properties and mesoscopic acoustic emission characteristics of prefabricated fracture cemented paste backfill under different loading rates. Environ. Sci. Pollut. Res. 2023, 30, 24687–24707. [Google Scholar] [CrossRef] [PubMed]
  30. Li, K.; Zhang, F. Study on the Meso-Failure Mechanism of Granite under Real-Time High Temperature by Numerical Simulation. Appl. Sci. 2024, 14, 4575. [Google Scholar] [CrossRef]
  31. He, C.-S.; Wang, W.-W.; Tang, Y.-X.; Xue, Y.-J. Experimental Study on the Static Behavior and Recovery Properties of CFRP/SMA Composites. Sustainability 2023, 15, 13078. [Google Scholar] [CrossRef]
  32. Chai, F.; Ma, Z.; Han, X.; Hu, X.; Chang, Z.; Zhou, J. Effect of strain rates on mechanical behavior, microstructure evolution and failure mechanism of extruded-annealed AZ91 magnesium alloy under room-temperature tension. J. Mater. Res. Technol. 2023, 27, 4644–4656. [Google Scholar] [CrossRef]
  33. Liu, X.; Liu, Z.; Li, X.; Gong, F.; Du, K. Experimental study on the effect of strain rate on rock acoustic emission characteristics. Int. J. Rock Mech. Min. Sci. 2020, 133, 104420. [Google Scholar] [CrossRef]
  34. Yu, X.; Zuo, J.; Mao, L.; Xu, X.; Lei, B.; Zhao, S. Uncovering the progressive failure process of primary coal-rock mass specimens: Insights from energy evolution, acoustic emission crack patterns, and visual characterization. Int. J. Rock Mech. Min. Sci. 2024, 178, 105773. [Google Scholar] [CrossRef]
  35. Wan, L.; Jiang, T.; Wu, Q.; Dong, J.; Yu, Z. Critical slowing down characteristics of acoustic emission for fracture instability of sandstone down-slope rock bridge under cyclic wetting and drying. Theor. Appl. Fract. Mech. 2024, 131, 104372. [Google Scholar] [CrossRef]
  36. Liu, K.-D.; Zhou, Y.; Zhang, X.-P.; Fu, S.-J.; Liu, Q.-S.; Dong, P.; Yao, K.-W.; Wang, D.-B. Study on mechanical properties and acoustic emission characteristics of deep diorite under uniaxial compression. Heliyon 2024, 10, e24482. [Google Scholar] [CrossRef] [PubMed]
  37. Lai, X.; Fang, X.; Shan, P.; Gu, H.; Zhan, S.; Liu, X. Analysis of mechanical response mechanism and energy evolution characteristics of saturated coal with a single pre-existing hole. Geomech. Geophys. Geo-Energy Geo-Resour. 2024, 10, 103. [Google Scholar] [CrossRef]
  38. Huang, L.; Li, B.; Li, C.; Wu, B.; Wang, J. Research on anisotropic characteristics and energy damage evolution mechanism of bedding coal under uniaxial compression. Energy 2024, 301, 131659. [Google Scholar] [CrossRef]
  39. Wang, Y.; Zheng, X.; Jiao, H.; Cheng, F.; Zhao, H. Energy evolution mechanism and energy yield criterion in granite’s failure process. Explos. Shock Waves 2016, 36, 876–882. [Google Scholar] [CrossRef]
  40. Liu, W.; Yan, E.; Dai, H.; Du, Y.; Xiao, W.; Zhao, S. Study on characteristic strength and energy evolution law of Badong formation mudstone under water effect. Chin. J. Rock Mech. Eng. 2020, 39, 311–326. [Google Scholar] [CrossRef]
  41. Yu, H.; Liu, S.; Jia, H.; Wang, S. Mechanical response and energy dissipation mechanism of closed single fractured sandstone under different confining pressures. J. Min. Saf. Eng. 2020, 37, 385–393. [Google Scholar] [CrossRef]
  42. Xia, Z.; Yuan, H.; Li, H.; Yu, X.; Fang, X.; Huang, S. Energy Transfer and Damage Evolution Process Research of Ore Rock-Filling Body under the Blasting Load. Minerals 2022, 12, 1362. [Google Scholar] [CrossRef]
Figure 1. Experimental process.
Processes 12 01893 g001
Figure 2. (a) Microstructure XRD of grey cast iron; (b) the proportion of each organisation in the material; (c) grey cast iron metallographic micrograph.
Processes 12 01893 g002
Figure 3. Schematic diagram of the behaviour and components of (a) PBM and (b) SJM.
Processes 12 01893 g003
Figure 4. (a) Initial model; (b) the particles are divided into polygonal regions using the Voronoi algorithm; (c) particle-swarm-based grouping of material micro parameters, with OM physical map of the material on the far left and PFC comparison simulation in the middle.
Processes 12 01893 g004
Figure 5. The engineering stress–strain curve of cast iron HT150 under a uniaxial compression test.
Processes 12 01893 g005
Figure 6. Engineering stress–strain curves and AE ring-down count relationships at various com-pression rates: (a) 0.5 mm/s; (b) 1 mm/s; (c) 2 mm/s.
Processes 12 01893 g006
Figure 7. Distribution of AF and RA correlations for cast iron in different stages (I, II, III and IV) at different loading rates: (a) 0.5 mm/s; (b) 1 mm/s; (c) 2 mm/s.
Processes 12 01893 g007
Figure 8. RA-AF correlation density map with different loading rates: (a) 0.5 mm/s; (b) 1 mm/s; (c) 2 mm/s. (d) The proportion of cracks in specimens under different loading rates is different.
Processes 12 01893 g008
Figure 9. Comparison of the results of laboratory test and numerical simulation: (a) stress–strain curve; (b) failure mode and crack distribution.
Processes 12 01893 g009
Figure 10. Numerical simulations of acoustic emission counts for different phases (I, II, III and IV) at different rates: (a) 0.5; (b) 1; and (c) 2 mm/s.To study the spatio-temporal evolution of acoustic emissions and cracks, we divided the simulated stress–strain curve into four stages, corresponding to the four stages observed in the experiment, and recorded the evolution process at each stage. The acoustic emission counts and crack formation in the model were mainly caused by bond breakdown between the particles inside the crystal (see the red line segment in Figure 11). As seen in Figure 11, when the axial strain is 0.04%, cracks can be observed between particles within various grains. However, these cracks are widely dispersed and sparse, resulting in a low count of acoustic emissions. This simulates the situation when compressing the grey cast iron material in the experiment, where a small number of acoustic emission counts and tiny cracks are present at the beginning of loading due to the presence of microscopic cracks and pores within the material. Loading up to 0.08%, it can be observed from Figure 11 that the cracks appear mainly within the graphite flake crystals, at which point the acoustic emission counts start to slowly rise and become more dense. This corresponds to the experimental observation that after a period of loading, the graphite phase within the cast iron material begins to be compressed, generating a large number of stress waves that are detected by the acoustic emission equipment. As loading continues in the model, reaching a strain of 0.12%, cracks and acoustic emissions still predominantly occur within the graphite flake crystals. However, cracks begin to appear within the boundaries between pearlite crystals and graphite flakes, indicating the emergence of crack bands. At this stage, the acoustic emission count reaches its peak. Upon reaching the maximum load during experimentation, grey cast iron experiences a proliferation of quasi-cleaved surfaces and cracks propagating along grain boundaries, leading to plastic deformation and the rupture of the surrounding matrix. Final phase, extensive cracking and acoustic emission were observed in all crystals within the model, resulting in the formation of a 45-degree tilt crack band. Experimentally, the material eventually developed macroscopic cracks with a similar inclination following the penetration of minute cracks.
Processes 12 01893 g010
Figure 11. The spatio-temporal evolution of force chains, cracks, and acoustic emissions during the loading process is as follows: At 0.04% strain, cracks (indicated by red lines in the figure) are sparsely dispersed throughout the various crystals. At 0.08% strain, a large number of cracks appears within the graphite flake crystals, with minimal variation in the force chains observed in the model up to this point. By 0.12% strain, cracks emerge at the grain boundaries of pearlite and graphite flake crystals, indicating a trend towards crack band formation across the entire model, accompanied by a significant reduction in both strong and weak force chains. At 0.13% strain, clear crack bands appear throughout the model, with strong force chains concentrating in their vicinity.
Processes 12 01893 g011aProcesses 12 01893 g011b
Figure 12. Displacement field distribution after damage of a single cracked specimen under uniaxial compression: (a) tension; (b) shearing; (c) tension–shearing.
Processes 12 01893 g012
Figure 13. Numerical simulation of shear and tensile crack trends.
Processes 12 01893 g013
Figure 14. Comparison of energy trend change.
Processes 12 01893 g014
Table 1. Chemical composition of grey cast iron (weight%).
GradeCSiMnP≤S≤Cr<
HT1503.3–3.52.0–2.40.5–0.80.20.120.12
Table 2. Microscopic parameters of smooth joints.
Smooth Joint ParametersNormal Stiffness (sj_kn/Gpa)Shear Stiffness
(sj_ks/ Gpa)
Friction Coefficient (sj_fric)Normal Strength (sj_coh/N)Cohesive Force (sj_ten/N)
Count6.1 × 10136.1 × 1013 × 0.20.8178 × 106178 × 106 × 0.3
Table 3. Microscopic parameters of PFC.
Micro-ParametersValues
PearliteGraphite FlakeMatrix
Micro-properties of grey cast iron
Density (kg/m−3)270025602600
Elasticity modulus (emod/Gpa)55 × 10965 × 10950 × 109
Stiffness ratio (kratio)0.20.20.2
Friction coefficient (fric)0.550.550.55
Parallel bond elastic modulus (pb_emod/Gpa)55 × 10965 × 10950 × 109
Parallel bond stiffness ratio (kratio)0.30.20.25
Tensile strength of cement (pb_ten/N)23.14 × 10518.2 × 10520.15 × 105
Cementation and cohesion (pb_coh/N)165 × 105140 × 105155 × 105
Internal friction angle of cement (pb_fa/o)405030
Disclaimer/Publisher’s Note: The statements, opinions and data contained in all publications are solely those of the individual author(s) and contributor(s) and not of MDPI and/or the editor(s). MDPI and/or the editor(s) disclaim responsibility for any injury to people or property resulting from any ideas, methods, instructions or products referred to in the content.

