Article

The Valorization of Fruit and Vegetable Wastes Using an Anaerobic Fixed Biofilm Reactor: A Case of Discarded Tomatoes from a Traditional Market

by
Andrea Alvarado-Vallejo
1,
Oscar Marín-Peña
2,
Erik Samuel Rosas-Mendoza
1,
Juan Manuel Méndez-Contreras
1 and
Alejandro Alvarado-Lassman
1,*
1
División de Estudios de Posgrado e Investigación, Tecnológico Nacional de México/Instituto Tecnológico de Orizaba, Av. Oriente 9, 852. Col. Emiliano Zapata, Orizaba 94320, Veracruz, Mexico
2
Consejo Nacional de Humanidades, Ciencias y Tecnologías, Tecnológico Nacional de México/ITS de Misantla, Km 1.8 Carretera a Loma del Cojolite, Misantla 93821, Veracruz, Mexico
*
Author to whom correspondence should be addressed.
Processes 2024, 12(9), 1923; https://doi.org/10.3390/pr12091923
Submission received: 9 August 2024 / Revised: 1 September 2024 / Accepted: 5 September 2024 / Published: 6 September 2024
(This article belongs to the Special Issue Biomass to Renewable Energy Processes, 2nd Edition)

Abstract

:
Tomato waste, characterized by high organic matter and moisture content, offers a promising substrate for anaerobic digestion, though rapid acidification can inhibit methanogenic activity. This study investigated the performance of a 10.25 L anaerobic fixed biofilm reactor for biogas production using liquid tomato waste, processed through grinding and filtration, at high organic loading rates, without external pH control or co-digestion. Four scouring pads were vertically installed as a fixed bed within a fiberglass structure. Reactor performance and buffering capacity were assessed over three stages with progressively increasing organic loading rates (3.2, 4.35, and 6.26 gCOD/L·d). Methane yields of 0.419 LCH4/gCOD and 0.563 LCH4/g VS were achieved during the kinetic study following stabilization. Biogas production rates reached 1586 mL/h, 1804 mL/h, and 4117 mL/h across the three stages, with methane contents of 69%, 65%, and 72.3%, respectively. Partial alkalinity fluctuated, starting above 1500 mg CaCO3/L in Stage 1, dropping below 500 mg CaCO3/L in Stage 2, and surpassing 3000 mg CaCO3/L in Stage 3. Despite periods of forced acidification, the system demonstrated significant resilience and high buffering capacity, maintaining stability through hydraulic retention time adjustments without the need for external pH regulation. The key stability indicators identified include partial alkalinity, effluent chemical oxygen demand, pH, and one-day cumulative biogas. This study highlights the effectiveness of anaerobic fixed biofilm reactors in treating tomato waste and similar fruit and vegetable residues for sustainable biogas production.

1. Introduction

Tomato is a vegetable crop native to Mesoamerica and a fundamental ingredient in Mexican and global cuisine. With an annual production of 4.27 million tons, Mexico ranks as the tenth-largest global producer of tomatoes, significantly contributing to the waste generated by its high consumption and production [1,2]. The year-round availability of tomatoes throughout the year, along with their processing into sauces, juices, and canned goods, increases the generation of solid waste. This waste, estimated at 94,000 tons annually in Mexico, often ends up in open landfills, where its decomposition produces greenhouse gases and leachates that contaminate soil and water sources, negatively impacting ecosystem health [3,4].
Waste disposal methods for tomato waste include technologies such as incineration. However, these practices continue to emit greenhouse gases, lack long-term sustainability, and do not enable the recovery of valuable resources. Another common strategy is composting, which reduces the volume of waste, stabilizes organic matter, and provides nutrients that improve soils and promote plant growth [3,5]. Nevertheless, anaerobic digestion is a more promising alternative for bioenergy production, particularly due to the high organic matter and moisture content of tomato waste. This technique offers a sustainable and beneficial solution from the environmental, economic, and social perspectives, especially in developing countries [6,7].
While the anaerobic digestion of fruit and vegetable waste (FVW) has been extensively researched, several challenges still arise, including acidification, imbalances in the carbon-to-nitrogen (C/N) ratio, inhibition by toxic compounds, and foam formation [8]. These issues are related to the low pH of the substrates, which makes pH control difficult during reactor operation [9,10,11]; the low nitrogen content, which leads to rapid degradation and nitrogen deficiency for biomass growth [10,12,13]; rapid hydrolysis resulting in ammonia and volatile fatty acid (VFA) accumulation, which can be toxic to methanogenic bacteria at high concentrations [14,15]; and inhibition caused by high organic loading rates (OLRs), leading to the accumulation of undegraded organic compounds [8].
To overcome these complications, some authors recommend co-digestion with other substrates, which can supply macro- and micronutrients, balance the C/N ratio, dilute inhibitors, and improve process stability compared to mono-digestion [16,17,18]. However, both FVW mixtures and co-digestion introduce inherent complexity in achieving optimal removal efficiencies in the anaerobic process. The operational conditions for anaerobic digestion with FVW mixtures often depend significantly on seasonal and geographical variations in the process site, which alter the characteristics of the FVW substrate, making it challenging to ensure consistent biodegradability before system operation. These variations often constitute a significant obstacle to effective anaerobic digestion treatment [10,19]. It is noteworthy that no studies in the literature demonstrate the efficient digestion of FVW with biogas production in short times, without the addition of substrates or chemicals to regulate pH and avoid rapid acidification, VFA production, and subsequent reactor failure.
Given its constant availability from agriculture and the food industry, tomato waste can be evaluated as a mono-substrate for anaerobic digestion, ensuring the stable supply of raw material and facilitating the long-term planning and operation of the system. This abundance of waste allows for experimentation with various concentrations and organic loading rates, which is crucial for assessing the reactor’s capacity to withstand different operational conditions and determining the system limits in terms of acidification and stability. Studying the reactor tolerance to high organic loads and acidification will provide key insights into the feasibility and effectiveness of using tomato waste as the sole substrate in anaerobic digestion. Additionally, the liquid fraction of tomato waste, which constitutes over 95% of the total, can be utilized to avoid solid saturation in the anaerobic process.
To address these challenges, the advantages of anaerobic fixed biofilm reactors (AFBRs) over other anaerobic reactor configurations can be leveraged to prevent the acidification of the mixed liquor within the reactor. One of the key advantages of AFBRs is their ability to retain active biomass by adhering microorganisms to an inert support, improving the retention of essential microorganisms for anaerobic decomposition [20]. These fixed biofilms are more resistant to being washed out of a treatment system under organic and hydraulic shock loads and other fluctuations in wastewater characteristics [21]. Additionally, the fixed biofilm creates micro-zones or microenvironments where different pH conditions can coexist within the reactor. These zones favor the growth of specific microorganisms for each stage of anaerobic digestion, optimizing substrate degradation [22,23,24]. Micro-zones with higher pH protect methanogenic bacteria, which consume excess VFAs.
Therefore, this study aimed to evaluate the feasibility of treating the liquid fraction of tomato waste from a traditional market using an AFBR without pH control or co-digestion. By applying various OLRs and monitoring key indicators, this study aimed to demonstrate the AFBR’s capacity to manage high loads of easily biodegradable substrates, its resilience to acidification, and its ability to recover with simple adjustments in hydraulic retention time (HRT). Furthermore, easily measurable parameters were evaluated as indicators of system instability, providing valuable tools for monitoring and controlling similar processes, both with tomato waste and other fruit and vegetable substrates, even on a larger scale. This approach offers a viable alternative for the efficient treatment of organic waste, particularly waste with high moisture and organic matter content, contributing to environmental impact mitigation and bioenergy generation.

2. Materials and Methods

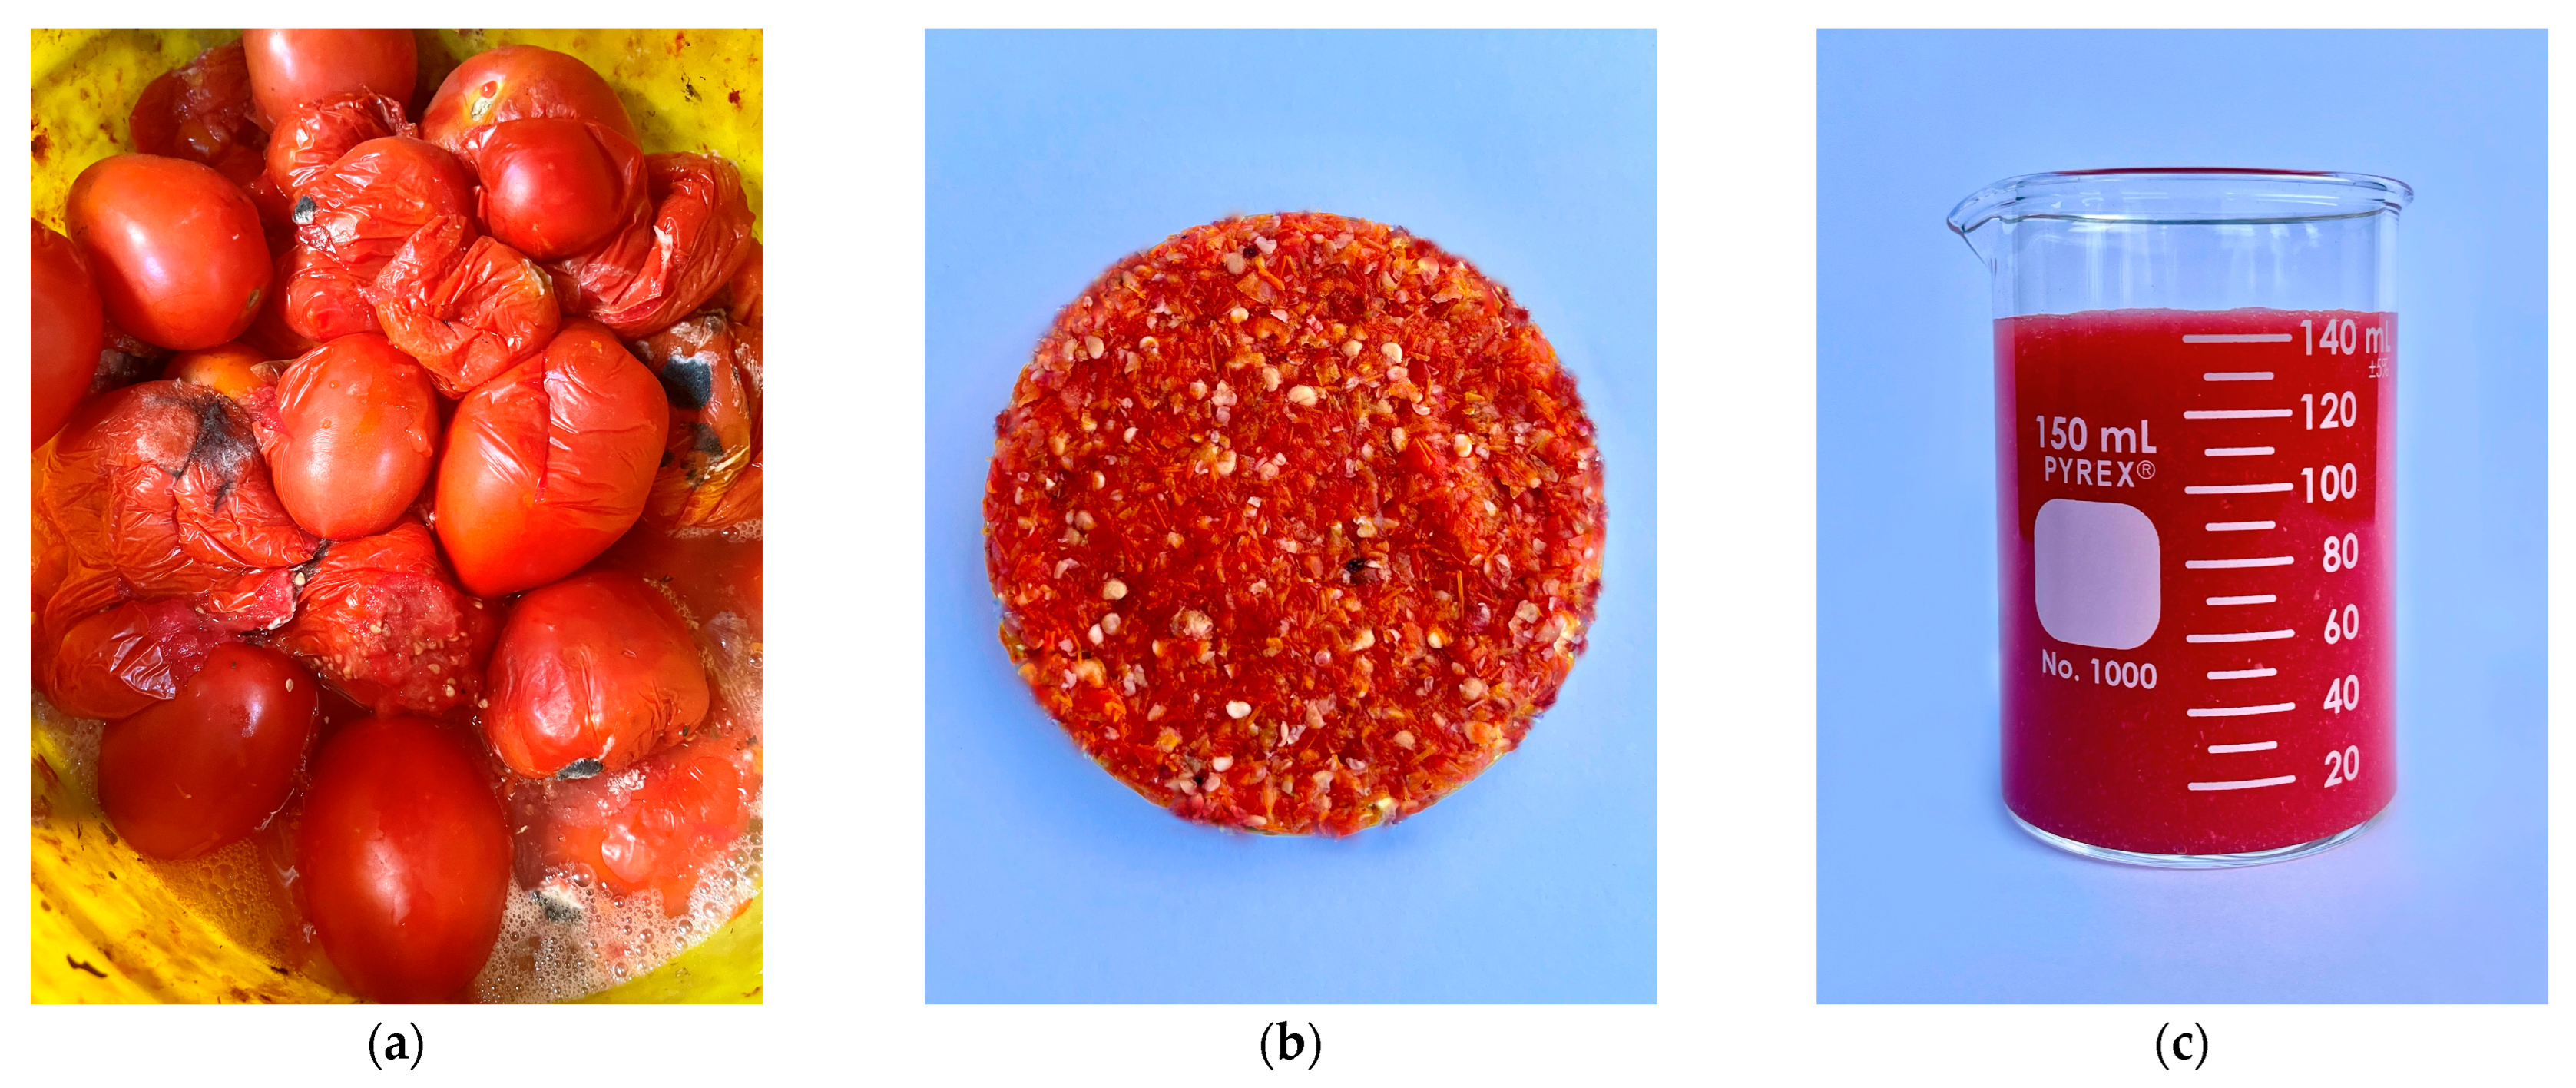
2.1. Tomato Waste and Inoculum Collection

This study was conducted at the Environmental Engineering Laboratory I of the National Technological Institute of Mexico, Orizaba Campus, located in Orizaba, Veracruz, Mexico, where the average temperature is 22 °C. Tomato waste was collected from a traditional market in Orizaba, Veracruz. This market, consisting of approximately 1400 establishments, generates an average of 15 tons of waste per day, 90% of which is organic. The tomato variety studied, the most common in Mexico, is known as Saladette or Roma (Solanum lycopersicum).
The anaerobic inoculum was sourced from a pilot-scale anaerobic biofilm reactor at the pilot plant for municipal solid waste utilization, located at the National Technological Institute of Mexico/Technological Institute of Orizaba.

2.2. Substrate Pretreatment

This study evaluated the utilization of the liquid fraction of tomato waste, as over 95% of its composition is liquid, with the solid fraction representing a minimal proportion. Figure 1 shows a flow diagram of the process for obtaining the liquid fraction of tomato waste. Utilizing the liquid fraction has advantages over using ground tomatoes, primarily by preventing potential solid saturation in the AFBR.
To obtain the liquid fraction, the required amount of waste was collected daily, depending on the feeding volume. For instance, approximately 0.85 kg of waste was needed to produce 500 mL of the liquid fraction, 1.25 kg for 700 mL, and 1.55 kg for 900 mL. The collected tomato waste was first pretreated using a Black & Decker commercial blender (model BL1000BG, Black & Decker®, Baltimore, MD, USA) to grind the waste, followed by a filtration stage.
In the filtration stage, two liquid fractions of tomato waste were obtained. The first liquid fraction of tomato waste (TWLF1) was produced by filtering the ground waste through a 1 mm MESH No. 18 sieve (ASTM E-11-70) [25], effectively removing larger solid particles, with an average filtration efficiency of approximately 95.29 ± 2.16% based on weight reduction (average of 20 batches). The second liquid fraction (TWLF2) was obtained by subjecting TWLF1 to additional filtration through a 0.05 mm MESH No. 270 screen, further refining the liquid fraction by removing finer particles, achieving an estimated filtration efficiency of 94 ± 2.5%. The solid fraction was separated, and the liquid fraction was used immediately to feed the reactor. Figure 2 illustrates the tomato residue in its different forms throughout the liquid fraction extraction process.

2.3. The Experimental Design of the Anaerobic Process

In Figure 3, a schematic of the AFBR and its components can be observed.
The anaerobic reactor has a diameter of 26.8 cm and a height of 35 cm, with a total volume of 10.25 L. The biogas chamber occupies 1.53 L, leaving a working volume of 8.4 L. The outlet valve is located at a height of 27.5 cm, determining the liquid level inside the reactor.
The AFBR fixed-bed system consists of an internal fiberglass structure with a diameter of 20.5 cm and a height of 25 cm, which supports four scouring pads (Scotch-Brite 96 Green) via slots at both ends of the structure. These scouring pads, each with dimensions of 15.9 × 23 cm, a thickness of 8.4 mm, and a weight of 27.21 g, are installed vertically with gaps between them, as shown in Figure 2. This arrangement maximizes the surface area available for bacterial adhesion and ensures uniform flow distribution through the reactor. By allowing the entire surface of the pads to come into contact with the substrate, it avoids dead zones or preferential flow paths and minimizes solid accumulation. This configuration helps reduce the risk of clogging and fixed-bed collapse due to excess biomass or hydraulic forces, thereby promoting a higher density of the biofilm.
A peristaltic pump model B6-3L/DZ25 (Boading Shenchen Precision Pump, Baoding, China) was used for substrate feeding and recirculation.

2.4. Operating Conditions

The AFBR was fed semi-continuously, with the hydraulic retention time (HRT) varying between 1 and 4 days. Adjustments in feeding intervals were made when mixed liquor inside the reactor was observed. These adjustments aimed to mitigate the effects of acidification by allowing the microbial community sufficient time to process the accumulated volatile fatty acids. When the reactor was operating stably, the HRT was maintained at 1 day. However, during significant acidification events, the HRT was extended to 4 days to allow for stabilization. The operating conditions for each phase of the experiment are summarized in Table 1.
The AFBR startup phase lasted 68 days, with recirculation every 12 h at a flow rate of 300 mL/min. During this period, 1910 mL of concentrated tomato liquid fraction substrate (TWLF2) was combined with 5200 mL of diluted anaerobic sludge containing 47.8 gVS. After the startup phase, the suspended biomass inside the AFBR was removed, and biogas production by the adhered biomass was verified.
Following startup, the initial semi-continuous phase began. The anaerobic reactor was fed semi-continuously with 125 mL of TWLF2 for 7 days, increasing to 250 mL for 5 days to evaluate the reactor’s degradation capacity. After the confirmation of the reactor performance, the stabilization phase with TWLF1 commenced, with 500 mL of TWLF1 being fed over 114 days with residence times ranging from 1 to 8 days. After the stabilization phase, 500 mL of TWLF1 was fed, and the reactor was left without feeding for 48 days to allow for the complete consumption of the substrate and to assess biogas and methane production.
Following these preliminary and stabilization phases, three operational stages were conducted to evaluate three different OLRs by varying the feed flow of the tomato liquid fraction. In the first stage, 500 mL of the substrate was fed with an OLR of 3.2 gCOD/L·d. In the second stage, the feed increased to 700 mL with an OLR of 4.35 gCOD/L·d. In the third stage, the feed was raised to 900 mL, corresponding to an OLR of 6.26 gCOD/L·d. The volatile solid (VS) content of TWLF1 was characterized, with a ratio of 1 gCOD = 1.34 gVS. Thus, the OLRs in gVS/L·d were 4.29, 5.83, and 8.39, respectively, for each stage.

2.5. Monitoring and Physicochemical Analysis

Samples were collected from both the inlet and outlet of the anaerobic reactor to assess its performance. The monitored parameters included pH, chemical oxygen demand (COD), soluble COD (sCOD), total solids (TSs), volatile solids (VSs), alkalinity, and biogas. The pH was measured using a digital pH meter with Buffer pH 0.14 LCD Xto. TSs and VSs were analyzed using the gravimetric method following the guidelines of NMX-AA-034-SCFI-2015. COD and sCOD were analyzed using an HACH spectrophotometer at 620 nm, (HACH®, Loveland, CO, USA). Biogas production was measured using the widely employed liquid displacement method, where the displaced volume of water directly corresponds to the volume of biogas produced. Methane content was determined by gas chromatography using a Buck 310 chromatograph (Buck Scientific Instruments, LLC., Norwalk, CT, USA). The portions of alkalinity (partial and intermediate alkalinity) were determined using the methodology proposed by Ripley et al. [26]. Table 2 summarizes the physicochemical analyses performed and their corresponding reference methods.

2.6. Statistical Analysis

Basic statistical analyses were performed to ensure the reliability and reproducibility of the experimental results. All measurements for key parameters, including pH, chemical oxygen demand (COD), volatile solids (VSs), total solids (TSs), and alkalinity, were conducted in triplicate. The average values and their corresponding standard deviations were calculated to assess data variability and ensure precision in the results.
In addition to this, biogas production data were analyzed by comparing the observed values against theoretical calculations based on COD input, allowing for the validation of biogas yields. These comparisons were essential in confirming the consistency of the reactor’s performance under varying organic loading rates.
All statistical calculations, including averages, standard deviations, and theoretical biogas yield estimations, were performed using Microsoft Excel® 2019 MSO.

3. Results and Discussion

3.1. Substrate Characterization Results

The proportion of liquid fraction (TWLF1) obtained from the grinding and filtering of whole tomato residue was 95.29 ± 2.17% (average of 20 batches).
Table 3 presents the average values of the key physicochemical characteristics of the tomato waste liquid fraction.
The acidic pH of the tomato waste liquid fraction, averaging 4.36, is attributed to the presence of organic acids such as citric and malic acids. Adjusting the pH of substrates like these is crucial for enhancing the buffer capacity of the anaerobic digestion process and preventing the accumulation of VFAs [31]. Although sodium hydroxide (NaOH) is commonly used to increase pH, its use can be problematic, as pH drops may arise from underlying issues not resolved by alkali addition [32,33]. Notably, in this study, the three organic loading rates were evaluated without the need for pH adjustment through alkali addition.
The chemical oxygen demand (COD) of 58.44 g/L indicates a substantial concentration of biodegradable organic matter, suggesting significant biogas production via anaerobic digestion. However, such a high COD level may require an extended hydraulic retention time (HRT) in the reactor to ensure the complete degradation of the organic matter and to avoid VFA accumulation. The soluble COD (sCOD) value of 46.70 g/L reflects that most of the organic matter is in a soluble state, enabling easier microbial assimilation and promoting efficient biogas generation. This high sCOD also simplifies anaerobic digestion by reducing the risk of non-biodegradable solid accumulation in the reactor.
The volatile solid (VS) content of 87.75% further underscores the biogas production potential of the tomato waste liquid fraction. The total solid (TS) content of 3.95 g/L indicates a low solid content, which facilitates the handling and pumping of the substrate. A low TS concentration improves mass and nutrient transfer within the anaerobic reactor, minimizing the need for pretreatment. The initial ash content was measured at 12.25%, a level of inorganic material that did not significantly affect the AFBR performance throughout the operational stages.
As observed, the high moisture content (96.05%) indicates that the majority of the material processed is in liquid form. This high liquid content allows the system to handle higher organic loads without solid accumulation issues. Despite this, the natural characteristics of the tomato waste result in a high concentration of organic matter, as evidenced by the elevated COD values.

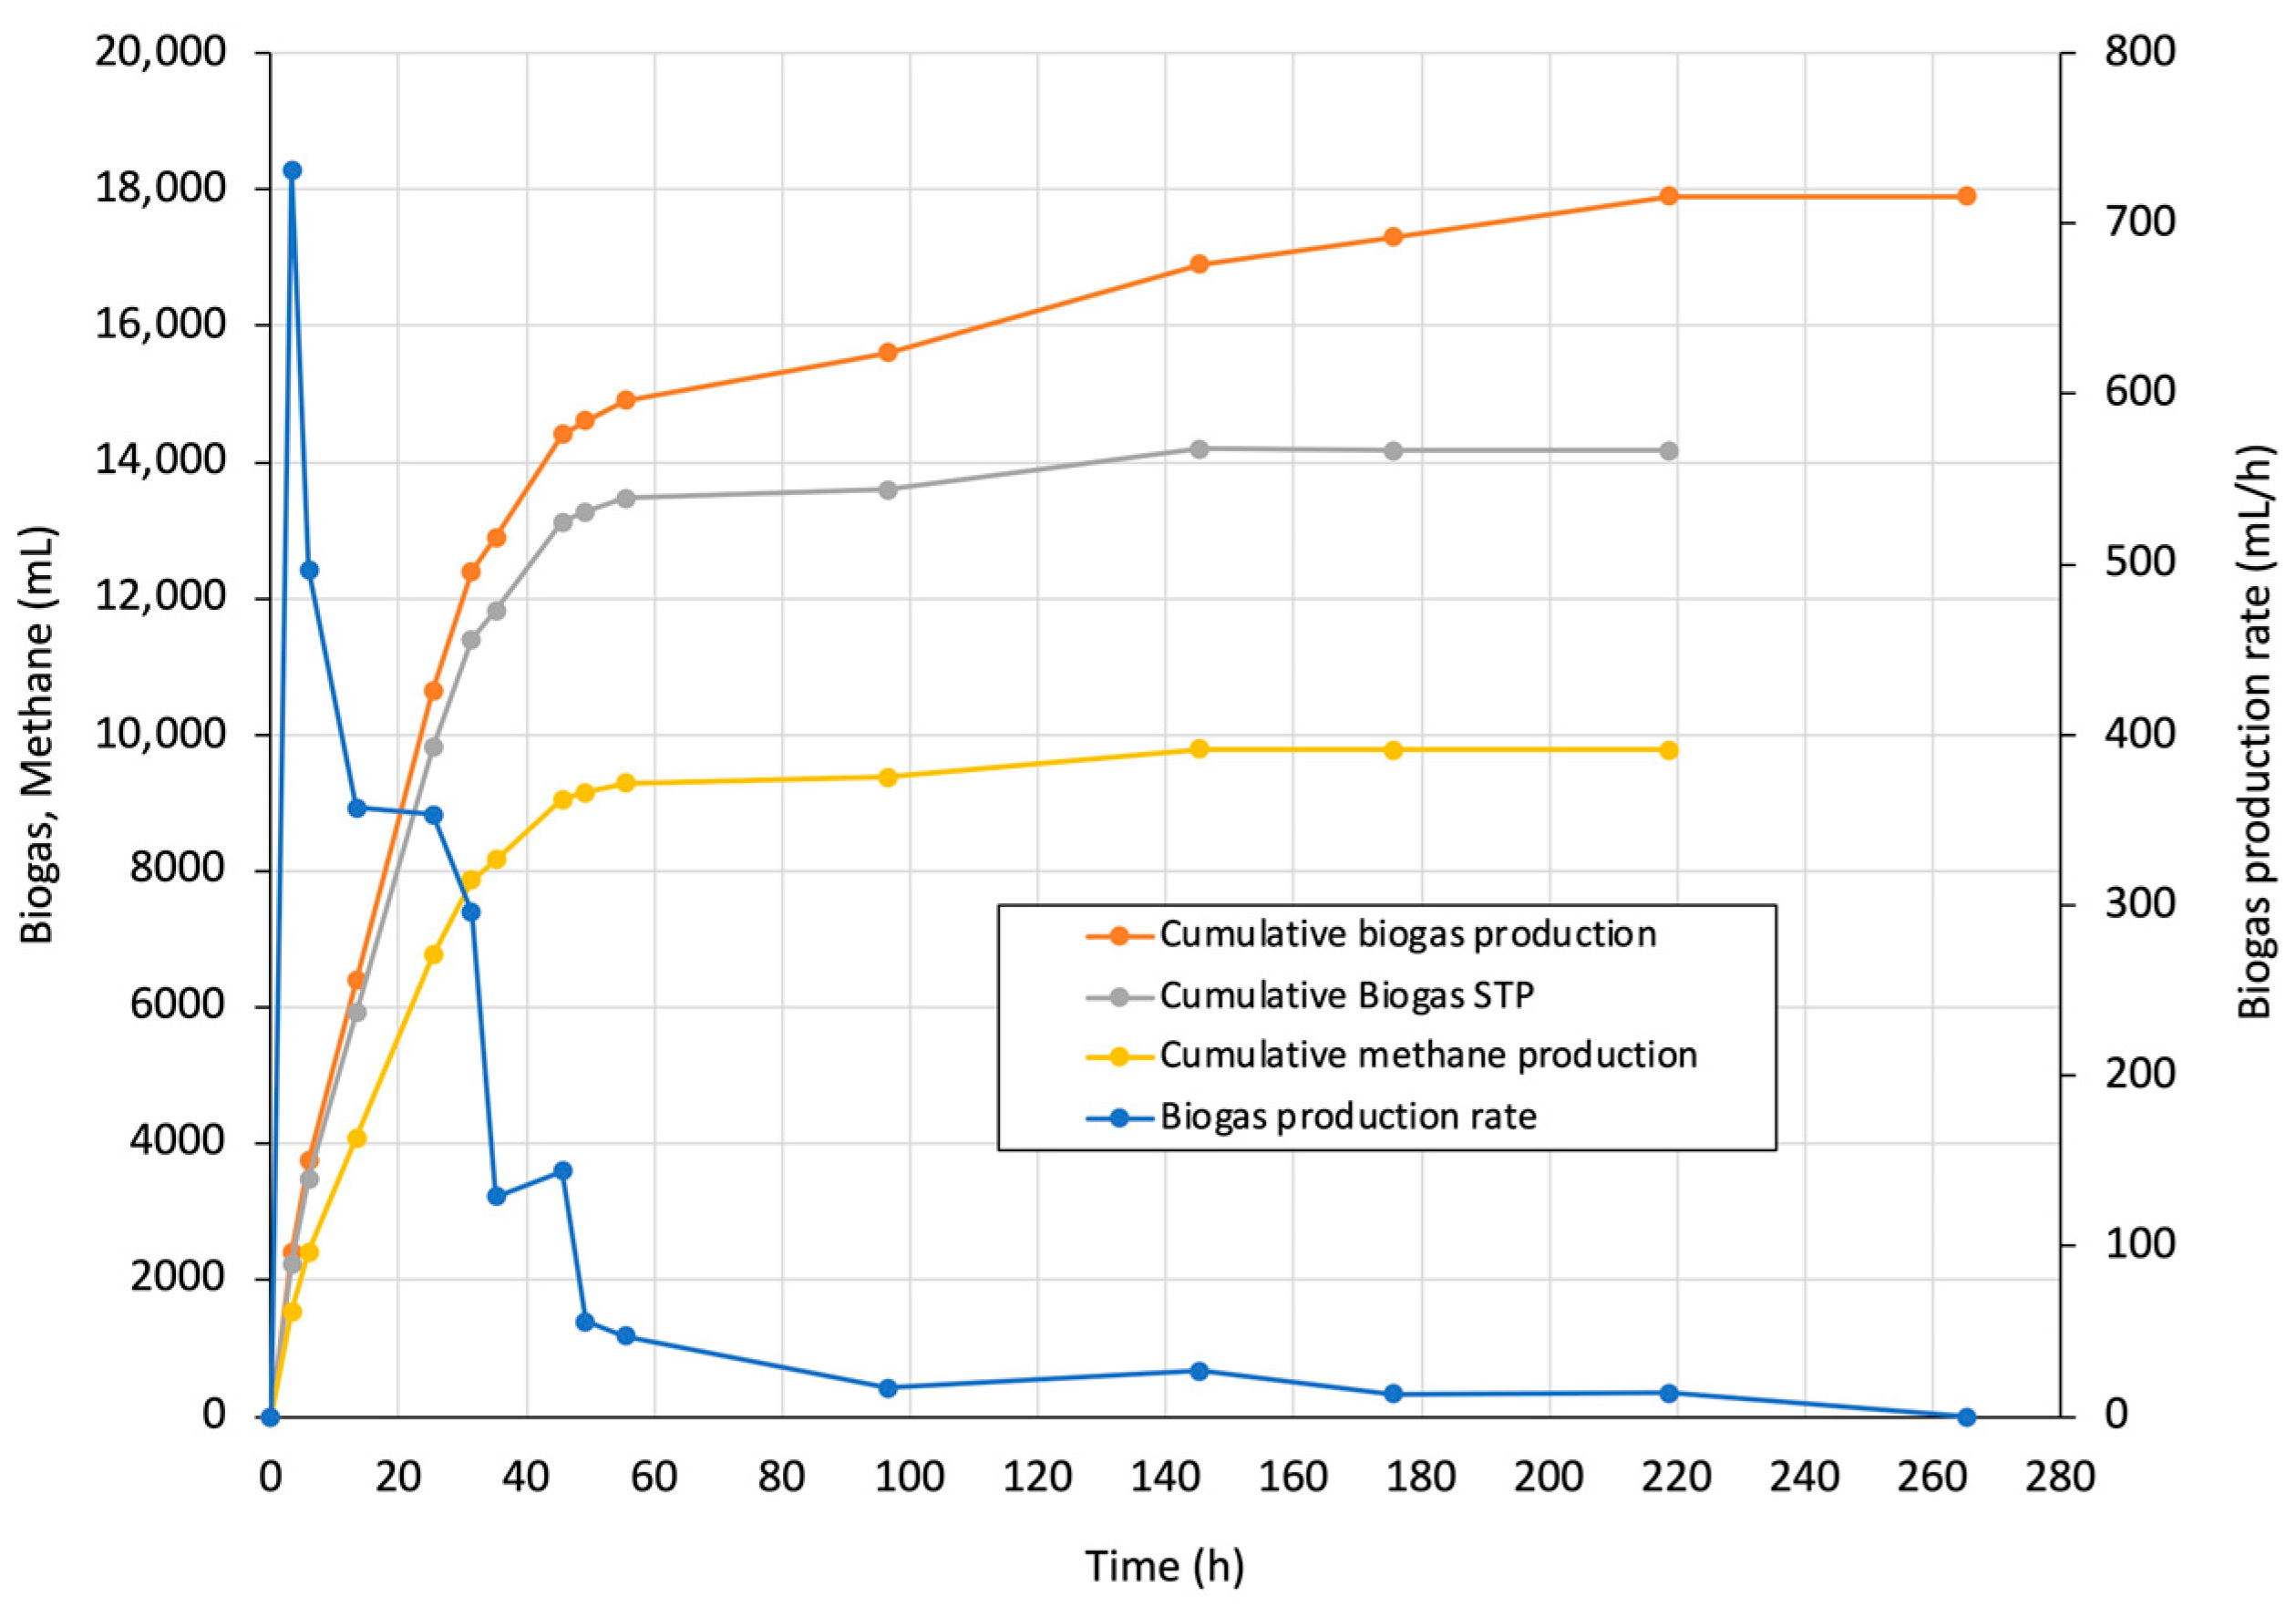
3.2. Startup Phase Evaluation

Figure 4 illustrates the behavior of the AFBR during the kinetic study before variations in organic load, when the reactor was fed with 500 mL of tomato liquid fraction (TWLF1) and then maintained without feeding for 48 days to deplete the substrate and monitor biogas and methane production.
During the initial hours of operation, the reactor demonstrated significant efficiency in biogas and methane production. The biogas production rate peaked at 731.04 mL/h between 3 and 4 h, then rapidly decreased to values below 100 mL/h within less than 50 h of operation, indicating the high biodegradability of the tomato liquid fraction. Biogas production remained low even after substrate depletion due to endogenous respiration, which was calculated from the biogas production rate curve at 13.2 mL/h. After adjusting for endogenous respiration, the cumulative biogas and methane curves were obtained using the methane concentration in the biogas, which was 69% in this case. Consequently, the cumulative methane production was 9776 mL. This value was validated by performing a mass balance, which accounted for the initial COD inside the reactor, the COD fed, and the residual COD at the end of the period, applying a factor of 0.35 LCH4/g COD removed. Based on the organic matter fed as COD and VSs, methane production was calculated to be 0.419 LCH4/g COD and 0.563 LCH4/g VS, respectively. These values are comparable to or exceed those reported in the anaerobic digestion of FVW, such as in the study by Nagao et al. [34], which achieved a methane yield of 0.455 LCH4/g VS under high-load mesophilic conditions, and in the study by Edwigies et al. [35], which reported a yield of 0.360 LCH4/g VS in the treatment of FVW using a semi-continuously operated continuous stirred tank reactor (CSTR).

3.3. Operation Stages at Different OLRs

3.3.1. Stage 1: Semi-Continuous with 500 mL of TWLF1

Figure 5 illustrates the behavior of the AFBR during the first stage (500 mL of TWLF1, 3.2 gCOD/L·d) out of the three stages with varying OLR.
During the first 12 days, the reactor exhibited an adaptation phase, with a peak biogas production rate of 409.28 mL/h occurring on day 4. This behavior can be attributed to the prior conditions of the AFBR, which was previously fed with 500 mL of TWLF1 and operated in discontinuous recirculation for 48 days. Starting from day 12, the AFBR began producing greater amounts of biogas, with higher peaks recorded on day 14 (1427.17 mL/h) and day 16 (1277.14 mL/h), although fluctuations were observed. Between days 16 and 22, the HRT was increased to 3 days to mitigate a trend toward acidification in the reactor. Following this adjustment, the AFBR once again achieved higher biogas production rates, reaching a maximum value of 1586 mL/h on day 23, showing the first signs of adaptation and recovery under these organic loading conditions. This recovery trend is reflected in the exponential trend line shown in Figure 5.
During this initial stage, the average methane concentration in the biogas was 69%. The behavior observed during the early days of operation is consistent with the findings by Edwiges et al. [36], who gradually increased the organic load from 0.5 to 5.0 kgVS/m³·d. Their study suggested that biogas production and methane concentration (43–65%) were initially low due to the low content of soluble organic matter in the inoculum. Similarly, Masebinu et al. [37] reported that biogas yield during the early stages of operation tends to be unstable, with high peaks and sudden drops. This instability was attributed to the acclimatization process of the microbial community, a phenomenon that was also observed in the first 12 days of our study. Comparable to the 69% CH4 content obtained during our study, Masebinu et al. [37] also achieved high CH4 content during the startup phase facilitated by the low OLR that allowed for complete substrate degradation. This indicates that the microbial community present in the initial inoculum was active and successfully adapted during the early phase.

3.3.2. Stage 2: Semi-Continuous with 700 mL of TWLF1

In the second stage, the OLR of the AFBR was increased to 4.35 gCOD/L·d with a feed of 700 mL of TWLF1 (Figure 6). At the beginning of this stage, a significant increase in the biogas production rate was observed compared to the last days of the previous stage, with a peak generation of 1476.38 mL/h on day 28.
Over the next 8 days, despite maintaining a biogas production rate above 1000 mL/h, a downward trend was observed, eventually falling below 500 mL/h by day 38. This decline can be attributed to the accumulation of degradation products from the tomato waste. This substrate is rich in easily fermentable sugars and organic acids. With the increase in organic load, the initial microbial communities, primarily fermentative bacteria, rapidly broke down these compounds into VFAs, such as acetic, propionic, and butyric acids. However, when the rate of acid production exceeds the consumption capacity of methanogens, which convert these acids into biogas, the reactor environment becomes more acidic. This trend suggested that the system might have become overloaded or saturated due to the high organic load applied, potentially compromising the reactor stability and efficiency [38].
To counter this decrease in the biogas production rate, the HRT was adjusted to 4 days from day 40 to day 52. As shown in the graph, there were peaks and drops during this period until, starting from day 52, the AFBR exhibited a significant increase in the biogas production rate, reaching up to 1276.31 mL/h on that day. At this point, the HRT was reduced again, resulting in a peak rate of 1804.88 mL/h on day 54. This recovery demonstrated the system’s ability to regain stability and efficiency, producing significantly higher amounts of biogas compared to the previous days. This is also reflected in the upward trend line between days 52 and 58.
It is important to note that, despite the instability during this stage and the subsequent recovery, no pH adjustment was necessary. The average methane content in the biogas during this stage was 65%, slightly lower than in Stage 1 due to the instability period but comparable to the 56.2–67.5% CH4 reported by Dinh et al. [39] in an anaerobic digestion study of vegetable waste, co-digested with food waste.
The organic load of 4.35 gCOD/L·d (5.83 kg VS/m³·d) evaluated in this stage is often considered the maximum value in most anaerobic digestion studies involving easily degradable substrates. Although this level of organic load can impact the anaerobic process, our system demonstrated resilience. Masebinu et al. [37] found that optimal operating conditions were achieved with an OLR between 2.68 and 2.97 kgVS/m³·d, with a CH4 concentration of 57.58%, lower than that obtained in our study, even during the instability period. The authors observed fluctuations in the anaerobic process and a decrease in biogas yield when the organic load exceeded 3.4 kgVS/m³·d. To restore process stability, they immediately reduced the OLR and diluted the substrate mixture. In contrast, our study did not require a reduction in OLR; instead, adjusting the HRT provided sufficient time for microorganisms to degrade the accumulated organic compounds. This adjustment was crucial, as increasing the OLR while maintaining a reduced HRT often leads to significant decreases in biogas yields due to microbial washout at higher flow rates, which are associated with low HRTs [33,40].
In another study using highly biodegradable substrates, Aslanzadeh et al. [41] evaluated food waste co-digested with the organic fraction of municipal solid waste (OFMSW) and reported that mono-digestion could not sustain organic loads above 3 kgVS/m³·d. Similarly, Parra-Orobio et al. [42] found that the anaerobic digestion of food waste in a single-stage process experienced reduced removal efficiencies and biogas production when the OLR exceeded 3.0 kgVS/m³·d. These studies demonstrate that treating highly biodegradable substrates, even in co-digestion, generally has an OLR limit around this range, with biogas production declining at higher values. Notably, unlike these studies, the AFBR in our study was able to recover and sustain higher organic loads in the subsequent stages.

3.3.3. Stage 3: Semi-Continuous with 900 mL of TWLF1

In the third stage, the OLR of the AFBR was further increased with a feed of 900 mL of TWLF1 (Figure 7). On day 60, a notable increase in biogas production rate was observed, reaching up to 3820 mL/h, indicating intense microbial activity in the degradation of a larger organic load.
During the period from day 60 to 66, the HRT was maintained at 3 days. As shown, the microorganisms adapted effectively to the new organic load, with biogas production values remaining above 2500 mL/h. By day 66, however, the production rate decreased to 1570 mL/h. At this point, the HRT was readjusted to 4 days. By day 70, the biogas production rate increased again to 2868.53 mL/h, demonstrating a faster recovery compared to the previous stage.
Due to the reactor’s excellent performance, the HRT was further adjusted again to 3 days on day 70, to 2 days on day 74, and finally stabilized at 1 day during the last days of operation. With these HRT adjustments, the biogas production rate remained above 2500 mL/h, reaching a peak of 4117 mL/h on day 86, the highest rate observed since the start of the operational stages with varying OLRs. The trend line shows a slight decrease followed by a subsequent increase beginning on day 71, suggesting that the AFBR could handle the high organic loads from tomato waste. This performance demonstrates the reactor’s increasingly rapid recovery capacity, effectively utilizing the high organic content to produce more biogas.
On day 71, the maximum cumulative biogas production for the entire experimental period was achieved, reaching 44,560 mL with a residence time of 3 days. This is significant relative to the reactor’s volume. The average CH4 content in the biogas for this stage was 72.3%.
In other studies, with rapidly biodegradable substrates, similar loads of 6.26 gCOD/L·d (8.39 kgVS/m³·d) have shown unfavorable biogas production results. In a study by Parra-Orobio et al. [42], increasing the OLR to 6 kgVS/m³·d resulted in a decline in COD removal and biogas production, with removal rates falling below 20%. The authors improved these values at higher organic loads only by conducting anaerobic digestion in two stages. Scano et al. [43] also increased the OLR to 5 kgVS/m³·d in the mono-digestion of food waste. However, the process remained stable and efficient in terms of biogas quantity and CH4 content only when the OLR was kept within the range of 2.5–3.0 kgVS/m³·d. In another study of food waste treatment, Wang et al. [44] recommended gradually increasing the organic load while maintaining values of 3 kgVS/m³·d. Beyond this threshold, the inhibition of methanogenic activity occurred due to VFA accumulation and high concentrations of propionic acid.
Gradual increases in OLR typically result in higher biogas production [33]. However, other studies with different substrates have shown that increasing the OLR beyond optimal levels decreases biogas production performance [45,46,47]. Other approaches have focused on co-digesting such residues with other substrates to enhance methane production. Dinh et al. [48] performed the anaerobic co-digestion of vegetable waste with food waste, reporting biogas yields between 431.6 and 595.9 mLCH4/gVS. Pham Van et al. [49] evaluated the anaerobic mono-digestion of vegetable waste, achieving methane yields between 207.71 and 226.01 mLCH4/gVS. They also reported success in two-stage anaerobic digestion, stabilizing the process in Stage 3 after two prior stages with lower organic loads, reaching up to 373.9 mLCH4/gVS, due to the development of a robust microbial consortium within the reactor.
In comparison, our study achieved methane yields of up to 563 mLCH4/gVS, in anaerobic mono-digestion with increasing organic loads and without co-digestion, highlighting its efficiency. Despite these promising results, it is important to note that, although the AFBR handled increases in the OLR well, the experimental setup may not fully represent full-scale scenarios. In practice, gradual increases in the OLR or changes in substrate composition due to waste ripening are common, and these factors may affect the microbial community differently [50].

3.3.4. Methane Content at Different Stages of Operation

Table 4 presents the methane content throughout the operation of the AFBR. The methane concentration in the biogas during the three semi-continuous feeding stages with increasing organic loads demonstrated good performance, with an average methane concentration of 70%, highlighting the AFBR´s efficiency in treating tomato liquid fraction.
In the 500 mL stage, the methane concentration remained steady at 69%, indicating efficient processing at a relatively low OLR. In the 700 mL stage, the methane concentration initially dropped to 65% on the first day, likely due to the system adjusting to the higher organic load. However, the concentration quickly stabilized back at 69%, showing that the methanogenic activity was able to adapt and maintain optimal performance even with the increased load. In the 900 mL stage, methane concentration showed a progressive increase from 72% to a peak of 78% suggesting that the reactor not only adapted to a higher load but also improved its conversion of organic matter to methane. This increase highlights the effectiveness of the fixed biofilm in degrading the highly biodegradable tomato residue. The favorable response also indicates adequate buffering capacity, allowing the reactor to maintain efficiency even under more demanding conditions.
Despite the decrease in methane content during Stage 2, methane levels increased during Stage 3, remaining above 60%, even with reduced biogas production caused by the increased organic load in the intermediate period of Stage 2. Pham Van et al. [49] explained this behavior, noting that both hydrogenotrophic and acetoclastic methanogens can experience stress under these conditions. However, the slight increase in methane concentration suggests that hydrogenotrophic methanogens were less affected than acetoclastic ones, which is reasonable since hydrogenotrophic bacteria generally grow faster. Overall, this adaptive behavior was possible due to the short duration of the shock periods and the reactor’s high adaptability.
To further assess reactor efficiency at each stage, experimentally obtained biogas volumes were compared to theoretical production based on the organic matter fed. The theoretical production was calculated using a yield of 0.35 L of methane per gram of COD removed and the experimentally determined methane content [51,52]. During the 500 mL stage, after adjusting for endogenous respiration, the produced biogas matched 99.5% of the theoretical value, indicating high reactor efficiency in converting organic matter into methane. The fixed biofilm effectively supported degradation at this initial organic load.
In the 700 mL stage, acidification was deliberately introduced to assess the system response and recovery capacity. The obtained biogas represented 80% of the theoretical value, suggesting that acidification affected production, but the reactor maintained considerable performance. This also demonstrates the system´s ability to recover, although the buffering capacity of the biofilm may have been exceeded in this stage.
In the final 900 mL TWLF1 feeding stage, the reactor demonstrated rapid adaptation, with biogas production exceeding the theoretical values due to residual organics from the previous stage. This indicates that the reactor not only managed the higher organic load effectively but also enhanced its overall performance. The elevated biogas production demonstrated the robust capacity of the reactor under high organic loads, highlighting the efficiency of the fixed biofilm in degrading the liquid tomato residue substrate. The biofilm played a crucial role in achieving these results by providing a large surface area for bacteria to adhere to, creating microenvironments that supported diverse bacterial groups [53,54,55]. This diversity enabled microorganisms to recover quickly in response to disturbances, such as increased organic load.
Specific methanogenic activity (SMA) is an important parameter for evaluating system performance and stability during operation [56]. At the end of Stage 3, the reactor was opened, and samples of the colonized carrier material were extracted to calculate attached biomass based on volatile solid content. The SMA of the final feeding in Stage 3 was calculated following the methodology of Hussain and Dubey [56]. The obtained value of 0.24 gCOD/gVS·d was comparable to the 0.246 gCOD/gVS·d reported by Punal et al. [57] for attached biomass and the 0.250 gCOD/gVSS·d for suspended biomass in a hybrid UASB reactor. This value also fell within the range of 0.24–0.30 gCOD/gVSS·d reported by Zhang et al. [58] for a UASB system fed with acetate. However, it was lower than the 0.48–0.66 gCOD/gVSS·d obtained by the same authors when activated carbon was added to the system. Variations in SMA values can be attributed to differences in anaerobic sludge characteristics, substrate type, environmental conditions, and testing procedures, as noted by Hussain and Dubey [56].
While the average methane content of 70% is promising, further optimization may enhance methane production. Future studies could explore increasing organic loading rates, as well as factors such as temperature, inoculum source, and co-digestion with other substrates to potentially improve methane yields. The slight dip in methane content during Stage 2 highlights the sensitivity of methanogens to disturbances, emphasizing the importance of maintaining stable operational conditions and carefully managing OLR increases to ensure consistent methane production.

3.4. Process Stability Indicators

3.4.1. Alkalinity

Figure 8 shows the behavior of total, partial, and intermediate alkalinity during the operational stage with varying organic loads. Significant variations in these three types of alkalinity were observed throughout the experiment, corresponding to changes in feed flows and biogas production.
In biological processes with anaerobic reactors, pH measurement is the most common method for monitoring stabilization and acidification. However, in substrates with high organic loads and easy degradability, such as tomato waste, the systematic verification of alkalinity becomes more important than pH assessment. This is due to the logarithmic scale of pH, where small pH variations can indicate rapid alkalinity consumption [10,59]. Thus, alkalinity is crucial for maintaining pH stability in the system and monitoring the reactor’s buffering capacity [36].
As shown in Figure 8, partial alkalinity remained stable until approximately day 20. From days 20 to 35, a decreasing trend occurred, with values approaching 1500 mg/L CaCO3. This coincided with the start of Stage 2, during which the reactor’s organic load was increased to a feed flow of 700 mL. By day 38, partial alkalinity had decreased below 500 mg/L CaCO3, while intermediate alkalinity rose from below 100 to 900 mg/L CaCO3 on day 38, eventually reaching 1500 mg/L CaCO3 by day 49.
In alignment with the biogas production behavior, the significant decrease in partial alkalinity indicated bicarbonate consumption to neutralize acids produced during organic matter degradation. This decrease posed a risk to pH stability. On the other hand, the substantial increase in intermediate alkalinity indicated VFA accumulation during the increased organic load, suggesting that methanogenic microorganisms could not fully degrade these compounds, leading to tendencies toward acidification in the reactor. Adjusting the HRT during this stage greatly assisted the system in consuming the generated organic compounds, demonstrating recovery by day 52, with partial alkalinity values rising above 2000 mg/L CaCO3. This indicates that the AFBR was able to recover and neutralize acids effectively due to the presence of bicarbonates. Conversely, intermediate alkalinity values decreased again below 500 mg/L CaCO3 and remained low until Stage 3, when the organic load increased with a feed of 900 mL. Despite a slight decline in the biogas production rate, this was not directly linked to a reduced capacity for neutralizing acids or excessive VFA accumulation. From day 60 onward, the reactor showed stability in organic compound degradation.
The recovery of partial alkalinity suggests improved system neutralization capacity, correlated with a stabilization of biogas production. Adjustments in HRT appear to be effective in restoring reactor efficiency, showcasing its self-buffering ability and counteracting the acidification caused by the pH drops [19]. In other anaerobic digestion studies involving easily biodegradable substrates, various strategies have been employed to enhance alkalinity and prevent acidification. For example, Wang et al. [60] increased total alkalinity above 1600 mg/L CaCO3 by using vermicompost and achieved 2304 mg/L with vermicompost biochar in their kitchen waste treatment process. On the other hand, Ferreira et al. [40] controlled reactor stability by reducing the OLR in response to acidification trends during food waste treatment.
Compared to our study, despite the increased organic load, the system demonstrated greater resilience, maintaining alkalinity and sustained biogas production without requiring external sources to boost alkalinity. The high buffering capacity observed in the AFBR throughout the operation period, even with increased organic loads, may also be attributed to the alkalinity produced by ammonium bicarbonate. Ammonia (NH3), released from the degradation of proteins and amino acids, reacted with carbon dioxide and water, contributing to the system’s alkalinity. This behavior aligns with the findings by Edwiges et al. [36], who assessed methane potential in the anaerobic mono-digestion of FVW, demonstrating significant buffering capacity even at an OLR of 3.5 kgVS/m³·d, due to a well-diversified FVW mixture.

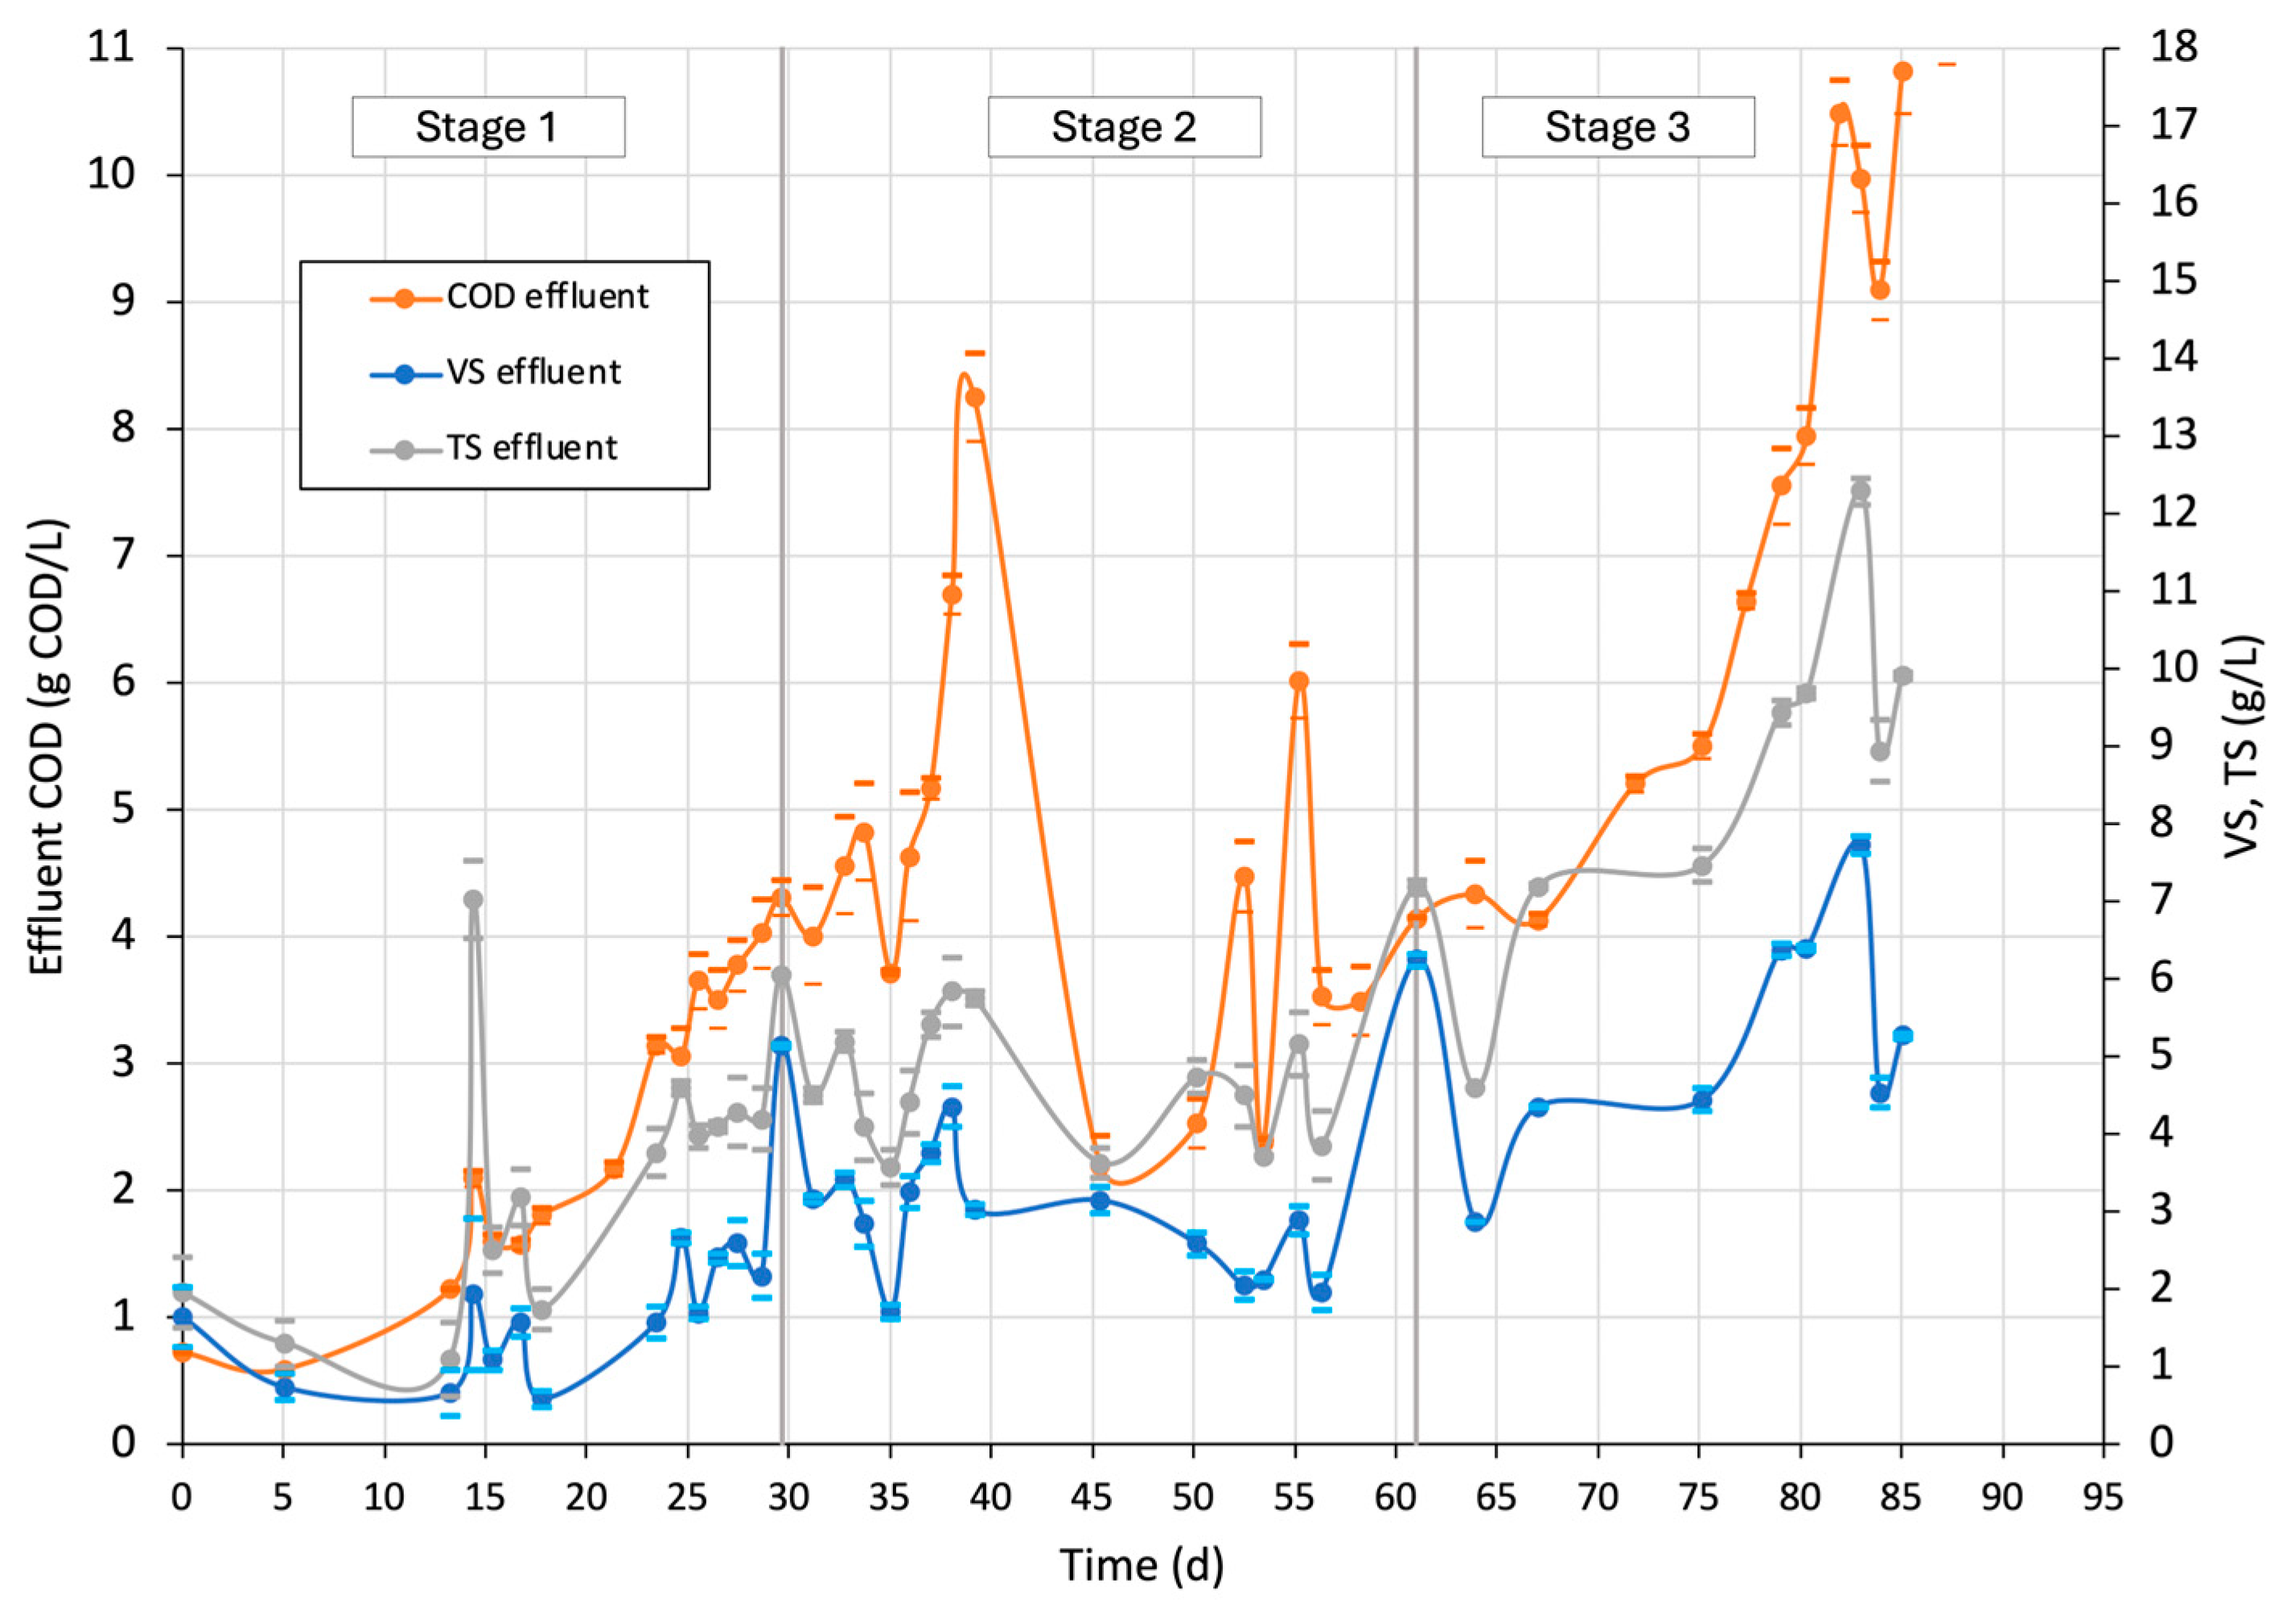
3.4.2. COD, VS, and TS Effluent

Figure 9 presents the effluent values for COD, VSs, and TSs, which are key indicators of process stability.
During Stage 1, the behavior of all three parameters showed a similar trend with minimal fluctuations, although there was a gradual increase, reflecting the rise in organic load. An exception occurred on day 14 when the accumulation of TSs at the outlet was observed, likely due to system acclimatization in the initial phase of operation. However, this did not affect biogas production during this period.
In contrast, Stage 2 showed more pronounced differences, particularly in COD effluent values, which displayed greater variation compared to VSs and TSs. From day 35 to 44, a noticeable accumulation of COD was observed, coinciding with reduced biogas production in Stage 2. This indicated that the system was overloaded by the increased organic matter, exceeding the microorganisms’ processing capacity and disrupting the microbial balance, favoring acidogenic bacteria over methanogens. The HRT during this period was 1 day, which did not allow methanogens enough time to process the compounds, leading to COD buildup and system instability.
Following adjustments to the HRT, organic matter degradation improved, and COD levels fell below 3 gCOD/L by day 45, which corresponded with an increase in biogas production. In Stage 3, all three parameters exhibited similar trends, reflecting the increase in organic load towards the end of the period. The system operated above 10 gCOD/L during the final days, maintaining the reactor in a hydrolysis phase for further studies.
Overall, the COD values in the liquid substrate remained higher than TSs and VSs, indicating that COD was more sensitive to system changes, as seen during Stage 2. In contrast, TSs and VSs did not show a significant response to variations in biogas production, likely due to the relatively smaller changes in degradable organic matter compared to the total solids present.
Various studies have assessed the efficacy of indicators like COD, TSs, and VSs for monitoring substrate conversion and process stability [61,62]. COD, in particular, has been identified as a reliable indicator of system instability when anaerobic reactors are subjected to OLR changes. For instance, Dhar et al. [63] demonstrated a strong correlation between biogas yield and the reduction in COD and VSs during the anaerobic digestion of municipal solid waste. While VSs represented a critical parameter in their high-solid system, our study focuses on the liquid fraction, where VS content is considerably lower. Hence, COD emerges as a more reliable indicator of system stability and responsiveness to OLR increases.

3.4.3. Cumulative Biogas and pH

Figure 10 presents pH and cumulative biogas, key parameters for monitoring the system’s performance. In Stage 1, both pH and cumulative biogas exhibited stability, particularly during the initial operational days. The pH remained neutral, ranging from 7 to 7.5, indicating that the AFBR had a good buffering capacity at this early OLR.
Biogas production initially remained below 15,000 mL for the first 12 days, reflecting the system’s acclimatization. Afterward, cumulative biogas increased above 15,000 mL but decreased between days 17 and 23 due to an HRT adjustment. It then rose again to over 15,000 mL as Stage 2 began. During this stage, cumulative biogas fluctuated between 10,000 and 20,000 mL though no clear signs of instability emerged. Meanwhile, the pH dropped to 5.5, indicating acidification due to VFA accumulation, which impacted the biogas production rate. After adjusting the HRT, pH returned to neutral values around day 45 and remained stable through Stage 3, with the exception of the hydrolysis phase at the end of the last stage. Cumulative biogas values levels increased after day 55 as the AFBR stabilized, with a reduction in HRT and an increase in the OLR.
While cumulative biogas provides a snapshot of total production over time, it does not reflect short-term fluctuations that may indicate instability. Such cumulative data can obscure significant variations in production rates, particularly during disruptions like those in Stage 2. Therefore, it is essential to complement cumulative biogas monitoring with other indicators that can capture rapid changes. Some researchers argue that pH alone may not reliably indicate stability in anaerobic digestion, especially with rapidly biodegradable substrates [64,65]. This is because pH can remain stable until substantial imbalances occur, making recovery more challenging [66].
In this study, however, pH proved to be an effective stability indicator, correlating well with changes in biogas production and OLR throughout Stages 2 and 3. The pH shifts prompted timely HRT adjustments, particularly in Stage 2, when the process faced instability due to the increased OLR. The process was able to recover and stabilize after these adjustments. Moreover, the reactor’s buffering capacity helped pH reflect system variations more accurately. In anaerobic systems with sufficient buffering capacity, pH can more closely track fluctuations in VFA production and other digestion byproducts [67,68,69].
The effectiveness of pH as a stability indicator in this study may also be attributed to the high moisture content and chemical composition of tomato waste.
Tomato waste contains natural organic acids, which may have increased the system’s sensitivity to pH changes and its responsiveness to variations in organic load [6,70,71]. This heightened sensitivity likely allowed pH to more accurately and quickly reflect process conditions. pH is a simple measurement and often the primary indicator monitored online in most biogas plants. Its role as a stability indicator is based on the principle that a drop in pH signals VFA accumulation, making it particularly useful for monitoring low-buffered anaerobic digestion systems, such as municipal sewage treatment plants with lower OLRs [64,66].
While pH was a useful stability indicator, monitoring alkalinity provided additional context. Alkalinity acts as a buffer, and when measured alongside pH, it allows for a more comprehensive assessment of process stability. Identifying reliable indicators such as pH is crucial for developing monitoring and control strategies in anaerobic treatment, both in lab-scale and larger applications. The early detection of instability through such indicators enables timely corrective actions, ensuring efficient and stable operation [72].

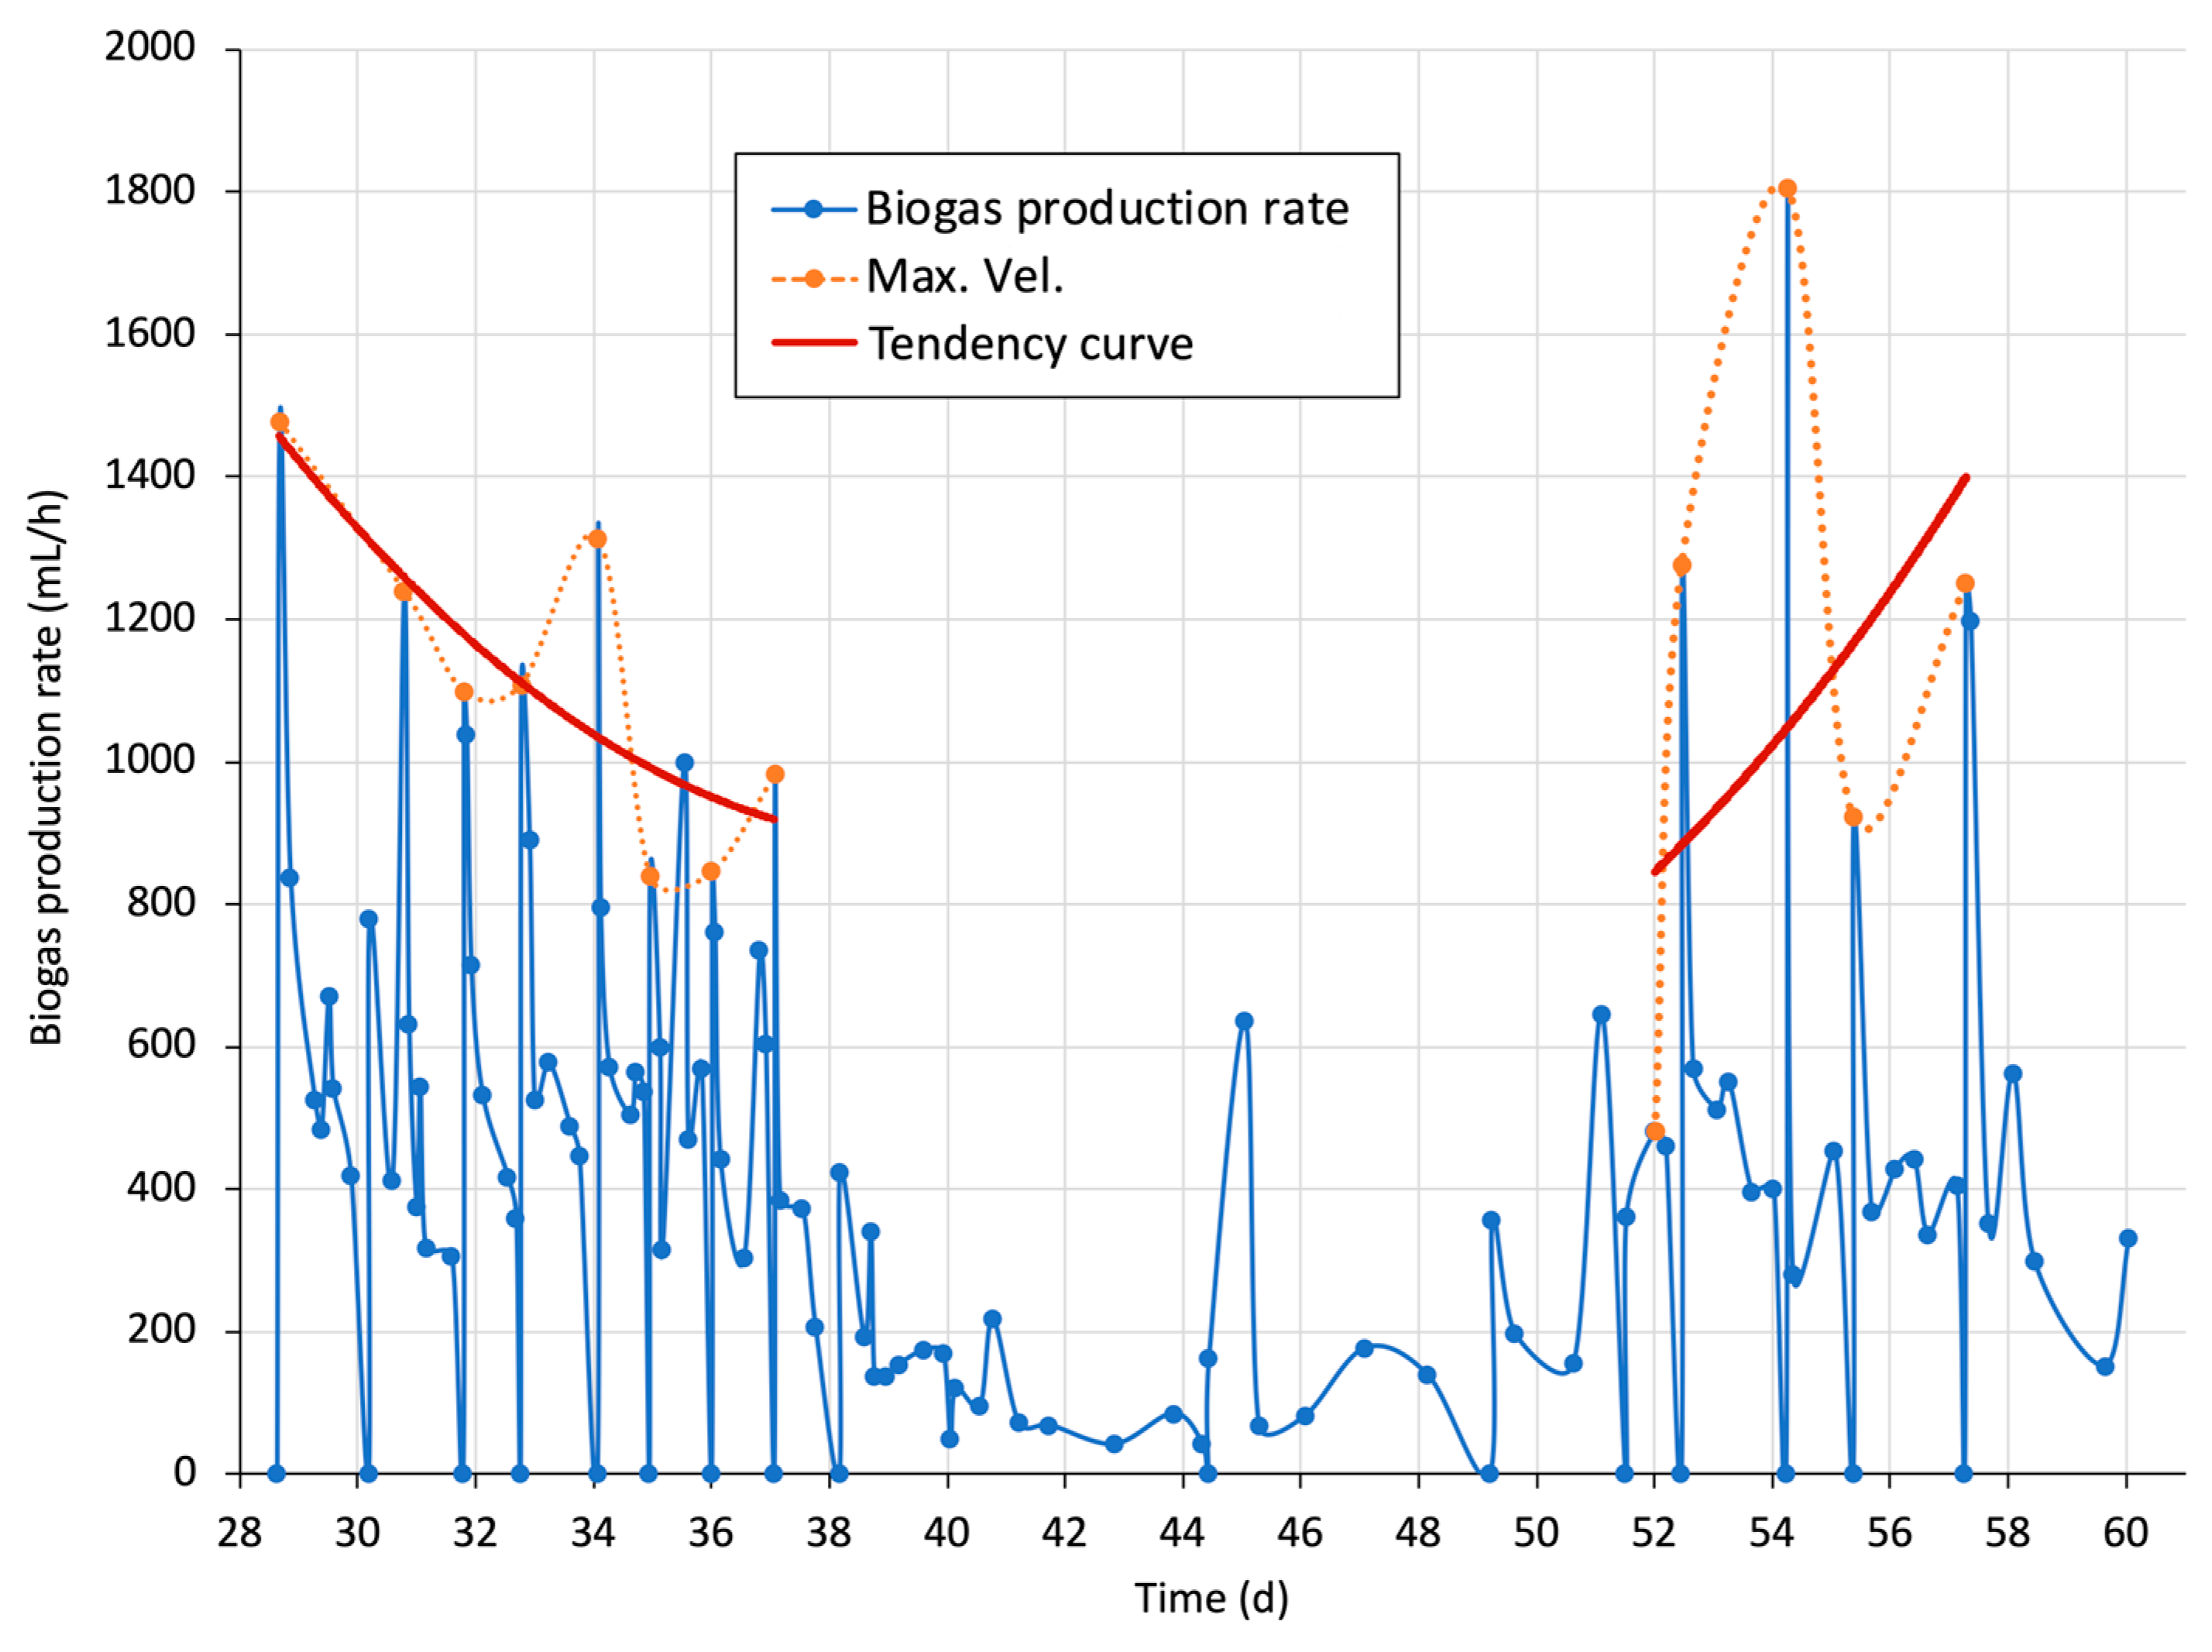
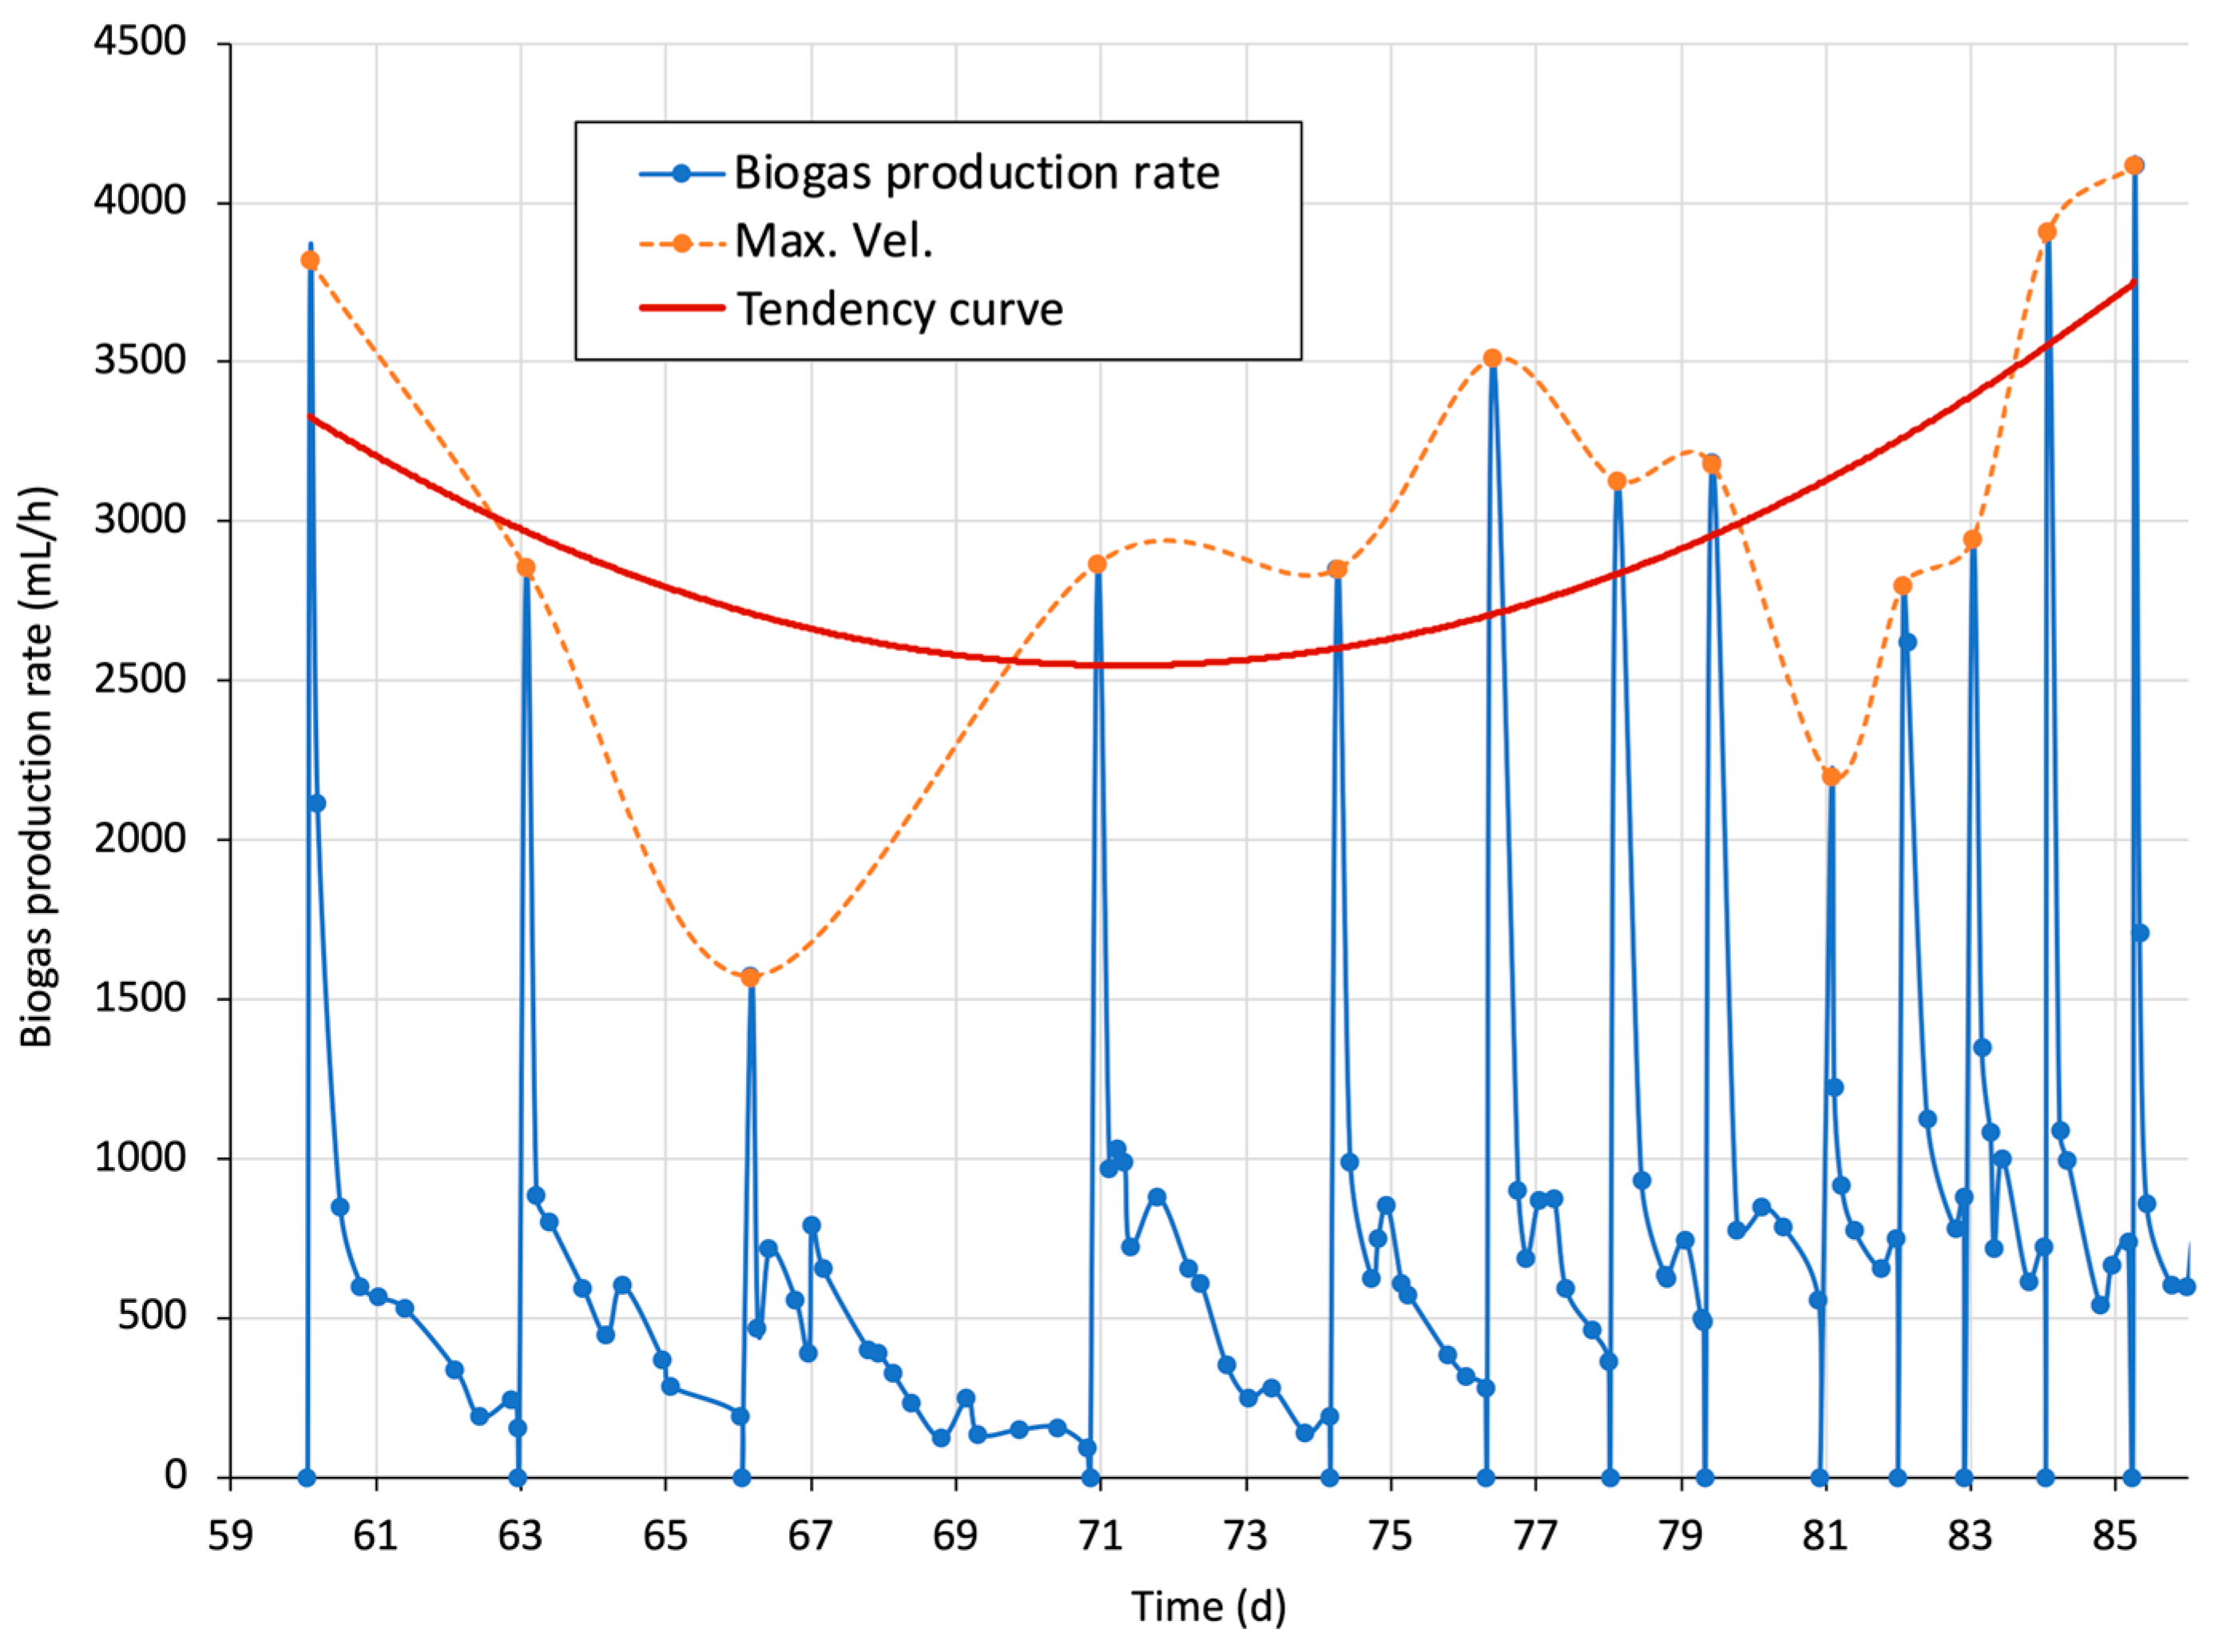
3.4.4. One-Day Cumulative Biogas and Biogas Production Rate

Figure 11 provides insights into the AFBR’s performance by analyzing daily cumulative biogas production and the biogas production rate, both normalized to a 24 h period. Unlike previous figures that show fluctuations due to HRT adjustments in response to acidification, this representation offers a clearer view of the system’s overall stabilization and continuous improvement.
The one-day cumulative biogas values reflect the total daily biogas production. The upward trend indicates continuous improvement, suggesting the progressive stabilization and optimization of the system. These values highlight the AFBR’s cumulative performance, showing its capacity to sustain or enhance biogas production without significant interruptions. However, while one-day cumulative biogas provides an overview of system performance, it may obscure short-term fluctuations. For example, a temporary decrease in the biogas production rate, such as that observed in Stage 2 due to acidification, might not be evident if the total daily output remains relatively high.
In contrast, the one-day biogas production rate is a more sensitive indicator of operational changes within the reactor. This metric offers a real-time view of system stability, enabling the immediate detection of changes in biogas production, which is crucial for identifying problems or improvements. The upward trend in this graph demonstrates the system’s positive response to operational conditions, highlighting its ability to adapt and continuously improve.
Compared to the previous figures, monitoring the effects of OLR changes and HRT adjustments, these one-day adjusted graphs reveal that the AFBR not only recovered from disturbances but also enhanced its efficiency. The steady upward trends in both metrics reinforce the idea that the AFBR can recover from adverse conditions and improve its performance over time.
While biogas production is a widely used indicator for monitoring anaerobic digestion, its response to sudden environmental or operational disturbances can be delayed. An increase in the biogas production rate does not always signify stable microbial processes, as it could result from an increased OLR or improved microbial activity under optimized conditions [68,73]. Biogas production alone is insufficient for monitoring process inhibition or reduced organic content in the feed substrate [68,74]. Hence, stability indicators like the one-day production rate are especially important during OLR increases with rapidly biodegradable substrates. The methane content produced is directly related to the amount of organic matter that has been degraded and the adaptation of the microbial community within the reactor [75]. Therefore, monitoring values provide a reliable indicator of instability, offering a comprehensive view of reactor behavior.

4. Conclusions

This study demonstrated the feasibility of using liquid tomato waste as the sole substrate in an AFBR for biogas production, even under a high OLR. The AFBR exhibited strong buffering capacity and resilience during periods of acidification, particularly in Stage 2, where the pH dropped below 6. In response, an adjustment in HRT to 4 days facilitated recovery without external pH control. Similarly, in Stage 3, a prompt HRT adjustment enabled a faster recovery.
Throughout the operation, the system successfully withstood the increasing OLR, achieving maximum biogas production rates of 1586, 1804, and 4117 mL/h in Stages 1, 2, and 3, respectively. Methane yields were high, with methane content reaching up to 72.3%, surpassing values reported in previous studies on food waste and fruit and vegetable waste digestion.
Key indicators for monitoring system stability were identified, with pH, effluent COD, and partial alkalinity emerging as the most effective. Specific thresholds for instability included pH levels below 6, effluent COD concentrations exceeding 3 gCOD/L, and partial alkalinity dropping below 500 mg CaCO3/L. These indicators allowed for timely HRT adjustments, preventing reactor acidification and maintaining efficient, stable operation throughout the experimental phases.
The findings highlight the significant buffering capacity of the AFBR, which played a crucial role in sustaining biogas production despite fluctuations in organic load. The system’s ability to recover and maintain stability without external buffering agents emphasizes its potential for practical applications.
Future research should explore microbial population dynamics through molecular biology techniques to better understand the interactions that contribute to system stability. Additionally, scaling up studies will be essential to evaluate the economic feasibility and broader applicability of this process in industrial settings. Overall, this study provides robust evidence of the potential for liquid tomato waste to serve as a valuable feedstock for biogas production in AFBRs. This approach could be extended to other highly biodegradable fruit and vegetable residues, opening new opportunities for sustainable waste treatment through biogas production.

Author Contributions

Conceptualization and project administration, A.A.-V. and A.A.-L.; formal analysis and investigation, A.A.-V. and E.S.R.-M.; supervision, A.A.-L. and J.M.M.-C.; writing original draft, A.A.-V., O.M.-P. and A.A.-L.; visualization, O.M.-P.; writing—review and editing, A.A.-V., O.M.-P. and E.S.R.-M. All authors have read and agreed to the published version of the manuscript.

Funding

The authors acknowledge the support provided by the Consejo Nacional de Humanidades, Ciencias y Tecnologías (CONAHCYT) for the doctoral scholarship of Andrea Alvarado Vallejo and the Consejo Veracruzano de Investigación Científica y Desarrollo Tecnológico (COVEICYDET) for project funding (Project: 0111 1258/2023).

Data Availability Statement

The data supporting the conclusions of this study can be obtained from the corresponding author.

Acknowledgments

The authors acknowledge the Municipal Government of Orizaba, Veracruz, for providing the facilities necessary for the collection of the tomato waste used in this study.

Conflicts of Interest

The authors declare no conflicts of interest.

References

  1. FAO-STAT. Datos Sobre Alimentación y Agricultura: Cultivos y Productos de Ganadería en México. 2023. Available online: https://www.fao.org/faostat/es/#data/QCL (accessed on 23 April 2024).
  2. Stylianou, M.; Laifi, T.; Bennici, S.; Dutournie, P.; Limousy, L.; Agapiou, A.; Papamichael, I.; Khiari, B.; Jeguirim, M.; Zorpas, A.A. Tomato waste biochar in the framework of circular economy. Sci. Total Environ. 2023, 871, 161959. [Google Scholar] [CrossRef] [PubMed]
  3. Gil, A.; Siles, J.A.; Gutiérrez, M.C.; Martín, M.Á. Evaluation of physicochemical pretreatment of tomato plant for aerobic and anaerobic biodegradation. Biomass Convers. Biorefinery 2019, 9, 489–497. [Google Scholar] [CrossRef]
  4. Tomatonews. The Global Tomato Processing Industry. The Tomato News Online Conference. 2021. Available online: https://www.tomatonews.com/en/background_47.html (accessed on 22 April 2024).
  5. Lopez, M.J.; Masaguer, A.; Paredes, C.; Roca, L.; Ros, M.; Salas, M.C.; Boluda, R. Residuos Orgánicos y Agricultura Intensiva III, 1st ed.; Mudi-Prensa: Madrid, Spain, 2015; p. 58. [Google Scholar]
  6. Calabrò, P.S.; Greco, R.; Evangelou, A.; Komilis, D. Anaerobic digestion of tomato processing waste: Effect of alkaline pretreatment. J. Environ. Manag. 2015, 163, 49–52. [Google Scholar] [CrossRef]
  7. Hirano, S.I.; Matsumoto, N. Analysis of a bio-electrochemical reactor containing carbon fiber textiles for the anaerobic digestion of tomato plant residues. Bioresour. Technol. 2018, 249, 809–817. [Google Scholar] [CrossRef]
  8. Ezieke, A.H.; Serrano, A.; Peces, M.; Clarke, W.; Villa-Gomez, D. Effect of feeding frequency on the anaerobic digestion of berry fruit waste. Waste Manag. 2024, 178, 66–75. [Google Scholar] [CrossRef]
  9. Fermoso, F.G.; Serrano, A.; Alonso-Fariñas, B.; Fernández-Bolaños, J.; Borja, R.; Rodríguez-Gutiérrez, G. Valuable compound extraction, anaerobic digestion, and composting: A leading biorefinery approach for agricultural wastes. J. Agric. Food Chem. 2018, 66, 8451–8468. [Google Scholar] [CrossRef] [PubMed]
  10. Agrawal, A.; Chaudhari, P.K.; Ghosh, P. Anaerobic digestion of fruit and vegetable waste: A critical review of associated challenges. Environ. Sci. Pollut. Res. 2023, 30, 24987–25012. [Google Scholar] [CrossRef] [PubMed]
  11. Zhu, Y.; Luan, Y.; Zhao, Y.; Liu, J.; Duan, Z.; Ruan, R. Current technologies and uses for fruit and vegetable wastes in a sustainable system: A review. Foods 2023, 12, 1949. [Google Scholar] [CrossRef]
  12. Ji, C.; Kong, C.X.; Mei, Z.L.; Li, J. A review of the anaerobic digestion of fruit and vegetable waste. Appl. Biochem. Biotechnol. 2017, 183, 906–922. [Google Scholar] [CrossRef]
  13. Azevedo, A.; Lapa, N.; Moldão, M.; Duarte, E. Opportunities and challenges in the anaerobic co-digestion of municipal sewage sludge and fruit and vegetable wastes: A review. Energy Nexus 2023, 10, 100202. [Google Scholar] [CrossRef]
  14. Assis, T.I.; Gonçalves, R.F. Valorization of food waste by anaerobic digestion: A bibliometric and systematic review focusing on optimization. J. Environ. Manag. 2022, 320, 115763. [Google Scholar] [CrossRef] [PubMed]
  15. Zia, M.; Ahmed, S.; Kumar, A. Anaerobic digestion (AD) of fruit and vegetable market waste (FVMW): Potential of FVMW, bioreactor performance, co-substrates, and pre-treatment techniques. Biomass Convers. Biorefinery 2022, 12, 3573–3592. [Google Scholar] [CrossRef]
  16. Hagos, K.; Zong, J.; Li, D.; Liu, C.; Lu, X. Anaerobic co-digestion process for biogas production: Progress, challenges and perspectives. Renew. Sustain. Energy Rev. 2017, 76, 1485–1496. [Google Scholar] [CrossRef]
  17. Li, Y.; Wang, Y.; Yu, Z.; Lu, J.; Li, D.; Wang, G.; Li, Y.; Wu, Y.; Li, S.; Xu, F.; et al. Effect of inoculum and substrate/inoculum ratio on the performance and methanogenic archaeal community structure in solid state anaerobic co-digestion of tomato residues with dairy manure and corn stover. Waste Manag. 2018, 81, 117–127. [Google Scholar] [CrossRef] [PubMed]
  18. Salehiyoun, A.R.; Sharifi, M.; Di Maria, F.; Zilouei, H.; Aghbashlo, M. Effect of substituting organic fraction of municipal solid waste with fruit and vegetable wastes on anaerobic digestion. J. Mater. Cycles Waste Manag. 2019, 21, 1321–1331. [Google Scholar] [CrossRef]
  19. Chatterjee, B.; Mazumder, D. New approach of characterizing fruit and vegetable waste (FVW) to ascertain its biological stabilization via two-stage anaerobic digestion (AD). Biomass Bioenergy 2020, 139, 105594. [Google Scholar] [CrossRef]
  20. Mannina, G.; Ekama, G.A.; Capodici, M.; Cosenza, A.; Di Trapani, D.; Ødegaard, H. Integrated fixed-film activated sludge membrane bioreactors versus membrane bioreactors for nutrient removal: A comprehensive comparison. J. Environ. Manag. 2018, 226, 347–357. [Google Scholar] [CrossRef]
  21. di Biase, A.; Kowalski, M.S.; Devlin, T.R.; Oleszkiewicz, J.A. Moving bed biofilm reactor technology in municipal wastewater treatment: A review. J. Environ. Manag. 2019, 247, 849–866. [Google Scholar] [CrossRef] [PubMed]
  22. Alvarado-Lassman, A.; Rustrián, E.; García-Alvarado, M.A.; Houbron, E. Simultaneous removal of carbon and nitrogen in an anaerobic inverse fluidized bed reactor. Water Sci. Technol. 2006, 54, 111–117. [Google Scholar] [CrossRef]
  23. Huang, C.; Shi, Y.; Xue, J.; Zhang, Y.; El-Din, M.G.; Liu, Y. Comparison of biomass from integrated fixed-film activated sludge (IFAS), moving bed biofilm reactor (MBBR) and membrane bioreactor (MBR) treating recalcitrant organics: Importance of attached biomass. J. Hazard. Mater. 2017, 326, 120–129. [Google Scholar] [CrossRef]
  24. Vallejo-Cantú, N.A.; Galván-Hernández, A.; Alvarado-Vallejo, A.; Méndez-Contreras, J.M.; Rosas-Mendoza, E.S.; Landeta-Escamilla, O. Enhancing biomethane production from citrus waste: An integrated approach of hydrothermal carbonization and anaerobic digestion for sustainable waste management. Renew. Energy Biomass Sustain. 2023, 5, 40–46. [Google Scholar] [CrossRef]
  25. ASTM E-11-70; Standard Practices for Simulating Vehicular Response to Longitudinal Profiles of Traveled Surfaces. ASTM International: West Conshohocken, PA, USA, 2017.
  26. Ripley, L.E.; Boyle, W.C.; Converse, J.C. Improved alkalimetric monitoring for anaerobic digestion of high-strength wastes. J. (Water Pollut. Control Fed.) 1986, 58, 406–411. [Google Scholar]
  27. ASTM D1293-18; Standard Test Methods for pH of Water. ASTM International: West Conshohocken, PA, USA, 2018.
  28. APHA 5220 D; Chemical Oxygen Demand: Standard Methods for the Examination of Water and Wastewater. American Public Health Association (APHA): Washington, DC, USA; American Water Works Association (AWWA): Denver, CA, USA; Water Environment Federation (WEF): Alexandria, VA, USA, 1997.
  29. NMX-AA-034-SCFI-2015; Water Analysis-Measurement of Solids and Dissolved Salts in Natural, Waste and Treated Waste Waters-Test Method. Diario Oficial de la Federación: Ciudad de México, México, 2015.
  30. ASTM D1946-12; Standard Test Method for Analysis of Reformed Gas by Gas Chromatography. ASTM International: West Conshohocken, PA, USA, 2016.
  31. Li, R.; Chen, S.; Li, X. Anaerobic co-digestion of kitchen waste and cattle manure for methane production. Energ. Source. Part A Recover. Util. Environ. Eff. 2009, 31, 1848–1856. [Google Scholar] [CrossRef]
  32. Zhang, W.; Xing, W.; Li, R. Real-time recovery strategies for volatile fatty acid-inhibited anaerobic digestion of food waste for methane production. Bioresour. Technol. 2018, 265, 82–92. [Google Scholar] [CrossRef] [PubMed]
  33. Nkuna, R.; Roopnarain, A.; Rashama, C.; Adeleke, R. Insights into organic loading rates of anaerobic digestion for biogas production: A review. Crit. Rev. Biotechnol. 2022, 42, 487–507. [Google Scholar] [CrossRef]
  34. Nagao, N.; Tajima, N.; Kawai, M.; Niwa, C.; Kurosawa, N.; Matsuyama, T.; Toda, T. Maximum organic loading rate for the single-stage wet anaerobic digestion of food waste. Bioresour. Technol. 2012, 118, 210–218. [Google Scholar] [CrossRef]
  35. Edwiges, T.; Frare, L.; Mayer, B.; Lins, L.; Triolo, J.M.; Flotats, X.; de Mendonça Costa, M.S. Infuence of chemical composition on biochemical methane potential of fruit and vegetable waste. Waste Manag. 2018, 71, 618–625. [Google Scholar] [CrossRef]
  36. Edwiges, T.; Frare, L.M.; Alino, J.H.L.; Triolo, J.M.; Flotats, X.; de Mendonça Costa, M.S.S. Methane potential of fruit and vegetable waste: An evaluation of the semi-continuous anaerobic mono-digestion. Environ. Technol. 2020, 41, 921–930. [Google Scholar] [CrossRef]
  37. Masebinu, S.O.; Akinlabi, E.T.; Muzenda, E.; Aboyade, A.O.; Mbohwa, C. Experimental and feasibility assessment of biogas production by anaerobic digestion of fruit and vegetable waste from Joburg Market. Waste Manag. 2018, 75, 236–250. [Google Scholar] [CrossRef]
  38. Kong, X.; Wei, Y.; Xu, S.; Liu, J.; Li, H.; Liu, Y.; Yu, S. Inhibiting excessive acidification using zero-valent iron in anaerobic digestion of food waste at high organic load rates. Bioresour. Technol. 2016, 211, 65–71. [Google Scholar] [CrossRef]
  39. Dinh, P.V.; Fujiwara, T.; Phu, S.T.P.; Hoang, M.G. Kinetic of biogas production in co-digestion of vegetable waste, horse dung, and sludge by batch reactors. IOP Conf. Ser. Earth Environ. Sci. 2018, 1, 012041. [Google Scholar] [CrossRef]
  40. Ferreira, T.B.; Passos, F.; Chernicharo, C.A.; de Souza, C.L. Anaerobic digestion of food waste: Effect of the organic load variation in a demo-scale system. Waste Biomass Valorization 2021, 12, 4407–4417. [Google Scholar] [CrossRef]
  41. Aslanzadeh, S.; Rajendran, K.; Taherzadeh, M.J. A comparative study between single-and two-stage anaerobic digestion processes: Effects of organic loading rate and hydraulic retention time. Int. Biodeterior. Biodegrad. 2014, 95, 181–188. [Google Scholar] [CrossRef]
  42. Parra-Orobio, B.A.; Cruz-Bournazou, M.N.; Torres-Lozada, P. Single-stage and two-stage anaerobic digestion of food waste: Effect of the organic loading rate on the methane production and volatile fatty acids. Water Air Soil Pollut. 2021, 232, 105. [Google Scholar] [CrossRef]
  43. Scano, E.A.; Asquer, C.; Pistis, A.; Ortu, L.; Demontis, V.; Cocco, D. Biogas from anaerobic digestion of fruit and vegetable wastes: Experimental results on pilot-scale and preliminary performance evaluation of a full-scale power plant. Energy Convers. Manag. 2014, 77, 22–30. [Google Scholar] [CrossRef]
  44. Wang, C.; Zuo, J.; Chen, X.; Xing, W.; Xing, L.; Li, P.; Lu, X.; Li, C. Microbial community structures in an integrated two-phase anaerobic bioreactor fed by fruit vegetable wastes and wheat straw. J. Environ. Sci. 2014, 26, 2484–2492. [Google Scholar] [CrossRef] [PubMed]
  45. Babaee, A.; Shayegan, J. Effect of organic loading rates (olr) on production of methane from anaerobic digestion of vegetables waste. In Proceedings of the World Renewable Energy Congress, Linköping, Sweden, 8–13 May 2011. [Google Scholar]
  46. Aramrueang, N.; Rapport, J.; Zhang, R. Effects of hydraulic retention time and organic loading rate on performance and stability of anaerobic digestion of Spirulina platensis. Biosyst. Eng. 2016, 147, 174–182. [Google Scholar] [CrossRef]
  47. Eslami, H.; Hashemi, H.; Fallahzadeh, R.A.; Khosravi, R.; Fard, R.F.; Ebrahimi, A.A. Effect of organic loading rates on biogas production and anaerobic biodegradation of composting leachate in the anaerobic series bioreactors. Ecol. Eng. 2018, 110, 165–171. [Google Scholar] [CrossRef]
  48. Dinh, P.V.; Hoang, M.G.; Pham Phu, S.T.; Fujiwara, T. Kinetics of carbon dioxide, methane and hydrolysis in co-digestion of food and vegetable wastes. Glob. J. Environ. Sci. Manag. 2018, 4, 401–412. [Google Scholar] [CrossRef]
  49. Pham Van, D.; Takeshi, F.; Hoang Minh, G.; Pham Phu, S.T. Comparison between single and two-stage anaerobic digestion of vegetable waste: Kinetics of methanogenesis and carbon flow. Waste Biomass Valorization 2020, 11, 6095–6103. [Google Scholar] [CrossRef]
  50. Niu, Q.; Kobayashi, T.; Takemura, Y.; Kubota, K.; Li, Y.Y. Evaluation of functional microbial community’s difference in full-scale and lab-scale anaerobic digesters feeding with different organic solid waste: Effects of substrate and operation factors. Bioresour. Technol. 2015, 193, 110–118. [Google Scholar] [CrossRef] [PubMed]
  51. Michaud, S.; Bernet, N.; Buffière, P.; Delgenes, J.P. Use of the methane yield to indicate the metabolic behaviour of methanogenic biofilms. Process Biochem. 2005, 40, 2751–2755. [Google Scholar] [CrossRef]
  52. Namburath, M.; Alappat, B.J.; Ramaswamy, S.T. A critical review of inverse fluidized bed reactors—Start-up optimization strategies and wastewater treatment. Environ. Sci. Pollut. Res. 2023, 30, 108370–108392. [Google Scholar] [CrossRef] [PubMed]
  53. Zinatizadeh, A.A.; Mohammadi, P.; Mirghorayshi, M.; Ibrahim, S.; Younesi, H.; Mohamed, A.R. An anaerobic hybrid bioreactor of granular and immobilized biomass for anaerobic digestion (AD) and dark fermentation (DF) of palm oil mill effluent: Mass transfer evaluation in granular sludge and role of internal packing. Bioenergy 2017, 103, 1–10. [Google Scholar] [CrossRef]
  54. Carneiro, R.B.; Gomes, G.M.; Zaiat, M.; Santos-Neto, Á.J. Two-phase (acidogenic-methanogenic) anaerobic fixed bed biofilm reactor enhances the biological domestic sewage treatment: Perspectives for recovering bioenergy and value-added by-products. J. Environ. Manag. 2022, 317, 115388. [Google Scholar] [CrossRef]
  55. Lv, P.L.; Jia, C.; Guo, X.; Zhao, H.P.; Chen, R. Microbial stratification protects denitrifying anaerobic methane oxidation archaea and bacteria from external oxygen shock in membrane biofilm reactor. Bioresour. Technol. 2024, 391, 129966. [Google Scholar] [CrossRef]
  56. Hussain, A.; Dubey, S.K. Specific methanogenic activity test for anaerobic degradation of influents. Appl. Water Sci. 2017, 7, 535–542. [Google Scholar] [CrossRef]
  57. Puñal, A.; Trevisan, M.; Rozzi, A.; Lema, J.M. Influence of C:N ratio on the start-up of up-flow anaerobic filter reactors. Water Res. 2000, 34, 2614–2619. [Google Scholar] [CrossRef]
  58. Zhang, Y.; Guo, B.; Zhang, L.; Zhang, H.; Liu, Y. Microbial community dynamics in granular activated carbon enhanced up-flow anaerobic sludge blanket (UASB) treating municipal sewage under sulfate reducing and psychrophilic conditions. Chem. Eng. J. 2021, 405, 126957. [Google Scholar] [CrossRef]
  59. de Lemos Chernicharo, C.A. Anaerobic Reactors; IWA Publishing: London, UK, 2007. [Google Scholar] [CrossRef]
  60. Wang, D.; Ai, J.; Shen, F.; Yang, G.; Zhang, Y.; Deng, S.; Zhang, J.; Zeng, Y.; Song, C. Improving anaerobic digestion of easy-acidification substrates by promoting buffering capacity using biochar derived from vermicompost. Bioresour. Technol. 2017, 227, 286–296. [Google Scholar] [CrossRef]
  61. Wu, D.; Li, L.; Zhao, X.; Peng, Y.; Yang, P.; Peng, X. Anaerobic digestion: A review on process monitoring. Renew. Sustain. Energy Rev. 2019, 103, 1–12. [Google Scholar] [CrossRef]
  62. Li, L.; Peng, X.; Wang, X.; Wu, D. Anaerobic digestion of food waste: A review focusing on process stability. Bioresour. Technol. 2018, 248, 20–28. [Google Scholar] [CrossRef]
  63. Dhar, H.; Kumar, P.; Kumar, S.; Mukherjee, S.; Vaidya, A.N. Effect of organic loading rate during anaerobic digestion of municipal solid waste. Bioresour. Technol. 2016, 217, 56–61. [Google Scholar] [CrossRef]
  64. Li, D.; Chen, L.; Liu, X.; Mei, Z.; Ren, H.; Cao, Q.; Yan, Z. Instability mechanisms and early warning indicators for mesophilic anaerobic digestion of vegetable waste. Bioresour. Technol. 2017, 245, 90–97. [Google Scholar] [CrossRef]
  65. Li, D.; Ran, Y.; Chen, L.; Cao, Q.; Li, Z.; Liu, X. Instability diagnosis and syntrophic acetate oxidation during thermophilic digestion of vegetable waste. Water Res. 2018, 139, 263–271. [Google Scholar] [CrossRef] [PubMed]
  66. Wu, D.; Li, L.; Peng, Y.; Yang, P.; Peng, X.; Sun, Y.; Wang, X. State indicators of anaerobic digestion: A critical review on process monitoring and diagnosis. Renew. Sustain. Energy Rev. 2021, 148, 111260. [Google Scholar] [CrossRef]
  67. Espinoza-Escalante, F.M.; Pelayo-Ortíz, C.; Navarro-Corona, J.; González-García, Y.; Bories, A.; Gutiérrez-Pulido, H. Anaerobic digestion of the vinasses from the fermentation of Agave tequilana Weber to tequila: The effect of pH, temperature and hydraulic retention time on the production of hydrogen and methane. Biomass Bioenergy 2009, 33, 14–20. [Google Scholar] [CrossRef]
  68. Sun, H.; Ni, P.; Angelidaki, I.; Dong, R.; Wu, S. Exploring stability indicators for efficient monitoring of anaerobic digestion of pig manure under perturbations. Waste Manag. 2019, 91, 139–146. [Google Scholar] [CrossRef]
  69. Casallas-Ojeda, M.R.; Marmolejo-Rebellón, L.F.; Torres-Lozada, P. Identification of factors and variables that influence the anaerobic digestion of municipal biowaste and food waste. Waste Biomass Valorization 2021, 12, 2889–2904. [Google Scholar] [CrossRef]
  70. Belhadj, S.; Joute, Y.; El Bari, H.; Serrano, A.; Gil, A.; Siles, J.Á.; Chica, A.F.; Martín, M.Á. Evaluation of the anaerobic co-digestion of sewage sludge and tomato waste at mesophilic temperature. Appl. Biochem. Biotechnol. 2014, 172, 3862–3874. [Google Scholar] [CrossRef]
  71. Trombino, S.; Cassano, R.; Procopio, D.; Di Gioia, M.L.; Barone, E. Valorization of tomato waste as a source of carotenoids. Molecules 2021, 26, 5062. [Google Scholar] [CrossRef] [PubMed]
  72. Li, L.; He, Q.; Wei, Y.; He, Q.; Peng, X. Early warning indicators for monitoring the process failure of anaerobic digestion system of food waste. Bioresour Technol. 2014, 171, 491–494. [Google Scholar] [CrossRef] [PubMed]
  73. Boe, K.; Angelidaki, I. Pilot-scale application of an online VFA sensor for monitoring and control of a manure digester. Water Sci. Technol. 2012, 66, 2496–2503. [Google Scholar] [CrossRef]
  74. Boe, K.; Batstone, D.J.; Steyer, J.; Angelidaki, I. State indicators for monitoring the anaerobic digestion process. Water Res. 2010, 44, 5973–5980. [Google Scholar] [CrossRef] [PubMed]
  75. Labatut, R.A.; Gooch, C.A. Monitoring of Anaerobic Digestion Process to Optimize Performance and Prevent System Failure. 2014. Available online: https://ecommons.cornell.edu/server/api/core/bitstreams/9074a3d3-057f-497d-a2f5-ffd7d43fe2f3/content (accessed on 23 August 2024).
Figure 1. A flow diagram of the process for obtaining the liquid fraction of tomato residue.
Processes 12 01923 g001
Figure 2. This figure illustrates the tomato residue in its different forms throughout the liquid fraction extraction process. (a) shows the tomato residue freshly collected from the traditional market, exhibiting high moisture content due to its natural characteristics. (b,c) depict the tomato residue after the solid–liquid separation phase. (b) highlights the solid fraction, primarily composed of tomato skin and seeds, while (c) presents the liquid fraction (TWLF1) after filtration, which served as the substrate for treatment in the anaerobic reactor.
Processes 12 01923 g002
Figure 3. Schematic diagram of anaerobic fixed biofilm reactor (ABFR).
Processes 12 01923 g003
Figure 4. Initial kinetics with 500 mL of TWLF1.
Processes 12 01923 g004
Figure 5. Biogas production rate with semi-continuous feed of 500 mL of TWLF1.
Processes 12 01923 g005
Figure 6. Biogas production rate with semi-continuous feed of 700 mL of TWLF1.
Processes 12 01923 g006
Figure 7. Biogas production rate with semi-continuous feed of 900 mL of TWLF1.
Processes 12 01923 g007
Figure 8. Alkalinity trends across different operational stages in the AFBR.
Processes 12 01923 g008
Figure 9. Effluent monitoring of COD, VSs, and TSs during varying organic load stages.
Processes 12 01923 g009
Figure 10. Monitoring of pH and cumulative biogas production across operational stages.
Processes 12 01923 g010
Figure 11. One-day cumulative biogas production and biogas production rate across all three operational stages.
Processes 12 01923 g011
Table 1. Experimental phases and operating conditions.
StageSpecific StagePeriod (Days)Conditions
Preliminary stagesStartup68 Recirculation: every 12 h, flow rate: 300 mL/min.
Initial semi-continuous7Feed: TWFL2, 125 mL for 7 days, then 250 mL for 5 days.
Stabilization114Feed: TWLF1, 500 mL for 114 days, HRT: 1–8 days.
Operational stagesInitial kinetic48Feed: TWLF1, 500 mL. All substrate was consumed.
Stage 128Feed: TWLF1, 500 mL, 3.2 gCOD/L·d.
Stage 232Feed: TWLF1, 700 mL, 4.35 gCOD/L·d.
Stage 326Feed: TWLF1, 900 mL, 6.26 gCOD/L·d.
Table 2. Physicochemical analyses and reference methods.
ParameterMethod of AnalysisReference Method
pHDigital pH meter with bufferASTM D1293-18 [27]
COD and sCODHACH spectrophotometer at 620 nmAPHA Standard Methods 5220 D [28]
TSs and VSsGravimetric methodNMX-AA-034-SCFI-2015 [29]
Biogas productionLiquid displacement methodNot applicable
CH4 contentGas chromatography (Buck Mod. 310)ASTM D1946-12 [30]
AlkalinityAcid–base titrationMethod according to Ripley et al. [26]
Table 3. Average values for tomato liquid fraction characterization.
ParameterUnitValue
pHpH unit4.36 ± 0.11
CODg/L58.44 ± 4.75
sCODg/L46.70 ± 5.04
TSsg/L3.95 ± 0.336
VSs (% of TSs)%87.75 ± 1.87
Ash%12.25 ± 1.87
Moisture%96.05 ± 0.36
Table 4. Methane content in different operational stages.
Stage Sampling Period (Day)CH4 Content (%)
1 (500 mL of TWLF1)1569
2169
2969
2 (700 mL of TWLF1)3065
3669
4069
3 (900 mL of TWLF1)6872
7575
8071
8478
Outside the study8762
9173
9469
Disclaimer/Publisher’s Note: The statements, opinions and data contained in all publications are solely those of the individual author(s) and contributor(s) and not of MDPI and/or the editor(s). MDPI and/or the editor(s) disclaim responsibility for any injury to people or property resulting from any ideas, methods, instructions or products referred to in the content.

