Article

Optimization of Residential Hydrogen Facilities with Waste Heat Recovery: Economic Feasibility across Various European Cities

by
Evangelos E. Pompodakis
1,
Arif Ahmed
2,
Georgios I. Orfanoudakis
3 and
Emmanuel S. Karapidakis
3,*
1
Institute of Energy, Environment and Climatic Change, Hellenic Mediterranean University, 71410 Heraklion, Greece
2
Power Systems Consultants, Burnaby, BC V5G 4Y2, Canada
3
School of Engineering, Power Systems and Energy Engineering, Hellenic Mediterranean University, 71410 Heraklion, Greece
*
Author to whom correspondence should be addressed.
Processes 2024, 12(9), 1933; https://doi.org/10.3390/pr12091933
Submission received: 13 August 2024 / Revised: 5 September 2024 / Accepted: 6 September 2024 / Published: 9 September 2024
(This article belongs to the Special Issue Energy Storage Systems and Thermal Management)

Abstract

:
The European Union has established ambitious targets for lowering carbon dioxide emissions in the residential sector, aiming for all new buildings to be “zero-emission” by 2030. Integrating solar generators with hydrogen storage systems is emerging as a viable solution for achieving these goals in homes. This paper introduces a linear programming optimization algorithm aimed at improving the installation capacity of residential solar–hydrogen systems, which also utilize waste heat recovery from electrolyzers and fuel cells to increase the overall efficiency of the system. Analyzing six European cities with diverse climate conditions, our techno-economic assessments show that optimized configurations of these systems can lead to significant net present cost savings for electricity and heat over a 20-year period, with potential savings up to EUR 63,000, which amounts to a 26% cost reduction, especially in Southern Europe due to its abundant solar resources. Furthermore, these systems enhance sustainability and viability in the residential sector by significantly reducing carbon emissions. Our study does not account for the potential economic benefits from EU subsidies. Instead, we propose a novel incentive policy that allows owners of solar–hydrogen systems to inject up to 20% of their total solar power output directly into the grid, bypassing hydrogen storage. This strategy provides two key advantages: first, it enables owners to profit by selling the excess photovoltaic power during peak midday hours, rather than curtailing production; second, it facilitates a reduction in the size—and therefore cost—of the electrolyzer.

1. Introduction

1.1. Motivation

The building sector significantly influences greenhouse gas (GHG) emissions, contributing 35% of the EU’s energy-related emissions in 2021. Emissions stem both from the direct use of fossil fuels within buildings, such as oil and gas in heating systems, and from the energy consumed to produce electricity and heat for buildings, including for water heaters, lighting, electronic devices, and cooling systems [1]. In response, the European Green Deal, the Renovation Wave Initiative, and the EU’s recovery plan prioritize significant reductions in GHG emissions and energy use in buildings. Furthering these efforts, the REPowerEU plan, unveiled by the European Commission in May 2022, aims to sever the EU’s reliance on Russian fossil fuels and address the climate crisis. It advocates for increased savings and enhanced energy efficiency in buildings, primarily guided by the ongoing negotiations of the Energy Performance of Buildings Directive. Additionally, the plan introduces the European Solar Rooftop Initiative, proposing a mandatory EU-wide solar rooftop obligation for specific building categories [1]. Since 2020, the EU has required that all new buildings meet “nearly zero energy” standards. This requirement is set to evolve, with “zero-emission buildings” standards taking effect in 2028 for new buildings owned by public bodies and in 2030 for all other new buildings [2].
The transition to a carbon-free building sector hinges on the implementation of efficient, small-scale hybrid renewable energy and storage systems. Solar generators paired with hydrogen storage systems have emerged as a promising option for the residential sector, even in applications below 25 kW [3], to meet the goal of achieving “zero-emission buildings”. However, the expansion of solar–hydrogen residential systems faces two significant challenges: the high costs of electrolyzers (ELZs) and fuel cells (FCs), and the low roundtrip efficiency of hydrogen, which can dip below 35% [4]. The first challenge—cost—is anticipated to diminish in the coming years as the commercialization of ELZ and FC technologies drives down prices [5]. As for the second challenge, efforts to boost hydrogen efficiency are underway, employing various strategies such as improving the design of fuel cells and electrolyzers [6], implementing intelligent power management [7], advancing power electronic interfaces [7], and utilizing the waste heat of ELZs and FCs for heating purposes [8]. Of these, the utilization of waste heat proves most effective, as it allows the waste heat to be captured and utilized by the coupled heating system, thereby enhancing overall energy efficiency.

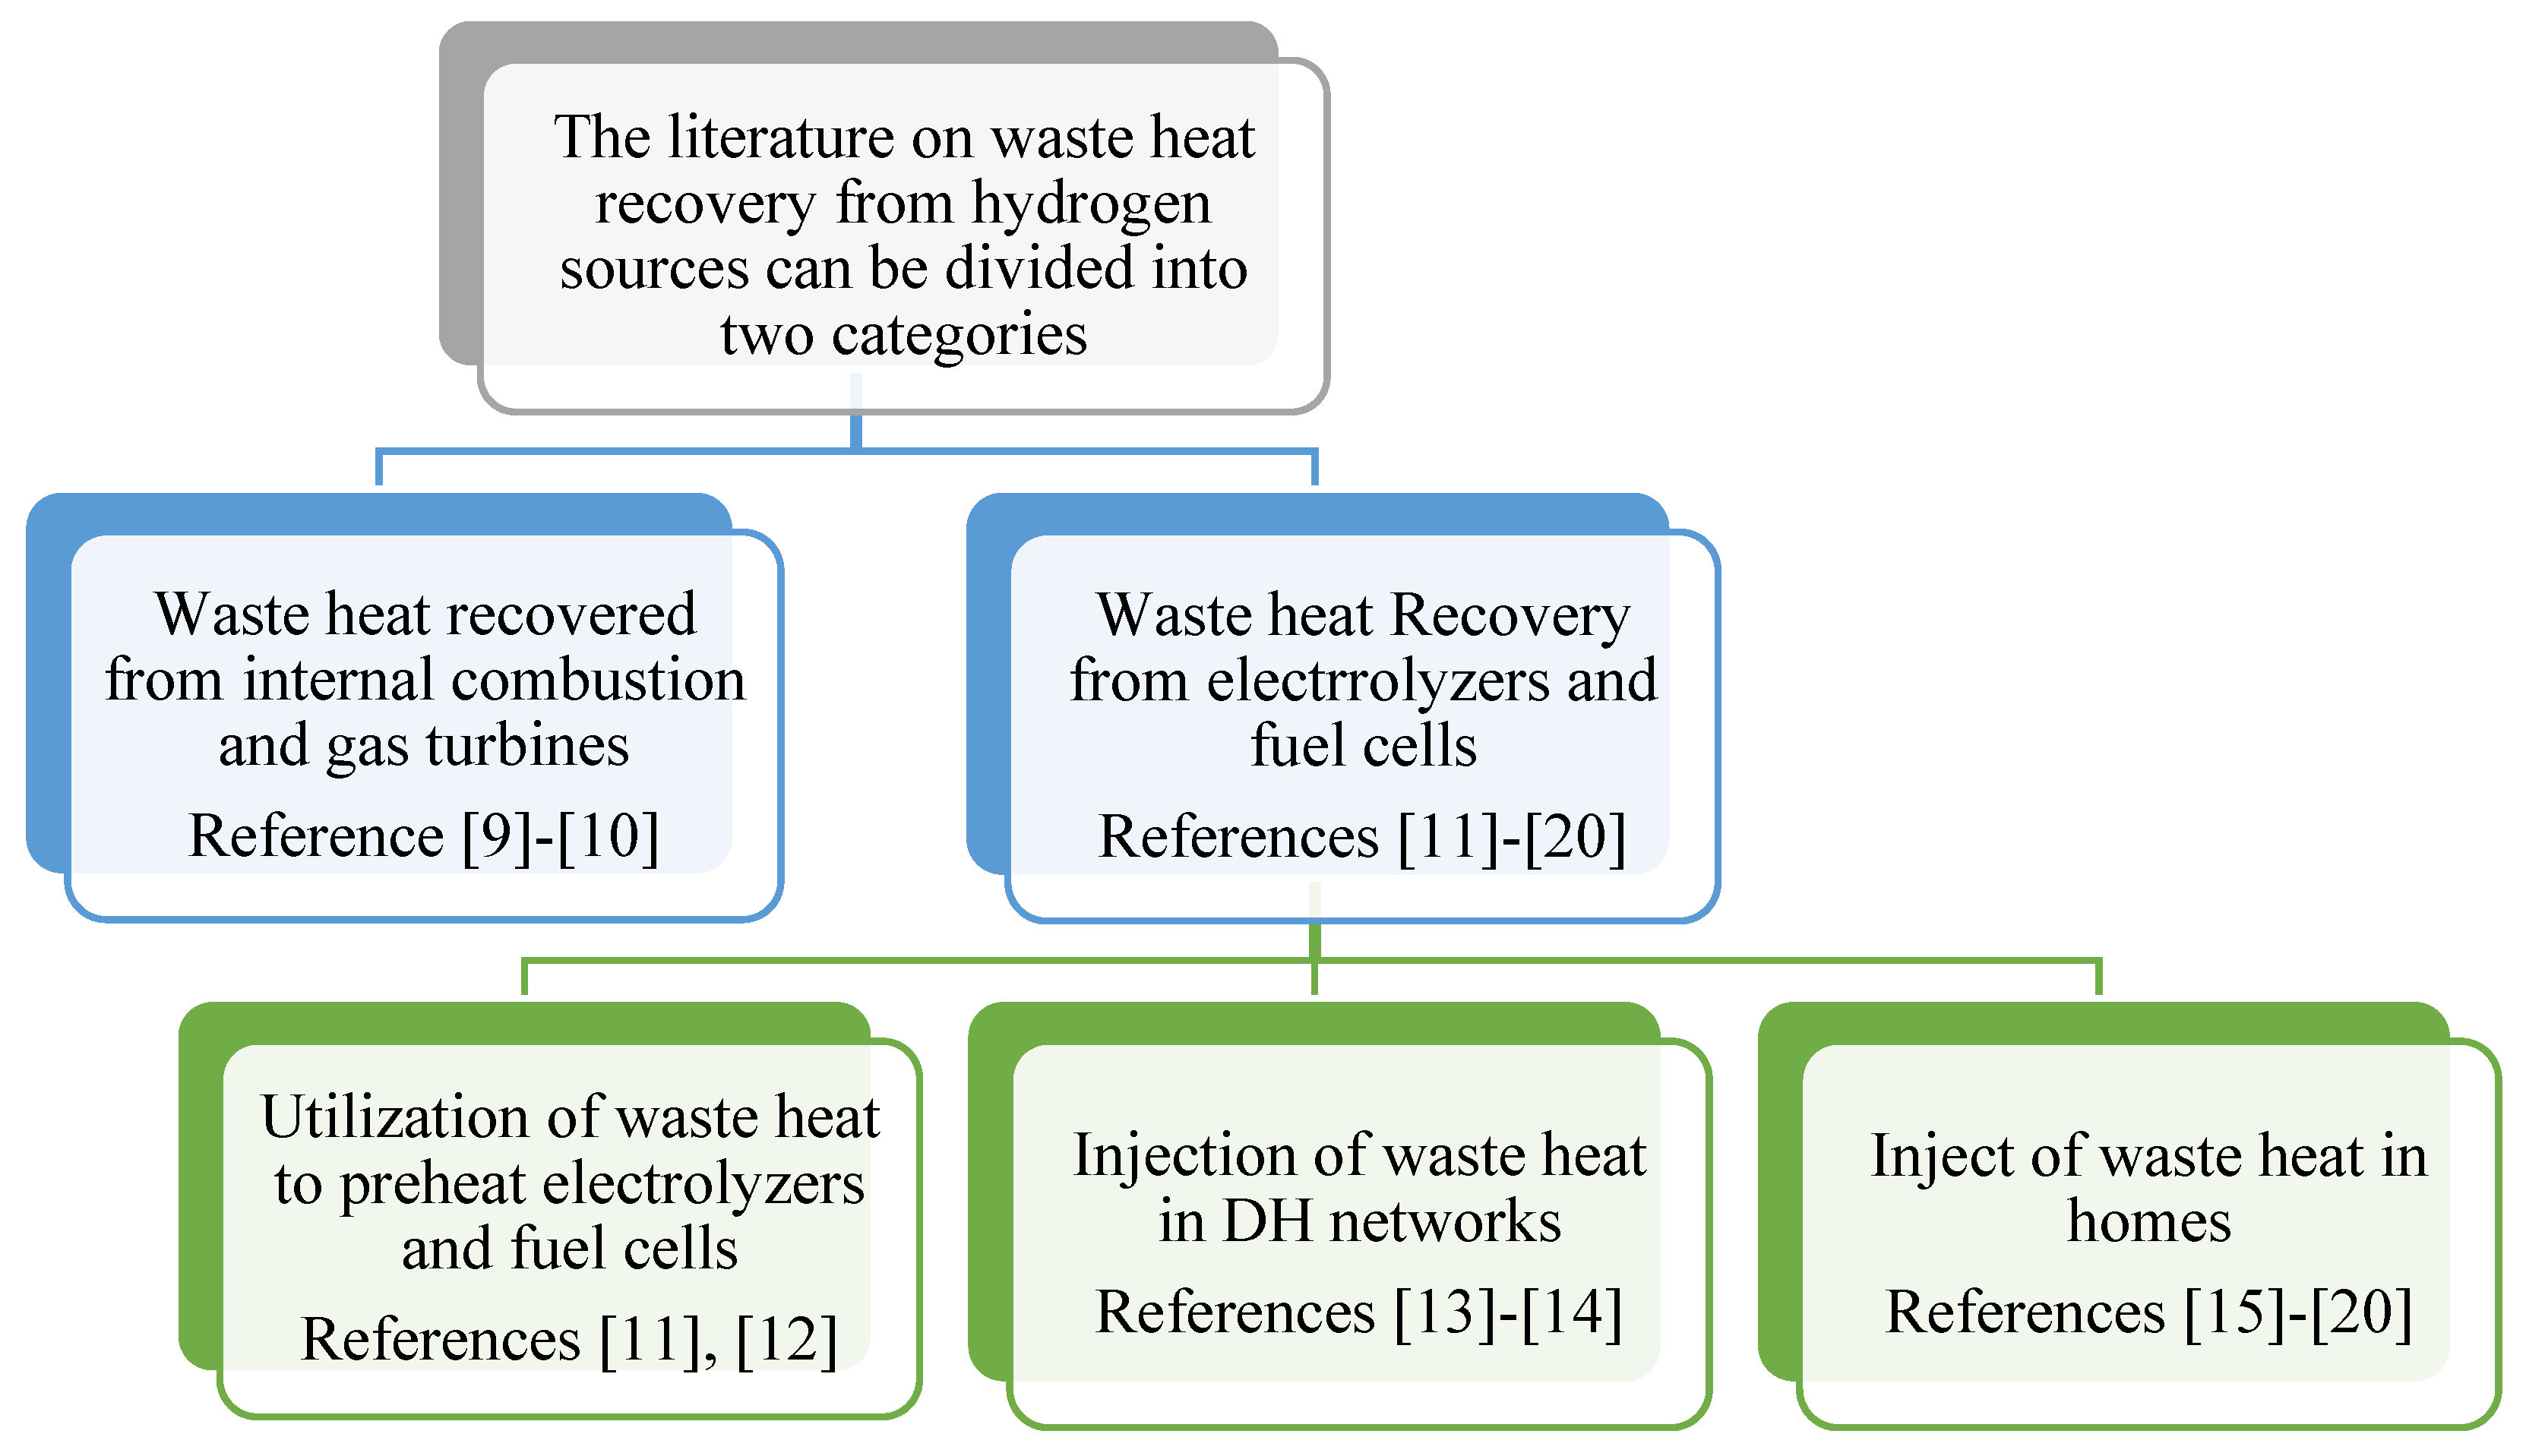
1.2. Literature Review

The potential for recovering waste heat from hydrogen sources has been thoroughly investigated for a wide range of applications, encompassing distinct heat (DH) networks, residential buildings, commercial buildings, telecommunications infrastructures, and academic institutions. Figure 1 presents a classification of the existing literature on waste heat recovery from hydrogen sources. The research is categorized by the source of the heat (e.g., hydrogen-fueled gas turbines, electrolyzers etc.), the scale of the source (utility- or domestic-scale), and the method of heat utilization, such as directing waste heat to DH networks, to electrolyzers, or directly into buildings’ heating systems.
Waste heat recovery from pure or hydrogen-blended gas turbines has been the focus of several studies [9,10]. Specifically, Skordoulias et al. [9] conducted a techno-economic analysis of a utility-scale (several megawatts) gas turbine fueled by a natural gas–hydrogen mixture with integrated waste heat recovery. Their investigation across various natural gas–hydrogen ratios revealed that, currently, generating electricity is less expensive when the turbine is powered solely by natural gas. However, they predict that by 2030, hydrogen will become a more cost-effective fuel than natural gas due to advancements in electrolyzer technology. An extensive review of heat recovery methods for hydrogen-blended gas turbines is provided in [10].
The waste heat is utilized in [11,12] to increase the temperature of electrolyzers, thereby enhancing their efficiency. Specifically, Nguyen et al. [11] developed a theoretical model of a Proton Exchange Membrane Fuel Cell (PEMFC) equipped with a heat recovery system designed to preheat its inlet air, thereby mitigating performance degradation when operating in extremely cold environments. This model was evaluated through an exergy analysis. To simulate the annual load profile of a PEMFC within a standalone hybrid solar–hydrogen system—integrated with batteries for telecommunication applications in cold climates—the researchers utilized HOMER and TRNSYS software tools. By employing a high-effectiveness heat exchanger, the inlet air temperature of the PEMFC was successfully raised from sub-zero to well above freezing. A case study conducted in Eureka, Canada, demonstrated that using the heat recovery system in place of an electric heater could save approximately 30% of the electrical energy generated annually by the PEMFC. Bilbao et al. [12] conducted an annual simulation of a system comprising an alkaline ELZ and a photovoltaic (PV) array. This study quantified and valorized the waste heat emitted by the electrolyzer, using it to preheat the water of the ELZ to its optimal operating temperature of 80 °C, thereby enhancing its efficiency. As a result of this integration, the system’s annual hydrogen production increased by 0.22%, and the electrolyzer’s efficiency improved by 0.33%. This modest improvement can be attributed to the fact that the water flow in the ELZ system is 30 times less than the available waste heat, resulting in suboptimal waste heat recovery.
The waste heat of utility-scale ELZs is harnessed in [13,14] to feed a DH network. Merilainen et al. [13] explore the techno-economic feasibility of harnessing waste heat from an off-grid alkaline water electrolyzer for use in a DH network under Nordic conditions. Their findings indicate that even with a 100% DH demand coverage rate, the levelized cost of heat (LCOH) would be 44 EUR/MWh, with heat pumps representing the most significant expense. Comparing these results with Finland’s projected renewable hydrogen production capabilities, the study suggests that by 2040, it might be possible to meet the entire country’s DH demand through this approach. Frassi et al. [14] analyze the technical and economic implications of utilizing excess heat from an alkaline electrolyzer, powered by surplus renewable energy, to supply a DH network. Their study assesses how heat utilization and sales affect system efficiency, economic viability, and hydrogen pricing. The findings reveal that incorporating heat recovery improves system efficiency by over 10%, and in an optimistic scenario for heat sales, the LCOH reaches 1.6 EUR/kg.
The waste heat of ELZs is exploited in [15,16,17,18,19,20] for domestic use. Ozawa et al. [15] assessed the impact of integrating Fuel Cell Combined Heat and Power (FC-CHP) systems, fueled by the city gas network, into Japanese homes with varying attributes. Their study compares the total costs and carbon emissions of residential energy use between these FC-CHP systems and conventional energy systems. The findings indicate that FC-CHP systems offer economic benefits primarily for families of four with teenage children. The study also highlights the need for further development of low-output FC-CHP systems to extend energy cost savings to a broader range of households.
Romdhane et al. [16] conducted a study on a neighborhood in France powered by an FC-CHP system. They presented, developed, and validated a mathematical model of the system using referenced data. Their research focused on the effects of various parameters—including fuel cell temperature, working pressure, gas humidity, and current density—on the FC-CHP system’s performance. The goal was to optimize the system’s performance and identify the optimal operating conditions. The study also explored the energy feasibility of the FC-CHP system through dynamic simulations and evaluated its capability to meet the local energy demands. A comparative analysis with a conventional system, which uses a natural gas-fired boiler for heating and domestic hot water along with grid electricity, revealed that the FC-CHP system could reduce primary energy consumption by about 30%, highlighting its potential for energy savings and environmental benefits.
Huckebrink et al. [17] developed a lumped capacitance model for buildings within an energy systems optimization framework. This model capitalizes on the inherent flexibility offered by the controllable temperatures of indoor environments and building structures to optimize the scheduling of temperature-impacting appliances, such as gas boilers, heat pumps, electrolyzers, and fuel cells. The study derives optimal investment strategies for these appliances and hydrogen storage, considering scenarios both with and without building refurbishments. These hydrogen-based appliances play a crucial role in addressing flexibility challenges and facilitate sector coupling by utilizing fuel cells that not only generate electricity during winter but also harness typically discarded waste heat.
Peppas et al. [18] developed a hybrid renewable-hydrogen system at the Lavrion Technological & Cultural Park in Attica, Greece, designed to supply both electricity and heating for an office building within the park. The system primarily harnesses energy from renewable sources to meet immediate electrical demands, while surplus energy is converted into hydrogen. This hydrogen is then used either for direct heating through combustion or for generating both heat and electricity via fuel cells.
Els van der Roest et al. [19] investigated various designs for harnessing waste heat from a 2.5 MWel polymer electrolyte membrane ELZ. Their analysis encompasses three scenarios: local heat consumption with and without a heat pump, and integration into a district heating network. The findings indicate that up to 15% of the electrical input to the ELZ can be utilized by a heat consumer, which elevates the overall system efficiency to 90%.
Qiang Hu et al. [20] extensively analyzed the electrothermal coupling in the electrolysis process, optimizing both hydrogen production and heat generation. They developed an optimal control model for a power-to-hydrogen and heat microgrid and conducted a case study to validate this model. Their findings emphasize the critical role of temperature in the electrolysis process, as it significantly affects the allocation of electricity for hydrogen and heat generation. Furthermore, the study demonstrates that utilizing waste heat can enhance the overall system efficiency, despite potential decreases in the efficiency of the power-to-hydrogen conversion process.

1.3. Research Gap and Contribution

Although there is extensive research on enhancing hydrogen efficiency through waste heat recovery, as seen in the above references, a significant research gap exists in the sizing of the components that make up the residential hydrogen sources and heating facilities. Specifically, none of these studies offer explicit mathematical formulations to concurrently optimize the capacities of photovoltaics (PVs), ELZs, FCs, hydrogen tanks, and heat exchangers (HEs) with the goal of maximizing the economic profit for the facility owner, thus encouraging the proliferation of residential hydrogen systems.
To address this gap, this paper introduces a linear programming (LP) optimization model that utilizes annual residential electric and thermal load profiles, as well as solar radiation data specific to the household’s location. The contributions of this paper are threefold:
  • The development of an LP optimization formulation that determines the optimal capacities for all the components of residential solar–hydrogen systems involving waste heat recovery. This formulation aims to boost the owner’s economic returns, thereby enhancing the economic viability of residential hydrogen investments. It guarantees global optimality and avoids the pitfalls of local optima. Additionally, it incorporates an annual optimization horizon to account for all the temporal variations—hourly, daily, and seasonal—in solar variations and electric and thermal loads.
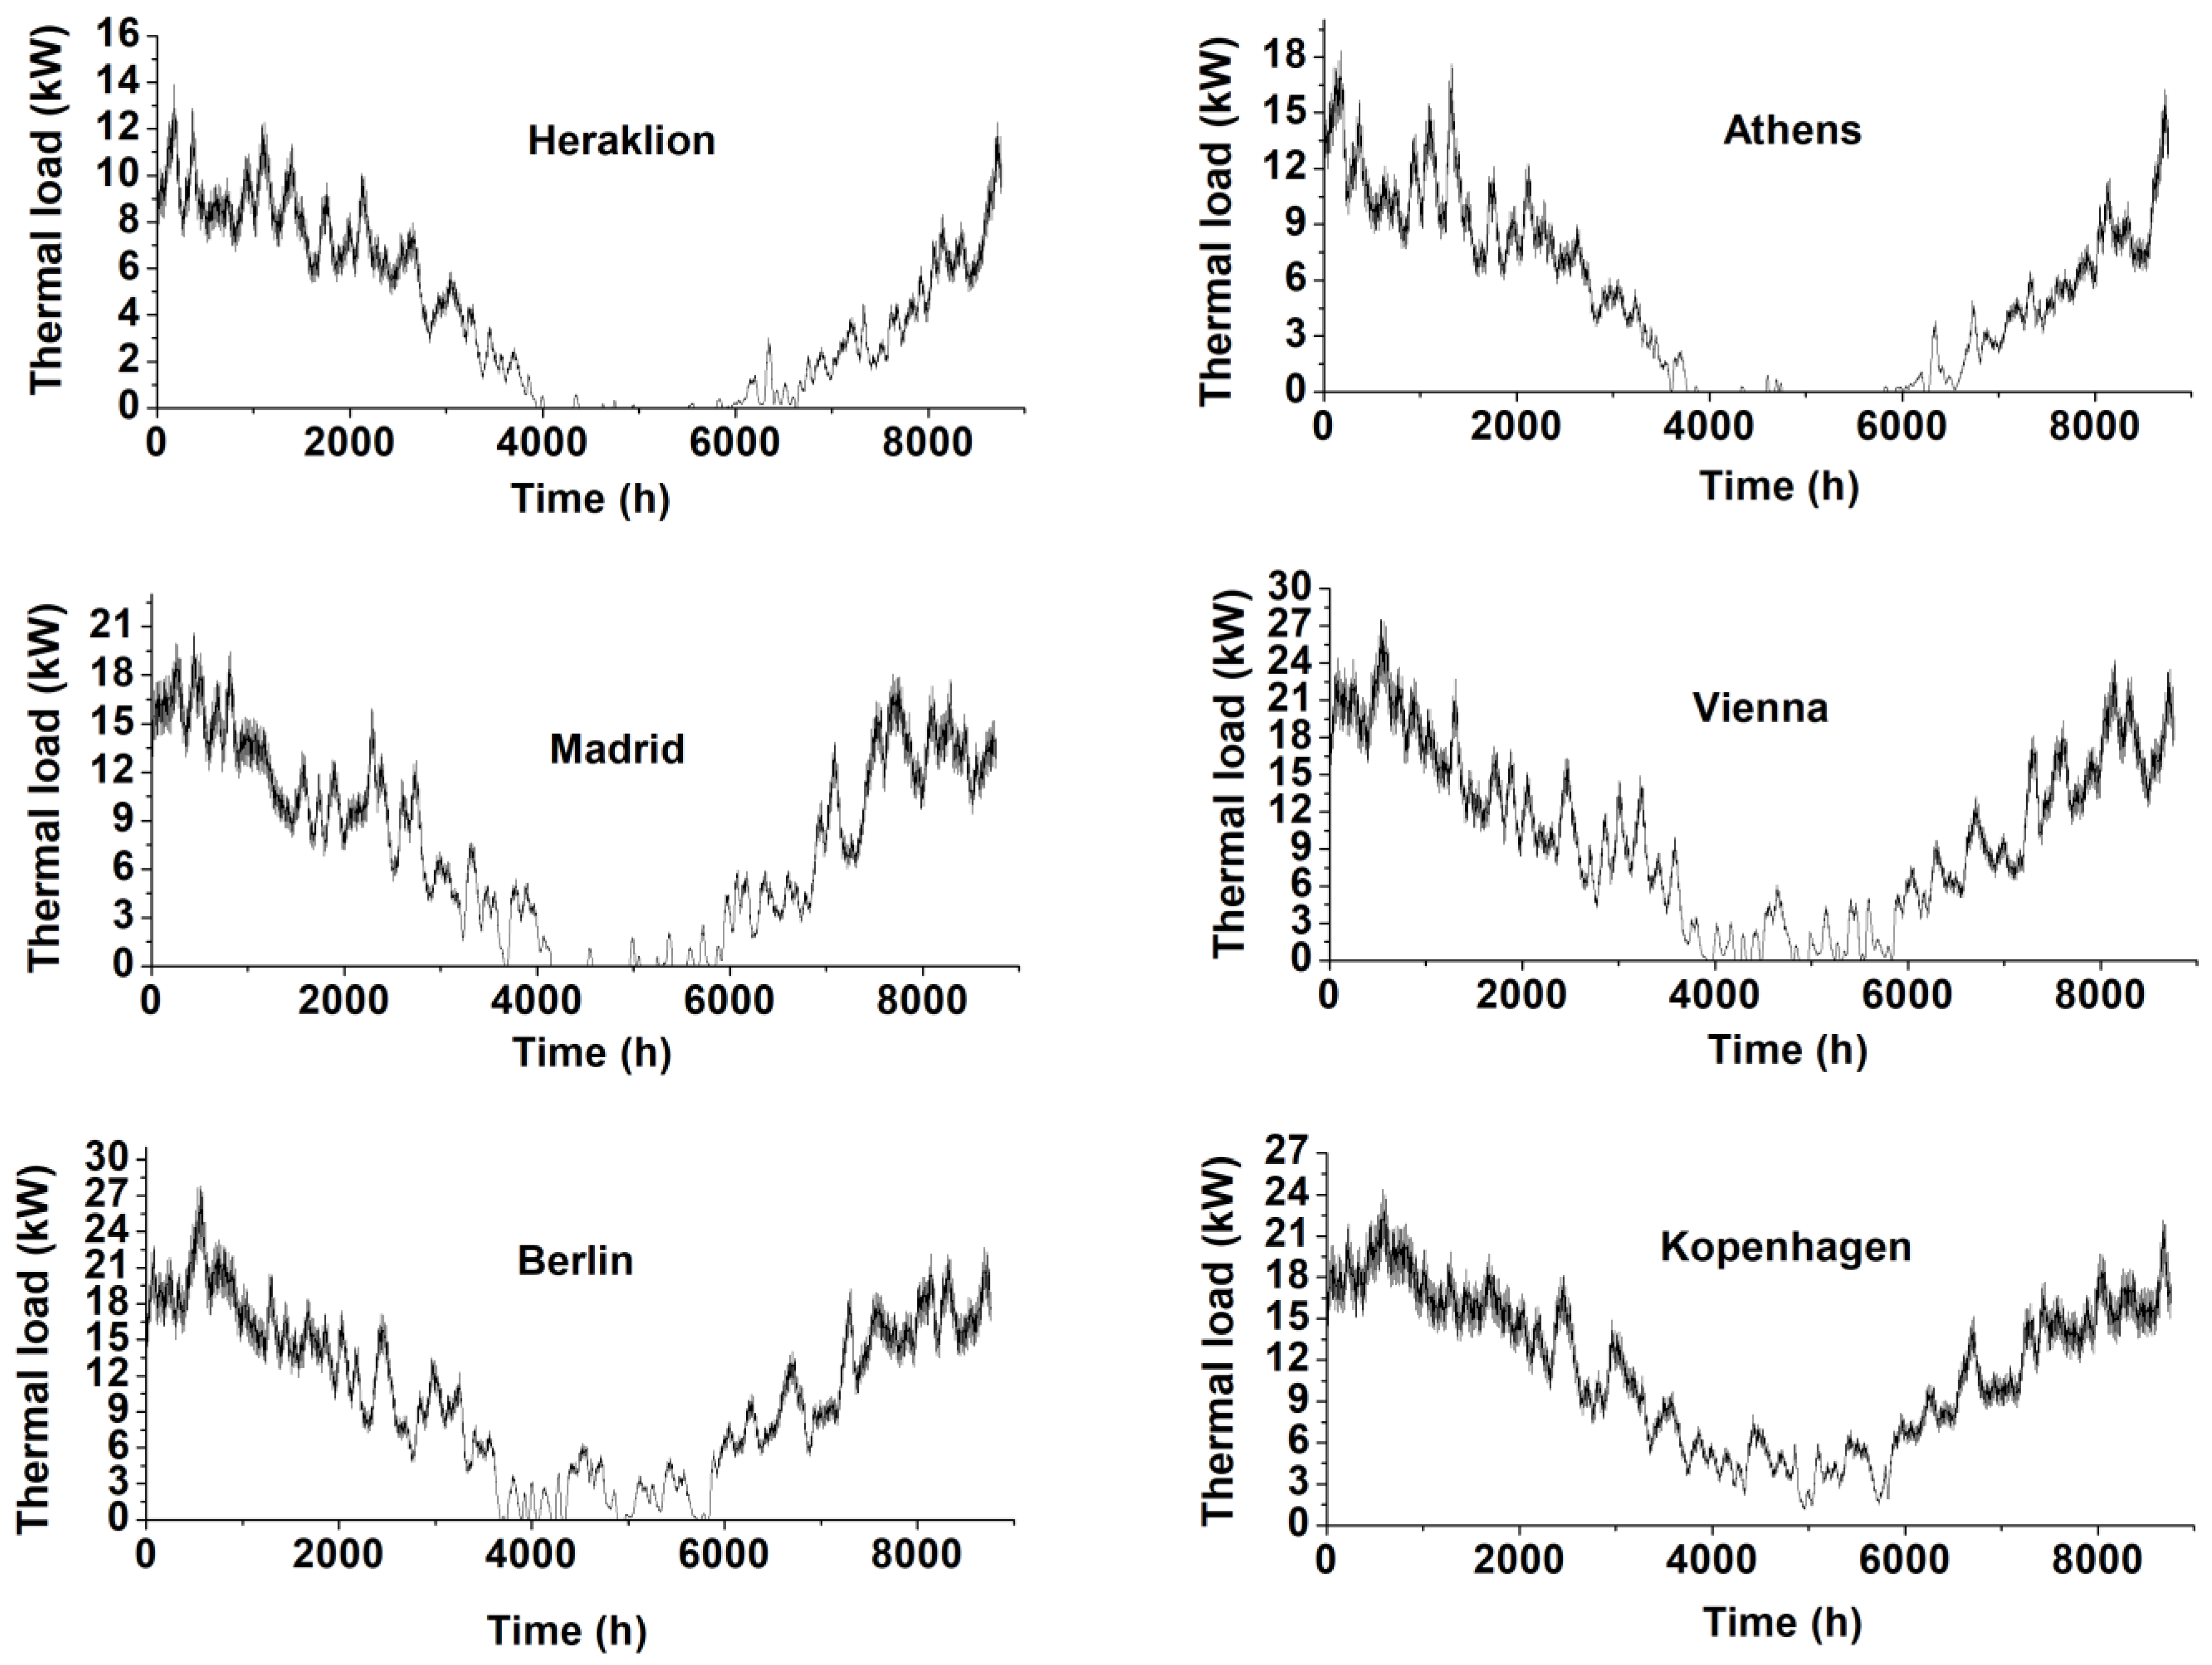
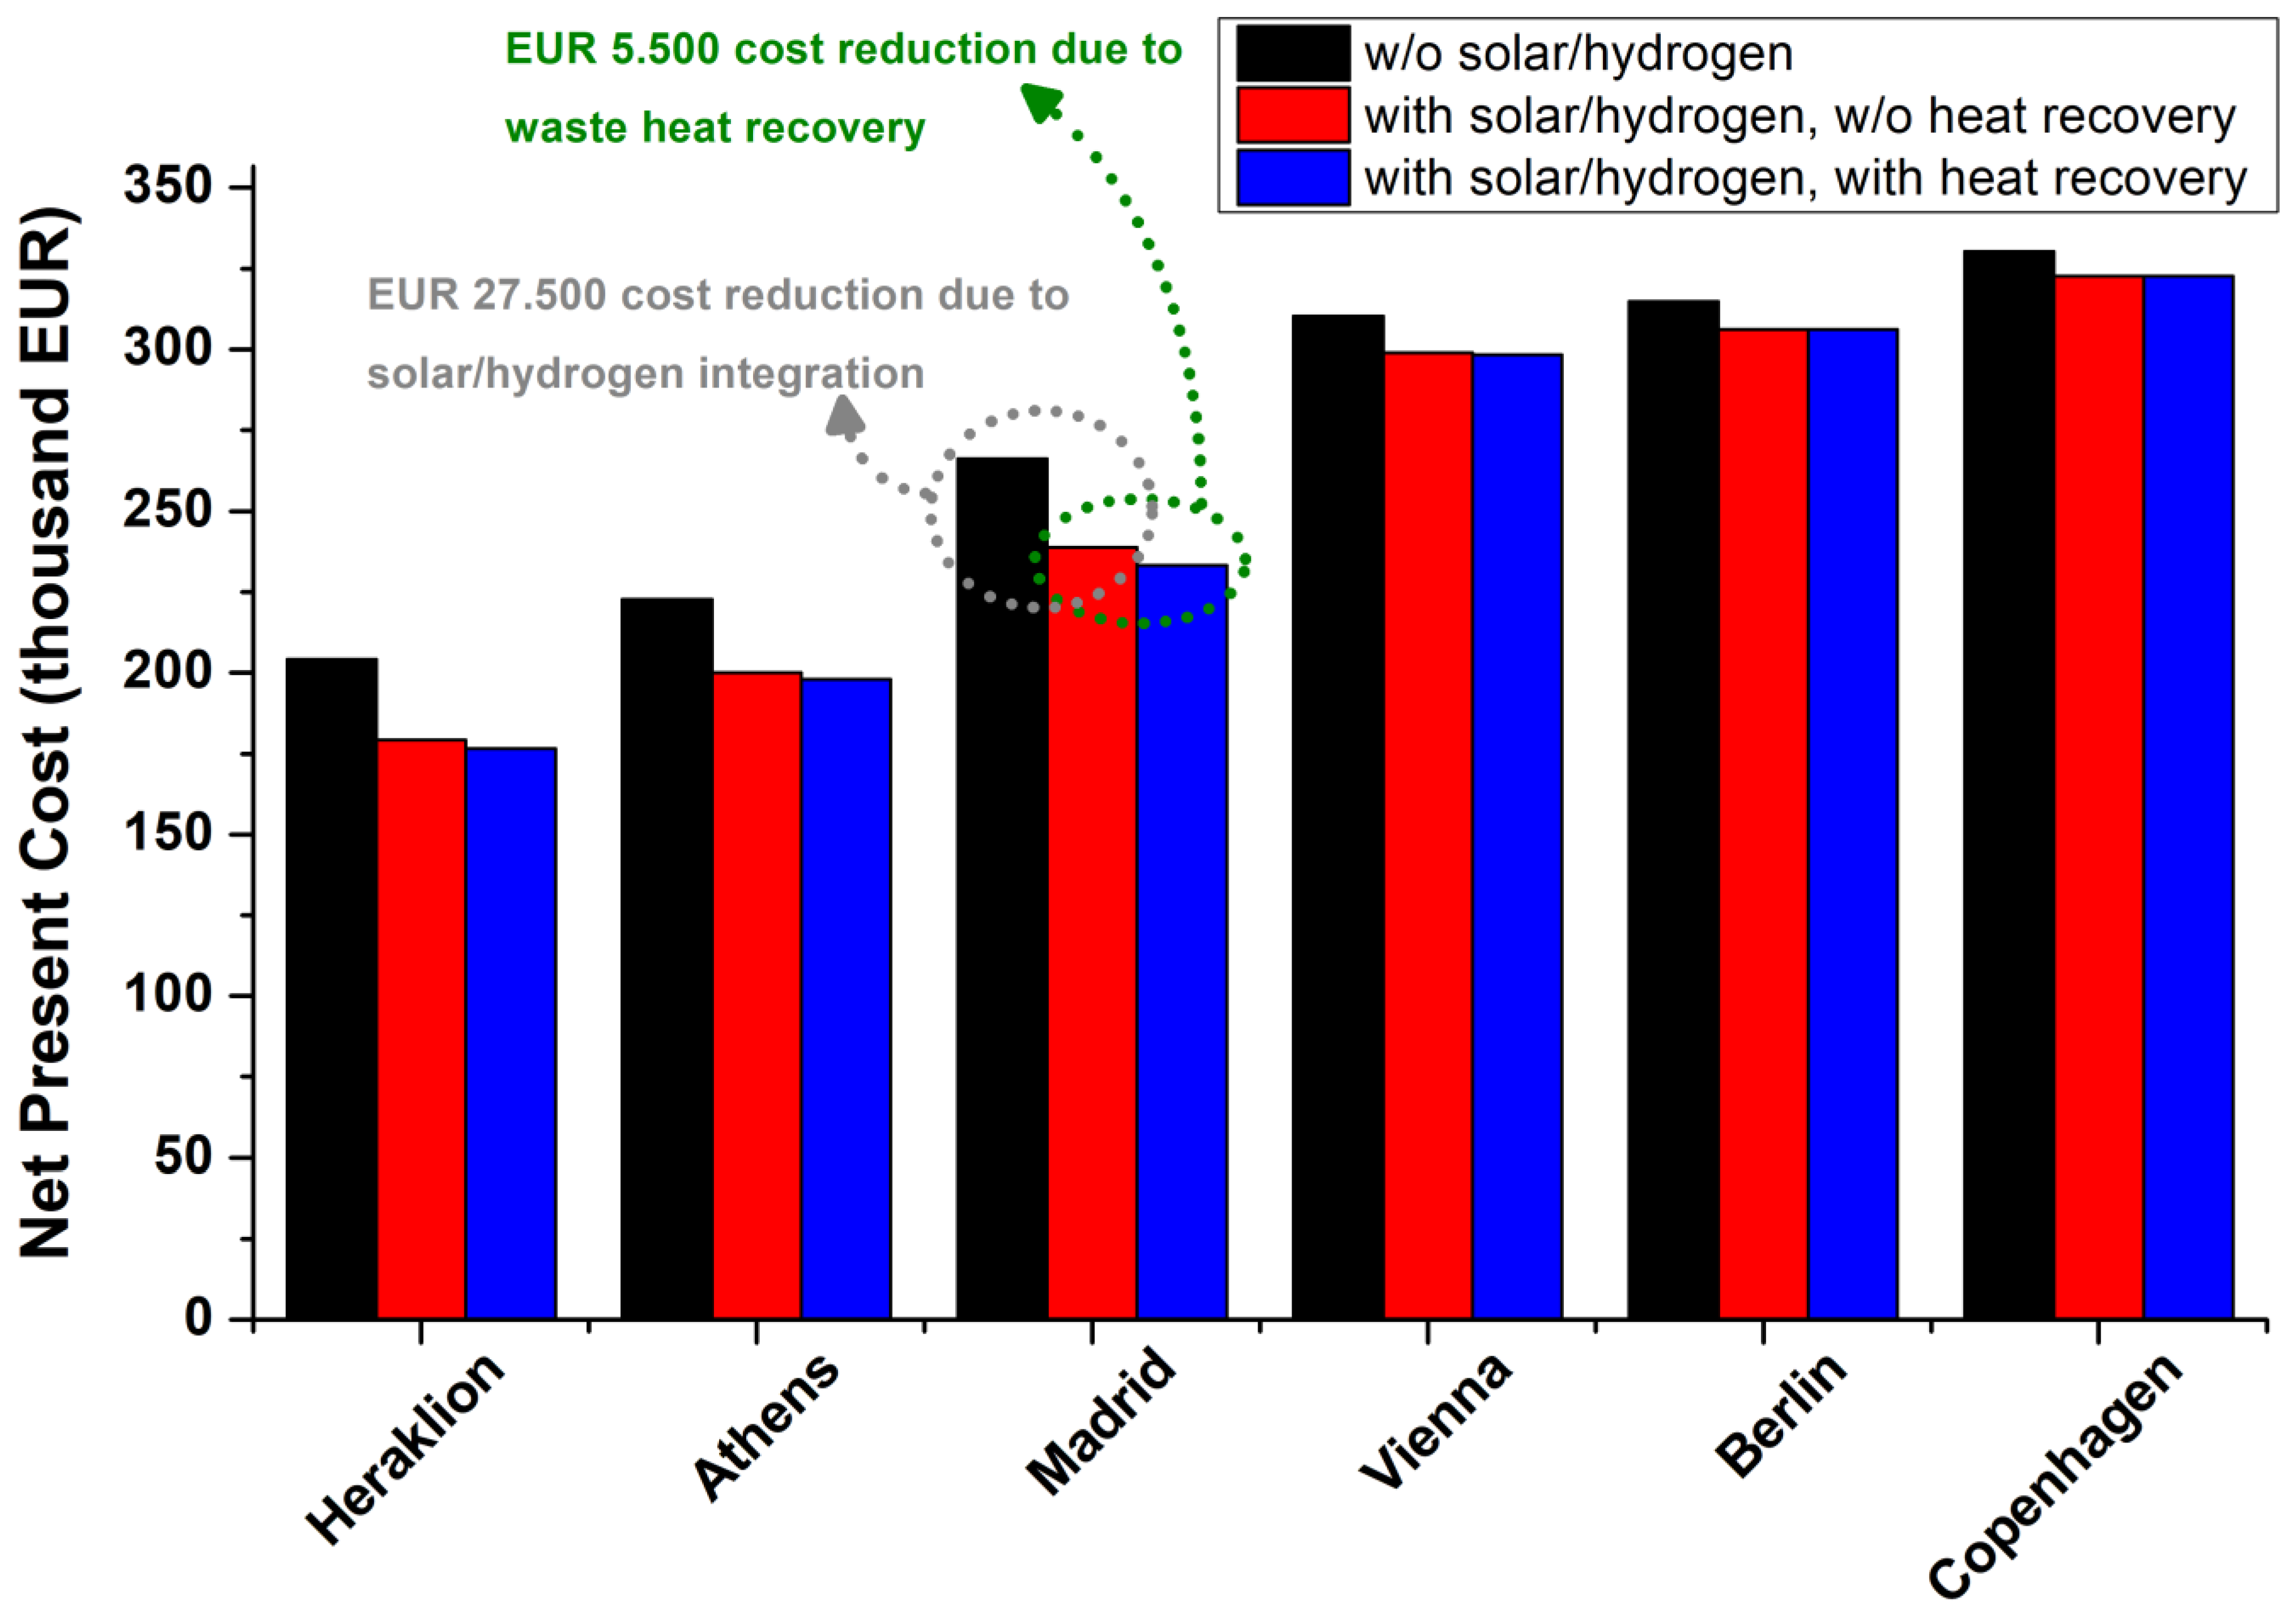
  • A preliminary techno-economic feasibility assessment of residential solar–hydrogen systems across various European regions, which considers the diverse photovoltaic and thermal load profiles characteristic of different European locales.
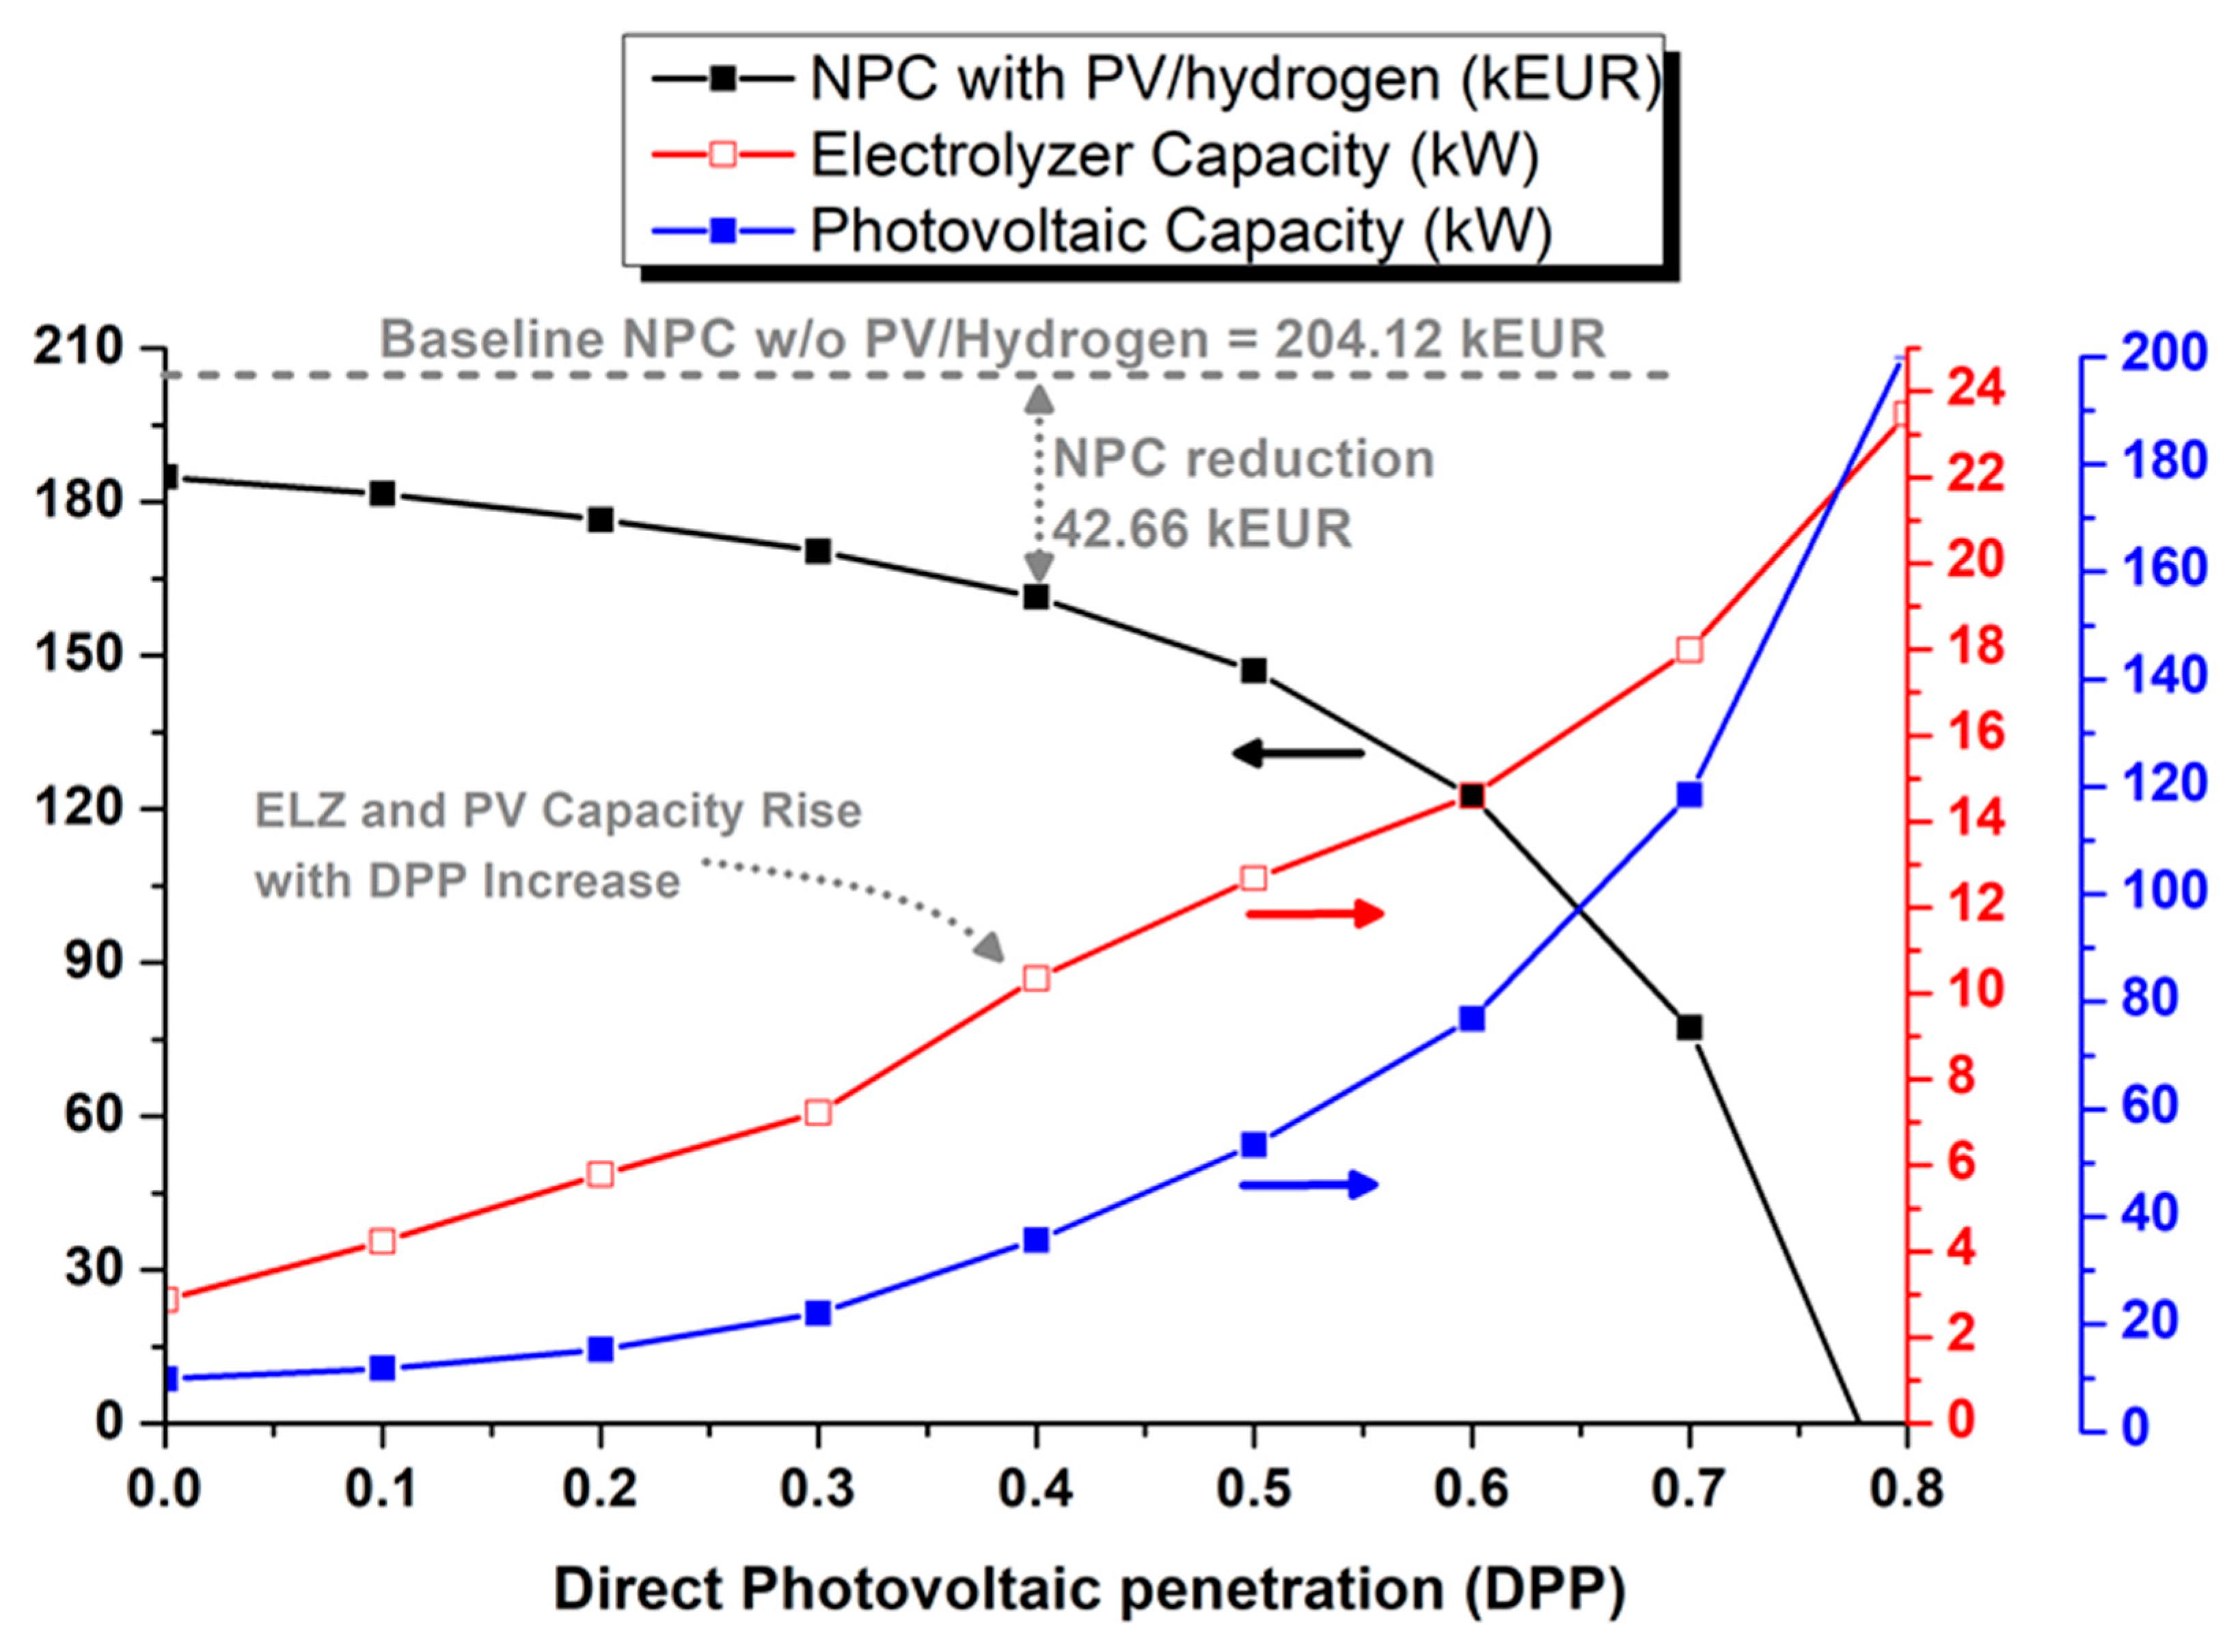
  • It introduces a novel incentive policy that allows owners of solar–hydrogen systems to inject up to 20% of their total solar power output directly into the grid, bypassing hydrogen storage. This policy enables owners to capitalize on selling excess PV power during peak midday hours instead of curtailing it. Moreover, it facilitates a reduction in the size and cost of the electrolyzer. This strategy could significantly enhance investment in residential hydrogen systems, increase their adoption, and reduce costs more sustainably than traditional subsidy policies [21] that are designed to promote a hydrogen economy.

2. Proposed Optimization Approach

Figure 2 illustrates the schematic of a residential green hydrogen-powered rrosumer with waste heat recovery. The PV power primarily meets the household demand P p v , l o a d t while surplus electricity is channeled to hydrogen production via the electrolyzer P e l / z e r t and can also be injected into the grid. This setup ensures flexibility, as it allows for part of the excess PV power to be distributed to the grid ( P g r i d t ), reducing the potential curtailment during high PV output periods, thereby enhancing profit and incentivizing investment. The stored hydrogen is utilized by the fuel cell to supply power during low PV generation periods P f c t . The household’s electric load is supported by the PV power, the fuel cell, and the electricity grid P g , l o a d t , which provides a backup source if the PV and fuel cell power prove insufficient.
Heat generated by the electrolyzer P h e a t , e l t and fuel cell P h e a t , f c t is redirected into the home using two HEs, instead of being released to the environment. As depicted in Figure 3 and noted in reference [19], the output water from the electrolyzer at approximately 62 °C is cooled to 57 °C through a HE, and then recirculated. This recovered heat is then utilized within the home, possibly through underfloor heating systems or radiators, maintaining an efficiency level at which 80% of the heat is reclaimed [19].
The optimization model, detailed in Equations (1)–(18), serves as a crucial tool for maximizing the installed capacities of all components of a residential green hydrogen-powered prosumer with heat recovery. The aim is to optimize the total profit over the project’s lifespan. The model is an LP problem that can be effectively solved using the CPLEX solver in MATLAB 2019b, a sophisticated tool adept at managing LP, mixed integer programming (MIP), and quadratic programming (QP) problems through advanced algorithms like the branch-and-bound method.
The model’s objective function is presented in Equation (1), with constraints laid out in Equations (2)–(18). Constants are denoted with hats ^, while other variables are subject to optimization through the solver.

2.1. Objective Function

The goal of this study is to minimize the net present cost (NPC) of the system over its anticipated lifespan, quantified as 20 years. The NPC is defined in Equation (1) and consists of three terms: the installation cost I n s t a l l a t i o n , the operation and maintenance cost O & M , and the energy transactions T r a n s a c t i o n s with the grids, encompassing both electricity and heating costs throughout the system’s operational life.
N P C = I n s t a l l a t i o n + O & M + T r a n s a c t i o n s
The three terms of (1) are defined below.
I n s t a l l a t i o n = P p v i n s t a l C p v ^ + E h 2 i n s t a l C t a n k ^ + P f c i n s t a l C f c ^ + P e l / z e r i n s t a l C e l / z e r ^ + P h e a t , e l i n s t a l + P h e a t , f c i n s t a l C h e a t ^
O & M = l i f e t i m e ^ 0.03 I n s t a l l a t i o n
T r a n s a c t i o n s = l i f e t i m e ^ t = 0 8760 P g , l o a d t c p u r , e l ^ + P h e a t , p u r c t c p u r , t h ^ l i f e t i m e ^ t = 0 8760 P g r i d t c s e l , e l ^
All variables are provided in the Nomenclature. In this paper, the lifetime is considered to be 20 years, i.e., l i f e t i m e ^ = 20 . The I n s t a l l a t i o n is composed from the installation costs of the photovoltaics, i.e., P p v i n s t a l C p v ^ ; the hydrogen tank, i.e., E h 2 i n s t a l C t a n k ^ ; and the fuel cell and electrolyzer, i.e., P f c i n s t a l C f c ^ , P e l / z e r i n s t a l C e l / z e r ^ . It also includes the installation costs for heat recovery systems associated with the electrolyzer, i.e., P h e a t , e l i n s t a l C h e a t ^ ; and the fuel cell, i.e., P h e a t , f c i n s t a l C h e a t ^ . The annual operation and maintenance costs are calculated as 3% of the initial installation costs. When multiplied by the system’s lifetime, this provides the total O&M expenditure O & M . The final term, T r a n s a c t i o n s , represents the financial impacts of buying and selling electricity and heat to and from the grid. Specifically, the costs of purchasing electricity and heat are denoted by P g , l o a d t c p u r , e l ^ and P h e a t , p u r c t c p u r , t h ^ , respectively. On the other hand, the revenue from selling surplus PV power back to the grid, represented by P g r i d t c s e l , e l ^ , is subtracted, thereby reducing the transaction cost.

2.2. Constraints

The optimization constraints are quoted here. All the variables are defined in the Nomenclature and are depicted in Figure 2. Equation (2) constrains the power produced by the PV to be lower than the maximum available power, based on the installation capacity, i.e., ρ p v t ^ P p v i n s t a l . Note that ρ p v t ^ denotes the normalized power output from the PV system per 1 kW of installed capacity at any given time, t. This coefficient is derived from either historical data or direct measurements at the proposed installation site, capturing the annual variability of solar power availability.
P p v t ρ p v t ^ P p v i n s t a l t { 1 , , 8760 }
Equations (3) and (4) represent the power balance equations of the PV and household electric load, respectively, at any time t.
P p v t = P p v , l o a d t + P g r i d t + P e l / z e r t t { 1 , , 8760 }
P p v , l o a d t + P g , l o a d t + P f c t = P l o a d t ^   t   { 1 ,   , 8760 }  
Equation (5) represents the energy balance equation of the hydrogen tank, relating the stored hydrogen into the hydrogen tank at hour t (i.e., E h 2 t ) and t 1 (i.e., E h 2 t 1 ) , with the input P h 2 , i n t and output P h 2 , o u t t power of hydrogen tank. Equation (6) ensures that the hydrogen tank’s energy content is equal at the beginning and the end of the year, thereby guaranteeing that no energy stored from previous years carries over into the year under examination.
P h 2 , i n t P h 2 , o u t t = E h 2 t E h 2 t 1   t   { 1 ,   , 8760 }
E h 2 1 E h 2 8760 = 0
Equations (7)–(9) constrain the hydrogen storage, the power of the FC, and the power of the ELZ, respectively, to be within their minimum and maximum limits.
0 E h 2 t E h 2 i n s t a l   t   { 1 ,   , 8760 }  
0 P f c t P f c i n s t a l   t   { 1 ,   , 8760 }  
0 P e l / z e r t P e l / z e r i n s t a l   t   { 1 ,   , 8760 }  
Equation (10) establishes a relationship between the hydrogen output of the ELZ and its power consumption, considering the efficiency of the ELZ, denoted as ( n e l / z e r ^ ). Likewise, Equation (11) performs a similar function for the FC.
P h 2 , i n t = n e l / z e r ^ P e l / z e r t   t   { 1 ,   , 8760 }  
P h 2 , o u t t = 1 n f c ^ P f c t   t   { 1 ,   , 8760 }  
Equation (12) details the thermal energy balance, equating the heat consumed by the household at any given time t, denoted as P h e a t t ^ , with the sum of the waste heat recovered from the ELZ and the FC represented as P h e a t , e l t and P h e a t , f c t , respectively, plus the heat procured from the natural gas grid ( P h e a t , p u r c t ). This equation ensures that the household’s total heat requirements are met through both recovered and purchased sources.
P h e a t t ^ = P h e a t , e l t + P h e a t , f c t + P h e a t , p u r c t   t   { 1 ,   , 8760 }
Equation (13) computes the waste heat recovered from the ELZ as a function of the electrical power consumed by the ELZ. More precisely, the waste heat is calculated as 1 n e l / z e r ^ P e l / z e r t , with the assumption that 80% of this waste heat can be recovered by the heat exchanger [19]. Equation (14) ensures that the recovered heat falls between the minimum (0) and the maximum P h e a t , e l i n s t a l capacities of the heat recovery system. Equations (15) and (16) similarly address the heat recovery process from the FC.
P h e a t , e l t 80 % 1 n e l / z e r ^ P e l / z e r t   t   { 1 ,   , 8760 }  
0 P h e a t , e l t P h e a t , e l i n s t a l   t   { 1 ,   , 8760 }
P h e a t , f c t 80 % 1 n f c ^ P f c t   t   { 1 ,   , 8760 }  
0 P h e a t , f c t P h e a t , f c i n s t a l   t   { 1 ,   , 8760 }
Equation (17) allows a maximum portion of photovoltaic energy to be directly injected to the electrical grid, without being diverted for hydrogen production or household consumption. This limit is symbolized here as Direct Photovoltaic Penetration (DPP) and denotes the portion (%) of the total solar power that is allowed to be directly injected to the grid. This strategy constitutes a key innovation of this study and is applied to reduce the curtailment of PV production when it exceeds the combined demand of the electrolyzer and household electricity. As a result, the economic feasibility of residential hydrogen systems is enhanced, enabling a sustainable and economically sound expansion of residential solar–hydrogen projects. Notably, this mild direct injection of solar power can be easily managed by the network operator without causing overload [22,23] or overvoltage problems [24,25], thanks to its limited scale. More details are available in Figures 10 and 11.
t = 1 8760 P g r i d t D P P t = 1 8760 P s o l a r t
Finally, Equation (18) restricts several one-direction variables to be positive.
P s o l a r t , P g r i d t , P h e a t , p u r c t , P p v , l o a d t 0   t   { 1 ,   , 8760 }  
The proposed optimization model is based on several key assumptions outlined below:
Constant ELZ and FC Efficiencies: Despite evidence that the efficiencies of the ELZ and FC vary with current and temperature [14,26], we assume constant efficiencies to facilitate a linear problem formulation. This assumption simplifies the analysis by disregarding the influence of current and temperature variations on the ELZ and FC efficiencies.
No Heat Storage: The model does not account for the storage of heat. Heat generated by the ELZ and FC is either utilized within the home or dissipated externally.
No Waste Heat Utilization for Preheating: Although part of the waste heat could potentially be used to preheat the electrolyzer, thereby enhancing its efficiency during a cold start-up as discussed in references [11,12], this recovery mechanism is beyond the scope of this study.
No Degradation and Aging: The model assumes a constant ELZ and FC efficiency throughout the facility’s operational life, despite a documented degradation rate of 0.19% per 1000 h [19].
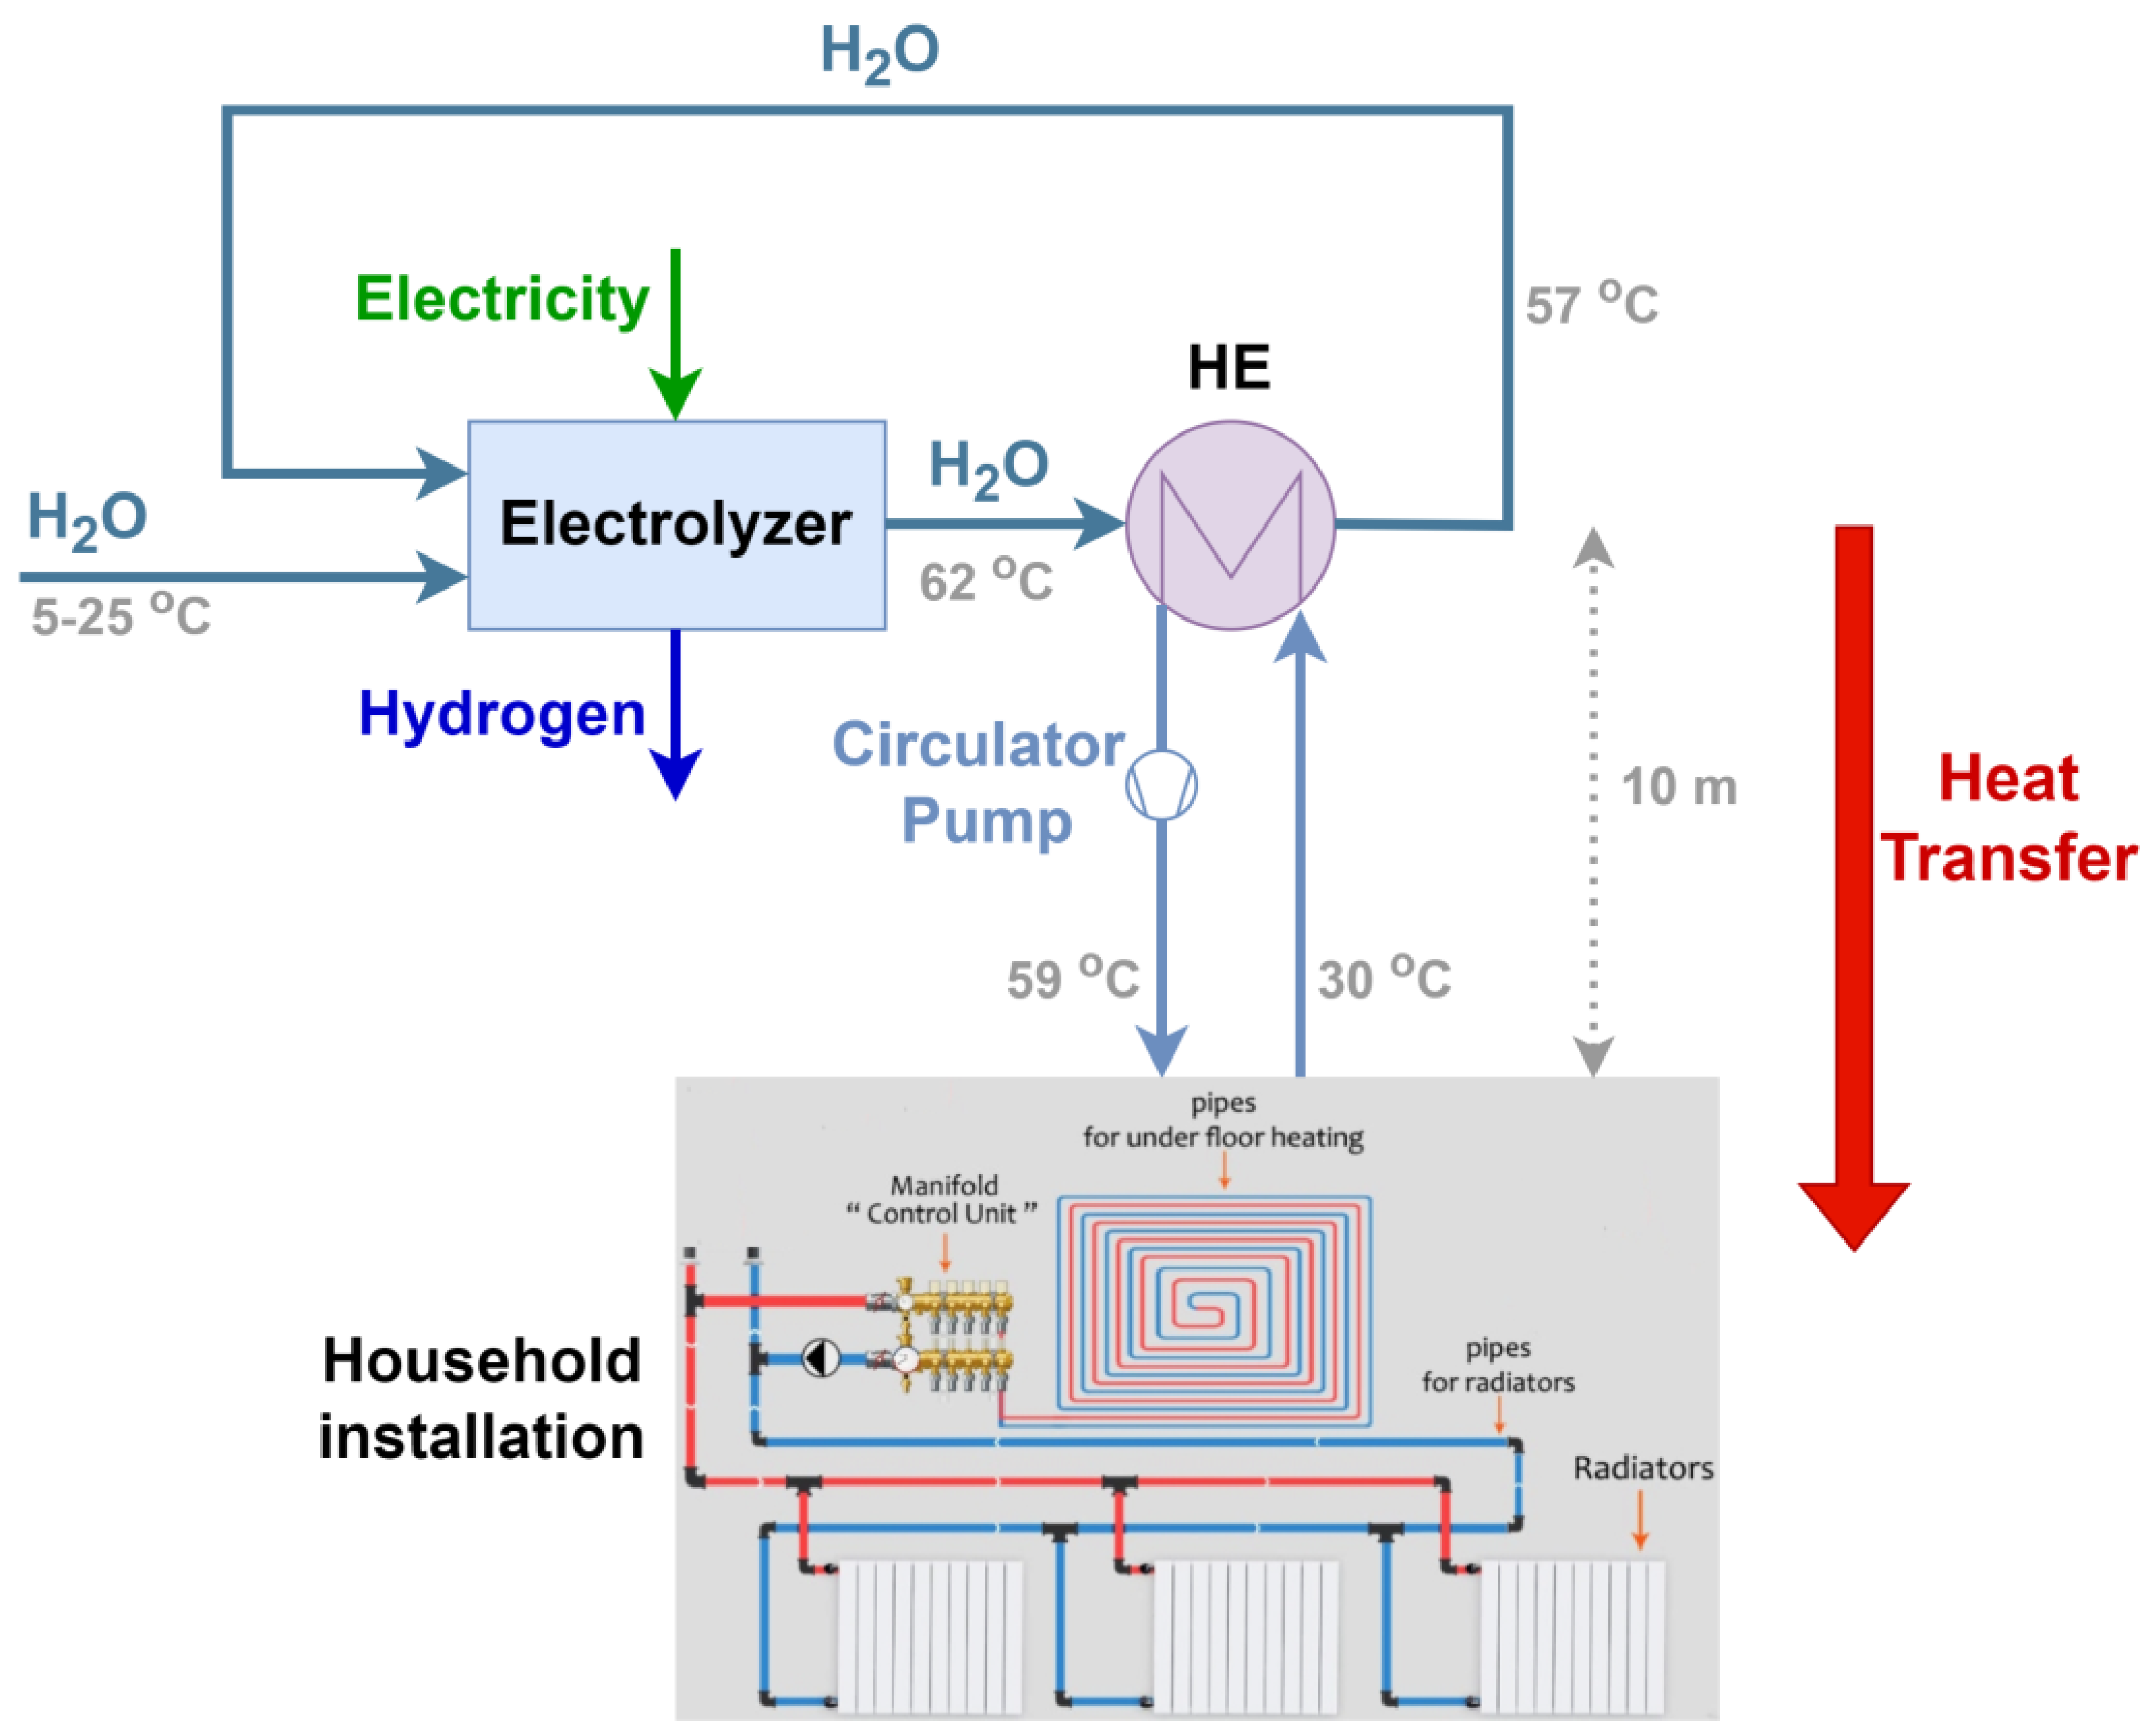
No Heat Loss in Pipes: Given that the study focuses on household installations, where the heat is produced and consumed locally, the heat pipes are presumed to be very short. Consequently, heat losses through the pipes are considered negligible.
These assumptions are critical to maintain linearity in the optimization model but may slightly affect its accuracy in real-world scenarios.

3. Results

This study examines a residential complex that relies on the public grid for electricity and uses either natural gas or diesel for heating. We explore the energy profiles of six European cities with diverse climates, ranging from the southern cities of Heraklion, Athens, and Madrid, to the northern locations of Vienna, Berlin, and Copenhagen. The annual electric load profile, consistent across all cities, is detailed in Figure 4. Derived from source [27], it highlights a typical residential usage pattern with peak consumption in summer due to an increased demand for ventilation and air conditioning. Heating is provided through natural gas or diesel at a cost of 0.10 EUR/kWh, as estimated in reference [28]. The heat demand for each city is depicted in Figure 5 and is calculated using software from reference [29], based on the thermal parameters from Table 1. It reveals that the northern cities experience a higher heat demand due to colder weather. Solar data sourced from reference [30] and illustrated in Figure 6 indicate that southern cities like Heraklion, Athens, and Madrid have higher capacity factors, as summarized in Table 2.
The net present cost (NPC) of electricity and heat over a 20-year period for the residential complex without photovoltaic–hydrogen systems is depicted in Table 3, assuming electricity and heat prices of 0.23 EUR/ k W e and 0.1 EUR/ k W t h , respectively, based on references [31] and [28]. The NPC exhibits considerable variation, ranging from EUR 204,120 in Heraklion to EUR 330,300 in Copenhagen, primarily due to the higher heat demands in northern cities.
The NPC for the residential complex with an optimized photovoltaic–hydrogen system, excluding heat recovery, is shown in Table 4. This includes the optimal capacities for the photovoltaics, ELZ, FC, and hydrogen tank, with the techno-economic parameters derived from Table 5 for the photovoltaic and hydrogen storage components. A comparison between the NPCs from Table 3 and Table 4 suggests that integrating photovoltaic and hydrogen systems in the residential sector can lead to significant cost savings, up to EUR 27,400 in Madrid. Even in Copenhagen, which has the lowest solar potential, a modest cost saving of EUR 7700 underscores the economic feasibility of solar–hydrogen systems in European residential settings.
Table 6 details the NPC for the complex with both optimized photovoltaics–hydrogen and heat recovery. The cost details for installing the heat recovery system are analyzed in the Appendix A. Comparing Table 4 and Table 6 shows that the inclusion of a heat recovery system can further reduce the NPC in sunnier cities. For instance, in Madrid, waste heat recovery from ELZs and FCs can reduce the NPC from EUR 238,800 to EUR 233,330, a reduction of 2.3%. Conversely, the benefits of heat recovery in northern cities are minimal due to their low solar potential during the colder months when heating is most needed. Figure 7 summarizes the NPC for all the examined scenarios and cities.
To address the uncertainties in the costs of hydrogen components and electricity prices, a sensitivity analysis is conducted. Figure 8 illustrates the NPC without photovoltaics–hydrogen for the varying costs of ELZs/FCs and electricity prices in Heraklion. At lower electricity prices (i.e., 0.23 EUR/kWh − 0.3 × 0.23 EUR/kWh), the NPC stands at EUR 164,100, whereas at higher prices (i.e., 0.23 EUR/kWh + 0.3 × 0.23 EUR/kWh), it escalates to EUR 244,130. Figure 9 depicts the NPC for the scenario with photovoltaics–hydrogen and a heat recovery system, in which, even amidst ELZ and FC cost variations, the system remains profitable, leading to substantial cost reductions compared to the scenario without these systems. At high electricity prices, the NPC ranges from EUR 181,200 to EUR 202,500, highlighting potential cost savings of up to EUR 62,930 (i.e., EUR 244,130–181,200), corresponding to a reduction of 26%.
Figure 10 demonstrates how the NPC, electrolyzer capacity, and PV capacity respond to increases in the DPP limit. Notably, escalating the DPP from 0 to 0.4 significantly reduces the NPC, dropping from EUR 184,850 to EUR 161,460. This drop contrasts sharply with the baseline NPC of EUR 204,120 in systems without integrated solar–hydrogen technology, highlighting substantial potential cost savings for homeowners. Concurrently, this DPP increase also amplifies the electrolyzer capacity from 2.8 kW to 10.3 kW and the PV capacity from 9.8 kW to 35.6 kW. This paper’s findings underscore the benefits of allowing a portion of solar power to be directly injected into the grid rather than being stored as hydrogen. This approach can boost investment in residential hydrogen systems, enhance their adoption, and reduce costs more effectively than the traditional subsidy policies [21] that are aimed at fostering a hydrogen economy. However, it is critical to recognize that the DPP is constrained by the network’s capacity and its ability to seamlessly integrate solar power, which can lead to challenges such as overvoltages, imbalances (in single-phase PV systems), and the overloading of lines and transformers. Thus, it is essential for network operators to meticulously define the maximum permissible DPP for each network to prevent these adverse effects. A practical method to estimate the maximum allowable DPP involves calculating the annual energy output that would be produced by a photovoltaic system with a capacity equal to the maximum power demand of the residential complex, which is 18 kW, as shown in Figure 4. This approach is valid because the existing network infrastructure is already equipped to handle 18 kW, whether for power production or consumption. Figure 11 depicts the annual direct penetration of PV (left axis) and the optimal PV capacity (right axis) relative to the DPP. The annual energy output from an 18 kW-PV system is 27.5 MWh, which is used here to calculate the maximum DPP equal to 0.4. However, to ensure network safety and allow room for integrating other renewable energy systems, such as standalone PV systems without hydrogen production, a conservative DPP of approximately 0.2 is suggested.
Finally, the computational efficiency of the proposed LP optimization algorithm is notable. It completes its calculations in under 30 s when run on a laptop equipped with a 64-bit Intel Core i7 processor at 3.4 GHz and 16 GB of RAM. The optimization covers an extensive analysis, executed on an hourly basis for an entire year, amounting to an 8760 h optimization horizon.

4. Conclusions, Discussion, and Future Research

4.1. Conclusions and Discussion

This paper presents a linear programming optimization algorithm designed to optimize the installation capacity of residential solar–hydrogen systems, incorporating the recovery of waste heat from electrolyzers and fuel cells. We examined six European cities with varying climate conditions. Techno-economic analyses revealed that optimized solar–hydrogen system configurations could yield significant net present cost savings over 20 years, particularly in Southern Europe due to its high solar potential—savings could reach up to EUR 62,930, corresponding to a 26% cost reduction. Additionally, when considering the environmental benefits from reduced carbon emissions, the viability and sustainability of these systems in Europe’s residential sector become even more apparent. The analysis did not account for potential economic incentives such as subsidies, which could further enhance the economic returns on investment. Instead, it introduces a novel incentive policy that permits the owners of solar–hydrogen systems to inject up to 20% of their total solar power output directly into the grid, bypassing hydrogen storage. This approach offers dual benefits: firstly, it enables owners to profit from selling surplus PV power at peak midday hours rather than curtailing it, and secondly, it allows for a slight reduction in the size—and thus cost—of the electrolyzer.
Moreover, residential hydrogen storage could offer substantial ancillary services to the electrical grid, including frequency support, by leveraging the rapid response capabilities of fuel cells and electrolyzers [37]. This aspect could further boost the economic profitability of these systems. Furthermore, residential solar–hydrogen systems could increase the economic benefits for homeowners by enabling the free charging of electric or hydrogen vehicles.
Despite the promising potential for economic profit from residential solar–hydrogen systems, several significant challenges must be addressed. Key among these is the still-high installation cost. The absence of a robust commercialization strategy and well-defined regulatory frameworks complicates the deployment and scaling of these systems. Without standardized regulations and market mechanisms, it is challenging for such innovative technologies to secure a foothold in the competitive energy market. These obstacles collectively slow down the progress and broader integration of solar–hydrogen technology in residential areas, despite its considerable benefits for sustainable energy development.
Safety considerations are paramount when deploying hydrogen systems in residential settings, given their inherent risks [38]. The interaction between hydrogen and steel materials can lead to hydrogen embrittlement, compromising the integrity of storage vessels. Additionally, hydrogen’s wide flammability range makes it susceptible to explosive incidents. Unlike denser gases, hydrogen’s lower density causes it to rise rapidly if leaked, heightening the risks of explosions or asphyxiation in confined spaces—a distinct hazard compared to traditional fuels like diesel oil. Consequently, the implementation of robust safety measures and advanced leakage detection systems is critical, surpassing the requirements for conventional fuels. Furthermore, human error remains a significant factor in hydrogen-related accidents [38]. Even minor inattentions can lead to severe consequences. Therefore, enhancing safety protocols, using materials compatible with hydrogen, and improving the industry-wide understanding of hydrogen safety among managers and operators are essential steps to mitigate the risks.

4.2. Shortcomings and Future Research

The proposed optimization approach is grounded in three key assumptions to maintain the linearity of equations, resulting in a linear programming (LP) formulation. Firstly, it assumes constant efficiencies for electrolyzers and fuel cells throughout the year, overlooking their variability due to temperature and loading conditions. For example, it is known that electrolyzer efficiency is notably low immediately after startup and before the unit heats up, a factor disregarded in this model [11,12]. Secondly, the approach does not account for the gradual degradation of electrolyzer and fuel cell efficiency over time, which, according to [19], occurs at a rate of approximately 0.19% per 1000 operating hours. Additionally, the model ignores heat losses in piping systems. While these losses are minimal over short distances, they become significant over longer spans and should ideally be included in the formulation.
Despite its practicality, ease of implementation, and low computational demand, the proposed method leaves room for improvement, particularly in terms of accurately incorporating these nonlinear effects. The integration of these effects would complicate the model, transforming it into a highly nonlinear problem. One potential solution might involve linearizing the equations using binary variables [39,40], which would create a mixed integer linear programming (MILP) formulation. Nonetheless, this approach could pose challenges, as hydrogen storage planning requires long-term optimization horizons (e.g., 1 year) to accommodate hourly, daily, and seasonal fluctuations in renewable production and demand. The MILP approach is considerably more time-consuming compared to the LP method, especially for problems with numerous variables and extended horizons, rendering the MILP optimization impractical. This presents a mathematical dilemma warranting further investigation.

Author Contributions

Conceptualization, E.E.P. and G.I.O.; methodology, E.E.P.; software, E.E.P. and A.A.; validation, E.E.P.; formal analysis, E.E.P.; investigation, E.E.P.; resources, E.E.P. and A.A.; data curation, E.E.P.; writing—original draft, E.E.P.; writing—review and editing, A.A., G.I.O. and E.S.K.; supervision, E.S.K.; project administration, E.S.K.; funding acquisition, G.I.O. and E.S.K. All authors have read and agreed to the published version of the manuscript.

Funding

This research received no external funding.

Data Availability Statement

The original contributions presented in the study are included in the article, further inquiries can be directed to the corresponding author.

Conflicts of Interest

Author Arif Ahmed was employed by the company Power Systems Consultants. The remaining authors declare that the research was conducted in the absence of any commercial or financial relationships that could be construed as a potential conflict of interest. The company had no role in the design of the study; in the collection, analyses, or interpretation of data; in the writing of the manuscript, or in the decision to publish the results.

Abbreviations

ELZelectrolyzer
FCfuel cell
FC-CHPFuel Cell Combined Heat and Power
PVphotovoltaic
DHdistinct heat
HEheat exchanger
LPlinear programming
NPCnet present cost
HHVHigher Heating Value (for Hydrogen)
hhours
yyears
DPPdirect photovoltaic penetration

Notations

The notation ^ denotes a constant pre-specified variable.
All variables without the notation ^ denote optimization (decision) variables.

Nomenclature

P p v i n s t a l Installed (nominal) power of photovoltaics (kW)
ρ p v t ^ Per unit power of photovoltaics at time t (pu)
P p v t Power of photovoltaics at time t (kW)
E h 2 i n s t a l Installed power of hydrogen tank (kWh)
P f c i n s t a l Installed power of Fuel cell (kW)
P e l / z e r i n s t a l Installed power of electrolyzer (kW)
P h e a t , e l i n s t a l Installed power of waste heat recovery system of electrolyzer (kW)
P h e a t , f c i n s t a l Installed power of waste heat recovery system of fuel cell (kW)
C p v ^ Cost of solar installation (EUR/kW)
C t a n k ^ Cost of hydrogen tank (EUR/kWh)
C f c ^ Cost of fuel cell (EUR/kW)
C e l / z e r ^ Cost of electrolyzer (EUR/kW)
C h e a t ^ Cost of waste heat recovery system (EUR/kW)
P g r i d t Solar power injected to the grid at time t (kW)
P p v , l o a d t Solar power injected to the home at time t (kW)
P h e a t , p u r c t Purchased heat power at time t (kW)
P h e a t , f c t Heat power produced from fuel cell at time t (kW)
P h e a t , e l / z e r t Heat power produced from electrolyzer at time t (kW)
P e l / z e r t Electric power produced from electrolyzer at time t (kW)
P f c t Electric power produced from fuel cell at time t (kW)
P g , l o a d t Power supplied to the home from the electric grid at t (kW)
P l o a d t ^ Total electric load of the home at t (kW)
P h e a t t ^ Heat demand of the home at t (kW)
c p u r , e l ^ Purchase   price   of   electric   energy   ( EUR / k W h e )
c p u r , t h ^ Purchase   price   of   thermal   energy   ( EUR / k W h t h )
c s e l , e l ^ Selling   price   of   electric   energy   ( EUR / k W h e )
P h 2 , i n t Input power to hydrogen tank at time t (kW)
P h 2 , o u t t Output power of hydrogen tank at time t (kW)
E h 2 t Energy stored in the hydrogen tank at time t (kWh)
n f c ^ Efficiency of fuel cell
n e l / z e r ^ Efficiency of electrolyzer

Appendix A

The breakdown cost of the heat recovery system (either ELZ or FC) is as follows:
-
Pipe cost = 30   E U R / m [19,41],
-
Excavation cost = 25   E U R / m [19],
-
Pipe length = 10   m ,
-
Heat exchanger cost = 1500 P h e a t , e l i n s t a l E U R [19],
-
Circulator pump cost = 1250 P h e a t , e l i n s t a l 400 11.6 0.47 E U R [19].
The total cost of the heat recovery system is as follows:
-
Total Cost = 2 30 10 + 25 10 + 1500 P h e a t , e l i n s t a l + 1250 P h e a t , e l i n s t a l 400 11.6 0.47 E U R .
Due to its nonlinearity, the total cost function, as originally formulated, is not suitable for use in the LP optimization algorithm. To accommodate this, we have linearized the function as follows:
-
Linearized Total Cost = 1200 P h e a t , e l i n s t a l E U R for 0 P h e a t , e l i n s t a l 6   k W .
The accuracy of the linearization is shown in Figure A1. It is assumed that the linearized cost of recovering the waste heat is EUR 1200 per installed kW of heat exchanger.
Figure A1. Actual and linearized cost of waste heat recovery system (ELZ or FC).
Processes 12 01933 g0a1

References

  1. European Environment Agency. Available online: https://www.eea.europa.eu/en/analysis/indicators/greenhouse-gas-emissions-from-energy (accessed on 31 July 2024).
  2. European Commission. Available online: https://energy.ec.europa.eu/topics/energy-efficiency/energy-efficient-buildings/nearly-zero-energy-and-zero-emission-buildings_en (accessed on 31 July 2024).
  3. Lopez, V.M.; Ziar, H.; Haverkort, J.; Zeman, M.; Isabella, O. Dynamic operation of water electrolyzers: A review for applications in photovoltaic systems integration. Renew. Sustain. Energy Rev. 2023, 182, 113407. [Google Scholar] [CrossRef]
  4. Escamilla, A.; Sánchez, D.; García-Rodríguez, L. Assessment of power-to-power renewable energy storage based on the smart integration of hydrogen and micro gas turbine technologies. Int. J. Hydrogen Energy 2022, 47, 17505–17525. [Google Scholar] [CrossRef]
  5. PV Magazine, Electrolyzer Prices—What to Expect. Available online: https://www.pv-magazine.com/2024/03/21/electrolyzer-prices-what-to-expect/ (accessed on 4 June 2024).
  6. Sharshir, S.W.; Joseph, A.; Elsayad, M.M.; Tareemi, A.A.; Kandeal, A.W.; Elkadeem, M.R. A review of recent advances in alkaline ELZ for green hydrogen production: Performance improvement and applications. Int. J. Hydrogen Energy 2023, 360, 3199. [Google Scholar]
  7. Hossain, M.B.; Islam, M.R.; Muttaqi, K.M.; Sutanto, D.; Agalgaonkar, A.P. Advancement of fuel cells and ELZs technologies and their applications to renewable-rich power grids. J. Energy Storage 2023, 62, 106842. [Google Scholar] [CrossRef]
  8. Ramadhani, F.; Hussain, M.A.; Mokhlis, H. A Comprehensive Review and Technical Guideline for Optimal Design and Operations of Fuel Cell-Based Cogeneration Systems. Processes 2019, 7, 950. [Google Scholar] [CrossRef]
  9. Skordoulias, N.; Koytsoumpa, E.I.; Karellas, S. Techno-economic evaluation of medium scale power to hydrogen to combined heat and power generation systems. Int. J. Hydrogen Energy 2022, 47, 26871–26890. [Google Scholar] [CrossRef]
  10. Yu, S.; Fan, Y.; Shi, Z.; Li, J.; Zhao, X.; Zhang, T.; Chang, Z. Hydrogen-based combined heat and power systems: A review of technologies and challenges. Int. J. Hydrogen Energy 2023, 48, 34906–34929. [Google Scholar] [CrossRef]
  11. Nguyen, H.Q.; Aris, A.M.; Shabani, B. PEM fuel cell heat recovery for preheating inlet air in standalone solar-hydrogen systems for telecommunication applications: An exergy analysis. Int. J. Hydrogen Energy 2016, 41, 2987–3003. [Google Scholar] [CrossRef]
  12. Bilbao, D.C. Valorization of the waste heat given off in a system alkaline electrolyzer-photovoltaic array to improve hydrogen production performance: Case study Antofagasta, Chile. Int. J. Hydrogen Energy 2021, 46, 31108–31121. [Google Scholar] [CrossRef]
  13. Meriläinen, A.; Kosonen, A.; Jokisalo, J.; Kosonen, R.; Kauranen, P.; Ahola, J. Techno-economic evaluation of waste heat recovery from an off-grid alkaline water electrolyzer plant and its application in a district heating network in Finland. Energy 2024, 306, 132181. [Google Scholar] [CrossRef]
  14. Frassl, N.; Sistani, N.R.; Wimmer, Y.; Kapeller, J.; Maggauer, K.; Kathan, J. Techno-economic assessment of waste heat recovery for green hydrogen production: A simulation study. Elektrotech. Inftech. 2024, 141, 288–298. [Google Scholar] [CrossRef]
  15. Ozawa, A.; Kudoh, Y. Performance of residential fuel-cell-combined heat and power systems for various household types in Japan. Int. J. Hydrogen Energy 2018, 43, 15412–15422. [Google Scholar] [CrossRef]
  16. Romdhane, J.; Louahlia, H.; Marion, M. Dynamic modeling of an eco-neighborhood integrated micro-CHP based on PEMFC: Performance and economic analyses. Energy Build. 2018, 166, 93–108. [Google Scholar] [CrossRef]
  17. Huckebrink, D.; Bertsch, V. Decarbonising the residential heating sector: A techno-economic assessment of selected technologies. Energy 2022, 257, 124605. [Google Scholar] [CrossRef]
  18. Peppas, A.; Kollias, K.; Politis, A.; Karalis, L.; Taxiarchou, M.; Paspaliaris, I. Performance evaluation and life cycle analysis of RES-hydrogen hybrid energy system for office building. Int. J. Hydrogen Energy 2020, 46, 6286–6298. [Google Scholar] [CrossRef]
  19. van der Roest, E.; Bol, R.; Fens, T.; van Wijk, A. Utilisation of waste heat from PEM electrolyzers—Unlocking local optimization. Int. J. Hydrogen Energy 2023, 48, 27872–27891. [Google Scholar] [CrossRef]
  20. Hu, Q.; Lin, J.; Zeng, Q.; Fu, C.; Li, J. Optimal control of a hydrogen microgrid based on an experiment validated P2HH model. IET Renew. Power Gener. 2020, 14, 364–371. [Google Scholar] [CrossRef]
  21. Bozorgmehri, S.; Heidary, H.; Salimi, M. Market diffusion strategies for the PEM fuel cell-based micro-CHP systems in the residential sector: Scenario analysis. Int. J. Hydrogen Energy 2023, 48, 3287–3298. [Google Scholar] [CrossRef]
  22. Pompodakis, E.E.; Ahmed, A.; Alexiadis, M.C. A Three-Phase Weather-Dependent Power Flow Approach for 4-Wire Multi-Grounded Unbalanced Microgrids With Bare Overhead Conductors. IEEE Trans. Power Syst. 2021, 36, 2293–2303. [Google Scholar] [CrossRef]
  23. Pompodakis, E.E.; Ahmed, A.; Alexiadis, M.C. A Sensitivity-Based Three-Phase Weather-Dependent Power Flow Algorithm for Networks with Local Voltage Controllers. Energies 2022, 15, 1977. [Google Scholar] [CrossRef]
  24. Ahmed, A.; Pompodakis, E. Optimal conductor repositioning to mitigate adverse impacts of photovoltaics in LV networks. Electr. Power Syst. Res. 2023, 216, 109050. [Google Scholar] [CrossRef]
  25. Pompodakis, E.E.; Drougakis, I.A.; Lelis, I.S.; Alexiadis, M.C. Photovoltaic systems in low-voltage networks and overvoltage correction with reactive power control. IET Renew. Power Gener. 2016, 10, 410–417. [Google Scholar] [CrossRef]
  26. Wang, J.; Li, D.; Zhang, J.; Zhuang, G.; Gao, S. Mathematical Model and Working Characteristics Analysis of Alkaline Electrolyzer, The Proceedings of the 16th Annual Conference of China Electrotechnical Society; Lecture Notes in Electrical Engineering; Springer: Singapore, 2022; Volume 890. [Google Scholar] [CrossRef]
  27. Dataset on Hourly Load Profiles for a Set of 24 Facilities from Industrial, Commercial, and Residential End-Use Sectors. Available online: https://data.mendeley.com/datasets/rfnp2d3kjp/1 (accessed on 2 July 2024).
  28. Eurostat Statistics. Available online: https://ec.europa.eu/eurostat/statistics-explained/index.php?title=Natural_gas_price_statistics (accessed on 4 August 2024).
  29. Pfenninger, S.; Staffell, I. Renewable Ninja. 2020. Available online: https://www.renewables.ninja (accessed on 20 March 2023).
  30. Pfenninger, S.; Staffell, I. Long-term patterns of European PV output using 30 years of validated hourly reanalysis and satellite data. Energy 2016, 114, 1251–1265. [Google Scholar] [CrossRef]
  31. Statista. Electricity Prices for Households with an Annual Consumption of 2500 to 5000 kWh in the European Union in 2023, by Country. Available online: https://www.statista.com/statistics/1046505/household-electricity-prices-european-union-eu28-country/ (accessed on 4 August 2024).
  32. Ahmed, A.; Pompodakis, E.E.; Katsigiannis, Y.; Karapidakis, E.S. Optimizing the Installation of a Centralized Green Hydrogen Production Facility in the Island of Crete, Greece. Energies 2024, 17, 1924. [Google Scholar] [CrossRef]
  33. Moran, C.; Deane, P.; Yousefian, S.; Monaghan, R.F. The hydrogen storage challenge: Does storage method and size affect the cost and operational flexibility of hydrogen supply chains? Int. J. Hydrogen Energy 2024, 52, 1090–1100. [Google Scholar] [CrossRef]
  34. UPDATED: Rooftop Solar PV Country Comparison Report. Available online: https://caneurope.org/rooftop-solar-pv-comparison-report/ (accessed on 4 August 2024).
  35. Parra, D.; Valverde, L.; Pino, F.J.; Patel, M.K. A review on the role, cost and value of hydrogen energy systems for deep decarbonisation. Renew. Sustain. Energy Rev. 2019, 101, 279–294. [Google Scholar] [CrossRef]
  36. Maestre, V.; Ortiz, A.; Ortiz, I. Sustainable and self-sufficient social home through a combined PV-hydrogen pilot. Appl. Energy 2024, 363, 123061. [Google Scholar] [CrossRef]
  37. Huang, C.; Zong, Y.; You, S.; Træholt, C. Analytical Modeling and Control of Grid-Scale Alkaline Electrolyzer Plant for Frequency Support in Wind-Dominated Electricity-Hydrogen Systems. IEEE Trans. Sustain. Energy 2023, 14, 217–232. [Google Scholar] [CrossRef]
  38. Guo, L.; Su, J.; Wang, Z.; Shi, J.; Guan, X.; Cao, W.; Ou, Z. Hydrogen safety: An obstacle that must be overcome on the road towards future hydrogen economy. Int. J. Hydrogen Energy 2024, 51, 1055–1078. [Google Scholar] [CrossRef]
  39. da Silva, P.R.; Aragão, M.E.; Trierweiler, J.O.; Trierweiler, L.F. MILP Formulation for Solving and Initializing MINLP Problems Applied to Retrofit and Synthesis of Hydrogen Networks. Processes 2020, 8, 1102. [Google Scholar] [CrossRef]
  40. Asghari, M.; Fathollahi-Fard, A.M.; Mirzapour Al-E-Hashem, S.M.; Dulebenets, M.A. Transformation and Linearization Techniques in Optimization: A State-of-the-Art Survey. Mathematics 2022, 10, 283. [Google Scholar] [CrossRef]
  41. Polytherm Heating Systems. Available online: https://www.polytherm.ie/v4/0940aa0c-5421-4a9b-840d-c9a2ae5d95bb/uploads/PolythermCompletePricelist.pdf (accessed on 3 August 2024).
Figure 1. Categorization of research on heat recovery from hydrogen sources [9,10,11,12,13,14,15,16,17,18,19,20].
Processes 12 01933 g001
Figure 2. Schematic of a residential green hydrogen-powered prosumer with waste heat recovery.
Processes 12 01933 g002
Figure 3. Simplified illustration of heat transfer from the electrolyzer to household installation.
Processes 12 01933 g003
Figure 4. Total electric load profile ( P l o a d t ^ ) [27]. It is considered the same for all examined cities.
Processes 12 01933 g004
Figure 5. Thermal load ( P h e a t t ^ ) of the examined residential complex for different cities.
Processes 12 01933 g005
Figure 6. Per unit solar power ρ p v t ^ produced per kW-installed photovoltaics in different cities.
Processes 12 01933 g006
Figure 7. Summary of the net present costs for the examined cases.
Processes 12 01933 g007
Figure 8. Net present cost (z-axis) without photovoltaics–hydrogen for the varying costs of ELZs/FCs (x-axis) and electricity (y-axis) in the city of Heraklion.
Processes 12 01933 g008
Figure 9. Net present cost (z-axis) with optimized photovoltaics–hydrogen and heat recovery for the varying costs of ELZs/FCs (x-axis) and electricity (y-axis) in the city of Heraklion.
Processes 12 01933 g009
Figure 10. The influence of the DPP limit on the NPC, electrolyzer, and photovoltaic capacities in the city of Heraklion.
Processes 12 01933 g010
Figure 11. Yearly direct penetration (left axis) and optimal solar capacity (right axis) as a function of the DPP.
Processes 12 01933 g011
Table 1. Heating demand parameters [29].
ParameterDescriptionValue
Heating threshold (°C)Temperature below which heating is required22
Heating power (kW/°C)Heat per temperature drop below the heating threshold1
Smoothing (days−1)Constant for building’s thermal inertia 0.5
Solar gains (°C per W/m2)The influence that sunshine has on the building’s temperature0.01
Wind chill (°C per m/s)The influence that wind has on the building’s temperature−0.2
Humidity discomfort (°C per g/kg)The influence that humidity has on the perceived temperature0.05
Table 2. Photovoltaic capacity factors.
HeraklionAthensMadridViennaBerlinCopenhagen
19.41%18.59%20.55%13.41%11.47%10.69%
Table 3. Net present cost without photovoltaics–hydrogen for the examined residential complex.
CityAnnual
Electricity (kWh)
Annual
Heat (kWh)
NPC
(Thousand EUR)
Heraklion28,99635,368204.12
Athens28,99644,674222.73
Madrid28,99666,431266.24
Vienna28,99688,453310.29
Berlin28,99690,710314.80
Copenhagen28,99698,458330.30
Table 4. Net present cost with optimized photovoltaic and hydrogen capacities, without heat recovery.
CityNPC
(Thousand EUR)
Photovoltaic Capacity
(kW)
Electrolyzer
Capacity (kW)
Fuel Cell
Capacity (kW)
Hydrogen Tank
(kWh)
Electrolyzer Heat
Exchanger (kW)
Fuel Cell Heat
Exchanger (kW)
Heraklion179.1812.904.571.0244.10--
Athens200.0512.024.140.8140.77--
Madrid238.8015.426.431.4853.03--
Vienna299.007.730.980.148.10--
Berlin306.166.57000--
Copenhagen322.576.87000--
Table 5. Techno-economic parameters.
ParameterDescriptionValueReference
C s o l a r ^ Cost of solar installation (EUR/kW)1200 EUR/kW[32]
C t a n k ^ Cost of hydrogen tank (EUR/kWh)10.5 EUR/kWh (≈350 EUR/kg H2)[17,33]
C f c ^ Cost of fuel cell (EUR/kW)1684 EUR/kW[17]
C e l / z e r ^ Cost of electrolyzer (EUR/kW)1295 EUR/kW[17]
C h e a t ^ Cost of waste heat recovery system (EUR/kW)1200 EUR/kWSee Appendix A
-Annual Operation and maintenance0.03 × installation cost-
c p u r , e l ^ Purchase   price   of   electric   energy   ( EUR / k W h e )0.23 EUR/kWh[31]
c p u r , t h ^ Purchase   price   of   thermal   energy   ( EUR / k W h t h )0.10 EUR/kWh[28]
c s e l , e l ^ Selling   price   of   electric   energy   ( EUR / k W h e )0.10 EUR/kWh[34]
n f c ^ Efficiency of fuel cell (HHV)50%[17,35]
n e l / z e r ^ Efficiency of electrolyzer (HHV)76%[19,35]
l i f e t i m e ^ LifetimePV: 20 years[32]
ELZ: 80,000 h ≈ 20 years[3,19,35]
FC: 80,000 h ≈ 20 years[35,36]
Table 6. Net present cost with optimized photovoltaic, hydrogen, and heat recovery capacities.
CityNPC
(Thousand EUR)
Photovoltaic Capacity
(kW)
Electrolyzer
Capacity (kW)
Fuel Cell
Capacity (kW)
Hydrogen Tank
(kWh)
Electrolyzer Heat
Exchanger (kW)
Fuel Cell Heat
Exchanger (kW)
Heraklion176.4915.375.831.3758.301.080.50
Athens197.9514.125.211.0656.770.910.38
Madrid233.3320.149.052.08105.641.730.83
Vienna298.349.392.070.3020.010.390.11
Berlin306.107.060.440.054.140.080.02
Copenhagen322.576.8700000
Disclaimer/Publisher’s Note: The statements, opinions and data contained in all publications are solely those of the individual author(s) and contributor(s) and not of MDPI and/or the editor(s). MDPI and/or the editor(s) disclaim responsibility for any injury to people or property resulting from any ideas, methods, instructions or products referred to in the content.

