Article

Phase Equilibria Study of the MgO–CaO–SiO2 Slag System with Ferronickel Alloy, Solid Carbon, and Al2O3 Additions

by
Nandhya K. P. Prikusuma
,
Muhammad G. Algifari
,
Rafiandy A. Harahap
,
Zulfiadi Zulhan
and
Taufiq Hidayat
*
Metallurgical Engineering Research Group, Faculty of Mining and Petroleum Engineering, Institut Teknologi Bandung, Bandung 40132, Indonesia
*
Author to whom correspondence should be addressed.
Processes 2024, 12(9), 1946; https://doi.org/10.3390/pr12091946
Submission received: 15 August 2024 / Revised: 1 September 2024 / Accepted: 7 September 2024 / Published: 11 September 2024
(This article belongs to the Special Issue Phase Equilibrium in Chemical Processes: Experiments and Modeling)

Abstract

:
Knowledge of the phase equilibria in the MgO–CaO–SiO2–Al2O3 slag system is crucial for the nickel laterite smelting process. The phase equilibria of this slag system were experimentally investigated, focusing on the olivine and tridymite/cristobalite primary phase fields, using high-temperature equilibration and quenching methods, followed by Scanning Electron Microscopy–Energy Dispersive X-Ray analysis. The phase equilibria of the MgO–CaO–SiO2 slag system at 1400 °C and 1500 °C were first determined in the absence of ferronickel alloy. The phase equilibria between 1400 °C, 1450 °C, and 1500 °C were then determined under a reducing condition, i.e., at equilibrium with ferronickel alloy and solid carbon. Finally, the effect of Al2O3 addition on the liquidus and solidus compositions in the slag system under the reducing condition was investigated at 1400 °C and 1450 °C. Comparisons between the experimentally constructed diagram, previous data, and FactSage-predicted phase diagrams have been provided and discussed. The present study identified the liquid slag both in the absence and presence of ferronickel alloy and solid carbon, as well as in the presence of Al2O3 impurity, within the formation boundaries of olivine and tridymite/cristobalite solids. Identifying the liquid slag area is essential to ensure that the nickel laterite smelting slag can be tapped from the furnace.

1. Introduction

The expansion of the stainless-steel industry is the primary driver behind the rising demand for nickel, as nearly 65% of nickel is used for this purpose [1]. The most widely used technology for nickel production is the Rotary Kiln–Electric Furnace (RKEF) [2]. The RKEF outputs are nickel pig iron or ferronickel, containing 10–30% nickel, which is the raw material for stainless-steel production [3], and slag with MgO–CaO–SiO2–Al2O3 as primary components. The slag composition significantly affects its physicochemical properties and is critical to the slag’s performance during the smelting process [4]. In the area around the electrodes of the electric furnace within the RKEF process, where there are slag phases, ferronickel alloy droplets, and excess carbon content, the silicon and carbon contents in the alloy are very likely to increase significantly. Alloy with high silicon and carbon contents can cause the phenomena of Si reversion and CO boil in other areas of the furnace [5]. The phase equilibria of the MgO–CaO–SiO2 slag system and the effect of Al2O3 addition in the presence of ferronickel alloy and solid carbon need to be studied. By studying the phase equilibria, the physical state and chemical composition of phases can be determined as a function of smelting parameters, such as temperature, impurities, and atmospheric conditions. These smelting parameters can then be optimized based on the phase equilibria information, for instance, to ensure that the slag is predominantly in a liquid state, allowing it to be easily tapped from the furnace.
Previous research on the phase diagram of MgO–CaO–SiO2–Al2O3 is available. Initial studies were conducted by Osborn et al. [6], Kushiro [7], Loghi et al. [8], and Liu et al. [9] on the phase diagram of the MgO–CaO–SiO2 system, which were later refined into a combined phase diagram [10]. Several studies have also focused on the phase diagram of MgO–CaO–SiO2–Al2O3 system, most of which were performed with a constant Al2O3 content or at a specific CaO/SiO2 ratio. Earlier research used optical microscopy and X-ray analysis techniques to determine the composition of the final samples [11,12,13,14,15,16]. More recent research utilized Scanning Electron Microscopy–Energy Dispersive Spectroscopy (SEM-EDS) to examine the sample microstructure and Electron Probe Microanalysis (EPMA) to determine the sample composition [17,18,19,20,21,22,23,24,25,26,27].
Vazquez et al. (2005) investigated the Al2O3–CaO–MgO–SiO2 phase system, specifically in the 65 wt% MgAl2O4 region [17]. The research involved high-temperature equilibrium experiments conducted in platinum crucibles for durations ranging from 4 to 200 h, followed by air-quenching. Mineralogical analysis was performed using techniques such as SEM-EDS, FE-SEM-EDS, and XRD. The observed low temperatures at which the first liquid formed in the MgAl2O4-rich section of the quaternary system support the presence of liquid phases in spinels with minor CaO and SiO2 content.
Gran et al. (2011) studied the CaO–MgO–SiO2–(30 wt%)Al2O3 system by conducting high-temperature equilibrium experiments for 36 h in platinum crucibles, followed by quenching in water [18]. The sample microstructure was analyzed using SEM-EDS, and the composition was determined with EPMA. The experimental results at 1600 °C indicated that the liquid composition with high CaO was in agreement with findings by Osborn et al., as reported in the Slag Atlas [10], although this study found a slightly higher solubility of MgO.
Another study by Gran et al. (2011) focused on the equilibrium of the CaO–MgO–SiO2–(25 and 35 wt%) Al2O3 system [19]. High-temperature equilibrium was maintained for 36 h using platinum crucibles, followed by rapid quenching in water. The sample microstructure was examined using SEM-EDS, and the composition was determined by EPMA. The study found that at 25 wt% Al2O3, the results align with those of Osborn et al. However, for 35 wt% Al2O3, the solubility of CaO and MgO at 1500 °C was lower than that observed by Osborn et al. reported in the Slag Atlas [10].
Ma et al. (2014) examined the MgO–CaO–SiO2–Al2O3 slag system, focusing on CaO/SiO2 ratios of 1.1 and 1.3 [20]. The synthetic slag was equilibrated in a vertical furnace and then rapidly quenched for analysis via SEM and EPMA. While the FactSage simulations mirrored the experimental trends, discrepancies were observed in the position of the isotherm lines. Specifically, the experimental liquidus temperature in the spinel primary phase region was found to be 50 °C higher than what was predicted by the FactSage simulations.
Ma et al. (2015) investigated the CaO–SiO2–Al2O3–MgO system, particularly focusing on a CaO/SiO2 ratio of 1.3 [21]. To achieve high-temperature equilibrium, the researchers used a carbon crucible for 8 to 24 h before quenching the samples in water. The microstructure and composition of the samples were examined using SEM-EDS and EPMA, respectively. The study found that the liquidus temperature in the dicalcium silicate primary phase was lower than reported by Osborn et al. Additionally, in both the spinel and dicalcium silicate primary phase regions, the liquidus temperatures observed in the experiment were 50 K lower than those predicted by FactSage simulations.
Ma et al. (2016) examined the phase equilibrium in the CaO–SiO2–Al2O3–MgO system, specifically with a CaO/SiO2 ratio of 1.1 [22]. The equilibrium at high temperatures was established using a carbon crucible, followed by rapid quenching. The study involved analyzing the sample’s microstructure through SEM-EDS and determining its composition via EPMA. The research focused on the primary regions of dicalcium silicate, wollastonite, merwinite, periclase, spinel, and melilite, which are significant for ironmaking slags. It was observed that when the MgO or Al2O3 concentration was fixed near industrial slag levels, the liquidus temperature increased with higher Al2O3 content but showed minimal sensitivity to changes in MgO levels. The study found a general difference of 20 K between the experimental results and the simulations provided by Factsage.
Kou et al. (2016) studied the MgO–CaO–SiO2–Al2O3 system with a CaO/SiO2 ratio of 1.5 [23]. High-temperature equilibrium experiments were carried out using a graphite crucible for 2 to 12 h, followed by quenching. The final samples were analyzed using EPMA. The results of this study show a similar trend to the FactSage simulation but differ in the extent of the primary phase region. The primary phase area of melilite expanded towards MgO, the primary phase regions of Ca2SiO4 and spinel shifted away from (CaO + SiO2), and the periclase region extended towards MgO. The liquidus temperature in the melilite region was 20 K higher than the FactSage results. Additionally, the isothermal lines in the study’s findings were steeper compared to the FactSage results.
Lyu et al. (2020) studied the phase equilibrium in the CaO–SiO2–Al2O3–MgO system [24]. They achieved high-temperature equilibrium using a carbon crucible for durations ranging from 2 to 12 h, followed by quenching in water. EPMA was used to analyze the samples. At 10 wt% MgO, they observed a notable discrepancy where the lowest liquidus temperature occurred at an (Al2O3 + SiO2) ratio of 0.35. This finding contrasts with FactSage predictions, which indicated a ratio of 0.15, and prior research, which suggested 0.25. Additionally, the lowest liquidus temperatures at 5 and 10 wt% MgO were found to be 50 °C lower than at 0 wt% MgO.
Wang et al. (2020) conducted a study focusing on the MgO–CaO–SiO2–Al2O3 system with a CaO/SiO2 ratio of 0.9 [25]. High-temperature equilibrium experiments were performed using a graphite crucible for 4 to 8 h, followed by quenching in water. The final samples were analyzed using EPMA. There were several differences between the results of this study, the FactSage calculations, and previous research recorded in the Slag Atlas. Notably, the FactSage calculations did not detect the presence of a primary corundum phase, while this study identified a primary corundum phase region.
Yao et al. (2021) investigated the phase equilibrium in the Al2O3–CaO–SiO2 system, focusing on compositions with 0, 5, and 10 wt% MgO [26]. High-temperature equilibrium was established using a carbon crucible for periods ranging from 2 to 12 h, followed by rapid quenching in water. EPMA analysis was conducted on the samples. The experimental results for the 0 wt% MgO condition were consistent with FactSage predictions, but significant discrepancies were observed at 5 and 10 wt% MgO between the FactSage 7.3 simulations and the experimental data.
Liao et al. (2023) performed an investigation focusing on the equilibrium of the CaO–SiO2–Al2O3–MgO system with a MgO/CaO ratio of 0.2 [27]. High-temperature equilibrium was achieved using a graphite crucible, followed by quenching in water. The final samples were analyzed using EPMA. The FactSage simulation for (CaO + MgO)/SiO2 of 1.4 showed a primary phase region that differed from the experimental results at low Al2O3 content, and the liquidus temperature predicted by FactSage was 120 °C higher than the experimental results.
However, none of these studies have addressed the phase equilibrium of the MgO–CaO–SiO2–Al2O3 slag system under extremely reducing conditions, such as in the presence of ferronickel alloy and solid carbon, where the oxygen partial pressure corresponds to around 10−16 to 10−18 atm between 1400 °C and 1500 °C. Although the slag system does not contain a multivalence component and is thus less affected by atmosphere conditions, its interaction with the alloy phase is worth exploring.
In the present study, phase equilibria of the MgO–CaO–SiO2 slag system and the effects of ferronickel alloy, solid carbon, and 5–10 wt% Al2O3 additions were investigated. The obtained phase equilibria data will be valuable for both scientific information and industrial applications.

2. Materials and Methods

The experimental procedure includes preparing samples from pure chemical powders, performing high-temperature equilibrium experiments, and analyzing the microstructures and compositions of phases in the quenched samples. The pure chemical powders used for the mixtures were SiO2 (99.8 wt%, Merck, Rahway, NJ, USA), MgO (97 wt%, Supelco, Inc, Bellefonte, PA, USA), CaO (97 wt%, Merck), Al2O3 (99 wt%, Merck), Fe2O3 (95 wt%, Loba Chemie, Mumbai, India), Ni (99.5 wt%, Merck), Fe (99.98 wt%, Aldrich Chem. Co, Burlington, MA, USA), Si (99wt%, Aldrich Chem. Co), and graphite (99.5 wt%, Merck). Some of the oxide chemical powders are hygroscopic, making it necessary to determine their moisture contents. The contents of surface and crystalline moistures, together with other combustible components, of the powders were determined by measuring the weight losses of the powders before and after heating at 950 °C for 4 h. The loss on ignition results of the powders were found to be 0.28 wt% for SiO2, 30.51 wt% for MgO, 24.61 wt% for CaO, 5.02 wt% for Al2O3, and 0.94 wt% for Fe2O3. The loss on ignition value of each oxide chemical powder was taken into account during the weighing and preparation of mixtures for the phase equilibria experiments. Bulk compositions of the mixtures were set to achieve at least equilibrium between liquid and solid oxides. In the reducing condition, the bulk compositions were also designed to have a final phase assemblage with an oxides–metal–graphite ratio of 10:1:1. Approximately 0.2 g of each mixture was used in each experiment. The mixtures were prepared by mixing the required amounts of pure chemical powders in an agate mortar for 15 min.
For equilibria without ferronickel alloy, each mixture was placed in a platinum envelope made from 30 mm × 30 mm platinum foil. For equilibria with ferronickel alloy, each mixture was placed in a graphite crucible with an outer diameter of 10–20 mm and a height of 15–20 mm. The schematic experimental setup for the high-temperature equilibria in a vertical tube furnace is depicted in Figure 1. The vertical tube furnace was equipped with an alumina tube (99% alumina, outer diameter 40 mm, and height 800 mm) and heated by MoSi2 element. The actual temperature and hot zone inside the alumina tube were determined by measuring the temperature profile using a calibrated B-type thermocouple. Each sample mixture, placed inside the platinum envelope or graphite crucible, was suspended in the hot zone of the furnace using a 0.5 mm diameter molybdenum wire. The sample was introduced inside the alumina tube of the furnace by initially positioning it at the cold base of the tube. The bottom section of the tube was then immersed in water, and argon gas was injected into the tube at a flow rate of 1 L/min. After 15 min, ensuring all residual air inside the tube was completely replaced by argon, the sample was raised and positioned in the hot zone, which had already reached the target temperature. After equilibration, the sample was dropped directly into the water at the bottom of the alumina tube to be rapidly quenched.
The quenched specimen was then dried, mounted in epoxy resin, and polished for further examination. The polished samples were coated with gold and were analyzed using a Scanning Electron Microscope equipped with an Energy Dispersive X-ray Spectroscopy detector (SEM-EDS) (JCM-7000 NeoScopeTM, JEOL, Tokyo, Japan). The SEM-EDS analysis was performed using a 20 kV electron beam. SEM-EDS analysis was conducted on 2 areas of the alloy phase, 3–4 points on each solid phase, and 3–4 areas of the slag phase. The composition used was the average of the data from each analyzed point within each phase. The quality and consistency of the SEM-EDS were assessed by analyzing Basaltic Glass and Springwater Olivine reference materials obtained from the Department of Mineral Sciences at the Smithsonian Institution. The dissolved carbon and oxygen contents in the alloy was not reported due to the low accuracy of the present SEM-EDS method for measuring carbon and oxygen.

3. Thermodynamic Calculations

In the present study, FactSage 8.0 [28] thermochemical software was used to calculate the equilibria and phase diagrams within the MgO–CaO–SiO2–Al2O3 slag system. The FactPS and FToxid databases were utilized within the Equilib and Phase Diagram modules. The results of the equilibria calculations were employed in the planning stage of the experiments, specifically to determine the bulk compositions of the mixtures, while the calculated phase diagrams were compared with the experimentally obtained phase diagrams. The optimized and self-consistent MgO–CaO–SiO2–Al2O3–FeO–Fe2O3 system databases used in the present calculations were constructed based on optimized parameters for the MgO–CaO–SiO2 system [29], the FeO–Fe2O3–MgO–SiO2 [30] system, and the CaO–MgO–Al2O3 and MgO–Al2O3–SiO2 systems [31]. The slag solution was described by using the Modified Quasichemical Model. The solid solutions within the system were described either by a polynomial model or by a sublattice model based on the compound-energy formalism. The calculated pseudo-ternary diagram of the MgO–CaO–SiO2 slag system with low Al2O3 contents, pertinent to the present study, exhibits primary phase fields of monoxides, olivine, melilite, proto-pyroxene, clino-pyroxene, wollastonite, pseudo-wollastonite, rankinite, α-Ca2SiO4, α’-Ca2SiO4, tridymite, and cristobalite.

4. Results and Discussion

4.1. Determination of Equilibrium Time

Initial experiments were carried out to determine the adequate time required to reach the final equilibrium condition. The most complex system was selected for these experiments, specifically the MgO–CaO–SiO2 slag system in equilibrium with alloy and solid carbon. The phase equilibrium of this system at a temperature of 1450 °C was approached from both reductive and oxidative initial conditions. For the reductive initial condition, a metal-dominant initial mixture was prepared, consisting of 55.25 wt% Fe, 29.75 wt% Ni, 15 wt% Si, 67 wt% SiO2, and 33 wt% CaO. In contrast, the oxidative initial condition involved preparing an oxide-dominant initial mixture consisting of 70.49 wt% FeO, 29.51 wt% Ni, 67 wt% SiO2, and 33 wt% CaO. The experiments under the reductive initial condition were carried out for 2 and 24 h, while the experiment under the oxidative initial condition was conducted only for 2 h. Examples of microstructures of the quenched samples from the equilibrium experiments approached from the reductive initial condition for 2 h and from the oxidative initial condition for 2 h are provided in Figure 2a,b, respectively. The equilibrium compositions from the reductive and oxidative initial conditions are shown in Table 1. The equilibrium experiment under the reductive initial condition for 2 h resulted in a phase assemblage of liquid slag, Fe–Ni–Si alloy, Si-rich alloy, and solid carbon. In contrast, the equilibrium experiment under the oxidative initial condition for 2 h resulted in a phase assemblage of liquid slag, Fe–Ni alloy, tridymite, and solid carbon. It was found that the 24 h equilibrium experiment under the reductive initial condition produced a similar result to the 2 h equilibrium experiment under the oxidative initial condition; both produced ferronickel alloy with low Si content. This suggests that the reaction kinetics were slow under the reductive initial condition. The metal-dominant initial mixture needed to be oxidized to reach the final equilibrium point, but the driving force for oxidation was limited under reducing conditions where solid carbon was also present. On the other hand, the reaction kinetics were rapid under the oxidative initial condition. The oxide-dominant initial mixture was easily reduced due to the abundant amount of solid carbon. Consequently, all subsequent experiments were conducted with a 2 h equilibrium time, approached from the oxidative initial condition.

4.2. Experimentally Determined Phase Equilibria

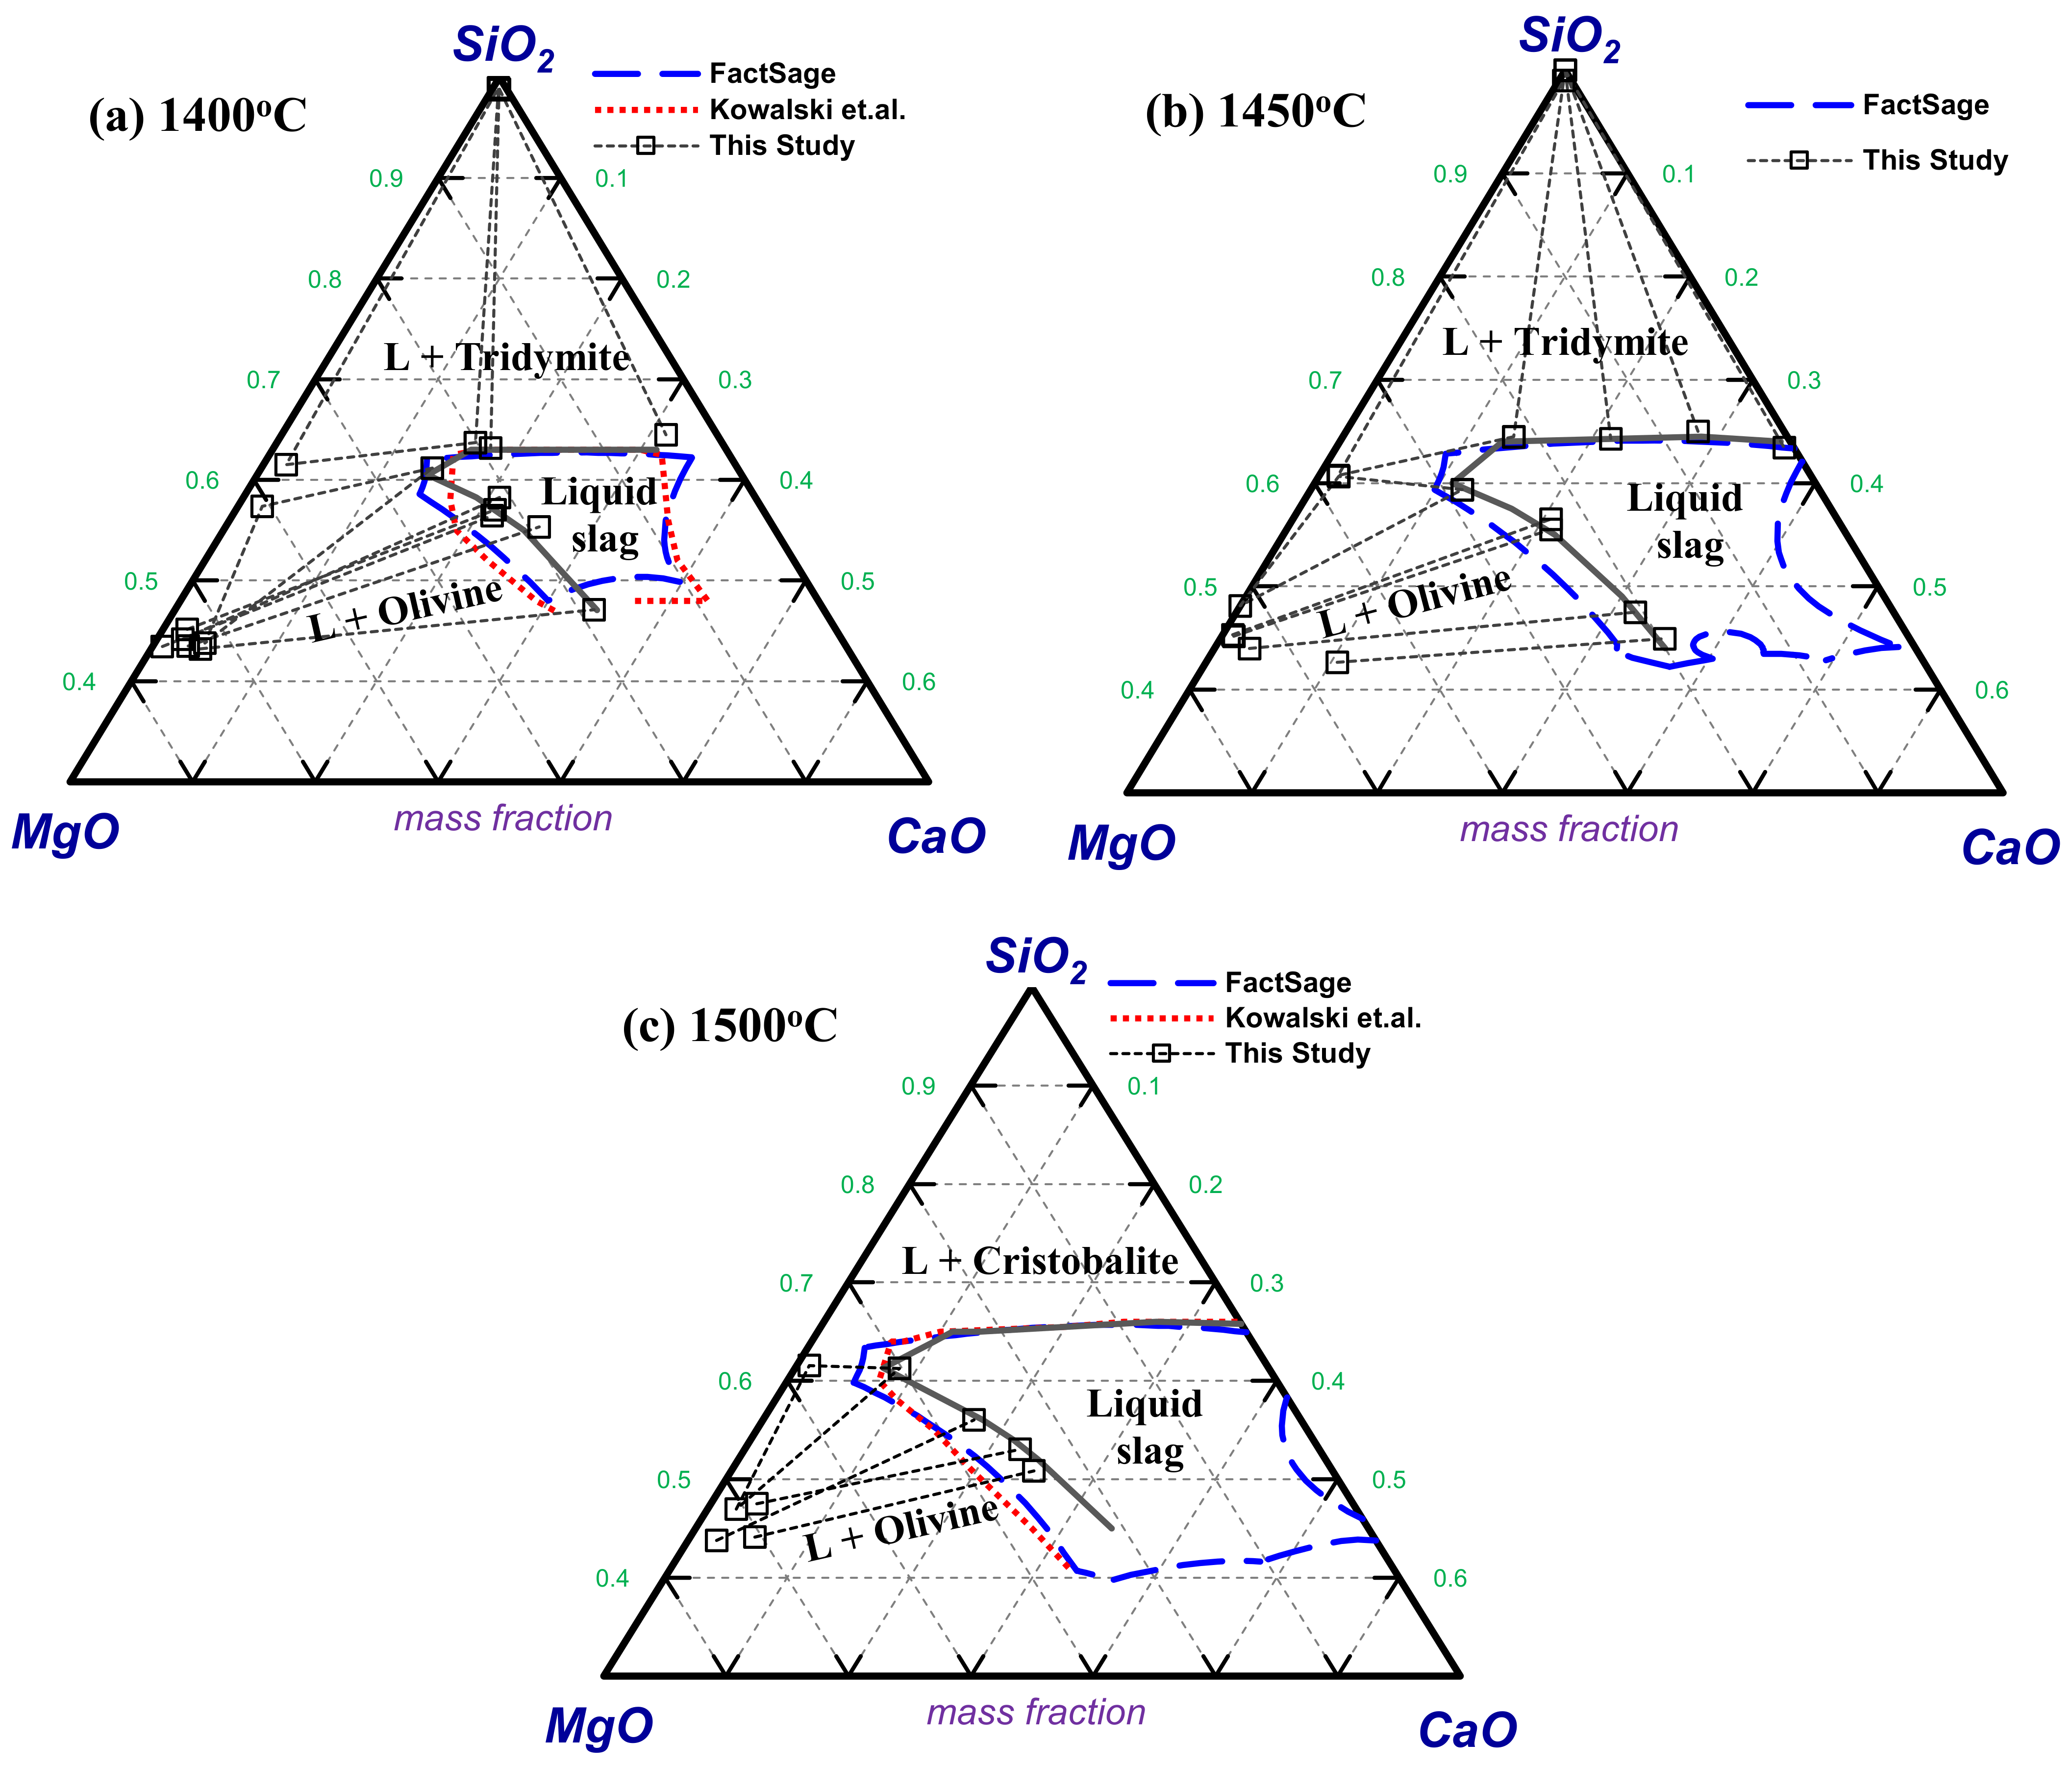
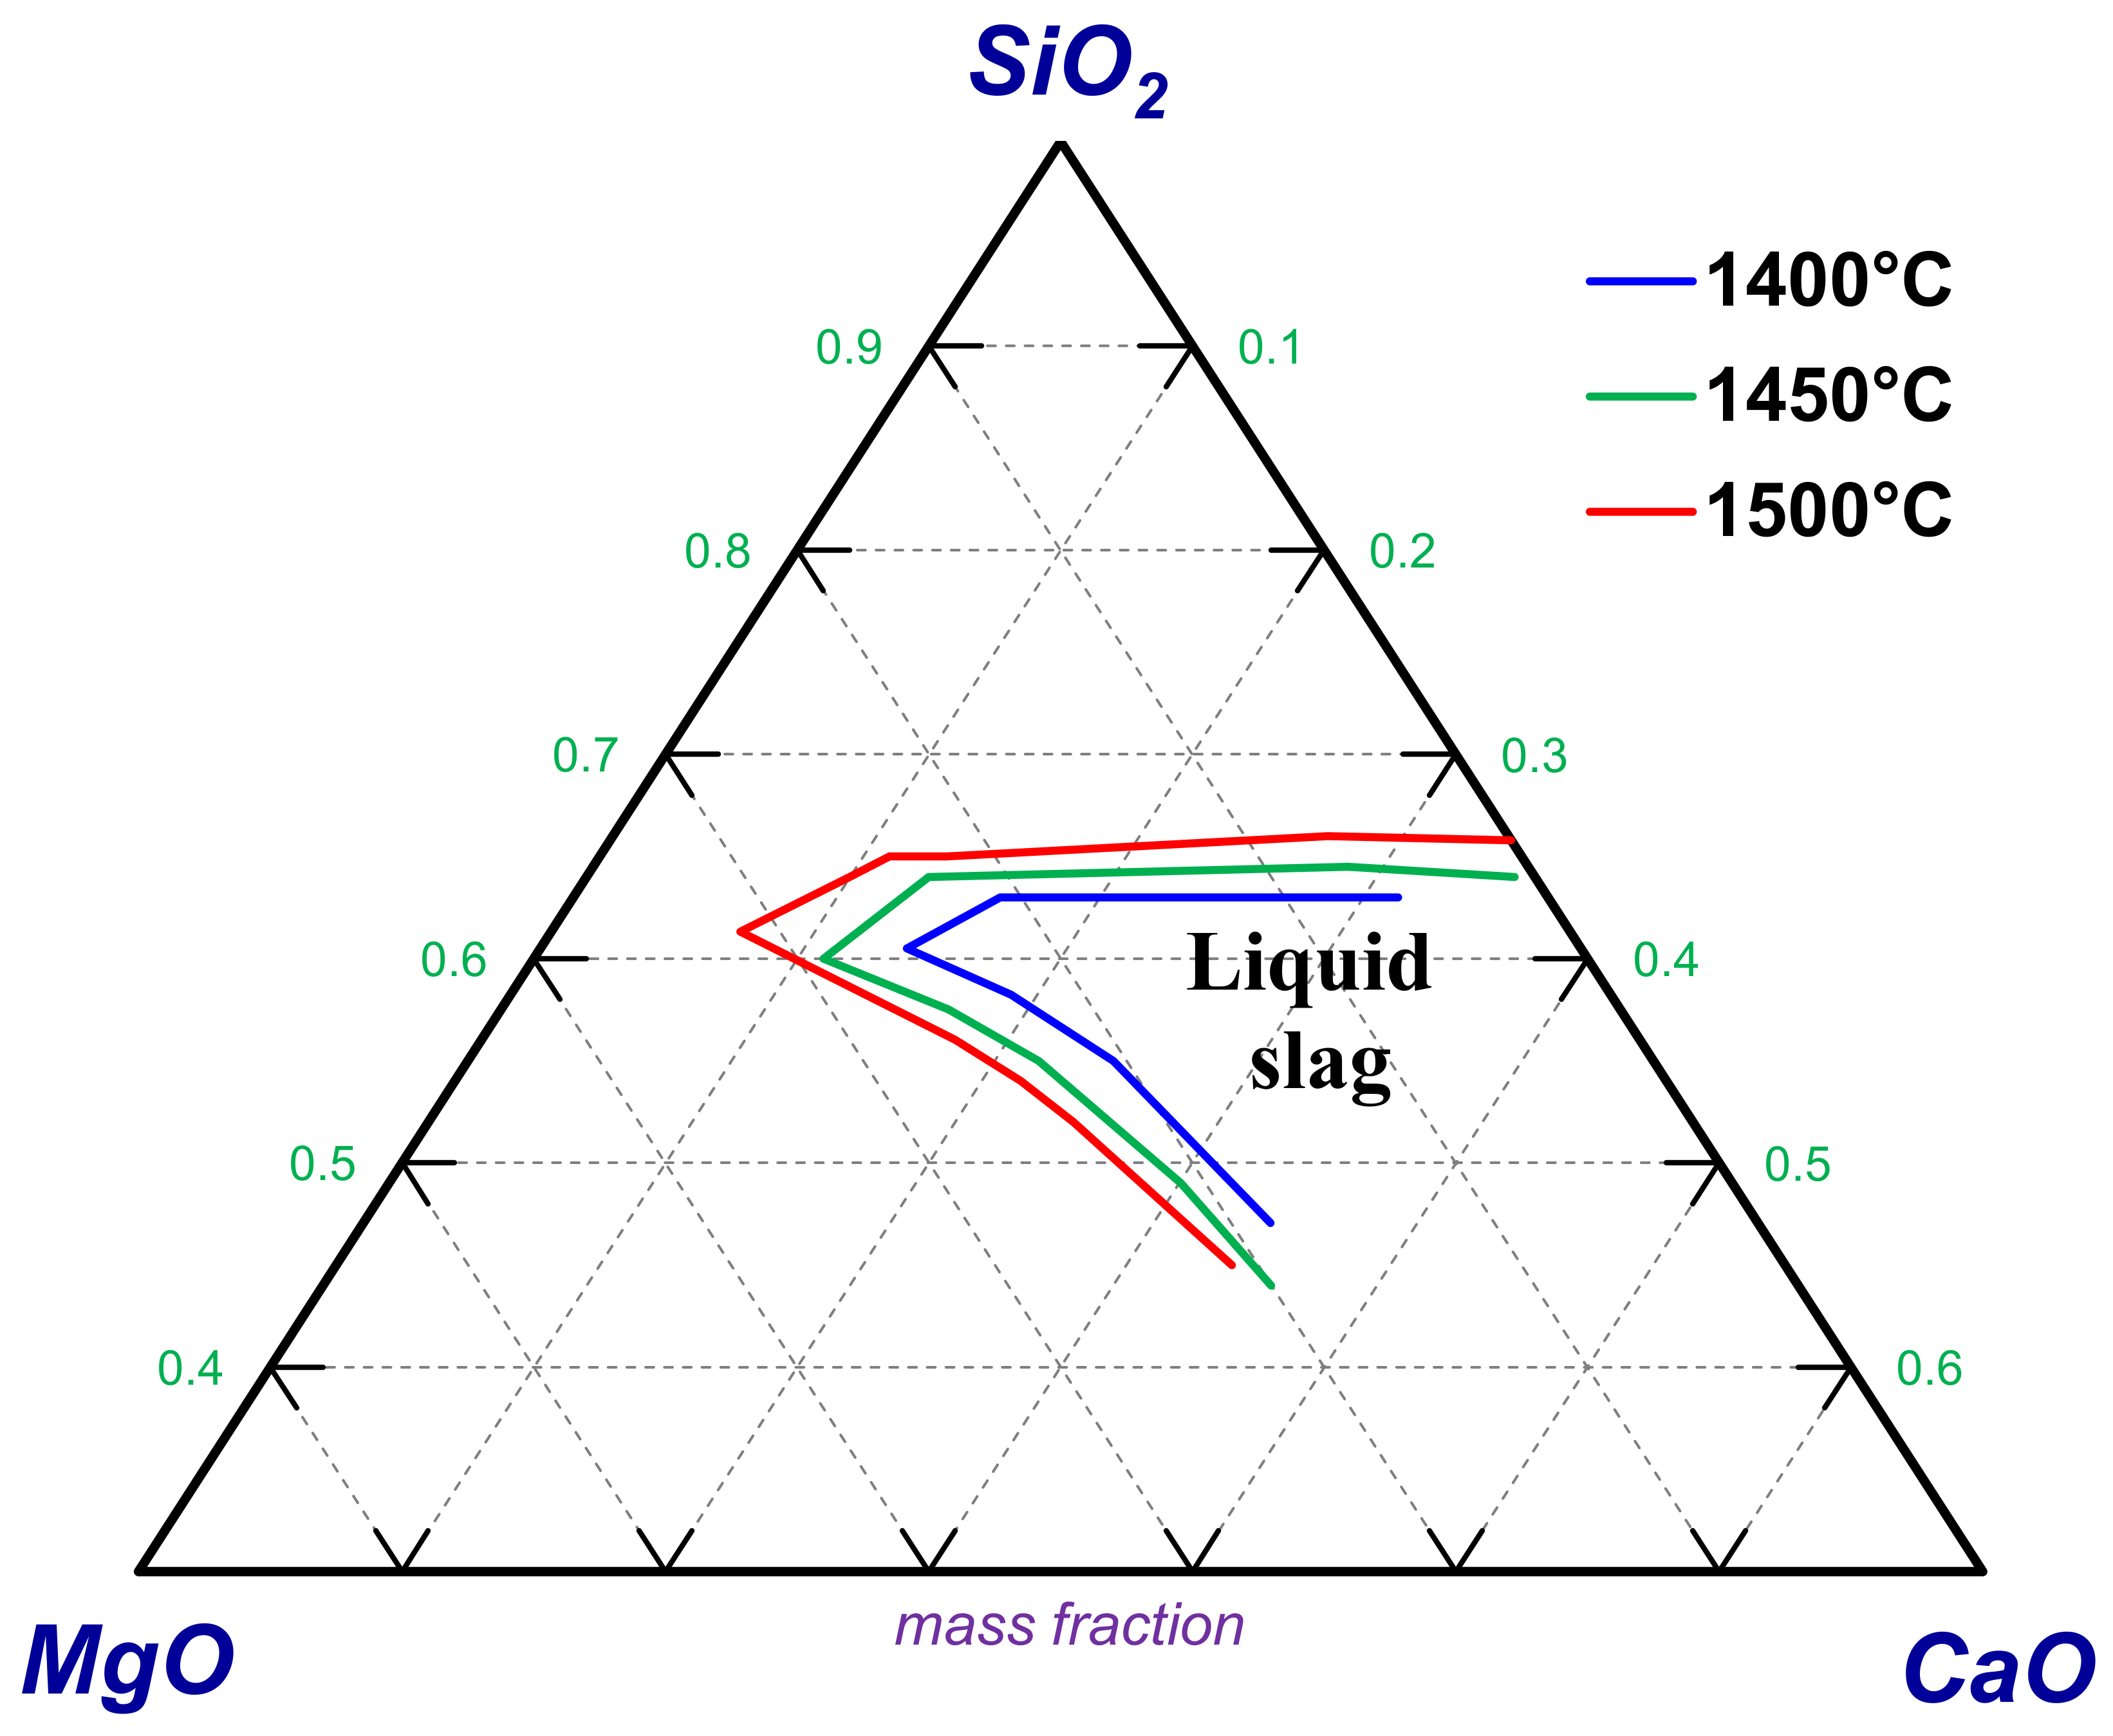
4.2.1. MgO–CaO–SiO2 Slag System

The phase equilibria of the MgO–CaO–SiO2 slag system have been experimentally investigated at 1400 °C and 1500 °C in the absence of ferronickel alloy, focusing on the olivine and tridymite/cristobalite primary phase fields. Examples of the microstructures of the quenched samples are provided in Figure 3. Figure 3a shows an example of a microstructure where the liquid slag is in equilibrium with olivine, forming euhedral crystals approximately 10 microns in size. Figure 3b provides an example of a microstructure where the liquid slag is in equilibrium with tridymite, forming round crystals with sizes ranging from 5 to 15 microns. The EDS-measured compositions of the liquid and solid phases after equilibration experiments in the MgO–CaO–SiO2 system are provided in Table 2. The liquidus and solidus compositions are plotted in the MgO–CaO–SiO2 ternary diagram in Figure 4. It can be observed that the experimental liquidus composition of tridymite at 1400 °C and the experimental liquidus composition of cristobalite at 1500 °C are in close agreement with those from the literature data [10] and thermodynamic calculations using FactSage. However, the experimental liquidus compositions begin to differ from the literature data and thermodynamic calculations for the olivine primary phase field, particularly at higher CaO/SiO2 ratios.

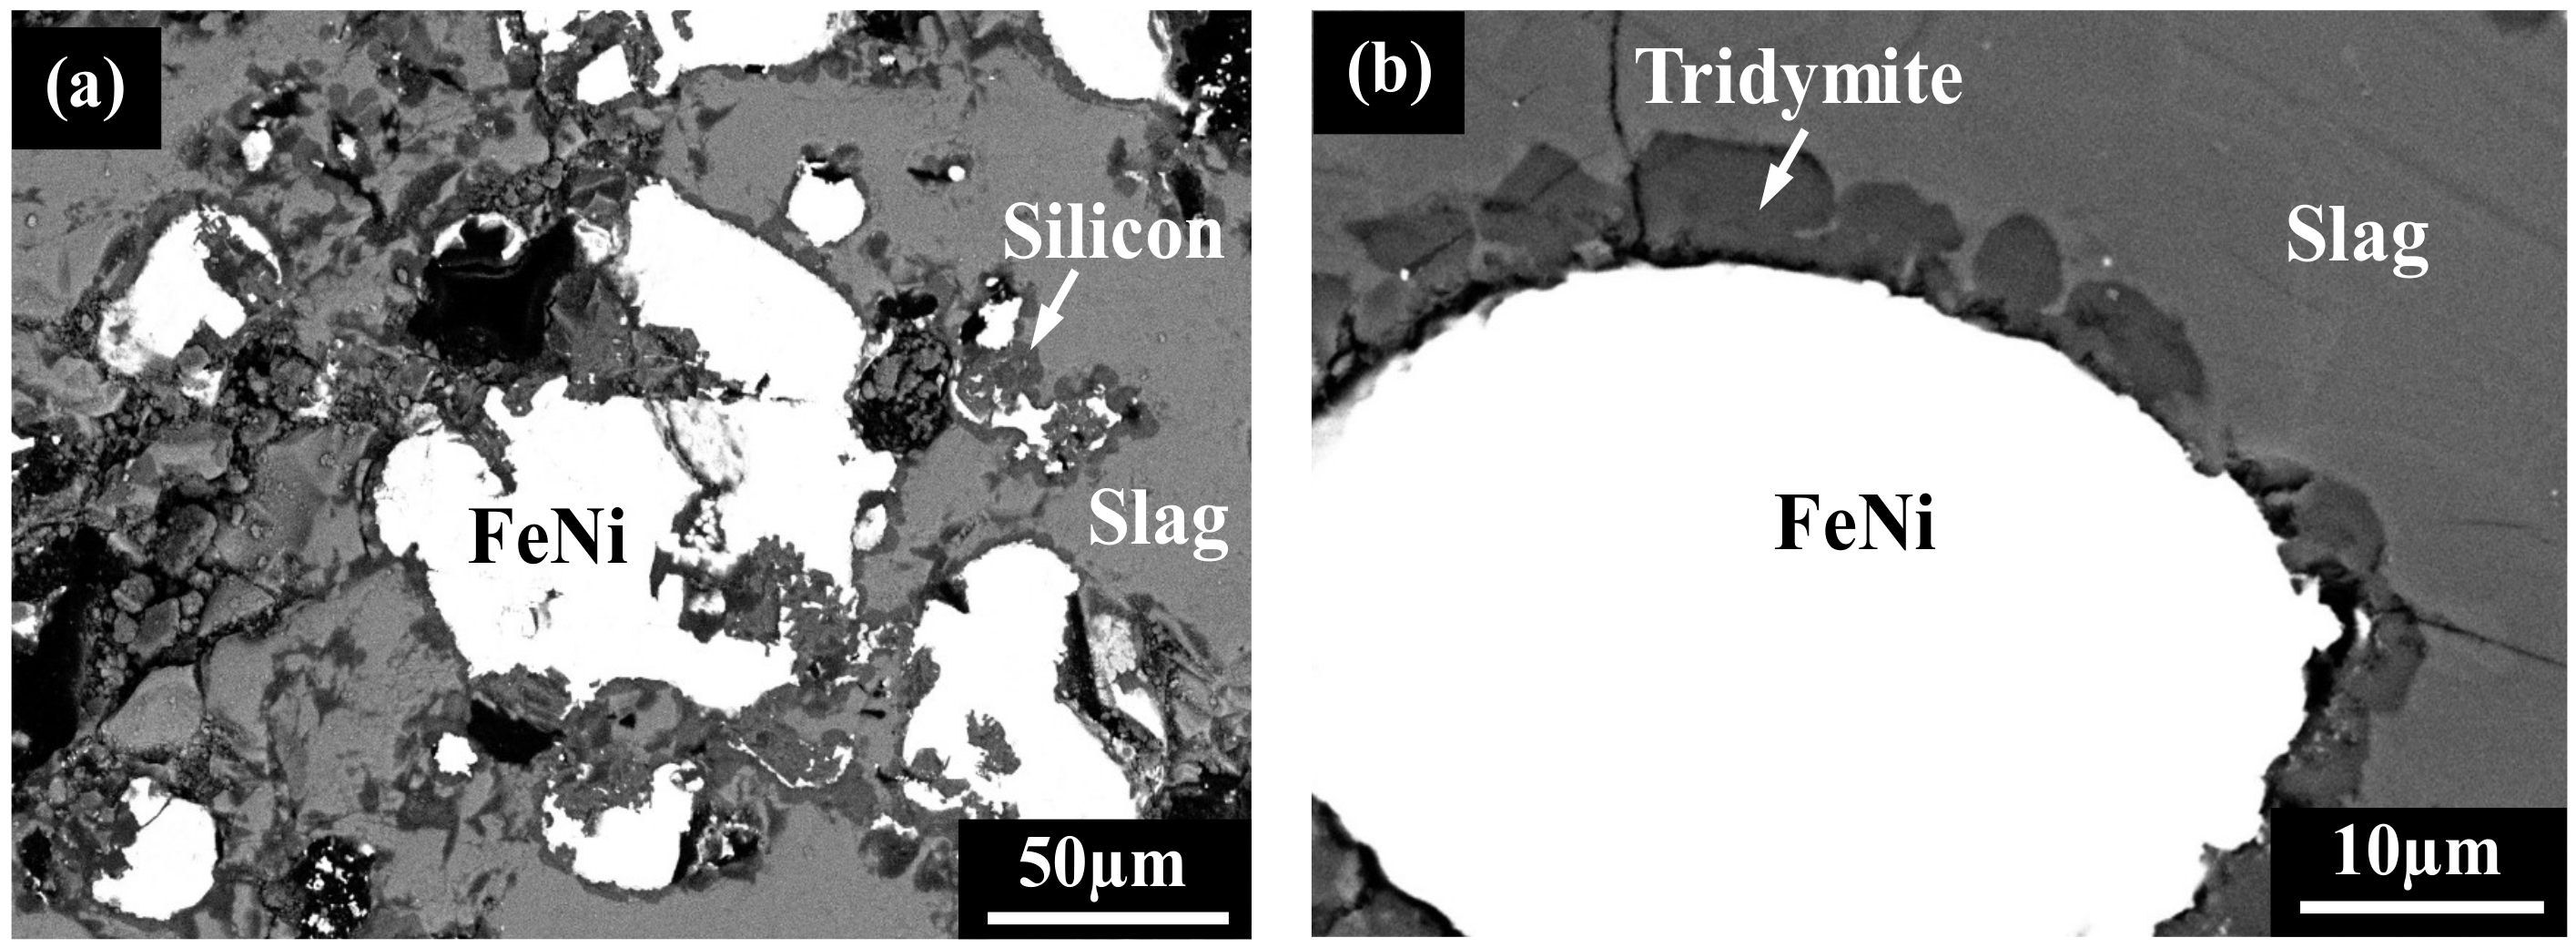
4.2.2. MgO–CaO–SiO2 Slag System in Equilibrium with Ferronickel and Solid Carbon

The phase equilibria of the MgO–CaO–SiO2 slag system in equilibrium with ferronickel and solid carbon have been determined at temperatures of 1400 °C, 1450 °C, and 1500 °C. Figure 5a through Figure 5e show examples of the microstructures of the quenched samples, depicting the equilibrium between liquid slag, FeNi alloy, and solid carbon with various solid oxide phases. The EDS-measured compositions of the liquid and solid phases after equilibration experiments in the MgO–CaO–SiO2 system in equilibrium with ferronickel and solid carbon are summarized in Table 3. The liquidus and solidus compositions are plotted in the MgO–CaO–SiO2 pseudo-ternary diagram in Figure 6. There is no significant difference in the experimental liquidus compositions between the slag systems in the absence and presence of ferronickel alloy and solid carbon, as shown in Figure 4 and Figure 6, respectively. As mentioned earlier, the slag system is less affected by atmospheric conditions because it predominantly consists of MgO, CaO, and SiO2, due to the negligible dissolution of multivalent iron oxide and nickel oxide in the slag under the carbon saturation condition. In general, the experimental liquidus composition of tridymite at 1400 °C and 1450 °C, as well as the experimental liquidus composition of cristobalite at 1500 °C, are in agreement within ±1 wt% SiO2 with those from the literature data [1] and thermodynamic calculations using FactSage. Similar to the MgO–CaO–SiO2 slag system in the absence of ferronickel alloy, the experimental liquidus compositions for the olivine primary phase field differ from the literature data and thermodynamic calculations. For the MgO–CaO–SiO2 system in equilibrium with ferronickel and solid carbon, this difference is approximately 4 wt% MgO at specific temperatures and CaO/SiO2 ratios.
The experimental liquidus compositions of the olivine, pyroxene, tridymite, and cristobalite primary phase fields of the MgO–CaO–SiO2 system in equilibrium with ferronickel and solid carbon are compiled in Figure 7. The fully liquid area of the slag system expands with increasing temperature. The expansion of the liquidus area near the tridymite and cristobalite regions is relatively small, amounting to 1–2 wt% toward SiO2 as the temperature increases by 50 °C. Meanwhile, the expansion of the liquidus area near the pyroxene and olivine regions is moderate, amounting to 3 wt% toward MgO as the temperature rises by 50 °C.

4.2.3. MgO–CaO–SiO2 Slag System in Equilibrium with Ferronickel and Solid Carbon with 5 and 10 wt% Al2O3

Experimental data on the effect of Al2O3 addition to the MgO–CaO–SiO2 slag system in equilibrium with ferronickel and solid carbon were acquired at 1400 °C and 1450 °C. The Al2O3 additions to the slag system were targeted at 5 and 10 wt%. The EDS-measured compositions of the liquid and solid phases after equilibration experiments in the MgO–CaO–SiO2–Al2O3 system are presented in Table 4. Most of the Al2O3 was found to partition into the liquid slag. The solid phases observed in the present study do not accommodate Al2O3 into their crystal structures; the small concentrations of Al2O3 found in the solids may be due to surrounding matrix interference or other measurement uncertainties.
The effect of Al2O3 addition on the liquidus composition at 1400 °C and 1450 °C is depicted in Figure 8. In the tridymite area, an increase in the Al2O3 concentration in the liquid slag shifts the liquidus composition toward higher SiO2. At 1400 °C and 1450 °C, the experimental tridymite liquidus composition shifts approximately 1% toward the SiO2 corner for every 1% Al2O3 addition to the slag. In contrast, changes in Al2O3 concentration in the liquid slag do not have a clear impact on the liquidus composition in the olivine and pyroxene primary phase fields. Thermodynamic calculations show a similar trend in the relationship between Al2O3 concentration and the liquidus compositions.
This study has determined the fully liquid slag region both in the absence and presence of ferronickel alloy and solid carbon, as well as in the presence of Al2O3 impurity within the olivine and tridymite/cristobalite formation boundaries. Recognizing this liquid slag area is crucial to ensure that nickel laterite smelting slag can be effectively tapped from the furnace.

4.3. Analysis of Alloy Phase

The alloy phases obtained from the equilibrium experiments show a diverse range of sizes and compositions. The alloy droplets vary widely in size, ranging from 7.9 to 530 microns. The compositions of the resulting alloys also vary, with ranges of 29.1–77.0 wt% Fe, 2.4–59.2 wt% Ni, and 0.11–27.6 wt% Si. The Fe–Ni–Si phase diagram by Witusiewicz et al. [32] is used to predict the liquidus temperature of the alloy phases. The alloy phases in this study are predicted to have liquidus temperatures in the range of 1100–1500 °C. The liquidus temperature of the alloy affects its tapping process. If the liquidus temperature of the alloy is higher than the operating temperature, the alloy will not melt completely, leading to difficulties during tapping [33]. The silicon content in the alloy is expected to increase with rising temperature. The silicon content in the alloy is also expected to increase with higher silica activity in the slag, achieved by increasing the SiO2/(MgO + CaO) ratio in the slag. However, there are no clear relationships between the alloy compositions and the experimental parameters in the present experiment. The uncertainty in the alloy composition observed in the present experiment may be caused by several factors, such as the following: (i) the presence of other components in the alloy, such as carbon and other unidentified elements; (ii) local equilibrium variations at different locations within the sample, as demonstrated by the differing compositions of alloy droplets within a single sample; (iii) sluggish reactions between the alloy and slag; and (iv) other experimental uncertainties. A comprehensive understanding of the interaction between the alloy phase and the slag system is essential for optimizing metallurgical processes. To achieve this, it is crucial to conduct further studies that delve deeper into the mechanisms governing this interaction and to refine the experimental approach to allow for more accurate data.

5. Conclusions

Experimental investigations of the MgO–CaO–SiO2–Al2O3 slag system, focusing on the olivine and tridymite/cristobalite primary phase fields, were conducted using high-temperature equilibration and quenching methods. SEM-EDS analysis was utilized to examine the microstructure and phase compositions in the quenched samples. The research provided phase equilibria data for the MgO–CaO–SiO2 slag system at 1400 °C and 1500 °C in the absence of ferronickel alloy. Phase equilibria data for this system were also obtained at 1400 °C, 1450 °C, and 1500 °C under a reducing condition, i.e., in equilibrium with ferronickel alloy and solid carbon. Additionally, experimental data on the impact of Al2O3 on the liquidus and solidus compositions of the slag were acquired at 1400 °C and 1450 °C. The results show that the liquidus compositions depend on temperature and Al2O3 addition. The fully liquid area of the slag system expands with increasing temperature. The addition of Al2O3 into the slag was found to primarily partition into the liquid slag, shifting the liquidus composition toward higher SiO2 in the tridymite area, but having minimal impact on the olivine and pyroxene regions. The alloy phases produced in the experiments showed a wide range of sizes and compositions. A clear understanding of the interaction between the alloy phase and the slag system requires further study and refinement of the experimental approach.

Author Contributions

Conceptualization, N.K.P.P. and T.H.; methodology, N.K.P.P., M.G.A., R.A.H. and T.H.; formal analysis, N.K.P.P., Z.Z. and T.H.; investigation, N.K.P.P., M.G.A., R.A.H., Z.Z. and T.H.; resources, Z.Z. and T.H.; data curation, N.K.P.P., M.G.A. and R.A.H.; writing—original draft preparation, N.K.P.P., M.G.A., R.A.H. and T.H.; writing—review and editing, N.K.P.P., M.G.A., R.A.H., Z.Z. and T.H.; visualization, N.K.P.P. and T.H.; supervision, Z.Z. and T.H.; project administration, T.H.; funding acquisition, Z.Z. and T.H. All authors have read and agreed to the published version of the manuscript.

Funding

This research was funded by Institut Teknologi Bandung research grant under Research, Community Service, and Innovation Program (PPMI) 2023 (contract no. 2152/IT1.C05/LK/2023).

Data Availability Statement

The data presented in this study are available on request from the corresponding author.

Acknowledgments

The authors gratefully acknowledge Institut Teknologi Bandung for providing funding for this work. The authors would like to acknowledge the support from PT Gunbuster Nickel Industry for providing the Scanning Electron Microscopy–Energy Dispersive X-ray Spectroscopy (JCM-7000 NeoScopeTM, JEOL, Tokyo, Japan) used for the analysis of the samples in this work. The authors would also like to acknowledge the support from the Department of Mineral Sciences of the Smithsonian Institution for providing Basaltic Glass and Springwater Olivine reference materials.

Conflicts of Interest

The authors declare no conflicts of interest.

References

  1. Statista Research Departement Chemicals & Resources: Mining, Metals & Minerals. Global Nickel Mining Industry Statistics & Facts. Available online: https://www.statista.com/topics/1572/nickel/#topicOverview (accessed on 23 May 2024).
  2. Crundwell, F.K.; Moats, M.S.; Ramachandran, V.; Robinson, T.G.; Davenport, W.G. Overview of the Smelting of Nickel Laterite to Ferronickel. In Extractive Metallurgy of Nickel, Cobalt and Platinum Group Metals; Elsevier: Amsterdam, The Netherlands, 2011; pp. 49–53. [Google Scholar]
  3. Wei, W.; Samuelsson, P.B.; Tilliander, A.; Gyllenram, R.; Jönsson, P.G. Energy Consumption and Greenhouse Gas Emissions of Nickel Products. Energies 2020, 13, 5664. [Google Scholar] [CrossRef]
  4. Wang, G.; Cui, Y.; Li, X.; Yang, S.; Zhao, J.; Tang, H.; Li, X. Molecular Dynamics Simulation on Microstructure and Physicochemical Properties of FexO-SiO2-CaO-MgO-“NiO” Slag in Nickel Matte Smelting under Modulating CaO Content. Minerals 2020, 10, 149. [Google Scholar] [CrossRef]
  5. Nelson, L.R.; Geldenhuis, J.M.A.; Miraza, T.; Badrujaman, T.; Hidyat, A.T.; Jauhari, I.; Stober, F.A.; Voermann, N.; Wasmund, B.O.; Jahnsen, E.J.M. Role of Operational Support in Ramp-Up of The FeNi Furnace at PT ANTAM in Pomala. In Proceedings of the International Conference on Innovations in the Ferro Alloy Industry (IFACON XI), New Delhi, India, 18–21 February 2007; pp. 798–813. [Google Scholar]
  6. Osborn, E.F.; Muan, A. Phase Equilibrium Diagrams of Oxide System; American Ceramic Society with the Edward Orton Jr. Ceramic Foundation: Columbus, OH, USA, 1960. [Google Scholar]
  7. Kushiro, I. Determination of Liquidus Relations in Synthetic Silicate Systems with Electron Probe Analysis: The System Forsterite-Diopside-Silica at 1 Atmosphere. Am. Mineral. J. Earth Planet. Mater. 1972, 57, 1260–1271. [Google Scholar]
  8. Longhi, J.; Boudreau, A.E. The Orthoenstatite Liquidus Field in The System Forsterite–Diopside–Silica at One Atmosphere. Am. Mineral. 1980, 65, 563–573. [Google Scholar]
  9. Liu, T.; Presnall, D.C. Diopside—Tridymite Liquidus Boundary Line in The System Mg2SiO4—CaMgSi2O6—SiO2 at Atmospheric Pressure. Mineral. Soc. Am. 1989, 7, 1032. [Google Scholar]
  10. Kowalski, M.; Spencer, P.J. Slag Atlas; Verlag Stahleisen GmbH: Duesseldorf, Germany, 1995; p. 134. [Google Scholar]
  11. Prince, A.T. Phase Equilibrium Relationships in a Portion of the System MgO-Al2O3-2CaO.SiO2. J. Am. Ceram. Soc. 1951, 34, 44–51. [Google Scholar] [CrossRef]
  12. DeVries, R.C.; Osborn, E.F. Phase Equilibria in High-Alumina Part of the System CaO–MgO–Al2O3–SiO2. J. Am. Ceram. Soc. 1957, 40, 6–15. [Google Scholar] [CrossRef]
  13. Osborn, E.F.; Devries, R.C.; Gee, K.H.; Kraner, H.M. Optimum Composition of Blast Furnace Slag as Deduced from Liquidus Data for The Quaternary System CaO-MgO-AI2O3-SiO2. J. Met. 1954, 200, 33–45. [Google Scholar]
  14. Prince, A.T. Liquidus Relationships on 10% MgO Plane of The System Lime—Magnesia—AIumina—SiIica. Am. Ceram. Soc. 1953, 37, 402–408. [Google Scholar] [CrossRef]
  15. Gutt, W.; Russell, A.D. Studies of the System CaO-SiO2-Al2O3-MgO in Relation to the Stability of Blast Furnace Slag. J. Mater. Sci. 1977, 12, 1869–1878. [Google Scholar] [CrossRef]
  16. Dahl, F.; Brandberg, J.; Sichen, D. Characterization of Melting of Some Slags in the Al2O3–CaO–MgO–SiO2 Quaternary System. ISIJ Int. 2006, 46, 614–616. [Google Scholar] [CrossRef]
  17. Alicia Vázquez, B.; Caballero, Á.; Pena, P. Quaternary System Al2O3-CaO-MgO-SiO2: Study of the Crystallization Volume of MgAl2O4. J. Am. Ceram. Soc. 2005, 88, 1949–1957. [Google Scholar] [CrossRef]
  18. Gran, J.; Wang, Y.; Sichen, D. Experimental Determination of The Liquidus in The High Basicity Region in the Al2O3 (30 Mass%)—CaO—MgO—SiO2 System. Calphad Comput. Coupling Phase Diagr. Thermochem. 2011, 35, 249–254. [Google Scholar] [CrossRef]
  19. Gran, J.; Yan, B.; Sichen, D. Experimental Determination of the Liquidus in The High-Basicity Region in the Al2O3(25 Mass Pct)-CaO-MgO-SiO2 and Al2O3(35 Mass Pct)-CaO-MgO-SiO2 Systems. Metall. Mater. Trans. B Process Metall. Mater. Process. Sci. 2011, 42, 1008–1016. [Google Scholar] [CrossRef]
  20. Ma, X.; Wang, G.; Wu, S.; Zhu, J.; Zhao, B. Phase Equilibria in the CaO-SiO2-Al2O3-MgO System Related to Iron Blast Furnace Slag. In Proceedings of the High Temperature Processing Symposium 2014 Swinburne University of Technology, Melbourne, Australia, 7–8 February 2014; pp. 90–92. [Google Scholar]
  21. Ma, X.; Wang, G.; Wu, S.; Zhu, J.; Zhao, B. Phase Equilibria in the CaO-SiO2-Al2O3-MgO System with CaO/SiO2 Ratio of 1.3 Relevant to Iron Blast Furnace Slags. ISIJ Int. 2015, 55, 2310–2317. [Google Scholar] [CrossRef]
  22. Ma, X.; Zhang, D.; Zhao, Z.; Evans, T.; Zhao, B. Phase Equilibria Studies in The CaO-SiO2- Al2O3-MgO System with CaO/SiO2 Ratio of 1.10. ISIJ Int. 2016, 56, 513–519. [Google Scholar] [CrossRef]
  23. Kou, M.; Wu, S.; Ma, X.; Wang, L.; Chen, M.; Cai, Q.; Zhao, B. Phase Equilibrium Studies of CaO-SiO2-MgO-Al2O3 System with Binary Basicity of 1.5 Related to Blast Furnace Slag. Metall. Mater. Trans. B Process Metall. Mater. Process. Sci. 2016, 47, 1093–1102. [Google Scholar] [CrossRef]
  24. Lyu, S.; Ma, X.; Chen, M.; Huang, Z.; Yao, Z.; Wang, G.; Zhao, B. Application of Phase Equilibrium Studies of CaO–SiO2–Al2O3–MgO System for Oxide Inclusions in Si-Deoxidized Steels. Calphad Comput. Coupling Phase Diagr. Thermochem. 2020, 68, 101721. [Google Scholar] [CrossRef]
  25. Wang, D.; Chen, M.; Jiang, Y.; Wang, S.; Zhao, Z.; Evans, T.; Zhao, B. Phase Equilibria Studies in The CaO–SiO2–Al2O3–MgO System with CaO/SiO2 Ratio of 0.9. J. Am. Ceram. Soc. 2020, 103, 7299–7309. [Google Scholar] [CrossRef]
  26. Yao, Z.; Ma, X.; Lyu, S. Phase Equilibria of the Al2O3–CaO–SiO2-(0%, 5%, 10%) MgO Slag System for Non-Metallic Inclusions Control. Calphad Comput. Coupling Phase Diagr. Thermochem. 2021, 72, 102227. [Google Scholar] [CrossRef]
  27. Liao, J.; Qing, G.; Zhao, B. Phase Equilibrium Studies in the CaO–SiO2–Al2O3–MgO System with MgO/CaO Ratio of 0.2. Metall. Mater. Trans. B Process Metall. Mater. Process. Sci. 2023, 54, 793–806. [Google Scholar] [CrossRef]
  28. Bale, C.W.; Bélisle, E.; Chartrand, P.; Decterov, S.A.; Eriksson, G.; Gheribi, A.E.; Hack, K.; Jung, I.H.; Kang, Y.B.; Melançon, J.; et al. Reprint of: FactSage Thermochemical Software and Databases. Calphad Comput. Coupling Phase Diagr. Thermochem. 2016, 55, 1–19. [Google Scholar] [CrossRef]
  29. Jung, I.H.; Decterov, S.A.; Pelton, A.D. Critical Thermodynamic Evaluation and Optimization of The CaO-MgO-SiO2 System. J. Eur. Ceram. Soc. 2004, 25, 313–333. [Google Scholar] [CrossRef]
  30. Jung, I.-H.; Decterov, S.A.; Pelton, A.D. Critical Thermodynamic Evaluation and Optimization of The FeO-Fe2O3-MgO-SiO2 System. Met. Mater. Trans. B 2004, 35, 877–889. [Google Scholar] [CrossRef]
  31. Jung, I.H.; Decterov, S.A.; Pelton, A.D. Critical Thermodynamic Evaluation and Optimization of the MgO-Al2O3, CaO-MgO-Al2O3, and MgO-Al2O3-SiO2 System. J. Phase Equilibria Diffus. 2004, 25, 329–345. [Google Scholar] [CrossRef]
  32. Witusiewicz, V.T.; Stryzhyboroda, O.; Vinke, S.; Bobzin, K.; Hecht, U. Experimental Study and Thermodynamic Modelling of The Ternary System Fe–Ni–Si with Remodelling of The Constituent Binary Systems. J. Alloys Compd. 2023, 935, 168118. [Google Scholar] [CrossRef]
  33. Tangstad, M.; Olsen, J.E.; Ringdalen, E.; Ksiazek, M.; Reynolds, Q.; Steenkamp, J. Conceptual Tapping Model of Mn-Ferroalloy Furnaces. JOM 2022, 74, 3962–3970. [Google Scholar] [CrossRef]
Figure 1. Schematic of the vertical tube furnace used in this study.
Processes 12 01946 g001
Figure 2. Microstructures of the quenched samples showing the resulting phases from equilibrium experiments: (a) approached from reductive initial condition for 2 h, and (b) approached from oxidative initial condition for 2 h.
Processes 12 01946 g002
Figure 3. Microstructures of the quenched samples showing the equilibrium of liquid slag with (a) olivine and (b) tridymite.
Processes 12 01946 g003
Figure 4. Liquidus and solidus compositions in MgO–CaO–SiO2 system at temperatures of (a) 1400 °C and (b) 1500 °C [10].
Processes 12 01946 g004
Figure 5. Microstructures of the quenched samples showing the equilibrium of liquid slag, FeNi alloy, and solid carbon with (a) olivine; (b) pyroxene; (c) tridymite and pyroxene; (d) olivine and pyroxene; and (e) pyroxene and pseudo-wollastonite.
Processes 12 01946 g005
Figure 6. Liquidus and solidus compositions in MgO–CaO–SiO2 slag system in equilibrium with ferronickel and solid carbon at temperatures of (a) 1400 °C; (b) 1450 °C; and (c) 1500 °C [10].
Processes 12 01946 g006
Figure 7. Liquidus compositions in MgO–CaO–SiO2 slag system in equilibrium with ferronickel and solid carbon as a function of temperature.
Processes 12 01946 g007
Figure 8. Liquidus and solidus compositions in MgO–CaO–SiO2–Al2O3 slag system in equilibrium with ferronickel and solid carbon at 0, 5, and 10 wt% Al2O3 and temperatures of (a) 1400 °C and (b) 1450 °C.
Processes 12 01946 g008
Table 1. EDS-measured compositions of phases from the equilibrium experiments between MgO–CaO–SiO2 slag system, ferronickel, and solid carbon for the determination of equilibrium time.
PhaseComposition (wt%)
Mg *Ca *Si *Fe *Ni *Al *
MgOCaOSiO2FeONiOAl2O3
2 h from
reductive initial condition
Alloy *0.020.1320.572.95.80.04
Si Alloy *0.000.1896.21.960.350.05
Liquid Slag1.0134.663.70.270.110.25
2 h from
oxidative initial condition
Alloy *0.090.152.659.536.40.07
Tridymite0.228.389.11.280.370.47
Liquid Slag0.7534.961.91.430.270.60
24 h from
reductive initial condition
Alloy *0.020.121.1965.132.90.01
Tridymite0.050.7998.90.180.000.09
Liquid Slag0.5832.260.25.70.850.49
Rows marked with * indicate elemental composition, while unmarked rows indicate oxide composition.
Table 2. EDS-measured compositions of phases from the equilibrium experiments of the MgO–CaO–SiO2 slag system.
No.Temp (C)PhaseComposition (wt%)
MgOCaOSiO2
11400Tridymite0.382.696.7
CaSiO30.1648.850.8
Liquid Slag5.330.163.1
21400Tridymite0.973.295.5
Liquid Slag9.728.661.1
31400Tridymite0.590.4798.7
Liquid Slag25.814.359.3
41400Olivine50.42.845.8
Liquid Slag26.714.358.1
51400Olivine48.25.345.8
Liquid Slag20.323.855.5
61500Cristobalite0.071.7198.0
Liquid Slag0.4335.763.3
71500Cristobalite0.220.5199.0
Liquid Slag11.922.864.7
81500Cristobalite0.170.3899.1
Liquid Slag24.510.662.3
91500Olivine52.41.4545.0
Liquid Slag32.86.359.8
101500Olivine54.02.343.7
Liquid Slag20.224.055.8
Table 3. EDS-measured compositions of phases from the equilibrium experiments between MgO–CaO–SiO2 slag system, ferronickel, and solid carbon.
No.Temp (C)PhaseComposition (wt%)
Mg *Ca *Si *Fe *Ni *Al *
MgOCaOSiO2FeONiOAl2O3
1.1400Alloy *0.433.022.871.22.40.11
Tridymite0.580.6198.00.170.220.41
Liquid Slag4.130.863.40.630.410.43
2.1400Alloy *1.821.6022.055.918.60.06
Tridymite0.660.5797.40.390.550.39
Liquid Slag18.917.562.50.370.150.39
3.1400Alloy *3.21.295.0330.959.20.17
Pyroxene35.91.8260.31.230.470.30
Tridymite0.590.4398.70.140.000.10
Liquid Slag19.515.761.81.820.310.62
4.1400Alloy *5.231.7023.443.325.90.21
Pyroxene39.81.9156.20.730.970.24
Olivine51.94.0643.60.230.000.16
Liquid Slag24.313.659.71.040.401.00
5.1400Alloy *0.100.0419.768.511.70.04
Olivine53.42.0943.90.130.080.34
Liquid Slag20.620.657.50.190.190.98
6.1400Alloy *0.090.051.5758.739.30.37
Olivine52.71.9745.00.200.000.13
Liquid Slag21.620.956.40.350.060.59
7.1400Alloy *1.650.9111.564.920.90.09
Olivine55.30.8043.10.540.000.19
Liquid Slag22.120.955.70.400.210.57
8.1400Alloy *0.100.136.377.016.30.10
Olivine53.42.9043.30.140.170.17
Liquid Slag18.925.354.80.100.050.77
9.1400Alloy *0.400.8310.168.620.20.26
Olivine52.64.0343.10.150.000.14
Liquid Slag18.633.946.70.040.000.84
10.1450Alloy *0.173.625.059.611.50.08
Tridymite0.000.000.990.000.000.00
Liquid Slag0.7534.961.91.430.270.60
11.1450Alloy *0.832.7824.149.322.80.14
Tridymite0.000.000.990.000.000.00
Liquid Slag6.727.563.61.300.220.46
12.1450Alloy *1.221.6921.962.112.90.10
Tridymite0.000.000.990.010.000.00
Liquid Slag14.021.263.40.650.110.55
13.1450Alloy *1.580.272.345.447.30.08
Pyroxene36.91.4759.41.120.350.62
Tridymite0.600.3898.80.000.070.14
Liquid Slag21.313.362.91.610.000.92
14.1450Alloy *1.730.231.762.533.60.16
Pyroxene36.91.5659.31.140.720.29
Olivine49.50.0045.92.22.100.36
Liquid Slag27.611.757.41.540.621.12
15.1450Alloy *0.060.142.659.737.40.15
Olivine53.10.9444.50.570.100.79
Liquid Slag23.120.954.90.200.090.73
16.1450Alloy *0.090.013.658.837.50.04
Olivine53.30.7944.80.660.310.15
Liquid Slag22.620.455.90.330.020.59
17.1450Alloy *0.080.150.1173.825.90.03
Olivine52.92.843.70.370.110.14
Liquid Slag20.531.647.10.060.060.70
18.1450Alloy *1.762.52.662.429.51.35
Olivine46.510.442.30.200.080.58
Liquid Slag19.234.844.10.420.001.51
19.1500Alloy *5.91.1227.643.421.60.24
Pyroxene37.31.0061.30.240.000.10
Olivine49.82.346.11.000.280.53
Liquid Slag29.48.359.61.160.471.09
20.1500Alloy *3.41.0023.962.49.20.15
Olivine53.32.343.30.440.280.44
Liquid Slag25.916.754.30.680.601.69
21.1500Alloy *2.31.0324.746.824.21.04
Olivine46.73.645.52.41.390.46
Liquid Slag23.621.751.21.270.861.25
22.1500Alloy *5.62.623.936.030.00.18
Olivine49.85.243.40.550.530.42
Liquid Slag23.523.848.90.900.572.13
Rows marked with * indicate elemental composition, while unmarked rows indicate oxide composition.
Table 4. EDS-measured compositions of phases from the equilibrium experiments between MgO–CaO–SiO2–Al2O3 slag system, ferronickel, and solid carbon.
No.Temp (C)PhaseComposition (wt%)
Mg *Ca *Si *Fe *Ni *Al *
MgOCaOSiO2FeONiOAl2O3
1.1400Alloy *0.030.193.0853.935.10.07
Tridymite0.410.4693.83.41.660.34
Liquid Slag17.313.262.70.210.136.5
2.1400Alloy *1.041.8623.629.143.80.67
Tridymite2.25.688.61.030.571.93
Liquid Slag7.918.466.10.890.336.4
3.1400Alloy *0.227.46.847.437.70.38
Tridymite0.090.5298.70.370.060.32
Liquid Slag0.5629.663.91.170.324.4
4.1400Alloy *5.71.4919.034.738.50.30
Olivine49.93.445.00.590.380.72
Liquid Slag21.418.156.50.670.442.9
5.1400Alloy *0.060.0816.048.934.80.04
Olivine53.32.144.10.130.170.23
Liquid Slag18.326.951.90.180.092.7
6.1400Alloy *0.050.1319.853.925.70.07
Tridymite5.14.287.40.340.082.9
Liquid Slag15.511.763.20.590.168.8
7.1400Alloy *0.080.2422.129.248.20.12
Tridymite0.511.9696.30.190.050.94
Liquid Slag6.219.365.40.140.178.9
8.1400Alloy *0.010.1921.940.637.10.06
Tridymite0.134.892.80.230.041.98
Liquid Slag0.4424.465.90.150.029.2
9.1400Alloy *0.150.1415.651.431.70.05
Olivine55.40.6143.60.150.080.18
Liquid Slag18.217.457.40.050.056.9
10.1400Alloy *0.180.1716.456.624.90.09
Olivine54.71.1443.80.000.020.31
Liquid Slag17.923.551.30.120.126.8
11.1450Alloy *0.090.108.357.332.70.03
Tridymite6.001.6490.90.340.060.98
Liquid Slag20.78.363.91.370.155.6
12.1450Alloy *0.200.193.958.936.60.08
Tridymite0.680.6998.20.060.050.28
Liquid Slag13.614.765.60.990.065.1
13.1450Alloy *0.090.519.754.734.90.01
Tridymite0.350.7398.10.170.120.49
Liquid Slag7.218.2166.80.290.167.3
14.1450Alloy *0.010.1419.650.629.70.05
Tridymite0.010.7697.80.890.220.31
Liquid Slag0.4227.265.90.950.055.5
15.1450Alloy *0.250.5616.542.137.70.17
Olivine51.02.9545.10.230.090.62
Liquid Slag21.919.654.40.590.163.4
16.1450Alloy *0.040.2715.144.140.30.10
Olivine55.12.741.10.190.120.73
Liquid Slag19.9528.045.20.150.156.6
17.1450Alloy *3.890.9626.635.032.21.28
Tridymite6.372.487.10.710.373.1
Liquid Slag17.706.166.40.700.588.5
18.1450Alloy *0.050.1421.438.839.50.05
Tridymite0.660.7297.80.040.110.65
Liquid Slag13.212.265.80.110.118.6
19.1450Alloy *0.260.7222.136.939.60.30
Tridymite0.782.994.70.150.101.39
Liquid Slag5.519.266.60.140.008.5
20.1450Alloy *0.020.4322.034.043.40.18
Tridymite0.031.6797.30.090.100.78
Liquid Slag0.3623.966.00.110.079.6
21.1450Alloy *0.120.1516.448.933.70.03
Olivine54.70.8743.90.110.110.19
Liquid Slag18.220.352.50.150.138.5
22.1450Alloy *0.060.1113.046.039.80.03
Olivine53.91.7343.70.200.350.16
Liquid Slag15.530.444.40.150.178.0
Rows marked with * indicate elemental composition, while unmarked rows indicate oxide composition.
Disclaimer/Publisher’s Note: The statements, opinions and data contained in all publications are solely those of the individual author(s) and contributor(s) and not of MDPI and/or the editor(s). MDPI and/or the editor(s) disclaim responsibility for any injury to people or property resulting from any ideas, methods, instructions or products referred to in the content.

