Article

Understanding Perforation Detonation Failure Mechanisms Based on Physicochemical Detection and Simulation Modeling

1
Exploration Division, PetroChina Xinjiang Oilfield Company, Karamay 834000, China
2
Oil Test Company, CNPC Xibu Drilling Engineering Co., Ltd., Karamay 834000, China
3
CNPC Engineering Technology R & D Company Limited, Beijing 102206, China
4
National Engineering Laboratory of Oil and Gas Drilling Technology, Beijing 102206, China
*
Authors to whom correspondence should be addressed.
Processes 2024, 12(9), 1971; https://doi.org/10.3390/pr12091971
Submission received: 17 July 2024 / Revised: 22 August 2024 / Accepted: 4 September 2024 / Published: 13 September 2024
(This article belongs to the Topic Energy Extraction and Processing Science)

Abstract

:
With advancements in the exploration and development of deep and ultra-deep oil and gas resources, the number of ultra-deep wells continues to rise globally. This trend places higher demands on testing technology. The combined perforating and testing technique, an established method for deep and ultra-deep wells, faces challenges. Frequent test operation failures due to perforation detonation failure increase down-hole complexity, restricting the timeliness of testing operations. Current methods use mechanical calibration software to calculate the minimum safety factor of the tubing string for safety assessments. However, without a thorough understanding of perforation detonation failure theory, existing mechanical analysis software remains unreliable for assessing well safety during operations. Simply using the safety factor method lacks reliability and cannot explain the causes of perforation detonation failure. This paper examines an ultra-deep well, referred to as TW1, to analyze perforation detonation failure mechanisms. Through metal microstructure examinations, chemical composition analysis, electron microscope scanning, and numerical simulation, the study yields the following insights: (1) The packer mandrel of Well TW1 fractured due to overstress from the detonation waves. (2) Detonation wave propagation patterns along the tubing string during perforation become apparent. (3) Simulation methods reconstruct the perforation detonation process, calculating effective stress at different tubing string positions over time. (4) It introduces an innovative approach for assessing perforation detonation failure mechanisms through a combination of laboratory testing and simulation modeling.

1. Introduction

Deep and ultra-deep wells are defined as wells with a depth significantly greater than the commercially developed drilling depth. In this article, the term “depth” is understood as the vertical distance from the wellhead to the bottomhole of the well. Thus, extended horizontal wells are not considered. According to the International Continental Scientific Drilling Program (ICDP) adopted in 1997, ultra-deep wells are wells with a depth of more than 8 km [1]. By the end of 2022, there were a total of 580 exploratory wells exceeding 8000 m globally. Among these, 187 wells were land-based, while 393 were in offshore regions. Notably, there was one land-based well, the SG-3, that surpassed a depth of 10,000 m. Of these exploratory wells, 177 were located in China, with the remaining distributed across countries such as the United States, Mexico, and Australia, primarily concentrated in the Gulf of Mexico. A portion of the ultra-deep well depths has been compiled (Table 1).
TW1 sits within the East Bay anticline of the Huomatu thrust belt, at the southern margin of the Junggar Basin. It functions as a risk exploration well aimed at evaluating the hydrocarbon potential of the East Bay structural belt, achieving a total drilling depth of 8166 m. Downhole pressure gauge data reveals a formation pressure of 171.78 MPa and a temperature of 170.13 °C. This well boasts the record for the highest formation pressure among domestic oil and gas fields.
The combined process of perforation and testing is crucial for oil testing in ultra-deep exploratory wells. It enables a single tubing string to achieve perforation, testing, acidizing, fluid drainage, and other functions. This method offers significant reservoir protection, time efficiency, and reduced well control risks. The technical advantages have been maturely applied domestically for over 20 years, facilitating the exploration and development of deep and ultra-deep oil and gas resources in the country [2]. The perforation testing combined technology had been applied five times in the ultra-deep, ultra-high-pressure small wellbore reservoirs in the mid-southern edge, with mature energies, obtaining complete and accurate geological data and achieving safe and efficient oil testing. However, with the continuous increase in reservoir depth, temperature, and pressure, perforation testing combined technology has encountered perforation detonation issues in recent years. The temperature at the bottom of the TW1 measures 170.13 °C, with a calculated temperature gradient of 2.08 degrees, the temperature increases every 100 m. Following the analysis presented above, it was concluded that the perforation testing combined technology is one of the few important testing technologies to meet the needs of efficient exploration and development, dealing with complex and diverse geological features, and harsh engineering environments [3,4]. However, to reduce the impact of perforation detonation on the tubing string and ensure the success rate and accuracy of the test data, it is necessary to thoroughly analyze the failure mechanism of perforation detonation effects and clarify the propagation laws of perforation detonation waves, forming a perforation detonation failure evaluation technology for ultra-deep wells [5,6].
Early assessments of stuck string, wellbore safety, and well control safety were conducted to ensure safety throughout the well control, wellbore, and surface energies. Innovative optimization of the tubing string structure was made, drawing from successful operations in Tarim, Southwest China, and other oilfields. A “two-valve (double RD valve), one-seal” tubing string combination was designed. Dynamic tracking and analysis of formation pressure, fluid properties, and production capacity during oil testing guided the prediction of production parameters, system adjustments, and safe production time forecasts [7,8].
The minimum safety factor of the tubing string was calculated before the operation, exceeding the required standard. Additionally, a thick-walled mandrel packer was used. Despite efforts to avoid safety risks, the extreme high-pressure, high-temperature conditions led to the packer mandrel breaking, causing all tools below the packer rubber tube to fall into the well. This demonstrated the unreliability of evaluating perforation detonation effects on tubing strings solely by safety factor methods. It also highlighted the limitations of current domestic and international tubing mechanical analysis and strength verification software under such extreme conditions. There is an urgent need for a reliable method to evaluate perforation detonation failure mechanisms [9].
Researchers have conducted extensive studies on perforation detonation mechanisms during oil testing. In 2013, Xiangtong Yang et al. used thermodynamic theory to analyze the impact load of perforation torque by examining perforation intervals, bottom hole pockets, and packer flow pressure, subsequently analyzing the structural integrity of perforation tubing using buckling theory [10,11]. In 2014, Liangliang Ding et al. created a jet penetration model for perforated projectiles based on fluid–solid coupling theory, investigating the energy conversion characteristics between jet kinetic energy and shell melting energy to determine the remaining energy conversion relationships of perforated projectiles under various influencing factors [12]. In 2016, Bale D et al. conducted studies on detonation wave oscillation-related theories based on temperature pressure influencing factors, using multiphase flow seepage theory [13]. In 2018, Qiao Deng et al. investigated the generation, attenuation, and reflection energies of pressure waves during the perforation process in wellbore completion fluids, establishing a complete calculation model for determining the safety distance of packers [14,15,16]. In 2020, Mark B et al. used numerical simulation methods to analyze the impact of detonation waves on fluids within the wellbore to accurately calculate maximum loads during perforation detonation [17,18,19,20,21,22,23,24]. In 2023, the Southwest Branch of China National Logging Corporation evaluated the stress state of the tubing during perforation detonation moments based on the measured frequency of the downhole perforation detonation wave through modal analysis methods [25]. In 2023, the CCDC Well Testing and Intervention Company, CNPC, proposed an analysis method for the dynamic load response of perforation detonation in ultra-deep, high-temperature, high-pressure sour wells based on peak perforation pressure, pulsation pressure, and perforation impact load tubing strength [26]. In 2024, CNPC Engineering and Technology R&D Company Limited conducted research on the nonlinear propagation and influencing factors of detonation waves in ultra-deep well perforations, studying the impact of completion fluid properties (density, viscosity, etc.) on the amplitude of detonation waves during propagation to provide theoretical reference for designing completion fluid parameters for oil and gas wells [27].
In 2024, Fayong Yuan et al. studied annular pressure pulsation regulations in the wellbore during perforation detonation, establishing a detonation wellbore pressure prediction model based on the fluid–solid coupling theory and predicting its distribution patterns [28]. Although previous researchers evaluated the propagation characteristics of perforation detonation waves using theoretical analysis and measured data, they did not verify the reliability of propagation laws through indoor testing, and they lacked quantitative evaluation methods for perforation detonation failure.
This study analyzed packer mandrel breakage using ultrasonic, physical, chemical, and microscopic methods, revealing detonation wave propagation laws. Researchers created physical models for simulation to replicate system behaviors on a computer. This allowed for the analysis and prediction of actual system performance. They reconstructed the entire perforation detonation process and calculated effective stress at various positions along the tubing string over time. A combined laboratory detection and simulation method evaluated perforation detonation failure mechanisms. The methodology flowchart clarifies the workflow (Figure 1).

2. Materials and Methods

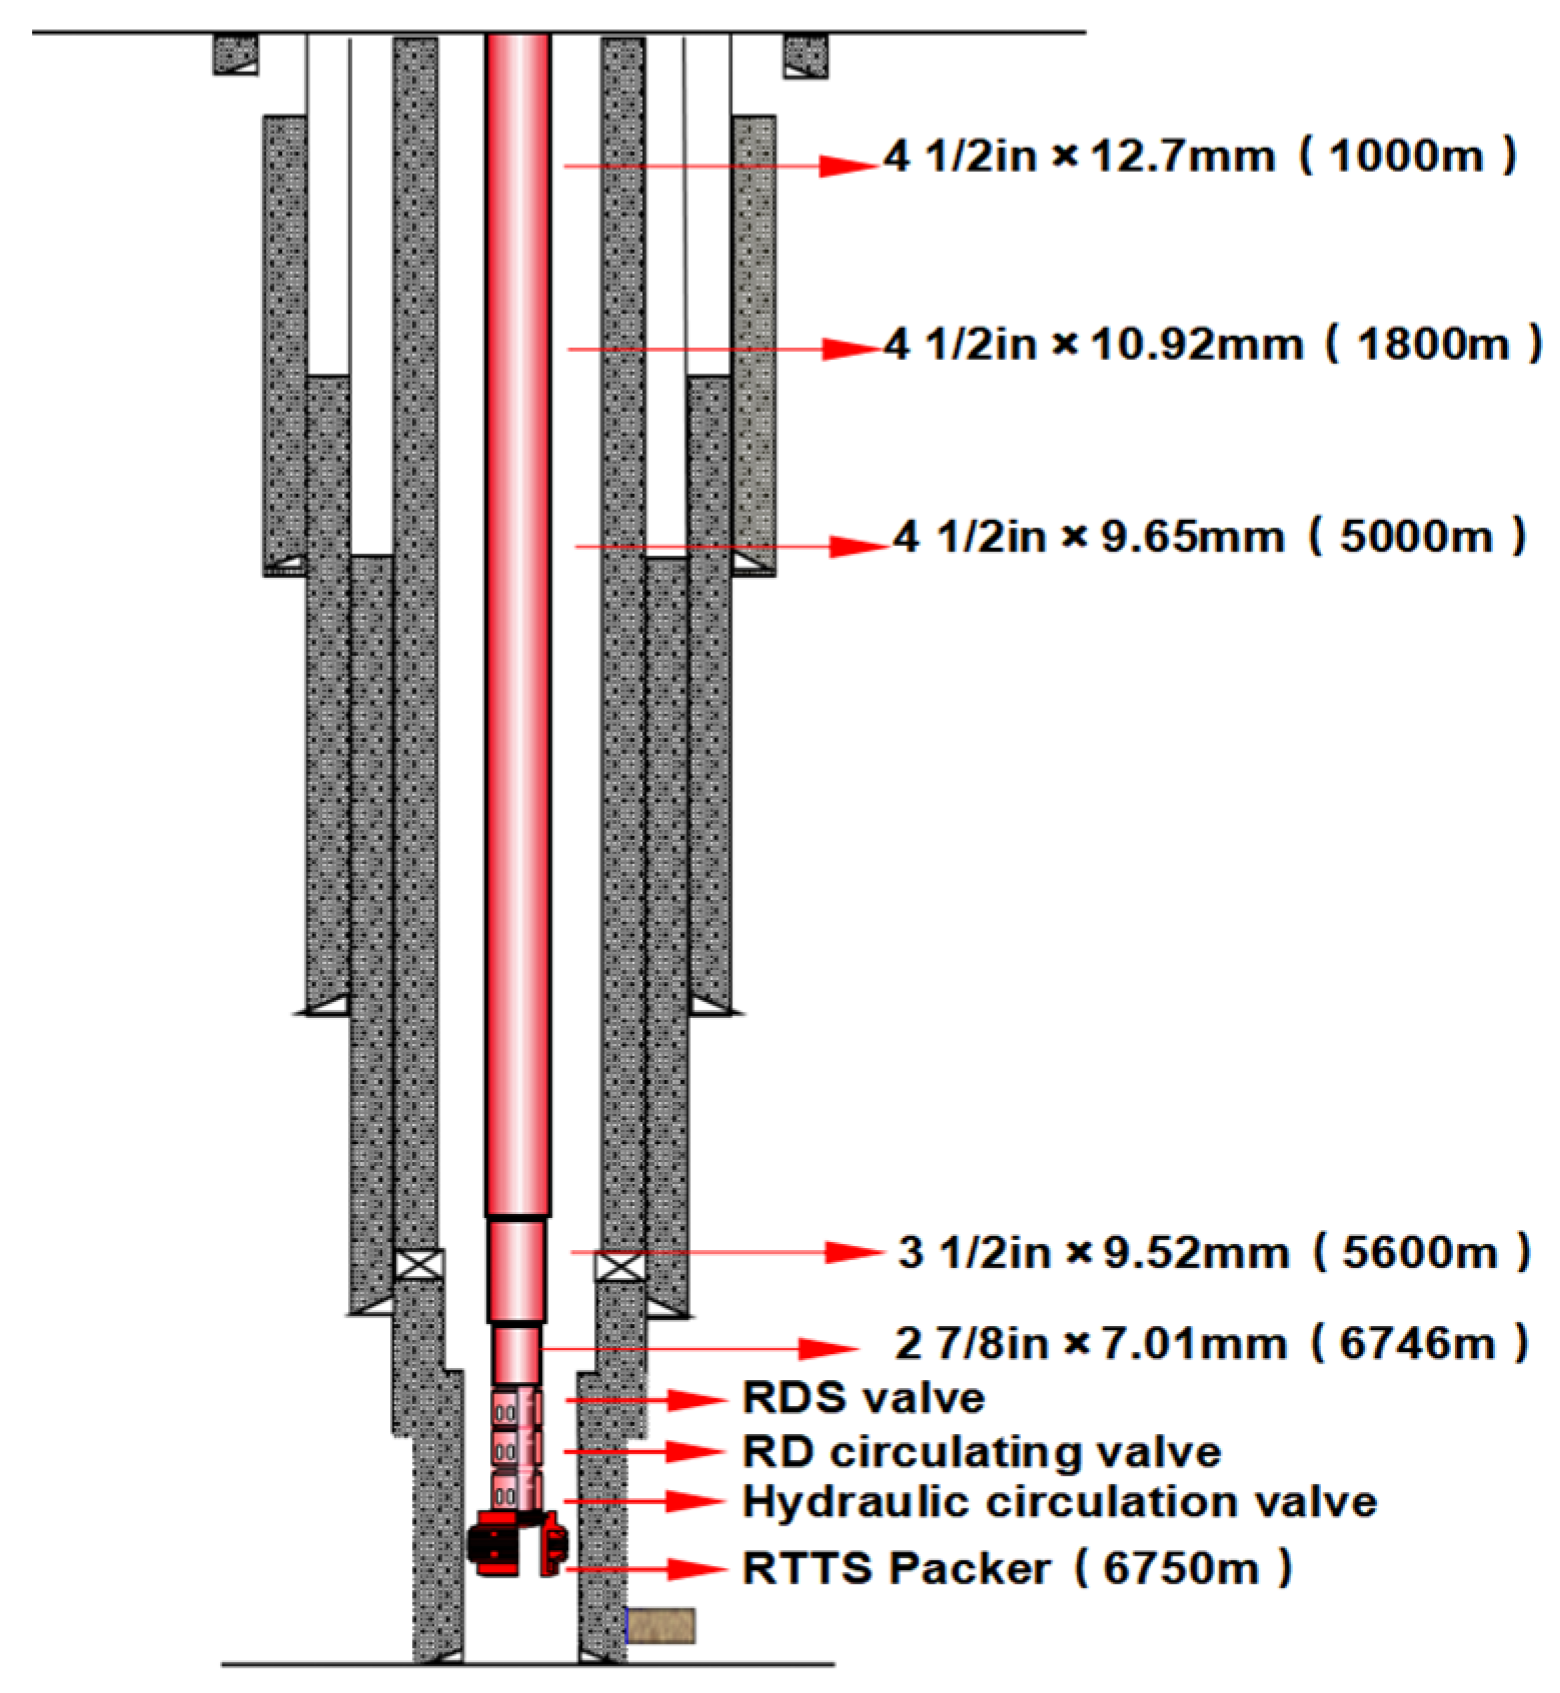
2.1. Ultra-Deep Well Testing String Design

The five major challenges faced before the oil testing operations of this well included the following: (1) Shut-in pressure exceeding the maximum of 20,000 psi (rated working pressure 137.9 MPa) pressure level of the wellhead device and the ground process pressure limit; (2) The internal pressure resistance strength of the casing at the wellhead was only 125.2 MPa, posing a risk of casing over-pressure; (3) Micro leaks at the hanger, abnormal pressure in the B annulus, poor well integrity, and risks; (4) The 5 1/2” small-size wellbore extended up to 1600 m, making subsequent workover operations very challenging; (5) Perforation detonation, which could have caused packer failure, deformation and sticking of linkage tubing, and breakage. After thoroughly evaluating the construction operation risk points, the following countermeasures were formulated: (1) Use of a two-wing, four-process system on the surface to ensure non-shut-in oil testing. Determine the nature and permeability of formation fluids, prepare double the amount of drilling mud on-site, and according to the actual well conditions, prepare for temporary closure of the production layer; (2) Conduct wellbore integrity tests before oil testing to locate leak points and monitor A annulus and B annulus pressures. Increase the density of the working fluid to reduce annulus pressure; (3) Conduct detonation force simulation assessments to predict detonation risks and achieve risk control.
Addressing the challenges of oil testing for TW1, considering geological characteristics, if using the “bare tubing” oil test string, it does not meet well integrity requirements, and the casing is overpressurized, posing high risks for oil testing. Therefore, the “Two Valves One Seal” perforation testing combined string (Figure 2) is used for testing, during which the well is not shut in to ensure well control safety. The design adopts 4 1/2” + 3 1/2” + 2 7/8” gas-tight tubing with 2 RD circulation valves + 103 mm RTTS packer + tailpipe (including 2 sets of shock absorbers) + a perforating gun for the perforation testing combined string structure.

2.2. Operation Overview and Testing Results

Negative pressure leak monitoring: We ran a “Three Valves One Seal” (RDS valve, RD circulation valve, hydraulic circulation valve, and RTTS packer) negative pressure leak monitoring string in the hole (Figure 3), verifying the passability of the wellbore tools, and conducting a leak monitoring on the hanger. After completion, we replaced the 1.35 g/cm3 oil-based mud in the wellbore with 1.2 g/cm3 salt fluid. Subsequently, we set the RTTS packer at the casing below the hanger. Since the formation pressure exceeds the hydrostatic pressure within the wellbore, if the hanger loses its seal, the casing pressure will increase. During the shut-in leak monitoring, the external pressure gauge showed a casing pressure rise, indicating a hanger leakage; however, the leakage rate was small. Combined with the previous pressure-bearing tests, a comprehensive analysis showed that the wellbore met operating conditions. We then ran a “Two Valves One Seal” (dual RD valves and RTTS packer) perforation testing in the hold, combining the string and setting the packer. We then perforated the layer in brine. The formation pressure measured 170.52 MPa, with a pressure coefficient of 2.152.
We released the packer and pulled the string out of the hole. It was found that the male thread end of the RTTS packer mandrel joint was broken off. The fish structure was as follows: packer rubber sleeve, slips, Ф73 mm tubing, and perforating gun assembly; the fish length: 214.88 m.
According to the relevant standards and common use for testing operations, we used 3–4–5–6–7.2–8.1 mm nozzles for the trial production, with oil pressures of 110.90, 123.36, and 117.14 MPa, obtaining an 8.1 mm nozzle trial production with a daily gas production of 75.82 million cubic meters, a daily oil production of 127.07 cubic meters, and a maximum wellhead flow pressure of 123.36 MPa. The shut-in after perforation converted original formation pressure at the middle of the gas layer (8079.00 m) is 171.78 MPa; the formation pressure coefficient is 2.167; and the converted middle of the gas layer formation temperature is 170.13℃, therefore, setting a national record for formation pressure and wellhead flow pressure in oil and gas fields. Refer to Table 2 for detailed well testing results.

3. Results and Discussion

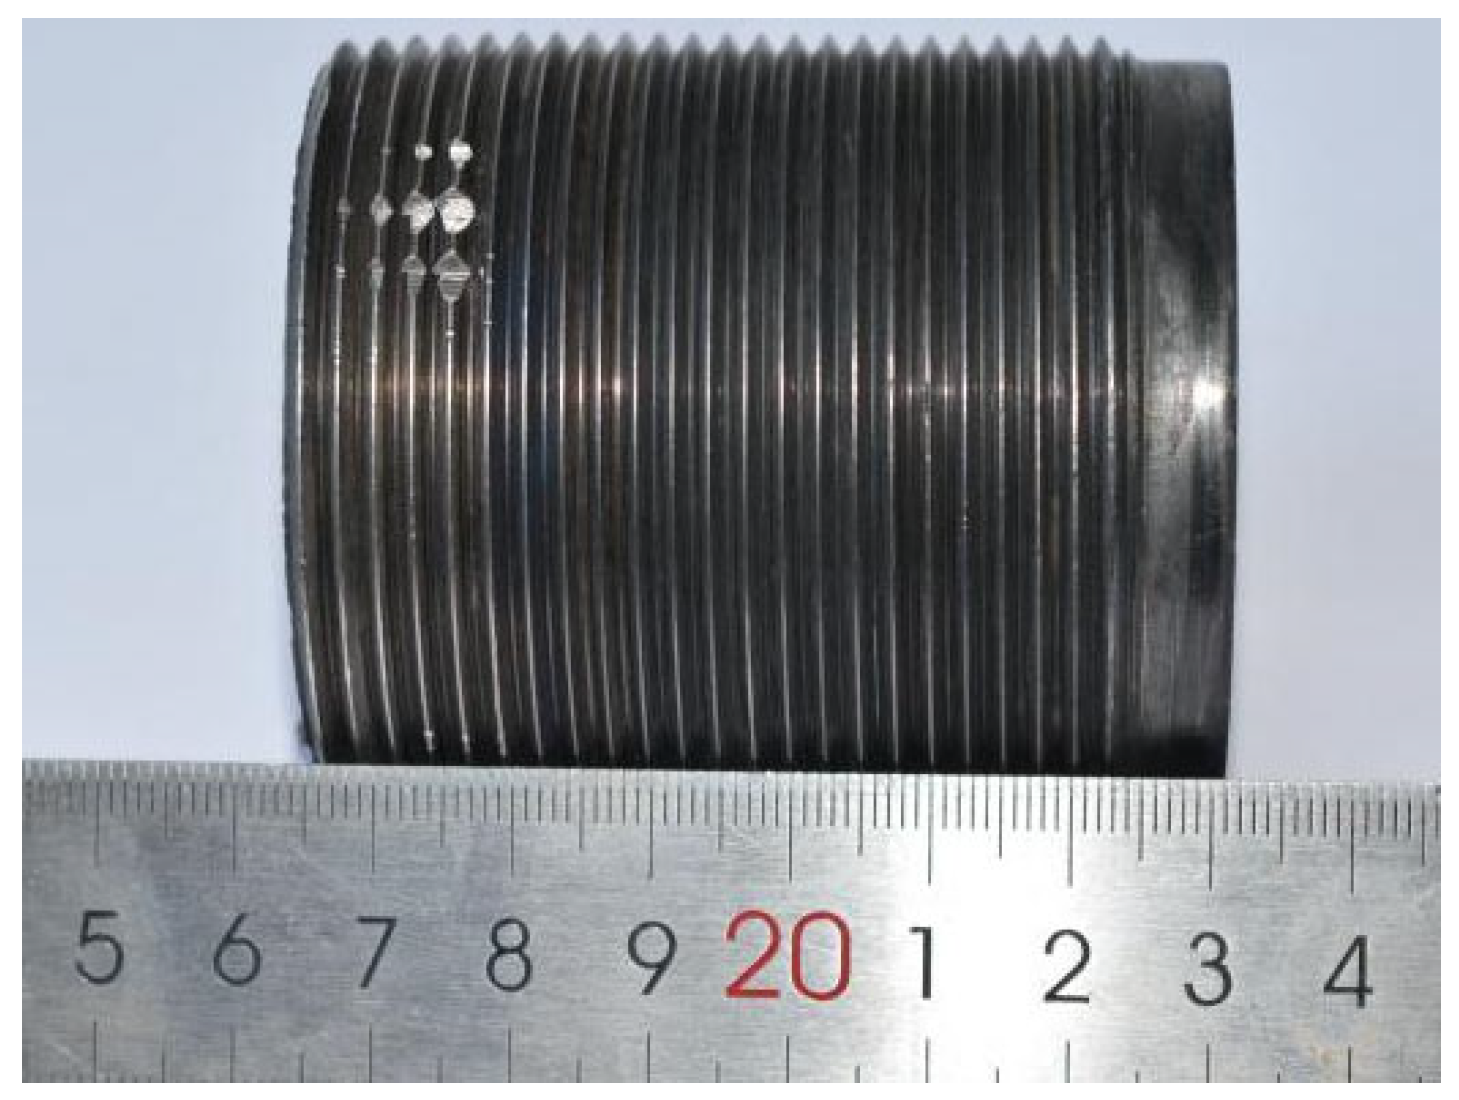
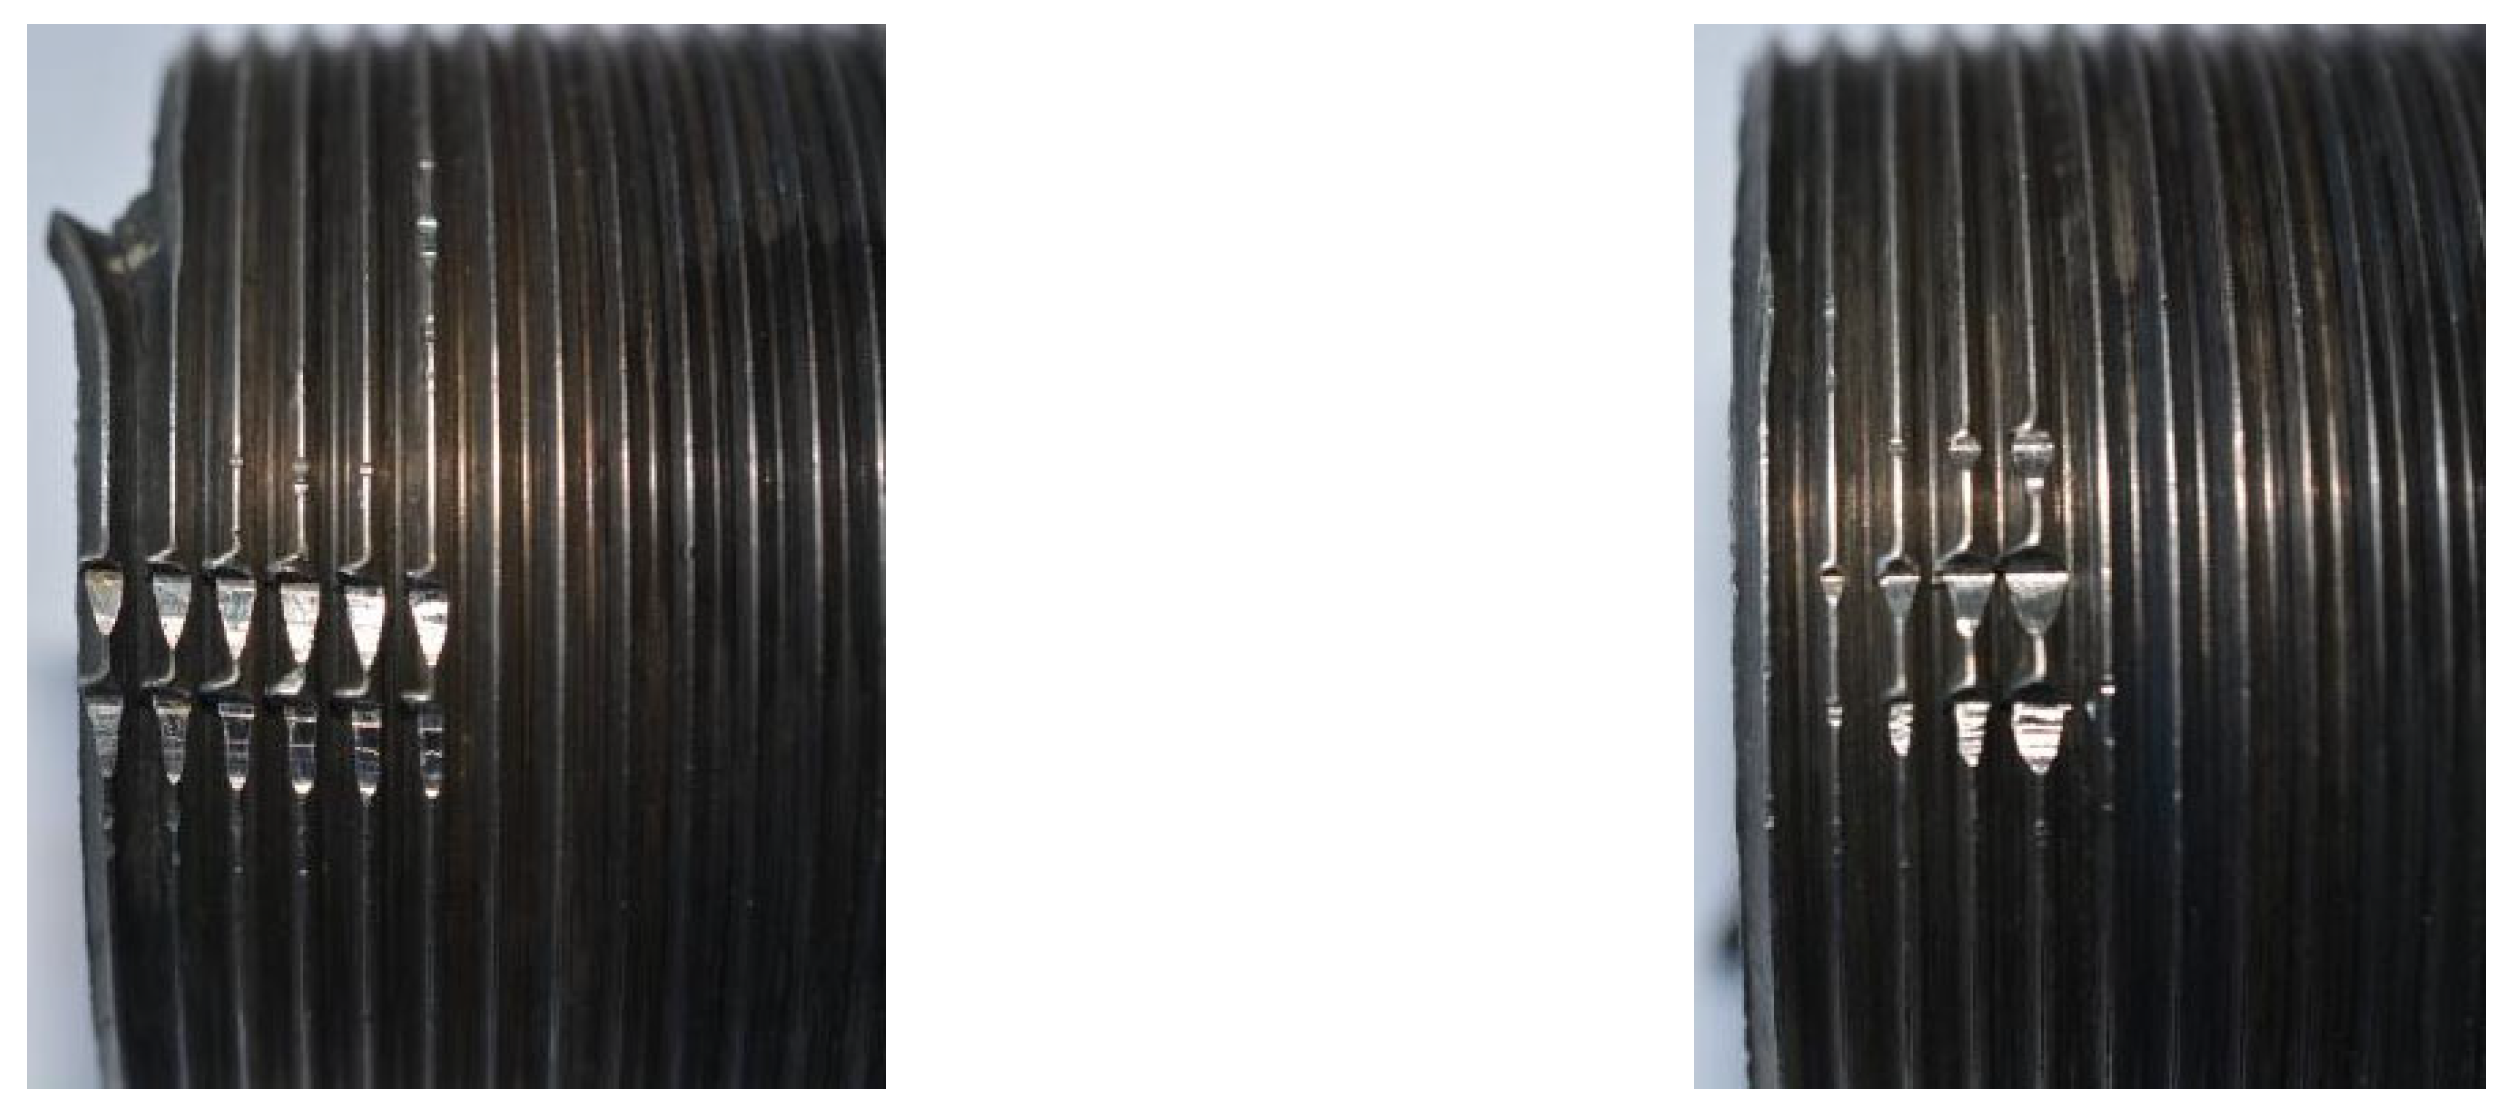
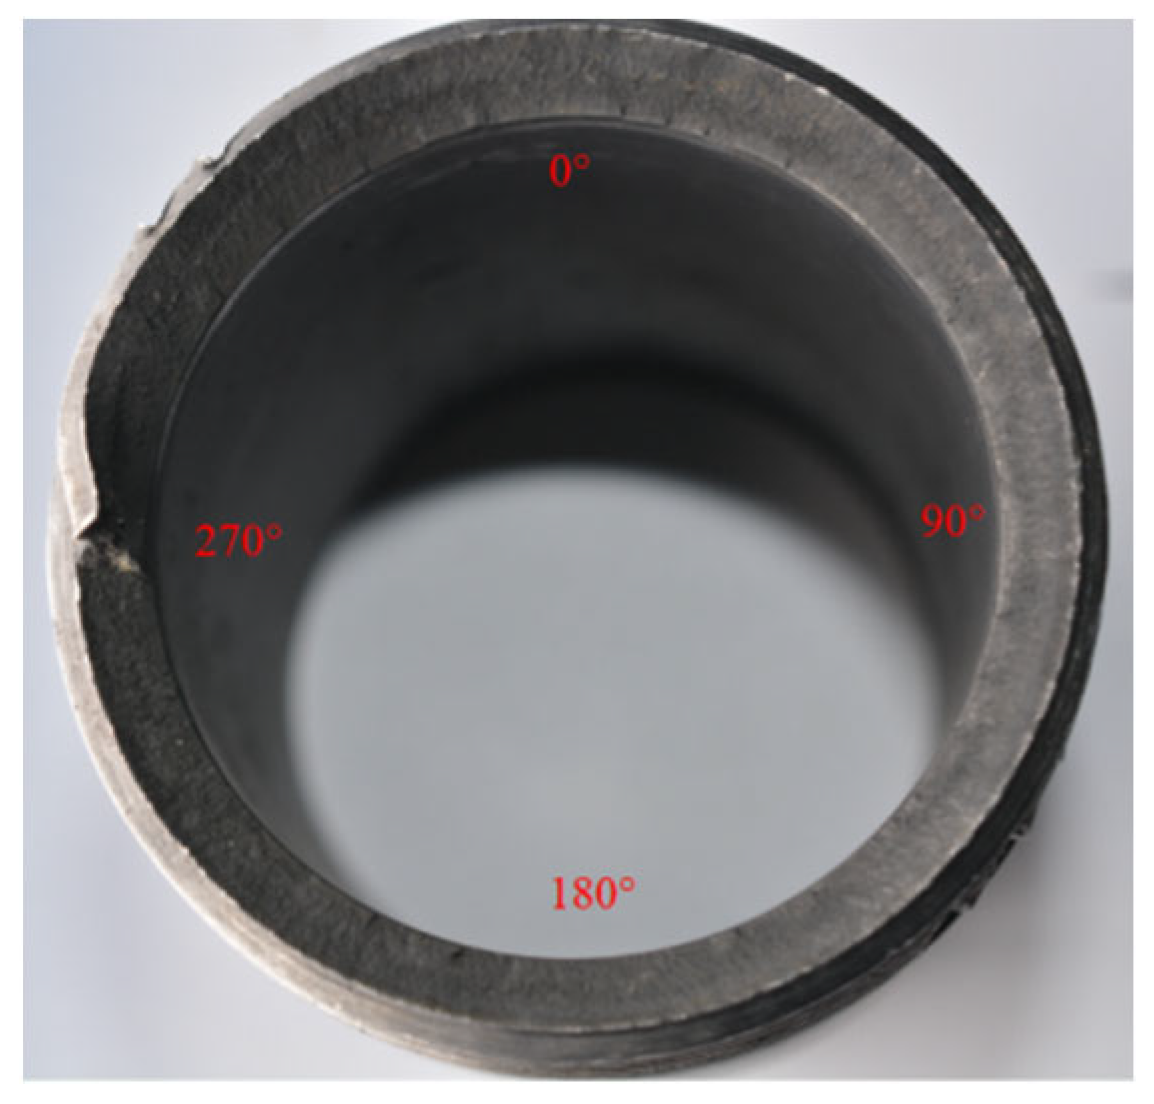
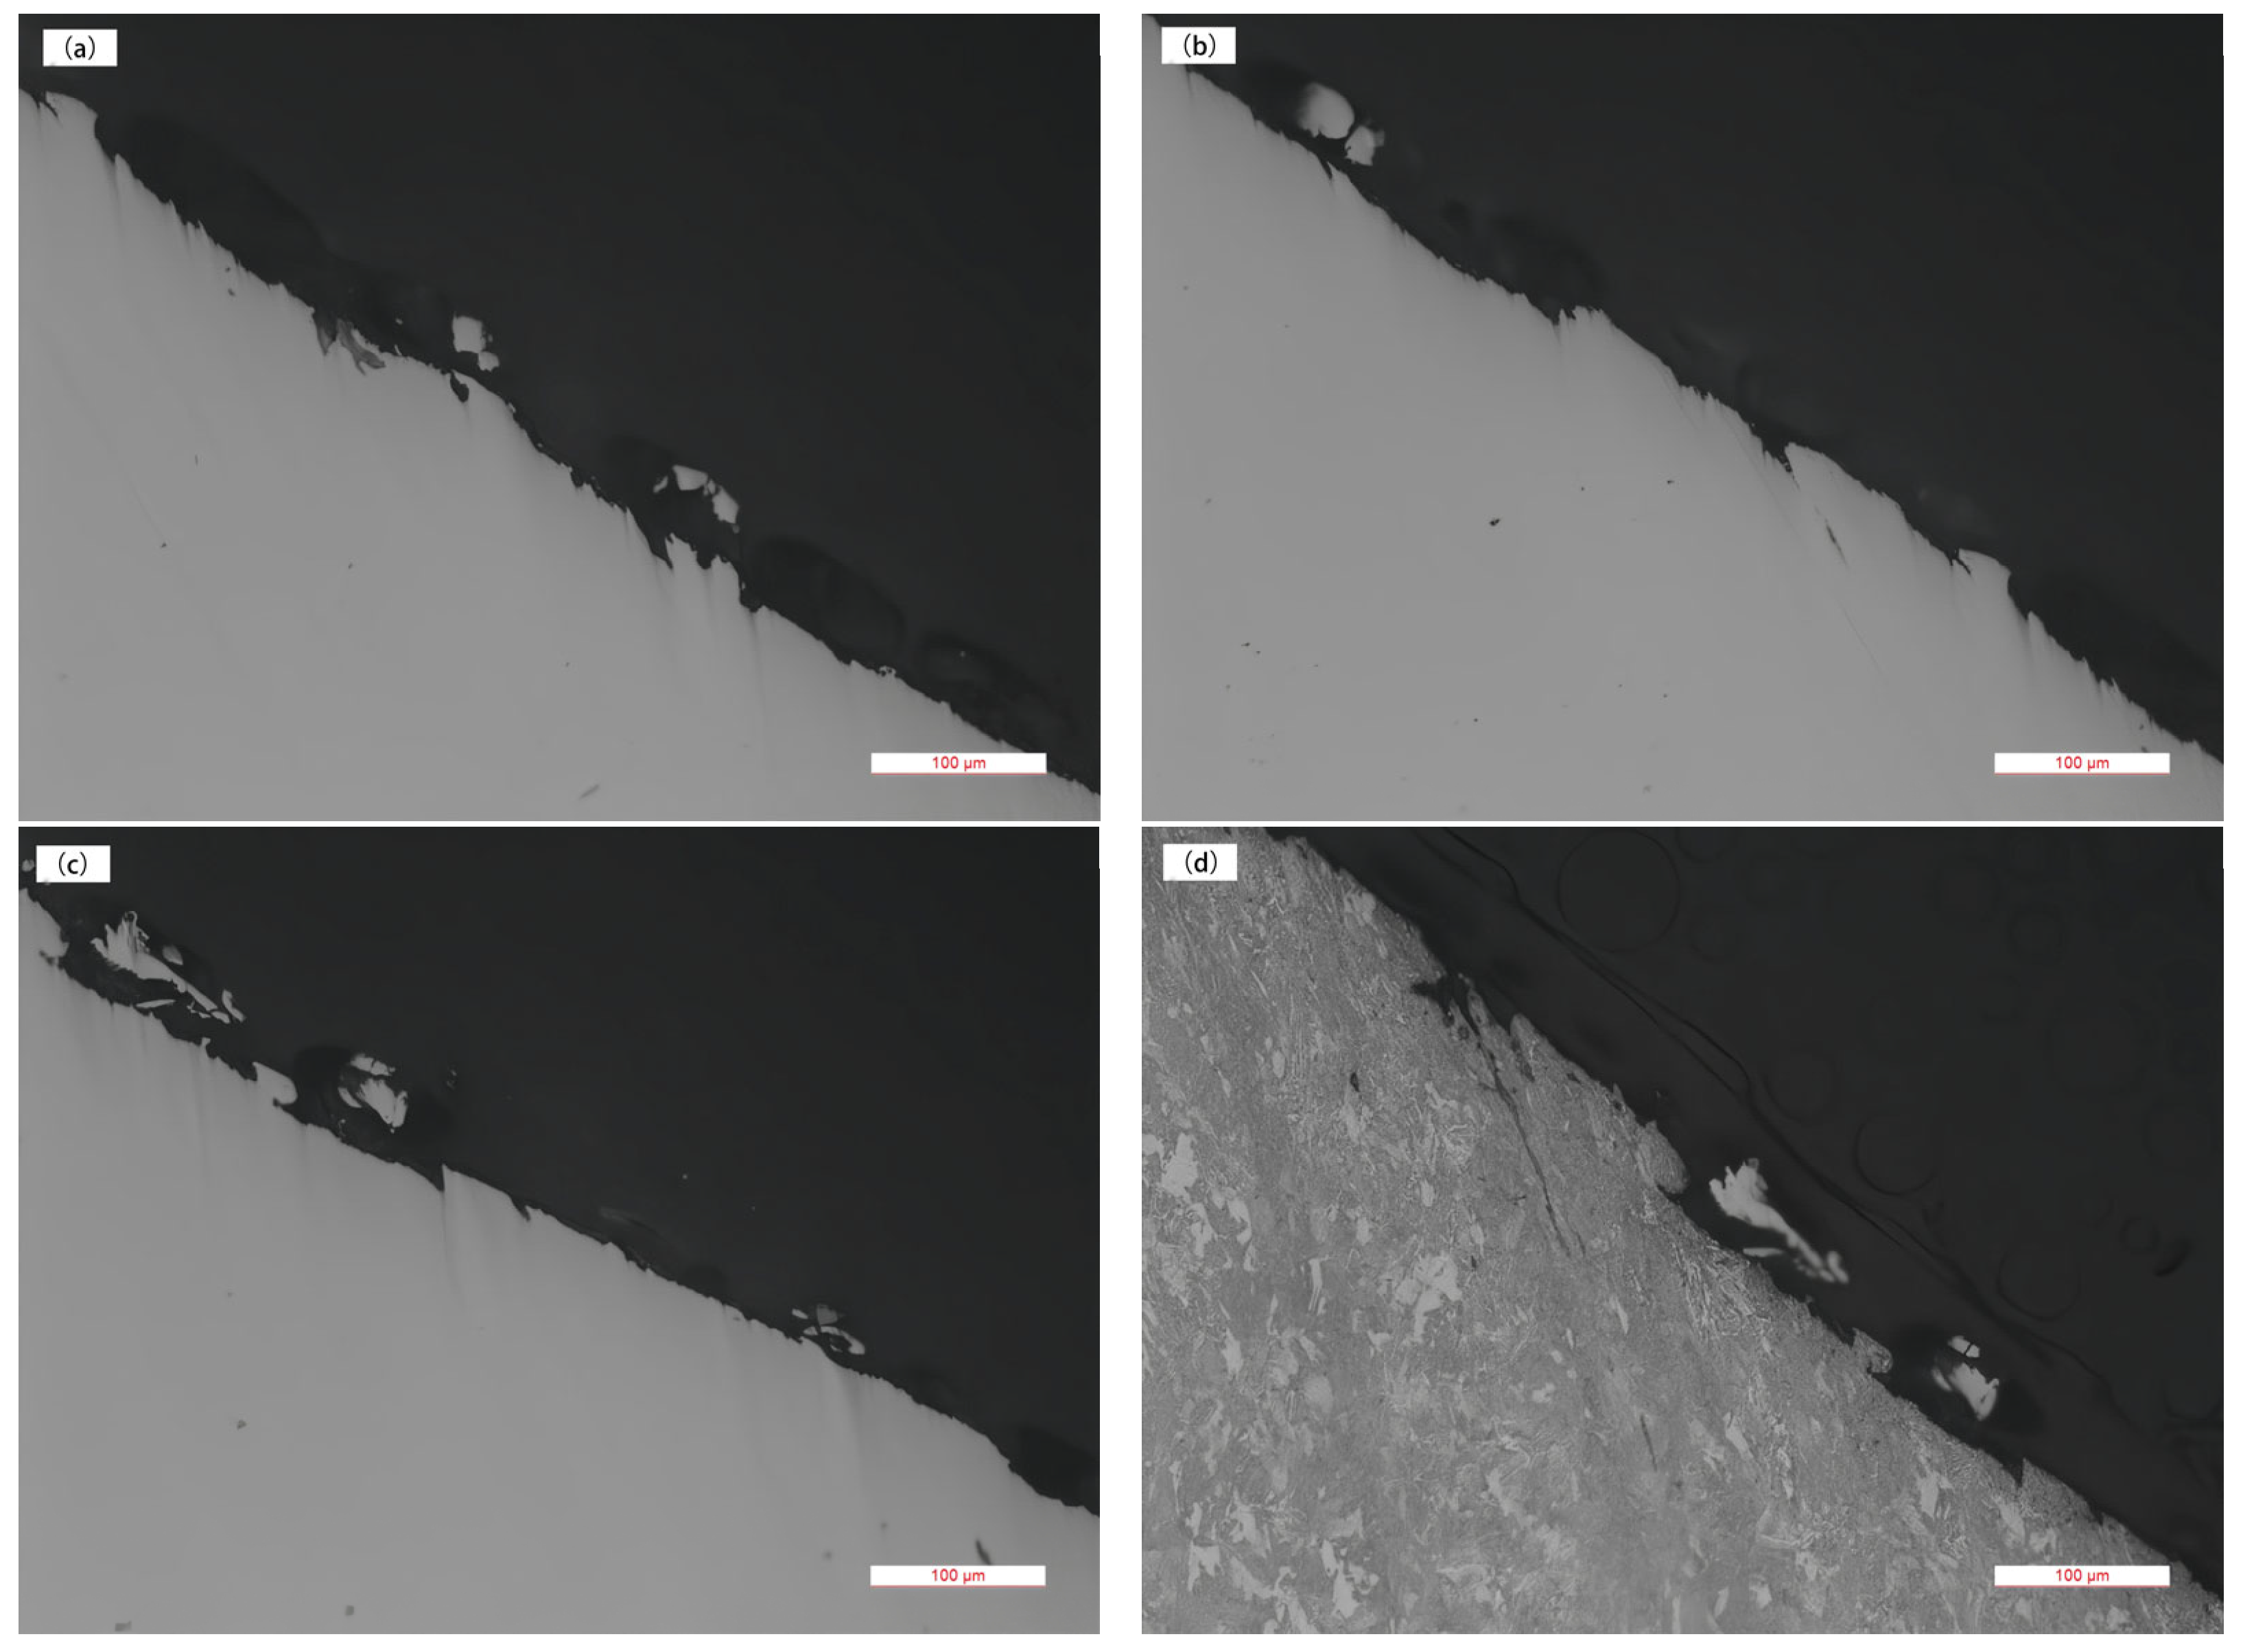
3.1. Macroscopic Analysis

The macroscopic appearance of the mandrel of the TW1 packer is shown in Figure 4, Figure 5 and Figure 6 below, with a total length of 67.22 mm. There are a pair of clamping jaw marks on the fracture side (clamping jaw mark 1 and jaw mark 2); its macroscopic appearance is shown in Figure 5. The macroscopic appearance of the fracture is shown in Figure 6. The fracture is basically an oblique fracture, with an angle of approximately 40° to the axis. The fracture surface is relatively smooth and appears light gray. At the 270° direction of the illustrated fracture, the base metal is raised. The measurements of the inner and outer diameters, pitch, tooth height, and clamping jaw marks of the packer mandrel are shown in Table 3.
From the above analysis, it can be seen that the fracture location is at the end of the 2 3/8” male thread of the mandrel, at the retreat groove, and the fracture is an oblique fracture, characterized by shear type fracture. It can be preliminarily determined that the mandrel fracture of the packer is an overload fracture.

3.2. Physicochemical Test Analysis
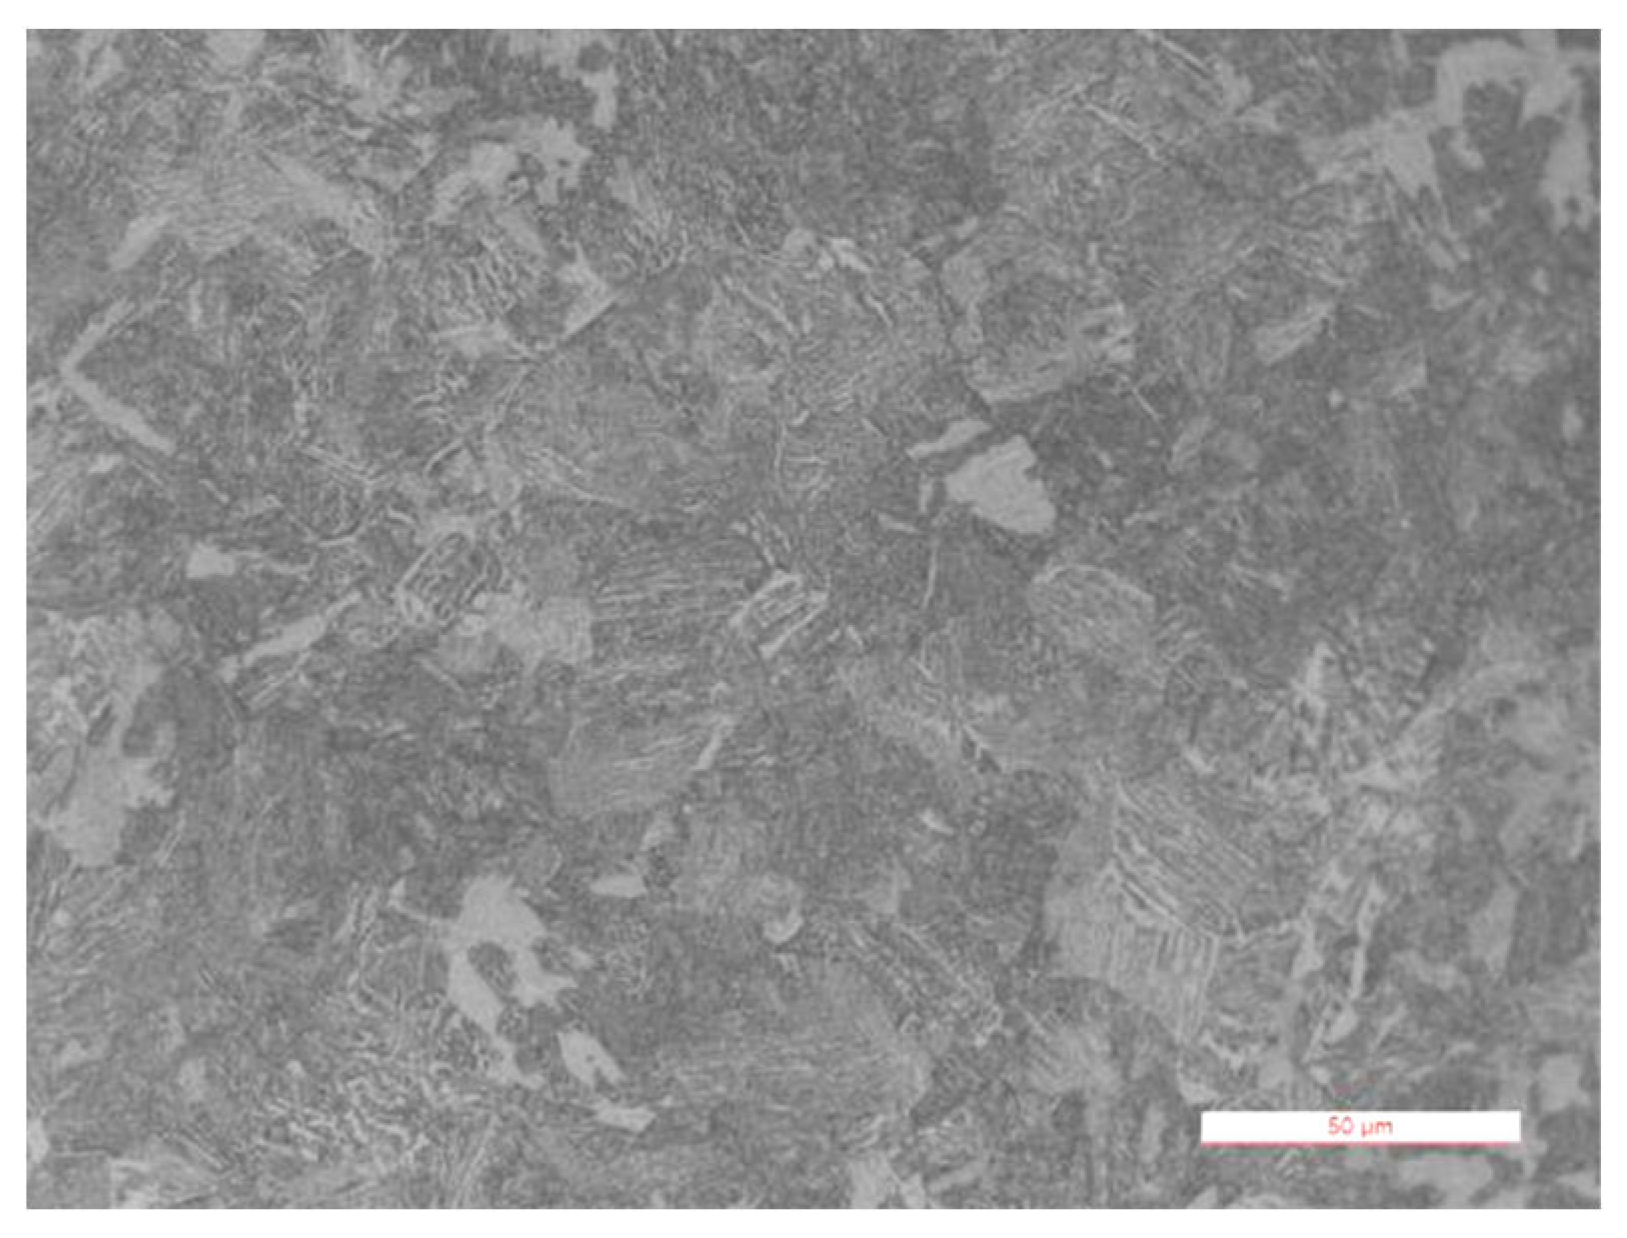
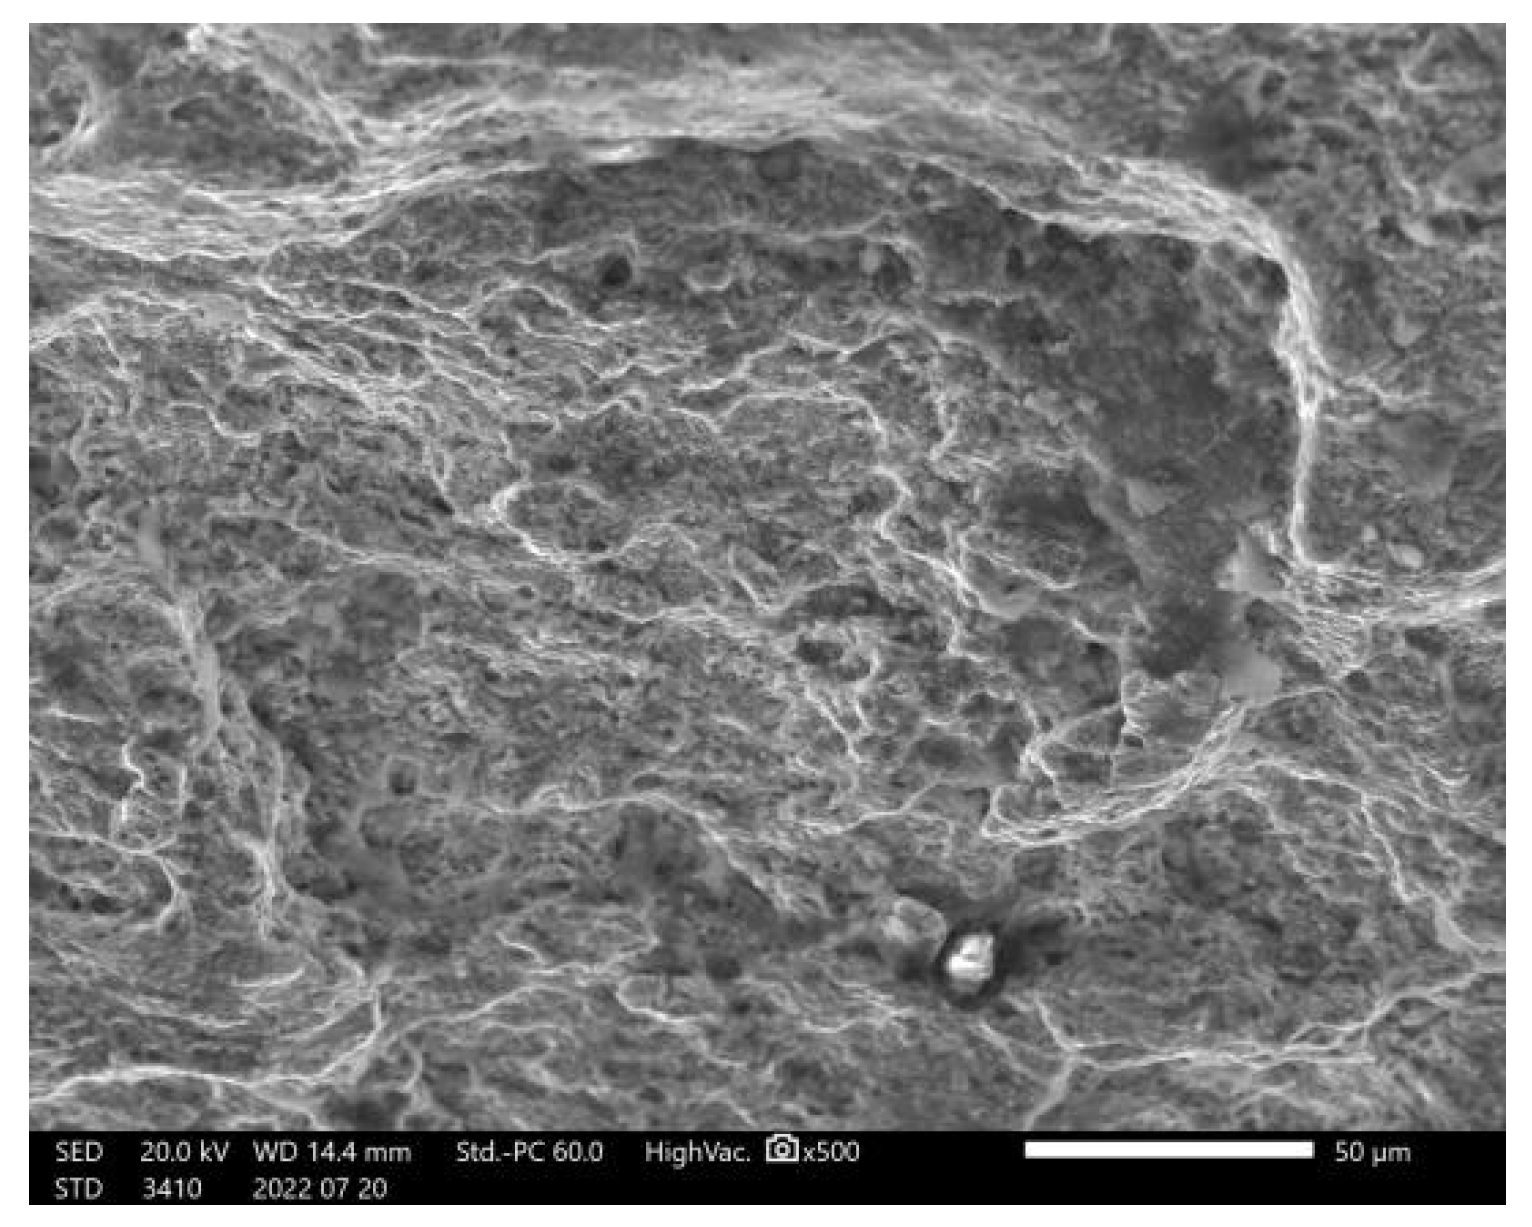
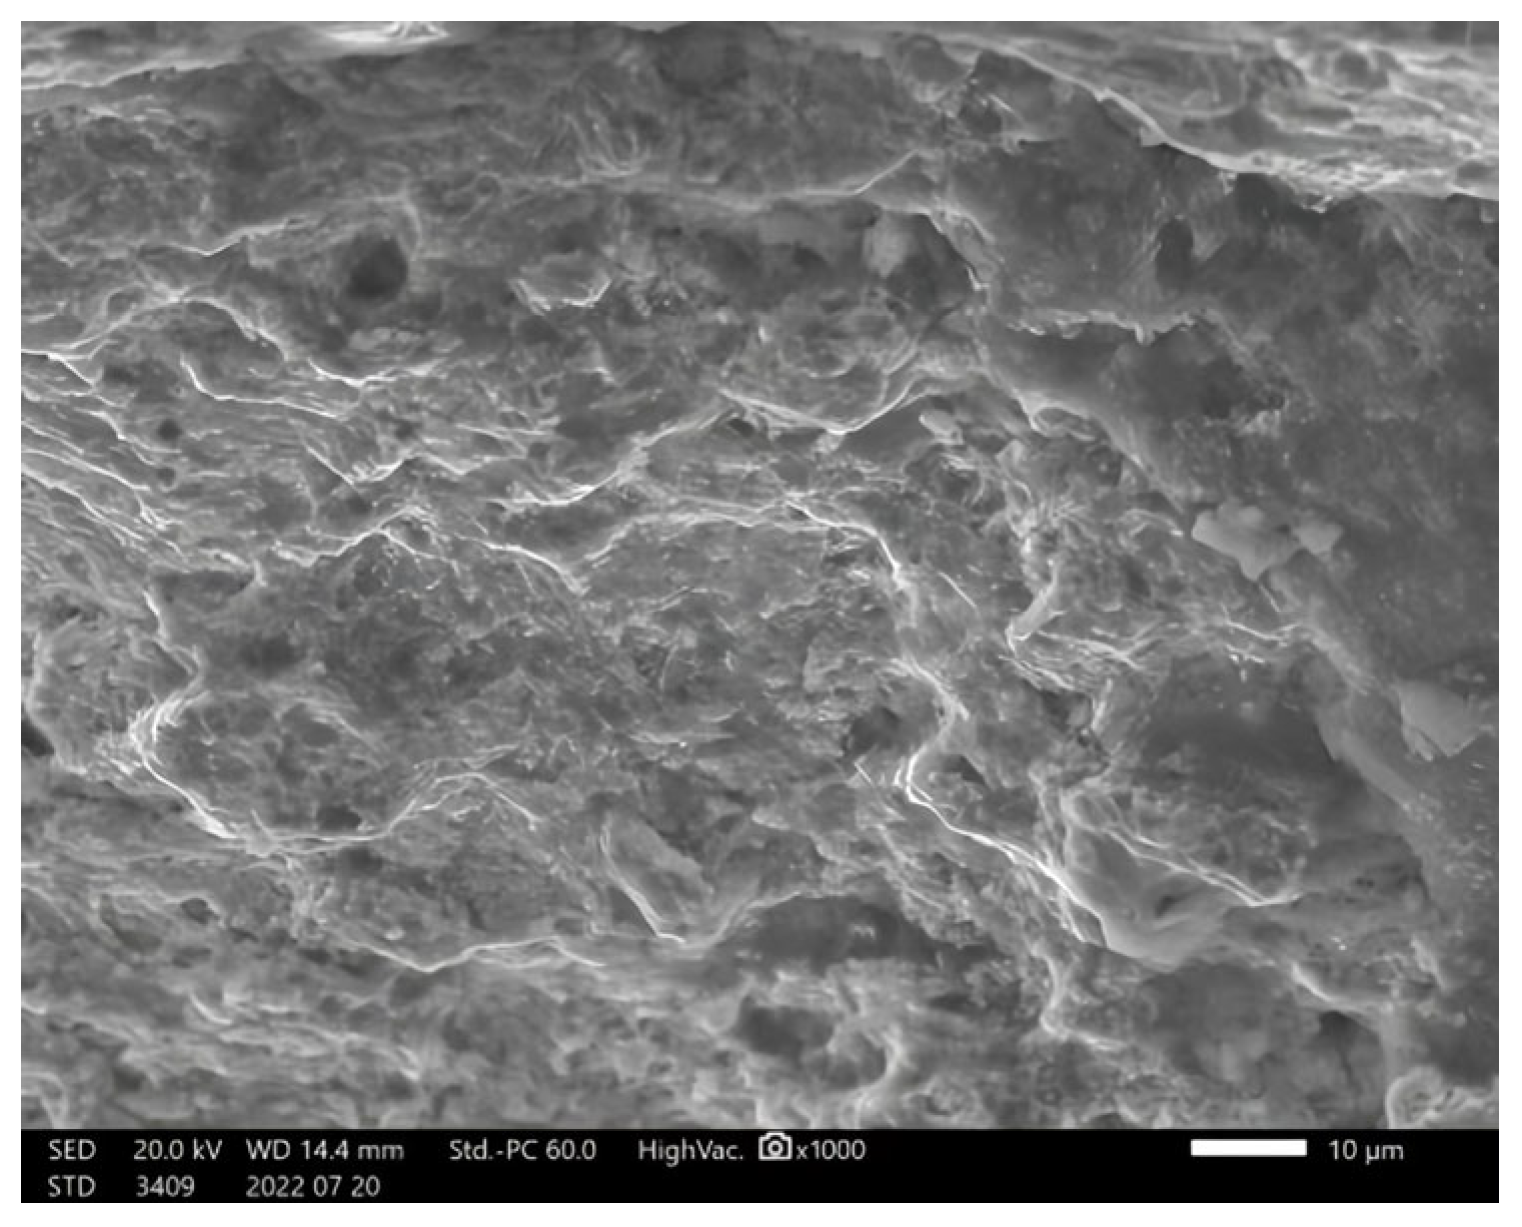
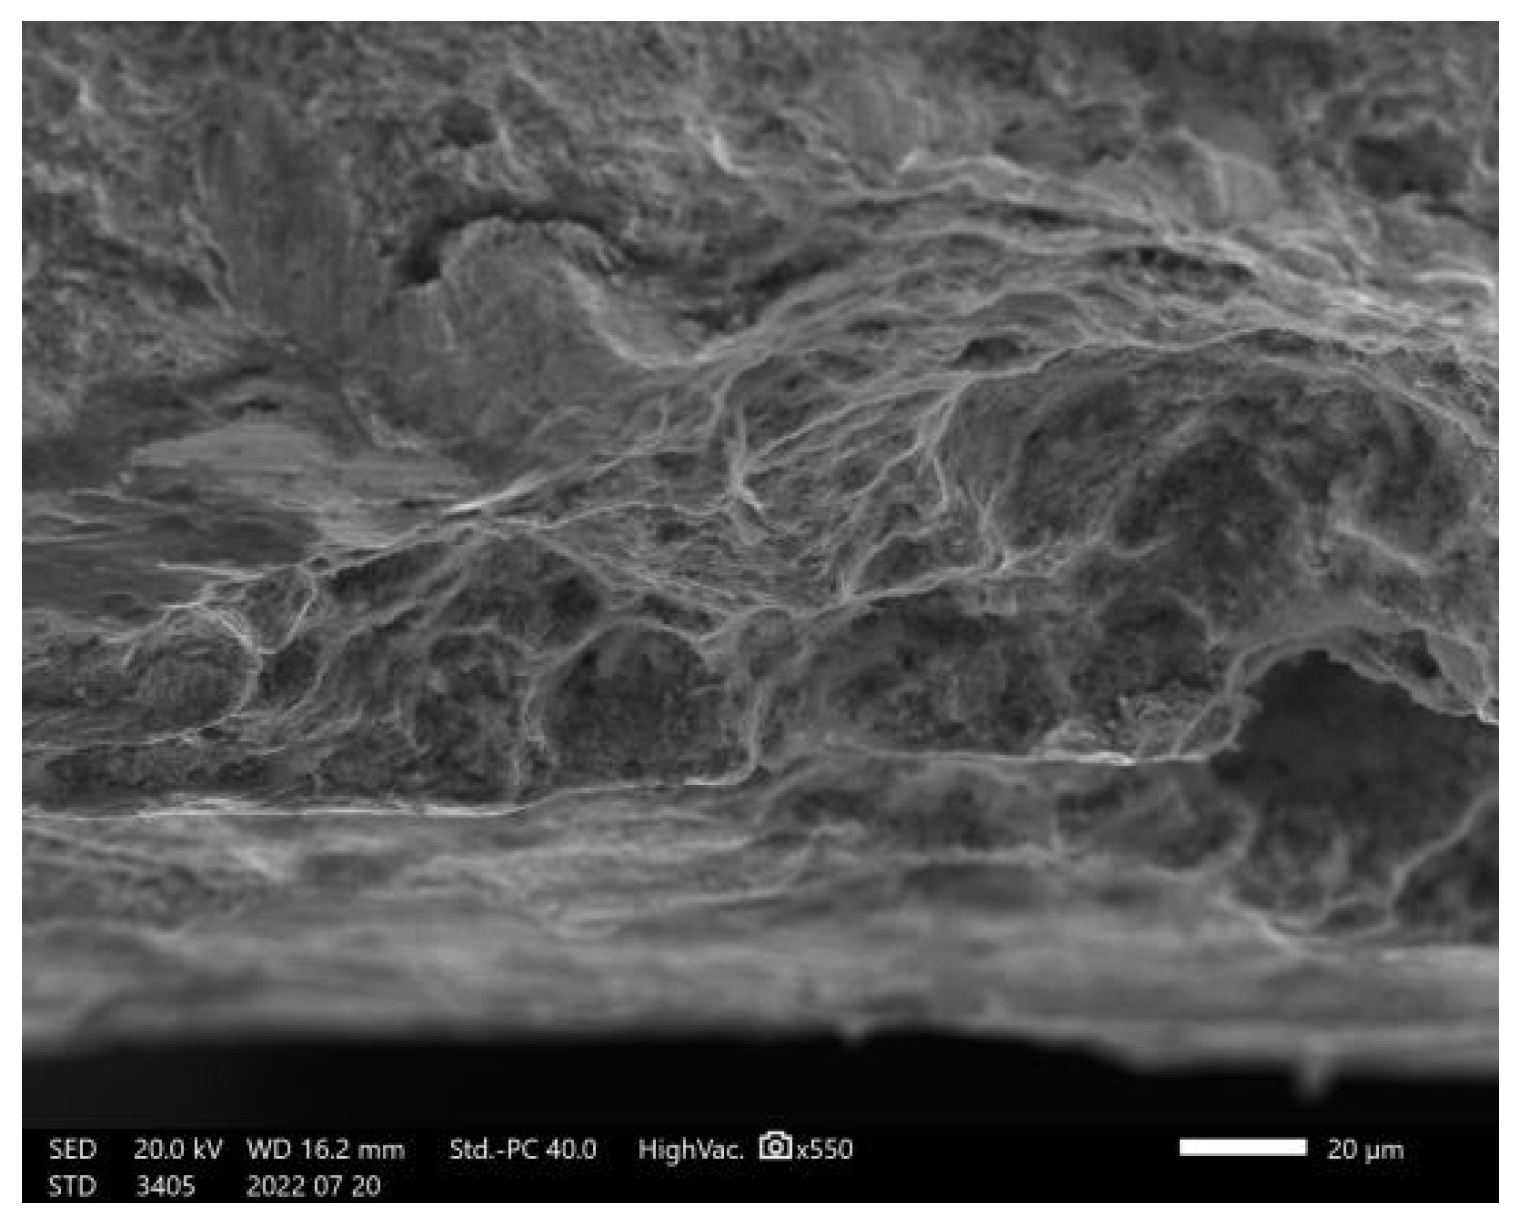
A sample of 40 × 30 mm was taken from the packer mandrel, and, according to the GB/T 4336-2016 standard for Carbon and low-alloy steel—determination of multi-element contents—spark discharge atomic emission spectrometric method [29], the content of elements C, Si, Mn, P, S, Ni, Cr, Mo, Cu composition analysis, and the results are shown in Table 4, which details the chemical composition of the supplied packer mandrel.
Metallographic samples were taken from the packer mandrel away from the fracture, according to GB/T 13298-2015 standard for inspection methods of microstructure for metals [30], GB/T 10561-2023 standard for determination of content of non-metallic inclusions in steel—micrographic method using standard diagrams [31], and GB/T 6394-2017 standard for determination of estimating the average grain size of metal for microstructure, non-metallic inclusion, and average grain size analysis [32]. Using the DMI3000M model metallurgical microscope, examine the microstructure of the packer core. The results are shown in Figure 7 and Table 5. It can be seen that the structure of the packer mandrel is tempered sorbite + bainite, with a higher bainite content in the structure.

3.3. Microanalysis

Gold metallographic samples were taken from the fracture site and examined under a DMI3000M metallographic microscope to assess the polished fracture morphology, as shown in Figure 8. The four images in Figure 8 represent the crack conditions at different circumferential positions of the fracture. Notably, two microcracks appear at the fracture, with gray substances present within the cracks. The corrosion morphology of the fracture is illustrated in Figure 9. The four images in Figure 9 depict the crack conditions at various circumferential locations around the fracture. Clearly, significant deformation lines are observable near the fracture, indicating that localized plastic deformation occurred during the fracture process.
The fracture surface shows severe corrosion damage. After removing the fracture, it was cleaned using the cellulose acetate film method and. A scanning electron microscope, model JSM-IT500LA, analyzed the outer, middle, and inner morphologies, illustrated in Figure 10, Figure 11 and Figure 12. It can be seen that the main morphology of the fracture is dimpled, further confirming that the mandrel of the packer is a tensile fracture.

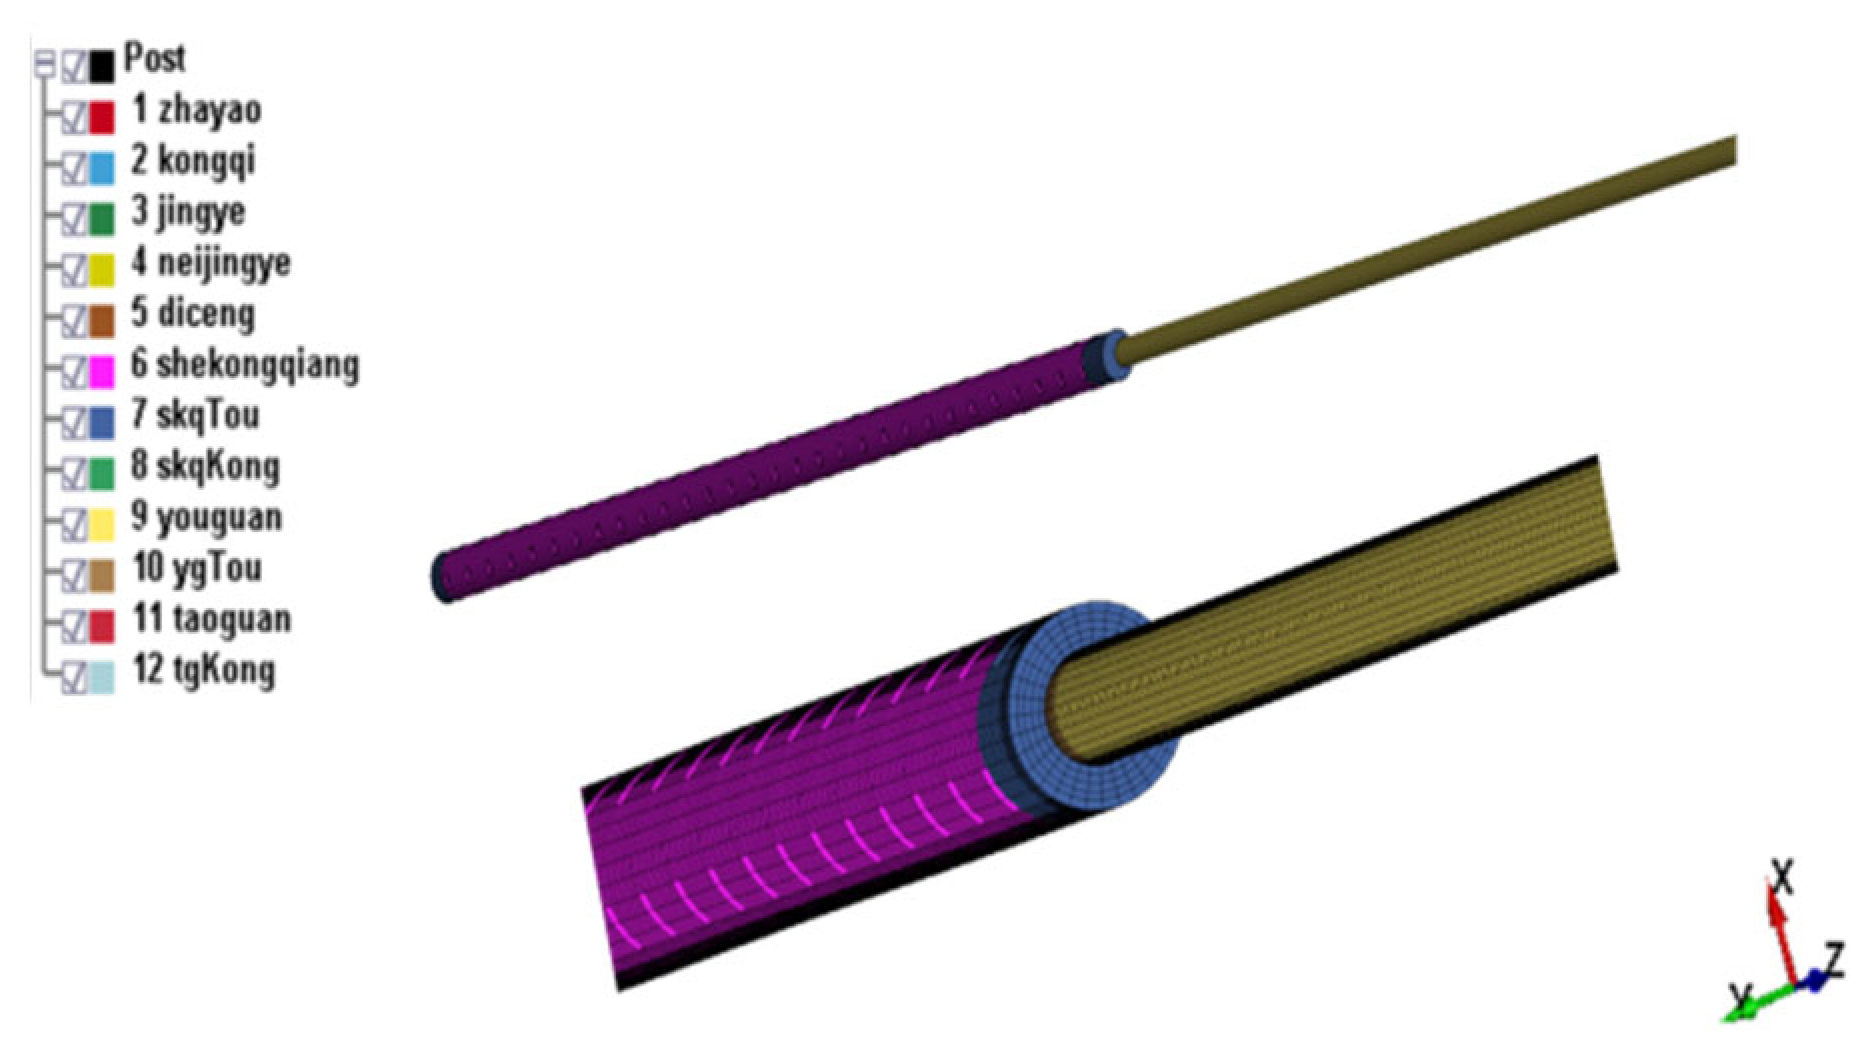
3.4. Establishment of a Perforated Detonation Model

Based on the aforementioned macro, physical, chemical, and micro-experimental detection and analysis results of the packer mandrel. Combined with perforation parameters, oil casing parameters, wellbore, and reservoir parameters. Using the finite element modeling method to simulate the perforation detonation process. The model fully considers the tensile strength of downhole tools, the outer diameter and length of the perforation gun, the weight and type of perforating charges, the perforation phase, the distance between the top of the perforation gun and the packer, the distance between the bottom of the tubing string and the artificial well bottom, the type and density of the wellbore working fluid, and formation flow pressure parameters (refer to Table 6).
However, due to the complex behavior of such an event, several factors were usually oversimplified, leading to the compromised accuracy of the methodology. Recommendations were also proposed for analyzing the perforation detonation’s behavior using modern and robust techniques such as computational string dynamics [33]. Simulated the detonation response of the tubing section from packer to perforating gun throughout the perforation process.
Establish a perforation detonation simulation analysis model (Figure 13) by ABAQUS software (ABAQUS 2024, Dassault Systems Simulation Corp., Johnston, RI, USA). Based on the wellbore structure, perforation string, and well trajectory data, create a composite model of the perforation string and the wellbore’s material and cross-sectional characteristics. Assemble the string and wellbore geometries, utilizing PIPE31 as the mesh element type. Use edge-to-edge technology to simulate the dynamic contact interaction between the string and wellbore. Define the internal and external pressure loads, as well as buoyancy, through ABAQUS’s user subroutine DLOAD. Differentiate load types using the variable JLTYP. When JLTYP is assigned to 27, we specify the internal pressure load for the string. For JLTYP==28, we define the external pressure load. When JLTYP is assigned to 43, we establish buoyancy load. Furthermore, we apply explosive shock loads based on fundamental parameters such as perforator specifications, perforation characteristics, and segment-specific wellbore parameters via the user subroutine DLOAD. The computational methodology for the pCJ model of explosive pressure is as follows:
p C J = ρ 0 D 2 γ + 1
In the equation: pCJ indicates explosive pressure, GPa; ρ 0 indicates density for explosives, g/cm3; D indicates the detonation velocity of explosives, mm/µs; and γ indicates multiple indices, with an approximate value retrieval γ = 1.6 + 0.8 ρ 0 .
The axial and lateral forces of the perforation are simplified to concentrated forces. The axial load is defined as follows:
F a = 1000 × K × p C J × π × R 2 / 4 + R 1 × w
Lateral force load is defined as follows:
F s = 1000 × K 1 × p C J × π × R 1 2 / 4
In the equation F a indicates perforation axial force, N; K indicates the correction factor; R indicates the internal diameter of the string, mm; R 1 indicates borehole diameter, mm; and w indicates thickness of the string, mm.

3.5. Interpretation and Discussion

To thoroughly comprehend the perforation detonation loads on tubing string in different orientations, designate the directions as X, Y, and Z. At the perforation moment, the tubing string will undergo varied stress variations in the X, Y, and Z axes. Due to the spatial constraints of the casing, radial displacement in the X and Y directions remains minimal. However, the absence of external restraints amplifies the perforation detonation load in the Z direction. This load manifests as tensile and compressive forces, potentially causing fatigue damage to the tubing string in the Z axis. Refer to the perforation moment as the zero reference point. This study evaluates intervals of 500 µs, 1000 µs, 1500 µs, and 2500 µs post-perforation. These four detonation points are the primary focus of analysis. By evaluating the effective stress distribution along the tubing string, spanning from the packer to the perforating gun, derive the subsequent results:
(1) During perforation detonation, shock pressure and shock wave jets release into the formation, causing axial and lateral impact forces. These impact forces induce stress wave responses in the tubing string.
(2) Post-detonation of the perforating gun, the bottom of the tubing responds first, showing an equivalent stress concentration. The detonation wave propagates from the bottom to the top of the tubing. At the packer, the shock wave reflects, again showing an equivalent stress concentration. The effective stress distribution at the four selected moments appears in Figure 14.
(3) Calculate the axial force on the tubing from the packer to the perforating gun during detonation (Figure 15). At the moment of perforation, the maximum axial force on the packer mandrel is about 1317 kN, directed downward, far exceeding the rated tensile strength of the packer mandrel of 620 kN, causing the tubing to break due to perforation detonation.
Figure 14. Schematic representation of effective stress distribution within tubing at different moments during perforation detonation, respectively, 500 µs, 1000 µs, 1500 µs, and 25,000 µs.
Processes 12 01971 g014aProcesses 12 01971 g014b

4. Conclusions

This study examines the TW1 perforation failure case. It combines physical-chemical experiments and simulation techniques. The research explores the dynamic response characteristics and failure mechanisms of the perforating string at depths beyond 8000 m. The conclusions drawn from the analysis are:
(a) The physicochemical and microscopic inspections revealed key findings about the TW1 packer mandrel. The mandrel undergoes tensile overload when subjected to perforation detonation stretching load. This load surpasses the mandrel’s tensile yield strength, leading to its failure and fracture. These results illuminate the propagation dynamics of the perforation detonation wave, enabling both qualitative analysis and quantitative calculation.
(b) This article reveals the failure mechanisms of perforating detonation. Specifically, perforation shock loads oscillate between the bottom (perforating gun) and top (packer) of a perforating test string with a packer. This affects the effective stress load on the string until the shock loads dissipate. During this process, the tubing and downhole tools primarily experience axial tension or pressure, causing deformation. If the tension or pressure at any point in the string exceeds its rated tensile strength, the string breaks, leading to perforating detonation failure. Notably, the packer mandrel’s thickness can’t be endlessly increased due to spatial constraints. In this case, even with an increased thickness, the packer mandrel remains the system’s weakest point, susceptible to fatigue damage.
(c) The finite element simulation method restored the complete process of perforation detonation. It calculated the effective stress experienced at different positions in the tubing string at various times. This analysis revealed the failure mechanism behind the perforation detonation in the TW1. To efficiently evaluate the dynamic response of impact loads during perforation and assess the pre-detonation effects, a combined methodology was established involving both laboratory testing and simulation. If simulation results indicate a risk of string failure, related process parameters must be optimized before operation to prevent complex downhole incidents. Thus, establishing this method is of significant importance. The study provides methods for evaluating the detonation effects before perforating with the perforation testing combined string for an ultra-deep well and analyzing the detonation failure reasons after perforation.
The finite element simulation replicated the perforation detonation process. It computed the stress at various tubing string positions over time. This analysis identified the TW1 perforation failure mechanism. To effectively evaluate dynamic impact loads and pre-detonation effects, a method combining lab testing and simulation was developed. If simulations show a risk of string failure, adjust process parameters before operations to avoid complex downhole issues. This method is crucial for assessing detonation effects and understanding failure mechanisms in ultra-deep well perforation.

Author Contributions

Writing—review and editing, C.C. and K.N.; conceptualization, X.L.; formal analysis, D.R.; validation, X.C.; methodology, X.Y. and Z.L. All authors have read and agreed to the published version of the manuscript.

Funding

This study was supported by the Key Program of the China National Petroleum Corporation: Study on Key Technologies for Oil Testing, Modification, and Extraction in Ultra-Deep Clastic Rock Reservoirs, no. 2023ZZ14YJ07.

Data Availability Statement

Data are contained within the article.

Conflicts of Interest

Author Xueru Chen was employed by Oil Test Company, CNPC Xibu Drilling Engineering Co., Ltd. The remaining authors declare that the research was conducted in the absence of any commercial or financial relationships that could be construed as a potential conflict of interest.

Abbreviations

mmmillimeter
cmcentimeter
mmeter
PaPascal
MPamillion Pascal
GPagiga Pascal
ggram
kgkilogram
μsmicrosecond
ssecond
kJkilo-Joule
NNewton
kNkilo-Newton
PBTDplug back total depth
CNPCChina National Petroleum Corporation
RDrupture disk
RDSrupture disk safety

References

  1. Dvoynikov, M.V.; Sidorkin, D.I.; Yurtaev, S.L.; Grokhotov, E.I.; Ulyanov, D.S. Drilling of deep and ultra-deep wells for prospecting and exploration of new raw mineral fields. J. Min. Inst. 2022, 258, 945–955. [Google Scholar] [CrossRef]
  2. Chen, C.; Liu, X.; Li, X.; Xiang, Z.; Ding, Y. High-temperature and high-pressure ultra-deep well oil testing technology for Hutan 1 well in Junggar Basin. Oil Drill. Prod. Technol. 2023, 45, 447–454. [Google Scholar] [CrossRef]
  3. Wu, J.I.; Binchang, L.U.; Jun, W.E.; Zhenmao, T.I.; Chaofeng, C.H.; Hongxue, M.I.; Zhanshan, N.I. Practice of Well Testing Technology for Ultra-high Pressure Well LT1 in Junggar Basin. Drill. Prod. Technol. 2022, 45, 160. [Google Scholar]
  4. Chen, C.; Jiang, W.; Mi, H.; Lu, B.; Zhou, C.; Tang, Q. Application of high temperature and high pressure deep well testing technology in Well Gaotan 1 in Junggar Basin. Drill. Prod. Technol. 2020, 43, 119–122. [Google Scholar]
  5. Hu, G.; Hu, G.; Wang, F.; Zhang, J.; Chen, C.; Zhang, Z. Analysis and re-understanding of the completed oil test in the Sangonghe Formation of Well MD04 in Junggar Basin. Oil Drill. Prod. Technol. 2010, 32, 159–161. [Google Scholar]
  6. Wang, W.; Chen, C.; Xu, J.; Peng, S. Oil testing technology of abnormally high pressure complex exploratory wells: A case study of Well Huo 10 in the southern margin of Junggar Basin. Xinjiang Pet. Geol. 2004, 25, 653. [Google Scholar]
  7. Rahman, M.R.A.; Busahmin, B.; Hasan, U.H.H. Analysis of a drilling mud-based system on the common problems related to coiled tubing application in slim-hole oil wells. Edelweiss Appl. Sci. Technol. 2023, 7, 71–86. [Google Scholar] [CrossRef]
  8. Saifulizan, S.S.B.H.; Busahmin, B.; Prasad, D.M.R.; Elmabrouk, S. Evaluation of different well control methods concentrating on the application of conventional drilling technique. ARPN J. Eng. Appl. Sci. 2023, 18, 1851–1857. [Google Scholar]
  9. Jun, D.; Kwon, D.; Lee, B.J. Numerical study on the reinitiation mechanism of detonation propagating through double slits in a planar channel. Combust. Flame 2024, 261, 113271. [Google Scholar] [CrossRef]
  10. Yang, X.T.; Zhang, F.X.; Li, M.F.; Dou, Y.H. Analysis of Strength Safety of Perforated String Considering Detonation Parameters. In Advanced Materials Research; Trans Tech Publications, Ltd.: Wollerau, Switzerland, 2013. [Google Scholar] [CrossRef]
  11. Guo, R. Study on tubing string safety during perforation detonation in ultra-deep wells. Geosystem Eng. 2024, 27, 160–170. [Google Scholar] [CrossRef]
  12. Ding, L.; Lei, Q.; Chen, W.; Xue, Y.; Zhang, Q. Study on transient energy conversion and influencing factors of perforating detonation. China Saf. Sci. J. 2023, 33, 76–85. [Google Scholar] [CrossRef]
  13. Bale, D.S.; Satti, R.P.; Ji, M.; Howard, J.J. A Next-Generation Shock-Capturing, Multi-Phase Flow Simulator for Perforating Applications in HPHT Environment. In Proceedings of the SPE Deepwater Drilling and Completions Conference, Galveston, TX, USA, 14 September 2016. [Google Scholar] [CrossRef]
  14. Qiao, D.; Hui, Z.; Jun, L.; Hao, W.; Xuejun, H. Safety Distances of Packers for Deep-Water Tubing-Conveyed Perforating. In Proceedings of the Offshore Technology Conference, Houston, TX, USA, 30 April–3 May 2018. [Google Scholar]
  15. Zifeng, L. Applicability of unified strength theory in tubular mechanics and safety stress field of the material with SD effect. Acta Pet. Sin. 2016, 37, 1537–1542. [Google Scholar]
  16. Yihua, D.; Mingfei, L.; Fuxiang, Z.; Xiangtong, Y. An analysis of the effect of the well bore structure on the strength safety of the tubing string at the perforation section. China Pet. Mach. 2012, 40, 27–29. [Google Scholar]
  17. Bale, D.S.; Satti, R.P. A fast computational model for wellbore pressure transients while perforating with dynamic underbalance. J. Pet. Sci. Eng. 2020, 185, 106495. [Google Scholar] [CrossRef]
  18. Jiang, J.; Deng, Q.; Yang, D.; Qi, G.; Zhang, F.; Tan, L. Numerical Simulation Study on the Damage Mechanism of the Combined Perforating Well Testing Tubing in Ultra-Deep Wells. Processes 2024, 12, 380. [Google Scholar] [CrossRef]
  19. Mingfei, L.; Fei, X.; Yihua, D. Measurement of perforating column vibration parameters and ALE-based numerical simulation. Chin. J. Appl. Mech. 2019, 36, 458–465+515. [Google Scholar]
  20. Mark, B.; Andrea, B.; Carlos, B. Perforating Gunshock Loads: Simulation Capabilities and Applications. In Proceedings of the International Petroleum Technology Conference, Kuala Lumpur, Malaysia, 10–12 December 2014. [Google Scholar]
  21. Canal, C.; Priscilla, M.; Scott, M.; Jovineto, M.; Darren, B. Predicting Pressure Behavior and Dynamic Shock Loads on Completion Hardware during Perforating. In Proceedings of the 2010 Offshore Technology Conference, Houston, TX, USA, 3–6 May 2010. [Google Scholar]
  22. John, M.B.; George, Y. A study of explosive effects in close proximity to a submerged cylinder. Int. J. Impact Eng. 2008, 35, 206–225. [Google Scholar]
  23. Yvonne, C.; Harwinder, S.; Mohd, S.I.; Ronny, V.T.; Amir, F.M.N. Optimizing perforating strategy with side mounted gun system for auto gas lift application with smart completions, offshore Malaysia. In Proceedings of the Abu Dhabi International Petroleum Exhibition & Conference, Abu Dhabi, United Arab Emirates, 9 November 2020; p. SPE-202695–MS. [Google Scholar] [CrossRef]
  24. Khan, A.M.; Binziad, A.; Alsubaii, A.; Ahmed, D.; Alotaibi, A. Perforating for Stimulation: Techniques, Challenges, Considerations, and Efficient Workflows. In Proceedings of the Middle East Oil, Gas and Geosciences Show, Manama, Bahrain, 7 February 2023. [Google Scholar] [CrossRef]
  25. Li, B.; Tang, K.; Lu, Y.; Luo, M.; Chen, H.; Huang, R. Research and effect evaluation of bidirectional shock absorber based on measured frequency of downhole perforated detonation wave. Well Logging Technol. 2023, 47, 636–641. [Google Scholar] [CrossRef]
  26. Huang, J.; Huang, C.; Liu, C.; Xian, W. Prediction and analysis method and safety guarantee measures of perforation-detonation effect of perforation-test combined operation technology in ultra-deep wells. In Natural Gas Committee of China Petroleum Society, Proceedings of the 33rd National Natural Gas Academic Annual Conference (2023) (04 Drilling and Production Engineering), Nanning, China, 1 June 2023; Chuanqing Drilling Engineering Co., Ltd.: Chengdu, China, 2023; Volume 8, p. 8. [Google Scholar] [CrossRef]
  27. Liu, H.; Liu, X.; Liu, Y.; Li, J.; Xi, Y.; Lian, W. Nonlinear Propagation and Influencing Factors of Perforation Detonation Waves in Ultra-Deep Wells. Xinjiang Pet. Nat. Gas 2024, 20, 31–37. [Google Scholar]
  28. Yuan, F.; Zhang, J.; Chen, Z.; Tang, Y.; Guo, R.; Lu, H. Study on the Rule of Annular Pressure Pulsation in Wellbore Caused by Three-in-One Perforation Detonation. Nat. Gas Oil 2024, 42. [Google Scholar]
  29. GB/T 4336-2016; Carbon and Low-Alloy Steel-Determination of Multi-Element Contents—Spark Discharge Atomic Emission Spectrometric Method (Routine Method). Standardization Administration of the People’s Republic of China: Beijing, China, 2016.
  30. GB/T 13298-2015; Inspection Methods of Microstructure for Metals. Standardization Administration of the People’s Republic of China: Beijing, China, 2015.
  31. GB/T 10561-2023; Determination of Content of Nonmetallic Inclusions in Steel—Micrographic Method Using Standard Diagrams. Standardization Administration of the People’s Republic of China: Beijing, China, 2023.
  32. GB/T 6394-2017; Determination of Estimating the Average Grain Size of Metal. Standardization Administration of the People’s Republic of China: Beijing, China, 2017.
  33. Zachopoulos, F.N.; Kokkinos, N.C. Detection methodologies on oil and gas kick: A systematic review. Int. J. Oil Gas Coal Technol. 2023, 33, 1–19. [Google Scholar] [CrossRef]
Figure 1. The flowchart of the methodology.
Processes 12 01971 g001
Figure 2. Schematic diagram of perforation and testing combined string.
Processes 12 01971 g002
Figure 3. Schematic diagram of negative pressure leak monitoring string.
Processes 12 01971 g003
Figure 4. Macroscopic appearance of the packer mandrel sent.
Processes 12 01971 g004
Figure 5. Macroscopic morphology of plier tooth marks at different position, respectively, mark 1 and mark 2.
Processes 12 01971 g005
Figure 6. Macroscopic morphology at the fracture site.
Processes 12 01971 g006
Figure 7. Microstructure of the packer mandrel.
Processes 12 01971 g007
Figure 8. Morphology of the different position (from (ad)) fracture surface (polished state).
Processes 12 01971 g008
Figure 9. Morphology of the different position (from (ad)) fracture surface (corroded state).
Processes 12 01971 g009
Figure 10. Morphology near the outer wall fracture of the mandrel.
Processes 12 01971 g010
Figure 11. Morphology of the middle part of the mandrel fracture.
Processes 12 01971 g011
Figure 12. Internal morphology of mandrel fracture.
Processes 12 01971 g012
Figure 13. Establishing a simulation model.
Processes 12 01971 g013
Figure 15. Simulation results reveal the effective tensile force acting on the packer mandrel.
Processes 12 01971 g015
Table 1. A portion of the ultra-deep well depths data.
No.WellRegionActual Depth, mDrilling Period, Years
1Kolskaya SG-3Russia12,2621970–1990
2TiberUSA10,6922009
3Deep WaterUSA10,5001985
4Blackbird WestUSA10,0642008
5KTB-OberpfalzGermany99011987–1995
6Berta RogersUSA95831973–1974
7Baden UnitUSA91591970–1971
8HauptborungGermany91001990–1994
9Pengshen-6China90262023
10Luntan-1China88822018–2019
1153-2NChina88742020
12UniversityUSA86681970–1980
13ZisterdorfAustria85531990–1994
14Chuanshen-1China84202018
15Tashen-1China84082006
16Saatlinskaya SG-1Azerbaijan83401977–1990
17En-Yakhinskaya SG-7Russia82502000–2006
18Wutan-1China80602018
19Guole-3CChina80572023
Table 2. TW1 testing results data.
Nozzle Size
mm
Tube Pressure
MPa
Flow Pressure
MPa
Pressure Differential
MPa
Gas Production
104 m3
Fluid Production
m3
Oil Production
m3
Oil Cut
%
Gas–Liquid Ratio
m3/m3
Gas–Oil Ratio
m3/m3
3107.15–111.08168.862.922.8335.26/0803/
4105.86–116.90167.054.7311.90166.23/0716/
5114.07–123.36162.719.0821.89212.85/01028/
6116.15–121.95162.449.3441.73199.9685.743020874867
7.2115.58–119.93160.4711.3156.82150.16122.764537844628
8.1112.31–117.19158.5113.2775.82127.32127.225059555960
Note: The gas–liquid ratio and gas–oil ratio data were obtained through ground-based measurements.
Table 3. Dimensions of the packer mandrel.
ItemOD (Away from the Fracture)
mm
OD
(Near the Fracture)
mm
ID (Away from the Fracture)
mm
ID
(Near the Fracture)
mm
Tooth Height
mm
PitchLength of Plier Tooth Mark 1
mm
Length of Plier Tooth Mark 2
mm
Result59.9458.2747.8746.85+0.13−0.0310.7715.33
Table 4. Chemical composition analysis results of the packer mandrel (wt.%).
ElementCSiMnPSNiCrMoCu
packer mandrel0.420.230.670.0150.0060.051.00.170.19
Table 5. Microstructure, non-metallic inclusion rating, and grain size results of the packer mandrel.
Test ItemsPacker Mandrel
MicrostructureTempered sorbite + bainite
Non-metallic inclusion ratingClass B 2.0; Class C 2.0; Class D 1.0
Average grain sizeLevel 8.0
Table 6. Basic parameters for simulation.
No.ItemParameterNo.ItemParameter
1Perforation gun OD89 mm10Type of gunpowderHNS
2Perforation gun length26 m11Weight of charge25 g
3Casing ID108.1 mm12Gunpowder density1.6 g/cm3
4Casing steel gradeTP140 V13Tubing OD73.02 mm
5Distance from top of gun to packer179 m14Tubing ID62 mm
6Formation pressure162.47 MPa15Tubing steel gradeP110
7Pocket length74 m16Perforation Phase60 degrees
8Wellbore pressure162.47 MPa17Type of packerRTTS
9Perforating fluid density1.2 g/cm318Packer tensile strength620 kN
Disclaimer/Publisher’s Note: The statements, opinions and data contained in all publications are solely those of the individual author(s) and contributor(s) and not of MDPI and/or the editor(s). MDPI and/or the editor(s) disclaim responsibility for any injury to people or property resulting from any ideas, methods, instructions or products referred to in the content.

