Article

Analysis of the Impact of Multiple Explosion Source Layouts on the Kinetic Characteristics of Gas Explosions in Blind Roadways

1
College of Resources, Environment and Safety Engineering, Hunan University of Science and Technology, Xiangtan 411101, China
2
School of Physics and Engineering Technology, Minzu Normal University of Xingyi, Xingyi 562400, China
*
Author to whom correspondence should be addressed.
Processes 2024, 12(9), 1980; https://doi.org/10.3390/pr12091980 (registering DOI)
Submission received: 12 August 2024 / Revised: 4 September 2024 / Accepted: 12 September 2024 / Published: 14 September 2024
(This article belongs to the Section Advanced Digital and Other Processes)

Abstract

:
To investigate the changes in conditions within a blind roadway when multiple gas explosion sources are simultaneously detonated, the fluid dynamics software Fluent14.0 was used to conduct numerical simulation experiments with different numbers (2 and 3) and varying intervals (5 m, 10 m, and 15 m) of explosion sources. The results revealed that multiple explosion sources in gas explosions generate shock waves that propagate in opposite directions, creating pressure overlap zones within the roadway. The pressure waves and shock waves in these overlap zones continuously couple within the roadway. The number of overlap zones decreases incrementally with each encounter of opposing shock waves in the roadway. Unlike single explosion source models, the pressure at various positions within the roadway in multiple explosion source models oscillates due to the coupling of multiple shock waves, with significant peak pressures occurring at the closed end of the roadway and in the pressure overlap zones. Additionally, the propagation patterns of shock waves and flames within the roadway are not associated with the interval distance between explosion sources, whereas the encounter time, speed, and pressure of shock waves increase with the interval distance.

1. Introduction

In recent years, with the increasing depth of coal mine excavation in China, gas explosion accidents have frequently occurred during coal mining operations, posing a serious threat to the safety of production personnel [1,2,3,4]. Effectively preventing gas explosion accidents is of great significance for the safe production of coal mines.
Domestic and international scholars have conducted a series of studies on the propagation and distribution patterns of flames and pressure following gas explosions in mine roadways. In 1979, Savenco [5] was the first to theoretically and experimentally study air shock waves underground, identifying the attenuation characteristics of shock wave pressure in straight roadways, which laid the preliminary theoretical foundation for future research on shock wave propagation under complex conditions. Rankin et al. [6,7,8], based on studies from 1985 to 1992, attributed the formation of Tulip flames to axial velocity gradient differences and the interaction between the flame front and pressure waves. They concluded that when the flame propagates to the sidewall of the combustion tube, the flame area decreases, and the flame propagation speed correspondingly decreases, which is the cause of the Tulip flame formation. In 1995, Catlin [9] simulated the explosion process of methane–air mixtures in pipelines, revealing that shock waves moving in the same direction as the flame front and rarefaction waves moving in the opposite direction accelerate the flame’s combustion speed. In 2004, Kristoffersen et al. [10] experimentally analyzed the fact that flames propagate hemispherically in all directions within a pipeline. As the flame propagates, it axially stretches due to the influence of the pipe walls, leading to flame acceleration and pressure increase. In 2001, Chinese scholars Feng Changgen et al. [11] were the first to use the AutoReaGas explosion simulation software to study the impact of ignition location on the consequences of gas explosions in blind roadways, laying the foundation for subsequent simulation research on gas explosions. Bartknecht et al. [12] conducted a study on the impact of spatial geometry and dimensions on gas explosions. Through theoretical derivation, Yang et al. [13] and Li et al. [14] developed a mathematical model for the propagation of curved shock waves. Zheng et al. [15] and Cheng et al. [16] employed the computational fluid dynamics software FLACS for numerical simulations, attaining the characteristics of gas accumulation ranges and the interactions between explosion shock waves and flames across varying lengths of gas accumulation zones within blind roadways. Xu Jingde et al. [17] conducted experimental studies that showed that during the propagation of a gas explosion, the length of the flame zone is far greater than that of the gas accumulation zone, approximately by a factor of 3 to 6. Nie Baisheng et al. [18] investigated the flame propagation mechanism of gas in a square pipeline with a cross-section of 80 mm × 80 mm and a total length of 20 m. Sun Jinhua et al. [19,20,21,22,23] employed high-speed schlieren imaging technology to analyze the flame propagation process of methane–air mixtures with different concentrations in a closed pipeline. They found that when the methane concentration is close to the stoichiometric concentration, the flame front undergoes a transition from bending towards the unburned region to receding into the burned region during the explosion process. Ma Heng et al. [24] conducted numerical simulations on the gas explosion process within an H-shaped roadway under normal ventilation conditions and obtained the propagation characteristics of shock waves from a single explosion source in the roadway. Liu Rucheng et al. [25] conducted a simulation study on the gas explosion at a working face and obtained the dynamic propagation characteristics of gas explosion models at different positions on the working face. Chen Xiaokun et al. [26] performed numerical simulations on cases of different gas concentrations and the presence or absence of obstacles within blind roadways. Ye Qing et al. [27,28] investigated the accumulation of gas in H-shaped roadways, examining the coupling and distribution issues of pressure and temperature under different gas source layouts. Yang Kun et al. [29] conducted experimental studies using steel explosion test pipelines with different nominal diameters to study the propagation patterns of gas explosion pressure and flame waves within the pipeline. Lin Baiquan and Zhai Cheng et al. [30,31,32,33,34] conducted comprehensive research on the flame propagation dynamics and acceleration mechanisms within gas explosion models in pipeline branches and bends.
In summary, most current research focuses on single explosion sources, and there is a lack of studies on the conditions involving multiple gas explosion sources in mines. Therefore, it is necessary to conduct systematic research on this topic, as the results are of significant importance for ensuring the safety of people and property in industrial and mining production. This study focuses on a model with multiple gas explosion sources in a blind arched roadway, which has broad applicability.

2. Mathematical Model

2.1. Basic Equations

The conservation equations for the three-dimensional unsteady compressible gas explosion flow field in an excavation roadway under Cartesian coordinates can be expressed as follows [35]:
Continuity Equation:
p t + ( p u ) x + ( p v ) y + ( p w ) z = 0 .
Momentum Equations:
u t + u u x + v u y + w u z = 1 p p x ,
v t + u v x + v v y + w v z = 1 p p y ,
w t + u w x + v w y + w w z = 1 p p z .
Energy Equation:
e t + u e x + v e y + w e z = 0 .
State equation:
p = p ( ρ , T ) = ρ R T .
The indication of each parameter in the above equations is as follows:
  • x , y , z —Cartesian coordinate parameters;
  • ρ —Fluid density, kg/m3;
  • p —Pressure, Pa;
  • u , v , w —Velocity components for x, y, and z coordinate directions, respectively, m/s;
  • t —Time coordinates;
  • T —Temperature, °C;
  • R —Gas constant;
  • e —Specific energy, J/kg.
Notably,
e = p γ 1 + ρ ( u 2 + v 2 + w 2 ) 2 ,
where γ is the gas index.
Due to the use of Fluent 14.0 simulation software in CFD, the governing equation for gas combustion is as follows:
k f , r = A r T β r exp E r R T .
The indication of each parameter in Equation (8) is as follows:
  • k f , r —Reaction rate constant;
  • A r —Frequency factor;
  • β r —Temperature index;
  • E r —Activation energy, J/kmol.
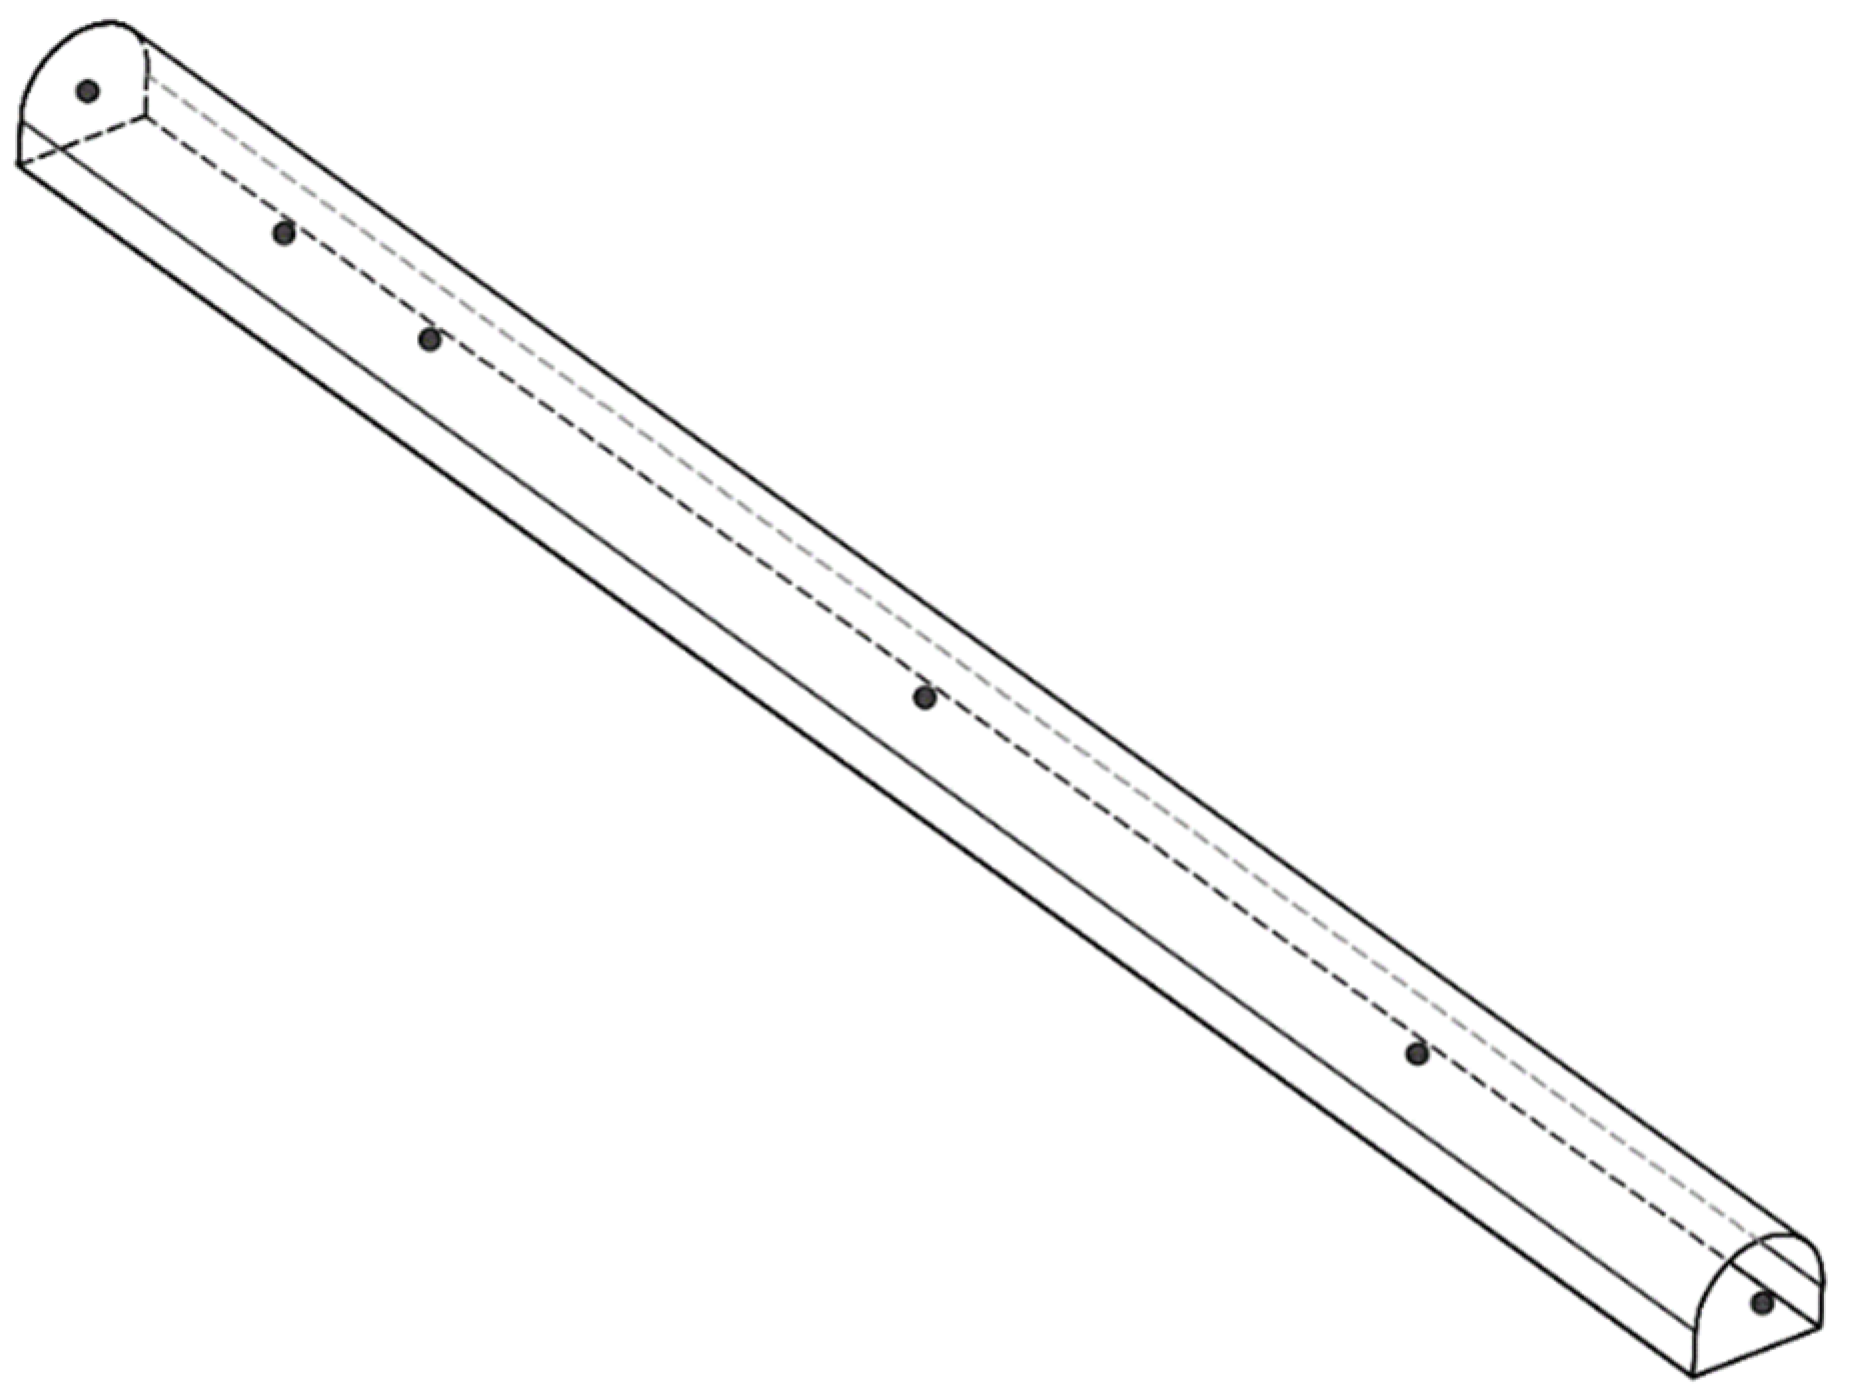
2.2. Physical Model

2.2.1. Numerical Modeling

The model is an arched tunnel [36], semi-enclosed, with cross-sectional dimensions shown in Figure 1. Grid subdivision employed a combination of Hex/wedge elements and the Cooper method, featuring a grid size of 0.1 m and comprising a total of 348,000 grids, which adequately satisfies the simulation demands of the model. The result of the grid division is shown in Figure 2. Gas accumulation in the tunnel is arranged with different quantities and intervals (each explosion source has an accumulation length of 5 m), as shown in Figure 3 and Figure 4.

2.2.2. Simulation Assumptions and Boundary Condition Setup

Gas explosions represent a complex and rapid chemical reaction process. To facilitate the simulation calculations, the following assumptions are made for the simulation process:
(1)
An electric spark ignition method is used, and the gas accumulation area is ignited within the tunnel.
(2)
The explosion process is a rapid, irreversible chemical reaction.
(3)
During the simulation, all gases are considered compressible, and the effect of gravity is neglected.
(4)
All wall surfaces in the simulation are assumed to be adiabatic and rigid. During the explosion, wall surfaces do not undergo relative displacement nor exchange energy with the external environment.
(5)
The explosion process is considered a single-step reaction, with the products being CO2 and H2O.
Based on the aforementioned assumptions, the model’s boundary conditions are established as follows: An unsteady solution approach is employed, utilizing a pressure-based solver with the energy equation enabled, and the RNG k-ε turbulence model is selected. To better manage flows characterized by high strain rates and significant streamline curvature, a term reflecting the time-averaged strain rate of the main flow is incorporated into the ε equation. The species transport model is activated, with a methane–air mixture designated as the explosion source gas, and the reaction equation is configured using a finite-rate chemical reaction model. The component mass fraction of the explosion source gas is specified via the materials database in FLUENT software. The SIMPLE algorithm is applied to resolve the coupling between pressure and velocity within the flow field, and the solution method employs the Pressure Implicit with Splitting of Operators (PISO) non-iterative algorithm, using a second-order upwind scheme for discretization. In FLUENT software, an electric spark ignition method is implemented, positioning the ignition source at the center of the explosion source gas accumulation zone. Boundary parameters are outlined in Table 1.

2.3. Validation of Numerical Simulation Reasonableness

A comparison was made between the single explosion source gas explosion model, which used the same parameters, and the experimental data [37], as shown in Table 2.
Due to the different units in the comparison data, the data have been standardized, and pairwise comparisons were made, as shown in Figure 5.
Based on Table 2 and Figure 5, it can be observed that under the condition where the gas accumulation length in the tunnel is 5 m, the two sets of data are of the same order of magnitude in the comparison of parameters, including peak overpressure, the location of the peak overpressure, and detonation velocity. The differences in the data are not significant. The deviation between the simulation and the experimental data is within 10% (considering there are differences in the parameters of the objects studied). Therefore, it can be concluded from this comparison that the numerical simulation is reasonable.

3. Numerical Simulation Results

3.1. Models with Different Numbers of Explosion Sources

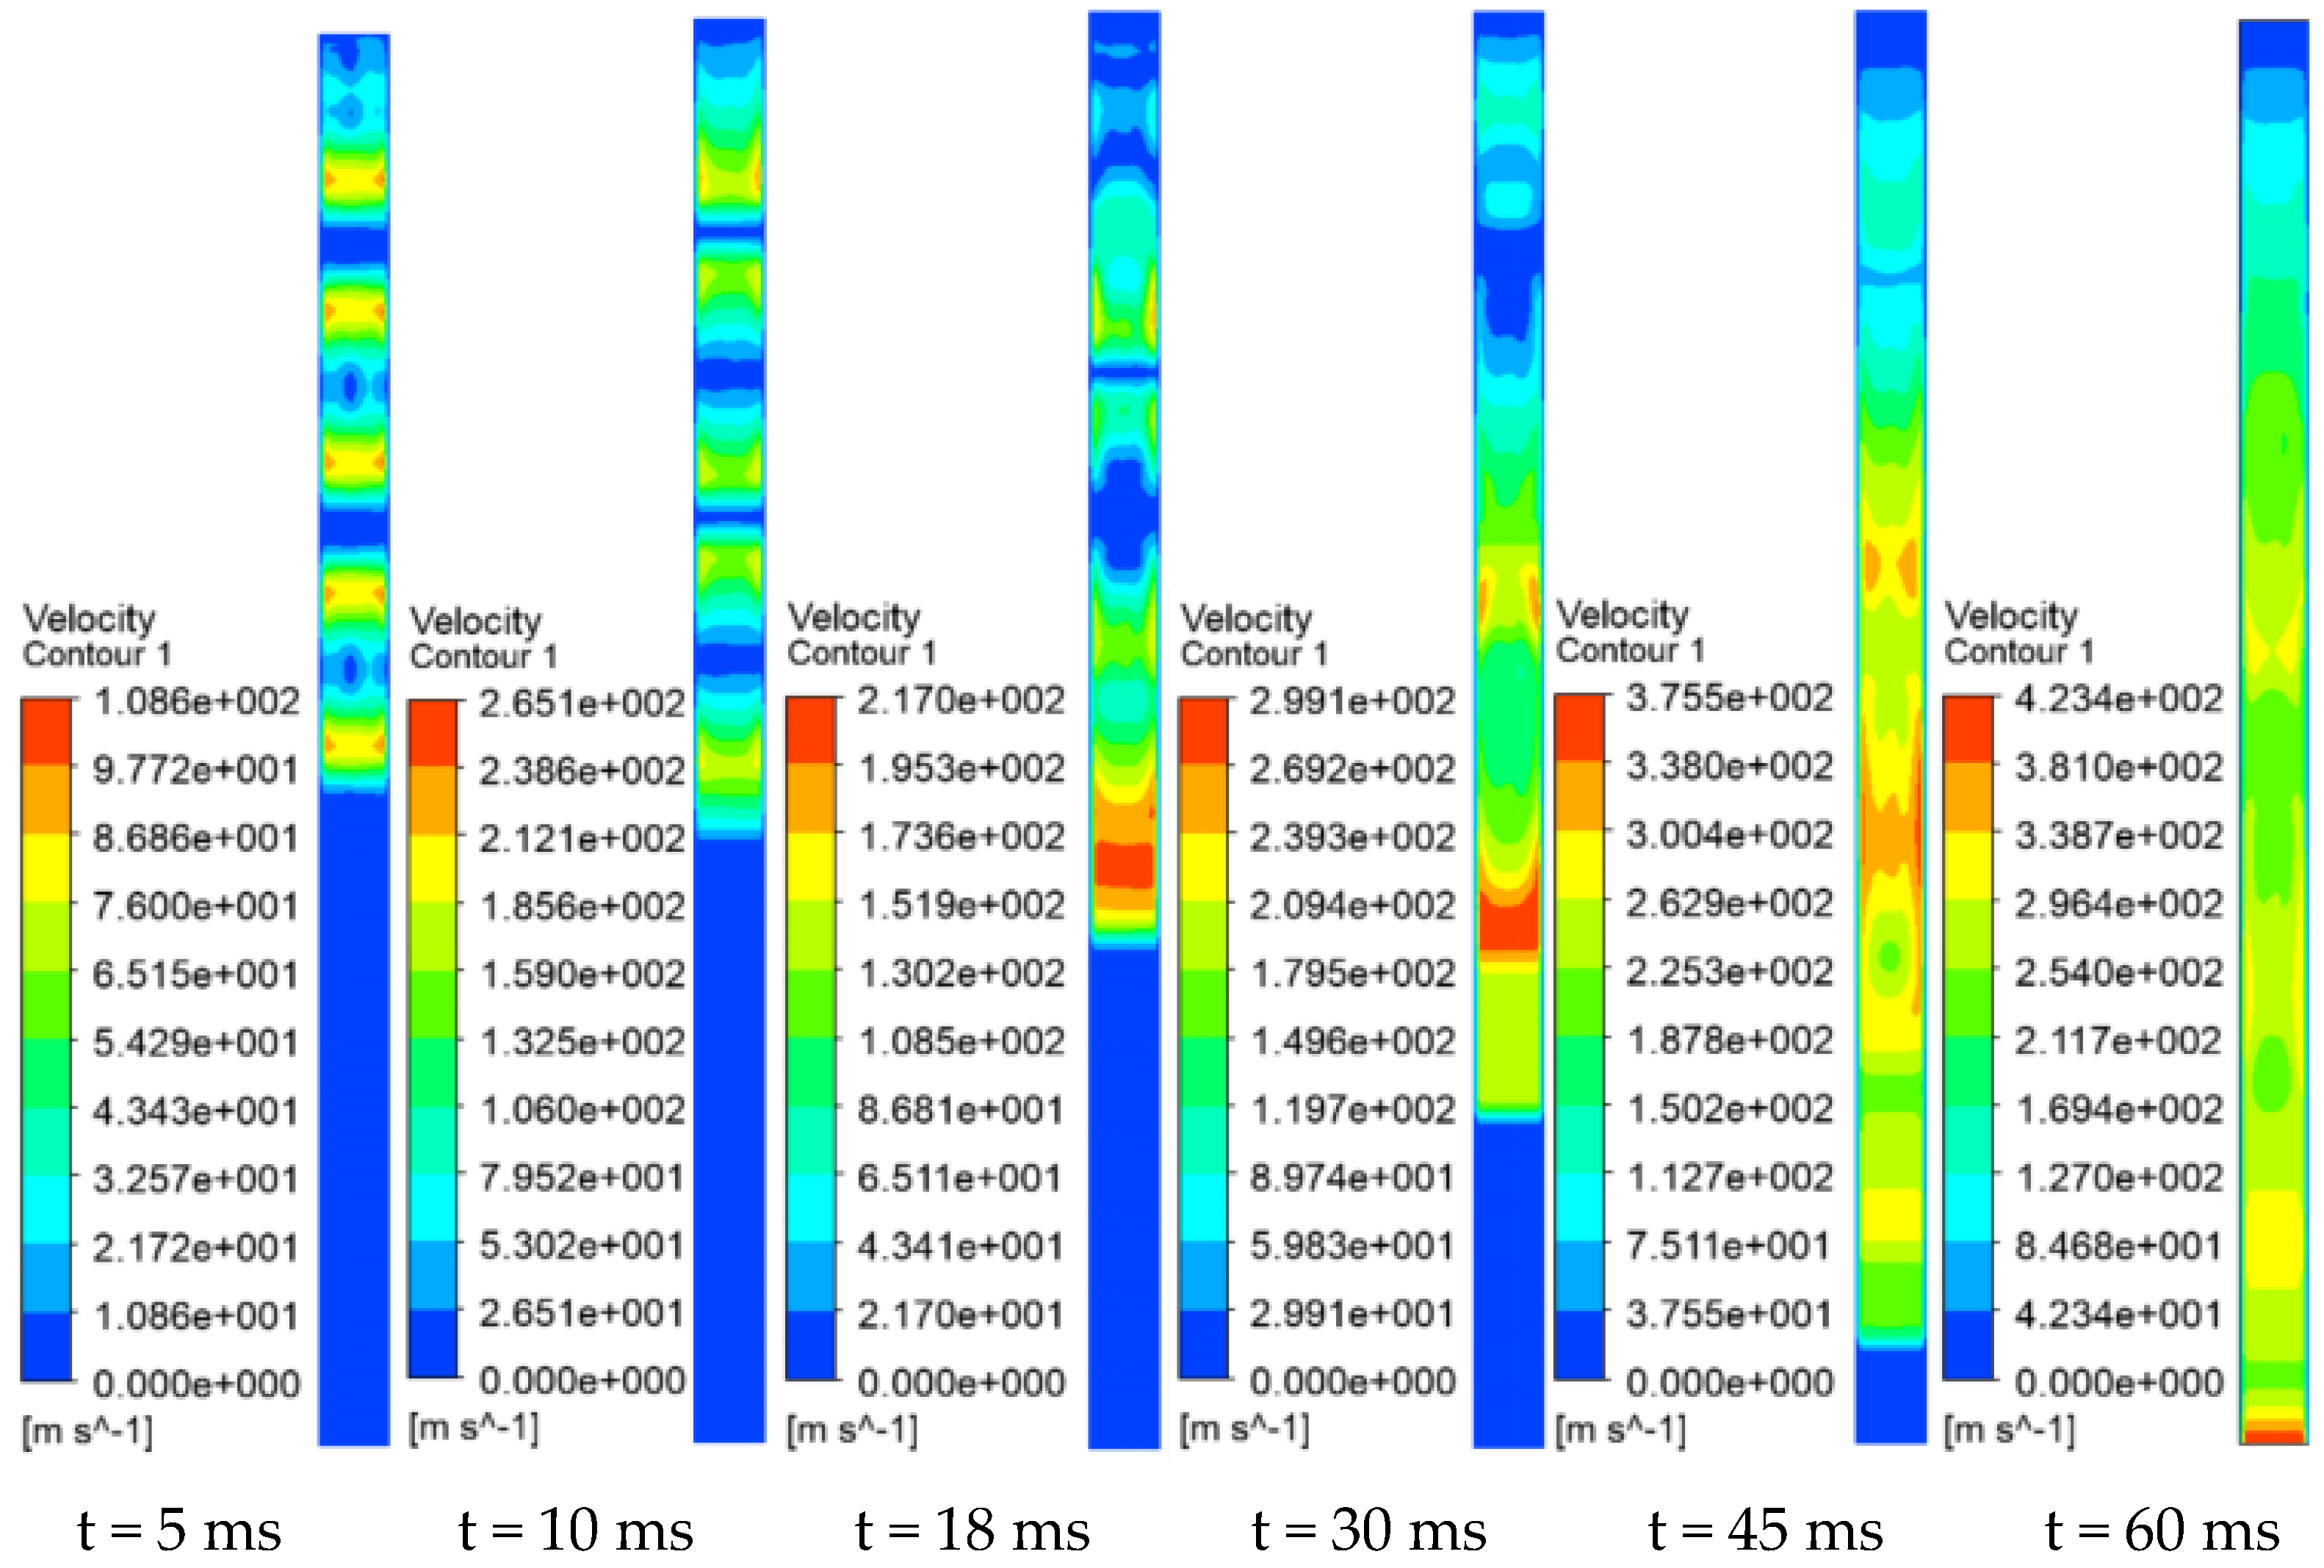
3.1.1. Shock Wave Propagation Process

The variation of parameters in the tunnel after the gas explosion is closely related to the propagation process of the shock wave. It is necessary to conduct a comparative analysis of the shock wave propagation process for models with different numbers of explosion sources. Taking an interval distance of 5 m between explosion sources as an example, the results are shown in Figure 6 and Figure 7.
From Figure 6, it can be seen that when the explosion occurs, shock waves are generated simultaneously from two explosion sources (for convenience of analysis, the gas accumulation area near the closed end is referred to as explosion source 1, and the other accumulation area in the tunnel is referred to as explosion source 2). The shock wave from the left side of explosion source 1 is restricted by the closed end, while the shock wave from the right side propagates towards the exit. In contrast, the shock wave from explosion source 2 propagates in both directions without any restrictions. At this time, the propagation speed of the shock waves at the center of the explosion sources and the closed end is slower than that within the tunnel (t = 1–5 ms). As the shock waves propagate, the right-side shock wave from explosion source 1 meets the left-side shock wave from explosion source 2 in the tunnel (the air in this region is subjected to compression from both ends), cancelling out each other’s momentum and resulting in near-zero speed at that location (t = 13 ms). Subsequently, pressure waves are generated in this region and spread towards both sides. The shock wave propagating towards the left closed end reflects off the end and propagates again towards the right, thereby creating multiple high-velocity regions in the tunnel (the reflected wave from the closed end, the rightward pressure wave generated from the encounter region of the shock waves, and the right-side shock wave from explosion source 2) (t = 40–55 ms). Over time, the left-side shock waves gradually catch up with the rightmost shock waves (as the propagation distance increases, the energy consumption causes the speed of the rightmost shock waves to continuously decay) (t = 68–75 ms).
Figure 7 shows that when three explosion sources (referred to as explosion sources 1, 2, and 3 from left to right) detonate simultaneously, the shock wave from explosion source 1 propagates to the right due to the confinement of the closed end, while the shock waves from explosion sources 2 and 3 propagate towards the two ends of the tunnel (t = 1–5 ms). Similar to the double explosion source model, the encounter of oppositely propagating shock waves leads to impulse coupling, resulting in three low-velocity areas within the tunnel (located at the centers of the explosion sources and where the shock wave meets the closed end) (t = 10 ms). Unlike the double explosion source model, there are two interaction regions where shock waves from the three explosion sources meet, and these regions subsequently generate pressure waves that propagate towards both ends. The oppositely propagating pressure waves meet again in the middle region of the two pressure overlap zones (t = 20 ms). Similar to the previous analysis, this pressure overlap zone generates pressure waves that propagate towards both ends again. The pressure wave on the left meets the reflected wave when propagating towards the closed end, forming another pressure overlap zone, while the pressure wave on the right propagates towards the exit and gradually catches up with the rightward initial shock wave from explosion source 3 and the rightward pressure wave generated from the first encounter (between the oppositely propagating waves of explosion sources 2 and 3) (t = 25–50 ms). At this point, multiple shock waves propagate through the tunnel, and the contour plot shows multiple high-velocity regions. As the velocity of the leading shock waves decays, they are gradually overtaken by the trailing shock waves (t = 50–65 ms).
Overall, the three-explosion source model is more complex in terms of shock wave propagation compared to the two-explosion source model. This complexity primarily manifests in the increased number of pressure and impulse coupling zones created by the shock waves from the explosion sources, and the occurrence of secondary or higher-order coupling phenomena. Similarly, it can be predicted that when multiple explosion sources detonate simultaneously within a tunnel, the resulting shock waves will continuously interact and couple, leading to pressure and impulse oscillations within the tunnel.

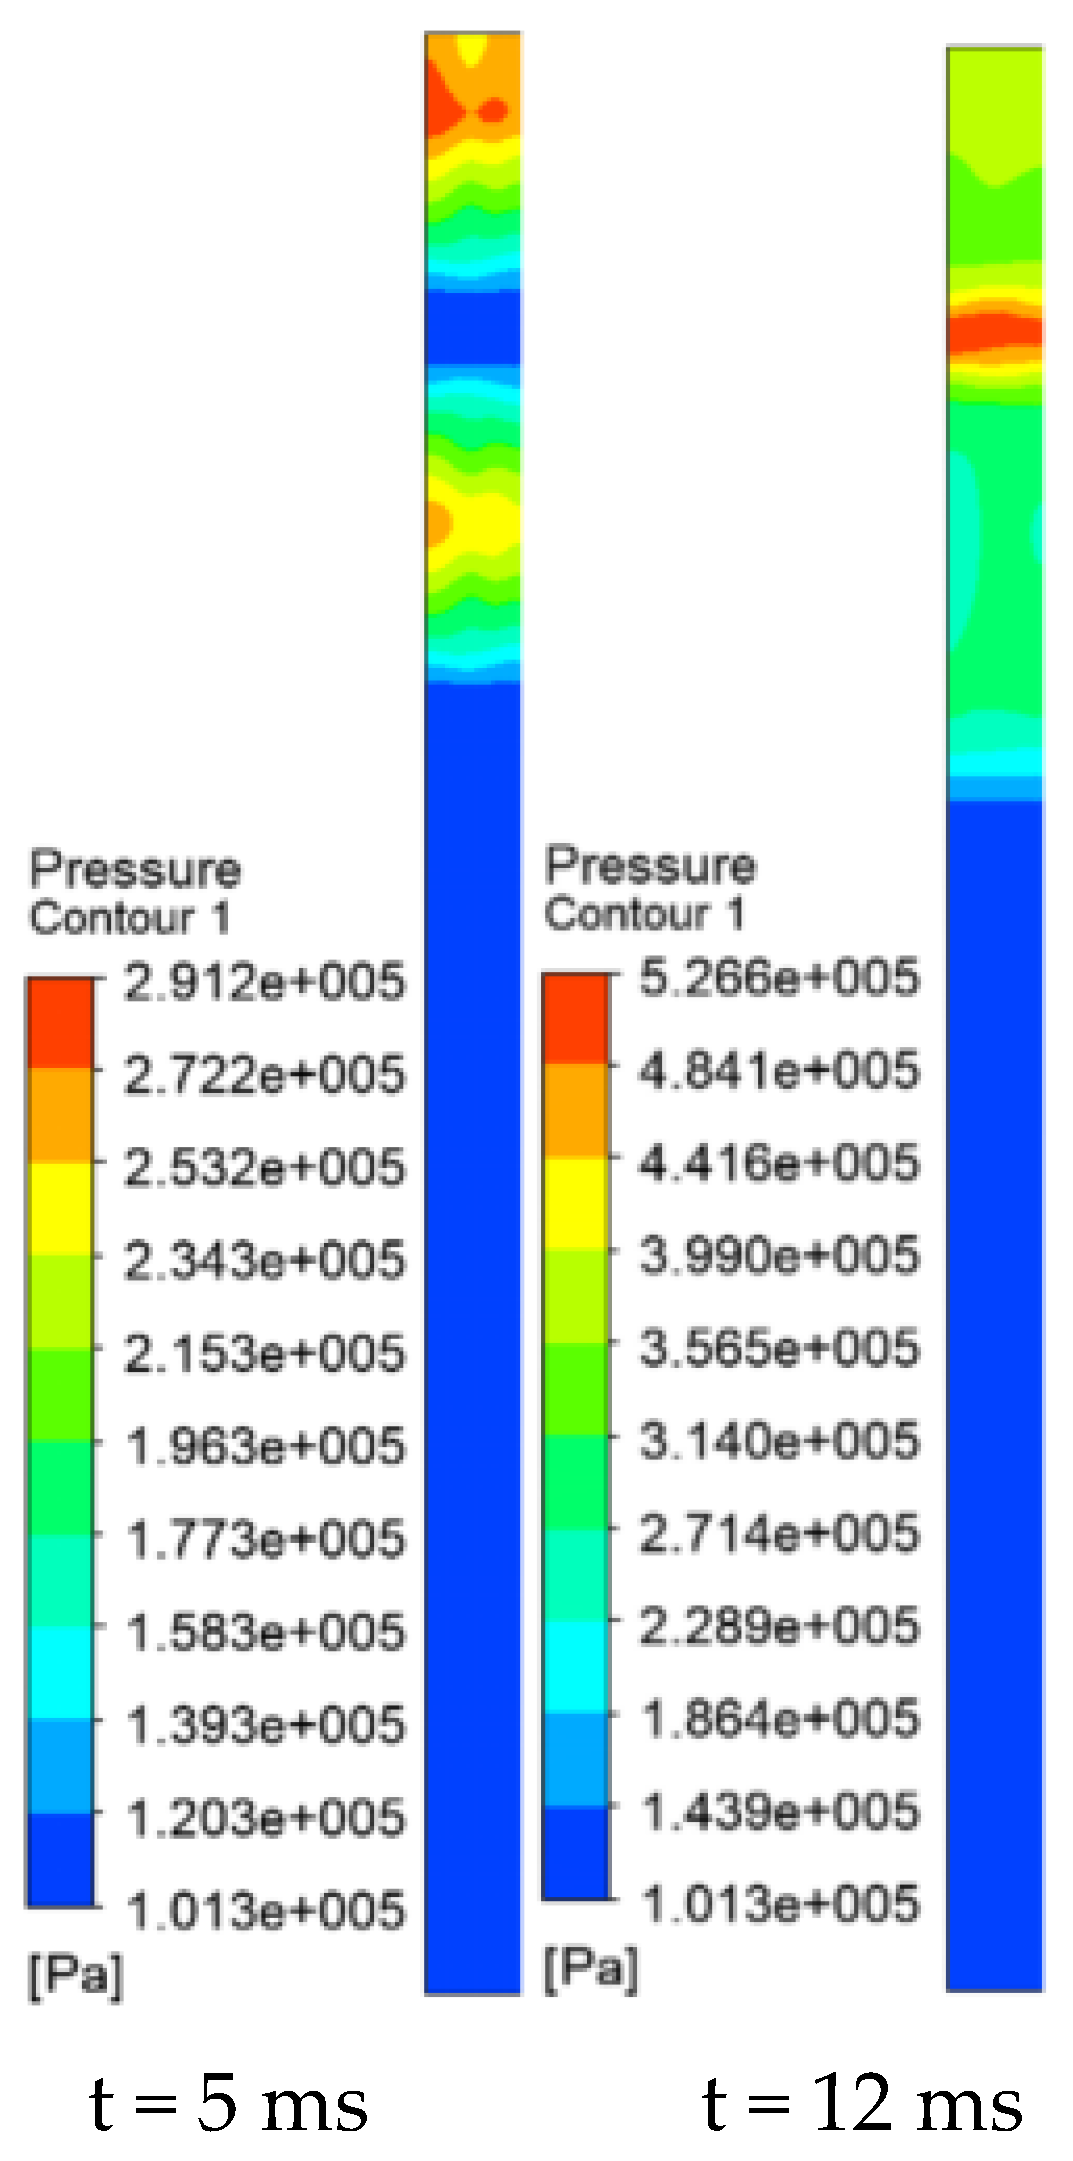
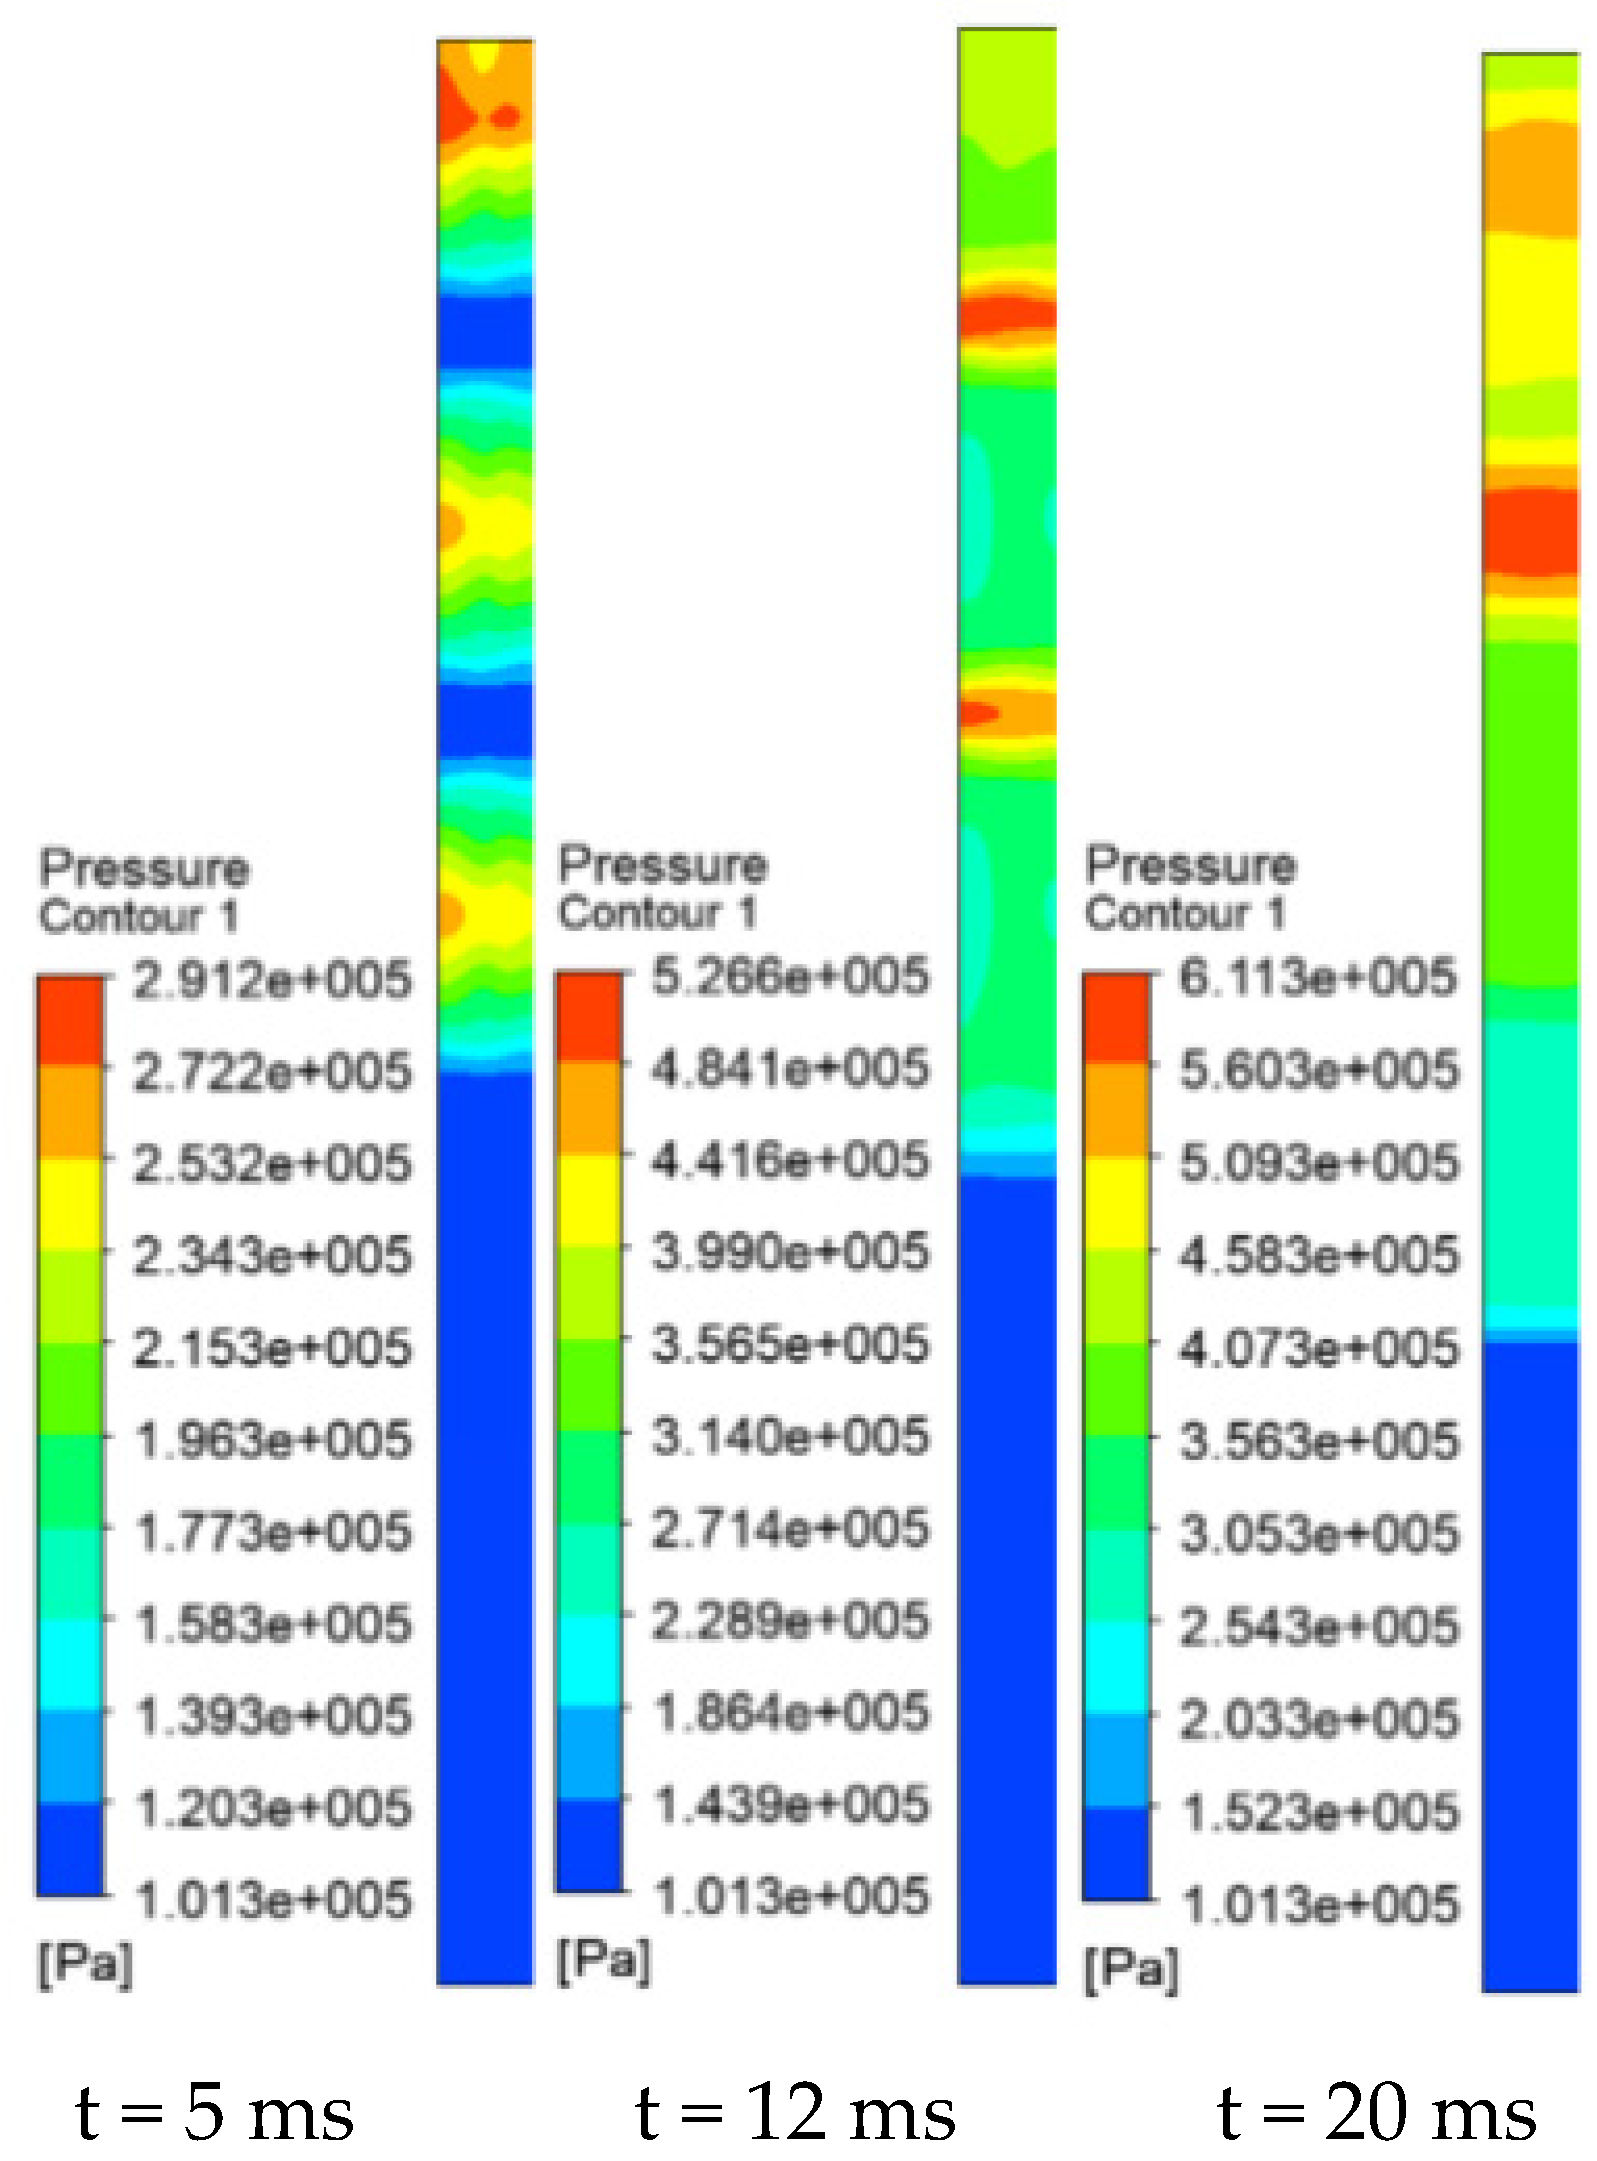
3.1.2. Analysis of the Formation Pattern of Pressure Overlap Zones in Multiple Explosion Sources

Building on the previous analysis, in the multiple explosion source model, the interaction of multiple shock waves leads to the formation of pressure overlap zones. This characteristic differs from the single explosion source model, where shock waves propagate through the tunnel without such interactions. The continuous formation and dissipation of pressure overlap zones result in significant variations in the tunnel’s inner conditions. Therefore, it is essential to analyze and study the formation patterns of these pressure overlap zones.
The pressure contour plots in Figure 8 and Figure 9 show that when the shock waves from two explosion sources meet, the pressure in that region within the tunnel is at its highest. In the double-explosion source model, the region where the shock waves meet is located in the middle of the two sources. In the three-explosion source model, the shock waves primarily meet twice: first, in the middle of the intervals between the three explosion sources, resulting in two meeting points, and second, in the middle of the previous two meeting points, resulting in one meeting point.
Based on the previous analysis, we found that the formation of pressure overlap zones from multiple explosion sources in a tunnel follows the following pattern, as shown in Figure 10.
As shown in Figure 10, in a straight tunnel with n explosion sources, the initial number of pressure overlap zones created by the encounter of the shock waves is n − 1. The pressure waves generated from these high-pressure zones then meet again to form n − 2 pressure overlap zones. This iterative, pyramid-like process continues (with each successive formation reducing the number of high-pressure overlap zones by 1) until a final single-pressure overlap zone is formed.

3.1.3. Analysis of Pressure from Different Numbers of Explosion Sources

To assess the impact of explosions within the tunnel with varying numbers of explosion sources, it is necessary to conduct a pressure analysis for models with different quantities of explosion sources. Therefore, monitoring points were set within the tunnel to analyze the dynamic changes in pressure.
(1)
Double-Explosion Source Model
The monitoring points were set from left to right as follows: Point 1 (closed-end), Point 2 (encounter point of shock waves from explosion sources 1 and 2), Point 3 (center of the explosion from explosion source 2), Point 4 (middle of the tunnel), Point 5 (middle of the rear half of the tunnel), and Point 6 (tunnel exit). The detailed layout is shown in Figure 11.
From the pressure curve in Figure 12, it is evident that after the explosion, the pressure at each monitoring point increases rapidly over a brief period, generally showing a trend of rising first and then falling. Notably, each monitoring point in the roadway, except at the closed end, exhibits two peak pressures from left to right. The pressure rapidly diminishes over time, and once depressurization is complete, the pressure within the tunnel stabilizes around the atmospheric pressure level. According to the statistical data, the peak pressure at the closed end is the highest, followed by the pressure overlap zone formed by the two explosion sources. At other points, the pressure gradually decreases with increasing distance from the explosion sources. The elevated pressure peak at the closed end arises from the obstruction of the shock wave, which, upon reflection and overlapping with the incident wave, causes an increase in pressure. Similarly, the elevated pressure at the intersection of two opposing shock waves results from the overlapping of the two pressures. Comparing the pressure peaks at the centers of the two explosion sources reveals that the center of explosion source 1, which is closer to the closed end, experiences a higher pressure peak due to the influence of the reflected wave compared to the center of explosion source 2, which is situated farther away.
(2)
Three-Explosion Source Model
The monitoring points were set from left to right as follows: Point 1 (closed-end), Point 2 (center of the encounter area of shock waves from explosion sources 1 and 2), Point 3 (center of the explosion from explosion source 2), Point 4 (center of the encounter area of shock waves from explosion sources 2 and 3), Point 5 (middle of the rear half of the tunnel), and Point 6 (tunnel exit). The detailed layout is shown in Figure 13.
From Figure 14, it can be observed that the pressure variation trend with distance is similar to that of the double explosion source model, i.e., generally, the closer to the closed end, the higher the pressure value. Specifically, the closed end forms two peak pressures, with the highest value greater than at any other point in the tunnel. Monitoring point 2, the meeting point of shock waves from explosion sources 1 and 2, has the highest pressure value following the closed end. The peak pressure variation pattern at other monitoring points is similar to the former, with multiple peak pressures forming at each point. The pressure value in the pressure overlap zone formed by explosion sources 1 and 2 is greater than that in the overlap zone formed by explosion sources 2 and 3. Unlike the double explosion source model, in this model, the pressure waves from the initially formed pressure overlap zones meet and overlap again, generating pressure waves that propagate towards both ends of the tunnel, resulting in a more complex pressure oscillation process within the tunnel.

3.1.4. Analysis of Regional Pressure Extremes

From the previous pressure analysis, the peak pressure values in certain regions of the tunnel following an explosion are significantly higher than those in other regions. From the perspective of potential hazards and prevention, it is necessary to focus on analyzing these areas. The collected data on the pressure extremes in specific regions are shown in Table 3 and Table 4.
Table 3 and Table 4 reveal that the pressure variations in specific areas within the tunnel are significant under multiple explosion source conditions, and the pressure distribution at different positions is closely related to the propagation dynamics of the explosion shock waves. Specifically, the peak pressure at the closed end is the highest, primarily due to the blockage of the leftward-propagating shock wave from explosion source 1 and the leftward-propagating pressure wave from the pressure overlap zone created by explosion sources 1 and 2. The pressure overlap zone is influenced not only by the opposing propagation of shock waves but also by the reflection waves from the closed end. Furthermore, the peak pressure in the pressure overlap zone formed by explosion sources 1 and 2, which is closer to the closed end, is higher than that in the pressure overlap zone formed by explosion sources 2 and 3. Comparing the above two conditions, it can be summarized that when multiple explosion sources occur in a tunnel, high-pressure areas are likely to form in the regions where shock waves are obstructed and in the shock wave intersection coupling areas. Overall, the average pressure value decreases with increasing distance from the closed end, and the pressure decreases rapidly owing to the exit effect.

3.2. Models with Different Intervals between Explosion Sources

3.2.1. Effects of Different Intervals on Flame Propagation

Figure 15 shows the contour plots for the double explosion source model with three different intervals (5 m, 10 m, and 15 m). From the figure, the patterns of the explosion flames, the formation of tulip flame fronts, the propagation of the flame from explosion source 2 through the tunnel, and the final distribution of the flame within the tunnel are consistently similar. This indicates that variations in the interval distance between the explosion sources have minimal effect on the flame propagation process after the explosion. From the dynamic changes in the contour plots, it is observed that the flame formed by explosion source 1, near the closed end, can never catch up with the flame formed by explosion source 2. The reason for this is similar to previous analyses, that is, the high-pressure region between the two explosions suppresses the forward spread of flame 1 while simultaneously promoting the propagation of flame 2 towards the exit. Additionally, as the interval distance increases, the time required for the flame to propagate out of the tunnel decreases. For example, in the 5 m interval model, the flame reaches the exit in 160 ms, while in the 10 m and 15 m intervals, it takes 130 ms and 110 ms, respectively.

3.2.2. Effects of Different Intervals on Pressure Distribution

To determine the impact of explosion source interval distance on the pressure distribution within the tunnel following an explosion, a comparative analysis of the pressure dynamic changes in the tunnel post-explosion was conducted for three different models. Monitoring points were set from left to right as follows: Point 1 at the closed end, Point 2 at the center of explosion source 1, Point 3 at the middle of the front section of the tunnel, Point 4 at the middle of the tunnel, Point 5 at the middle of the rear section of the tunnel, and Point 6 at the tunnel exit, as shown in Figure 16.
Based on the monitoring points, we plotted the time–pressure curves for the three comparative models, as shown in Figure 17.
The main characteristic of multi-source gas explosions is the creation of a pressure overlap zone after simultaneous detonation. The size, location, and timing of this zone vary under different conditions, as listed in Table 5.
The time–pressure curves for the three conditions, as shown in Figure 17, demonstrate that the variation patterns at the monitoring points remain consistent across all conditions. This suggests that the shock wave’s propagation pattern within the tunnel is not significantly affected by changes in the interval between explosion sources. However, Table 5 shows significant differences in the pressure overlap zone formed when the shock waves meet under the three conditions. Specifically, the meeting position is at the midpoint of the interval zone between the two explosion sources; as the interval distance increases, the meeting time, speed, and peak pressure value at this point all increase. The reasons for these observations can be explained as follows: (1) The meeting position is central due to the equal lengths of gas accumulation at both explosion sources (i.e., the energy is the same), resulting in identical initial shock wave speeds as they move towards each other. (2) As the interval distance increases, the leading shock wave has more time to receive energy supplementation from gas combustion, gaining more energy over this distance than it loses. Therefore, with an increasing interval distance, the speed (and thus the impulse) of the shock waves at the meeting point is greater, leading to a higher final peak pressure.

4. Conclusions

This study investigates the phenomenon of multiple gas explosion sources within a blind tunnel. Through a series of numerical simulation experiments conducted under varying conditions, such as the number of explosion sources and their interval distances, the research systematically analyzes the dynamic variations in parameters like pressure and temperature during simultaneous detonations of multiple gas explosion sources in a blind tunnel. The results provide valuable insights for further exploration of explosion dynamics and propagation characteristics in complex tunnel systems. The conclusions are presented as follows:
(1)
During a multi-source gas explosion, counter-propagating shock waves create pressure overlap zones within the tunnel. The pressure waves in these overlap zones coupled with the explosion shock waves in the tunnel, resulting in multiple segments of low-velocity regions (where shock waves meet) and high-velocity regions (generated by explosion waves, wall-reflected waves, and overlap zone pressure waves) within the tunnel at different times.
(2)
The number of pressure overlap zones formed by multiple explosion sources in the tunnel dynamically changes as the shock waves propagate. For n explosion sources, the number of pressure overlap zones decreases incrementally over time because each encounter of adjacent shock waves eliminates one overlap zone.
(3)
The pressure distribution from a multi-source gas explosion within the tunnel differs from that of a single-source model, exhibiting multiple pressure oscillations over time. Overall, the pressure decreases gradually as the distance from the explosion source increases. Locations with significantly higher pressures are the closed end and the pressure overlap zones formed by counter-propagating shock waves.
(4)
Simulation results indicate that the interval distance between explosion sources has a minor impact on the propagation patterns of shock waves and flames within the tunnel. However, the meeting time, the velocity at the meeting point, and pressure of the shock waves all increase with the increase in the interval distance.

Author Contributions

Conceptualization, Q.Y.; Validation, Z.J.; Writing—review & editing, W.W. All authors have read and agreed to the published version of the manuscript.

Funding

National Natural Science Foundation Project of China, Grant/Award Numbers: 52174177, 52174178.

Data Availability Statement

The data presented in this study are available on request from the corresponding author.

Conflicts of Interest

The authors declare no conflict of interest.

References

  1. Lin, B. Analysis on the current situation of coal mine safety in China. Energy Technol. Manag. 2006, 3, I0001. [Google Scholar]
  2. Si, R.; Li, R.; Su, D. Experimental study on the influence of coal dust cloud mass concentration on gas explosion pressure. J. Saf. Environ. 2018, 18, 1796–1798. [Google Scholar]
  3. Li, Z.; Wang, T.; Wang, S.; Wang, Y. Simulation study on disaster evolution of ventilation system in coal and gas outburst mine. J. Coal Ind. 2017, 42, 929–934. [Google Scholar]
  4. Wang, D. Thermal power disaster and characteristics of coal mine. J. Coal Ind. 2018, 43, 137–142. [Google Scholar]
  5. Savinko, C.K. Downhole Air Shock Wave; Ding, A.; Long, W., Translators; Metallurgical Industry Press: Beijing, China, 1979. [Google Scholar]
  6. Dunn-Rankin, D.; Barr, P.K.; Sawyer, R.F. Numerical and experimental study of tulip flame formation in aclosed vessel. In Proceedings of the 21st Symposium (International) on Combustion, Munich, Germany, 3–8 August 1986; Pergamon: Pittsburgh, PA, USA, 1986; pp. 1291–1301. [Google Scholar]
  7. Strehlow, R.A. Combustion Fundamentals; McGraw-Hill: New York, NY, USA, 1985. [Google Scholar]
  8. Gonzalez, M.; Borghi, R.; Saouab, A. Interaction of aflame front with its self-generated flow in an enclosure: The “tulip flame” phenomenon. Combust. Flame 1992, 88, 201–220. [Google Scholar] [CrossRef]
  9. Catlin, C.A.; Fairweather, M. Predictions of turbulent, premixed flame propagation in explosion tubes. Combust. Flame 1995, 102, 115–128. [Google Scholar] [CrossRef]
  10. Kristoffersen, K.; Vaagsaether, K.; Bjerketvedt, D.; Thomas, G.O. Propane–air pipe explosion experiments. Data for estimation of 1-D burning velocity in slow regimes. Exp. Therm. Fluid Sci. 2004, 28, 723–728. [Google Scholar] [CrossRef]
  11. Feng, C.; Chen, L.; Qian, X. Influence of ignition position on the overpressure of gas explosion in a solitary headway. J. Saf. Environ. 2001, 1, 56–59. [Google Scholar]
  12. Bartknecht, W. Explosion Process and the Protective Measures; He, H., Translator; Chemical Industry Press: Beijing, China, 1985. (In Chinese) [Google Scholar]
  13. Yang, S.; Jing, G.; Jia, Z. Injury study on impact current of gas explosion in coal mine. J. China Coal Soc. 2009, 34, 1354–1358. [Google Scholar]
  14. Li, Z.; Liu, H.; Dun, Z.; Ren, L.; Fang, J. Grouting effect on rock fracture using shear and seepage assessment. Constr. Build. Mater. 2020, 242, 118131. [Google Scholar] [CrossRef]
  15. Zheng, D.; Li, X.; Guo, Z.; Liu, K. Experimental and Numerical Simulation of Flame Propagation Mechanism in Methane Explosion. Res. Fire Prot. Theory 2014, 33, 725–728. [Google Scholar]
  16. Cheng, F.; Deng, J.; Cai, Z.; Luo, Z.; Xiao, Y. The influence of gas accumulation range on the damage characteristics and propagation rules of gas explosion shock waves in single ended roadways. Min. Saf. Environ. Prot. 2016, 43, 1–5. [Google Scholar]
  17. Xu, J.; Xu, S.; Yang, G. Experimental study on the propagation of mine gas explosion. J. Coal Sci. 2004, 33, 55–57. [Google Scholar]
  18. Nie, B.; He, X.; Li, X. Study on the Dynamic Change Law of Gas Explosion Flame Based on Image Correlation Coefficient. In Proceedings of the Fifth National Symposium on Strong Dynamic Load Effects and Protection and the Innovative Research Group Symposium on Dynamic Mechanical Behavior of Complex Media/Structures, Hohhot, China, 15–19 July 2013. [Google Scholar]
  19. Sun, J.; Chen, D. Structural characteristics of methane/air premixed flames with different concentrations. In Proceedings of the 2009 Academic Annual Meeting of the China Occupational Safety and Health Association, Xiamen, China, 11–14 November 2009. [Google Scholar]
  20. Chen, D.; Sun, J.; Liu, Y.; Ma, Y.; Han, X. Propagation characteristics of methane/air premixed gas flames. Explos. Shock 2008, 28, 385–390. [Google Scholar]
  21. Liu, Y.; Sun, J.; Chen, D. Experimental study on the structure of methane coal dust composite flames in pipelines. J. China Univ. Sci. Technol. 2006, 36, 65–68. [Google Scholar]
  22. Chen, X.; Sun, J.; Yao, L.; Liu, Y. Microstructural characteristics during Tulip flame formation. Combust. Sci. Technol. 2008, 14, 350–354. [Google Scholar]
  23. He, X.; Sun, J.; Chen, X.; Yuan, G. Experimental and numerical simulation study on the propagation characteristics of methane-air premixed flames in pipelines. J. China Univ. Sci. Technol. 2009, 39, 419–423. [Google Scholar]
  24. Ma, H.; Chen, X.; Jing, D. Simulation of gas explosion and explosion discharge process in H-type ventilation roadway. Chin. J. Saf. Sci. 2021, 31, 45–51. [Google Scholar]
  25. Liu, R.; Zhu, Y. Full scale simulation of gas explosion in long wall face of coal mine. Chin. J. Saf. Sci. 2018, 28, 62–68. [Google Scholar]
  26. Chen, X.; Guo, L.; Cheng, F. Numerical simulation of gas explosion in single head roadway. Coal Mine Saf. 2012, 43, 20–22. [Google Scholar]
  27. Ye, Q.; Wang, W.; Jia, Z.; Liu, J. Characteristics of gas explosion propagation in H-type tunnel with different arrangement of dual explosive sources. J. High Press. Phys. 2024, 38, 150–162. [Google Scholar]
  28. Wang, W.; Ye, Q.; Jia, Z. Numerical simulation study of gas explosion model with different accumulation ranges in H-type roadway. Min. Saf. Environ. Prot. 2023, 50, 13–18. [Google Scholar]
  29. Yang, K.; Si, R.; Huang, Z.; Jia, Q.; Zhao, J.; Niu, Y. Experimental study of gas explosion pressure and flame wave propagation in different pipe diameters. Eng. Blasting 2024. [Google Scholar] [CrossRef]
  30. Lin, B.; Ye, Q.; Zhai, C.; Jian, C. Propagation Law and Analysis of Gas Explosions in Branched Pipelines. J. China Coal Soc. 2008, 33, 136–139. [Google Scholar]
  31. Lin, B.; Zhang, R.; Lv, H. Study on the Flame Propagation Law and Acceleration Mechanism in Gas Explosions. J. China Coal Soc. 1999, 24, 56–58. [Google Scholar]
  32. Zhai, C.; Lin, B.; Ye, Q.; Li, X.; Zhu, C. Influence of geometry shape on gas explosion propagation laws in bend roadways. Procedia Earth Planet. Sci. 2009, 1, 193–198. [Google Scholar]
  33. Ye, Q.; Lin, B.; Jia, Z.; Jia, Z.; Zhu, C. Propaga tion law and analysis of gas explosion in bend duct. Procedia Earth Planet. Sci. 2009, 1, 316–321. [Google Scholar]
  34. Zhu, C.; Lin, B.; Lu, Z.; Jiang, B.; Liu, Y. Ex-periments on flame and shock wave propagation in a par-allel tunnel in underground coal mines. In Progress in Safety Science and Technology; Science Press: Beijing, China, 2010; pp. 1204–1208. [Google Scholar]
  35. Deng, Z. Numerical simulation of damage and failure of roadway wall caused by gas explosion. Sci. Technol. Eng. 2020, 20, 1792–1798. [Google Scholar]
  36. Ning, Y. Derivation and application of a simple calculation formula for the cross-section of an arch roadway. In Proceedings of the 2012 National Coal Mine Safety Academic Annual Conference, Guangzhou, China, 28 October 2012. [Google Scholar]
  37. Yang, S.; Jing, G. Propagation of gas explosion in semi-enclosed restricted space. J. Liaoning Univ. Eng. Technol. 2014, 33, 28–32. [Google Scholar]
Figure 1. Cross-sectional dimensions of roadway.
Processes 12 01980 g001
Figure 2. Arched tunnel model and grid division.
Processes 12 01980 g002
Figure 3. Layout of different numbers of explosion sources in the roadway. (a) Two-explosion source model and (b) three-explosion source model.
Processes 12 01980 g003
Figure 4. Layout of explosion sources with different intervals. The shaded area indicates the mixture of gas and air. (a) Interval of 5 m, (b) interval of 10 m, and (c) interval of 15 m.
Processes 12 01980 g004
Figure 5. Bar chart of simulated and experimental data indices.
Processes 12 01980 g005
Figure 6. Contour plot of the propagation process of the double explosion source shock waves in the tunnel.
Processes 12 01980 g006
Figure 7. Contour plot of the propagation process of the three-explosive source shock waves in the tunnel.
Processes 12 01980 g007
Figure 8. Pressure overlap zones by two explosion sources.
Processes 12 01980 g008
Figure 9. Pressure overlap zones by three explosion sources.
Processes 12 01980 g009
Figure 10. Formation and variation of pressure overlap zones in multi-explosion source gas explosions.
Processes 12 01980 g010
Figure 11. Monitoring point setup in the double-explosion source model.
Processes 12 01980 g011
Figure 12. Variation trend of time–pressure curves for the double-explosion source model.
Processes 12 01980 g012
Figure 13. Monitoring point setup in the three-explosion source model.
Processes 12 01980 g013
Figure 14. Variation trend of time–pressure curves for the three-explosion source model.
Processes 12 01980 g014
Figure 15. Contour plot of flame propagation for double-explosion sources with different intervals. (a) Interval of 5 m, (b) interval of 10 m, and (c) interval of 15 m.
Processes 12 01980 g015aProcesses 12 01980 g015b
Figure 16. Monitoring point setup.
Processes 12 01980 g016
Figure 17. Time–pressure curves of monitoring points with different intervals. (a) Interval of 5 m, (b) interval of 10 m, and (c) interval of 15 m.
Processes 12 01980 g017aProcesses 12 01980 g017b
Table 1. Boundary condition setup.
ParametersValue
EntranceWall
Exit pressure P (Pa)101,325
Wall roughness height L (m)0
Initial temperature T (°C)298 K
Volume fraction of CH4 in gas explosion zone p (%)9.5
Volume fraction of O2 in gas explosion zone p (%)21
Ignition energy E (j)0.1
Ignition time t (ms)1
Total duration t (ms)500
Table 2. Data comparison between simulation and experimental results.
TypesGas Accumulation Length (m)Peak Overpressure (MPa)Location of Peak Overpressure (m)Detonation Velocity (m/s)
Experiment50.499.8302
Simulation50.45210.1329
Error rate% 7.83.18.9
Table 3. Distribution of pressure extremes in key areas of the double-explosion source model.
PositionPressure Extremes (MPa)
Closed end0.681
Pressure overlap zone by explosion sources 1 and 20.581
Center of the explosion from explosion source 20.449
Center point of the tunnel0.426
Middle of the rear half of the tunnel0.406
Tunnel exit0.220
Table 4. Distribution of pressure extremes in key areas of the three-explosion source model.
PositionPressure Extremes (MPa)Note
Closed end0.681
Pressure overlap zone by explosion sources 1 and 20.649
Center of the explosion from explosion source 2 (Secondly formed pressure overlap zone)0.606The pressure extremes in the secondly formed pressure overlap zone is 0.548, with a time interval of 0.018 s from the initial peak pressure.
Pressure overlap zone by explosion sources 2 and 30.559
Middle of the rear half of the tunnel0.418
Tunnel exit0.233
Table 5. Conditions in the explosion pressure overlap zone under different intervals.
Interval (m)Overpressure in the Pressure Overlap Zone (MPa)Meeting PositionMeeting Time (ms)Velocity (m/s)
50.5836Middle of the explosion source interval zone7169
100.7077Middle of the explosion source interval zone15325
150.7137Middle of the explosion source interval zone18337
Disclaimer/Publisher’s Note: The statements, opinions and data contained in all publications are solely those of the individual author(s) and contributor(s) and not of MDPI and/or the editor(s). MDPI and/or the editor(s) disclaim responsibility for any injury to people or property resulting from any ideas, methods, instructions or products referred to in the content.

