At zero flow, the axial power of the axial flow pump is at its maximum. Therefore, the gate valve on the discharge pipeline must be opened before the pump starts to reduce the startup power. During the startup of the axial flow pump, the gate should not be in the closed position, as this would impose the maximum load on the pump. However, having a larger gate opening is not always better. As the gate pre-opening angle increases, the internal backflow rate during startup also increases, leading to decreased fluid stability within the pump. Therefore, it is necessary to choose an appropriate gate pre-opening angle.
3.2.1. Flow Rate, Torque Calculation, and Analysis
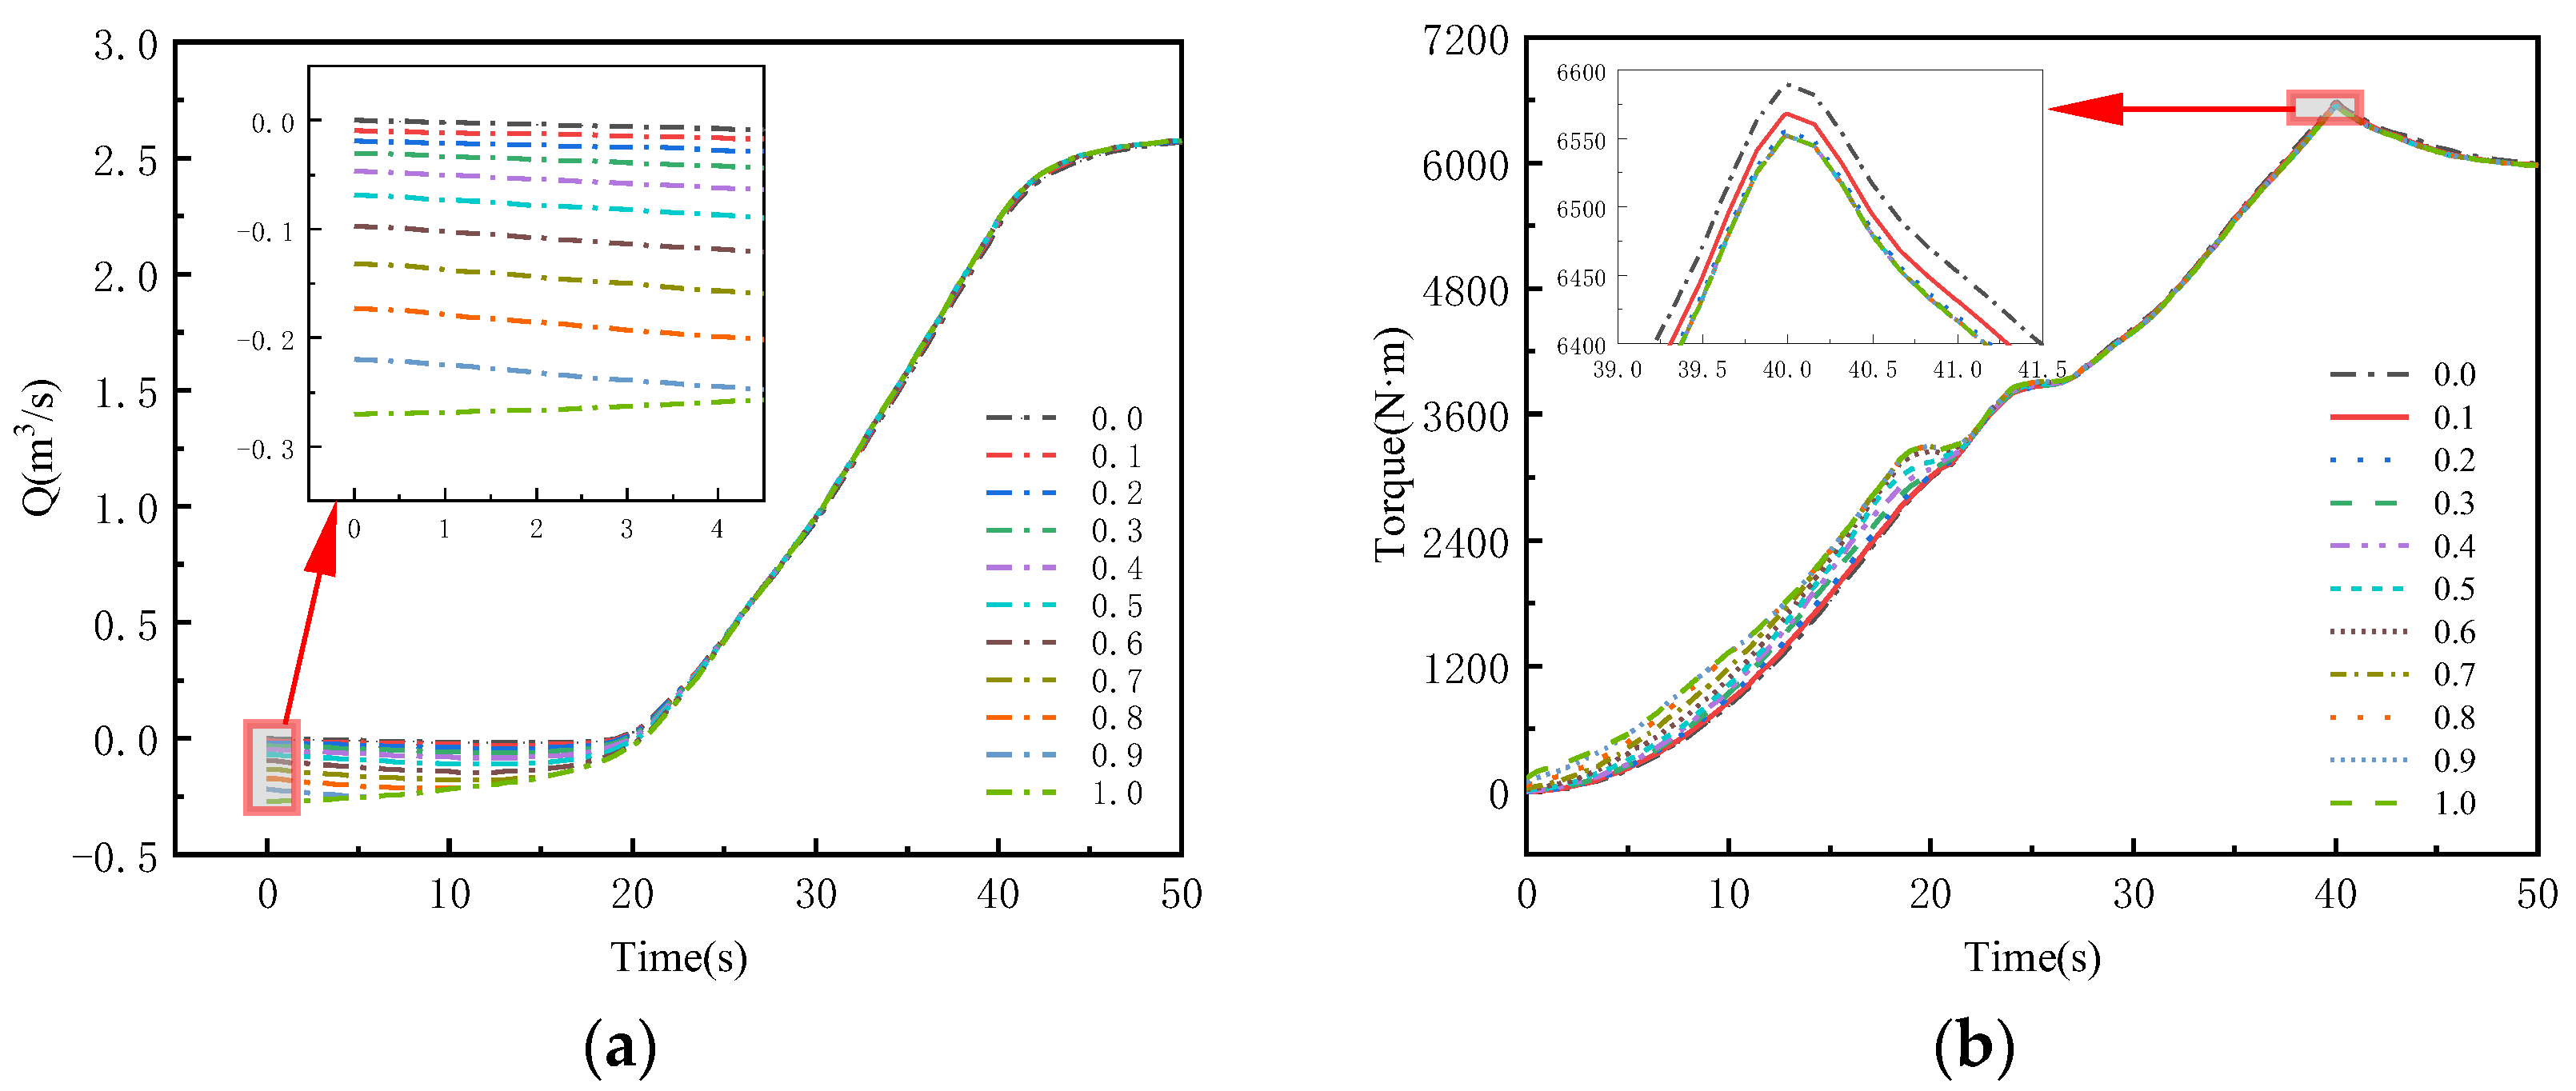
To investigate the effect of the gate pre-opening angle on the pump unit startup, the pump is started with different gate pre-opening angles. To ensure a single variable, the gate opening speed and pump startup time remain constant for each test with different pre-opening angles. In the study, a fully open gate is defined as 1, while a fully closed gate is defined as 0. The gate pre-opening angle is varied from fully closed to fully open, with each experiment conducted at an interval of a 0.1 opening angle. The numerical simulation results are shown in
Figure 6.
In
Figure 6a, it can be seen that as the gate pre-opening angle increases, the backflow rate of the pump gradually increases. When the gate is fully open and the pump is started, the maximum backflow rate in the pump reaches a peak of 0.2701 m
3/s, which is 10.98% of the design flow rate. At 20 s into the pump operation, the backflow situation disappears. However, the change in pump torque differs from the flow rate. As shown in
Figure 6b, the startup torque of the pump gradually decreases with an increasing gate pre-opening angle. When the pump reaches its rated speed, the torque inside the pump reaches its maximum value. This is consistent with what is described in Reference [
3], where the transient impact during pump startup reaches its peak at the rated speed. The maximum torque of the pump is observed when the gate pre-opening angle is 0, with a maximum torque of 6589.66 N·m, which is 92.41% of the calculated torque. (The torque in this calculation is derived using Equation
, where
P represents the motor power and
n denotes the rated speed of the pump.) The curves of the maximum backflow rate and maximum torque versus the gate pre-opening angle in the experiments are shown in
Figure 7.
In
Figure 7, it can be seen that when the gate pre-opening angle is 0.2, both the maximum torque and backflow rate during the pump startup are relatively small. The maximum torque is 6555.79 N·m, which is 91.94% of the calculated torque, and the maximum backflow rate is 0.0421 m
3/s, which is 1.71% of the design flow rate. After the gate opening angle reaches 0.3, with an increasing pre-opening angle, the maximum torque in the pump gradually stabilizes and is no longer influenced by the opening angle. The maximum torque remains around 6552 N·m, which is 91.88% of the calculated torque. When the gate pre-opening degree is 0.6, the backflow rate within the pump is 0.1449 m
3/s, which is 5.89% of the pump’s rated flow rate. Meanwhile, as the gate opening angle increases, the backflow rate in the pump shows a continuous growth trend. When the gate pre-opening angle is 1.0, the backflow rate reaches its maximum value of 0.2701 m
3/s, which is 10.98% of the design flow rate.
3.2.2. Axial Force, Efficiency Calculation, and Analysis
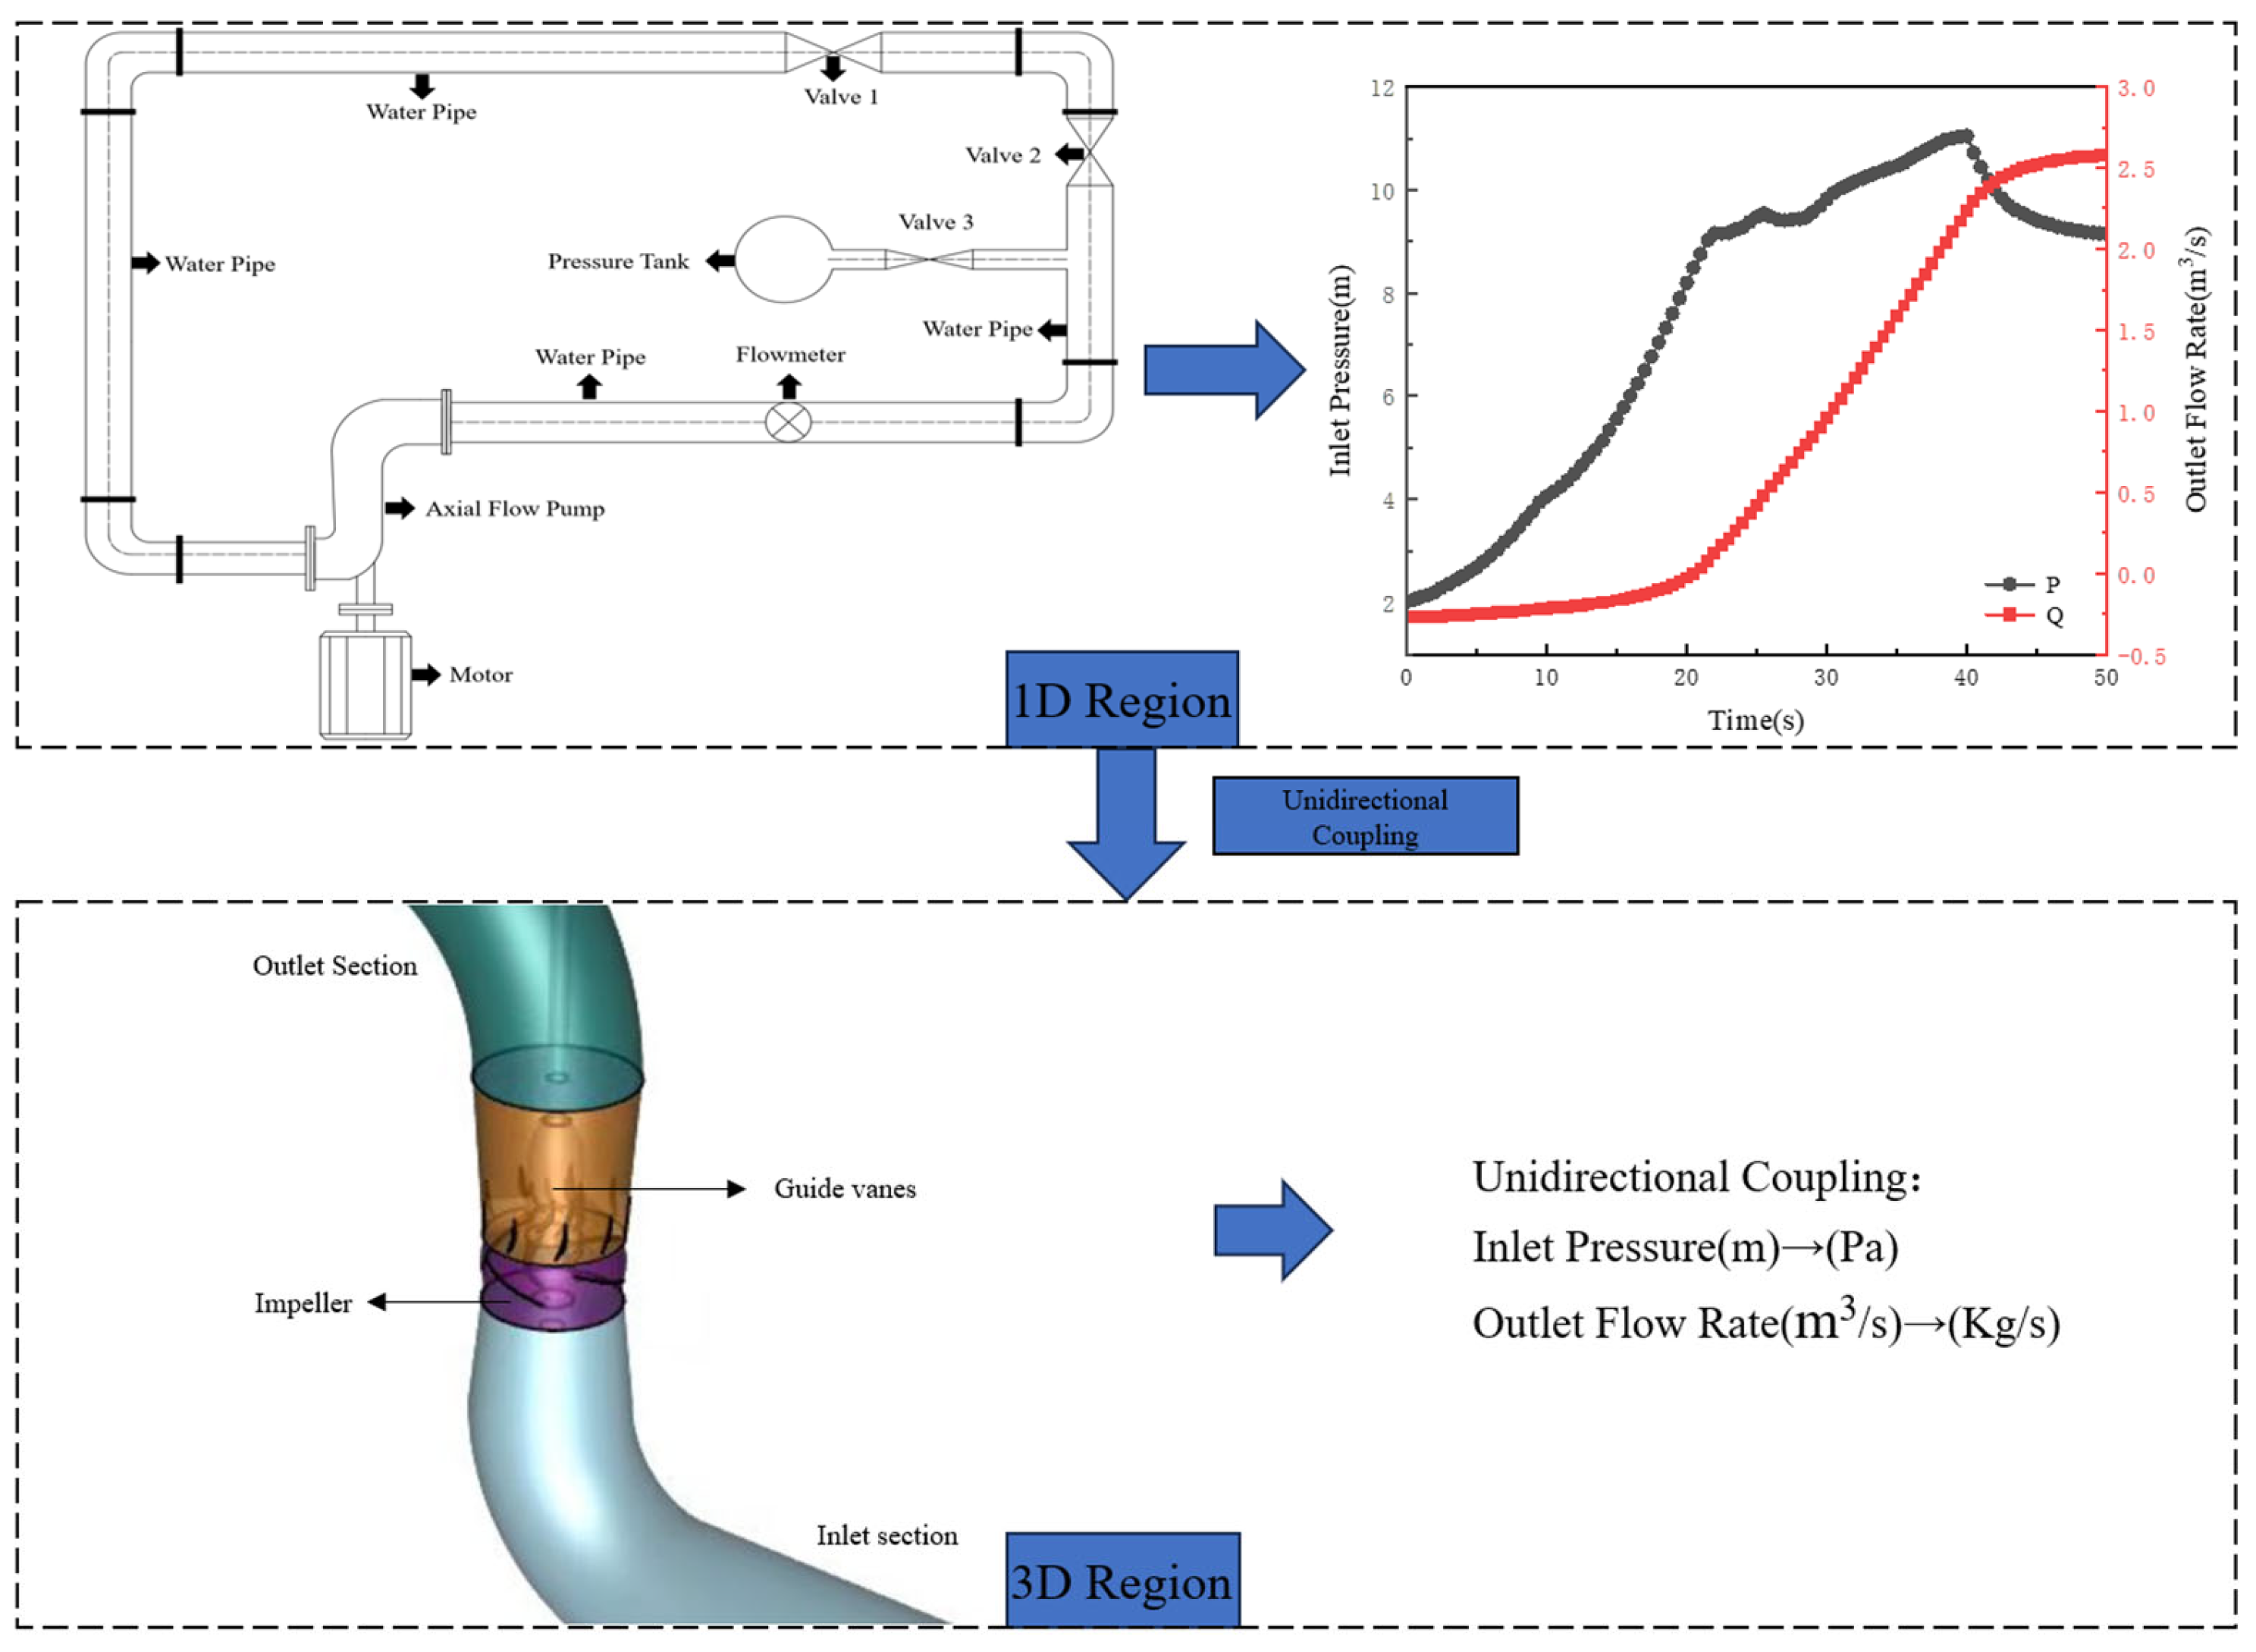
To further analyze the internal flow conditions of the axial flow pump during startup with different gate pre-opening angles, 1D-3D-coupled simulations were performed based on 1D simulations with gate pre-opening angles of 0.0, 0.2, 0.6, 0.8, and 1.0.
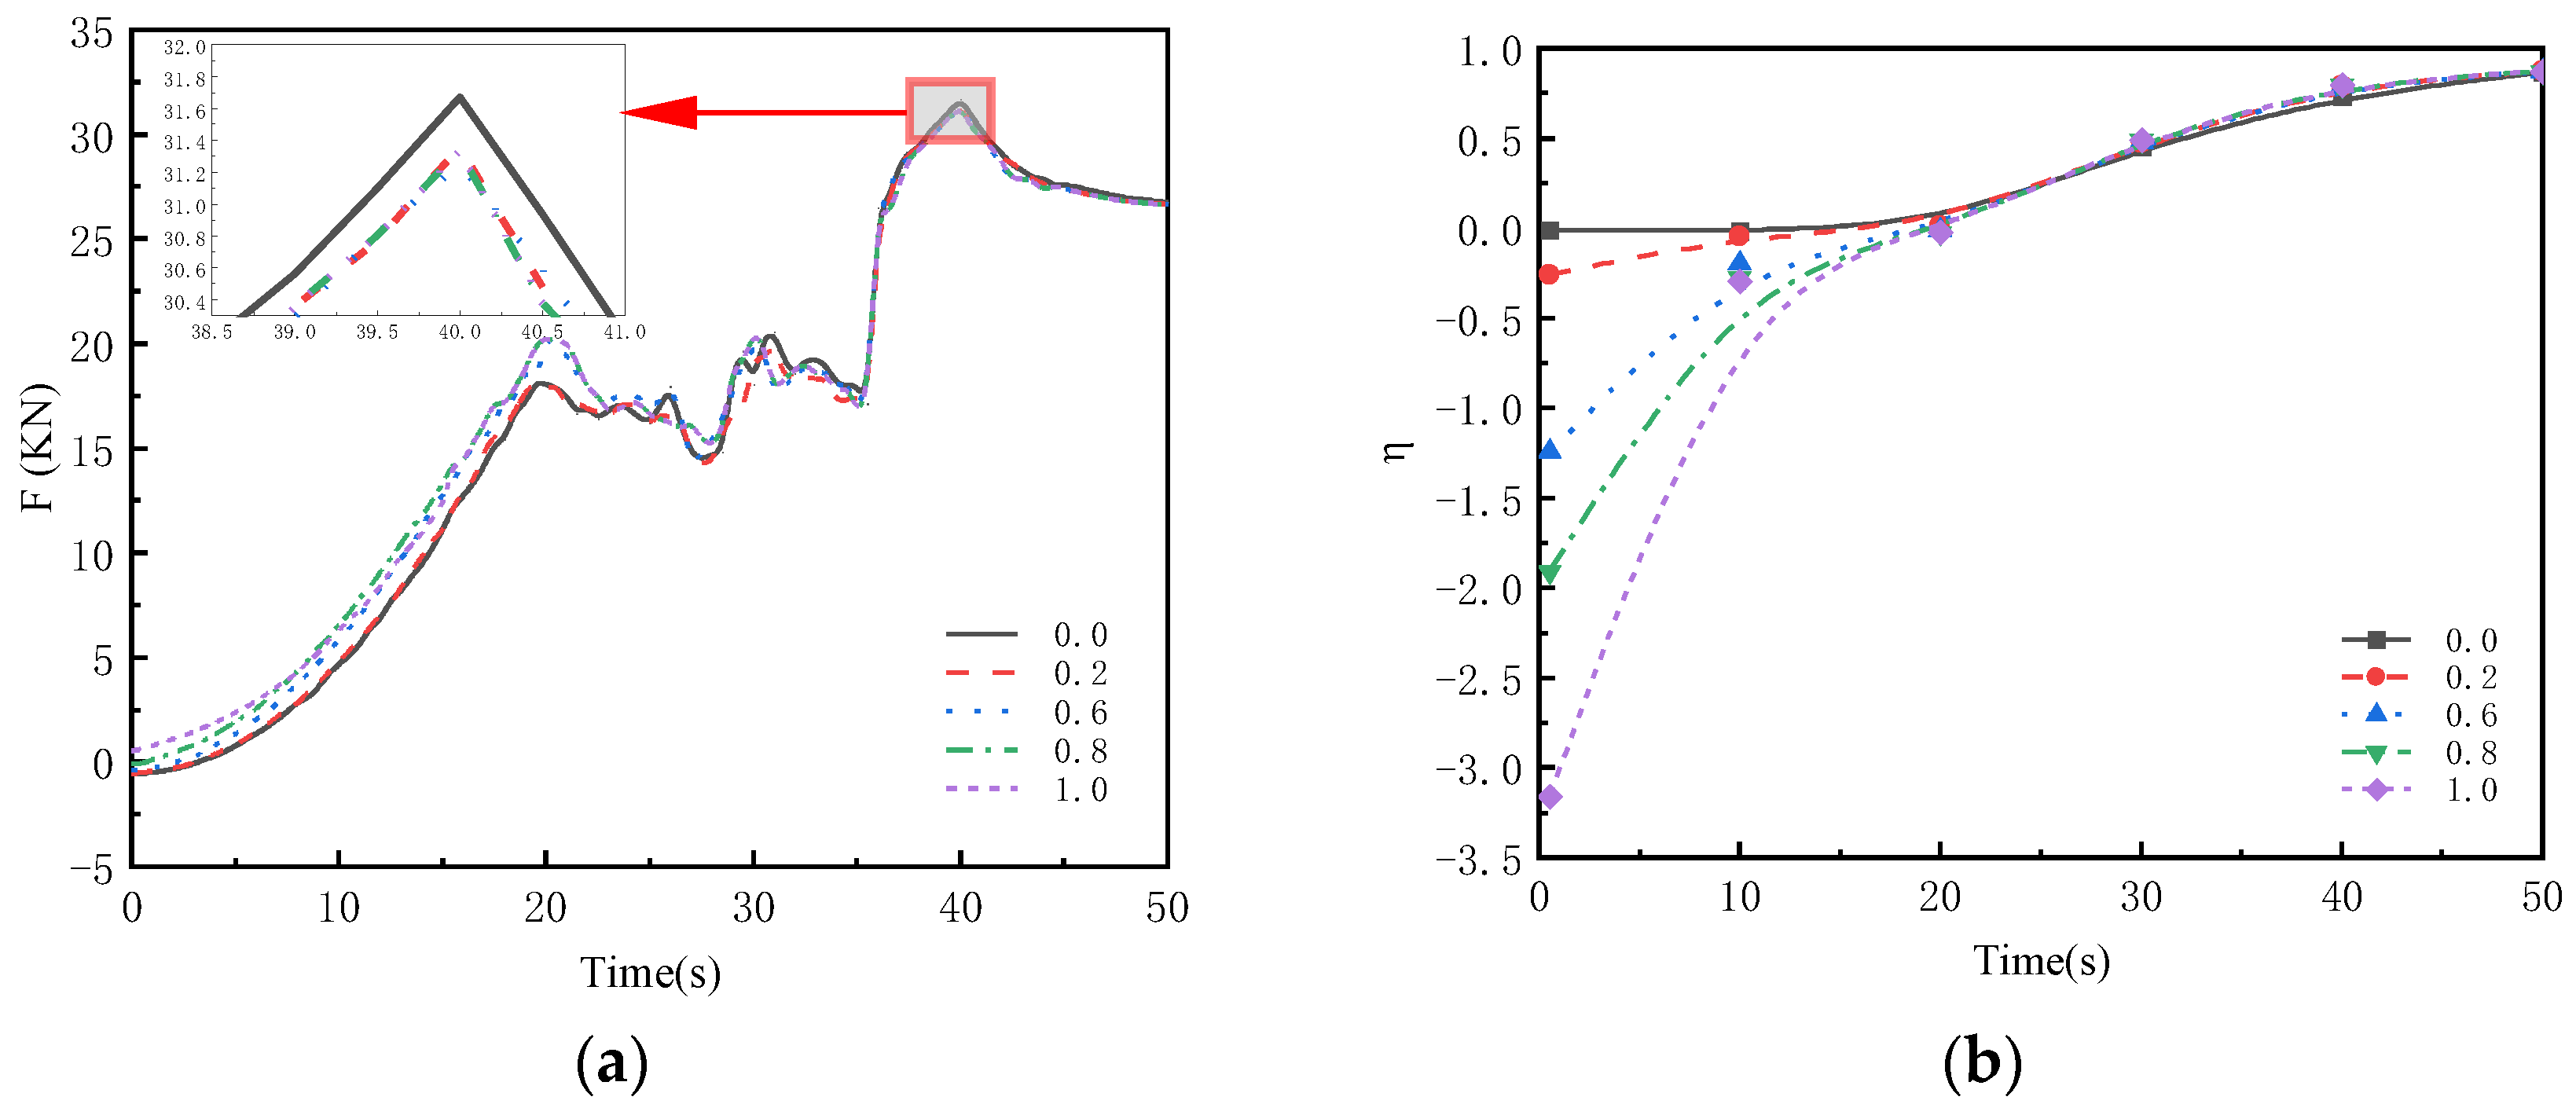
Figure 8 shows the axial force curves on the impeller blades of the axial flow pump and the efficiency curves of the pump for different gate pre-opening angles. The efficiency shown in the figure is based on the First Law of Thermodynamics. The calculation is performed using the following formula:
In the formula, M represents the torque, and represents the angular velocity of the pump.
From
Figure 8a, it can be observed that at 40 s, when the pump reaches its rated speed, the axial force generated by the impeller of the axial flow pump peaks. This is consistent with what is described in Reference [
3], where the transient impact during the pump startup reaches its peak at the rated speed. The maximum axial force occurs when the gate opening angle is 0, with a maximum axial force of 31.67 kN, which exceeds the axial force of 18.93% after the pump reaches stable operation.
Figure 8b shows that the pump efficiency is inversely proportional to the backflow rate within the pump. As the gate pre-opening angle increases, the backflow rate increases and the pump efficiency decreases. When the gate pre-opening angle is 1.0, the pump efficiency reaches its lowest point at 0.5 s after startup. At a pre-opening angle of 0, the initial efficiency of the pump during startup is 0.
3.2.3. Internal Flow Field Calculation and Analysis
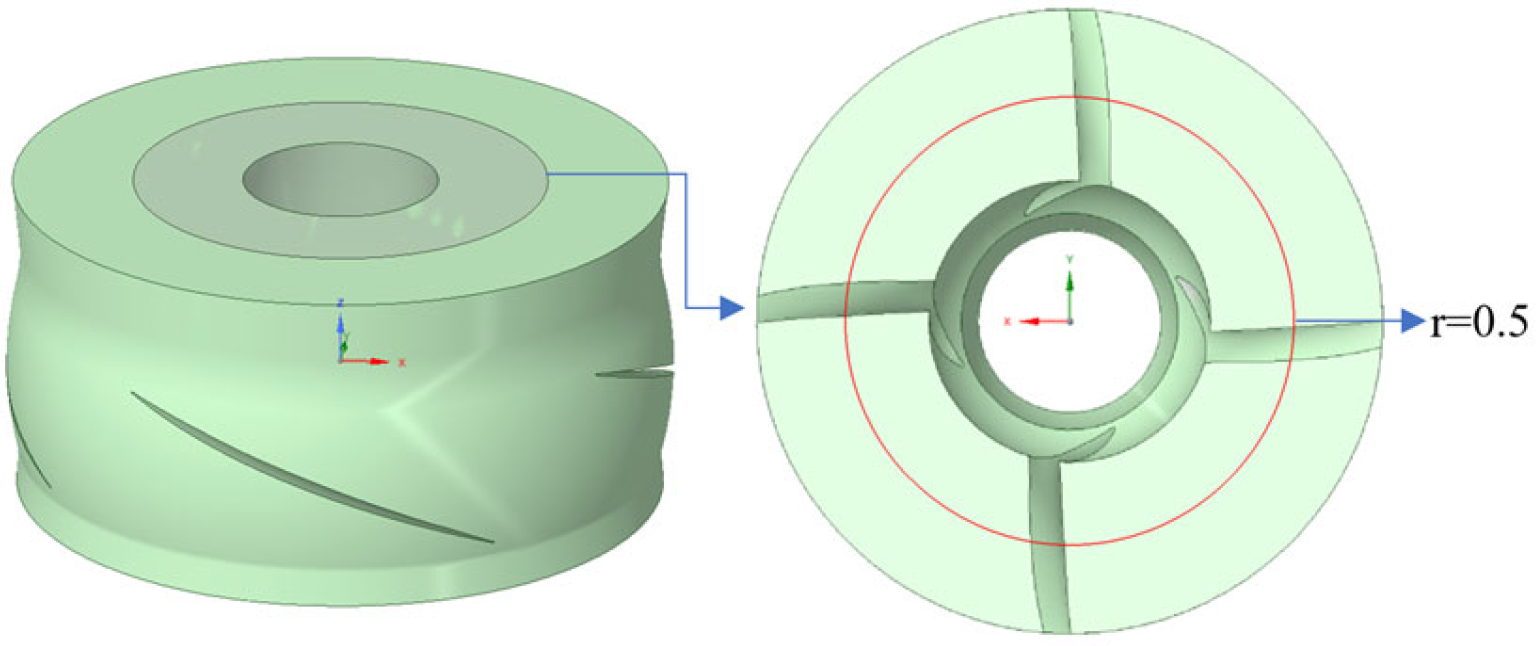
Based on this, further analysis of the internal characteristics of the impeller at a radial coefficient r = 0.5 during the startup process of the axial flow pump is conducted at 10 s, 20 s, 30 s, 40 s, and 50 s. The schematic diagram at the radial coefficient r = 0.5 is shown in
Figure 9.
Figure 10,
Figure 11 and
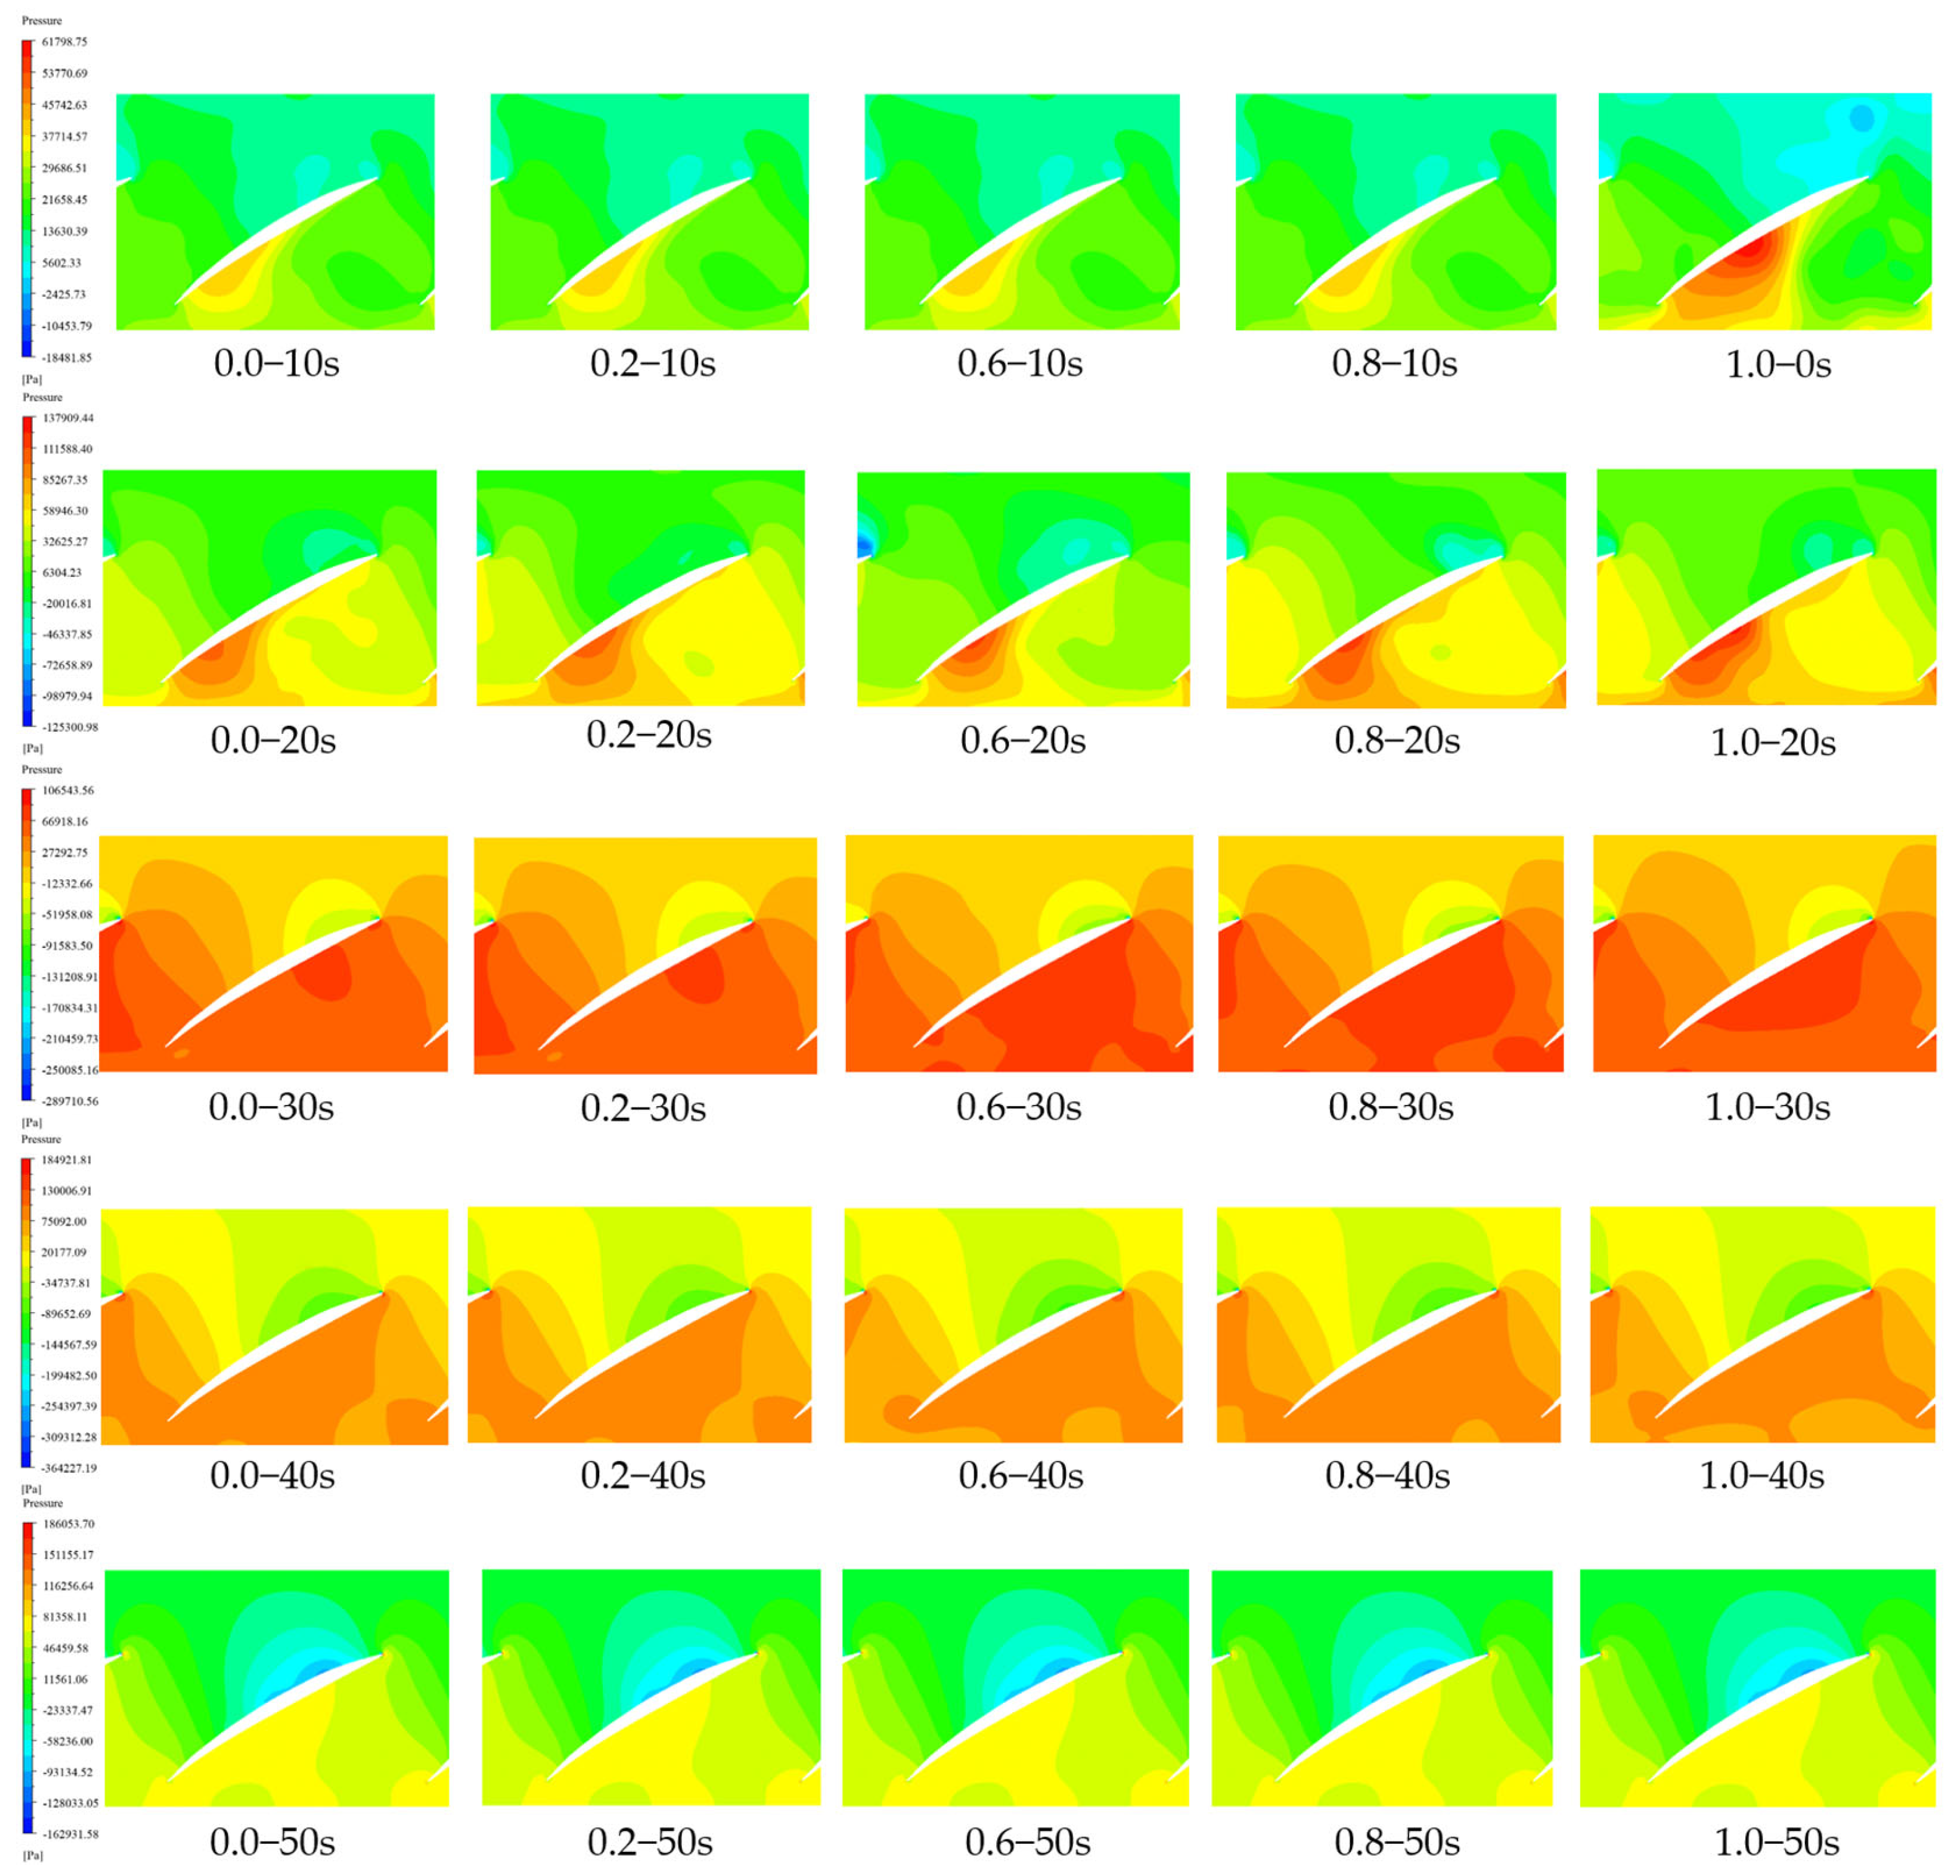
Figure 12 show the conditions at different times, with 0.0–10 s representing the pump running from 0 to 10 s with a gate pre-opening angle of 0.
Figure 10 and
Table 2 and
Table 3 show the pressure contour maps of the axial flow pump impeller at a radial coefficient r = 0.5 and the corresponding maximum and minimum values of positive and negative pressure. From these figures and tables, it can be observed that the low-pressure zone is mainly concentrated at the blade tip and the inlet of the impeller. During the first 20 s of pump startup, the pressure peak is found under conditions of large gate opening (gate pre-opening angles of 0.8 and 1.0). When the pump reaches its rated speed, the maximum pressure occurs with a gate pre-opening angle of 0, with a maximum dimensionless pressure of 0.8520, followed by a pre-opening angle of 0.6, where the dimensionless pressure peak reaches 0.8378. As the pump startup reaches its rated speed, the high-pressure zone inside the impeller gradually increases. When the pump reaches its rated speed (at 40 s), the pressure distribution inside the impeller becomes uniform. When all the pump valves are fully open (At 50 s), the maximum pressure inside the pump starts to stabilize after the gate pre-opening angle reaches 0.6. At pre-opening angles of 0.8 and 1.0, the peak values of positive and negative pressures inside the pump become equal.
Let x be the gate pre-opening angle, y be the running time, a be the non-dimensionalized positive pressure, and b be the non-dimensionalized negative pressure. The function relationship of pressure as a function of x and y is obtained through fitting.
Positive Pressure: Correlation coefficient of 0.99.
Negative Pressure: Correlation coefficient of 0.99.
In the formula
,
represents the running time in seconds (s). The pressure is expressed in a dimensionless form, as follows:
In the formula, P represents the maximum instantaneous pressure at that location, in Pascals (Pa). The internal fluid is water, with a density of . Based on the fitted relationship, the maximum pressure at the cross-section with a radial impeller coefficient of r = 0.5 under different operating conditions can be obtained.
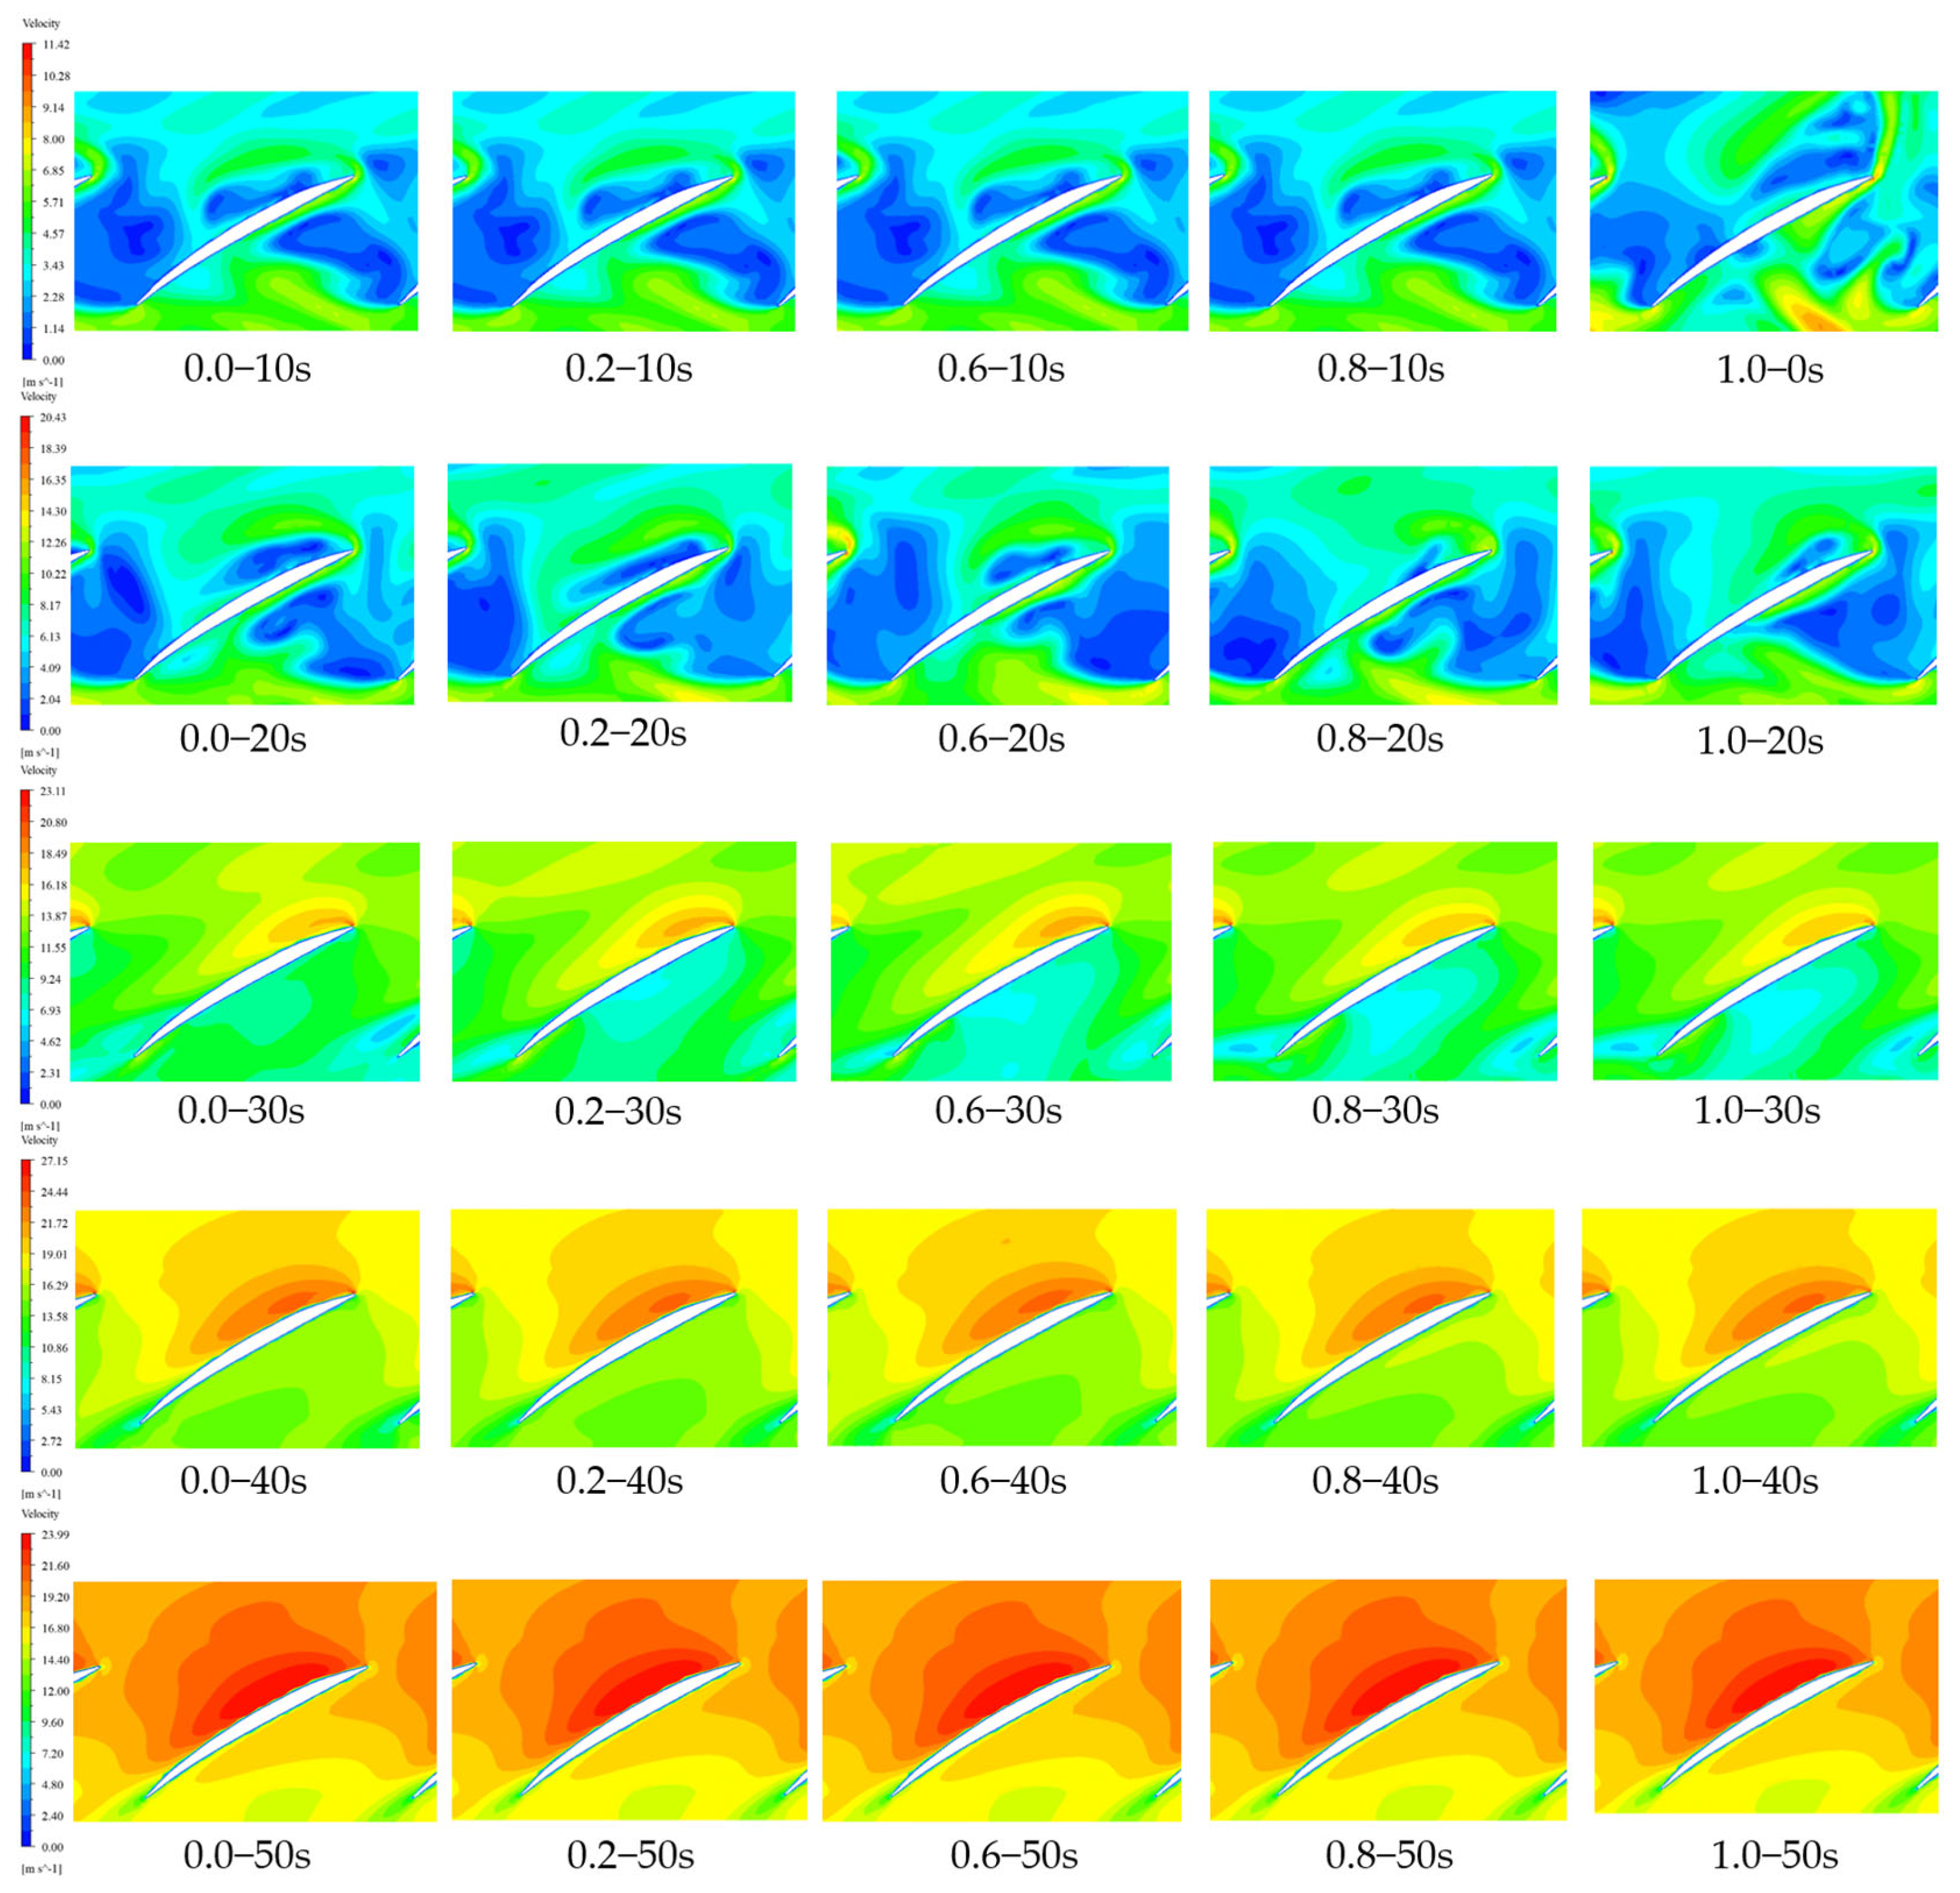
Figure 11 and
Table 4 show the velocity contour map and the corresponding velocity extremes at the radial coefficient r = 0.5 for the axial flow pump impeller. From the figures and table, it can be observed that the high-speed zone of the fluid is concentrated at the blade tip and the inlet of the impeller. During the initial startup of the pump, as the gate pre-opening angle increases, the fluid velocity distribution inside the pump becomes increasingly uneven. This indicates that the flow inside the pump becomes progressively turbulent with an increasing gate pre-opening angle, which is due to the increased internal recirculation. When the pump is started with the valve closed and reaches the rated speed at 40 s, the maximum flow speed is 27.15 m/s, which is 1.22% of the outlet speed. For a gate opening angle of 0.6, the maximum speed at 40 s is 27.11 m/s, which is 1.37% of the outlet speed. At gate pre-opening angles of 0.8 and 1.0, the maximum speed inside the pump at rated speed is 26.78 m/s, which is a decrease of approximately 1.38% compared to the closed valve start. After reaching stable operation, the flow speed is reduced to 23.99 m/s, which is 12.71% of the outlet speed, a decrease of about 13.15% compared to the maximum flow speed at the closed valve start. At this point, the speed distribution inside the pump is more uniform compared to the distribution before reaching the rated speed, with a clearer boundary between high-speed and low-speed zones.
Let x be the gate pre-opening angle, y be the running time, and c be the non-dimensionalized velocity. The function relationship of velocity as a function of x and y is obtained through fitting.
Velocity: Correlation coefficient of 0.97.
In the formula,
y and
are as defined previously. The velocity is expressed in a dimensionless form, as follows:
In the formula, u represents the maximum instantaneous velocity at the cross-section with a radial impeller coefficient of r = 0.5 under any operating condition in the model. Based on the fitted relationship, the maximum velocity at the cross-section with a radial impeller coefficient of r = 0.5 under other operating conditions can be obtained.
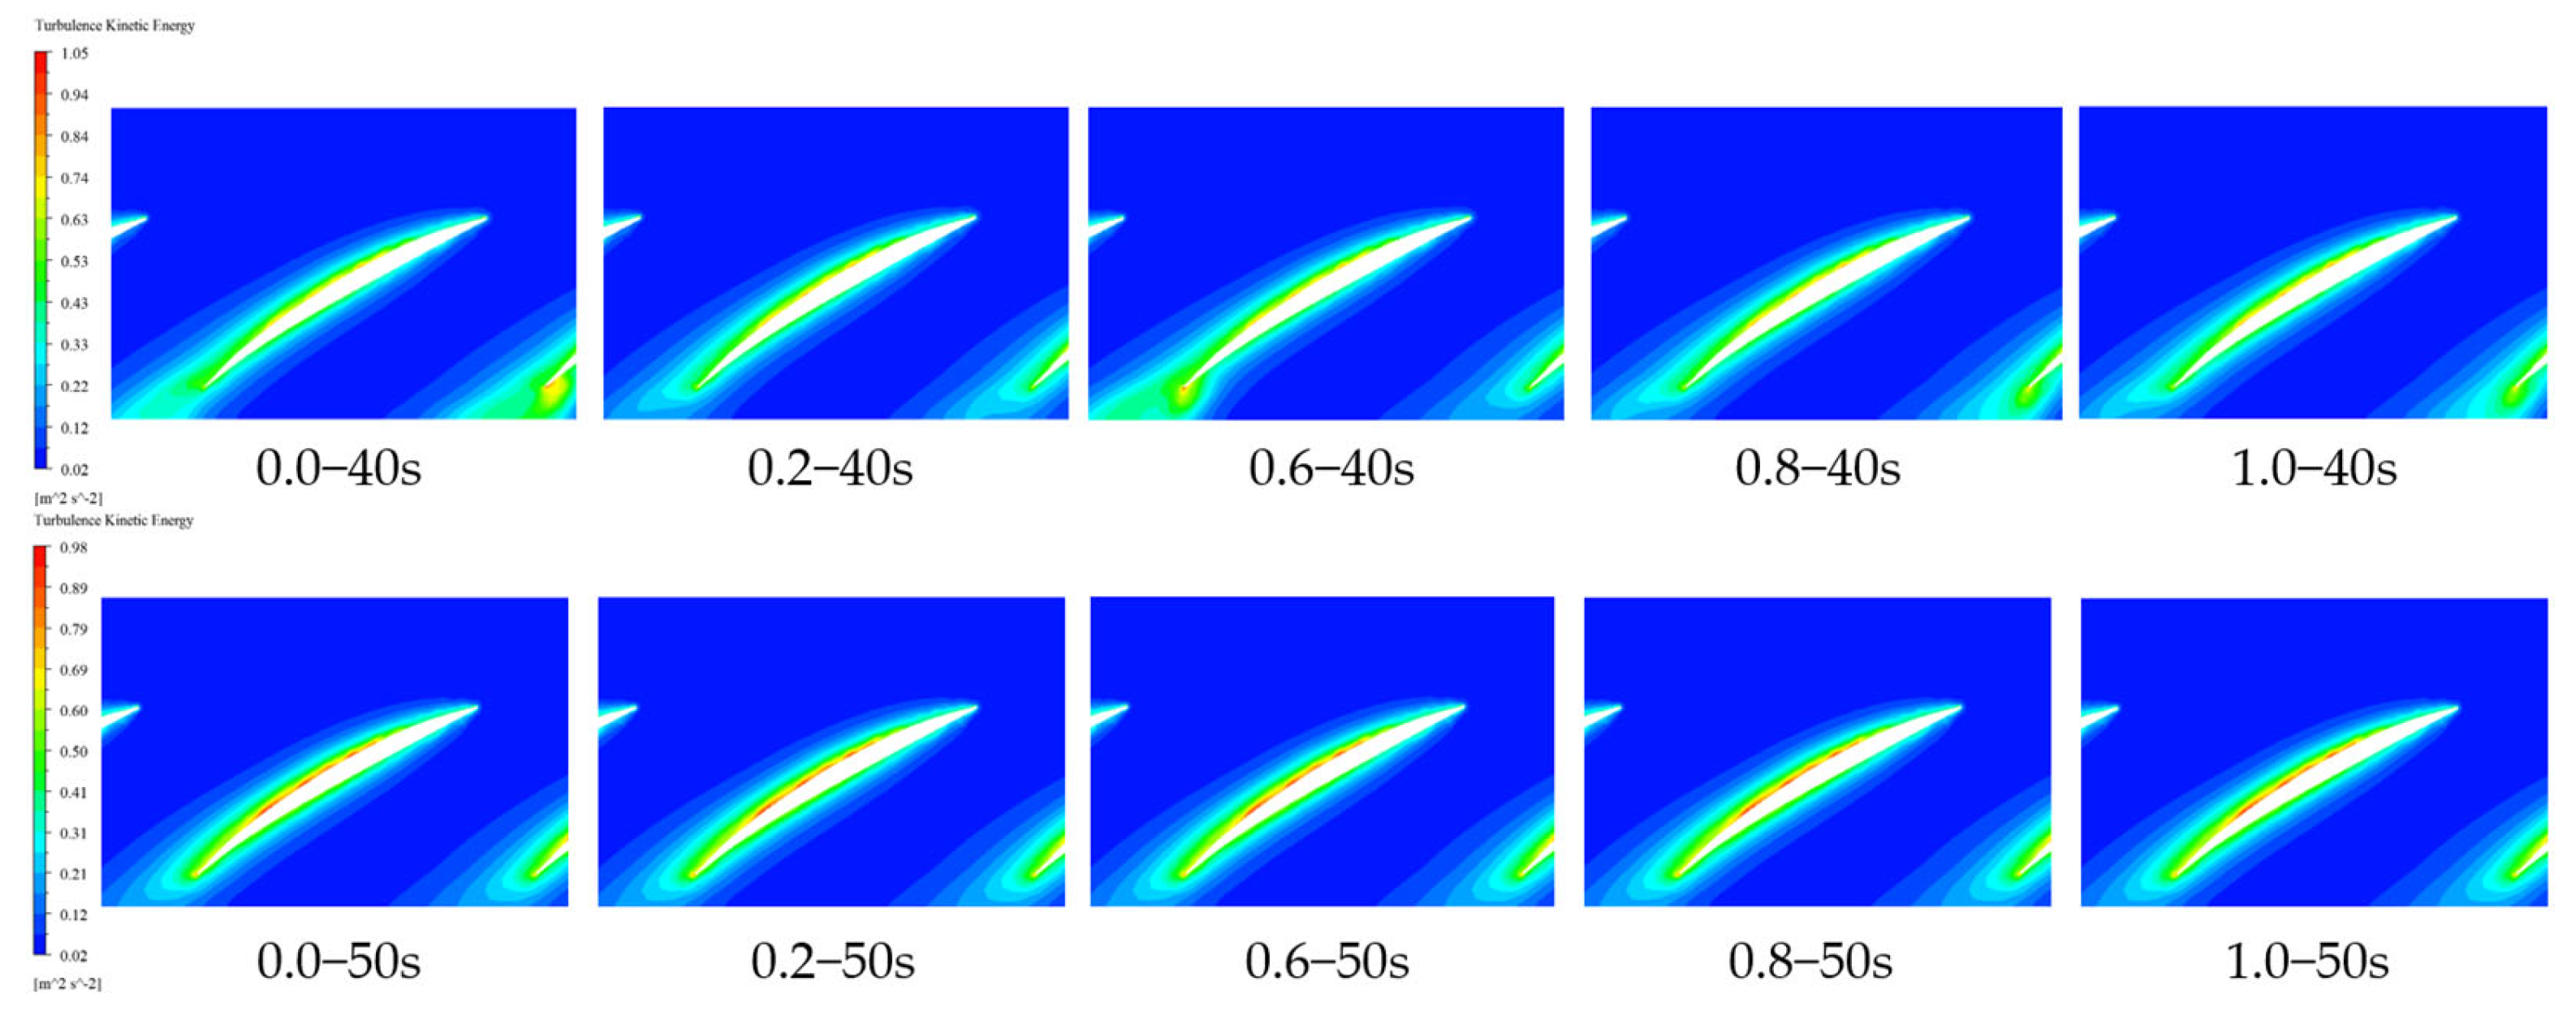
Figure 12 and
Table 5 show the turbulence kinetic energy contour map and the corresponding turbulence kinetic energy extremes at the radial coefficient r = 0.5 for the axial flow pump impeller. From the figures and table, it can be observed that within the first 20 s of pump startup, the turbulence kinetic energy distribution inside the pump is uneven, with vortices forming at the blade tips. During this period, the fluid stability inside the pump is relatively poor. At 20 s into the startup, as the gate opening angle increases, the turbulence kinetic energy also increases. The maximum turbulence kinetic energy occurs with a gate pre-opening angle of 0.2, reaching 2.0214 m
2/s
2. At a gate pre-opening angle of 0.8, the maximum turbulence kinetic energy is 1.5897 m
2/s
2, which is a 27.16% decrease compared to the 0.2 opening. With a gate pre-opening angle of 1.0, the fluid stability inside the pump is relatively poor throughout the startup process, with a 6.88% increase in turbulence kinetic energy compared to the 0.8 opening. After 30 s of startup, the turbulence kinetic energy distribution inside the pump becomes more uniform, with a smooth streamline from the impeller inlet to the outlet, indicating improved fluid stability.
Let x be the gate pre-opening angle, y be the running time, and d be the turbulence kinetic energy. The function relationship of turbulence kinetic energy as a function of x and y is obtained through fitting.
Turbulence kinetic energy: Correlation coefficient of 0.98.
Based on the fitted relationship, the maximum turbulent kinetic energy at the cross-section with a radial impeller coefficient of r = 0.5 under other operating conditions can be obtained.
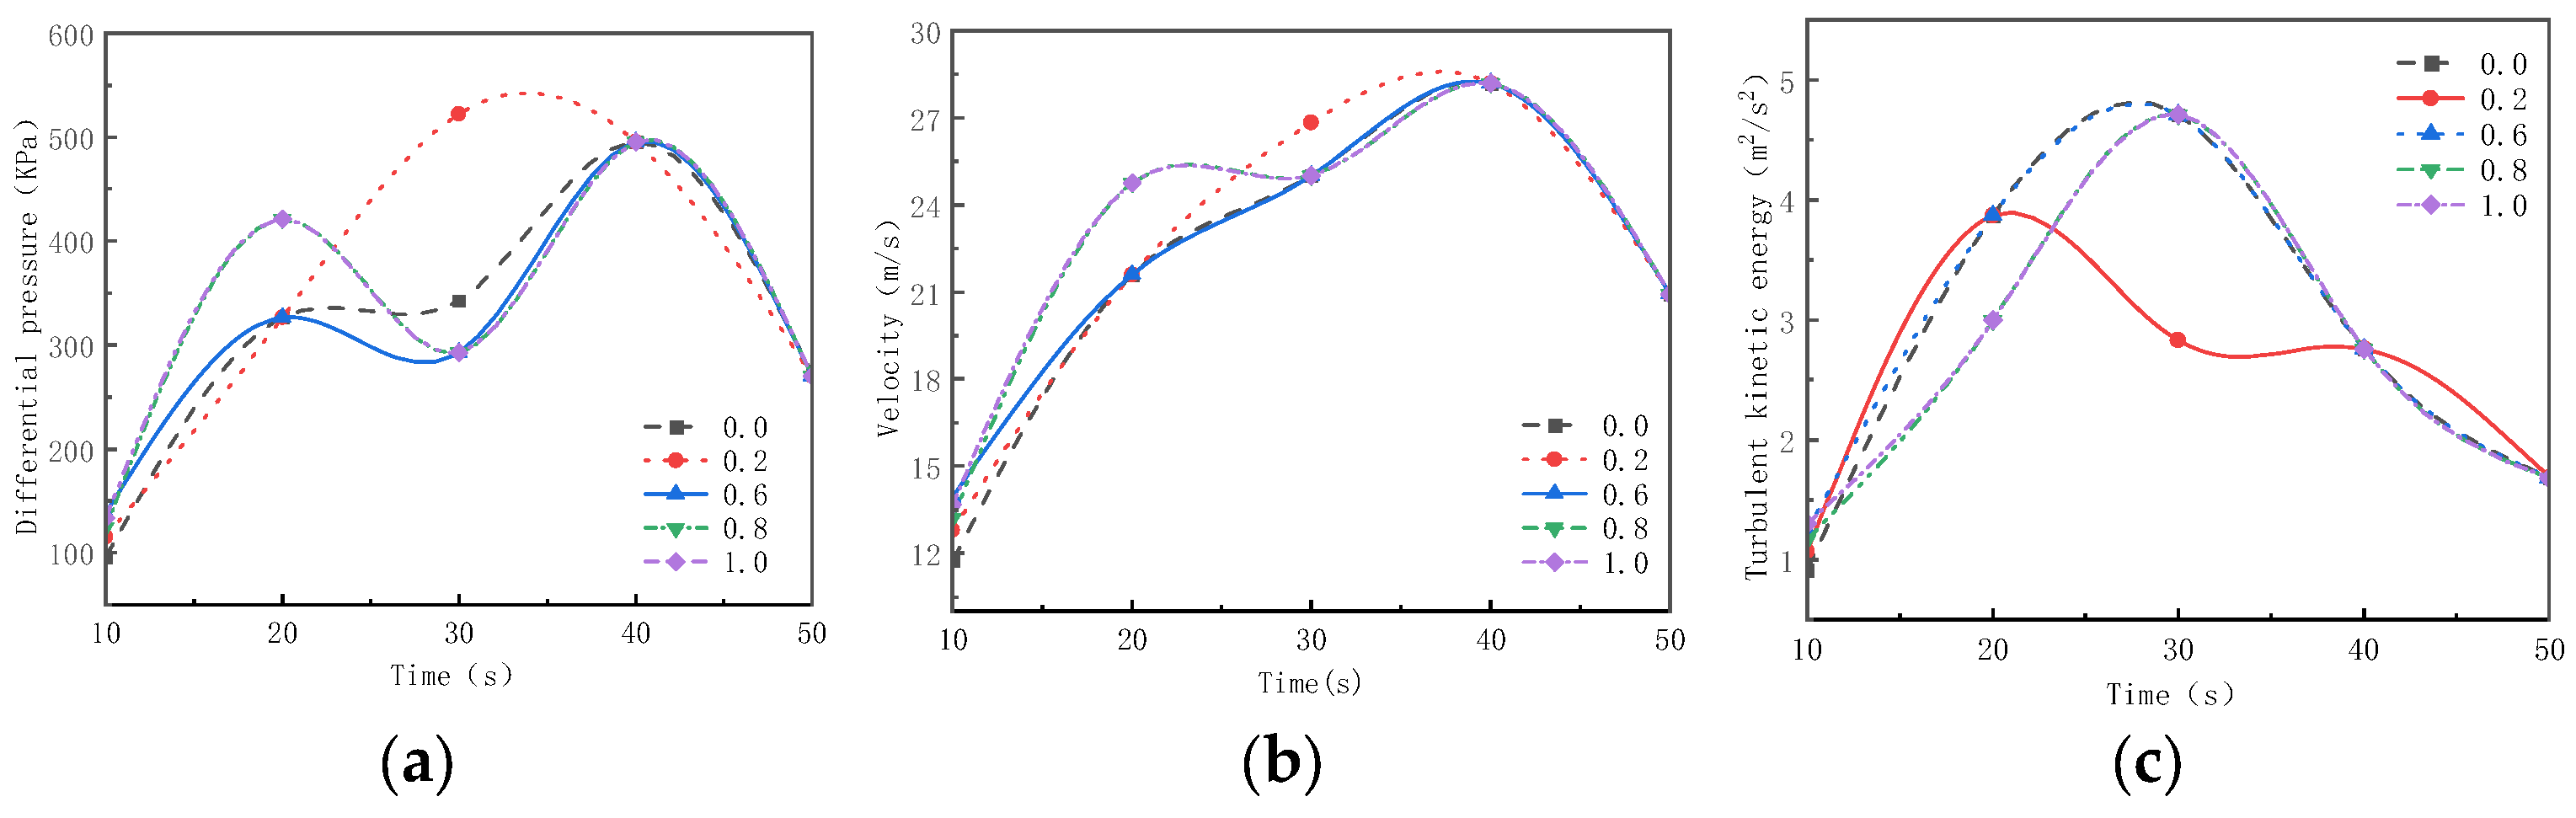
Figure 13 shows the variation curves of the maximum pressure difference, velocity, and turbulent kinetic energy at r = 0.5 of the impeller under different gate pre-opening degrees during pump startup at 10 s, 20 s, 30 s, 40 s, and 50 s. By examining the contour plots in
Figure 11,
Figure 12 and
Figure 13, it can be observed that when the pump starts with a gate pre-opening degree of 0.6, the internal pressure difference is minimized, which is beneficial in reducing the forces on the impeller. In the early stage of pump startup (within the first 20 s), the internal pressure difference is the highest when the gate pre-opening degree is 0.8 and 1.0, being 28.96% higher than at 0.6. As shown in the backflow variation curve in
Figure 6a, backflow occurs within the pump during the first 20 s, with the highest backflow occurring at gate pre-opening degrees of 0.8 and 1.0, resulting in the maximum internal pressure difference and poor flow stability. The velocity variation follows a similar pattern as the pressure difference, with the maximum velocity occurring at 0.8 and 1.0 degrees in the first 20 s, being 14.62% higher than at 0.6. The higher pressure difference leads to an increase in flow velocity, contributing to poor fluid stability within the pump. Turbulent kinetic energy fluctuations are most noticeable when the pump is started with a gate pre-opening degree of 0.2. In summary, when the pump is started with a gate pre-opening degree of 0.6, the internal flow conditions are relatively better.


