
Damage Evaluation of Unconsolidated Sandstone Particle Migration Reservoir Based on Well–Seismic Combination

 ,
,
Abstract
:1. Introduction
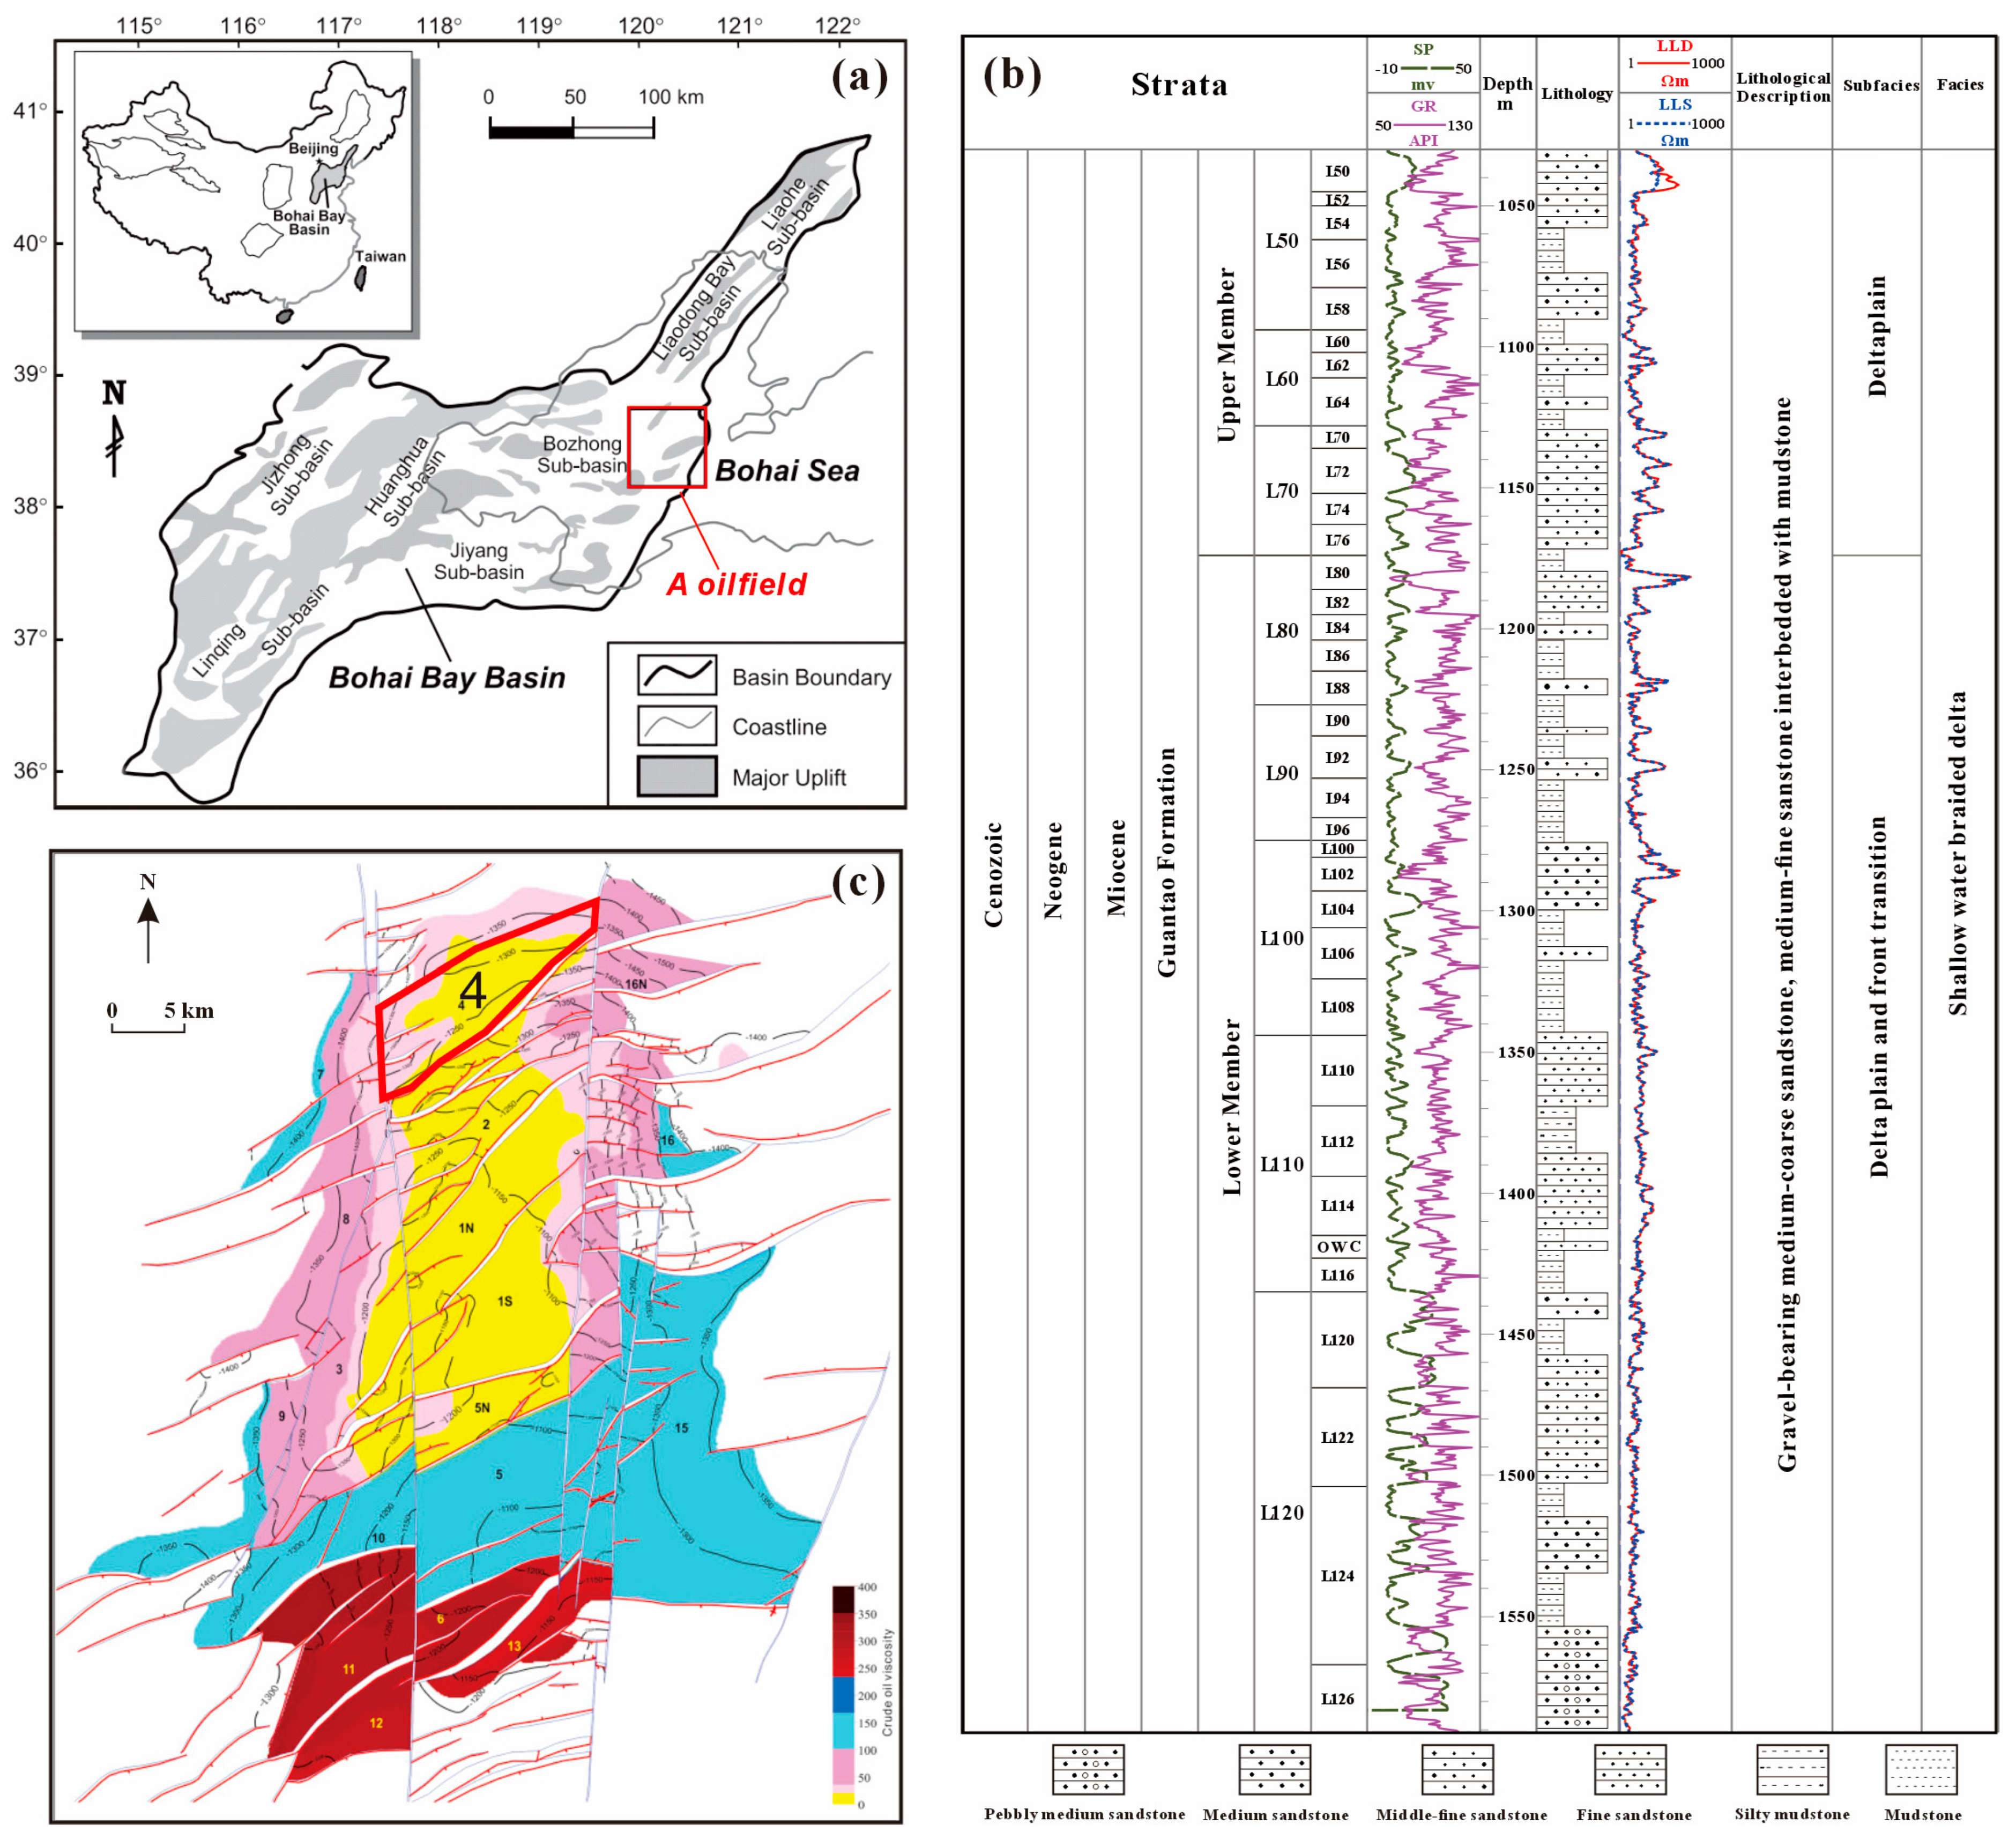
2. Geological Background
3. Samples and Methodology
3.1. Experimental Samples
- The core was displaced with formation water. Then, the core was dried and the permeability () of the core was measured.
- The natural core was saturated with the simulated formation water and soaked for more than 24 h.
- The saturated natural core sample was placed into the core holder and the confining pressure was set to 2.0 MPa.
- Formation water was injected into the core at the following flow rates: 0.25 mL/min, 0.5 mL/min, 1 mL/min, 1.5 mL/min, 2 mL/min, 3 mL/min, 4 mL/min, 6 mL/min, 8 mL/min, 10 mL/min, or 12 mL/min.
- The core permeability (n = 1, 2, 3, 4…) was identified for different displacement velocities. The degree of permeability damage was calculated as shown in Equation (1).
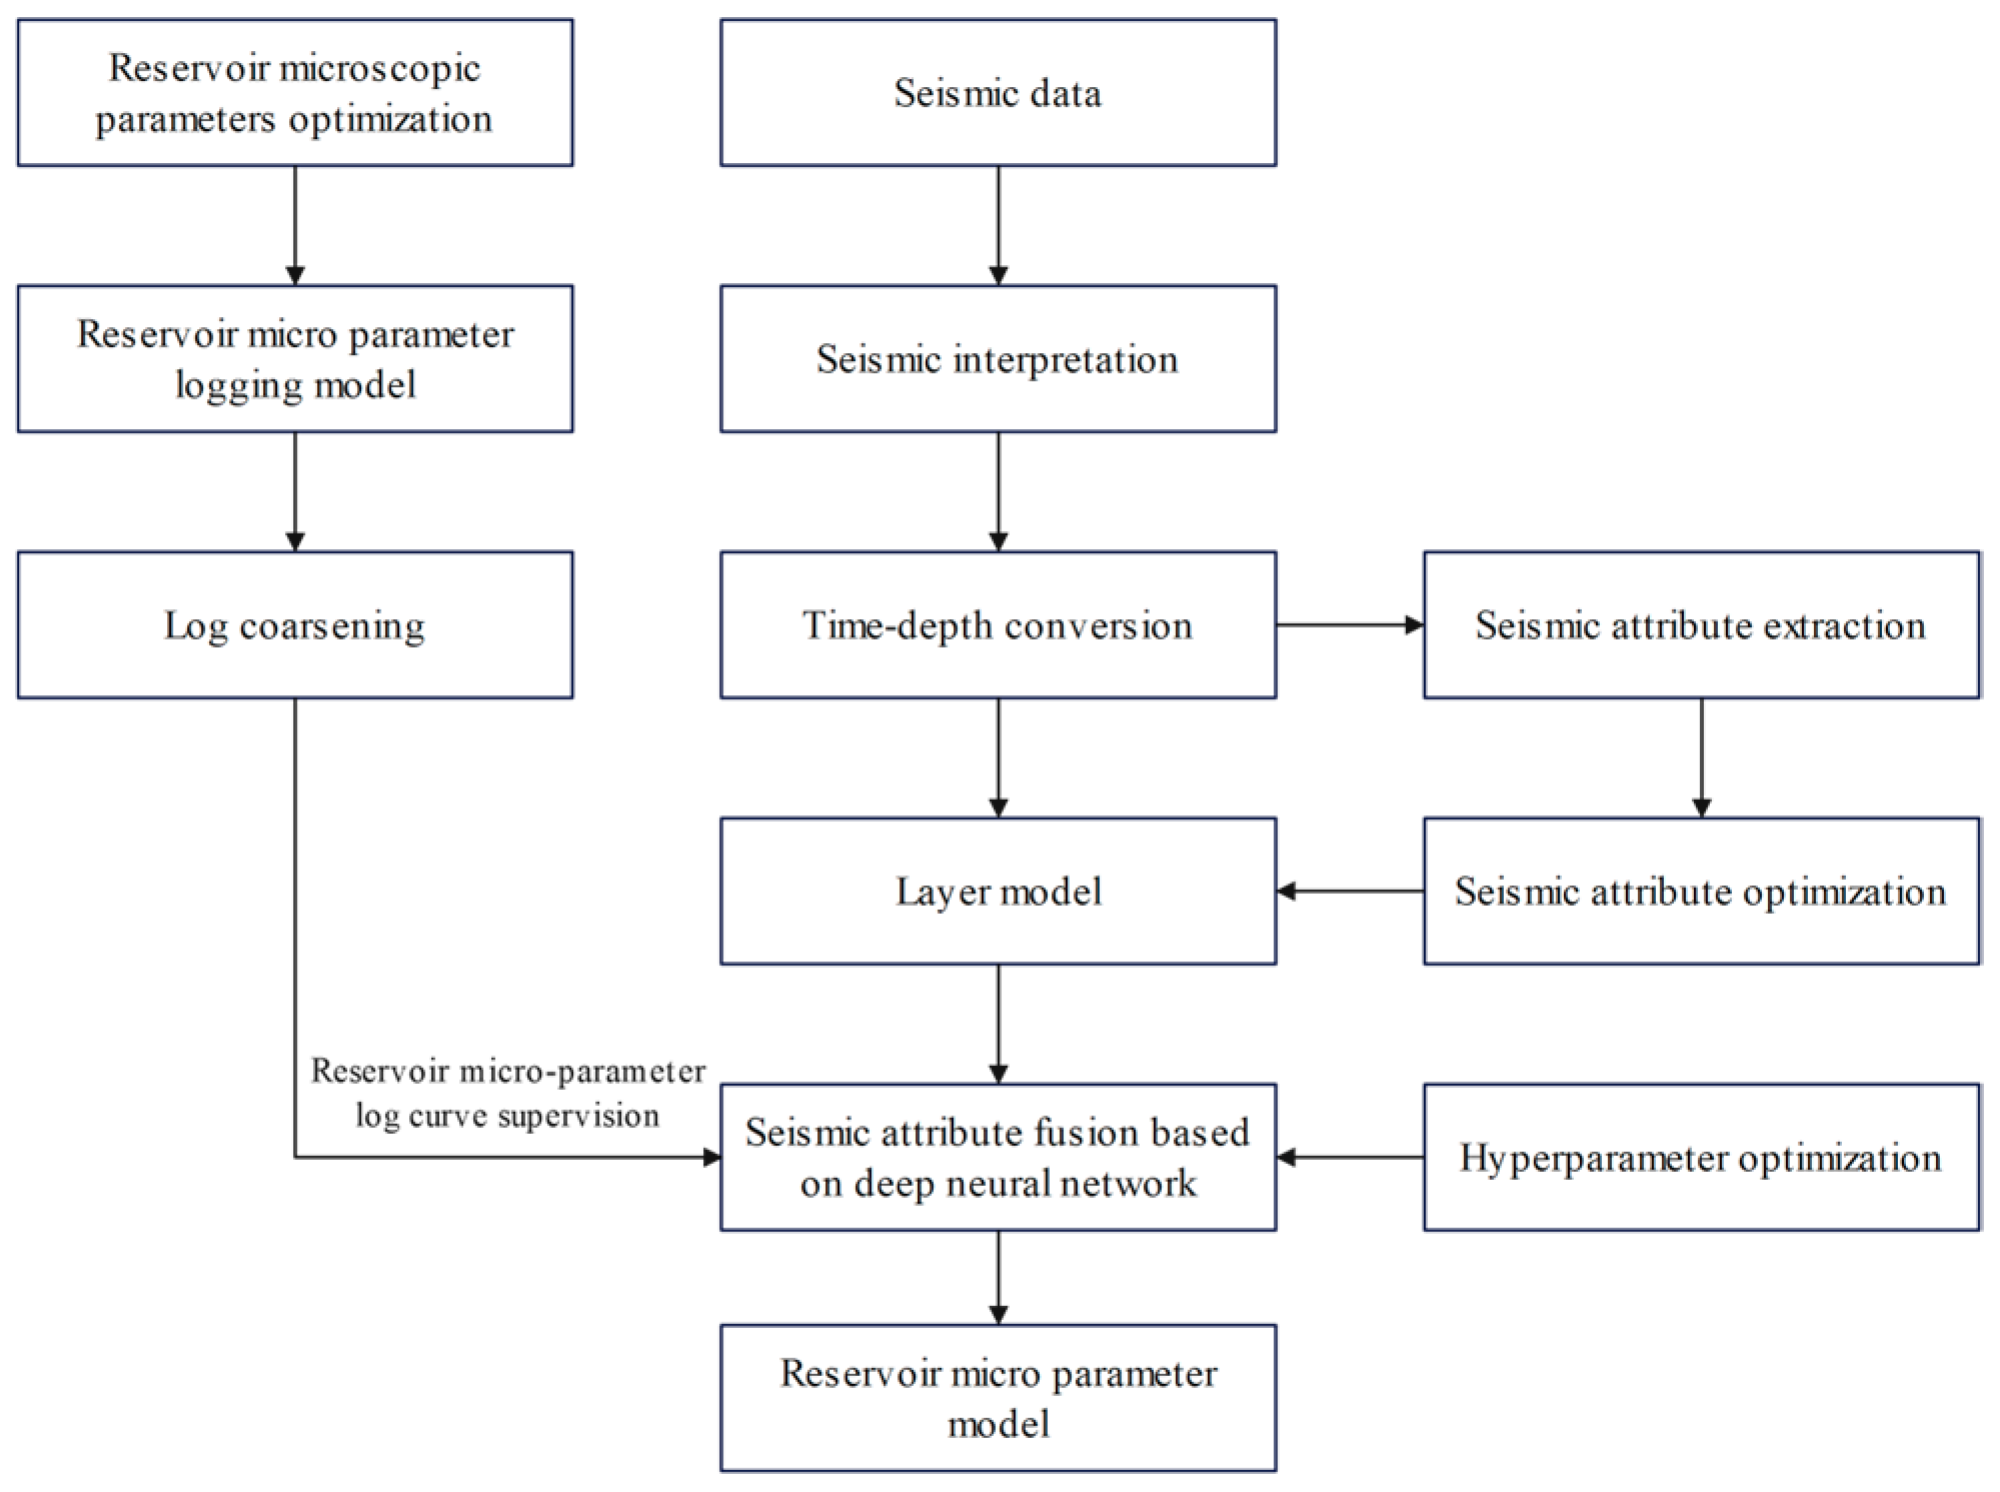
3.2. Seismic Attribute Fusion
3.3. Deep Neural Network
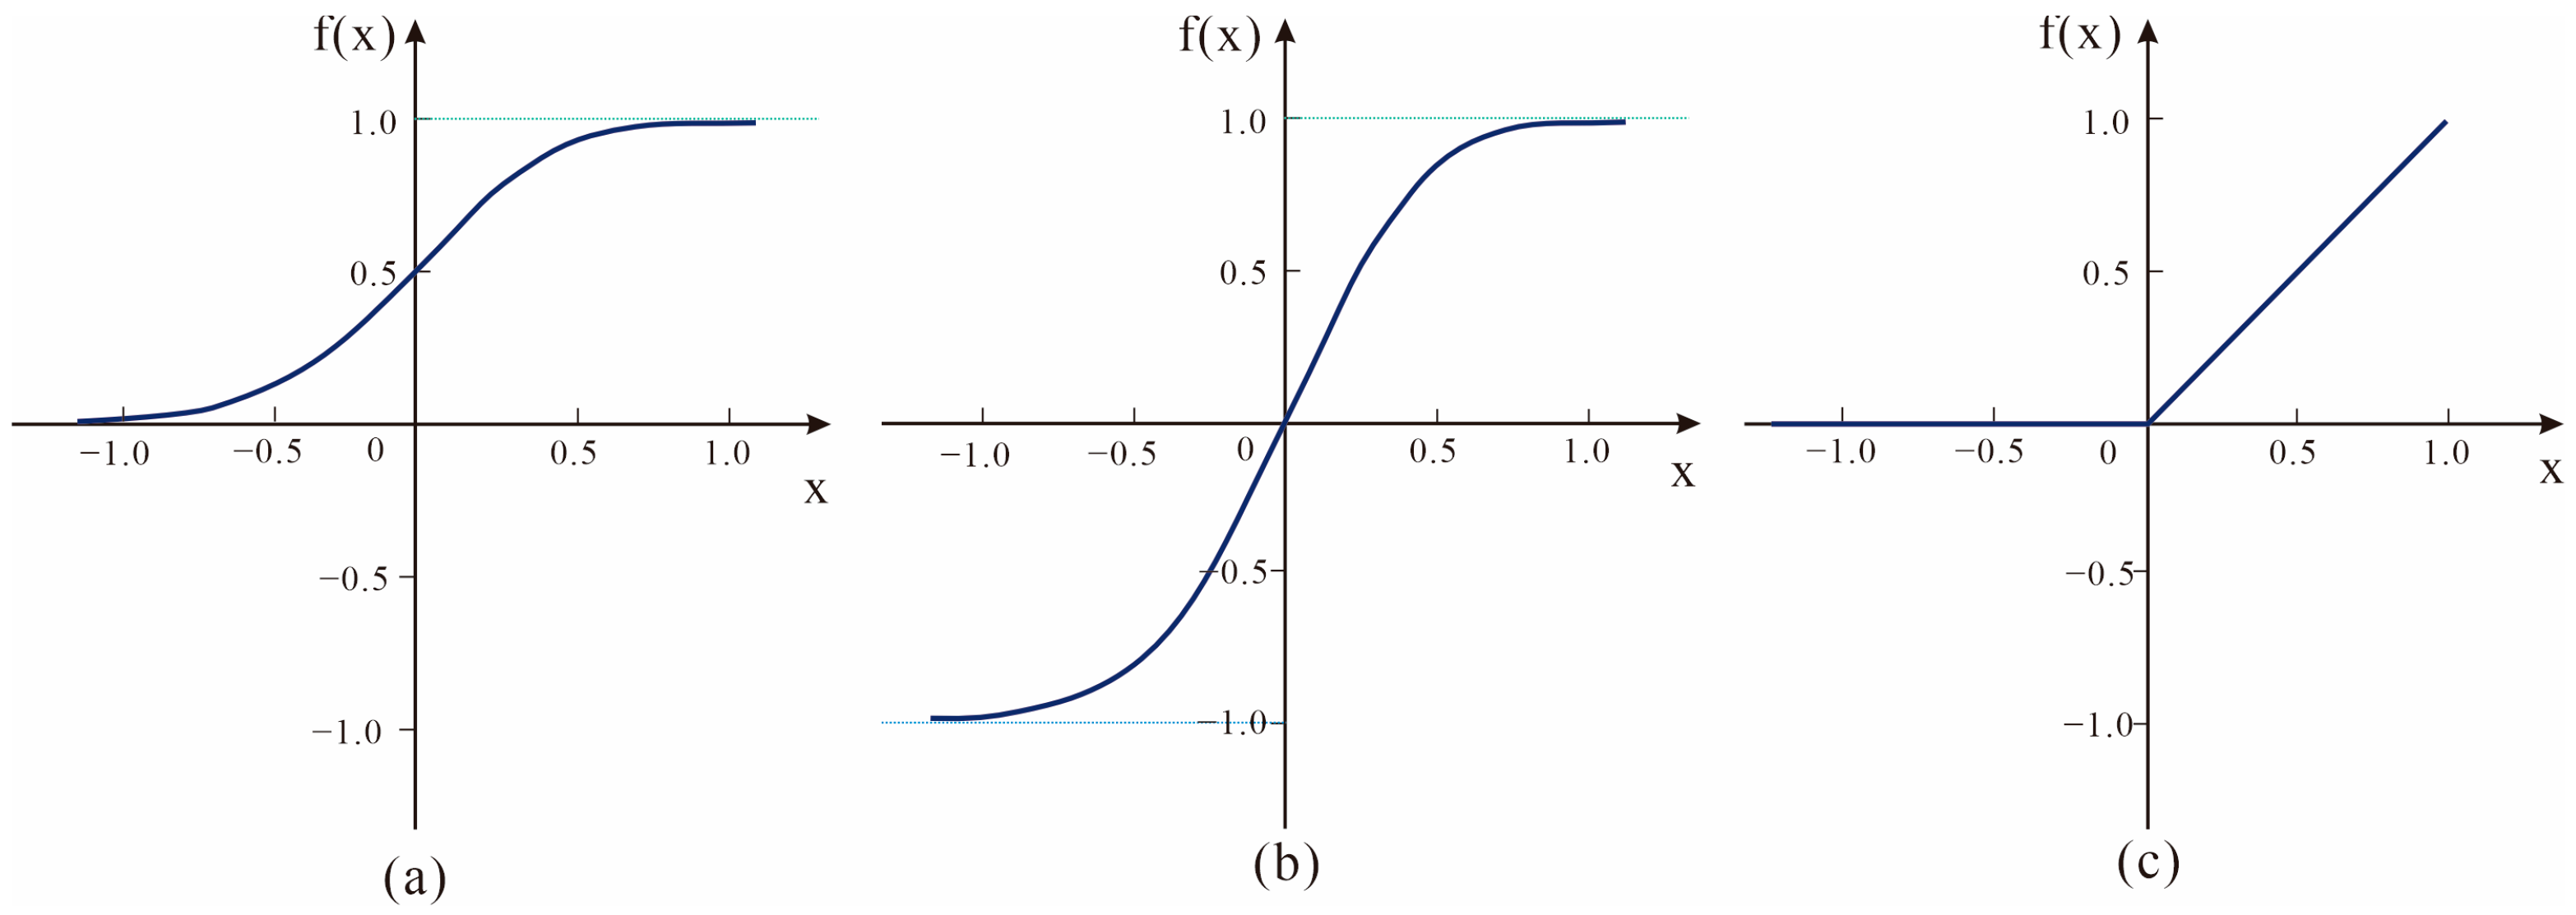
3.3.1. Activation Functions
3.3.2. Adam Optimizer
3.3.3. Data Preparation
3.4. Reservoir Modeling
4. Results
4.1. Experimental Results
4.2. Optimization of Reservoir Characteristic Parameters
4.3. Neural Network Reservoir Characteristic Parameters
4.3.1. Optimization of Seismic Attributes
4.3.2. Seismic Attribute Fusion Based on Deep Learning
- Optimization of DNN hyperparameters
- 2.
- Seismic attribute fusion
- 3.
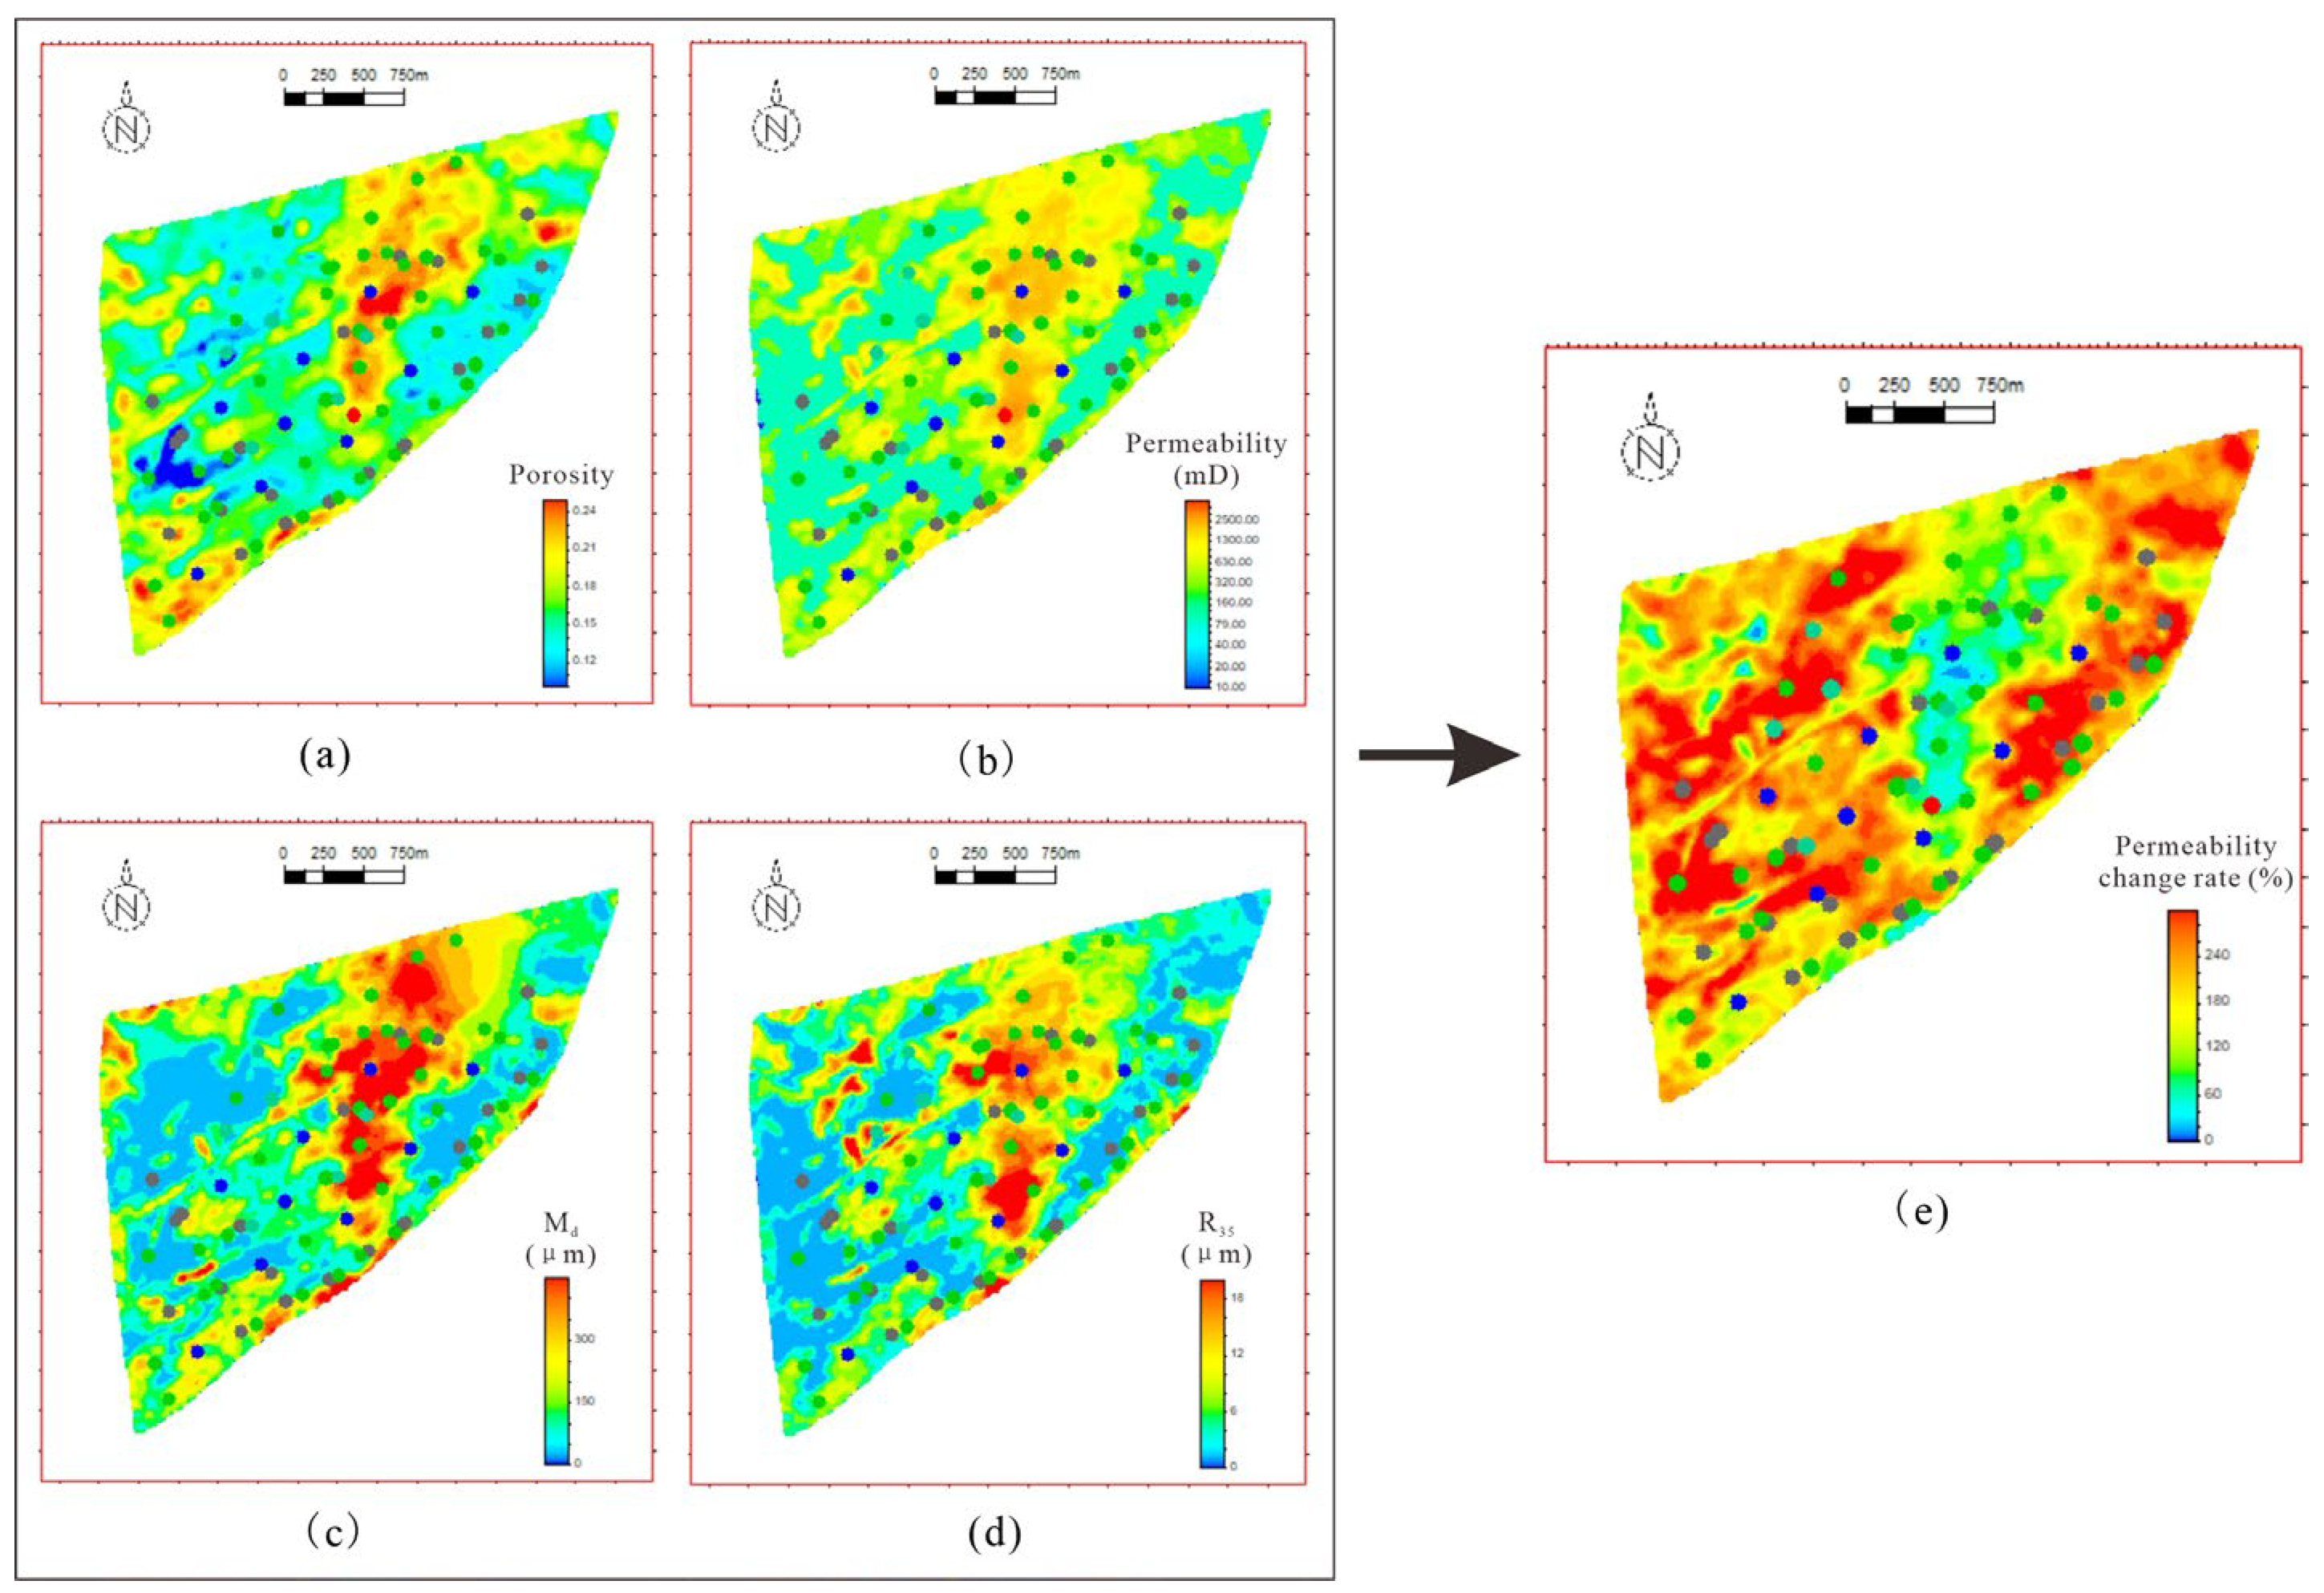
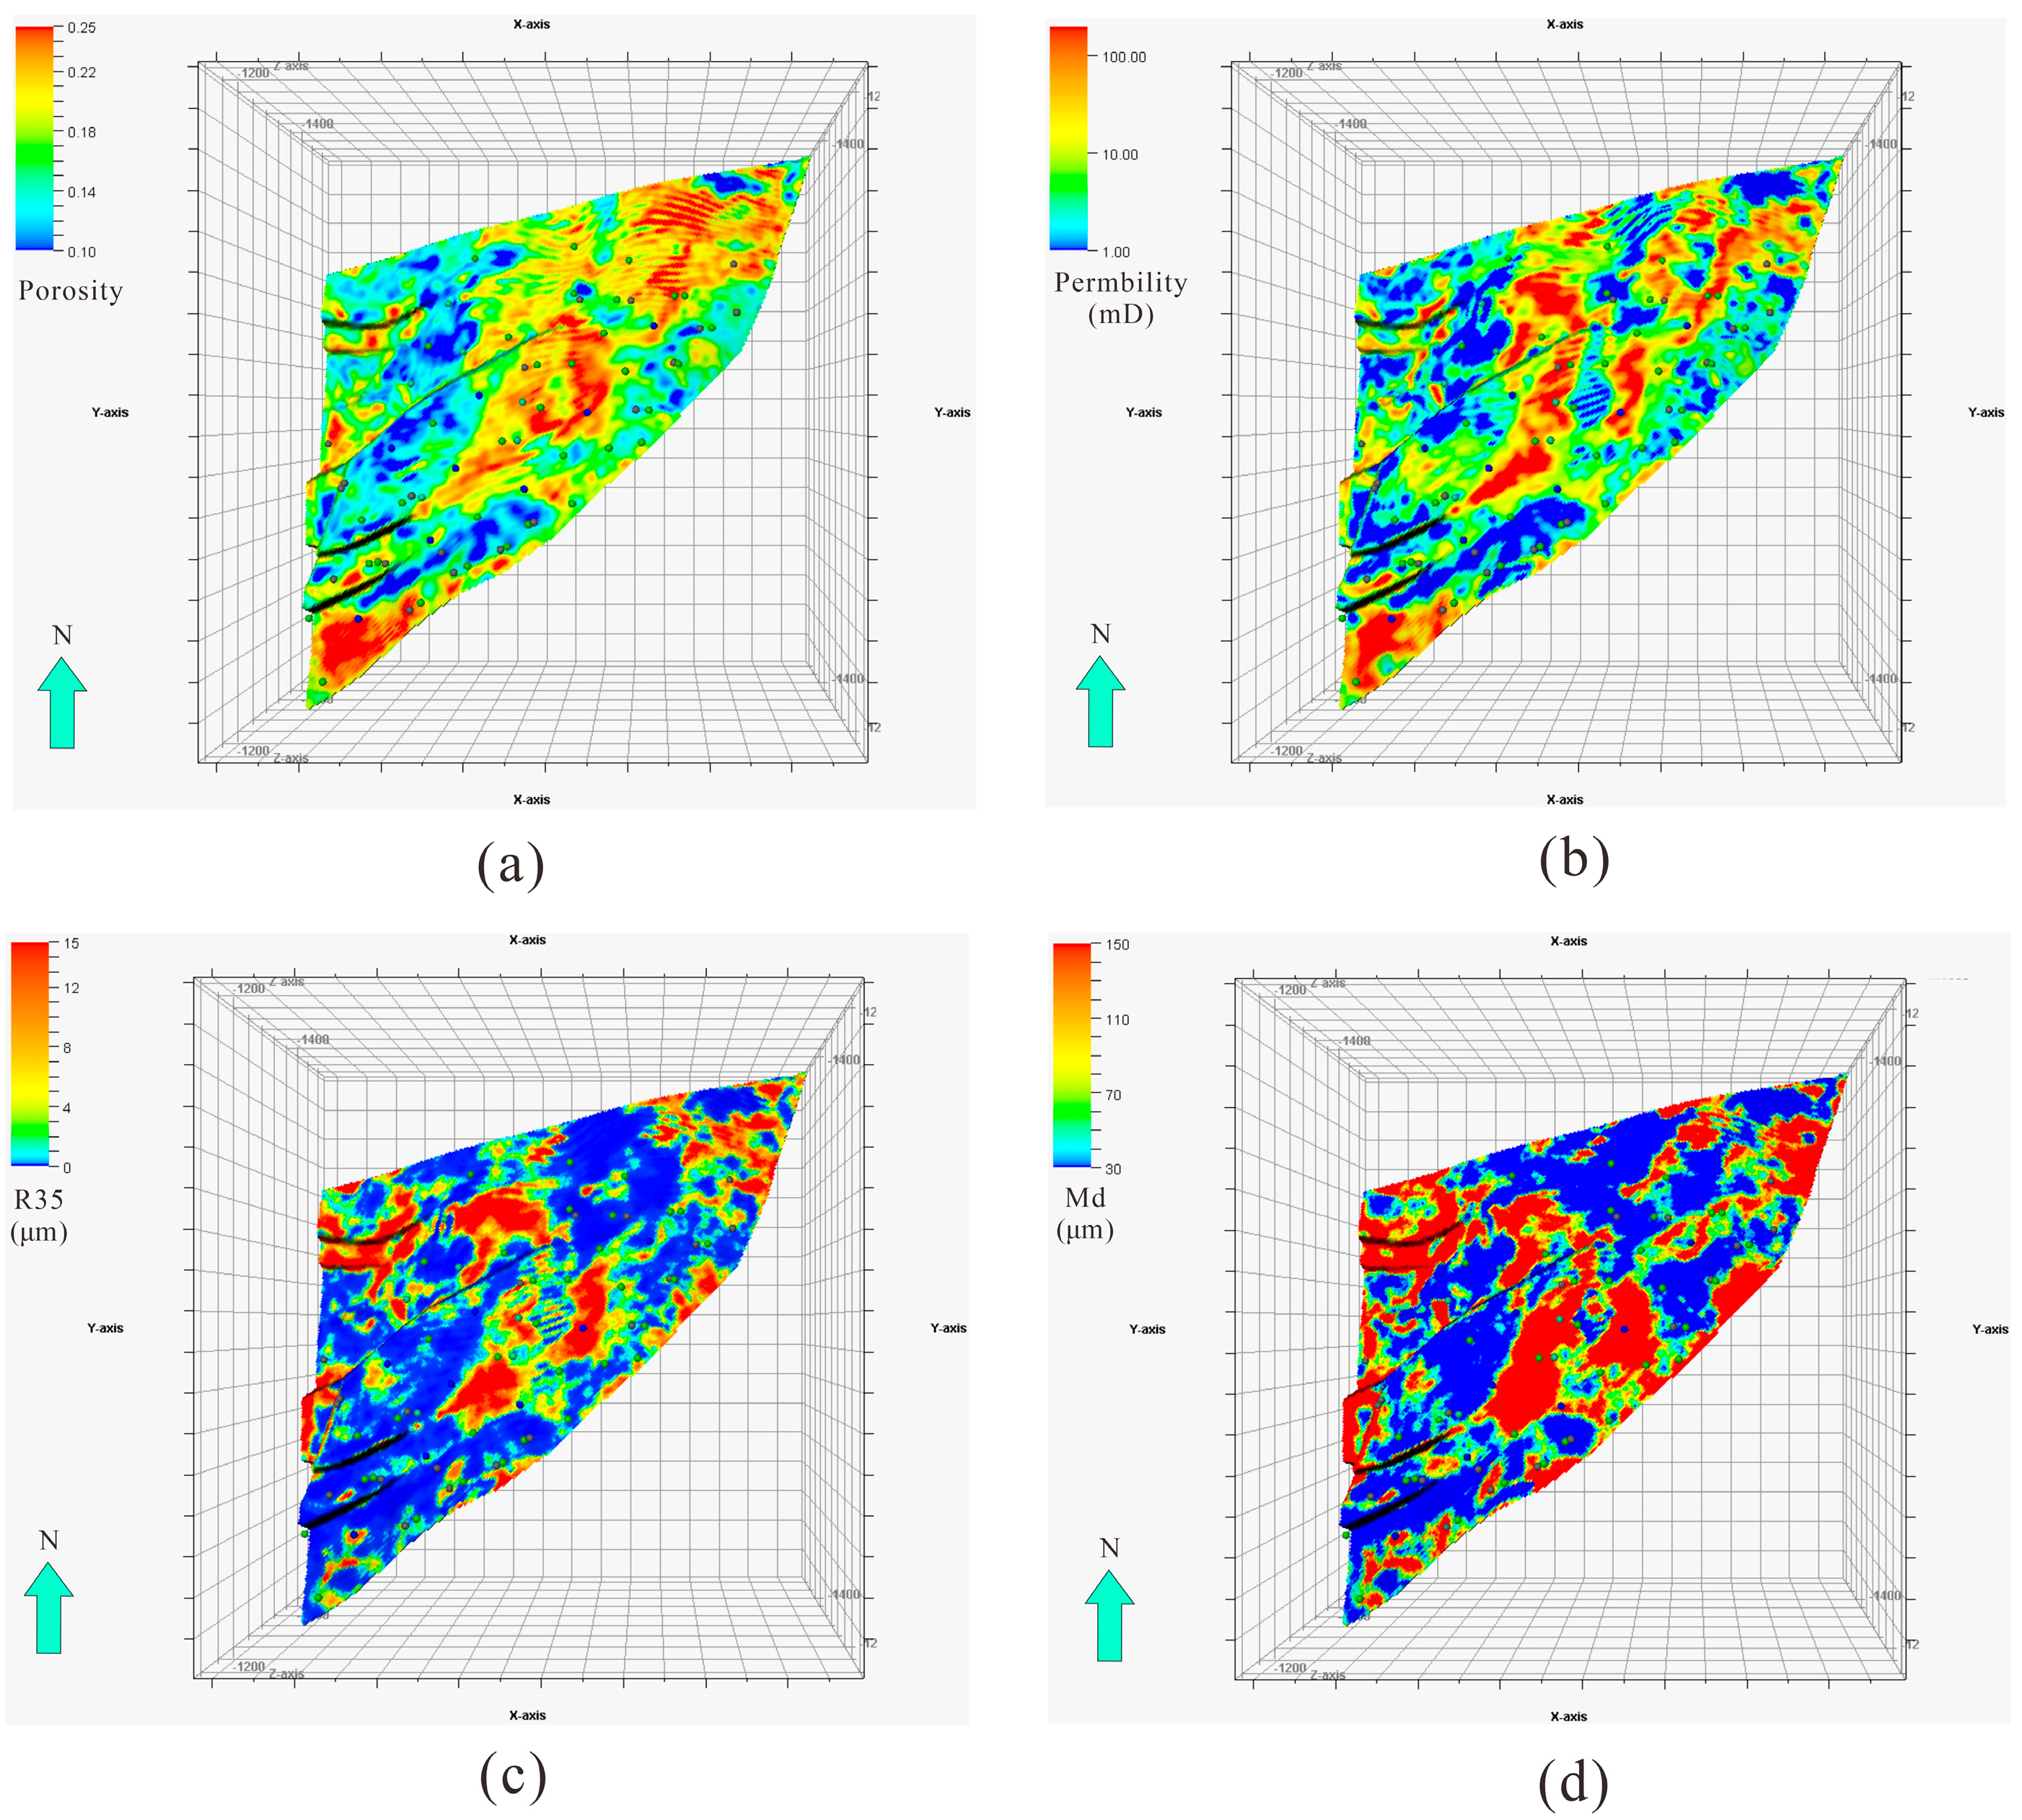
- Characterization of reservoir’s characteristic parameters
5. Discussion
5.1. Permeability Variation Characteristics of Different Reservoir Types
5.2. Seismic Attribute Fusion Body Distribution Characteristics
5.3. Correlating Reservoir Characteristic Parameters with Particle Migration
5.4. Prediction of Reservoir Damage Caused by Particle Migration
- (1)
- The rate of change in permeability exhibited significant planar heterogeneity. As the quality of the reservoir improved, the rate of permeability damage decreased. High–quality thick reservoirs typically contain a lower clay mineral content, a lower content of mobile particles, and a larger pore throat. These characteristics impart the reservoirs with a greater resistance to particle migration–induced damage.
- (2)
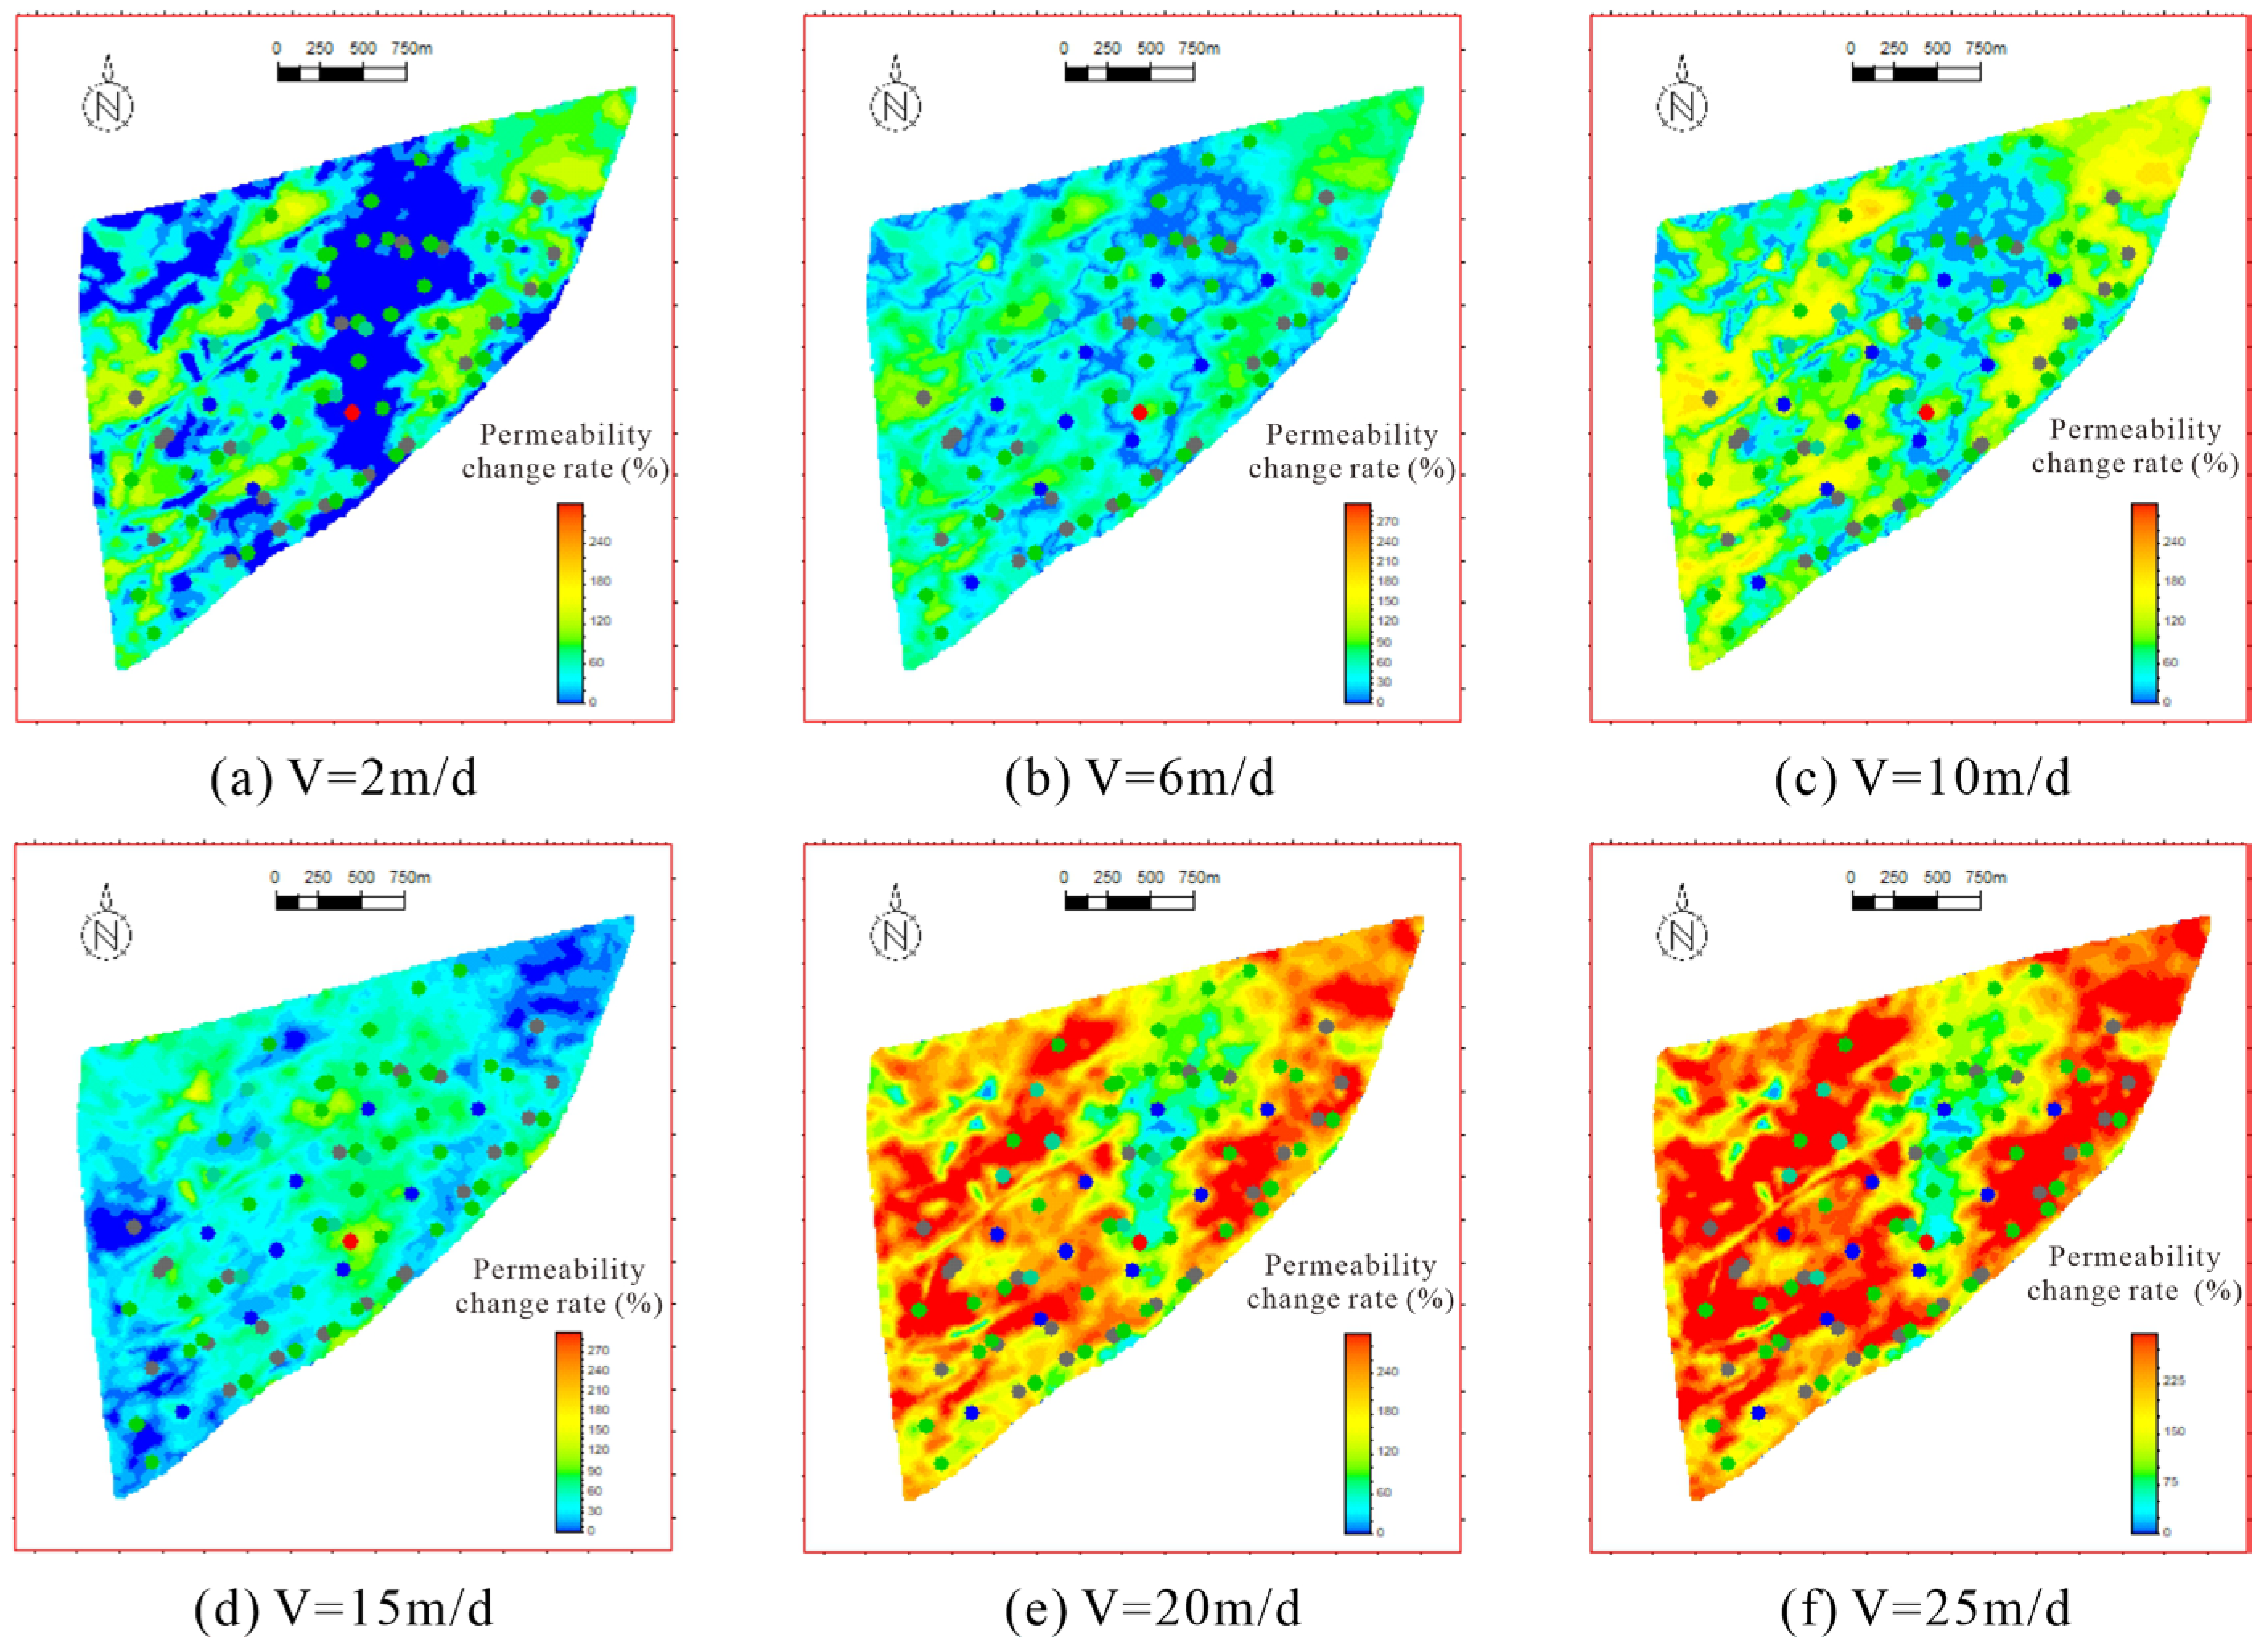
- As the flow velocity increased, the rate of permeability damage gradually intensified. As illustrated in Figure 17, even at a flow velocity as low as 2 m/d, certain regions exhibited a rate of permeability damage exceeding 50%.
- (3)
- Comparing the degree of damage of the reservoirs at different flow rates revealed substantial variation, particularly within the displacement velocity range of 10 m/d to 15 m/d. Therefore, according to the definition of the critical flow rate, the critical damage velocity was estimated to be between 6 m/d and 10 m/d.
5.5. The Effect of Particle Migration Reservoir Damage on Oil Well Production
6. Conclusions
- (1)
- The porosity, permeability, R35, and median grain size selected through data–mining methods effectively characterized the macroscopic and microscopic features of unconsolidated sandstone reservoirs.
- (2)
- Offshore oilfields often lack sufficient core data. This study combined machine learning with well–seismic methods, inputting well logging curves and core test information at the wells and utilizing the seismic attribute fusion constraints between wells to successfully characterize the distribution of the reservoir feature parameters (porosity, permeability, R35, and median grain size) in the region. This method enhances the effectiveness of predicting reservoir feature parameters in offshore oilfields with limited core data.
- (3)
- Unconsolidated sandstones are widely distributed in major oil–bearing regions in the world. This study compared the experimental results of other scholars and found that the permeability of unconsolidated sandstones would increase due to particle detachment. The core displacement experimental results indicated significant differences in permeability changes among different types of reservoirs after formation water displacement. The variation range for Type I reservoirs is 43% to 55%; for Type II reservoirs, it is 70% to 201%; and the change is most pronounced for Type III reservoirs, ranging from 222% to 410%. The critical flow velocity is estimated to be between 6 and 10 m/d.
- (4)
- Based on the experimental results, a quantitative relationship model between the permeability change rate induced by particle migration and the reservoir’s characteristic parameters (porosity, permeability, R35, and median grain size) was established. This model could quantitatively predict the permeability change rates in both vertical and horizontal planes at different flow rates within the region. Ultimately, the prediction results were successfully validated by the initial production performance of three horizontal wells, providing new scientific evidence for reservoir protection and oil–gas development.
Author Contributions
Funding
Data Availability Statement
Conflicts of Interest
References
- Xu, C.; Kang, Y.; You, Z.; Chen, M. Review on formation damage mechanisms and processes in shale gas reservoir: Known and to be known. J. Nat. Gas. Sci. Eng. 2016, 36, 1208–1219. [Google Scholar] [CrossRef]
- Civan, F. Chapter 1—Overview of formation damage. In Reservoir Formation Damage, 4th ed.; Civan, F., Ed.; Gulf Professional Publishing: Houston, TX, USA, 2023; pp. 1–12. [Google Scholar]
- Bedrikovetsky, P.; Caruso, N. Analytical Model for Fines Migration During Water Injection. Transp. Porous Med. 2014, 101, 161–189. [Google Scholar] [CrossRef]
- Yang, Y.; Yuan, W.; Hou, J.; You, Z. Review on physical and chemical factors affecting fines migration in porous media. Water Res. 2022, 214, 118172. [Google Scholar] [CrossRef] [PubMed]
- Guo, Z.; Hussain, F.; Cinar, Y. Permeability variation associated with fines production from anthracite coal during water injection. Int. J. Coal Geol. 2015, 147–148, 46–57. [Google Scholar] [CrossRef]
- Huang, F.; Dong, C.; You, Z.; Shang, X. Detachment of coal fines deposited in proppant packs induced by single–phase water flow: Theoretical and experimental analyses. Int. J. Coal Geol. 2021, 239, 103728. [Google Scholar] [CrossRef]
- Fan, C.; Nie, S.; Li, H.; Radwan, A.E.; Pan, Q.; Shi, X.; Li, J.; Liu, Y.; Guo, Y. Quantitative prediction and spatial analysis of structural fractures in deep shale gas reservoirs within complex structural zones: A case study of the Longmaxi Formation in the Luzhou area, southern Sichuan Basin, China. J. Asian Earth Sci. 2024, 263, 106025. [Google Scholar] [CrossRef]
- Huang, F.; Kang, Y.; You, Z.; You, L.; Xu, C. Critical Conditions for Massive Fines Detachment Induced by Single–Phase Flow in Coalbed Methane Reservoirs: Modeling and Experiments. Energy Fuels 2017, 31, 6782–6793. [Google Scholar] [CrossRef]
- Arab, D.; Pourafshary, P.; Ayatollahi, S.; Habibi, A. Remediation of colloid–facilitated contaminant transport in saturated porous media treated by nanoparticles. Int. J. Environ. Sci. Technol. 2014, 11, 207–216. [Google Scholar] [CrossRef]
- Kanti Sen, T.; Khilar, K.C. Review on subsurface colloids and colloid–associated contaminant transport in saturated porous media. Adv. Colloid Interface Sci. 2006, 119, 71–96. [Google Scholar] [CrossRef]
- Herzig, J.P.; Leclerc, D.M.; Goff, P.L. Flow of Suspensions through Porous Media—Application to Deep Filtration. Ind. Eng. Chem. 1970, 62, 8–35. [Google Scholar] [CrossRef]
- Zamani, A.A.U.C.; Maini, B.B.U.C. Flow of dispersed particles through porous media—Deep bed filtration. J. Pet. Sci. Eng. 2009, 69, 71–88. [Google Scholar] [CrossRef]
- Peng, K.; Shi, S.; Zou, Q.; Wen, Z.; Wang, Y.; Jiang, Z.; Zheng, C. Quantitative Characteristics of Energy Evolution of Gas–Bearing Coal Under Cyclic Loading and its Action Mechanisms on Coal and Gas Outburst. Rock. Mech. Rock. Eng. 2021, 54, 3115–3133. [Google Scholar] [CrossRef]
- Peng, K.; Shi, S.; Zou, Q.; Wang, G.; Jiang, Z. Disaster–Triggering Mechanisms Based on Interaction of Various Factors in Structured Gas Migration in Coal Seams Under Loading and Unloading Conditions. Nat. Resour. Res. 2021, 30, 1445–1465. [Google Scholar] [CrossRef]
- Zou, Q.; Chen, Z.; Zhan, J.; Chen, C.; Gao, S.; Kong, F.; Xia, X. Morphological evolution and flow conduction characteristics of fracture channels in fractured sandstone under cyclic loading and unloading. Int. J. Min. Sci. Technol. 2023, 33, 1527–1540. [Google Scholar] [CrossRef]
- Baiyu, Z.; Hongming, T.; Senlin, Y.; Gongyang, C.; Feng, Z.; Ling, L. Experimental and numerical investigations of particle plugging in fracture–vuggy reservoir: A case study. J. Pet. Sci. Eng. 2022, 208, 109610. [Google Scholar] [CrossRef]
- Baiyu, Z.; Hongming, T.; Senlin, Y.; Gongyang, C.; Feng, Z.; Shiyu, X. Effect of fracture roughness on transport of suspended particles in fracture during drilling. J. Pet. Sci. Eng. 2021, 207, 109080. [Google Scholar] [CrossRef]
- Koyama, T.; Li, B.; Jiang, Y.; Jing, L. Numerical simulations for the effects of normal loading on particle transport in rock fractures during shear. Int. J. Rock. Mech. Min. 2008, 45, 1403–1419. [Google Scholar] [CrossRef]
- Shi, X.; Prodanović, M.; Holder, J.; Gray, K.E.; DiCarlo, D. Coupled solid and fluid mechanics modeling of formation damage near wellbore. J. Pet. Sci. Eng. 2013, 112, 88–96. [Google Scholar] [CrossRef]
- Wang, G.; Pu, X. Discrete Element Simulation of Granular Lost Circulation Material Plugging a Fracture. Part. Sci. Technol. 2014, 32, 112–117. [Google Scholar] [CrossRef]
- Olson, J.E.; Yaich, E.; Holder, J. Permeability changes due to shear dilatancy in uncemented sands. In Proceedings of the Canada–U.S. Rock Mechanics Symposium, Asheville, NC, USA, 28 June–1 July 2009. [Google Scholar]
- Scott, J.D.; Proskin, S.A.; Adhikary, D.P. Volume and Permeability Changes Associated with Steam Stimulation in an Oil Sands Reservoir. J. Can. Pet. Technol. 1994, 33, PETSOC-94-07-06. [Google Scholar] [CrossRef]
- Ibukun, O.; Tovar, J.; Heinemann, N.; Chalmers, F.; Mokdad, B.; Katoozi, K. Reservoir Permeability Evolution in Sand Producing Wells. In Proceedings of the SPE Nigeria Annual International Conference and Exhibition, Lagos, Nigeria, 4–6 August 2015. [Google Scholar]
- Nassir, M.; Walters, D. Permeability Enhancement of Oil Sands. In Proceedings of the 52nd U.S. Rock Mechanics/Geomechanics Symposium, Seattle, WA, USA, 17–20 June 2018. [Google Scholar]
- Xue, Y.; Deng, Y.; Wang, D.; Yang, H.; Lv, D.; Kang, K. Hydrocarbon accumulation conditions and key exploration and development technologies for PL 19–3 oilfield. Pet. Res. 2019, 4, 29–51. [Google Scholar] [CrossRef]
- Allen, M.B.; Macdonald, D.I.M.; Xun, Z.; Vincent, S.J.; Brouet-Menzies, C. Early Cenozoic two–phase extension and late Cenozoic thermal subsidence and inversion of the Bohai Basin, northern China. Mar. Pet. Geol 1997, 14, 951–972. [Google Scholar] [CrossRef]
- Hao, F.; Zhou, X.; Zhu, Y.; Bao, X.; Yang, Y. Charging of the Neogene Penglai 19—3 field, Bohai Bay Basin, China: Oil accumulation in a young trap in an active fault zone. AAPG Bull. 2009, 93, 155–179. [Google Scholar] [CrossRef]
- Liang, J.; Wang, H.; Bai, Y.; Ji, X.; Duo, X. Cenozoic tectonic evolution of the Bohai Bay Basin and its coupling relationship with Pacific Plate subduction. J. Asian Earth Sci. 2016, 127, 257–266. [Google Scholar] [CrossRef]
- Liu, Y.; Luo, X.; Kang, K.; Li, T.; Jiang, S.; Zhang, J.; Zhang, Z.; Li, Y. Permeability characterization and directional wells initial productivity prediction in the continental multilayer sandstone reservoirs: A case from Penglai 19—3 oil field, Bohai Bay Basin. Pet. Explor. Dev. 2017, 44, 97–104. [Google Scholar] [CrossRef]
- Chen, Q.; Sidney, S. Seismic attribute technology for reservoir forecasting and monitoring. Lead. Edge 1997, 16, 445–448. [Google Scholar] [CrossRef]
- Chopra, S.; Marfurt, K.J. Seismic attributes—A historical perspective. Geophysics 2005, 70, 3SO–28SO. [Google Scholar] [CrossRef]
- Li, W.; Yue, D.; Colombera, L.; Du, Y.; Zhang, S.; Liu, R.; Wang, W. Quantitative prediction of fluvial sandbodies by combining seismic attributes of neighboring zones. J. Pet. Sci. Eng. 2021, 196, 107749. [Google Scholar] [CrossRef]
- Schmidhuber, J. Deep learning in neural networks: An overview. Neural Netw. 2015, 61, 85–117. [Google Scholar] [CrossRef]
- Hornik, K.; Stinchcombe, M.; White, H. Multilayer feedforward networks are universal approximators. Neural Netw. 1989, 2, 359–366. [Google Scholar] [CrossRef]
- Forneron, J. Estimation and inference by stochastic optimization. J. Econ. 2024, 238, 105638. [Google Scholar] [CrossRef]
- Shi, G.; Wang, J.; Gates, I.D. Investigation of enhanced geothermal system in the Basal Cambrian Sandstone Unit, Alberta, Canada. Heliyon 2024, 10, e24763. [Google Scholar] [CrossRef] [PubMed]
- Shi, G.; Wang, J.; Gates, I.D. Combined geothermal and CO2 sequestration in the Basal Cambrian Sandstone Unit (BCSU) in Alberta, Canada. J. CO2 Util. 2024, 80, 102685. [Google Scholar] [CrossRef]
- Pittman, E.D. Relationship of porosity and permeability to various parameters derived from mercury injection–capillary pressure curves for sandstone. AAPG Bull. 1992, 76, 191–198. [Google Scholar]
- Wang, Z.; Tang, H.; Cai, H.; Hou, Y.; Shi, H.; Li, J.; Yang, T.; Feng, Y. Production prediction and main controlling factors in a highly heterogeneous sandstone reservoir: Analysis on the basis of machine learning. Energy Sci. Eng. 2022, 10, 4674–4693. [Google Scholar] [CrossRef]
- Wang, Z.; Tang, H.; Hou, Y.; Shi, H.; Li, J.; Yang, T.; Feng, Y.; Meng, W. Quantitative evaluation of unconsolidated sandstone heavy oil reservoirs based on machine learning. Geol. J. 2022, 58, 2321–2341. [Google Scholar] [CrossRef]
- Wang, Z.; Tang, H.; Yang, J.; Huang, L. Reservoir Pore Characteristics Based on Depositional Microfacies Control in the Neogene Guantao Formation, Bohai Bay Basin, China. Energies 2022, 15, 2870. [Google Scholar] [CrossRef]
- Wang, Z.; Yin, H.; Tang, H.; Hou, Y.; Yu, H.; Liu, Q.; Tang, H. Analysis of damage mechanisms and controlling factors of fine particle migration in unconsolidated sandstone reservoirs based on reservoir classification. Energy Sci. Eng. 2024, 12, 2879–2898. [Google Scholar] [CrossRef]
- Xue, S.; Yuan, Y. Sanding Process and Permeability Change. J. Can. Pet. Technol. 2007, 46, 33–39. [Google Scholar] [CrossRef]
- Xiong, Y.; Xu, H.; Wang, Y.; Zhou, W.; Liu, C.; Wang, L. Fluid flow with compaction and sand production in unconsolidated sandstone reservoir. Petroleum 2018, 4, 358–363. [Google Scholar] [CrossRef]
- Zivar, D.; Shad, S.; Foroozesh, J.; Salmanpour, S. Experimental study of sand production and permeability enhancement of unconsolidated rocks under different stress conditions. J. Pet. Sci. Eng. 2019, 181, 106238. [Google Scholar] [CrossRef]
- Nie, X.; Yang, S.; Ding, J.; Cao, L.; Zhou, F.; Ma, Q.; Qiu, Z. Experimental investigation on permeability evolution law during sand production process of weak sandstone. J. Nat. Gas. Sci. Eng. 2014, 21, 248–254. [Google Scholar] [CrossRef]


| Reservoir Classification | Porosity (%) | Permeability (mD) | Vsh 1 (%) | R35 2 (μm) |
|---|---|---|---|---|
| Type I | ≥25 | ≥800 | ≤15 | ≥10 |
| Type II | 20~25 | 300~800 | 15~25 | 3~10 |
| Type III | <20 | <300 | >25 | <3 |
| Sample | Depth/m | Member | Reservoir Type | Poro./% | Perm./mD | Md/μm | R35/μm |
|---|---|---|---|---|---|---|---|
| 2—009 | 1286.73 | L60 | I | 34.70 | 1772.65 | 224.73 | 20.66 |
| 2—028 | 1289.33 | L60 | I | 32.60 | 1357.52 | 201.55 | 19.12 |
| 3—038 | 1306.6 | L62 | I | 29.70 | 2539.08 | 356.94 | 11.24 |
| 4—029 | 1333.19 | L64 | I | 31.90 | 3118.01 | 479.35 | 15.06 |
| 5—002 | 1340.46 | L70 | III | 27.60 | 112.14 | 73.96 | 0.11 |
| 5—024 | 1344.54 | L70 | I | 34.50 | 3137.97 | 385.56 | 25.73 |
| 6—024 | 1378.94 | L76 | III | 28.90 | 331.23 | 90.71 | 0.41 |
| 7—024 | 1406.3 | L82 | III | 21.00 | 166.03 | 120.17 | 0.02 |
| 8—036 | 1450.42 | L88 | II | 26.60 | 537.90 | 238.38 | 5.70 |
| 9—038 | 1479.89 | L92 | II | 26.10 | 446.94 | 111.25 | 0.17 |
| 11—009 | 1621.36 | L112 | I | 32.50 | 1556.47 | 426.02 | 15.07 |
| Method | Advantages | Disadvantages |
|---|---|---|
| RGB seismic attribute fusion | Although this method can overcome single attribute colors, it cannot highlight the shortcomings of regional anomalies. | This technology is only applicable to a few attributes for fusion and should be combined with data–mining methods. |
| Clustering analysis of seismic attribute fusion | Suitable for classifying seismic attributes from large amounts of data. | Limited application conditions. |
| Multiple linear regression seismic attribute fusion | Can overcome the limitations of single earthquake attributes. | Simple linear model with limited room for improvement of the coincidence rate. Has high requirements for the selection of attribute types. |
| Seismic attribute fusion based on well data | Can make full use of logging data and assign weight coefficients to each seismic attribute to improve the prediction accuracy. | Weightings are difficult to determine, which will affect the final result. |
| Neural network seismic attribute fusion | Can handle complex nonlinear data. Has a high prediction accuracy and a wide range of applications. | Seismic attributes need to be optimized using data–mining methods and the neural network model needs a large amount of training data. |
| Activation Function | Expression |
|---|---|
| Linear | |
| Sigmoid | |
| Tanh | |
| ReLu | |
| Softplus |
| Well | Porosity/% | Permeability/mD | R35/μm | Md/μm | Vsh/% |
|---|---|---|---|---|---|
| 1 | 24.11 | 486.69 | 10.61 | 53.77 | 44.62 |
| 2 | 25.06 | 835.40 | 12.15 | 127.57 | 27.89 |
| 3 | 30.47 | 1366.58 | 15.26 | 135.89 | 21.62 |
| 4 | 32.35 | 1283.12 | 13.12 | 141.58 | 23.83 |
| …… | |||||
| 40 wells (mean) | 25.93 | 680.45 | 11.12 | 88.85 | 35.27 |
| Hyperparameter | Classification |
|---|---|
| Optimizer | SGD, Adam, RMSprop |
| Neuron | [5,10,1], [5,10,5,1], [5,10,20,10,1] |
| Hyperparameter | Classification |
|---|---|
| Optimizer type | Adam |
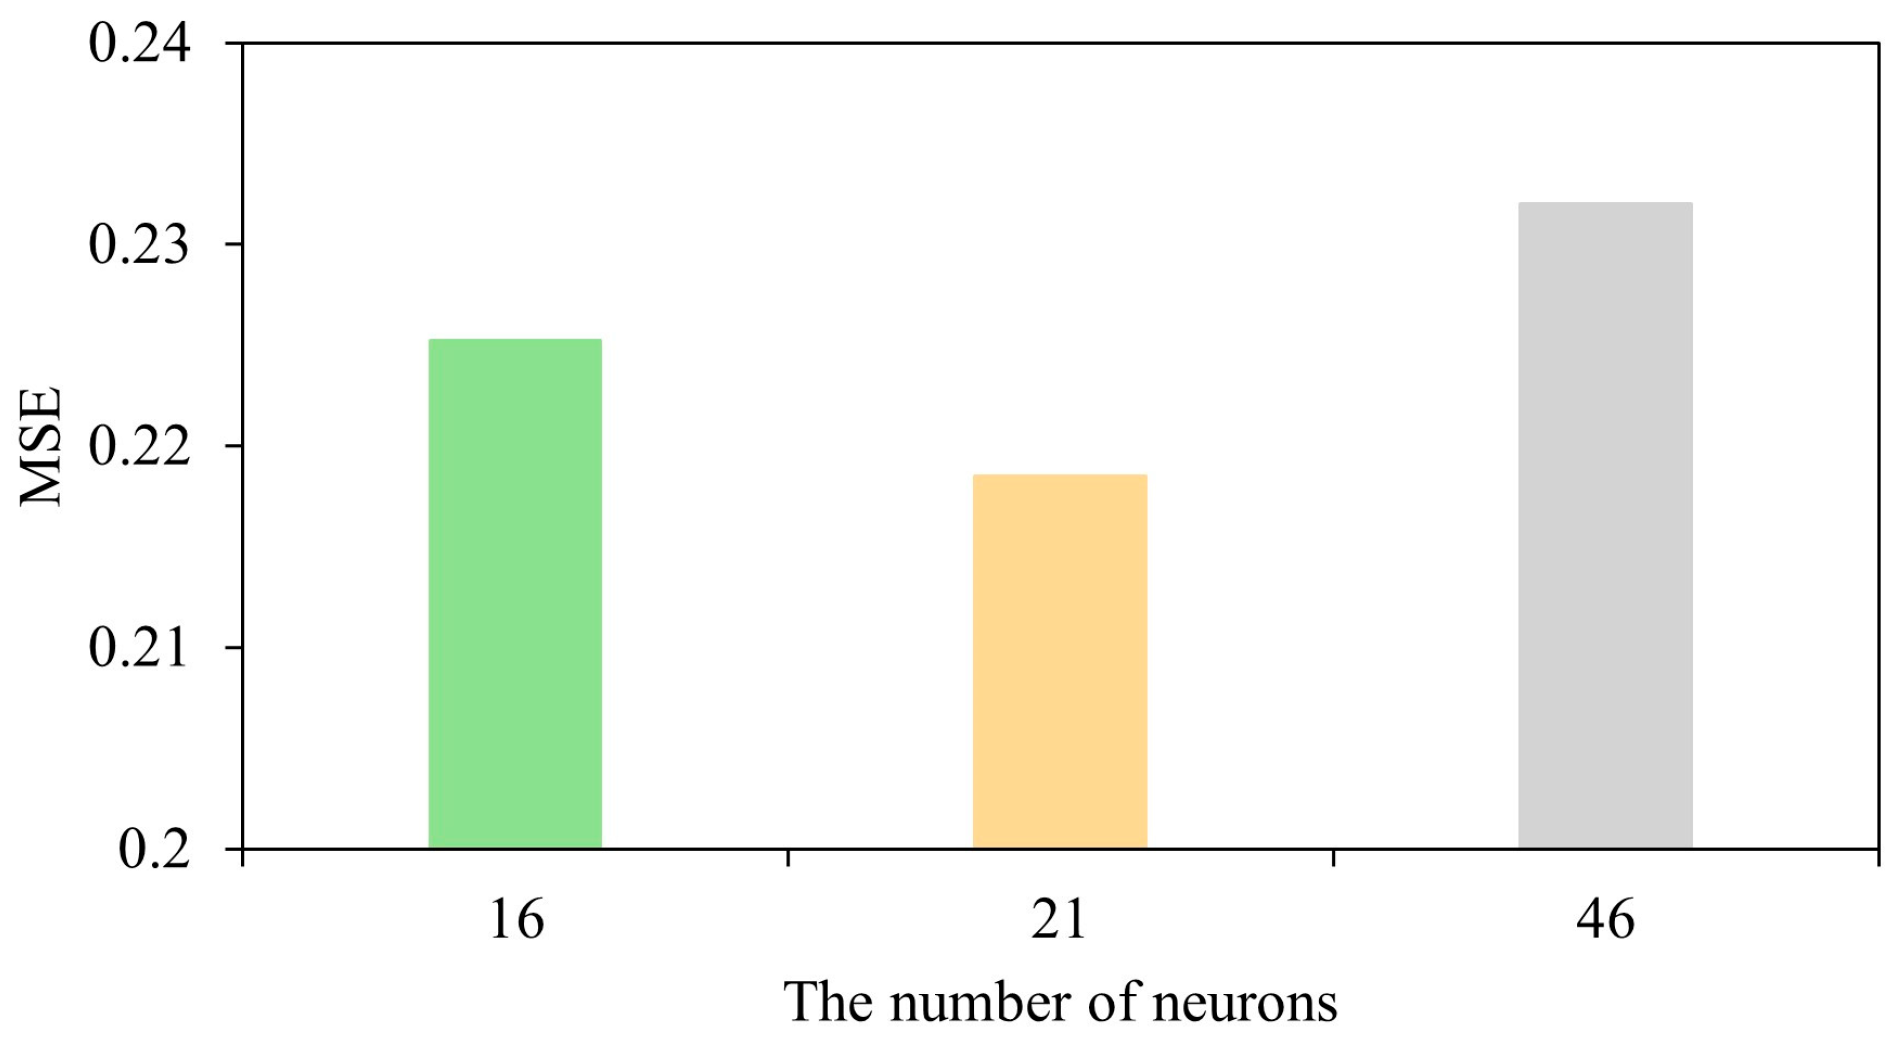
| Number of neurons | [5,10,5,1] |
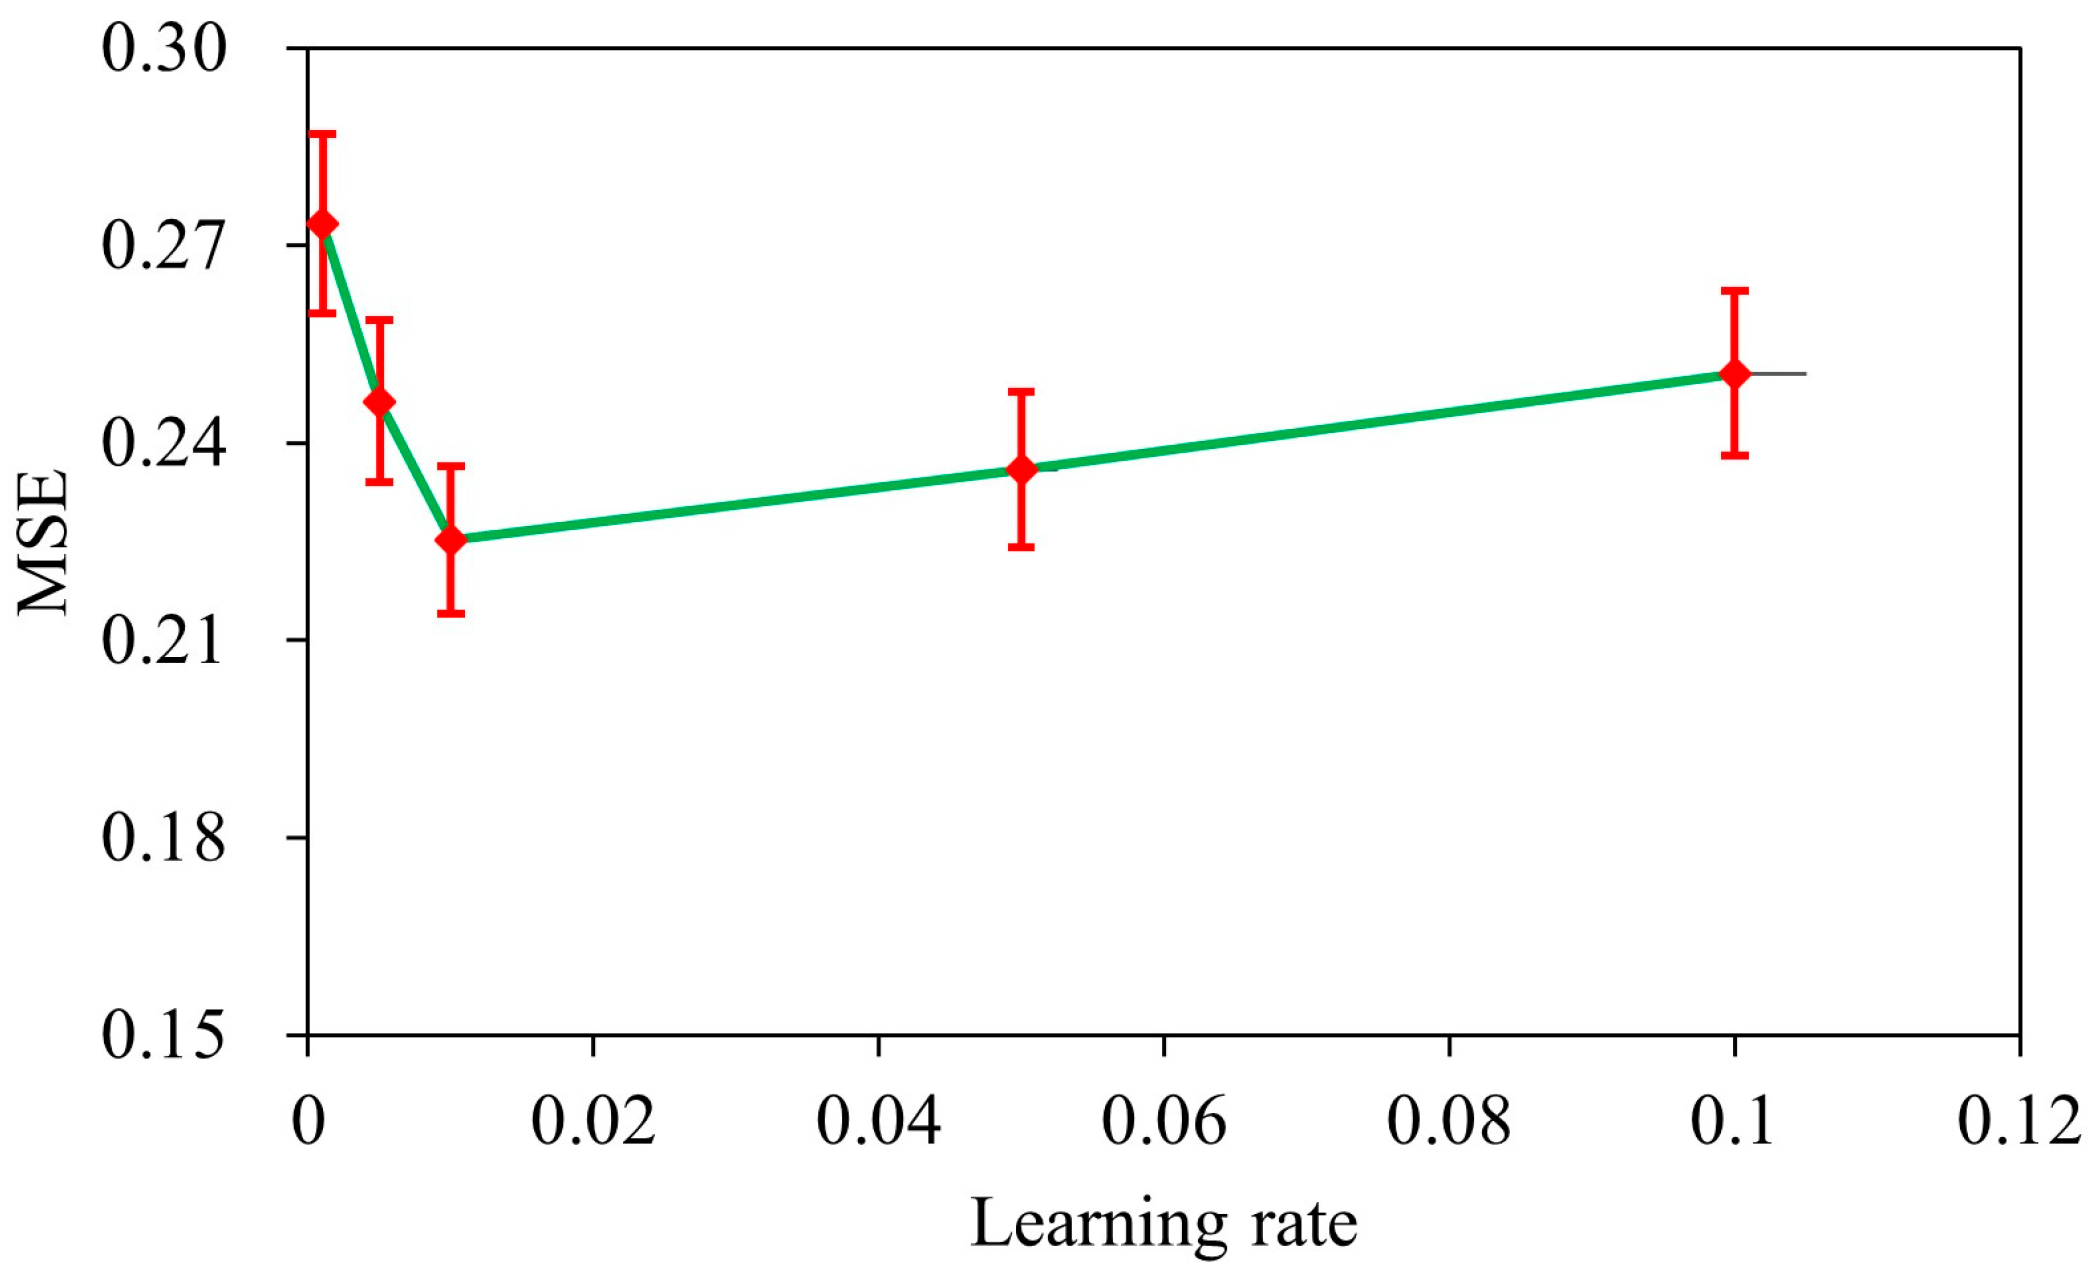
| Learning rate | 0.01 |
| Flow Velocity (m/d) | Linear Fitting Formula | R2 |
|---|---|---|
| 2 | y = −92.07 × + 0.76 × + 45.97 × + 2652.33 × − 341.93 | 0.83 |
| 6 | y = −24.74 × + 0.24 × − 430.30 × − 317.66 × + 230.35 | 0.94 |
| 10 | y = 70.34 × − 0.57 × + 9.28 × − 2111.87 × + 233.13 | 0.82 |
| 15 | y = −7.00 × + 0.12 × − 309.39 × − 1732.94 × + 524.79 | 0.80 |
| 20 | y = 21.94 × − 0.19 × + 187.15 × − 1793.72 × + 398.79 | 0.83 |
| 25 | y = 27.76 × − 0.28 × + 194.86 × − 2017.01 × + 504.00 | 0.80 |
Disclaimer/Publisher’s Note: The statements, opinions and data contained in all publications are solely those of the individual author(s) and contributor(s) and not of MDPI and/or the editor(s). MDPI and/or the editor(s) disclaim responsibility for any injury to people or property resulting from any ideas, methods, instructions or products referred to in the content. |
© 2024 by the authors. Licensee MDPI, Basel, Switzerland. This article is an open access article distributed under the terms and conditions of the Creative Commons Attribution (CC BY) license (https://creativecommons.org/licenses/by/4.0/).
Share and Cite
Wang, Z.; Yin, H.; Tang, H.; Hou, Y.; Yu, H.; Liu, Q.; Tang, H.; Jia, T. Damage Evaluation of Unconsolidated Sandstone Particle Migration Reservoir Based on Well–Seismic Combination. Processes 2024, 12, 2009. https://doi.org/10.3390/pr12092009
Wang Z, Yin H, Tang H, Hou Y, Yu H, Liu Q, Tang H, Jia T. Damage Evaluation of Unconsolidated Sandstone Particle Migration Reservoir Based on Well–Seismic Combination. Processes. 2024; 12(9):2009. https://doi.org/10.3390/pr12092009
Chicago/Turabian StyleWang, Zhao, Hanjun Yin, Haoxuan Tang, Yawei Hou, Hang Yu, Qiang Liu, Hongming Tang, and Tianze Jia. 2024. "Damage Evaluation of Unconsolidated Sandstone Particle Migration Reservoir Based on Well–Seismic Combination" Processes 12, no. 9: 2009. https://doi.org/10.3390/pr12092009