Abstract
The adsorption isotherms and intraparticle mass transfer coefficients of a novel adsorbent with various VOCs at different temperatures during the desorption process are investigated. Firstly, the adsorption isotherms of an HCP-5 adsorbent with o-xylene and ethyl acetate systems were determined at temperatures ranging from 30 to 160 °C, and the data were fitted using the Langmuir adsorption isotherm equation. Subsequently, a mathematical model for the fixed-bed desorption breakthrough of VOCs was established. By combining with fixed-bed desorption breakthrough experiments, the intraparticle mass transfer coefficients of o-xylene and ethyl acetate during the desorption process at different temperatures were obtained through the least squares method. This study revealed that the intraparticle mass transfer coefficients of o-xylene and ethyl acetate during the desorption process were basically equal. The intraparticle mass transfer coefficients increased and then decreased with temperature during the desorption process. Compared with the adsorption process, the contribution of surface diffusion inside the adsorbent pores to intraparticle mass transfer decreased during the desorption process, leading to a significant decrease in the intraparticle mass transfer coefficients, which were approximately one-twentieth of those during the adsorption process.
1. Introduction
Volatile organic compounds (VOCs) are crucial precursors for the formation of PM2.5 and O3, causing severe damage to the ecological environment and impacting human health [1]. Studies indicate that the national anthropogenic VOC emissions exceeded 30 million tons in 2015 [2]. Industries such as furniture manufacturing, mechanical equipment manufacturing, and printing exhibit characteristics of low concentration and high air volume in VOC emissions. Such emissions have a large base and are a top priority for VOC pollution control [3,4]. The current optimal treatment process for such VOC exhaust is to first undergo adsorption concentration to transform it into exhaust with high concentration and low air volume, followed by catalytic combustion or condensation recovery.
The adsorption concentration processes currently used in China mainly include the early fixed-bed process and the emerging adsorption rotary wheel process. The fixed-bed process has disadvantages, such as a high pressure drop, discontinuous operation, and large footprint [5]. The adsorption rotary wheel process is mainly imported from abroad, with core technology still held by countries such as Japan, Europe, and the United States [6,7]. Fluidized beds have advantages, such as a uniform bed temperature, fast heat and mass transfer, large processing capacity, and ease of scale-up design. Multilayer shallow fluidized beds can effectively suppress solid-phase back-mixing and bubble formation, ensuring high mass transfer efficiency and good gas–solid contact. Therefore, a multilayer shallow fluidized bed adsorption concentration technology is proposed that uses dual fluidized beds for adsorption and desorption, achieving the enrichment and concentration of low-concentration VOCs [8].
Adsorption isotherms and mass transfer coefficients are critical data for the design of multilayer fluidized bed adsorption and desorption units. They help to optimize adsorbent structures (particle size, specific surface area, pore size, etc.) and operating conditions (operating air velocity, bed height, etc.). Currently, most research on mass transfer coefficients focuses on the adsorption process. For example, studies by Wang Lina et al. [9] and S. Brosillon et al. [10] investigated the intraparticle mass transfer coefficients during the adsorption process of VOCs in highly cross-linked resins and molecular sieve adsorbents, respectively. W. J. Weber et al. [11] studied the internal and external mass transfer coefficients during the adsorption of bromophenol and dodecyl benzenesulfonate in water on activated carbon. P. Marin et al. [12] investigated the mass transfer control steps when dye adsorbs onto commercial adsorbents under different conditions. However, there is limited research on the mass transfer coefficients during the desorption process, which is detrimental to the design of desorption units. Therefore, the main purpose of this paper is to determine the adsorption isotherms and intraparticle mass transfer coefficients during the desorption process of the novel HCP-5 highly cross-linked resin adsorbent with different types of VOCs, providing data support for the design of multilayer fluidized bed desorption units.
2. Materials and Methods
2.1. Adsorbent and Adsorbates
The adsorbent used in this study is the novel HCP-5 highly cross-linked resin [13]. This adsorbent consists of uniformly spherical particles with excellent adsorption performance, and its recyclability does not lead to a decline in adsorption efficiency. HCP-5 adsorbent exhibits good hydrophobicity, allowing it to operate effectively under high humidity conditions. In our previous work, we conducted a detailed comparison of the performance of HCP-5 and DOW503 adsorbents under similar conditions to evaluate their adsorption capacity and stability. The results demonstrated that HCP-5 exhibited superior adsorption performance and better regeneration capabilities compared to DOW503, indicating that HCP-5 has greater potential for long-term application. Additionally, it possesses outstanding strength and wear resistance, with a wear index (r168) of less than 0.1%, making it suitable for high-intensity friction processes in fluidized bed technology. The pore structure information of the HCP-5 adsorbent was determined using an automated surface area and pore size distribution analyzer (Autosorb-iQ, Quantachrome, Boynton Beach, FL, USA), and some of its physical properties are presented in Table 1.

Table 1.
Physical properties of adsorbent and adsorbates.
The furniture manufacturing industry contributes to 18.18% of industrial VOCs emissions in China, representing the largest share of industrial emissions [2]. Tong Ruipeng et al. [14] investigated the emissions of VOC pollutants from 8 wooden furniture manufacturing enterprises. Among the pollutants, the concentration of xylene was the highest at 35%, followed by toluene and ethyl acetate at 26% and 20%, respectively. According to the survey results of Wu Xuecheng et al. [2] on VOC emissions from 30 furniture manufacturing enterprises, benzene, esters, and ketones accounted for over 95% of total VOC emissions. Therefore, this study selected o-xylene and ethyl acetate as representative VOCs to investigate the desorption mass transfer kinetics in the HCP-5 adsorbent. The physical properties of the two adsorbates are presented in Table 1.
2.2. Experimental Equipment and Methods
The adsorption isotherm measurement system used in this experiment is illustrated in Figure 1. The experiment is divided into a gas distribution system and an adsorption/desorption system. The gas distribution system employs nitrogen as the carrier gas, which is split into two streams controlled by two mass flow controllers. Organic liquids are introduced into the nitrogen pipeline at a specified flow rate using a syringe pump. After being heated by a heated zone in the pipeline, the organic liquids enter a buffer bottle. Simultaneously, the other stream of nitrogen is mixed in the buffer bottle, ensuring the stability of the gas flow concentration.
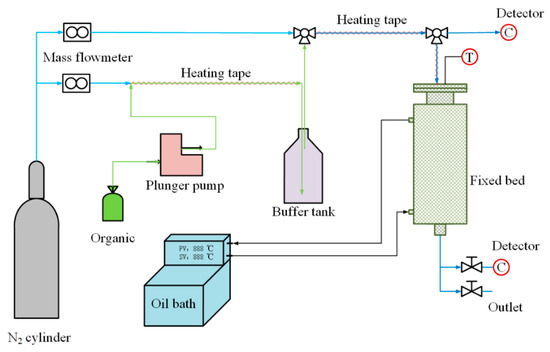
Figure 1.
Experimental measuring system.
The adsorption/desorption system consists of a fixed-bed adsorber with an outer diameter of 51 mm, inner diameter of 22 mm, and height of 500 mm. The temperature of the fixed-bed adsorber is controlled by a circulating oil bath. Gas concentration measurement points are located at the inlet and outlet of the fixed-bed adsorber, and a type K thermocouple inserted into the bed is used for measuring bed temperature.
This study employed a handheld portable VOC detector (PV6001, Hunan Rike Instrument Co., Ltd., Changsha, China) to measure VOC gas concentration. The instrument has a range of 5000 ppm, an accuracy of 0.1 ppm, and a response time of 1 s. Before each experiment, the VOC detector was calibrated using high-purity nitrogen and a standard gas (isobutylene).
To ensure the stability of the desorption experiments, adsorption experiments were first conducted at the desorption experiment temperature. When the VOC concentration at the outlet of the fixed bed was equal to the inlet concentration (400 ppm), the adsorption experiment was concluded (180 min). At this point, the adsorbent was saturated with adsorption at the desorption experiment temperature. Subsequently, the inlet gas to the fixed bed was switched to nitrogen, initiating the desorption experiment and obtaining a desorption breakthrough curve, ensuring the continuity of the experiment. The saturated adsorption amount of the adsorbent was obtained by integrating the desorption breakthrough curve, as calculated by Equation (1). By altering the experimental conditions, adsorption isotherms and desorption breakthrough curves for different adsorption systems at different temperatures were obtained.
In the equation, q is the adsorption amount of the adsorbent (mg/g), Q is the nitrogen volumetric flow rate during the desorption process (Nm3/h), cout is the concentration of VOCs at the outlet of the fixed bed during the desorption process (mg/Nm3), c0 is the concentration of VOCs at the inlet of the fixed bed during the adsorption process (mg/Nm3), V is the free space volume of the fixed bed and gas pipeline (Nm3), and m is the mass of adsorbent in the fixed bed (g).
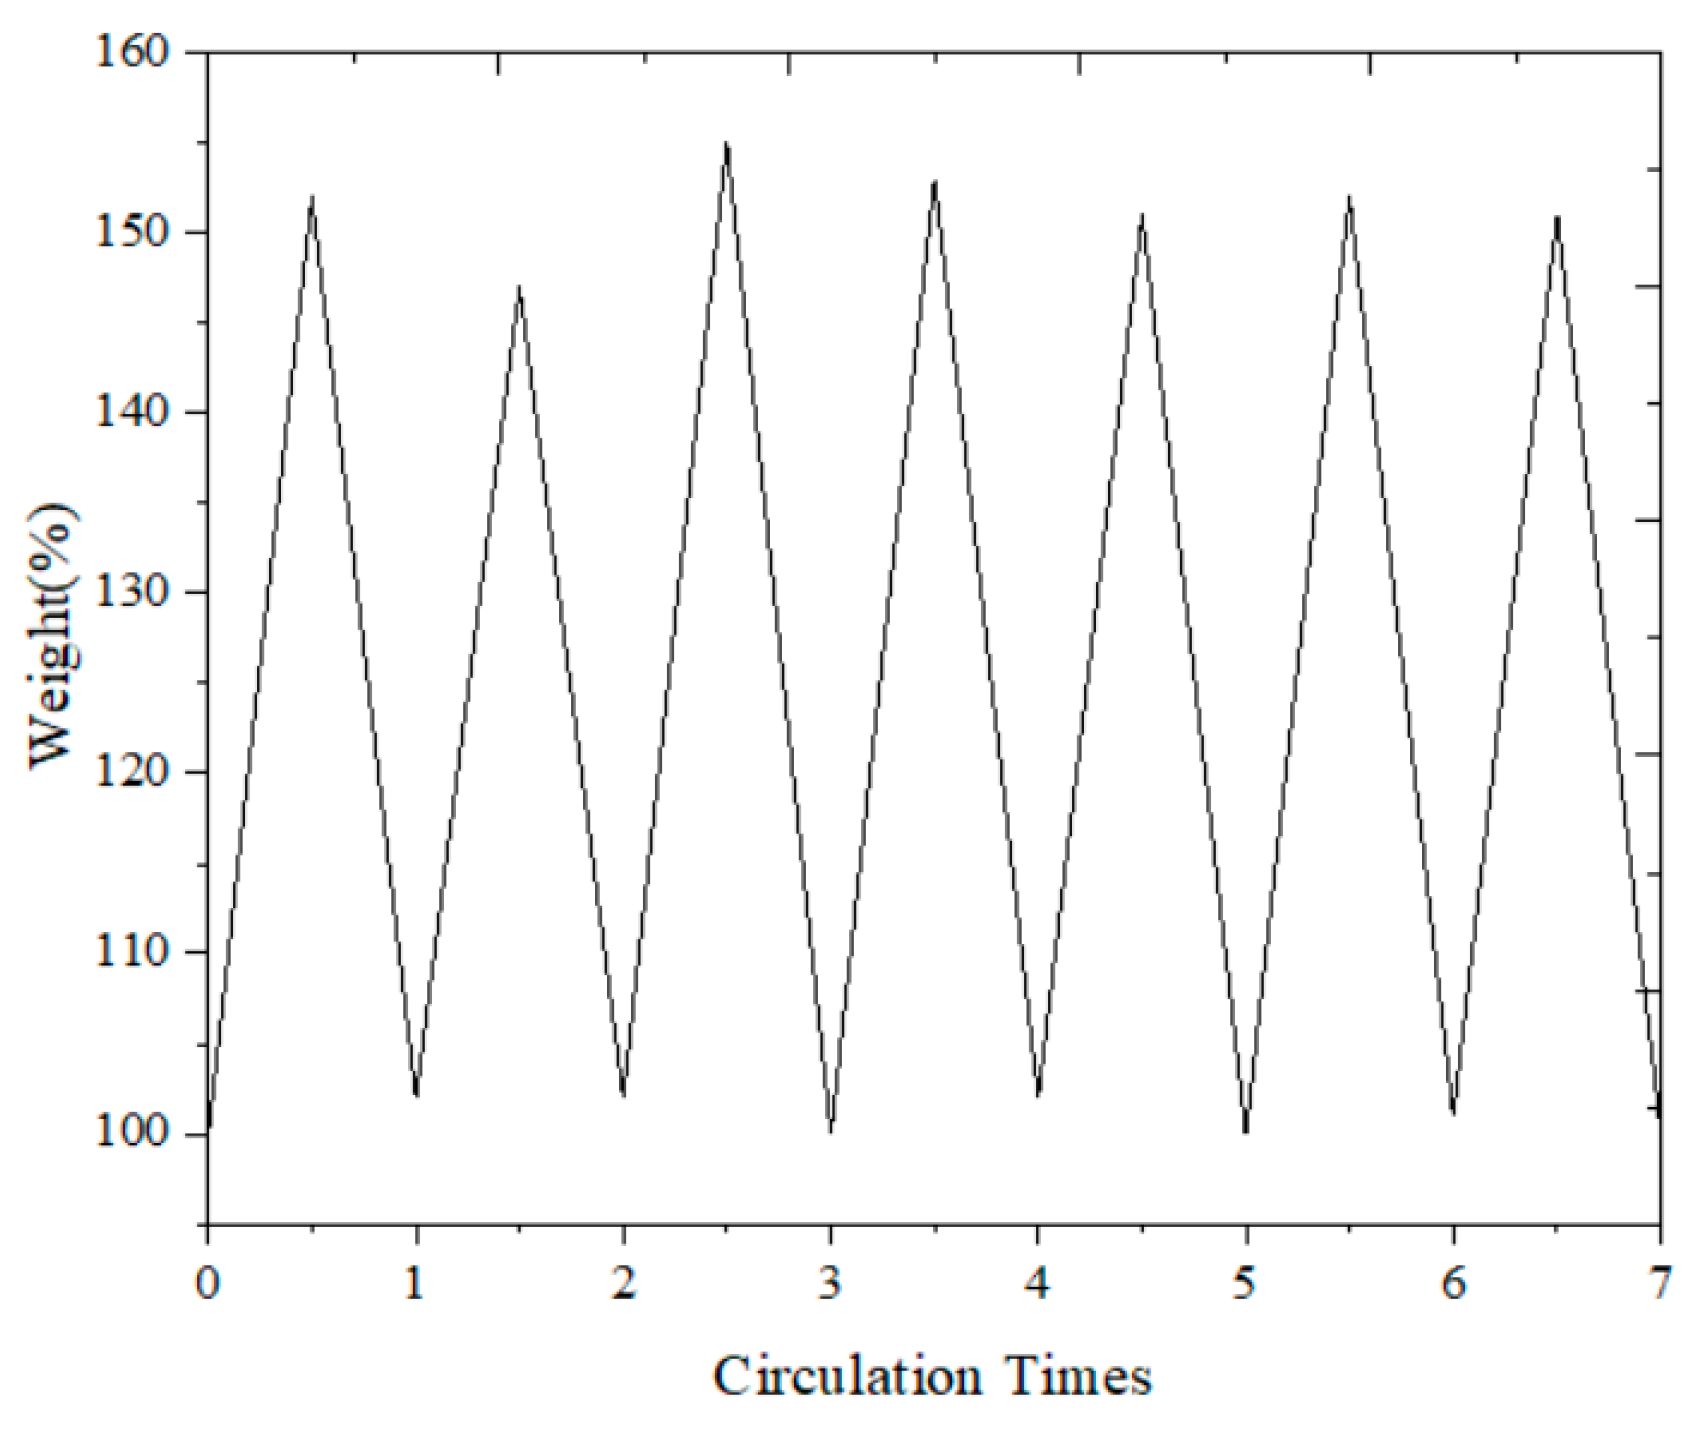
To verify the stability of the adsorbent for repeated use, we conducted a series of regeneration tests. These tests involved multiple cycles of adsorption and desorption to evaluate the performance and durability of the HCP-5 adsorbent. The results, which are presented in Figure 2, illustrate that the adsorbent maintains its effectiveness and stability throughout the regeneration process. This confirms that the HCP-5 adsorbent is suitable for repeated use, showcasing its robustness and reliability in practical applications.
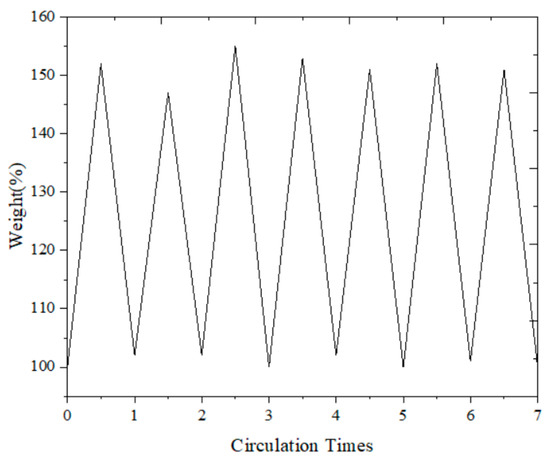
Figure 2.
Reusability of HCP-5: weight change curve.
3. Mathematical Model
3.1. Mass Transfer Process Analysis
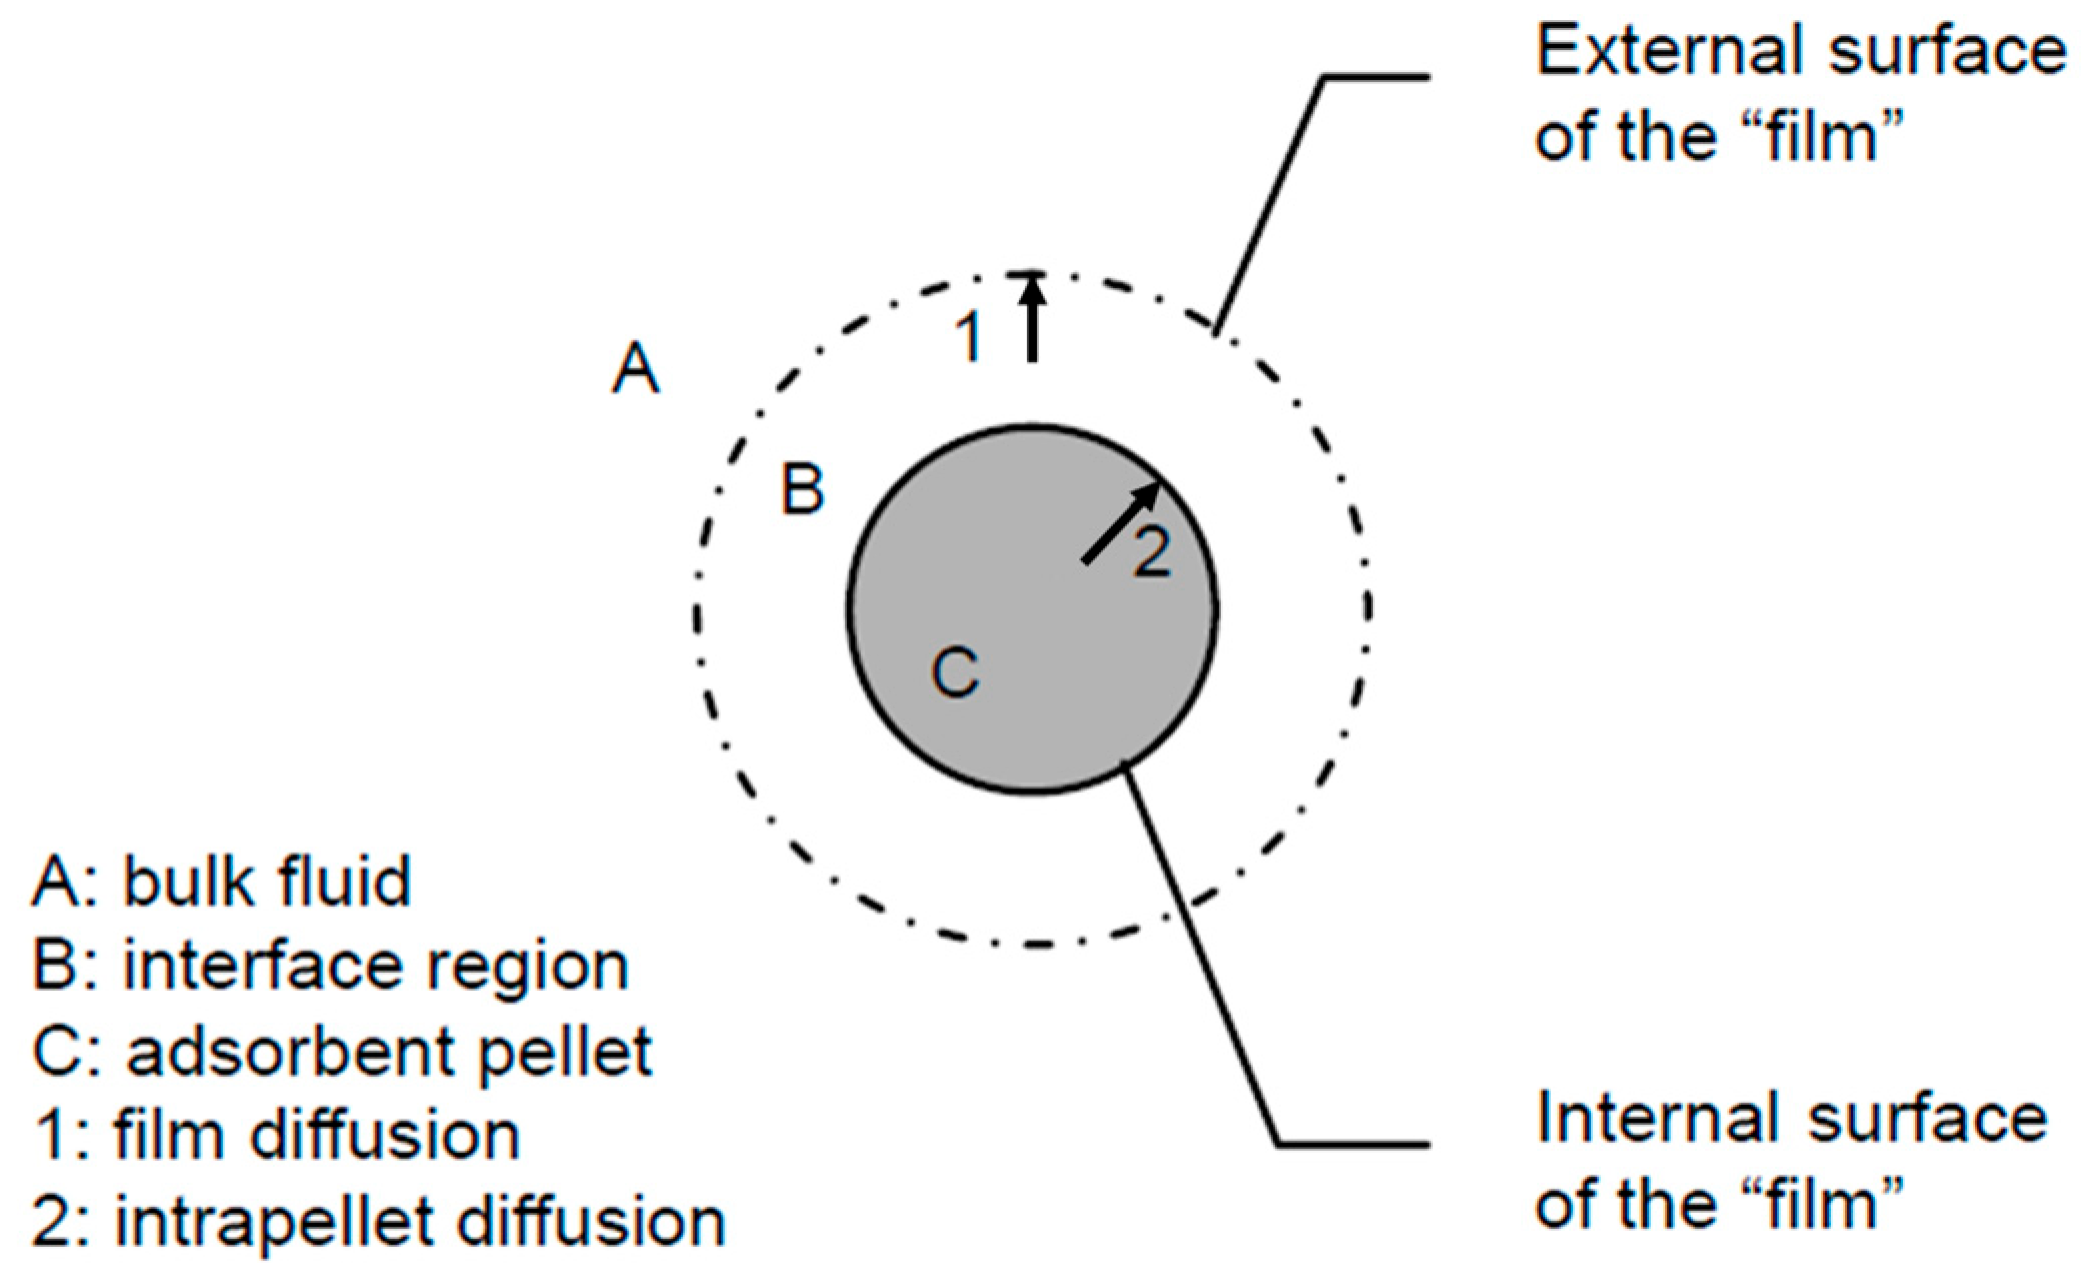
The mass transfer process of the adsorbate in the adsorbent during the desorption process is illustrated in Figure 3. It primarily includes the desorption process on the internal surface of the adsorbent, the intraparticle mass transfer process within the pores of the adsorbent, and the external mass transfer process on the mass transfer gas film.
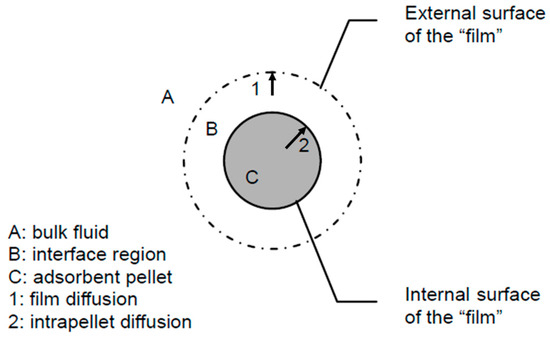
Figure 3.
Mass transfer process of desorption.
Usually, the adsorption or desorption rate of adsorbate molecules at adsorption sites is rapid, with magnitudes roughly comparable to the collision frequency of gas molecules on the internal pore surface of the adsorbent. This rate is much greater than the rates of internal and external mass transfer. Therefore, it is commonly assumed that a dynamic adsorption equilibrium is reached between the gas-phase adsorbate and the solid surface within the pores of the adsorbent. Hence, during the processes of adsorption and desorption, particular emphasis should be placed on considering the internal and external mass transfer processes between the gas and solid phases.
Within the pores of a porous adsorbent, due to the typically minimal gas flow in micropores, the mass transfer process within the adsorbent is often treated as a diffusion process. The internal diffusion process in the adsorbent generally includes molecular diffusion (molecular diffusion coefficient), Knudsen diffusion (Knudsen diffusion coefficient), and surface diffusion (surface diffusion coefficient). When the average free path of molecules is smaller than the pore diameter, the diffusion process inside the pores of the adsorbent is primarily molecular diffusion. When the average free path of molecules is larger than the pore diameter, collisions between gas molecules and the pore wall become the main diffusion pathway, known as Knudsen diffusion. For the typical case of pore diffusion within an adsorbent, both molecular diffusion and Knudsen diffusion coexist and are termed pore diffusion. Surface diffusion refers to the direct transfer phenomenon of adsorbate molecules already adsorbed on the internal pore surface of the adsorbent. The formulas for calculating various diffusion coefficients are presented in Table 2.
Table 2.
The formula of diffusion coefficient.
For intraparticle mass transfer processes, when using the linear driving force model (LDF) to represent the mass transfer rate, the internal diffusion process can be greatly simplified, reducing the computational complexity of the model. This makes it a widely used model [19,20,21], and its mass transfer rate equation is generally expressed as
where
The process from the outer surface of the adsorbent to the gas phase is the external mass transfer process. For external mass transfer processes, the mass transfer rate equation is generally expressed using the LDF model as follows:
During the desorption process, the internal and external mass transfer rates are equal. By combining Equations (2) and (4), we can obtain
where
where kp is the internal mass transfer coefficient (m/s), kf is the external mass transfer coefficient (m/s), K is the overall mass transfer coefficient (m/s), ap is the external surface area per unit volume of adsorbent (1/m), ρp is the density of adsorbent particles (g/m3), c* is the equilibrium gas-phase VOC concentration corresponding to the average adsorption capacity q (mg/Nm3), c is the gas-phase main VOC concentration (mg/Nm3), and cs is the gas-phase VOC concentration on the particle surface (mg/Nm3).
3.2. Adsorption Breakthrough Curve Model
We aim to establish a foundational model to clearly present the core features of desorption kinetics. During the preliminary research phase, overly complex models may lead to intractable results, potentially affecting the understanding of fundamental phenomena. Therefore, we chose a simplified model to focus on the primary variables.
To establish a mathematical model for the fixed-bed desorption process, the following assumptions are made: (1) uniform temperature throughout the fixed bed; (2) ideal plug flow model for gas flow; (3) neglecting the accumulation of gas-phase adsorbate in the pores of adsorbent particles.
In the desorption process of a fixed bed, the differential equation for mass transfer can be expressed as
The mass transfer rate equation can be expressed as
With initial conditions
With initial conditions
where u is the superficial gas velocity (m/s), t is the reaction time (s), z is the axial height (m), c is the gas-phase main VOC concentration (mg/Nm3), q is the average adsorption capacity of the adsorbent (mg/g), ε is the bed void fraction (-), and ρp is the density of adsorbent particles (kg/m3).
For the differential equation of fixed-bed desorption, where the overall mass transfer coefficient (K) is an unknown, assuming it as an initial value (K0), a set of desorption breakthrough curves can be calculated. At this point, the mean square of errors (MSE) between experimental and calculated breakthrough curves can be calculated using Equation (6). By changing the value of the mass transfer coefficient, when MSE is minimized, the calculated breakthrough curve corresponds to the mass transfer coefficient of the system. Then, the desorption velocity of the fixed bed is increased. When the overall mass transfer coefficient does not change with the increase in velocity, the influence of external diffusion is essentially eliminated, and the overall mass transfer coefficient is equal to the internal mass transfer coefficient (kp = K).
where n is the number of data points (−) and and are the experimental and calculated VOCs concentrations, respectively.
4. Results and Discussion
4.1. Adsorption Isotherms
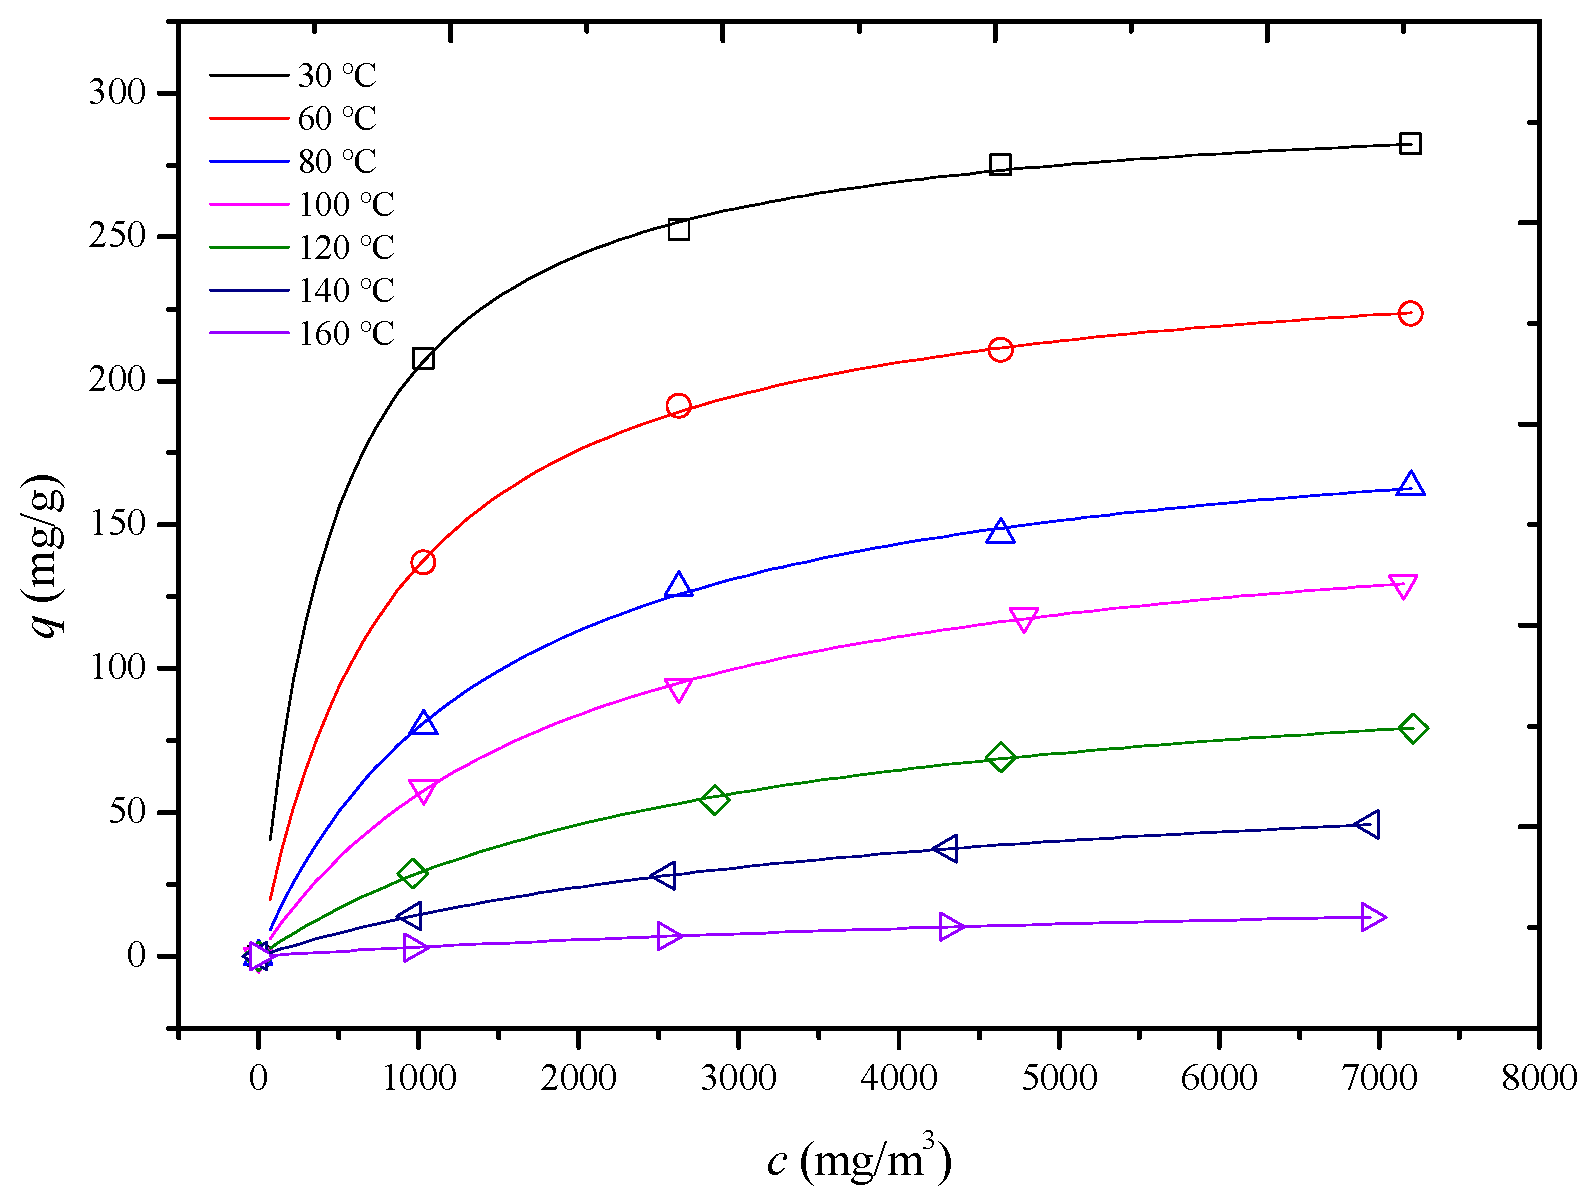
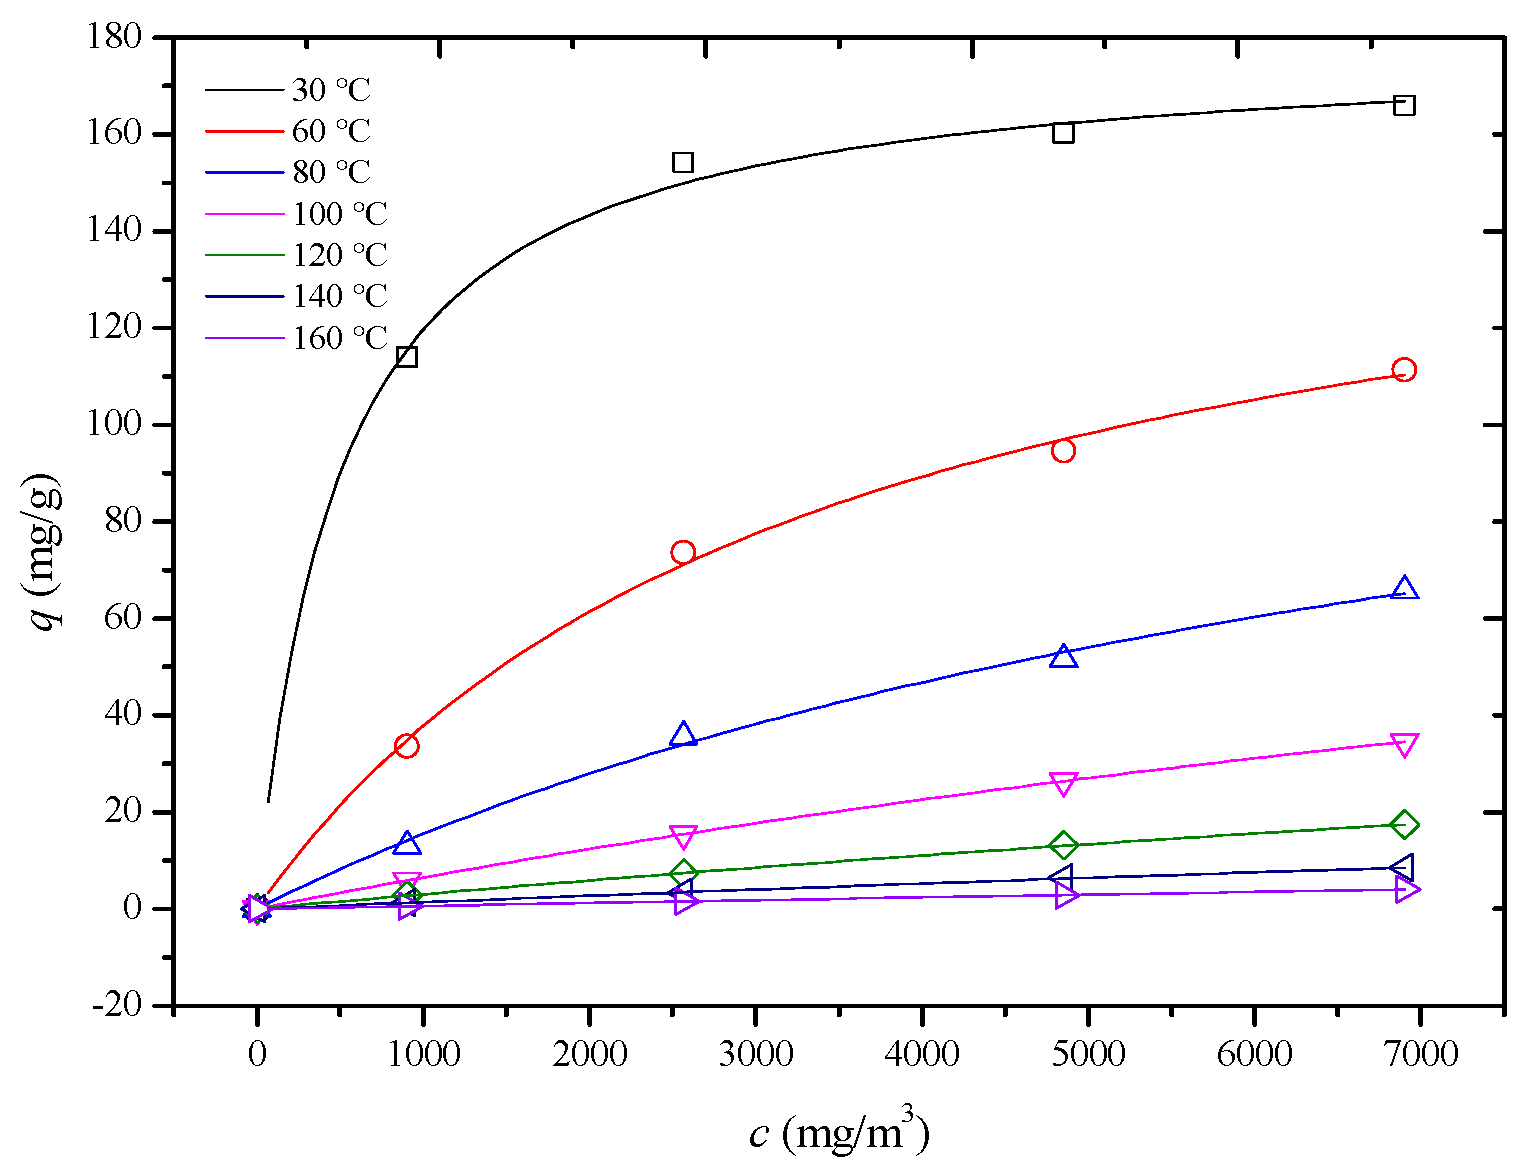
In this study, adsorption isotherms of an HCP-5 adsorbent with systems of o-xylene and ethyl acetate were measured at seven temperature and four concentration conditions shown in Figure 4 and Figure 5 (point). In 1918, Langmuir derived the adsorption isotherm for monolayer adsorption from kinetic theory, known as the Langmuir adsorption isotherm equation, as shown in Equation (10) [22]. Using the least squares method, the Langmuir adsorption isotherm equation was employed to perform regression analysis on experimental data for different adsorption systems. The results are presented in Table 3, Figure 4 and Figure 5 (line) (R2 > 0.98). This indicates that the adsorption process adheres to a monolayer adsorption mechanism, where each adsorption site on the adsorbent surface has equivalent energy, and the adsorbate forms a single layer.
where qm is the maximum adsorption capacity, indicating the highest amount of adsorbate that can be adsorbed onto the adsorbent per unit weight. kL is the Langmuir constant, reflecting the affinity between the adsorbent and the adsorbate.
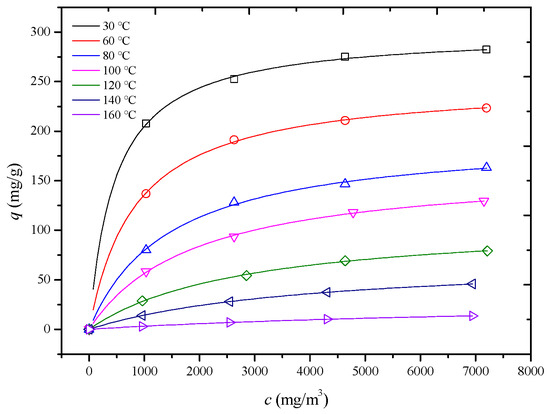
Figure 4.
Comparison of calculated (line) and experimental (point) adsorption isotherm of HCP-5 and o-xylene system.
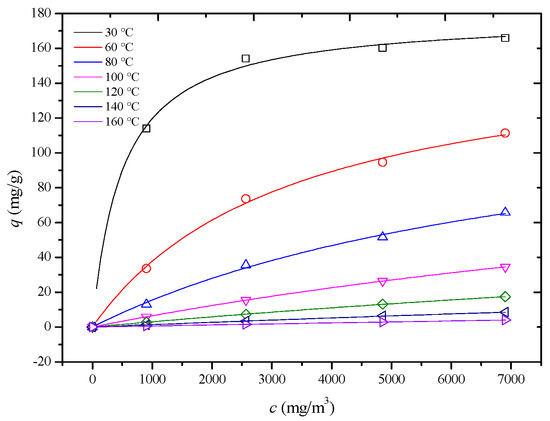
Figure 5.
Comparison of calculated (line) and experimental (point) adsorption isotherm of HCP-5 and ethyl acetate system.
Table 3.
Regression results with Langmuir isotherm.
4.2. Effect of Air Velocity on Overall Mass Transfer Coefficient
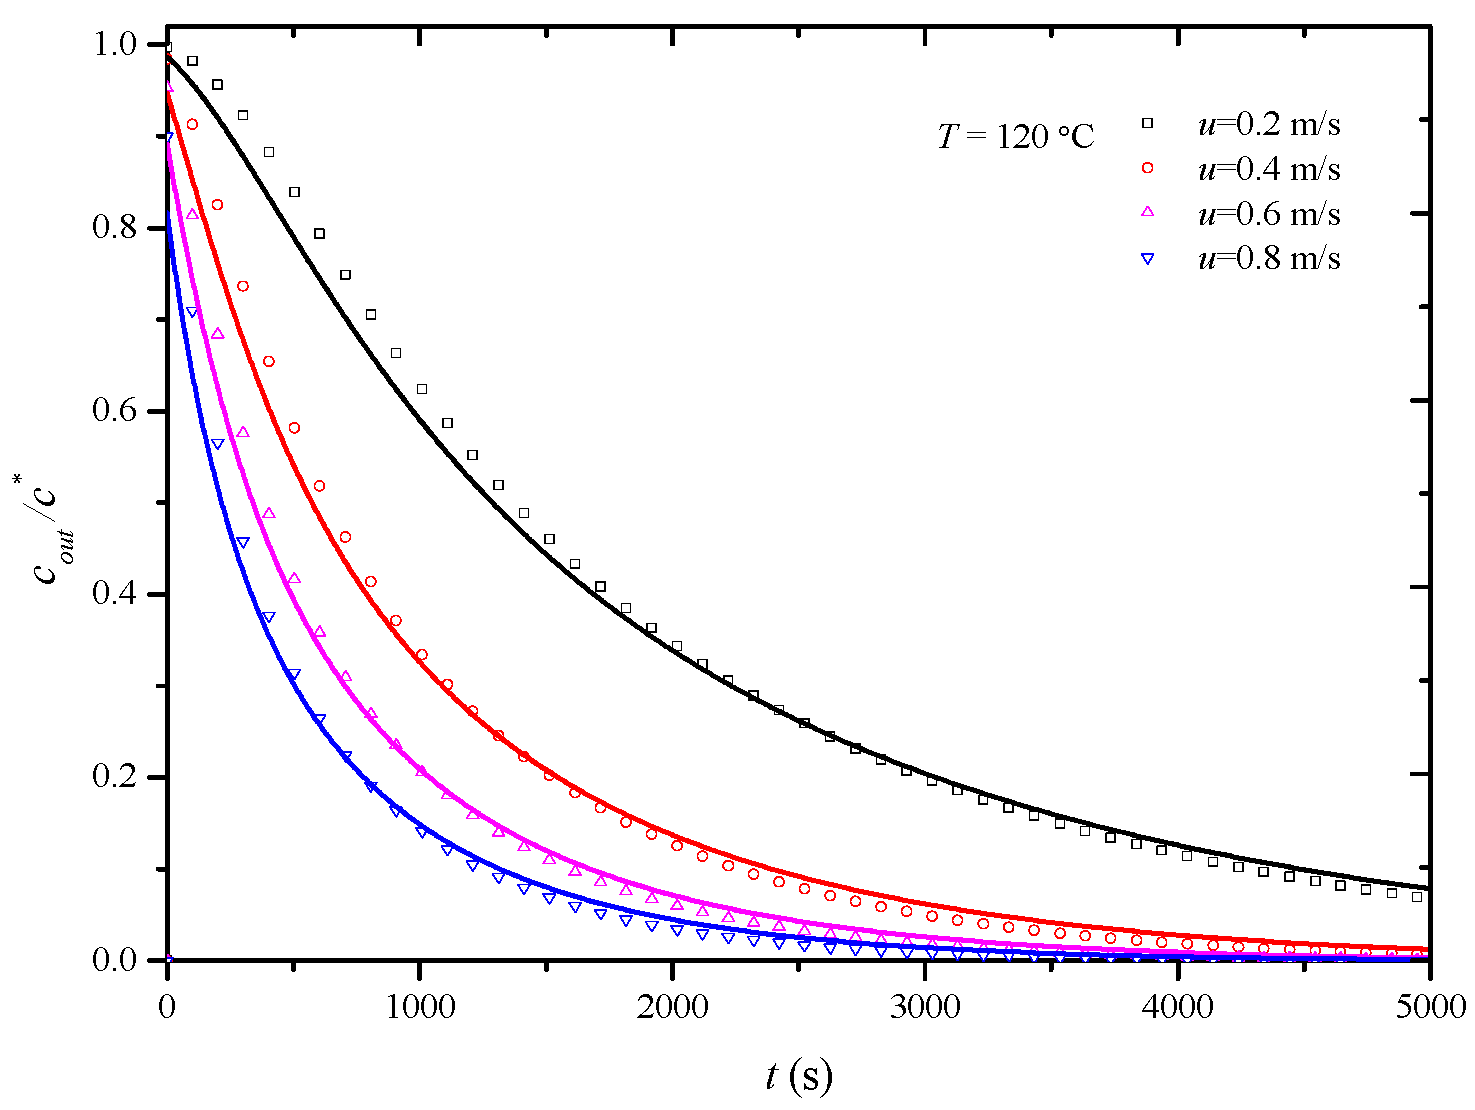
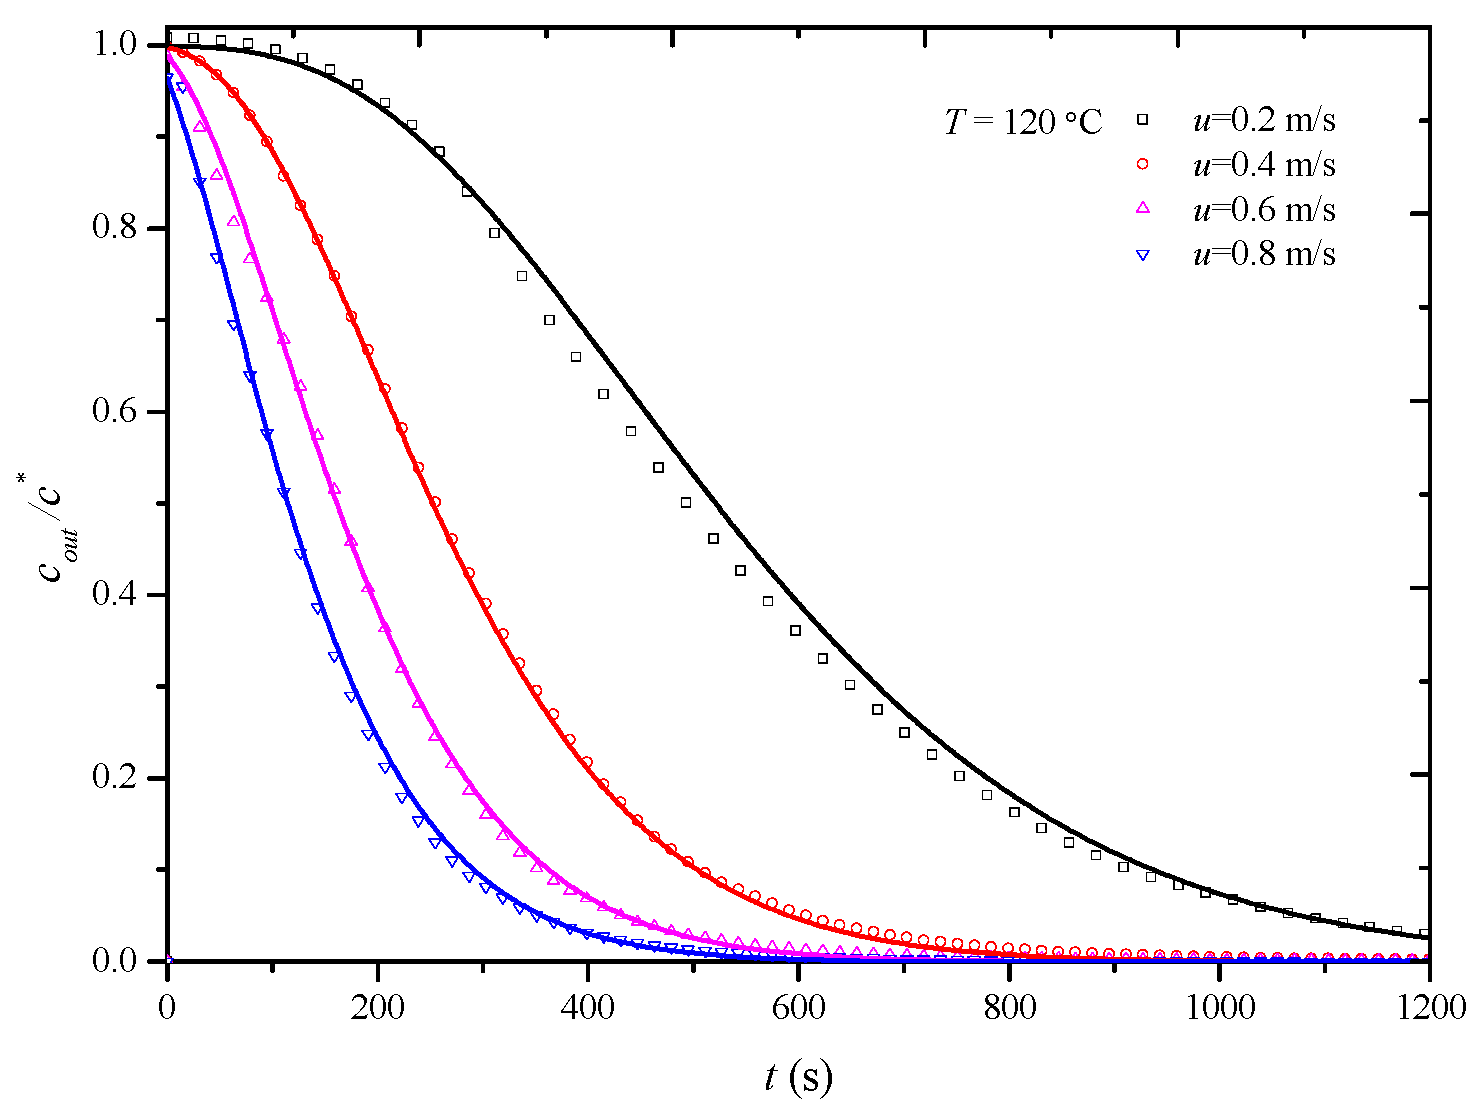
In this study, penetration curves for the desorption process of the HCP-5 adsorbent with o-xylene and ethyl acetate systems were initially determined at 120 °C under various air velocities: 0.2 m/s, 0.4 m/s, 0.6 m/s, and 0.8 m/s. The overall mass transfer coefficients under experimental conditions were then obtained through simulation calculations. Figure 6 and Figure 7, respectively, illustrate the comparison between calculated (lines) and experimental (points) desorption penetration curves at different apparent air velocities. From the figures, it can be observed that the calculated and experimental penetration curves exhibit similar trends and a good agreement, accurately describing the desorption penetration process under different apparent air velocities.
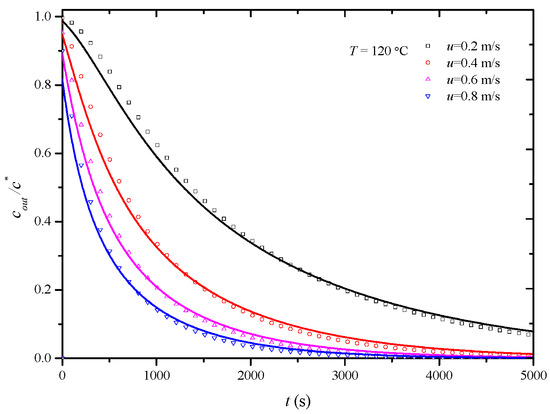
Figure 6.
Comparison of calculated (line) and experimental (point) breakthrough curve of HCP-5 adsorbent and o-xylene system.
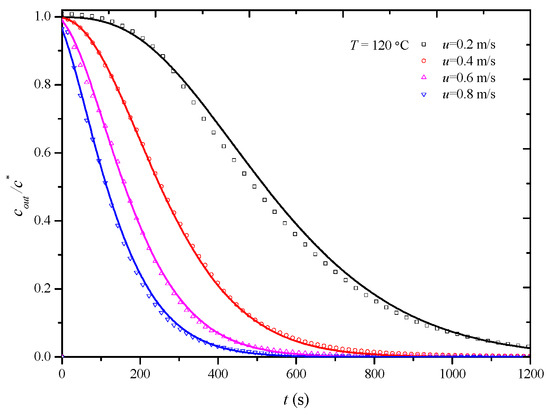
Figure 7.
Comparison of calculated (line) and experimental (point) breakthrough curve of HCP-5 adsorbent and ethyl acetate system.
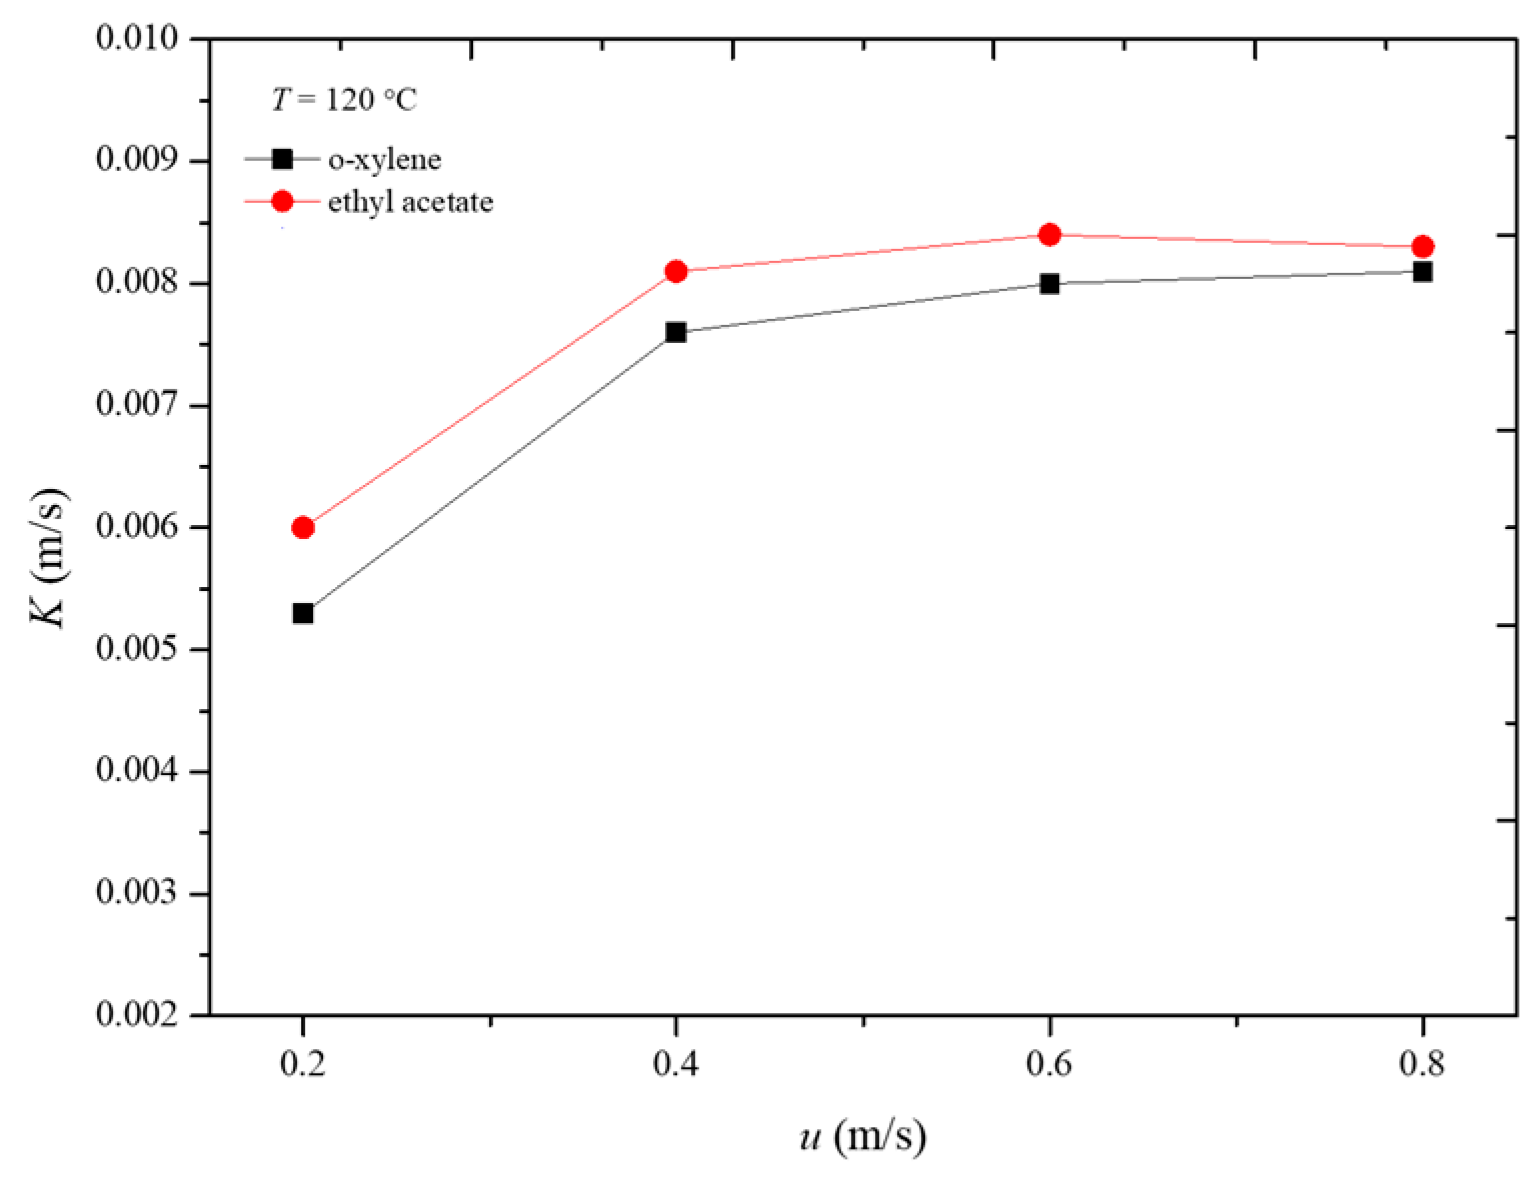
Figure 8 illustrates the variation in the overall mass transfer coefficient with apparent air velocity during the desorption process of the two adsorbates at 120 °C. It can be observed that, when the apparent air velocity is 0.6 m/s, the influence of external diffusion has been essentially eliminated. At this point, the overall mass transfer coefficient represents the internal mass transfer coefficient. Therefore, under the conditions of 120 °C, the internal mass transfer coefficients for o-xylene and ethyl acetate during the desorption process are 0.0081 m/s and 0.0084 m/s, respectively. The internal mass transfer coefficients for o-xylene and ethyl acetate are nearly equal. This similarity can be attributed to the comparable molecular sizes and diffusion characteristics of the two adsorbates within the adsorbent under the given conditions. The similar internal mass transfer coefficients suggest that both compounds interact with the adsorbent in a comparable manner, leading to similar mass transfer dynamics during desorption [23,24,25].
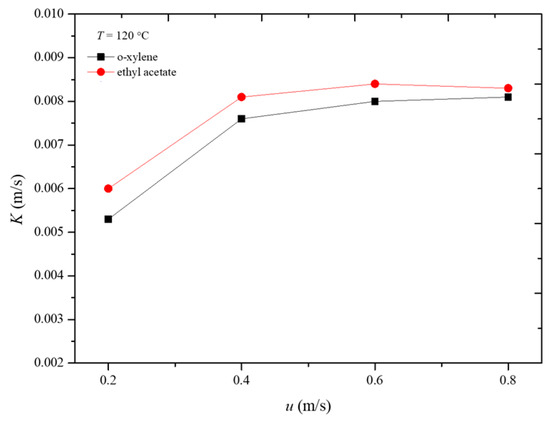
Figure 8.
Variation in overall mass transfer coefficient with gas velocity in desorption process.
4.3. Effect of Temperature on Internal Mass Transfer Coefficient
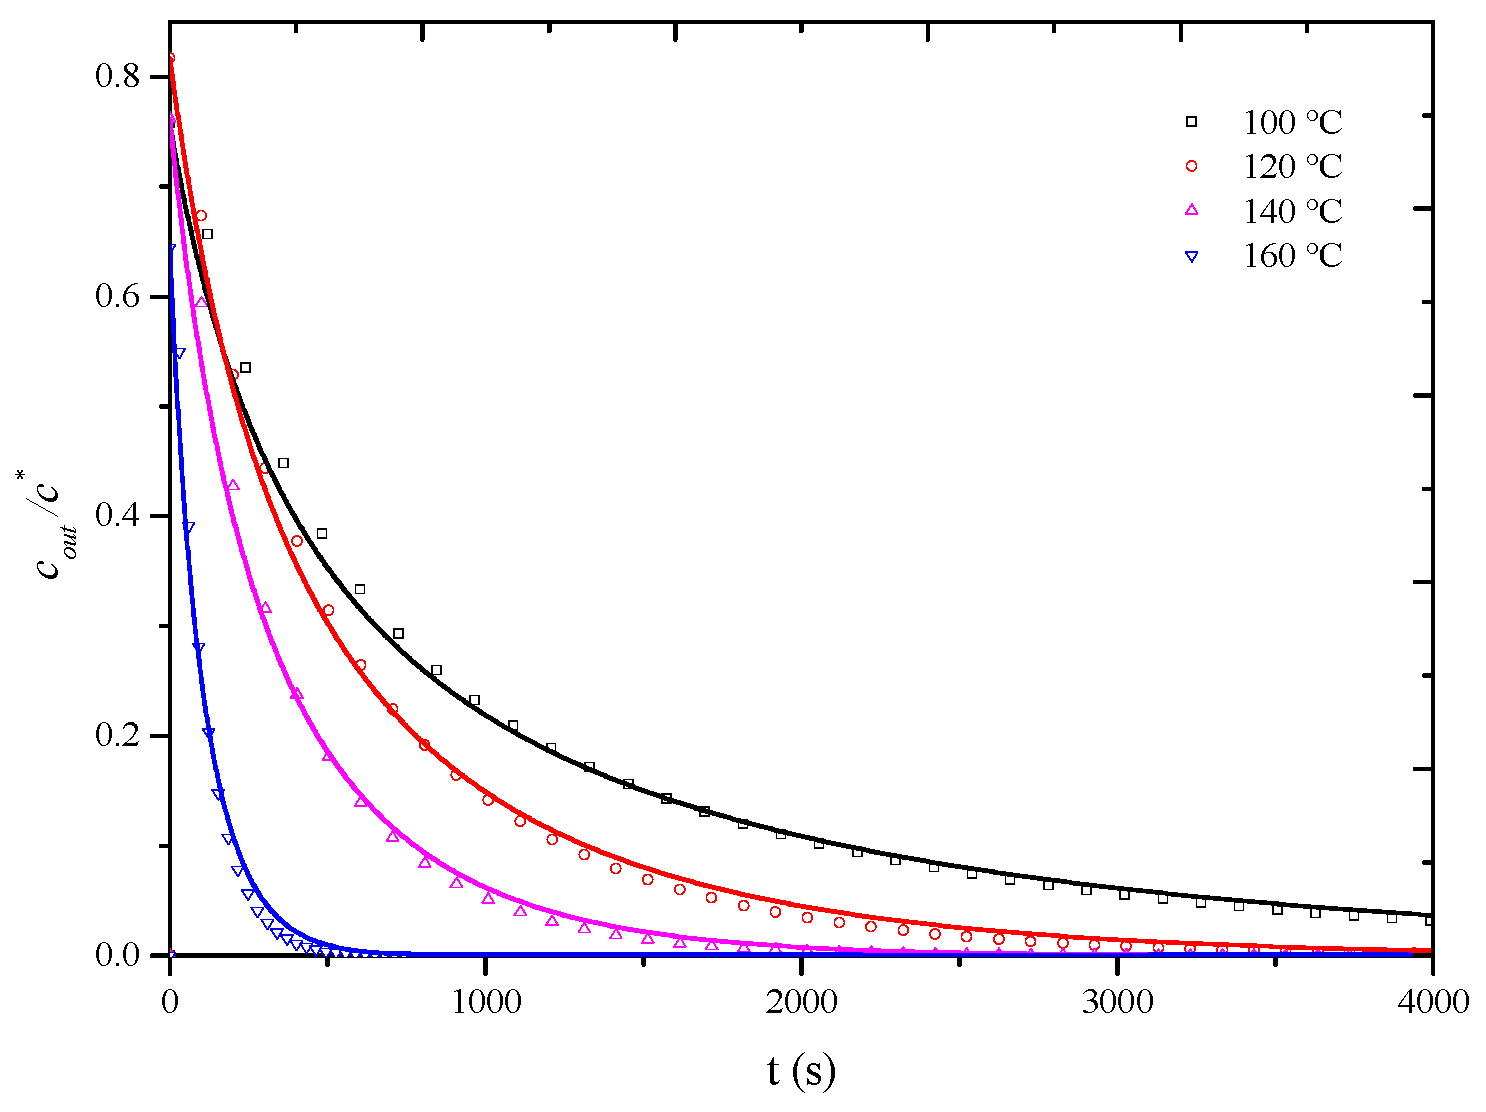
As observed in Figure 8, at a desorption temperature of 120 °C, when the apparent air velocity exceeds 0.6 m/s, the influence of external diffusion is essentially eliminated, and the measured overall mass transfer coefficient represents the internal mass transfer coefficient, assuming that, at desorption temperatures of 100 °C, 140 °C, and 160 °C, the influence of external diffusion is also essentially eliminated when the air velocity exceeds 0.6 m/s. To completely eliminate the influence of external diffusion, desorption penetration curves for the HCP-5 adsorbent with o-xylene and ethyl acetate systems were measured at temperatures of 100 °C, 140 °C, and 160 °C under a wind speed of 0.8 m/s. The corresponding internal mass transfer coefficients were obtained through simulation calculations. Experimental conditions and fitting results are presented in Table 4, while Figure 9 and Figure 10, respectively, illustrate the comparison between calculated (lines) and experimental (points) desorption penetration curves at different desorption temperatures. From the figures, it can be seen that the calculated and experimental penetration curves exhibit similar trends and a good agreement, accurately describing the desorption penetration process at different desorption temperatures.
Table 4.
Experimental conditions and fitting results under different temperatures.
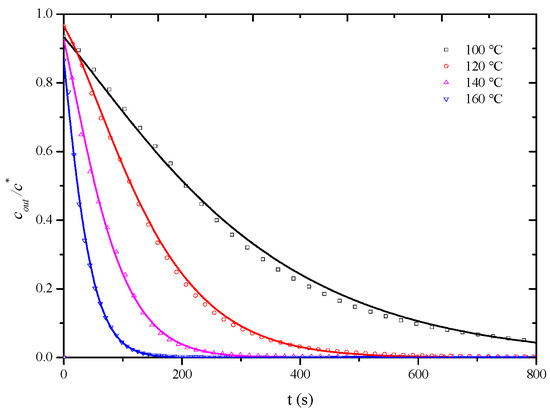
Figure 9.
Comparison of calculated (line) and experimental (point) breakthrough curve of HCP-5 adsorbent and o-xylene system.

Figure 10.
Comparison of calculated (line) and experimental (point) breakthrough curve of HCP-5 adsorbent and ethyl acetate system.
Figure 11 illustrates the variation in the internal mass transfer coefficient for the HCP-5 adsorbent with o-xylene and ethyl acetate systems at different desorption temperatures. It can be observed from the figure that the internal mass transfer coefficients for o-xylene and ethyl acetate are essentially equal. Within the temperature range of 100 to 160 °C, the internal mass transfer coefficients increase initially and then decrease with temperature. At a desorption temperature of 120 °C, the internal mass transfer coefficients reach their maximum values, measured at 0.0081 m/s and 0.0083 m/s for o-xylene and ethyl acetate, respectively.
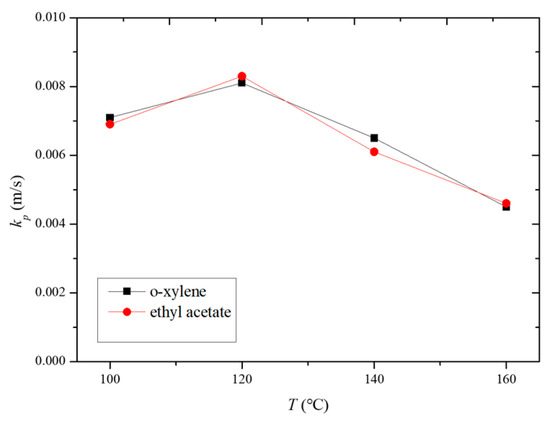
Figure 11.
Variation in intraparticle mass transfer coefficient with desorption temperature.
The observed trend can be explained by considering the factors outlined in Table 2. Both the pore diffusion coefficient and surface diffusion coefficient increase with temperature. Additionally, Figure 4 and Figure 5 reveal that the slope of the adsorption isotherms decreases as the temperature rises. This interplay of increasing diffusion coefficients and decreasing adsorption capacity leads to the observed trend in the internal mass transfer coefficient. Initially, the increase in diffusion coefficients enhances the mass transfer rate, but, as the temperature continues to rise, the decrease in the slope of the adsorption isotherms starts to dominate, leading to a reduction in the internal mass transfer coefficient [26,27,28].
4.4. Comparison of Adsorption and Desorption Internal Mass Transfer
In accordance with Equation (3), the relationship between the internal mass transfer coefficient (kp) and the pore diffusion coefficient (Dp) and surface diffusion coefficient (Ds) can be expressed as
Here, the first term represents the contribution of pore diffusion to the internal mass transfer coefficient and the second term represents the contribution of surface diffusion to the internal mass transfer coefficient. By calculating the contribution of pore diffusion to the internal mass transfer coefficient at different temperatures based on Table 2, and subsequently using the measured internal mass transfer coefficients in the equation, the contribution of surface diffusion to the internal mass transfer coefficient can be determined. Table 5 presents the diffusion coefficients obtained through this method for the adsorption and desorption processes of the HCP-5 adsorbent with the ethyl acetate system. The internal mass transfer coefficients for the adsorption process are referenced from the experimental results of Wang Lina [9].
Table 5.
Theoretical calculation of diffusion coefficients for adsorption and desorption processes.
Table 5 reveals distinct differences in the role of diffusion processes during adsorption and desorption with the HCP-5 adsorbent. During the adsorption phase, surface diffusion is the predominant mechanism, contributing significantly more to internal mass transfer than pore diffusion, by a factor of 55. This suggests that surface diffusion is the primary rate-limiting step in internal mass transfer under adsorption conditions.
In contrast, during desorption, the contributions of surface and pore diffusion to internal mass transfer become nearly equal, indicating a shift in the controlling mechanisms. This balance suggests that both diffusion processes play an important role in the desorption phase. The notable reduction in the contribution of surface diffusion during desorption, relative to its dominant role in adsorption, results in a substantial decrease in the overall internal mass transfer coefficient—approximately one-twentieth of the value observed during adsorption [29,30].
This decrease may be attributed to changes in the adsorbent’s properties and the dynamic nature of the desorption process, which alters the efficiency of surface and pore diffusion. The decreased role of surface diffusion during desorption could reflect changes in the adsorbent’s surface characteristics or changes in the interactions between the adsorbate and adsorbent. Such shifts highlight the need for a detailed understanding of these mechanisms to optimize both adsorption and desorption processes.
5. Conclusions
This study experimentally investigated the adsorption isotherms and internal mass transfer coefficients during the desorption processes of the HCP-5 adsorbent with o-xylene and ethyl acetate at varying temperatures. The key findings are summarized as follows:
1. Adsorption Isotherms: The adsorption isotherms of the HCP-5 adsorbent with o-xylene and ethyl acetate were determined across a temperature range of 30 to 160 °C. The Langmuir adsorption isotherm model was utilized to fit the experimental data, providing a quantitative description of the adsorption behavior of the adsorbent.
2. Internal Mass Transfer Coefficients: During the desorption processes at temperatures between 100 and 160 °C, the internal mass transfer coefficients for both o-xylene and ethyl acetate were found to be similar. The coefficients demonstrated a trend of an initial increase with temperature, followed by a subsequent decrease. This trend reflects the complex interplay between temperature and the adsorbent’s properties, such as pore diffusion and surface diffusion characteristics.
3. Comparison Between Adsorption and Desorption: This study revealed a significant change in the role of surface diffusion during the desorption process compared to adsorption. Specifically, the contribution of surface diffusion to internal mass transfer decreased during desorption, resulting in a notable reduction in the internal mass transfer coefficients—approximately one-twentieth of the values observed during the adsorption process. This decrease highlights the shift in the controlling mechanisms from surface diffusion to a more balanced role of surface and pore diffusion during desorption.
These findings provide insights into the mass transfer dynamics of VOCs in the HCP-5 adsorbent, offering valuable information for optimizing both adsorption and desorption processes in practical applications.
Author Contributions
J.Z.: Conceptualization, methodology, writing—original draft preparation. C.Y.: mathematical modeling, experimental design, data collection. M.X.: project administration. X.L.: funding acquisition. X.Z.: data interpretation, writing—review and editing. All authors have read and agreed to the published version of the manuscript.
Funding
This research was funded by the Research on Direct Air Capture Technology of China National Petroleum Corporation (CNPC) [grant numbers 2022DJ6607].
Data Availability Statement
Data are contained within the article.
Conflicts of Interest
Authors Jiale Zheng, Chuanruo Yang, Ming Xue, Xingchun Li and Xinglei Zhao were employed by the company CNPC Research Institute of Safety and Environmental Technology.
References
- Huang, R.-J.; Zhang, Y.; Bozzetti, C.; Ho, K.-F.; Cao, J.-J.; Han, Y.; Daellenbach, K.R.; Slowik, J.G.; Platt, S.M.; Canonaco, F. High secondary aerosol contribution to particulate pollution during haze events in China. Nature 2014, 514, 218–222. [Google Scholar] [CrossRef] [PubMed]
- Wu, X.; Huang, W.; Zhang, Y.; Zheng, C.; Jiang, X.; Gao, X.; Cen, K. Characteristics and uncertainty of industrial VOCs emissions in China. Aerosol Air Qual. Res. 2015, 15, 1045–1058. [Google Scholar] [CrossRef]
- Jiyu, Y. Determination of VOCs source strength and analysis of typical pollution control measures in environmental impact assessment of wood furniture. Environ. Dev. 2019, 31, 30–31. [Google Scholar]
- Du, Z.; Yuan, X.L.; Ren, A.L.; Fu, F.Y. Typical Pharmaceutical Process VOCs and Stench Pollution Characteristics and Control Techniques. Adv. Mater. Res. 2013, 726–731, 2017–2021. [Google Scholar] [CrossRef]
- Zheng, G.; Wei, K.; Kang, X.; Fan, W.; Ma, N.L.; Verma, M.; Ng, H.S.; Ge, S. A new attempt to control volatile organic compounds (VOCs) pollution—Modification technology of biomass for adsorption of VOCs gas. Environ. Pollut. 2023, 336, 122451. [Google Scholar] [CrossRef]
- Pei, L.X.; Lv, Z.M.; Zhang, L.Z. Selective adsorption of a novel high selective desiccant for prospective use in heat and moisture recovery for buildings. Build. Environ. 2012, 49, 124–128. [Google Scholar] [CrossRef]
- Kim, Y.H. Development of process model of a rotary kiln for volatile organic compound recovery from coconut shell. Korean J. Chem. Eng. 2012, 29, 1674–1679. [Google Scholar] [CrossRef]
- Zheng, J.; Song, W.; Du, L.; Wang, L.; Li, S. Desorption of VOC from polymer adsorbent in multistage fluidized bed. Chin. J. Chem. Eng. 2020, 28, 1709–1716. [Google Scholar] [CrossRef]
- Wang, L.; Zheng, J.; Du, L.; Li, S.; Song, W. Study on mass transfer of ethyl acetate in polymer adsorbent by experimental and theoretical breakthrough curves. Chin. J. Chem. Eng. 2020, 28, 84–89. [Google Scholar] [CrossRef]
- Brosillon, S.; Manero, M.-H.; Foussard, J.-N. Mass transfer in VOC adsorption on zeolite: Experimental and theoretical breakthrough curves. Environ. Sci. Technol. 2001, 35, 3571–3575. [Google Scholar] [CrossRef]
- Weber Jr, W.; Liu, K. Determination of mass transport parameters for fixed-bed adsorbers. Chem. Eng. Commun. 1980, 6, 49–60. [Google Scholar] [CrossRef]
- Marin, P.; Borba, C.E.; Módenes, A.N.; Espinoza-Quiñones, F.R.; de Oliveira, S.P.D.; Kroumov, A.D. Determination of the mass transfer limiting step of dye adsorption onto commercial adsorbent by using mathematical models. Environ. Technol. 2014, 35, 2356–2364. [Google Scholar] [CrossRef] [PubMed]
- Chang, Y.; Zheng, J.; Du, L.; Li, S.; Song, W. Resin based spherical activated carbon for fluidized bed and its VOCs adsorption performance. Guocheng Gongcheng Xuebao 2018, 18, 1112–1118. [Google Scholar]
- Tong, R.; Zhang, L.; Yang, X.; Liu, J.; Zhou, P.; Li, J. Emission characteristics and probabilistic health risk of volatile organic compounds from solvents in wooden furniture manufacturing. J. Clean. Prod. 2019, 208, 1096–1108. [Google Scholar] [CrossRef]
- Fuller, E.N.; Schettler, P.D.; Giddings, J.C. New method for prediction of binary gas-phase diffusion coefficients. Ind. Eng. Chem. 1966, 58, 18–27. [Google Scholar] [CrossRef]
- Scott, D.; Dullien, F. Diffusion of ideal gases in capillaries and porous solids. AIChE J. 1962, 8, 113–117. [Google Scholar] [CrossRef]
- Maxwell, J.C. Electricity and Magnetism; Dover: New York, NY, USA, 1954; Volume 2. [Google Scholar]
- Gilliland, E.R.; Baddour, R.F.; Perkinson, G.P.; Sladek, K.J. Diffusion on surfaces. I. Effect of concentration on the diffusivity of physically adsorbed gases. Ind. Eng. Chem. Fundam. 1974, 13, 95–100. [Google Scholar] [CrossRef]
- Glueckauf, E. Theory of chromatography. Part 10.—Formulæ for diffusion into spheres and their application to chromatography. Trans. Faraday Soc. 1955, 51, 1540–1551. [Google Scholar] [CrossRef]
- Heese, C.; Worch, E. A New User-Oriented Method for Prediction of Intraparticle Mass Transfer Coefficients for Adsorber Modelling; Eine Neue Anwenderorientierte Methode zur Vorausberechnung von Stoffuebergangskoeffizienten Fuer Die Adsorbermodellierung. 1997. Available online: https://www.osti.gov/etdeweb/biblio/584087 (accessed on 30 July 2024).
- Worch, E. Fixed-bed adsorption in drinking water treatment: A critical review on models and parameter estimation. J. Water Supply Res. Technol.—AQUA 2008, 57, 171–183. [Google Scholar] [CrossRef]
- Langmuir, I. The adsorption of gases on plane surfaces of glass, mica and platinum. J. Am. Chem. Soc. 1918, 40, 1361–1403. [Google Scholar] [CrossRef]
- Frost, A.C.; Sawyer, J.E.; Summers, J.C.; Shah, Y.T.; Dassori, C.G. Kinetics and transport parameters for the fixed-bed catalytic incineration of volatile organic compounds. Environ. Sci. Technol. 1991, 25, 2065–2070. [Google Scholar] [CrossRef]
- Howard-Reed, C.; Corsi, R.L.; Moya, J. Mass transfer of volatile organic compounds from drinking water to indoor air: The role of residential dishwashers. Environ. Sci. Technol. 1999, 33, 2266–2272. [Google Scholar] [CrossRef]
- Li, L.; Liu, Z.; Qin, Y.; Sun, Z.; Song, J.; Tang, L. Estimation of volatile organic compound mass transfer coefficients in the vacuum desorption of acetone from activated carbon. J. Chem. Eng. Data 2010, 55, 4732–4740. [Google Scholar] [CrossRef]
- Meininghaus, C.K.; Prins, R. Sorption of volatile organic compounds on hydrophobic zeolites. Microporous Mesoporous Mater. 2000, 35, 349–365. [Google Scholar] [CrossRef]
- Chen, T.; Fu, C.; Liu, Y.; Pan, F.; Wu, F.; You, Z.; Li, J. Adsorption of volatile organic compounds by mesoporous graphitized carbon: Enhanced organophilicity, humidity resistance, and mass transfer. Sep. Purif. Technol. 2021, 264, 118464. [Google Scholar] [CrossRef]
- Mateus, M.-L.; Lindinger, C.; Gumy, J.-C.; Liardon, R. Release kinetics of volatile organic compounds from roasted and ground coffee: Online measurements by PTR-MS and mathematical modeling. J. Agric. Food Chem. 2007, 55, 10117–10128. [Google Scholar] [CrossRef]
- Kim, H.; Annable, M.D.; Rao, P.S.C. Effect of water content on kinetics of volatile organic compounds mass transfer between gas and aqueous phases during gas transport in unsaturated sand. Soil Sci. 2005, 170, 680–691. [Google Scholar] [CrossRef]
- Sheng, M.; Li, G.; Huang, Z.; Tian, S.; Shah, S.; Geng, L. Pore-scale modeling and analysis of surface diffusion effects on shale-gas flow in Kerogen pores. J. Nat. Gas Sci. Eng. 2015, 27, 979–985. [Google Scholar] [CrossRef]


Disclaimer/Publisher’s Note: The statements, opinions and data contained in all publications are solely those of the individual author(s) and contributor(s) and not of MDPI and/or the editor(s). MDPI and/or the editor(s) disclaim responsibility for any injury to people or property resulting from any ideas, methods, instructions or products referred to in the content. |
© 2024 by the authors. Licensee MDPI, Basel, Switzerland. This article is an open access article distributed under the terms and conditions of the Creative Commons Attribution (CC BY) license (https://creativecommons.org/licenses/by/4.0/).