
Optimization of Ultrasound-Assisted Extraction of Phenolics from Satureja hortensis L. and Antioxidant Activity: Response Surface Methodology Approach


 , and
, and
Abstract
1. Introduction
2. Materials and Methods
2.1. Herbal Material
2.2. Chemicals and Reagents
2.3. Ultrasound Extractions
2.4. TPC and TFC
2.5. DPPH and ABTS Assays
2.6. Experimental Design
2.7. Quantitation Analysis of Optimized HE
2.8. Statistical Analysis with Experimental Design
3. Results and Discussion
3.1. Model System
3.2. TPC
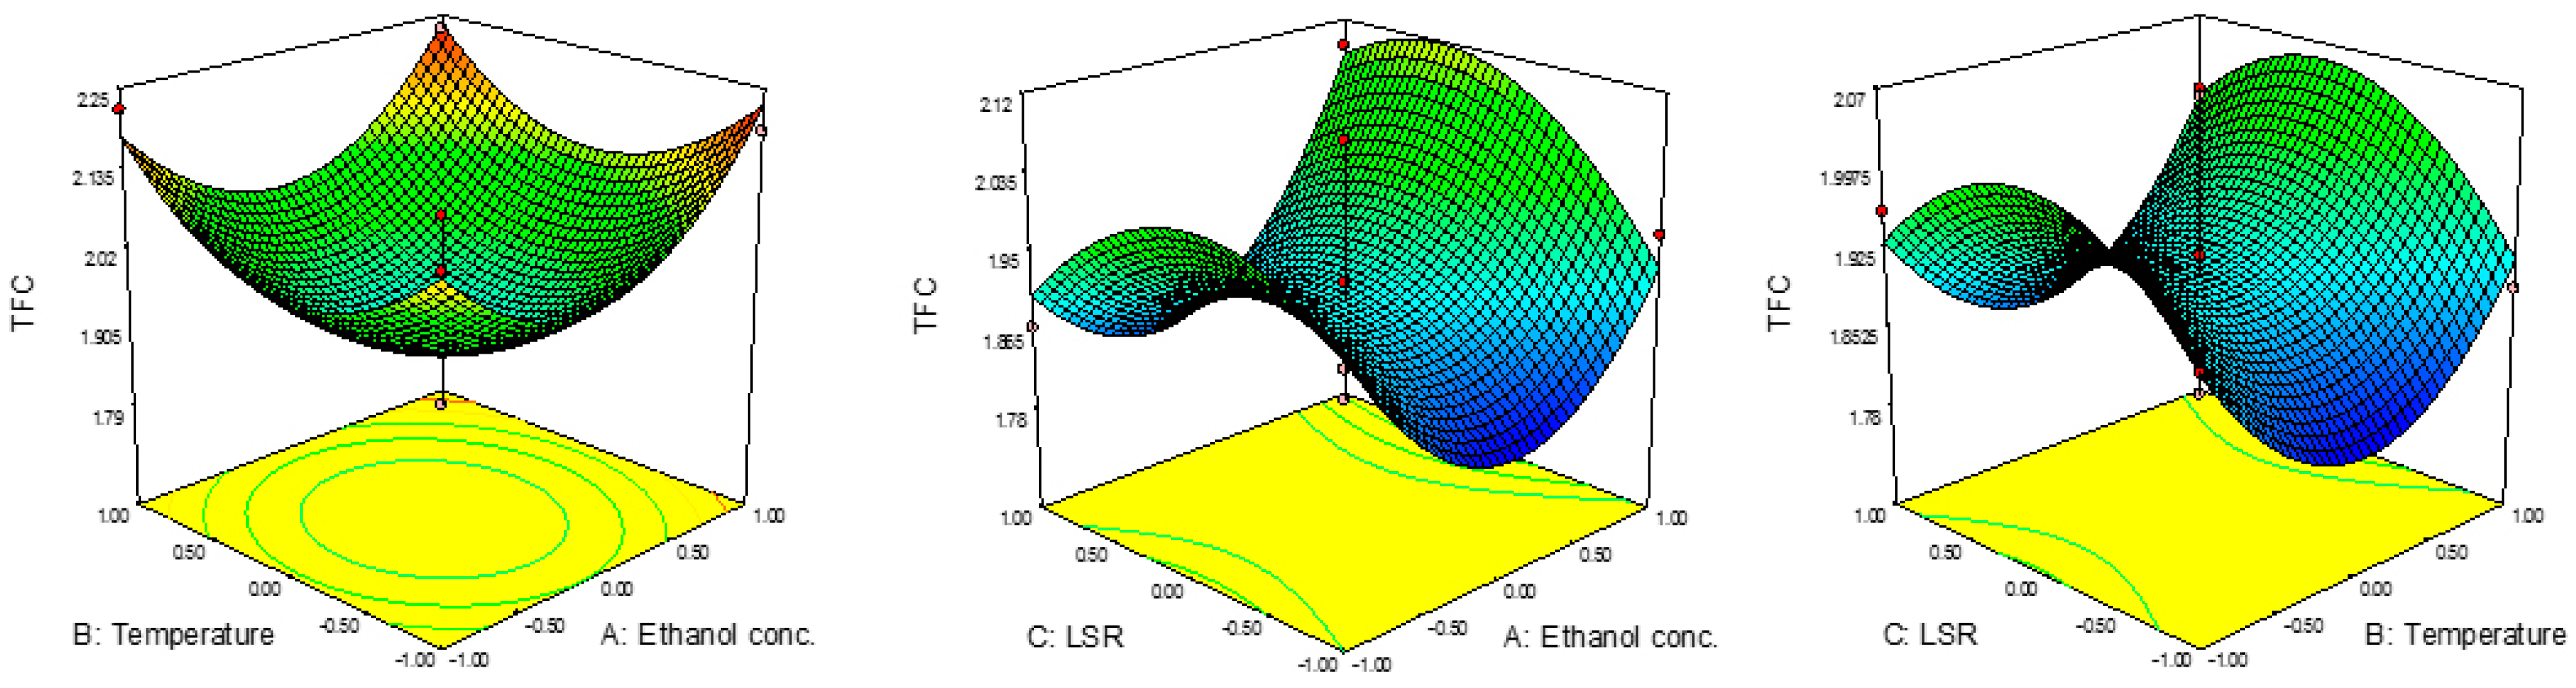
3.3. TFC
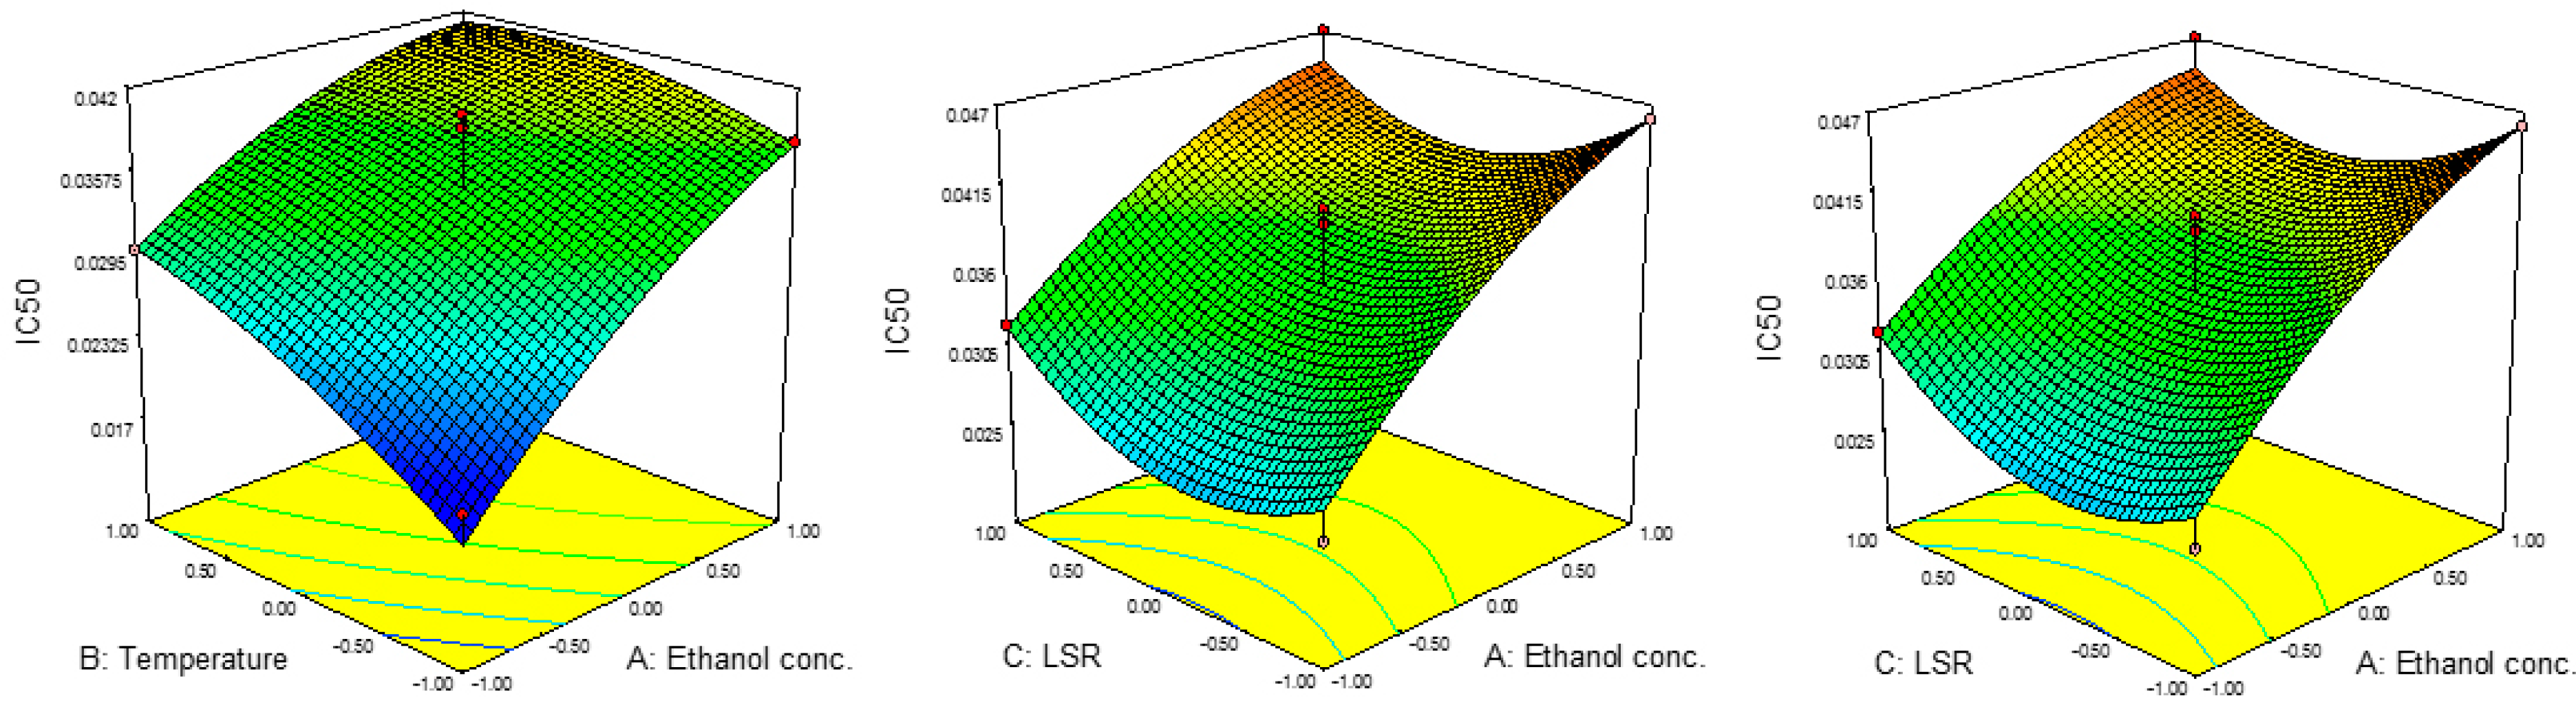
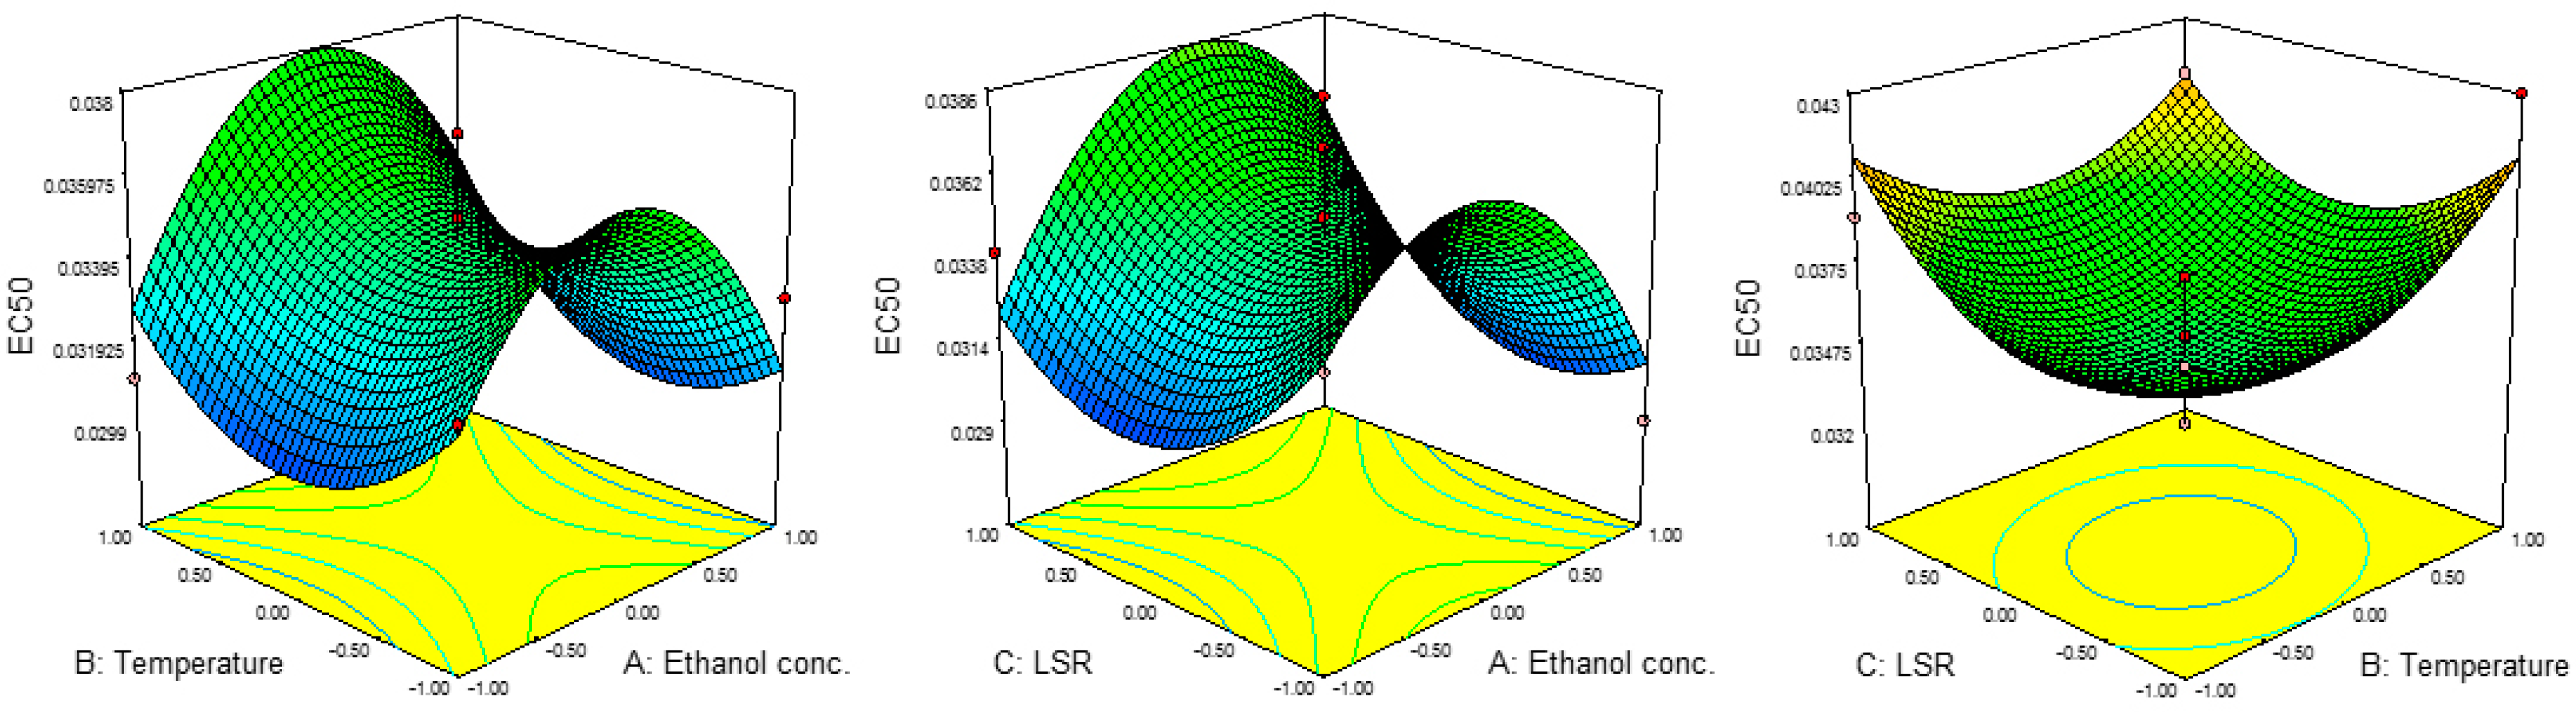
3.4. DPPH and ABTS Assays
3.5. Optimization Process
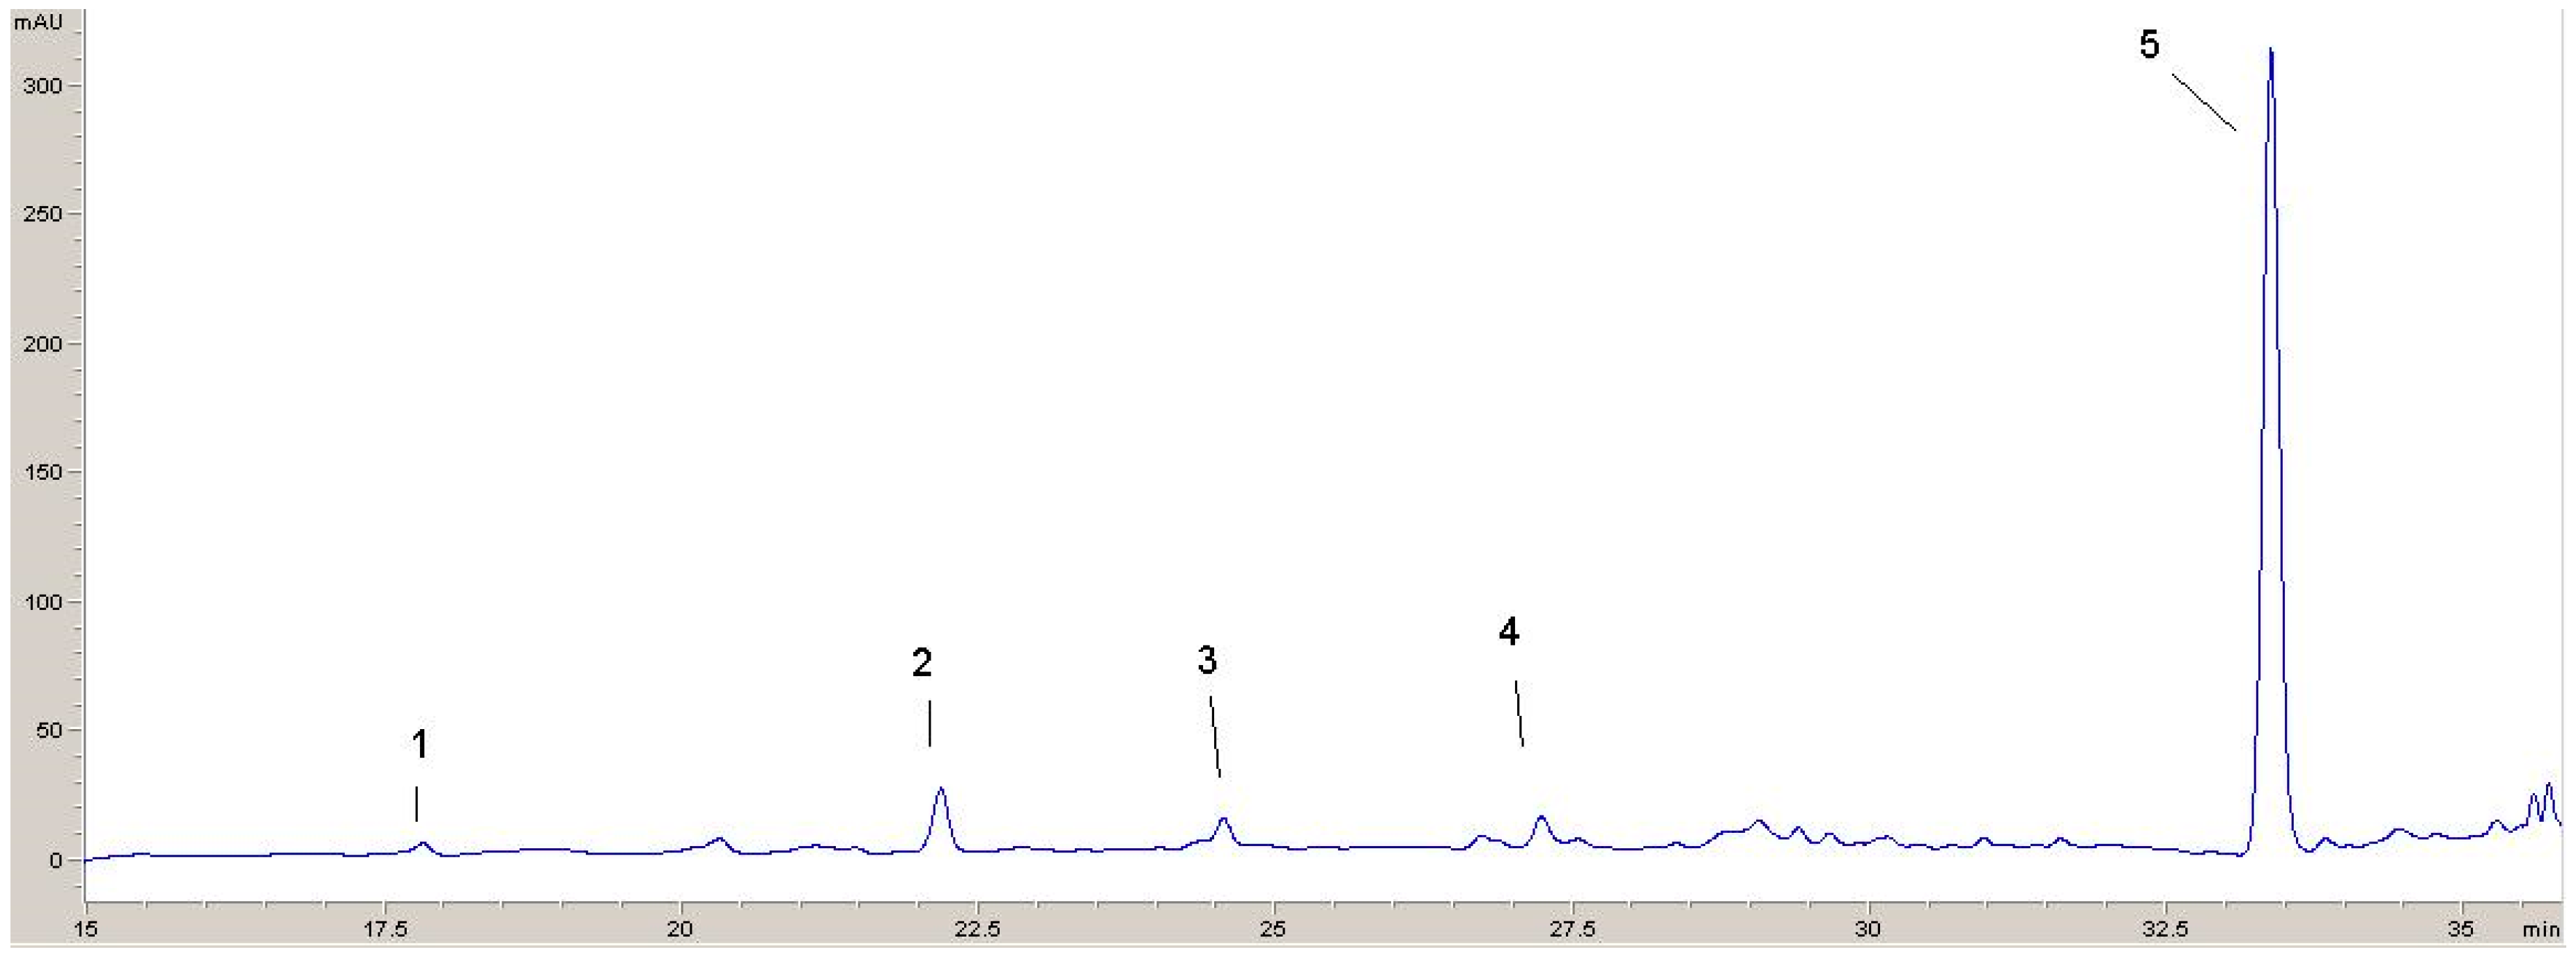
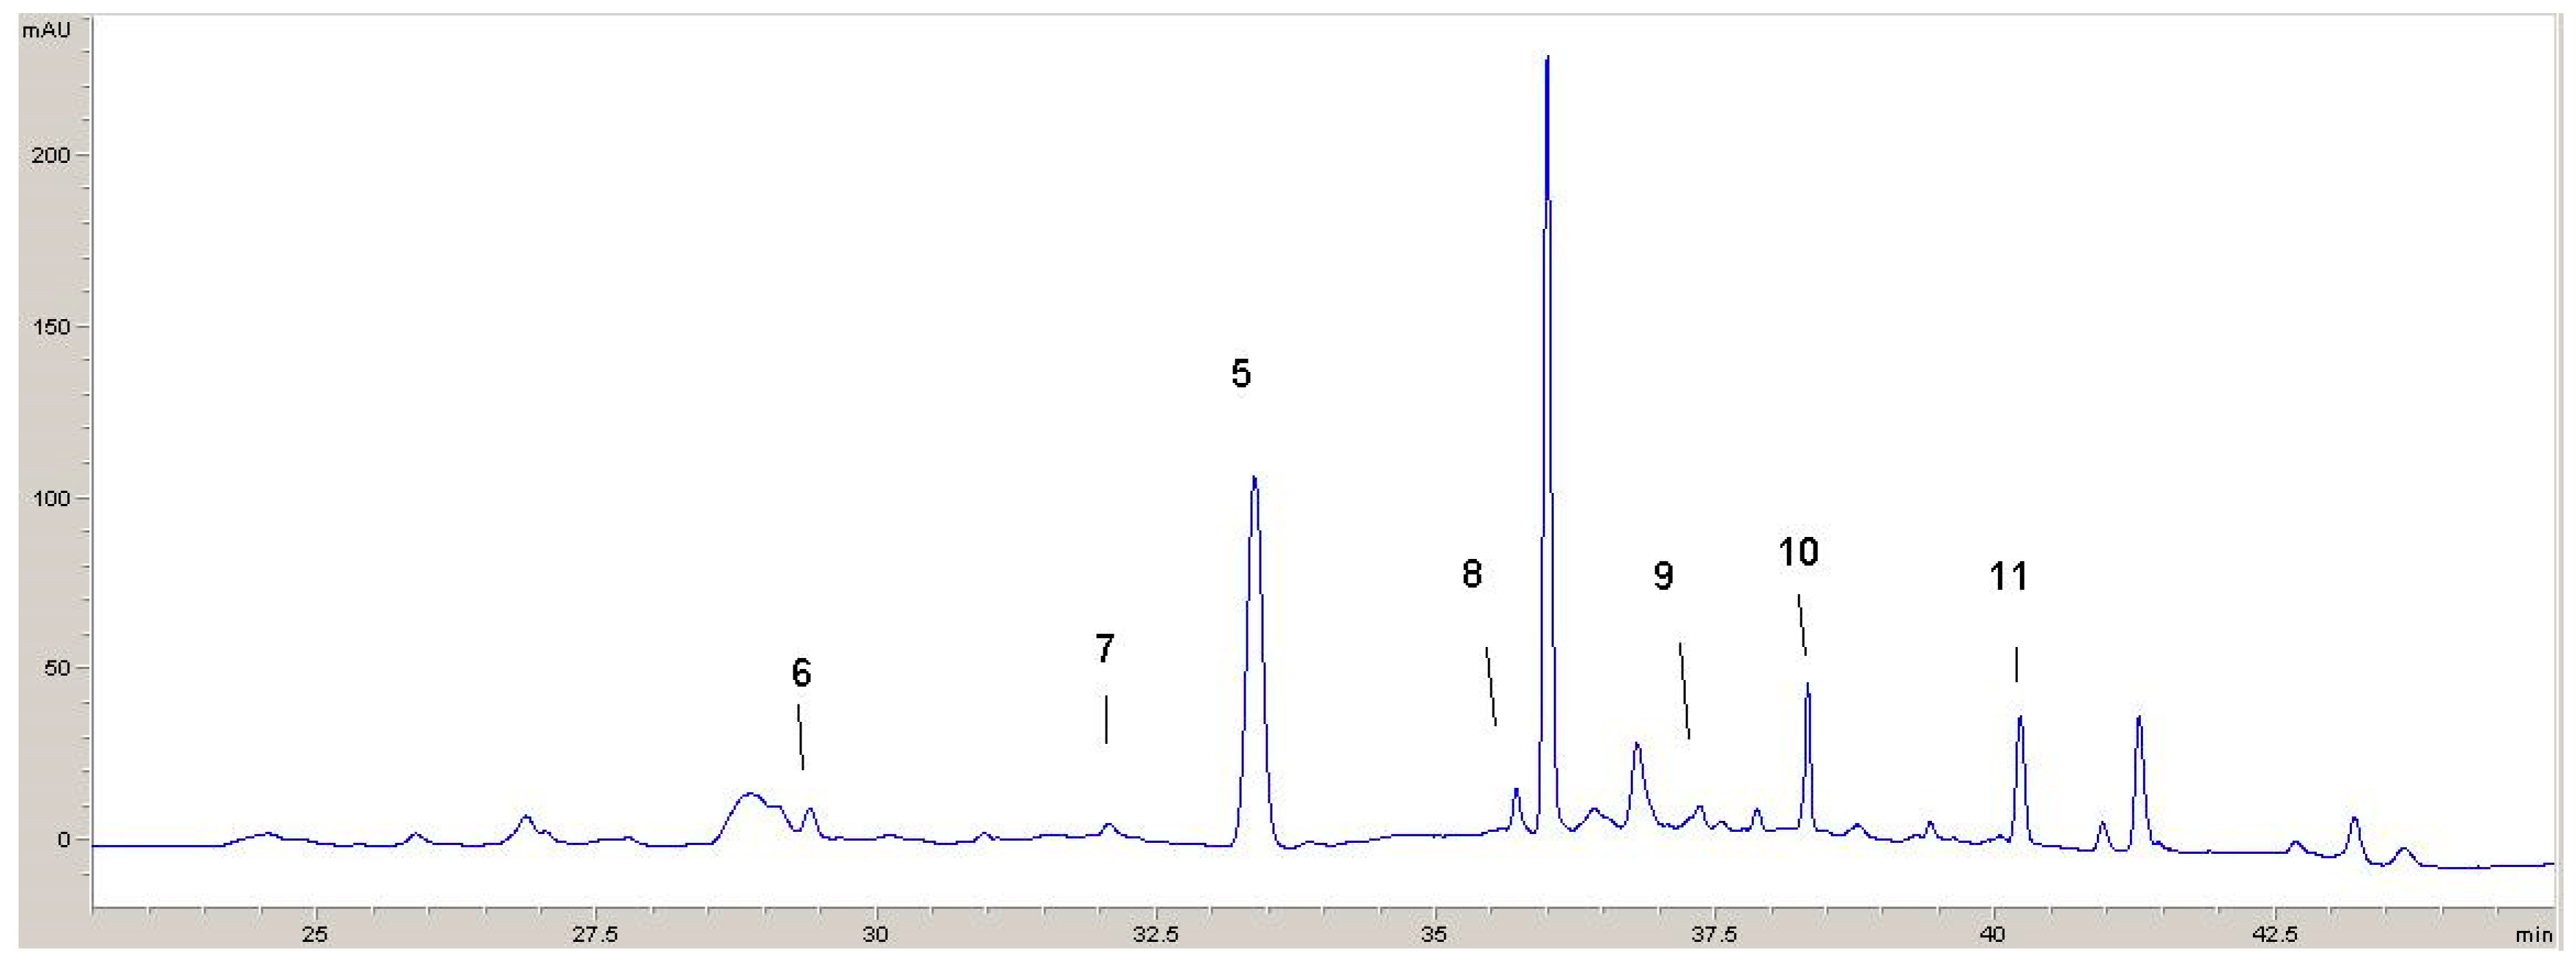
3.6. Polyphenolic Profile
4. Conclusions
Author Contributions
Funding
Data Availability Statement
Conflicts of Interest
References
- Plánder, S.; Gontaru, L.; Blazics, B.; Veres, K.; Kéry, Á.; Kareth, S.; Simándi, B. Major antioxidant constituents from Satureja hortensis L. extracts obtained with different solvents. Eur. J. Lipid Sci. Technol. 2012, 114, 772–779. [Google Scholar] [CrossRef]
- Deans, S.G.; Svoboda, K.P. Antibacterial activity of summer savory (Satureja hortensis L) essential oil and its constituents. J. Hortic. Sci. 1989, 64, 205–210. [Google Scholar] [CrossRef]
- Dorman, H.J.; Hiltunen, R. Fe(III) reductive and free radical-scavenging properties of summer savory (Satureja hortensis L.) extract and subfractions. Food Chem. 2004, 88, 193–199. [Google Scholar] [CrossRef]
- Esquível, M.M.; Ribeiro, M.A.; Bernardo-Gil, M.G. Supercritical extraction of savory oil: Study of antioxidant activity and extract characterization. J. Supercrit. Fluids 1999, 14, 129–138. [Google Scholar] [CrossRef]
- Exarchou, V.; Nenadis, N.; Tsimidou, M.; Gerothanassis, I.P.; Troganis, A.; Boskou, D. Antioxidant Activities and Phenolic Composition of Extracts from Greek Oregano, Greek Sage, and Summer Savory. J. Agric. Food Chem. 2002, 50, 5294–5299. [Google Scholar] [CrossRef] [PubMed]
- Güllüce, M.; Sökmen, M.; Daferera, D.; Aǧar, G.; Özkan, H.; Kartal, N.; Polissiou, M.; Sökmen, A.; Şahïn, F. In Vitro Antibacterial, Antifungal, and Antioxidant Activities of the Essential Oil and Methanol Extracts of Herbal Parts and Callus Cultures of Satureja hortensis L. J. Agric. Food Chem. 2003, 51, 3958–3965. [Google Scholar] [CrossRef]
- Hajhashemi, V.; Ghannadi, A.; Pezeshkian, S.K. Antinociceptive and anti-inflammatory effects of Satureja hortensis L. extracts and essential oil. J. Ethnopharmacol. 2002, 82, 83–87. [Google Scholar] [CrossRef] [PubMed]
- Şahin, F.; Karaman, İ.; Güllüce, M.; Öğütçü, H.; Şengül, M.; Adıgüzel, A.; Öztürk, S.; Kotan, R. Evaluation of antimicrobial activities of Satureja hortensis L. J. Ethnopharmacol. 2003, 87, 61–65. [Google Scholar] [CrossRef]
- Azmir, J.; Zaidul, I.S.M.; Rahman, M.M.; Sharif, K.M.; Mohamed, A.; Sahena, F.; Jahurul, M.H.A.; Ghafoor, K.; Norulaini, N.A.N.; Omar, A.K.M. Techniques for extraction of bioactive compounds from plant materials: A review. J. Food Eng. 2013, 117, 426–436. [Google Scholar] [CrossRef]
- Kimbaris, A.C.; Siatis, N.G.; Daferera, D.J.; Tarantilis, P.A.; Pappas, C.S.; Polissiou, M.G. Comparison of distillation and ultrasound-assisted extraction methods for the isolation of sensitive aroma compounds from garlic (Allium sativum). Ultrason. Sonochem. 2006, 13, 54–60. [Google Scholar] [CrossRef]
- Rostagno, M.A.; Palma, M.; Barroso, C.G. Ultrasound-assisted extraction of soy isoflavones. J. Chromatogr. A 2003, 2012, 119–128. [Google Scholar] [CrossRef] [PubMed]
- Chemat, F.; Tomao, V.; Virot, M. Ultrasound-Assisted Extraction in Food Analysis. In Handbook of Food Analysis Instruments; Ötles, S., Ed.; CRC Press: Boca Raton, FL, USA, 2008; pp. 85–94. [Google Scholar]
- Paniwnyk, L.; Beaufoy, E.; Lorimer, J.; Mason, T. The extraction of rutin from flower buds of Sophora japonica. Ultrason. Sonochem. 2001, 8, 299–301. [Google Scholar] [CrossRef] [PubMed]
- Zekovic, Z.; Djurovic, S.; Pavlic, B. Optimization of ultrasound-assisted extraction of polyphenolic compounds from coriander seeds using response surface methodology. Acta Period. Technol. 2016, 249–263. [Google Scholar] [CrossRef]
- Adamczyk, J.; Horny, N.; Tricoteaux, A.; Jouan, P.-Y.; Zadam, M. On the use of response surface methodology to predict and interpret the preferred c-axis orientation of sputtered AlN thin films. Appl. Surf. Sci. 2008, 254, 1744–1750. [Google Scholar] [CrossRef]
- Baş, D.; Boyacı, İ.H. Modeling and optimization I: Usability of response surface methodology. J. Food Eng. 2007, 78, 836–845. [Google Scholar] [CrossRef]
- Singleton, V.L.; Rossi, J.A. Colorometry of total phenolics with phosphomolybdic-phosphotungstic acid reagents. Am. J. Enol. Vitic. 1965, 16, 144–158. [Google Scholar] [CrossRef]
- Brighente, I.M.C.; Dias, M.; Verdi, L.G.; Pizzolatti, M.G. Antioxidant activity and total phenolic content of some Brazilian species. Pharm. Biol. 2007, 45, 156–161. [Google Scholar] [CrossRef]
- Takao, T.; Kitatani, F.; Watanabe, N.; Yagi, A.; Sakata, K. A Simple Screening Method for Antioxidants and Isolation of Several Antioxidants Produced by Marine Bacteria from Fish and Shellfish. Biosci. Biotechnol. Biochem. 1994, 58, 1780–1783. [Google Scholar] [CrossRef]
- Kumarasamy, Y.; Byres, M.; Cox, P.J.; Jaspars, M.; Nahar, L.; Sarker, S.D. Screening seeds of some Scottish plants for free radical scavenging activity. Phyther. Res. 2007, 21, 615–621. [Google Scholar] [CrossRef]
- Delgado-Andrade, C.; Rufián-Henares, J.A.; Morales, F.J. Assessing the antioxidant activity of melanoidins from coffee brews by different antioxidant methods. J. Agric. Food Chem. 2005, 53, 7832–7836. [Google Scholar] [CrossRef]
- Jabbari, N.; Goli, M.; Shahi, S. Optimization of Bioactive Compound Extraction from Saffron Petals Using Ultrasound-Assisted Acidified Ethanol Solvent: Adding Value to Food Waste. Foods 2024, 13, 542. [Google Scholar] [CrossRef] [PubMed]
- Bezerra, M.A.; Santelli, R.E.; Oliveira, E.P.; Villar, L.S.; Escaleira, L.A. Response surface methodology (RSM) as a tool for optimization in analytical chemistry. Talanta 2008, 76, 965–977. [Google Scholar] [CrossRef] [PubMed]
- Wang, J.; Sun, B.; Cao, Y.; Tian, Y.; Li, X. Optimisation of ultrasound-assisted extraction of phenolic compounds from wheat bran. Food Chem. 2008, 106, 804–810. [Google Scholar] [CrossRef]
- Mašković, P.; Veličković, V.; Mitić, M.; Đurović, S.; Zeković, Z.; Radojković, M.; Cvetanović, A.; Švarc-Gajić, J.; Vujić, J. Summer savory extracts prepared by novel extraction methods resulted in enhanced bilogical activity. Ind. Crop. Prod. 2017, 109, 875–881. [Google Scholar] [CrossRef]


| Variable | Real levels | ||
| −1 | 0 | 1 | |
| Calculated levels | |||
| Ethanol concentration (%) | 40 (−1) | 60 (0) | 80 (1) |
| Temperature (°C) | 40 (−1) | 60 (0) | 80 (1) |
| Liquid–solid ratio (mL/g) | 10 (−1) | 20 (0) | 30 (1) |
| Independent Variables | Measured Responses | |||||
|---|---|---|---|---|---|---|
| X1 Concentration (%) | X2 Temperature (°C) | X3 LSR (mL/g) | TPC (mg ECA/g) | TFC (mg ER/g) | DPPH IC50 (mg/mL) | ABTS EC50 (mg/mL) |
| −1 | −1 | 0 | 3.53 | 2.14 | 0.020 | 0.033 |
| −1 | 0 | −1 | 3.46 | 1.95 | 0.026 | 0.034 |
| −1 | 1 | 0 | 4.09 | 2.22 | 0.030 | 0.031 |
| −1 | 0 | 1 | 3.76 | 1.87 | 0.032 | 0.034 |
| 0 | −1 | −1 | 3.97 | 1.92 | 0.034 | 0.038 |
| 0 | 1 | −1 | 3.85 | 1.89 | 0.044 | 0.043 |
| 1 | 0 | −1 | 3.47 | 1.97 | 0.046 | 0.029 |
| 1 | 1 | 0 | 3.81 | 2.23 | 0.039 | 0.034 |
| 1 | 0 | 1 | 3.36 | 2.09 | 0.047 | 0.036 |
| 0 | 1 | 1 | 4.12 | 1.99 | 0.043 | 0.041 |
| 0 | 0 | 0 | 4.40 | 1.89 | 0.039 | 0.032 |
| 0 | 0 | 0 | 4.31 | 2.07 | 0.040 | 0.037 |
| 0 | 0 | 0 | 4.24 | 1.87 | 0.039 | 0.035 |
| 0 | 0 | 0 | 4.42 | 1.92 | 0.029 | 0.034 |
| 0 | 0 | 0 | 4.30 | 1.79 | 0.031 | 0.035 |
| 1 | −1 | 0 | 3.89 | 2.19 | 0.038 | 0.033 |
| 0 | −1 | 1 | 4.03 | 1.96 | 0.033 | 0.039 |
| Coefficient | Response | |||
|---|---|---|---|---|
| TPC | TFC | IC50 | EC50 | |
| β0 | 4.33 | 1.91 | 0.036 | 0.035 |
| Linear | ||||
| β1 | −0.039 | 0.038 | 7.750∙10−3 | 0.000 |
| β2 | 0.056 | 0.015 | 3.875∙10−3 | 7.500∙10−4 |
| β3 | 0.065 | 0.023 | 6.250∙10−4 | 7.500∙10−4 |
| Interaction | ||||
| β12 | −0.16 | −0.010 | −2.250∙10−3 | 7.500∙10−4 |
| β13 | −0.10 | 0.050 | −1.250∙10−3 | 1.750∙10−3 |
| β23 | 0.052 | 0.015 | 0.000 | −7.500∙10−4 |
| Quadratic | ||||
| β11 | −0.49 | 0.16 | −2.300∙10−3 | −4.425∙10−3 |
| β22 | −0.012 | 0.13 | −1.550∙10−3 | 2.575∙10−3 |
| β33 | −0.33 | −0.096 | 4.450∙10−3 | 3.075∙10−3 |
| Source | Sum of Squares | DF | Mean Square | F-Value | p-Value |
|---|---|---|---|---|---|
| TPC | |||||
| Model | 1.79 | 9 | 0.20 | 16.43 | 0.0006 |
| Residual | 0.085 | 7 | 0.012 | ||
| Lack of fit | 0.063 | 3 | 0.021 | 3.74 | 0.1176 |
| Pure error | 0.022 | 4 | 0.0058 | ||
| Total | 1.88 | 16 | |||
| R2 = 0.9548 R2adj = 0.8967 Adeq precision 12.32 | |||||
| TFC | |||||
| Model | 0.24 | 9 | 0.027 | 3.81 | 0.0459 |
| Residual | 0.049 | 7 | 0.0070 | ||
| Lack of fit | 0.0071 | 3 | 0.0024 | 0.22 | 0.8747 |
| Pure error | 0.042 | 4 | 0.011 | ||
| Total | 0.29 | 16 | |||
| R2 = 0.8304 R2adj = 0.6173 Adeq precision 7.92 | |||||
| IC50 | |||||
| Model | 7.403∙10−4 | 9 | 8.226∙10−5 | 4.25 | 0.0348 |
| Residual | 1.354∙10−4 | 7 | 1.935∙10−5 | ||
| Lack of fit | 2.825∙10−5 | 3 | 9.417∙10−5 | 0.35 | 0.7917 |
| Pure error | 1.072∙10−4 | 4 | 2.680∙10−5 | ||
| Total | 8.758∙10−4 | 16 | |||
| R2 = 0.8453 R2adj = 0.6460 Adeq precision 8.58 | |||||
| EC50 | |||||
| Model | 1.688∙10−4 | 9 | 1.875∙10−5 | 3.90 | 0.0434 |
| Residual | 3.370∙10−5 | 7 | 4.814∙10−6 | ||
| Lack of fit | 2.050∙10−5 | 3 | 6.833∙10−6 | 2.07 | 0.2468 |
| Pure error | 1.320∙10−5 | 4 | 3.300∙10−6 | ||
| Total | 2.025∙10−4 | 16 | |||
| R2 = 0.8336 R2adj = 0.6196 Adeq precision 7.90 | |||||
| Values | Investigated Responses | |||
|---|---|---|---|---|
| TPC (mg CEA/g) | TFC (mg RE/g) | IC50 (mg/mL) | EC50 (mg/mL) | |
| Predicted | 4.11 | 2.18 | 0.030 | 0.030 |
| Experimental | 4.07 | 2.14 | 0.029 | 0.028 |
| Compound | Calibration Curve | (R2) | LOD μg/mL | LOQ μg/mL |
|---|---|---|---|---|
| Protocatechuic acid | y = 13307.5x + 0.235 | 0.9988 | 0.004 | 0.013 |
| p-Hydroxybenzoic acid | y = 9934.4x + 0.086 | 0.9998 | 0.003 | 0.010 |
| Caffeic acid | Y = 32241.5x − 0.154 | 1.0000 | 0.009 | 0.030 |
| Vanillic acid | Y = 10781.0x + 0.520 | 0.9995 | 0.003 | 0.010 |
| Chlorogenic acid | Y = 10491.8x − 0.525 | 0.9998 | 0.035 | 0.116 |
| Syringic acid | Y = 11253.6x + 0.465 | 0.9999 | 0.011 | 0.037 |
| p-Coumaric acid | Y = 16239.7x − 0.832 | 0.9997 | 0.042 | 0.140 |
| Ferulic acid | Y = 24685.7x − 0.754 | 0.9998 | 0.029 | 0.097 |
| Sinapic acid | Y = 13332.5x + 1.062 | 0.9998 | 0.032 | 0.106 |
| Rutin | Y = 4589.0x − 0.674 | 0.9999 | 0.052 | 0.173 |
| Luteolin glycoside | Y = 13132.5x + 1.042 | 0.9998 | 0.032 | 0.106 |
| Apigenin glycoside | Y = 4289.0x − 0.674 | 0.9999 | 0.052 | 0.173 |
| Rosmarinic acid | Y = 5385.2x + 0.656 | 0.9998 | 0.018 | 0.060 |
| Quercetin | Y = 10336.2x + 0.320 | 0.9996 | 0.033 | 0.110 |
| Luteolin | Y = 15958.6x − 0.234 | 0.9998 | 0.030 | 0.100 |
| Naringenin | Y = 14797.5x + 0.980 | 1.0000 | 0.055 | 0.183 |
| Kaempferol | Y = 13636.5x + 0.098 | 0.9997 | 0.029 | 0.097 |
| Apigenin | Y = 6229.8x + 1.200 | 0.9996 | 0.045 | 0.150 |
| Compound | Content (µg/mL) |
|---|---|
| Phenolic acids | |
| Protocatechuic acid | ND * |
| p-Hydroxybenzoic acid | 0.115 |
| Caffeic acid | ND |
| Vanillic acid | ND |
| Chlorogenic acid | 1.519 |
| Syringic acid | ND |
| p-Coumaric acid | 0.073 |
| Ferulic acid | 0.150 |
| Sinapic acid | ND |
| Flavonoids | |
| Rutin | 0.741 |
| Apigenin glycoside | 0.356 |
| Rosmarinic acid | 46.172 |
| Quercetin | 0.177 |
| Luteolin | 0.347 |
| Naringenin | ND |
| Kaempferol | 0.348 |
| Apigenin | 0.622 |
| Summary | 50.620 |
Disclaimer/Publisher’s Note: The statements, opinions and data contained in all publications are solely those of the individual author(s) and contributor(s) and not of MDPI and/or the editor(s). MDPI and/or the editor(s) disclaim responsibility for any injury to people or property resulting from any ideas, methods, instructions or products referred to in the content. |
© 2024 by the authors. Licensee MDPI, Basel, Switzerland. This article is an open access article distributed under the terms and conditions of the Creative Commons Attribution (CC BY) license (https://creativecommons.org/licenses/by/4.0/).
Share and Cite
Mašković, J.M.; Jakovljević, V.; Živković, V.; Mitić, M.; Kurćubić, L.V.; Mitić, J.; Mašković, P.Z. Optimization of Ultrasound-Assisted Extraction of Phenolics from Satureja hortensis L. and Antioxidant Activity: Response Surface Methodology Approach. Processes 2024, 12, 2042. https://doi.org/10.3390/pr12092042
Mašković JM, Jakovljević V, Živković V, Mitić M, Kurćubić LV, Mitić J, Mašković PZ. Optimization of Ultrasound-Assisted Extraction of Phenolics from Satureja hortensis L. and Antioxidant Activity: Response Surface Methodology Approach. Processes. 2024; 12(9):2042. https://doi.org/10.3390/pr12092042
Chicago/Turabian StyleMašković, Jelena M., Vladimir Jakovljević, Vladimir Živković, Milan Mitić, Luka V. Kurćubić, Jelena Mitić, and Pavle Z. Mašković. 2024. "Optimization of Ultrasound-Assisted Extraction of Phenolics from Satureja hortensis L. and Antioxidant Activity: Response Surface Methodology Approach" Processes 12, no. 9: 2042. https://doi.org/10.3390/pr12092042
APA StyleMašković, J. M., Jakovljević, V., Živković, V., Mitić, M., Kurćubić, L. V., Mitić, J., & Mašković, P. Z. (2024). Optimization of Ultrasound-Assisted Extraction of Phenolics from Satureja hortensis L. and Antioxidant Activity: Response Surface Methodology Approach. Processes, 12(9), 2042. https://doi.org/10.3390/pr12092042