


Fluoride Removal from Aqueous Solutions by Using Super-Adsorbents of Chitosan/Orange Peels/Activated Carbon@MgO: Synthesis, Characterization, and Adsorption Evaluation

 ,
,  , ,
, , 

Abstract
1. Introduction
2. Materials and Methods
2.1. Materials
2.2. Preparation of CS/OP/AC@MgO Adsorbent
2.3. Analytical Determinations
- (1)
- A total of 958 mg of SPADNS solution (Sigma-Aldrich, Merck KGaA, Darmstadt Germany) was added to 0.5 L of distilled water.
- (2)
- A total of 133 mg of 99.99% trace element zirconyl chloride (Sigma-Aldrich, Merck KGaA, Darmstadt Germany) was added to 25 mL of deionized water. Then, 350 mL of HCl was added to make a final 0.5 L diluted solution.
- (3)
- The Zr–SPADNS solution was created by mixing equal volumes of these two solutions and remains stable for 2 years when stored in the dark.
2.4. Adsorption Experiments
2.4.1. Equilibrium Experiments
2.4.2. Kinetics Experiments
2.5. Thermodynamics
2.6. Characterization Techniques
3. Results and Discussion
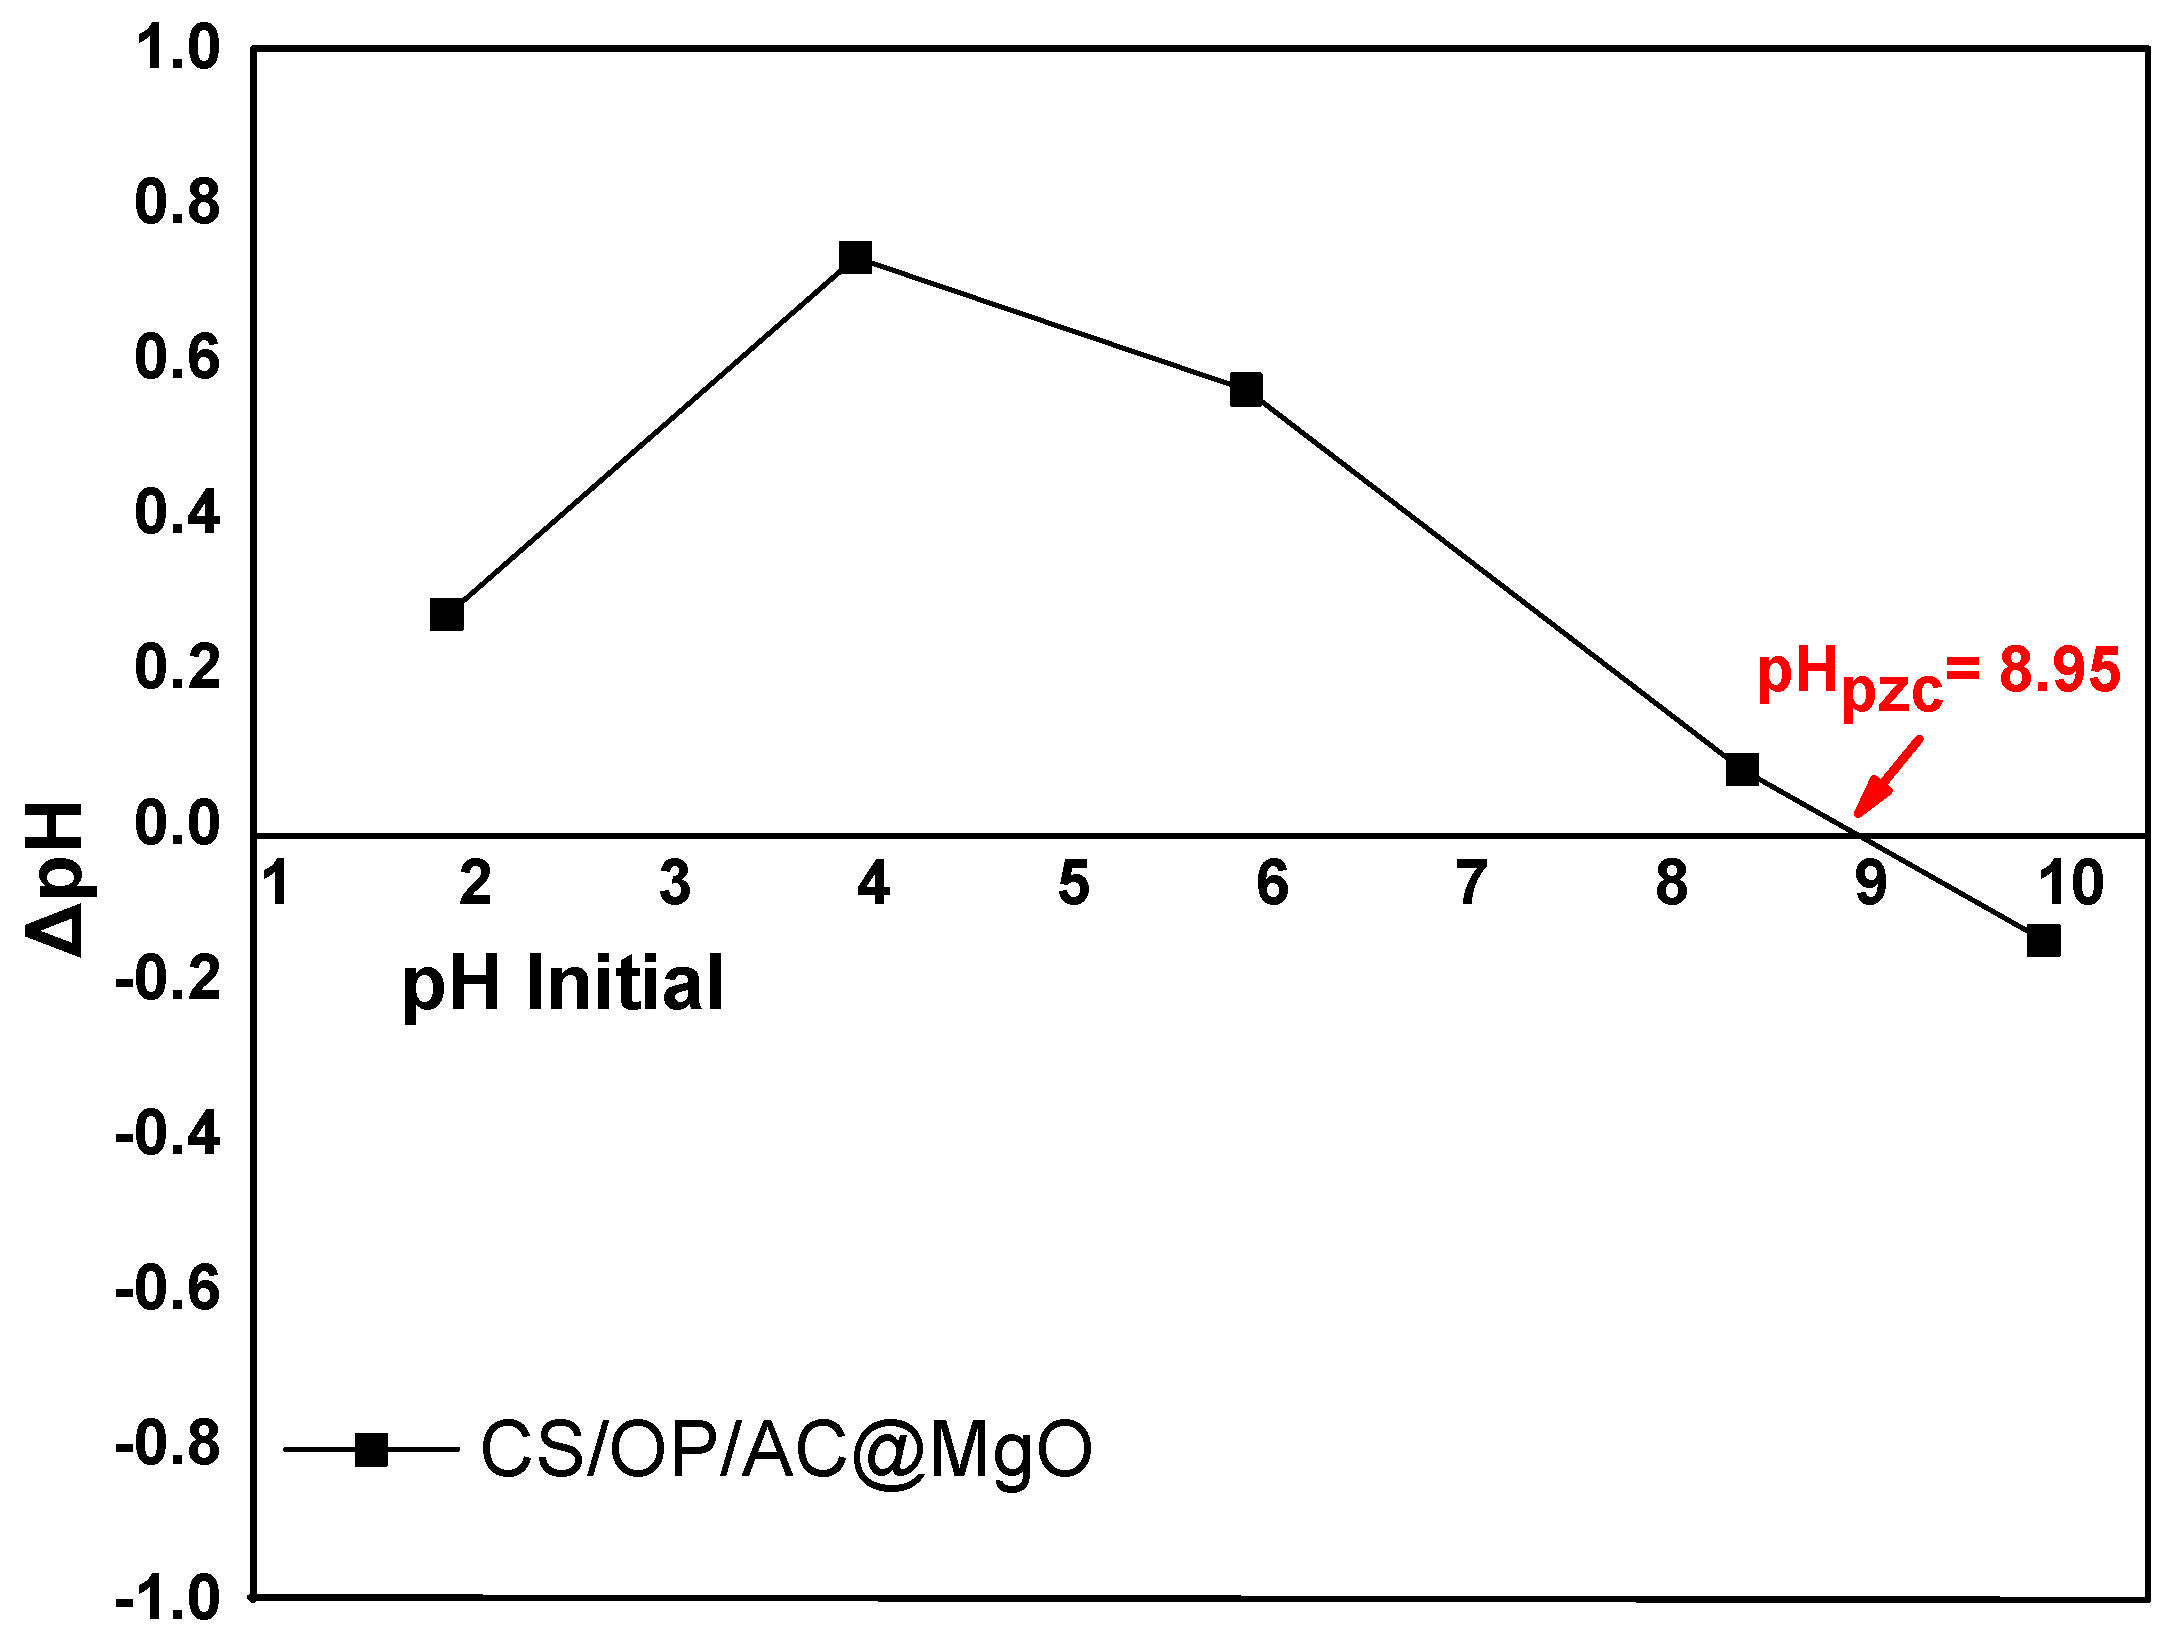
3.1. Impact of Initial pH Solution—Comparison of the Materials
3.2. The Impact of the Adsorbent’s Dosage
3.3. The Impact of Contact Time
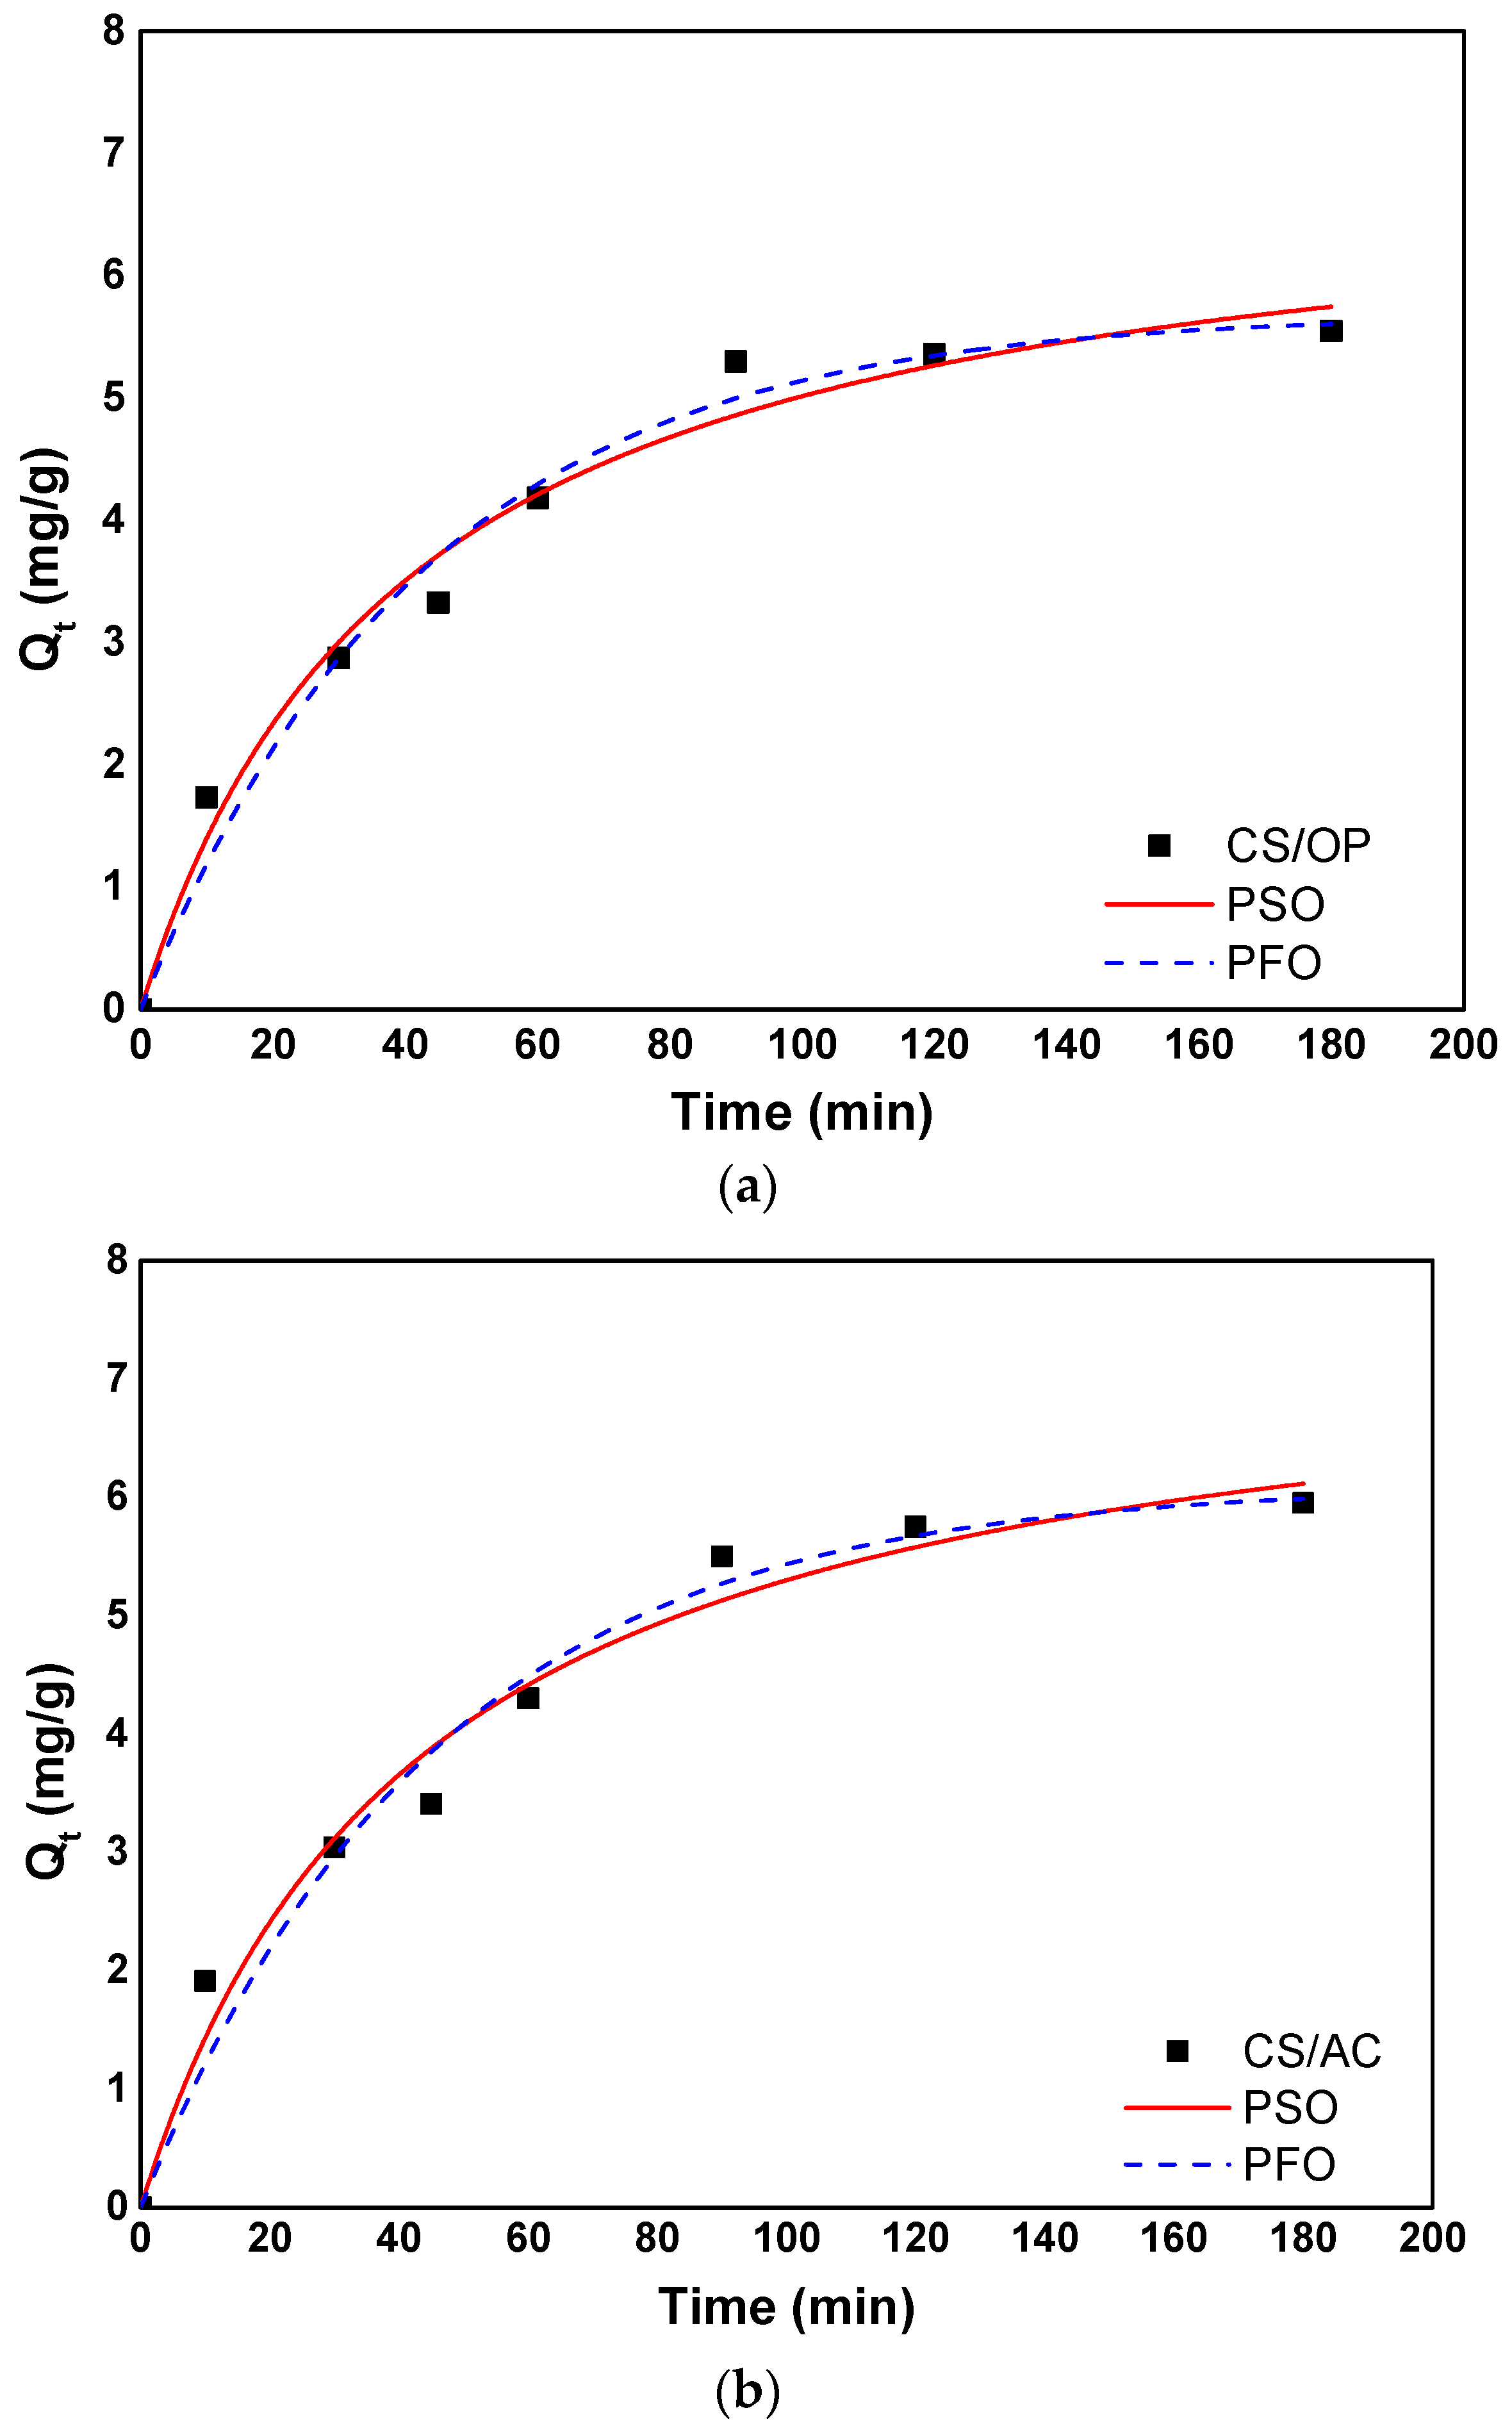
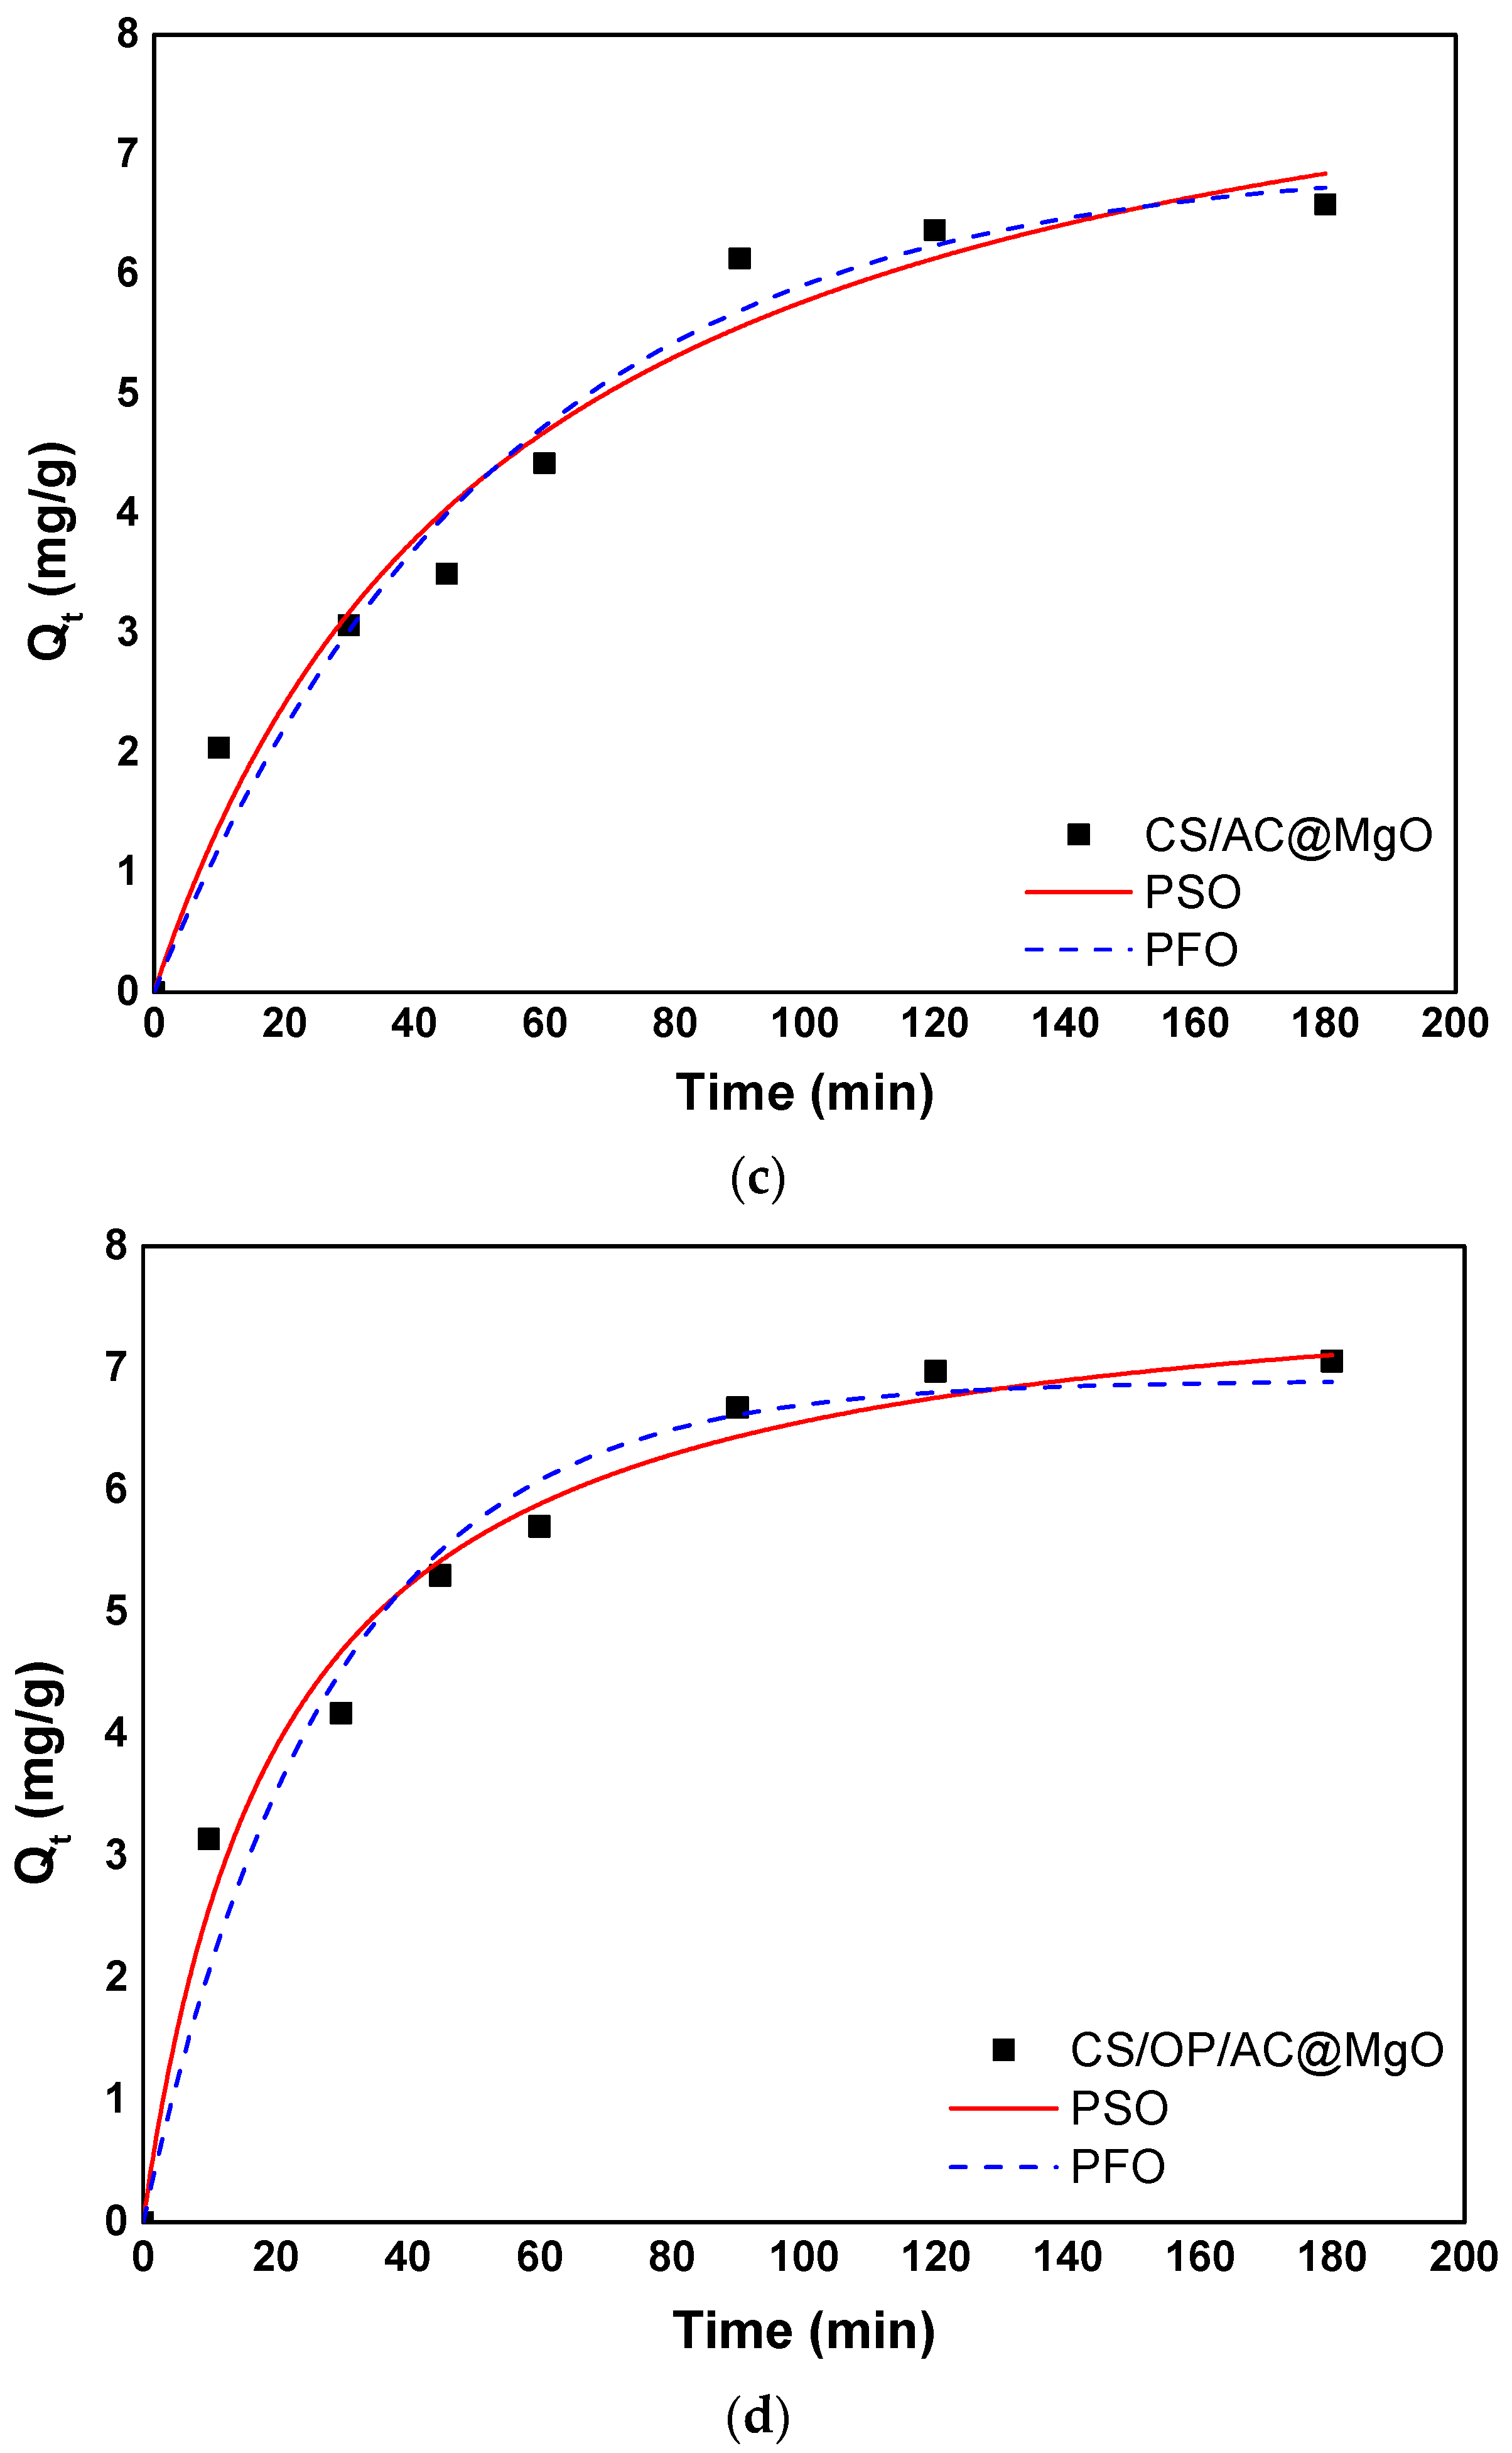
3.4. Adsorption Kinetics
3.4.1. Empirical Models
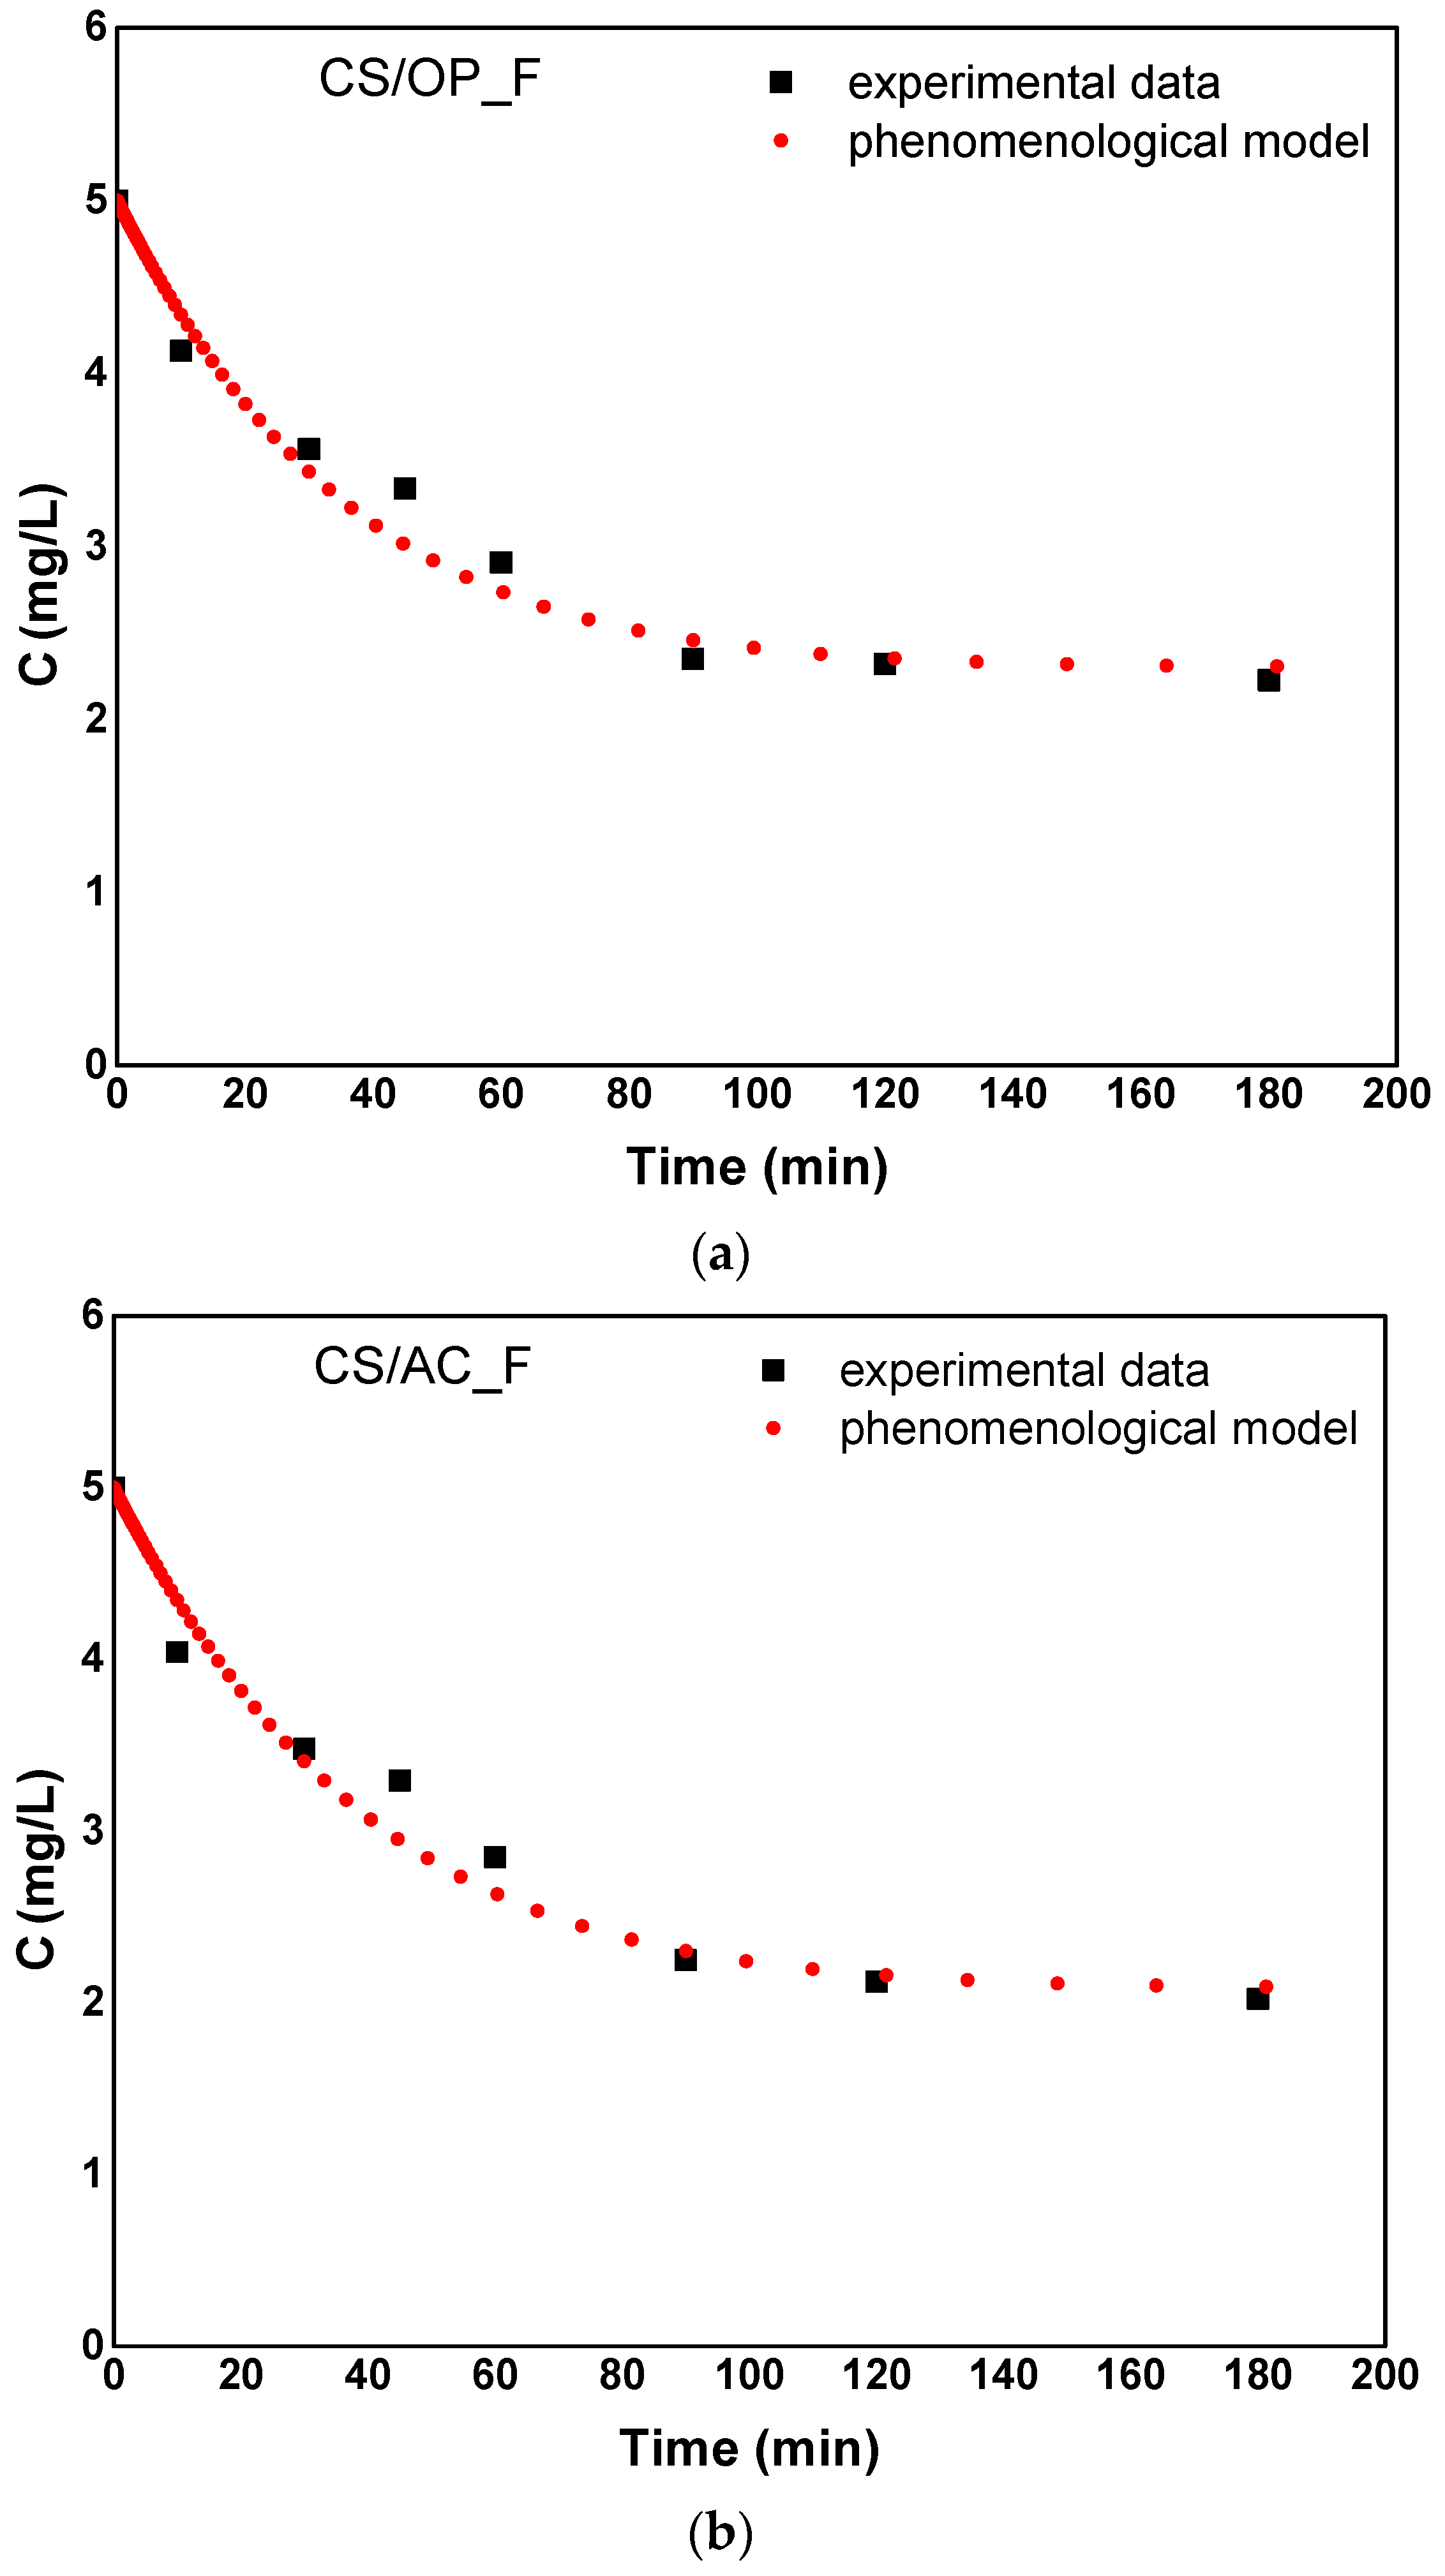
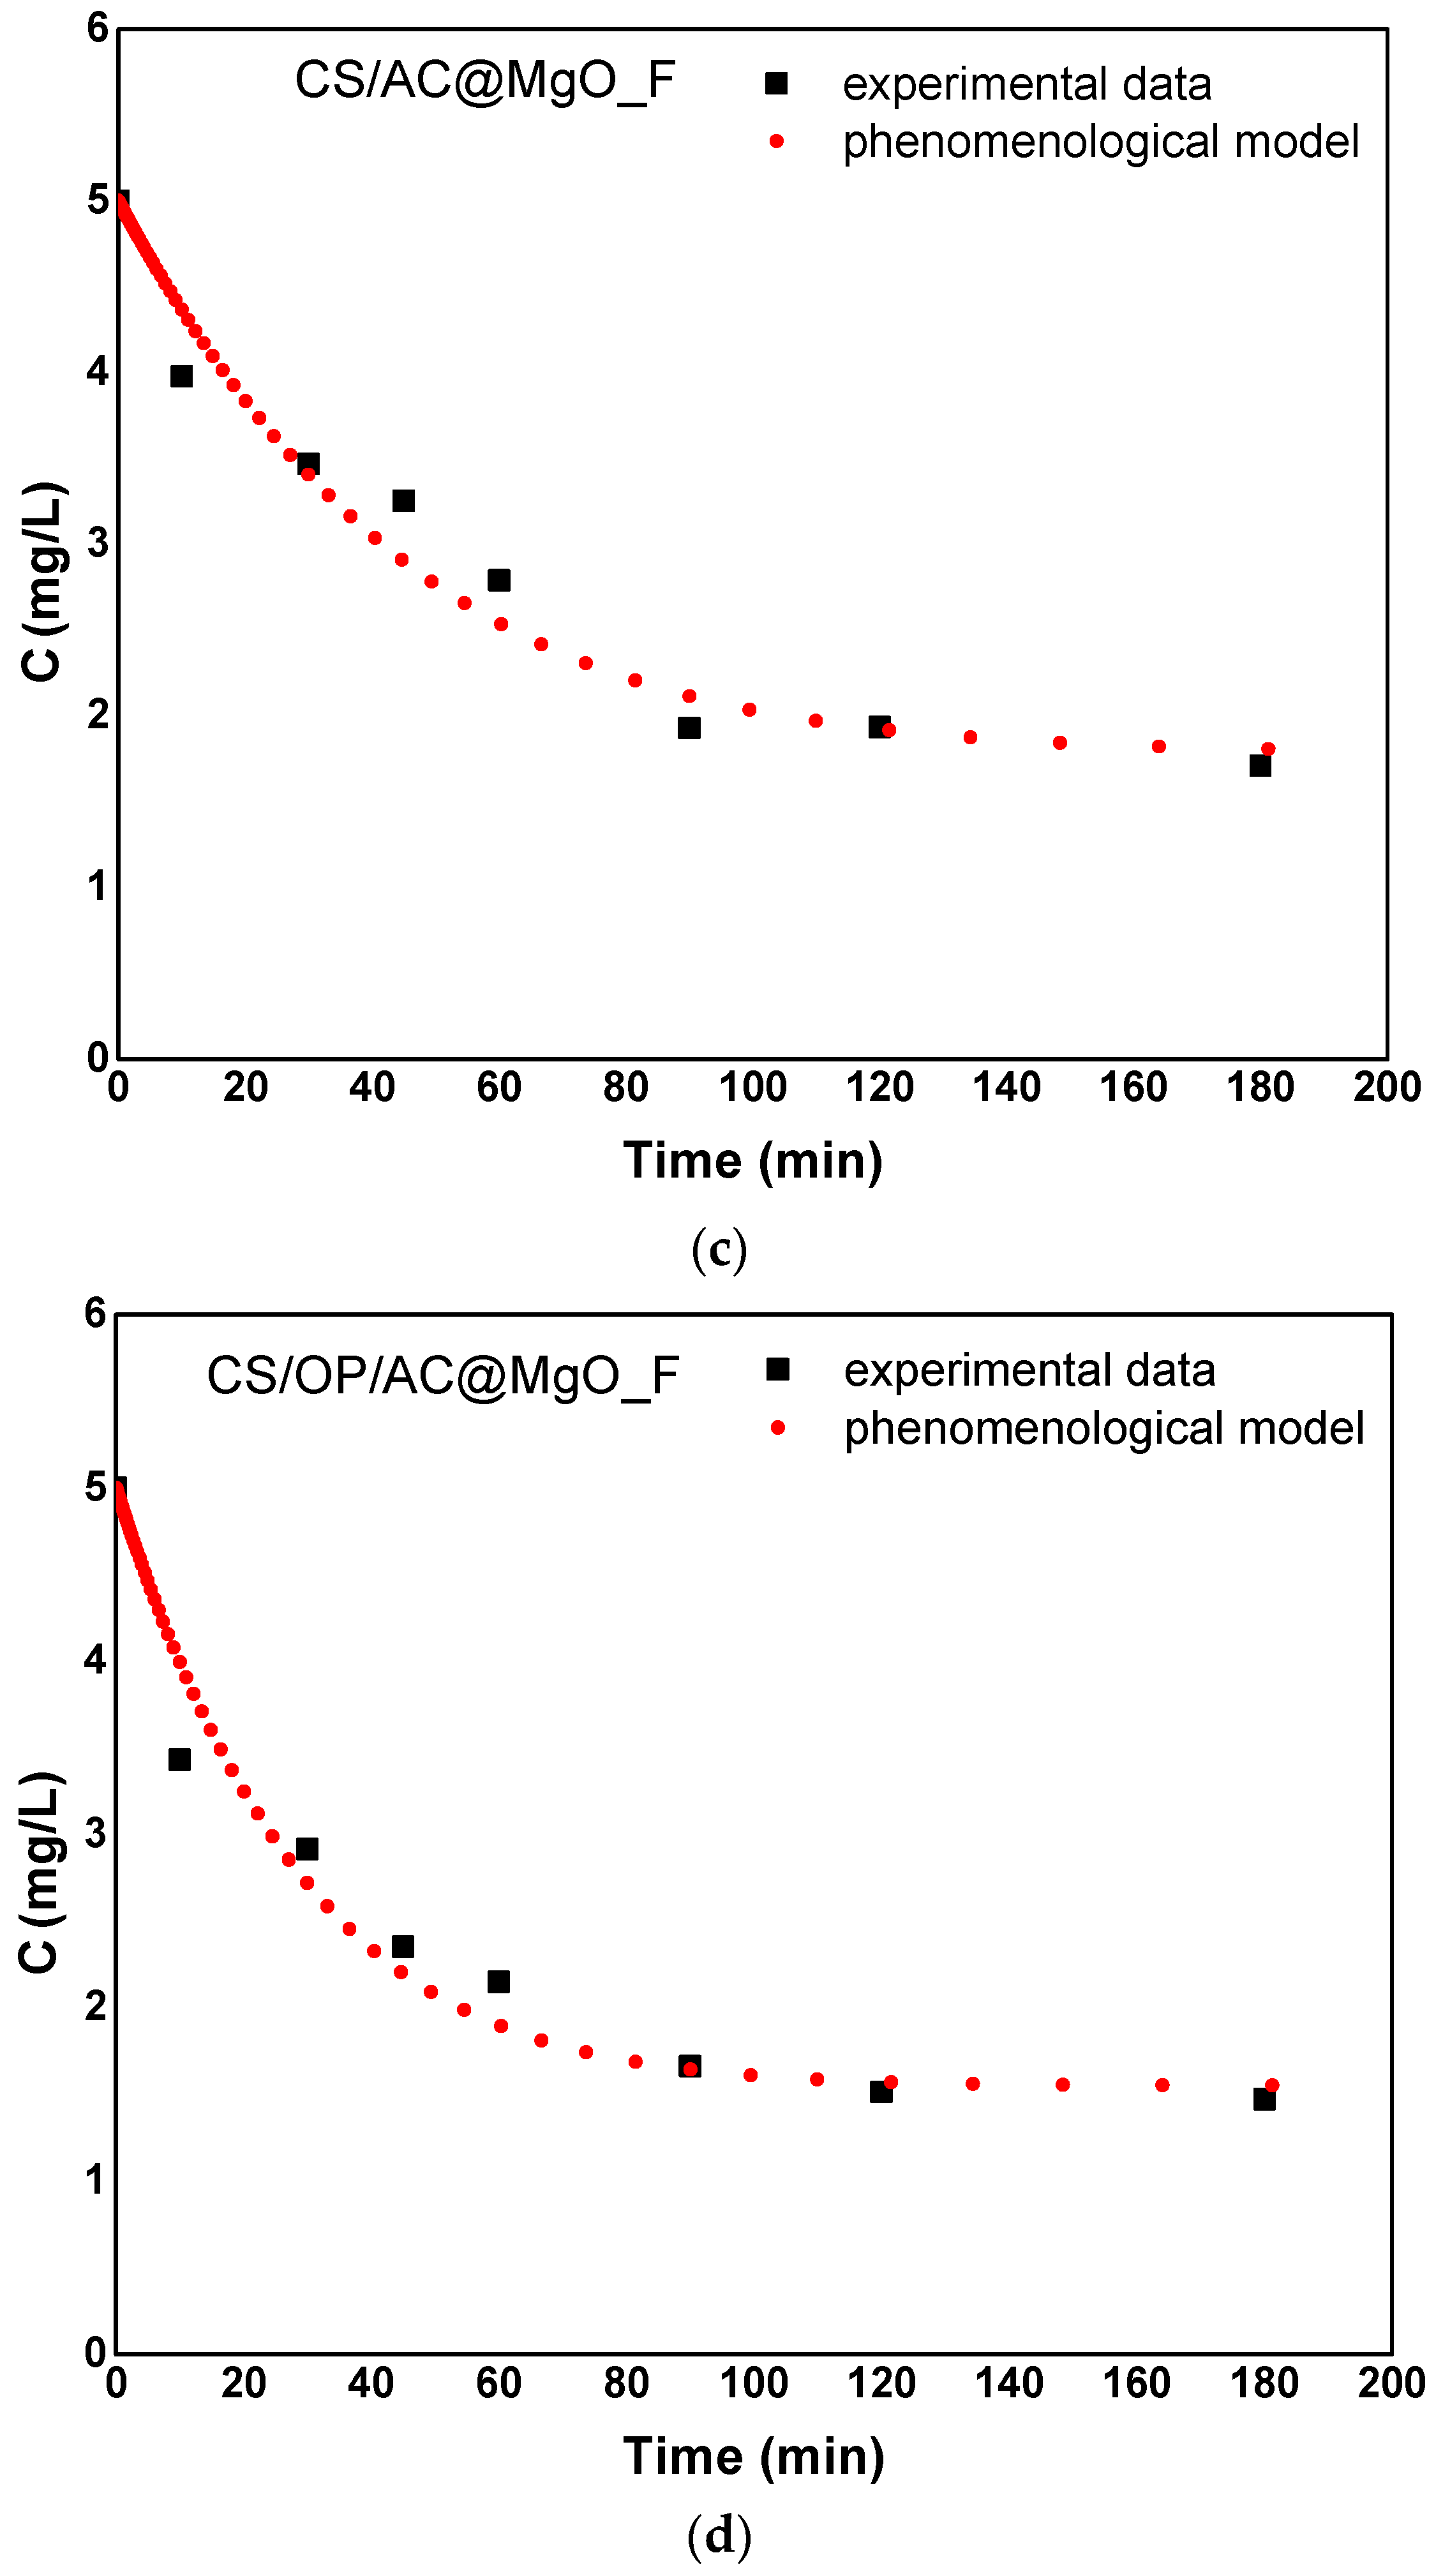
3.4.2. Phenomenological Model
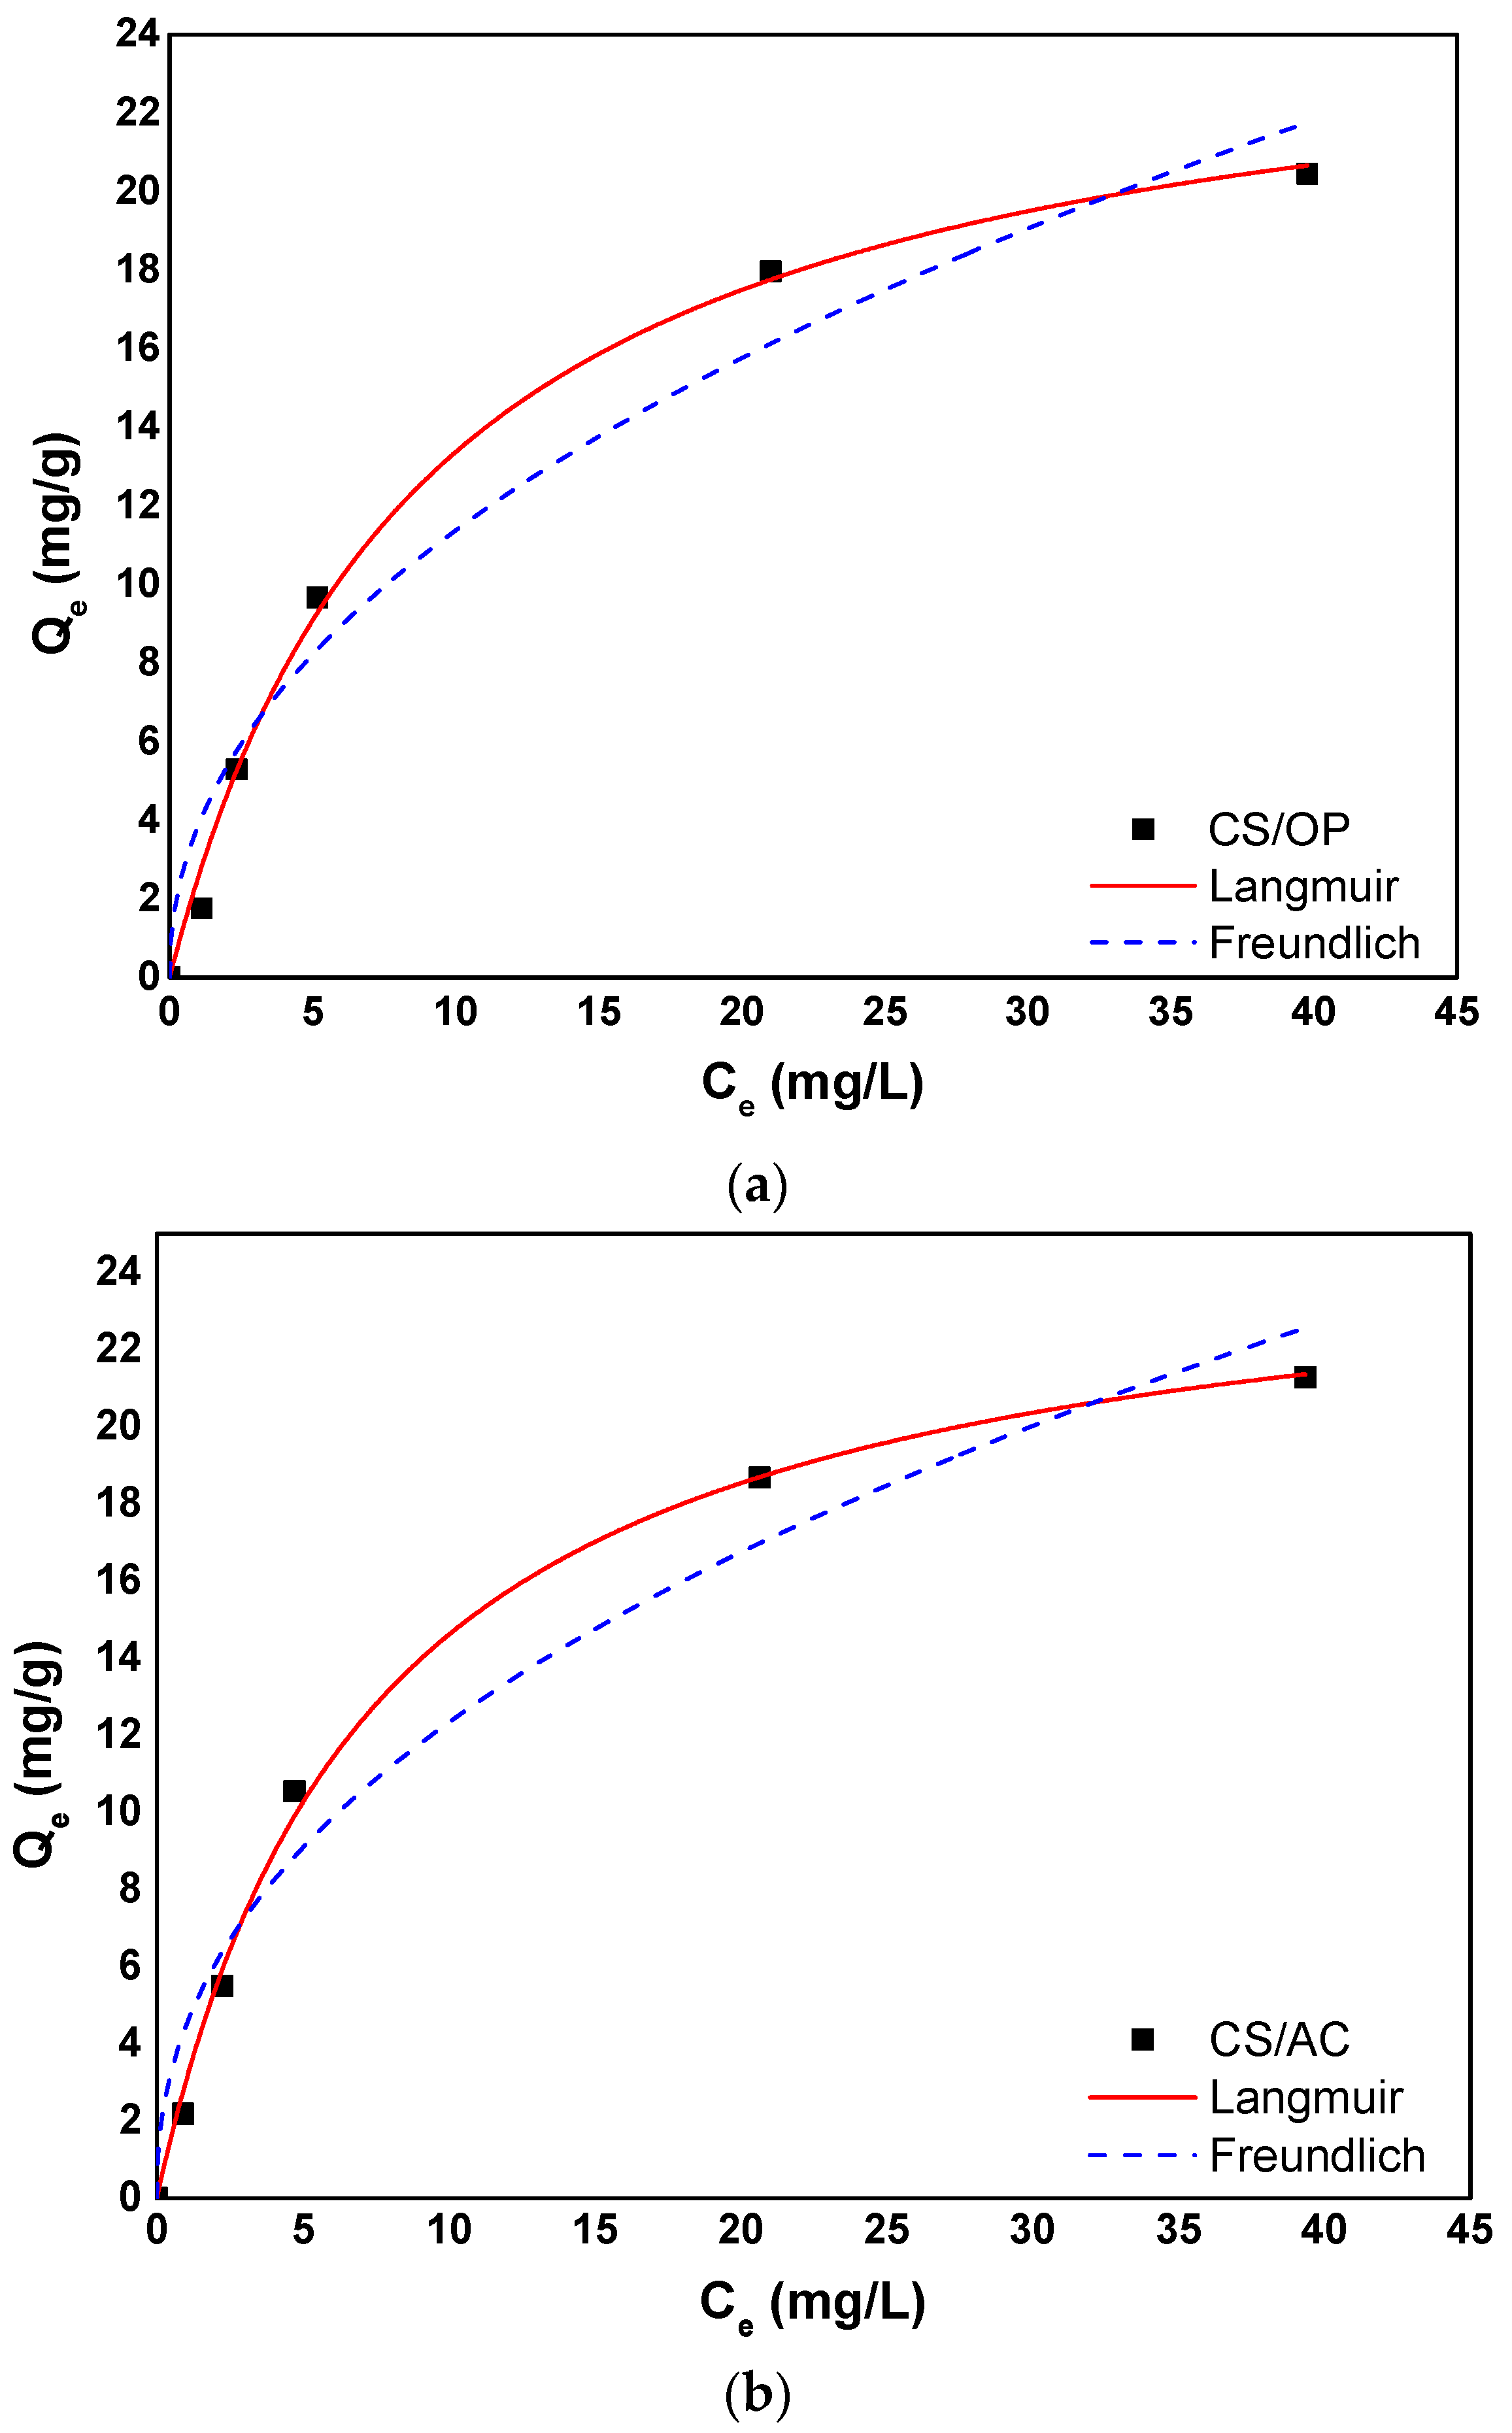
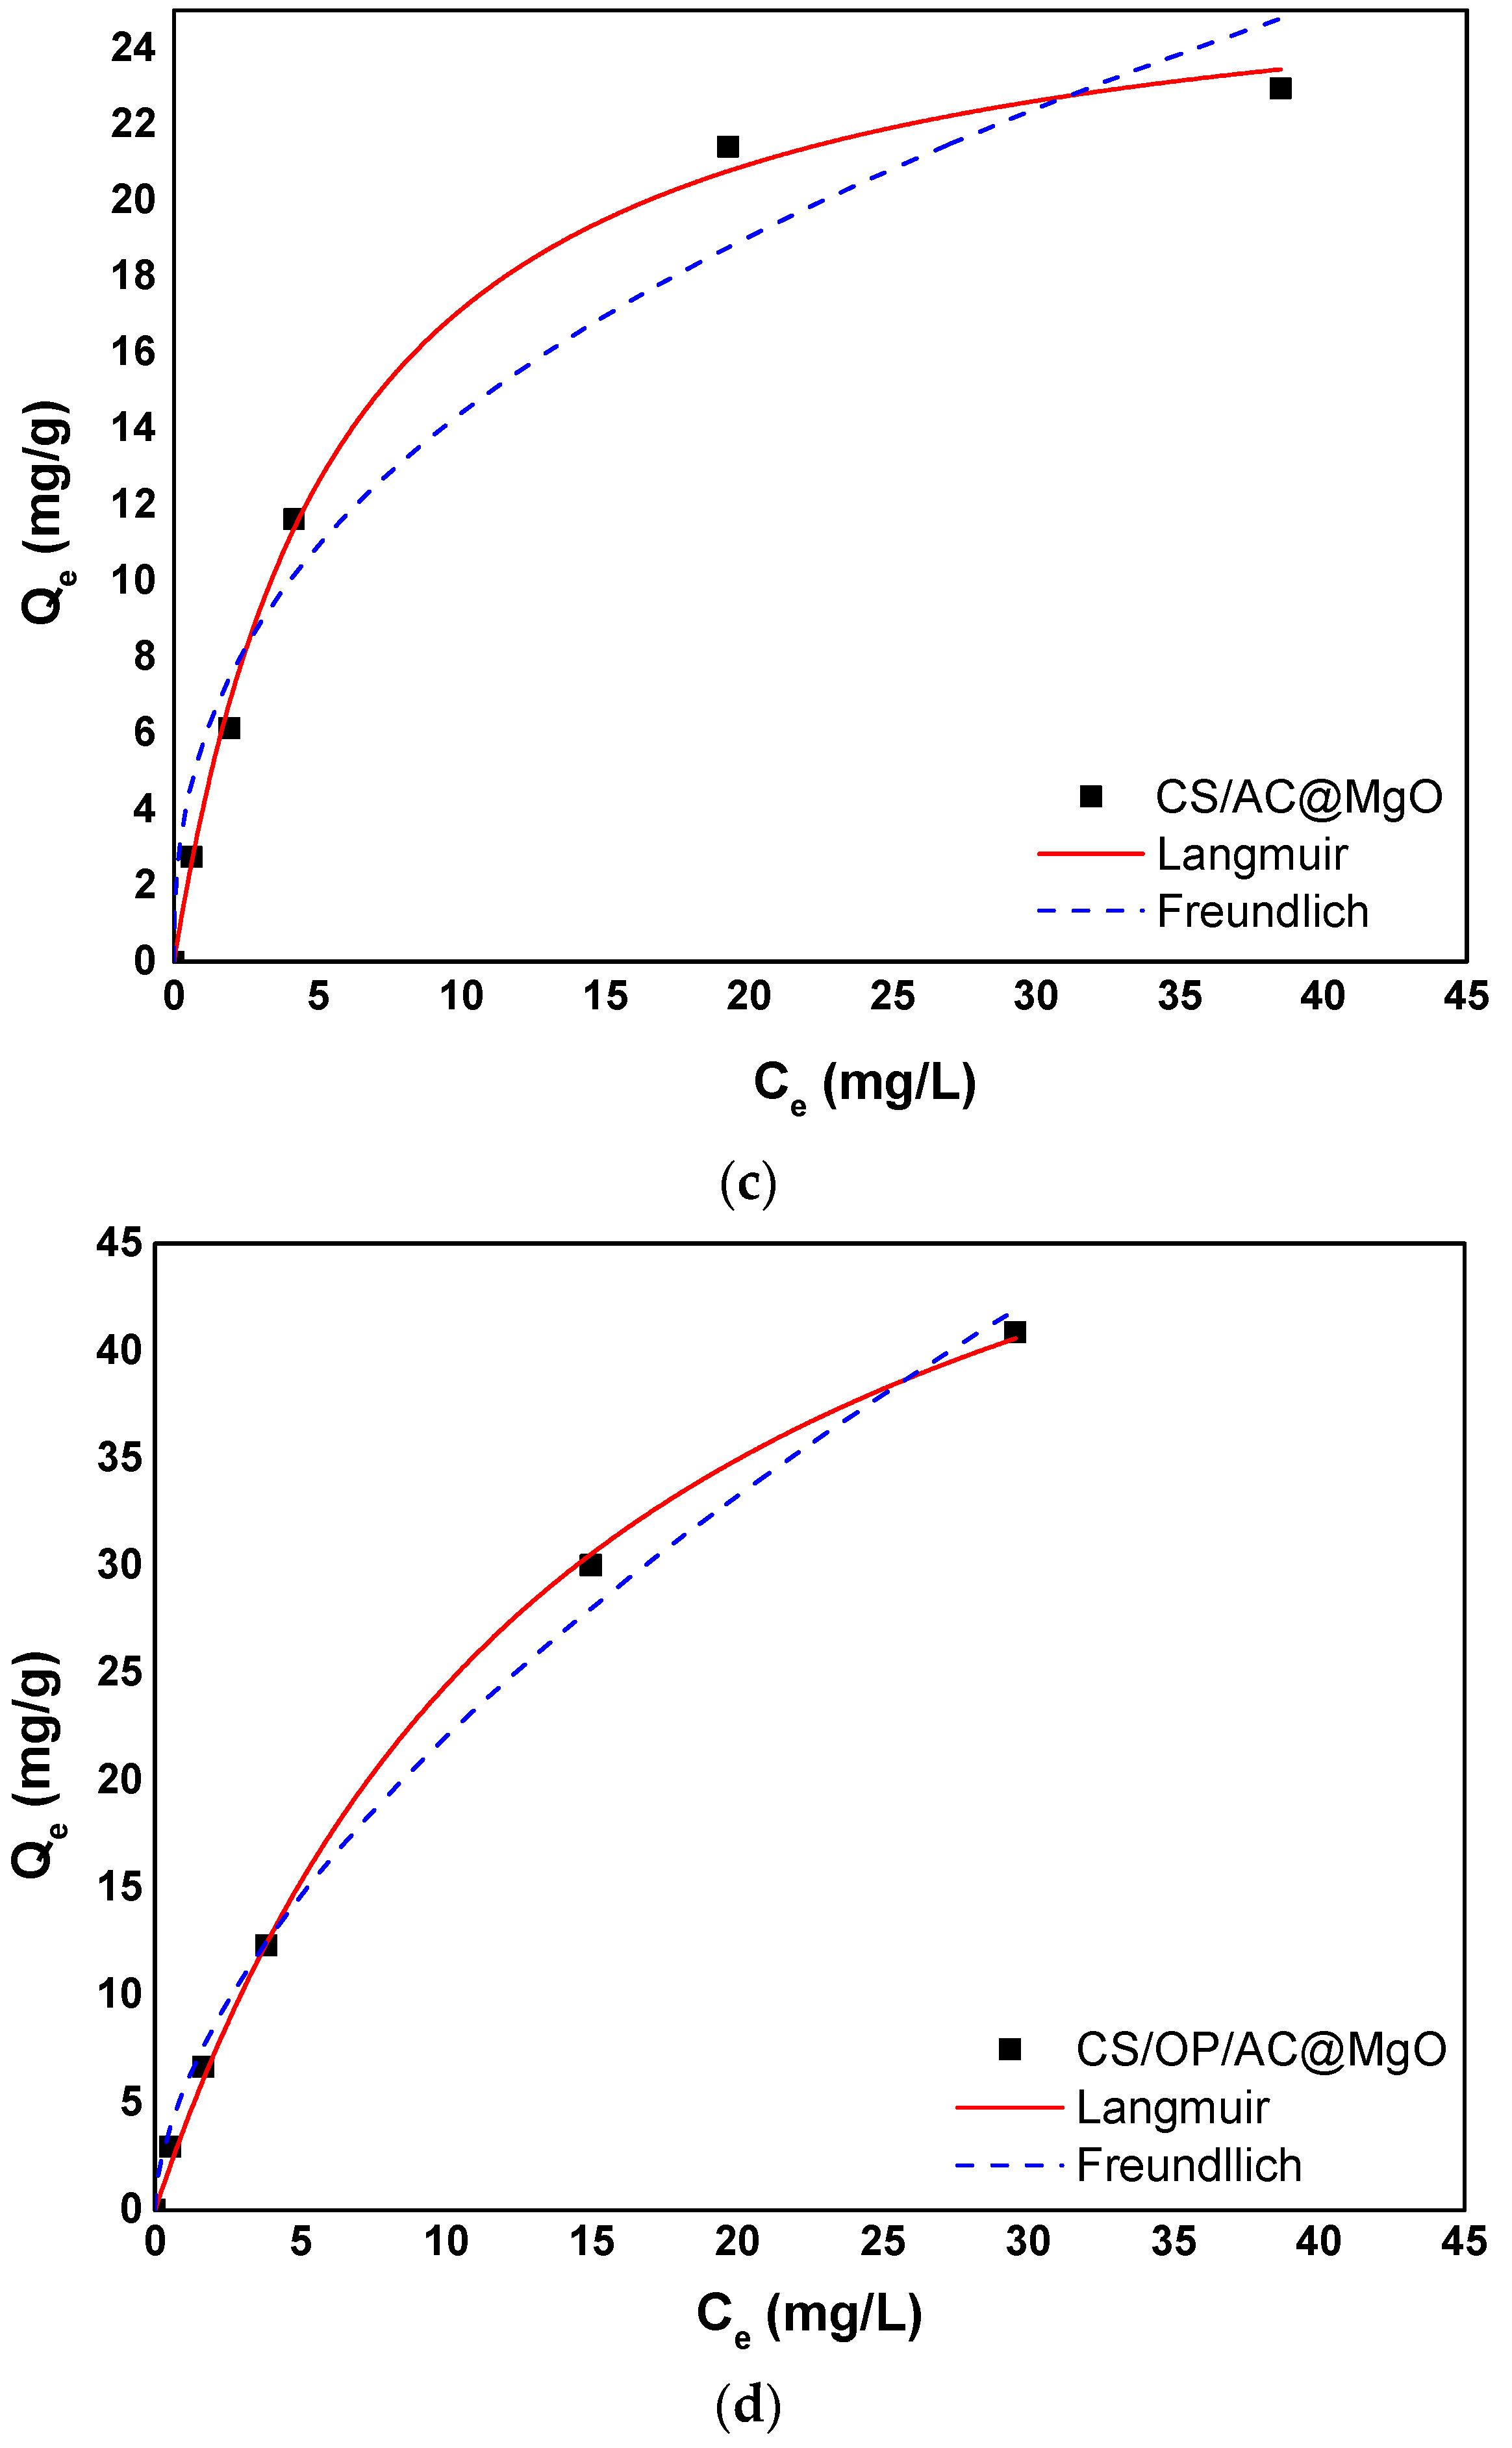
3.5. Adsorption Isotherms
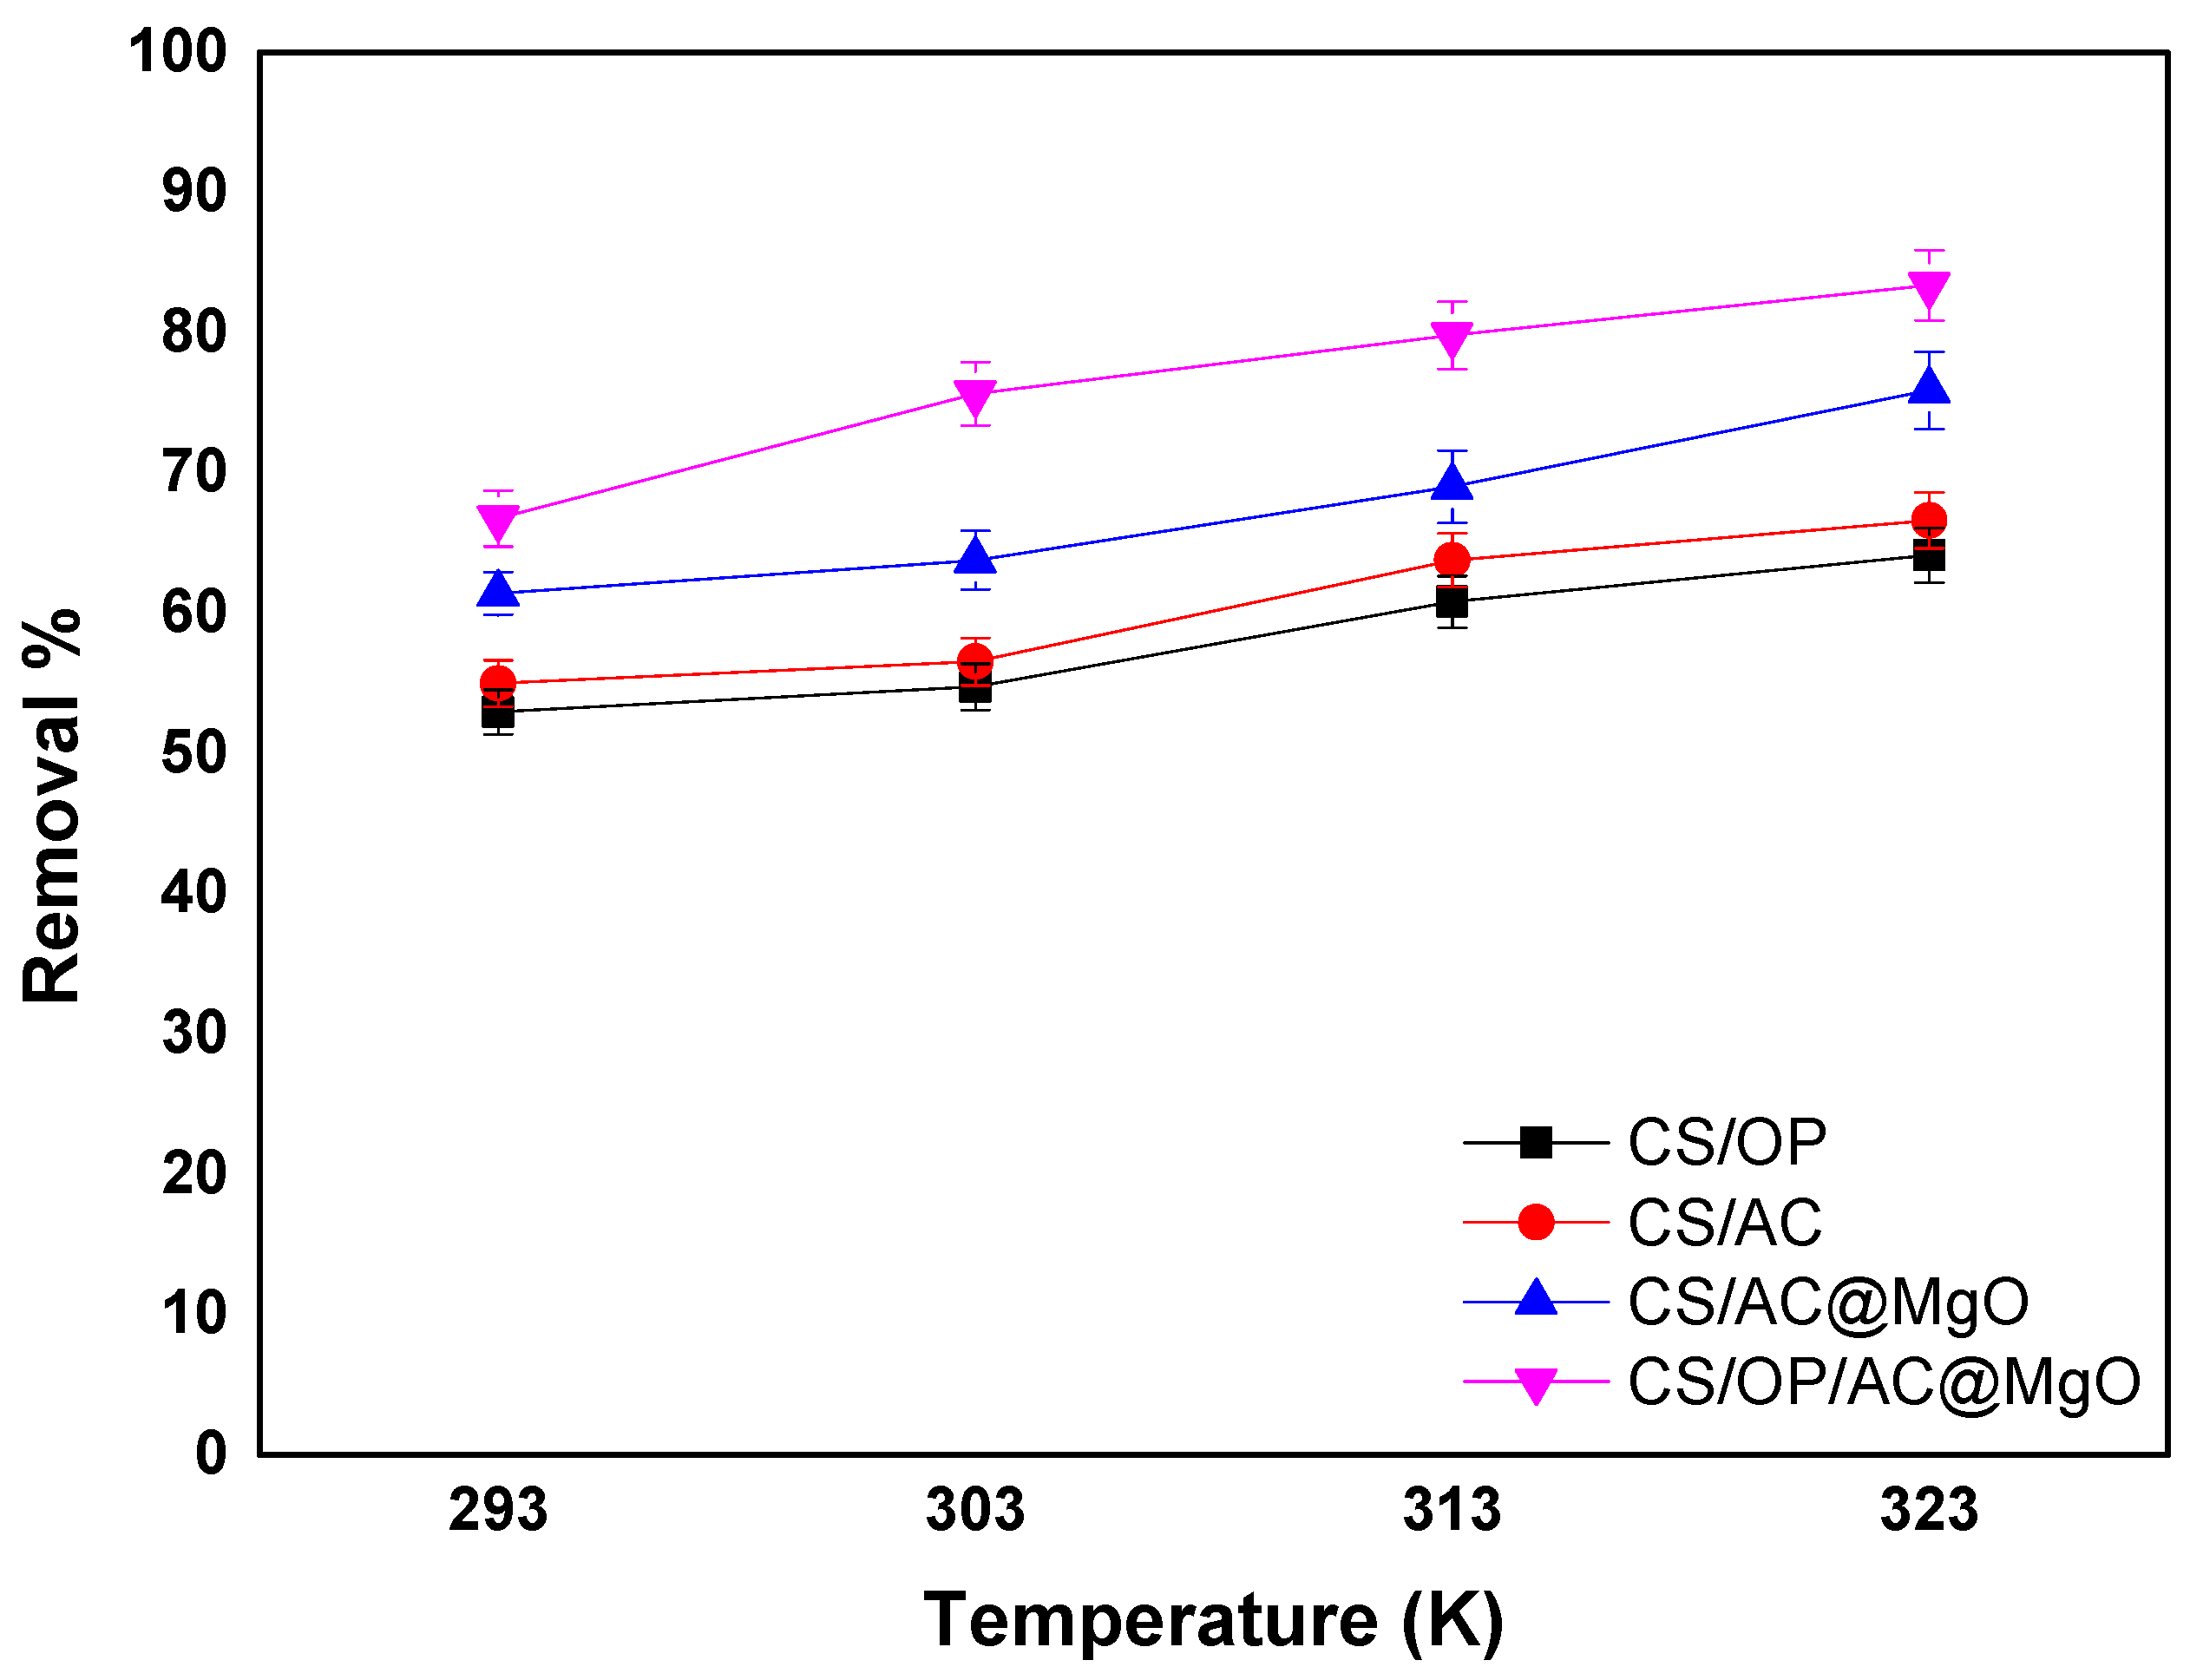
3.6. Effect of Temperature Thermodynamics
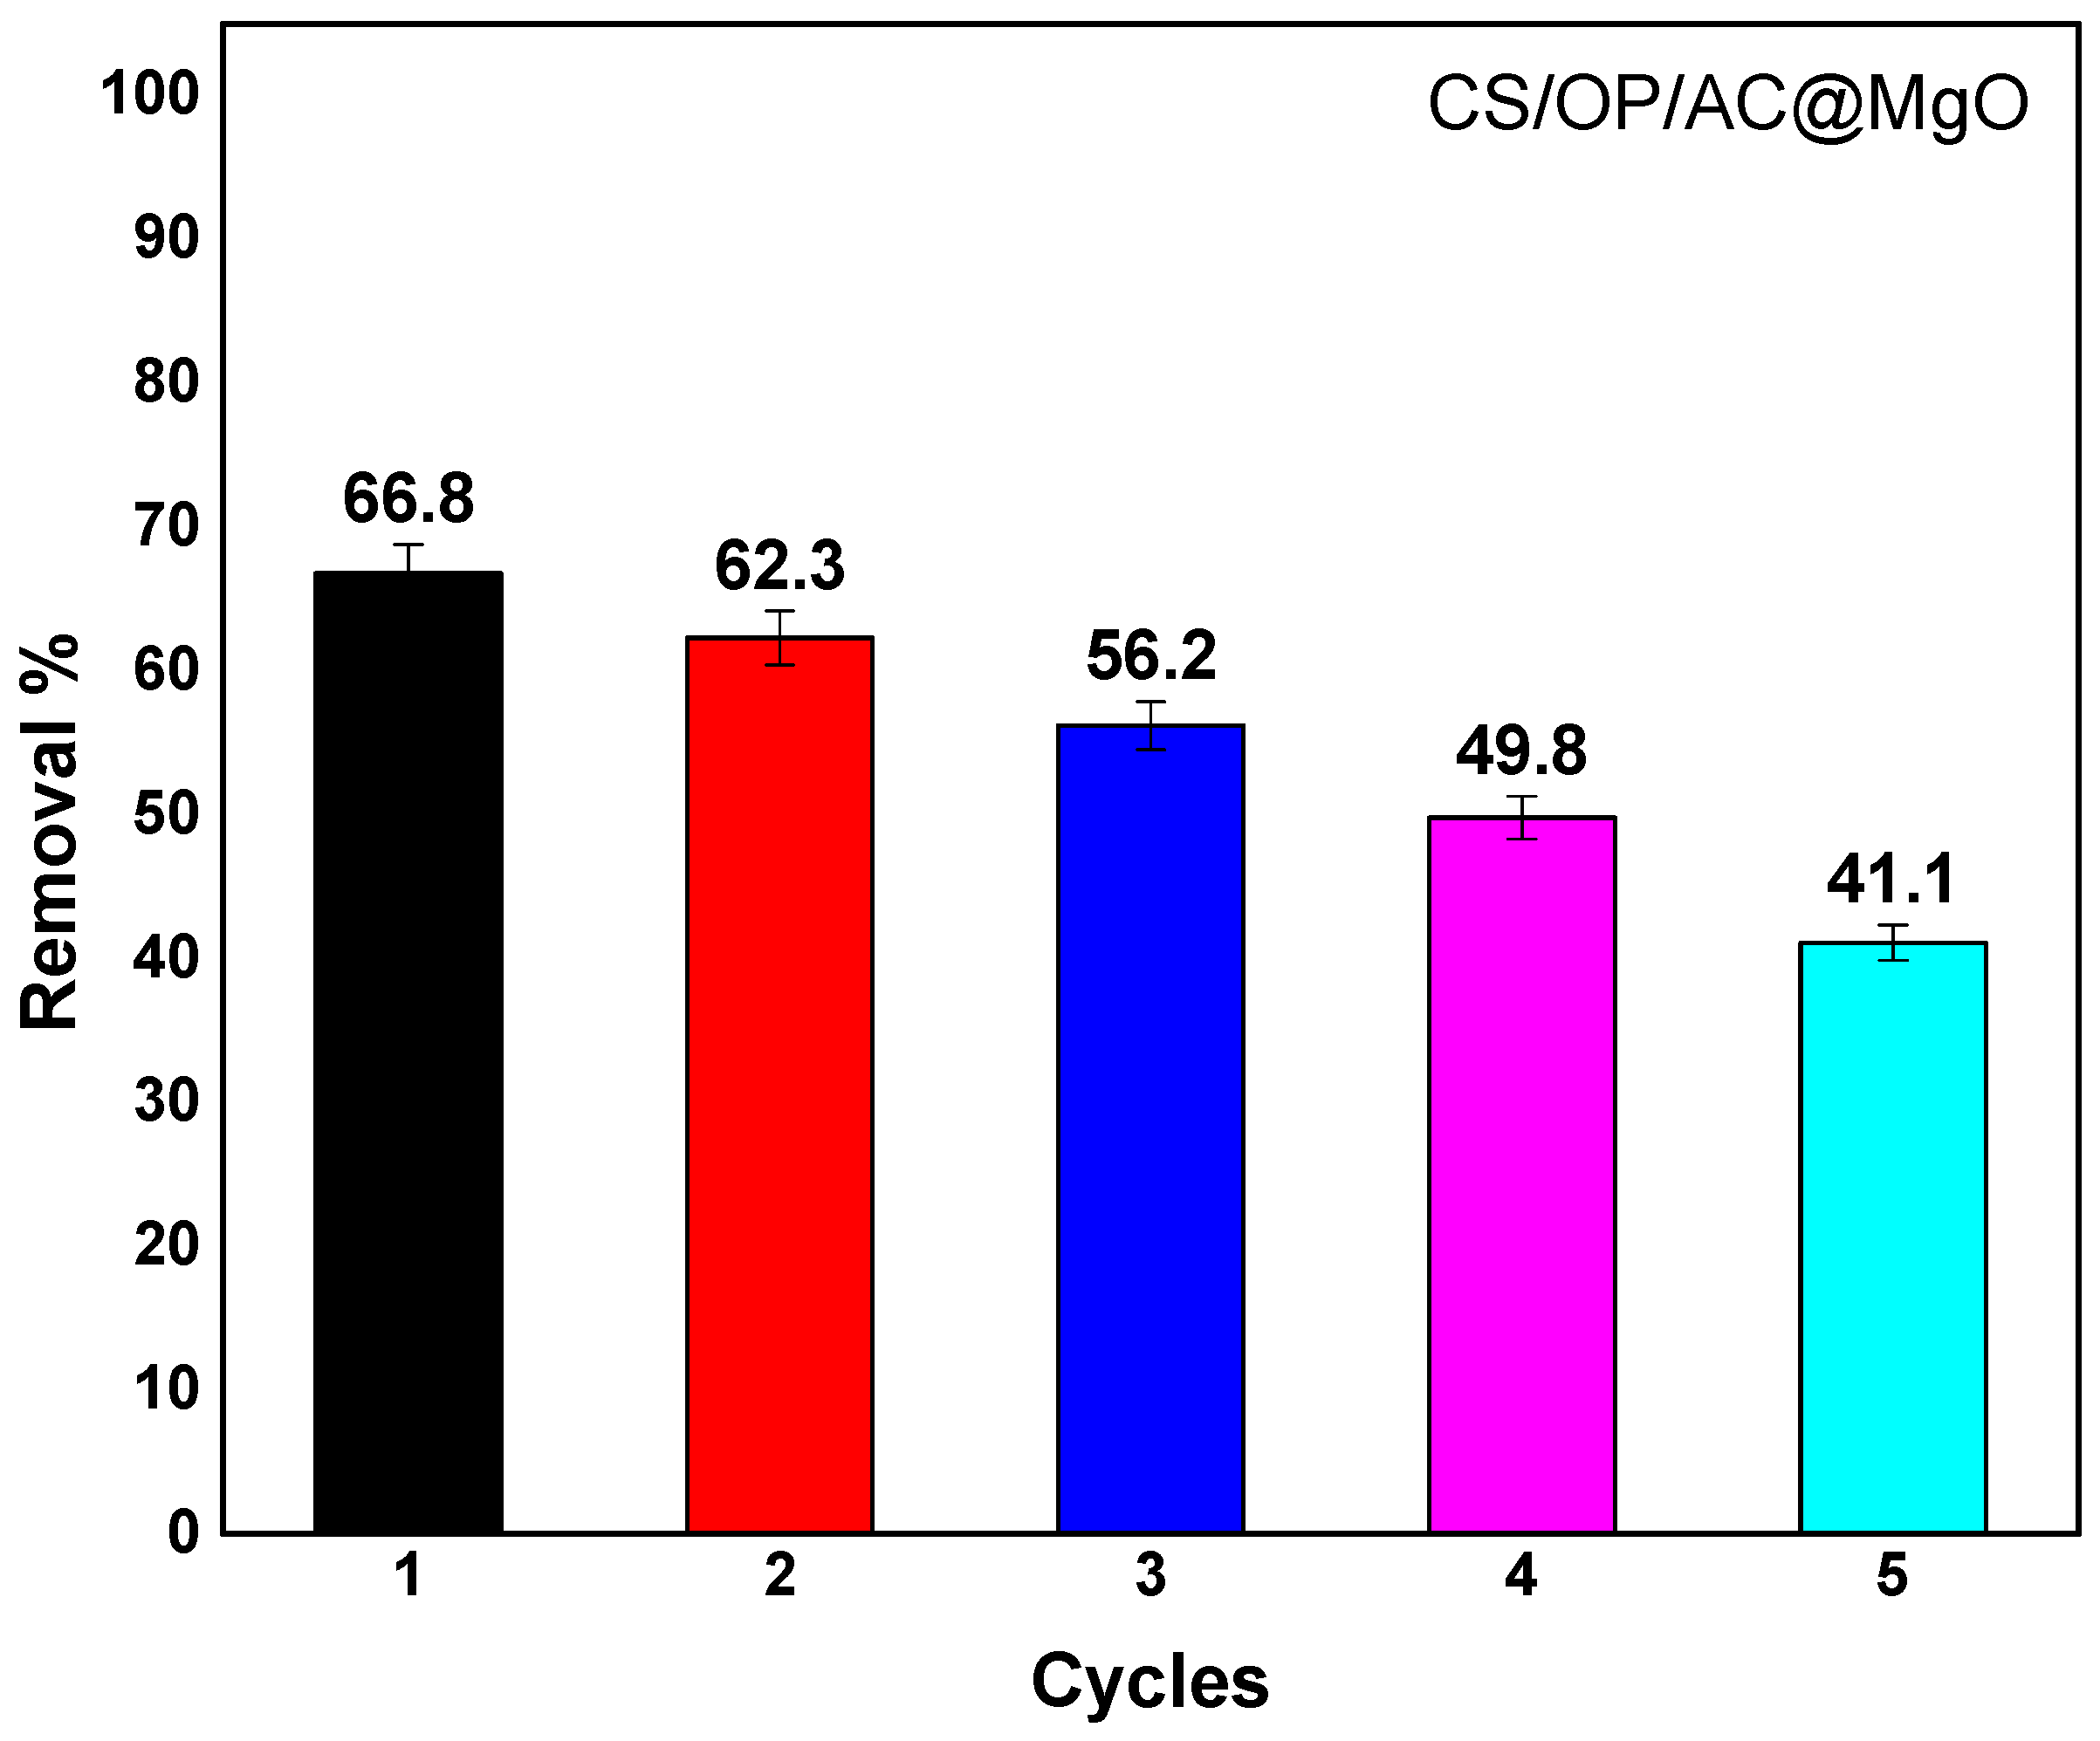
3.7. Regeneration of CS/OP/AC@MgO
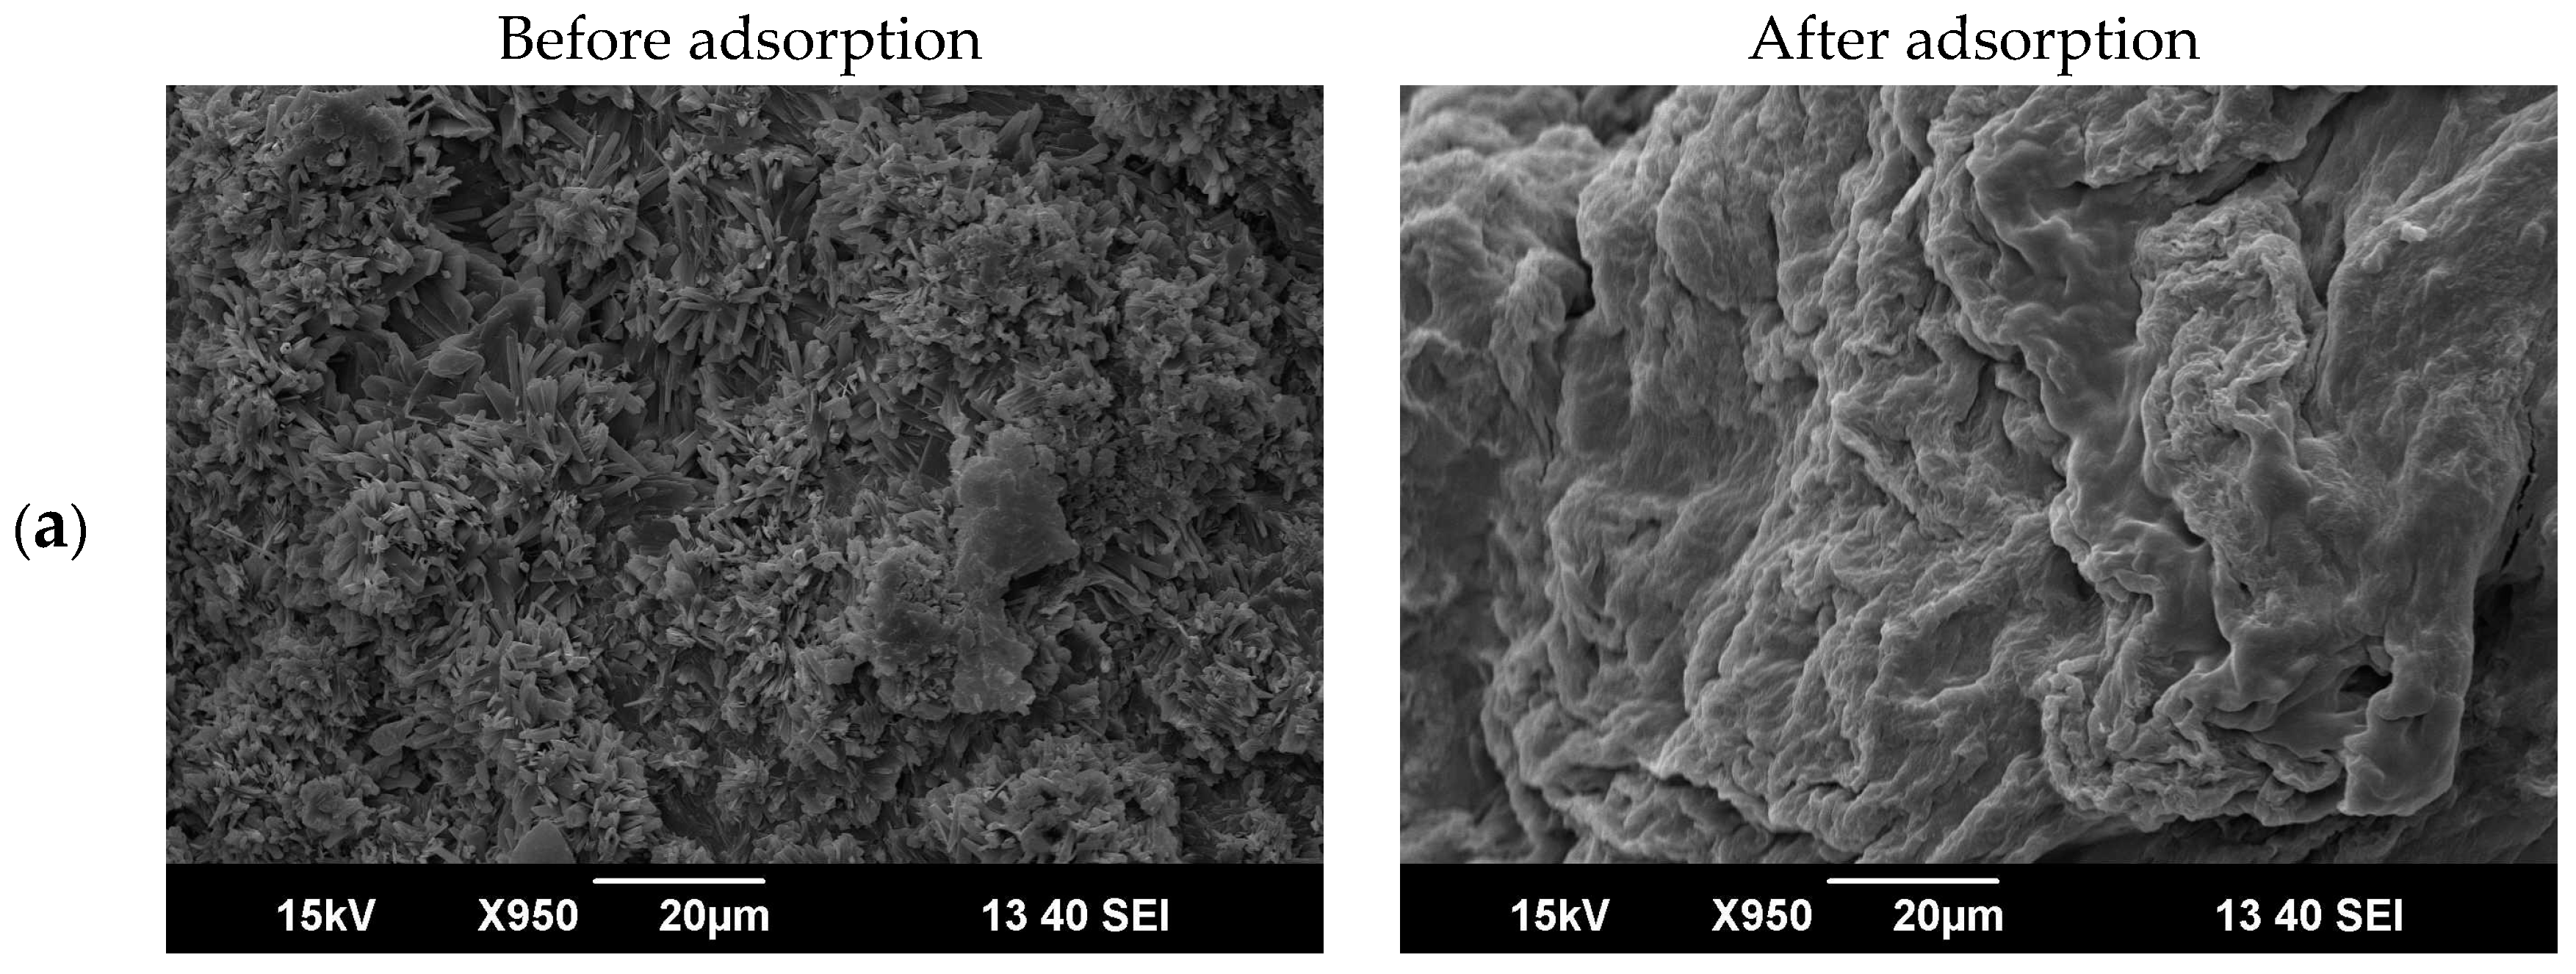
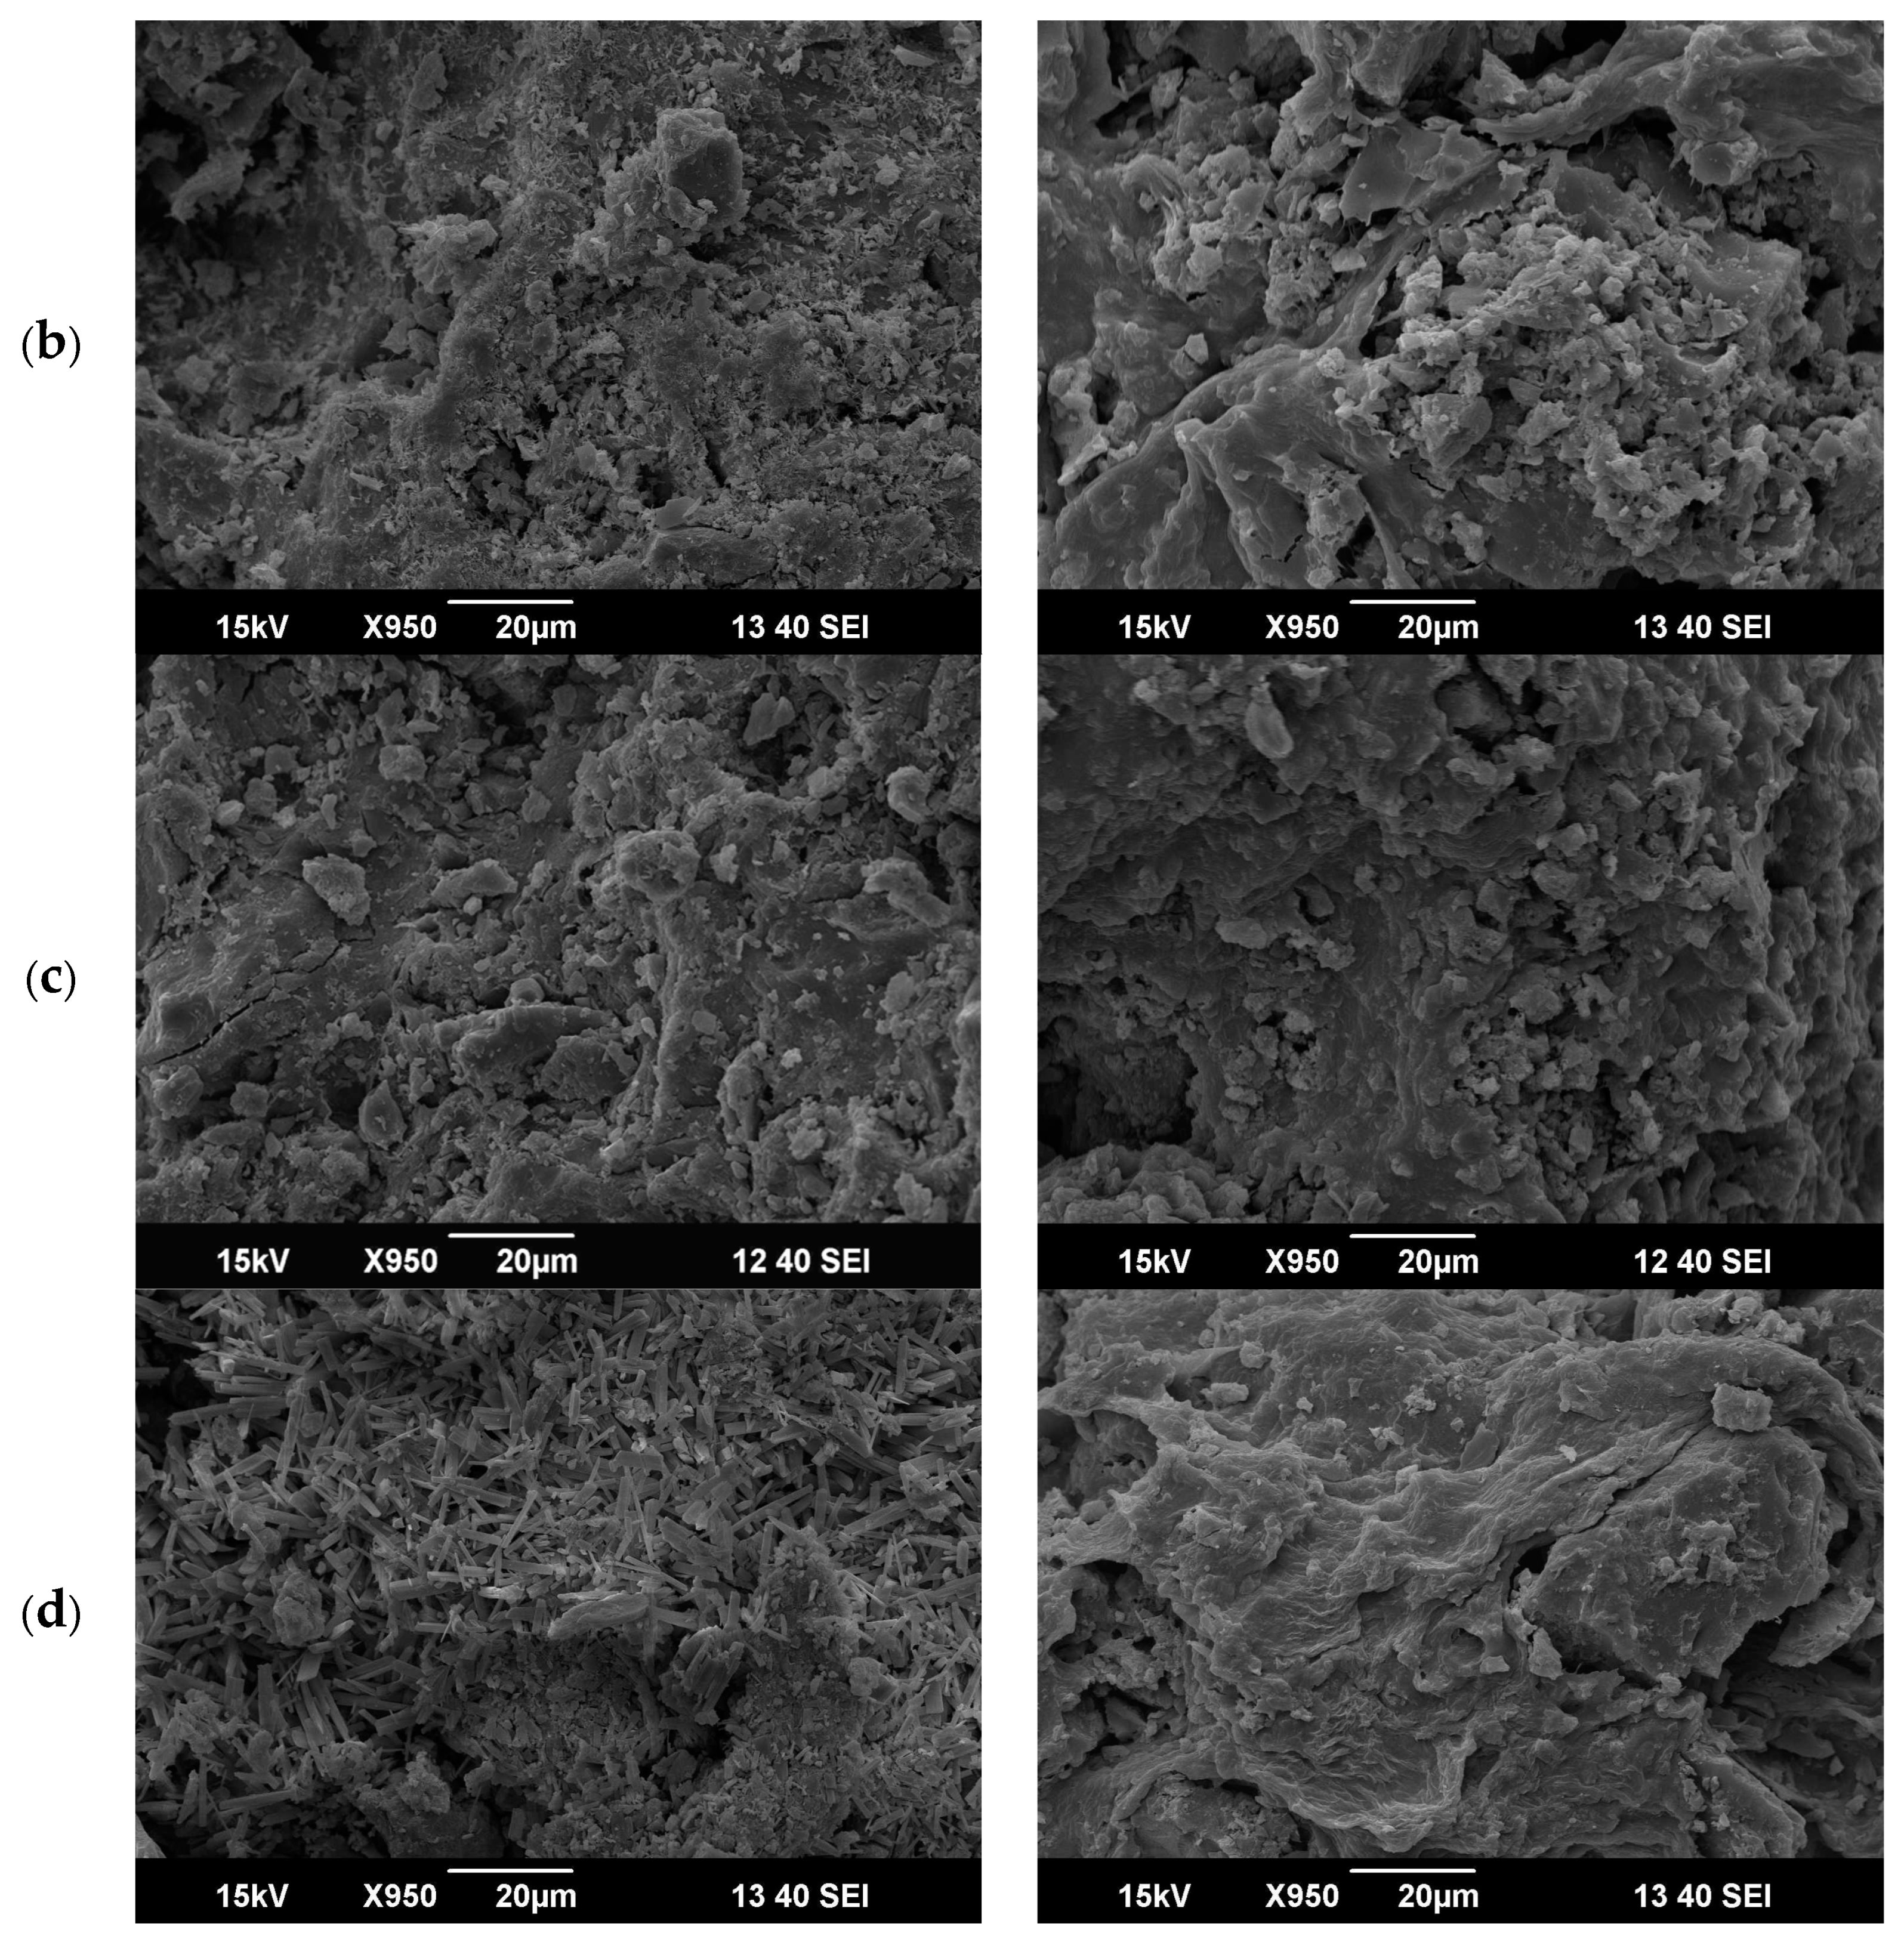
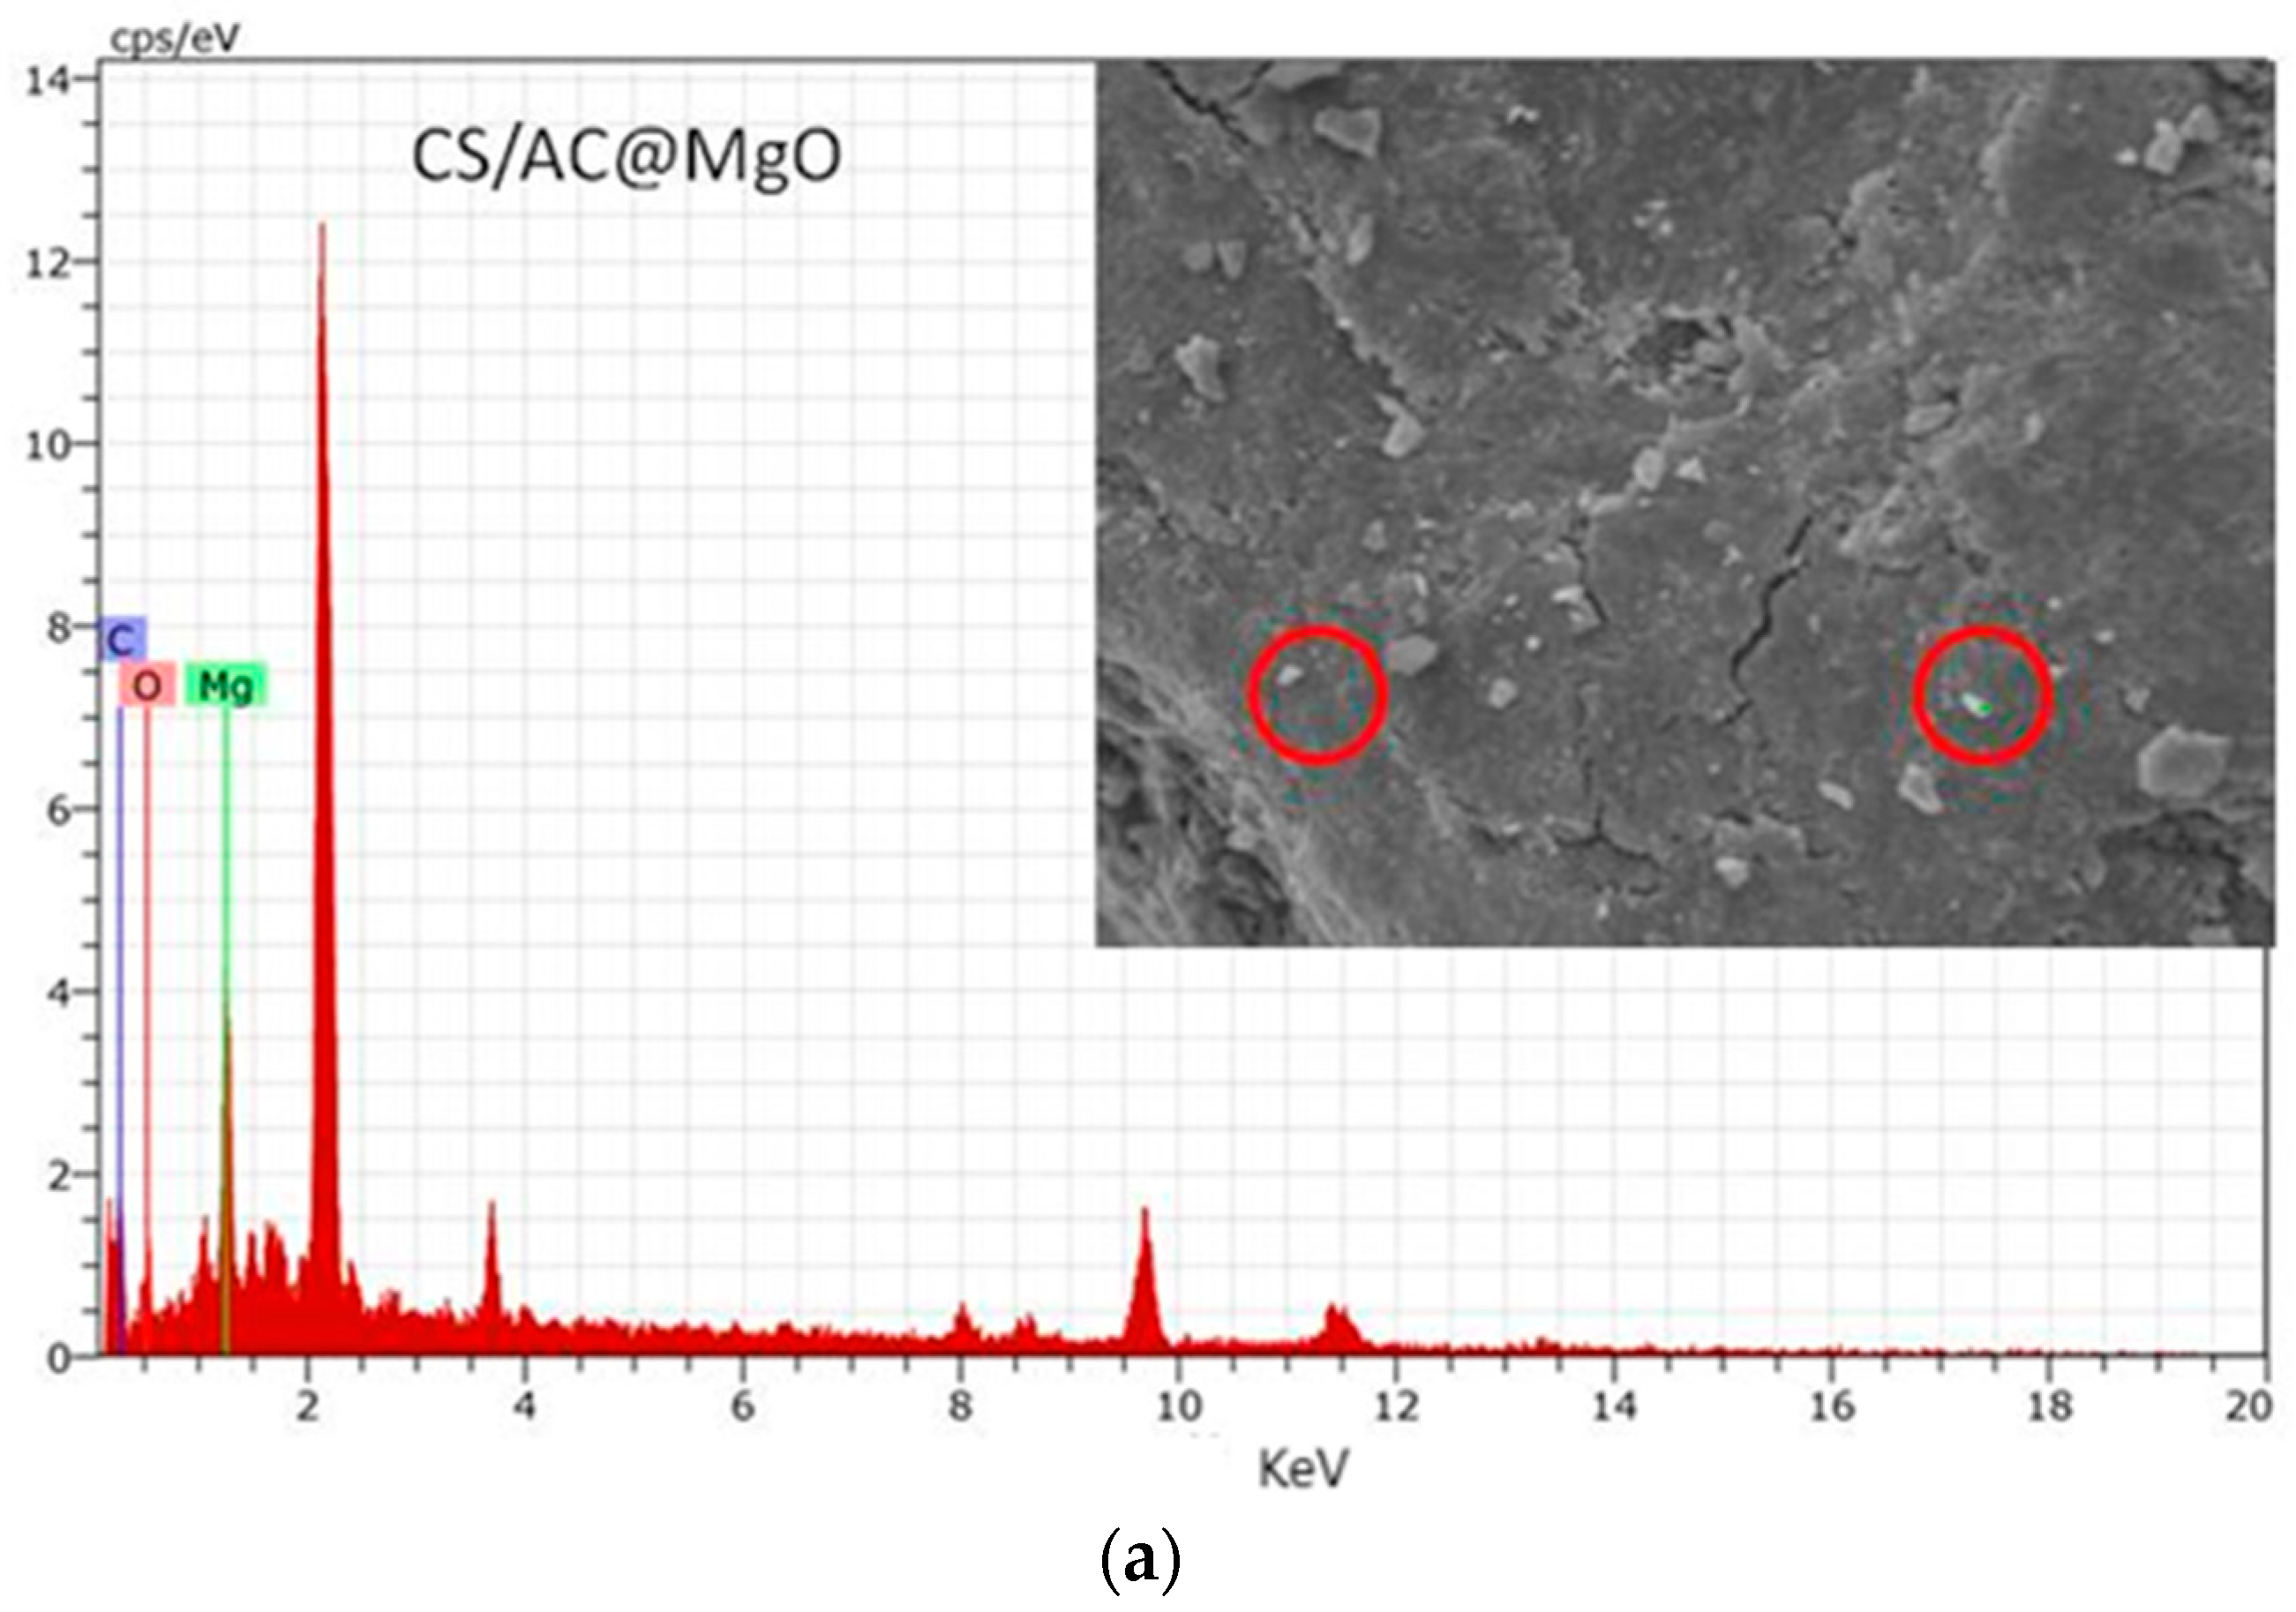
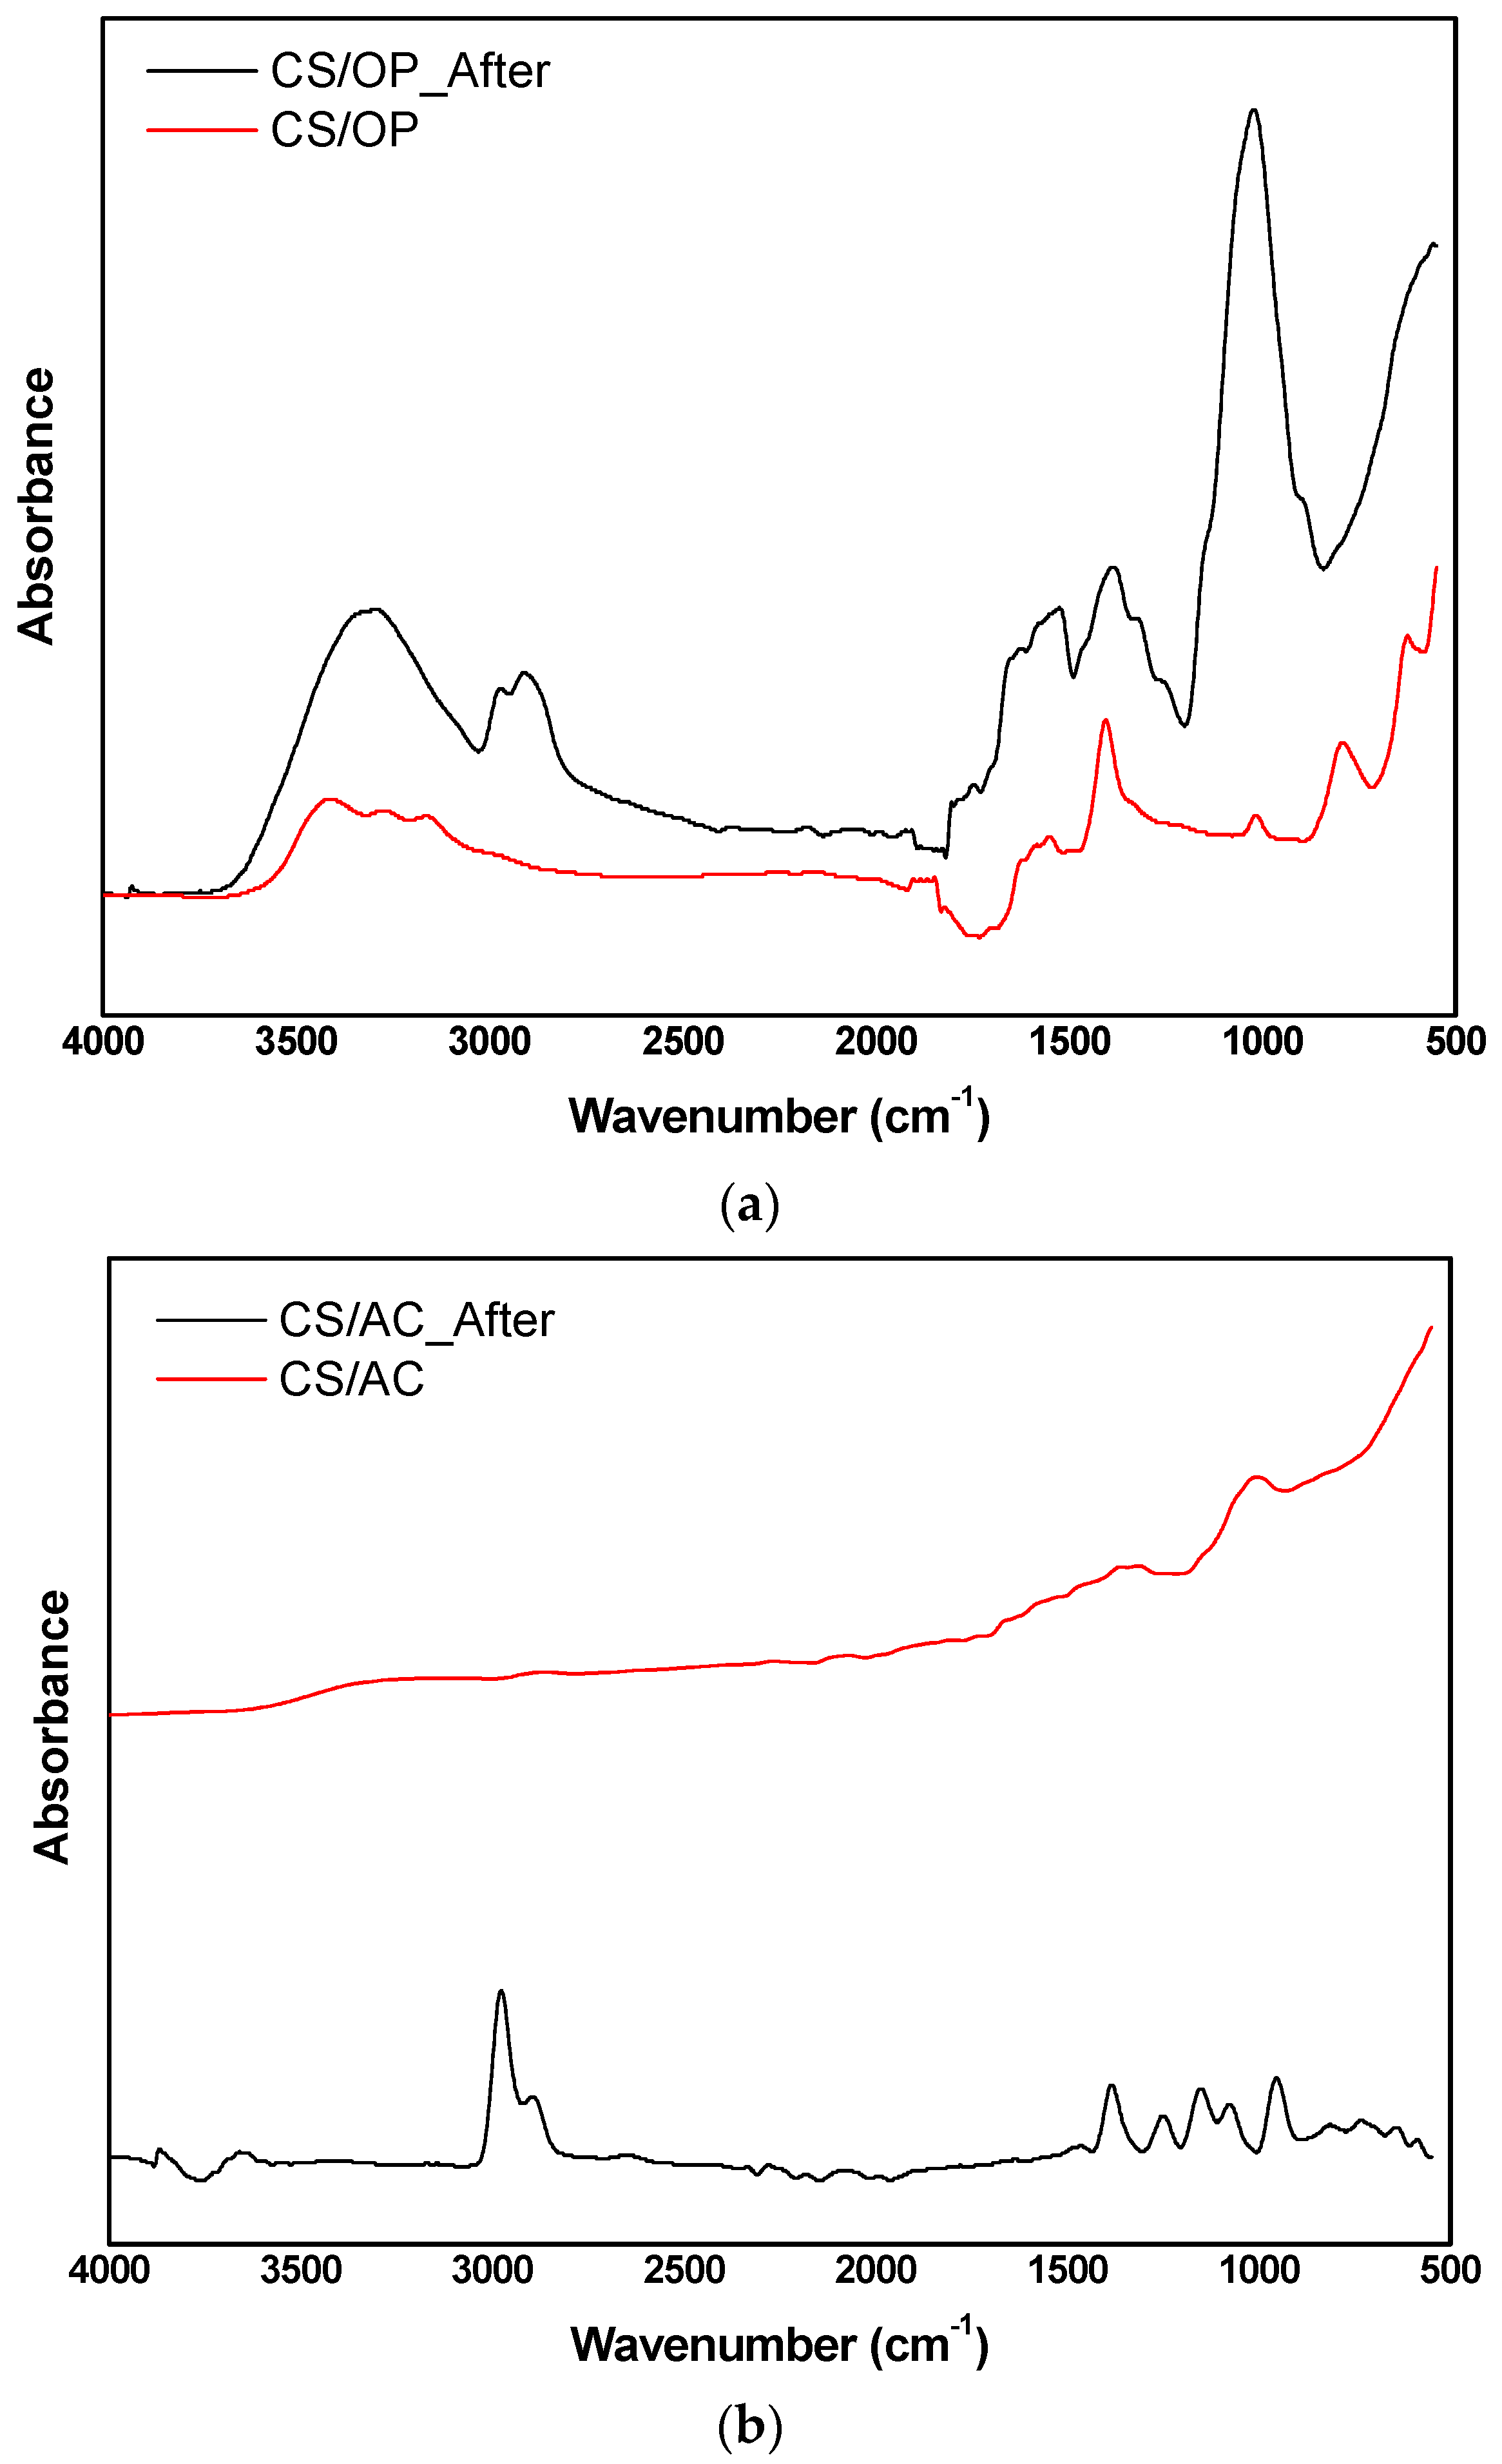
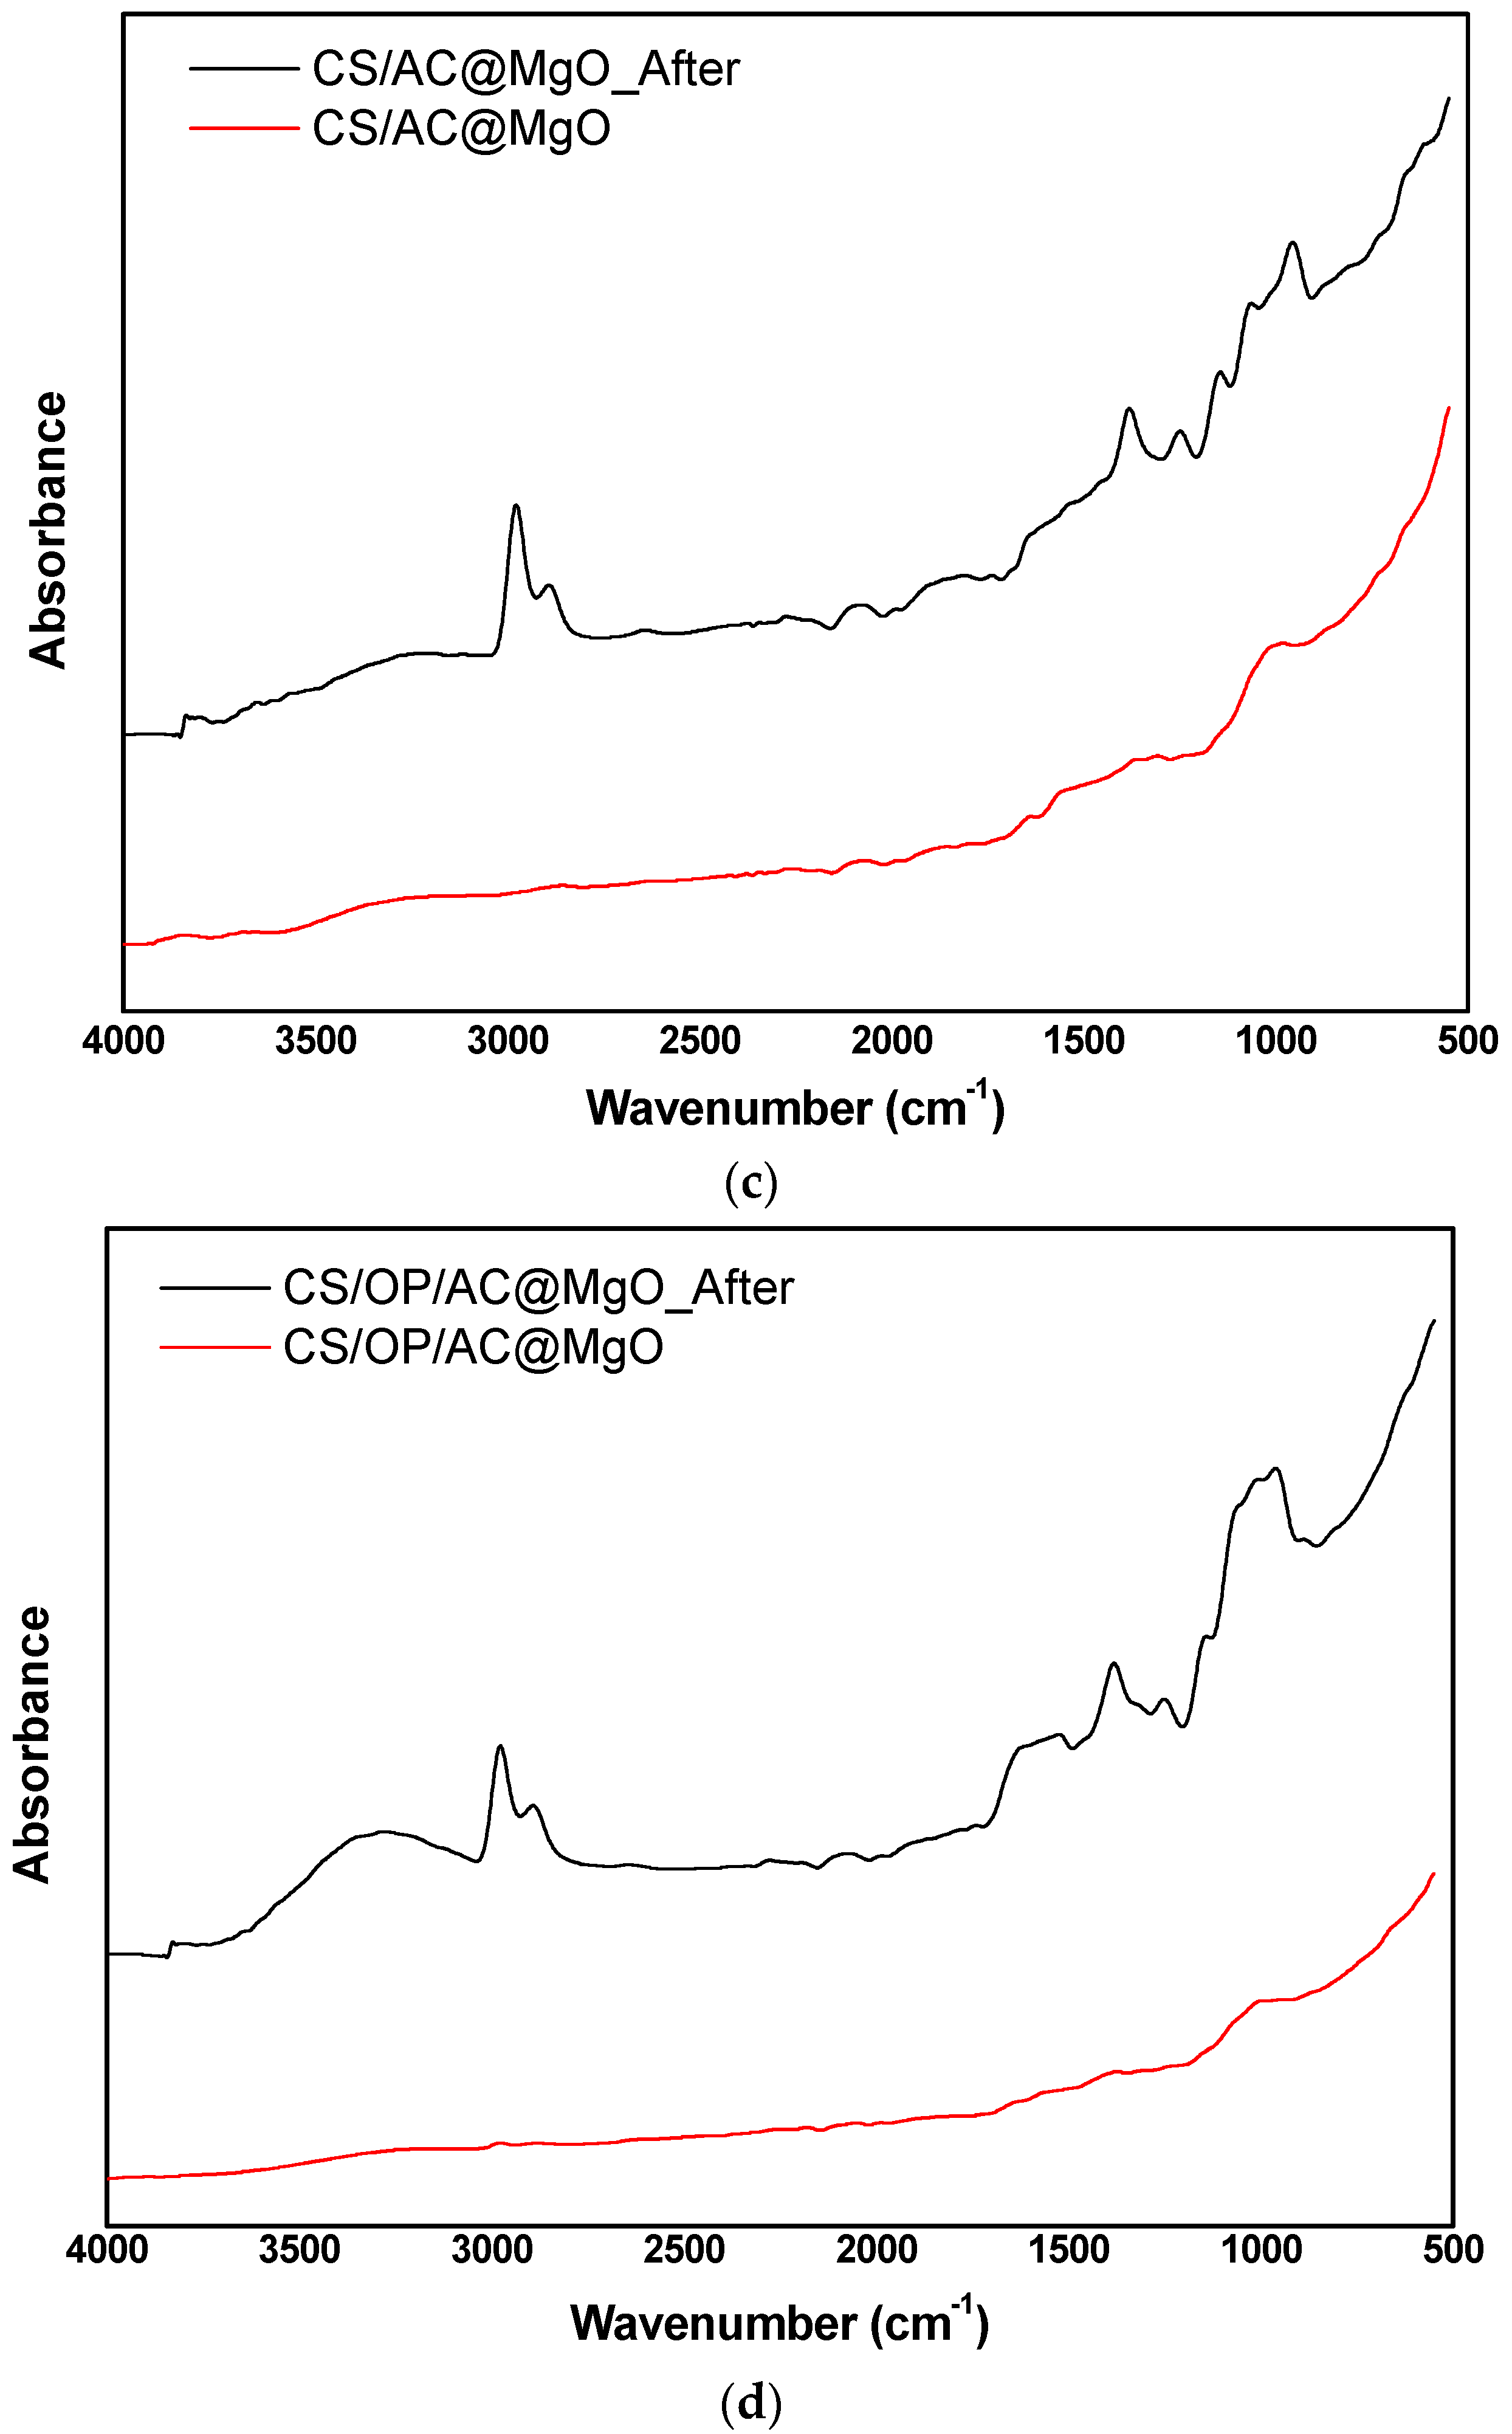
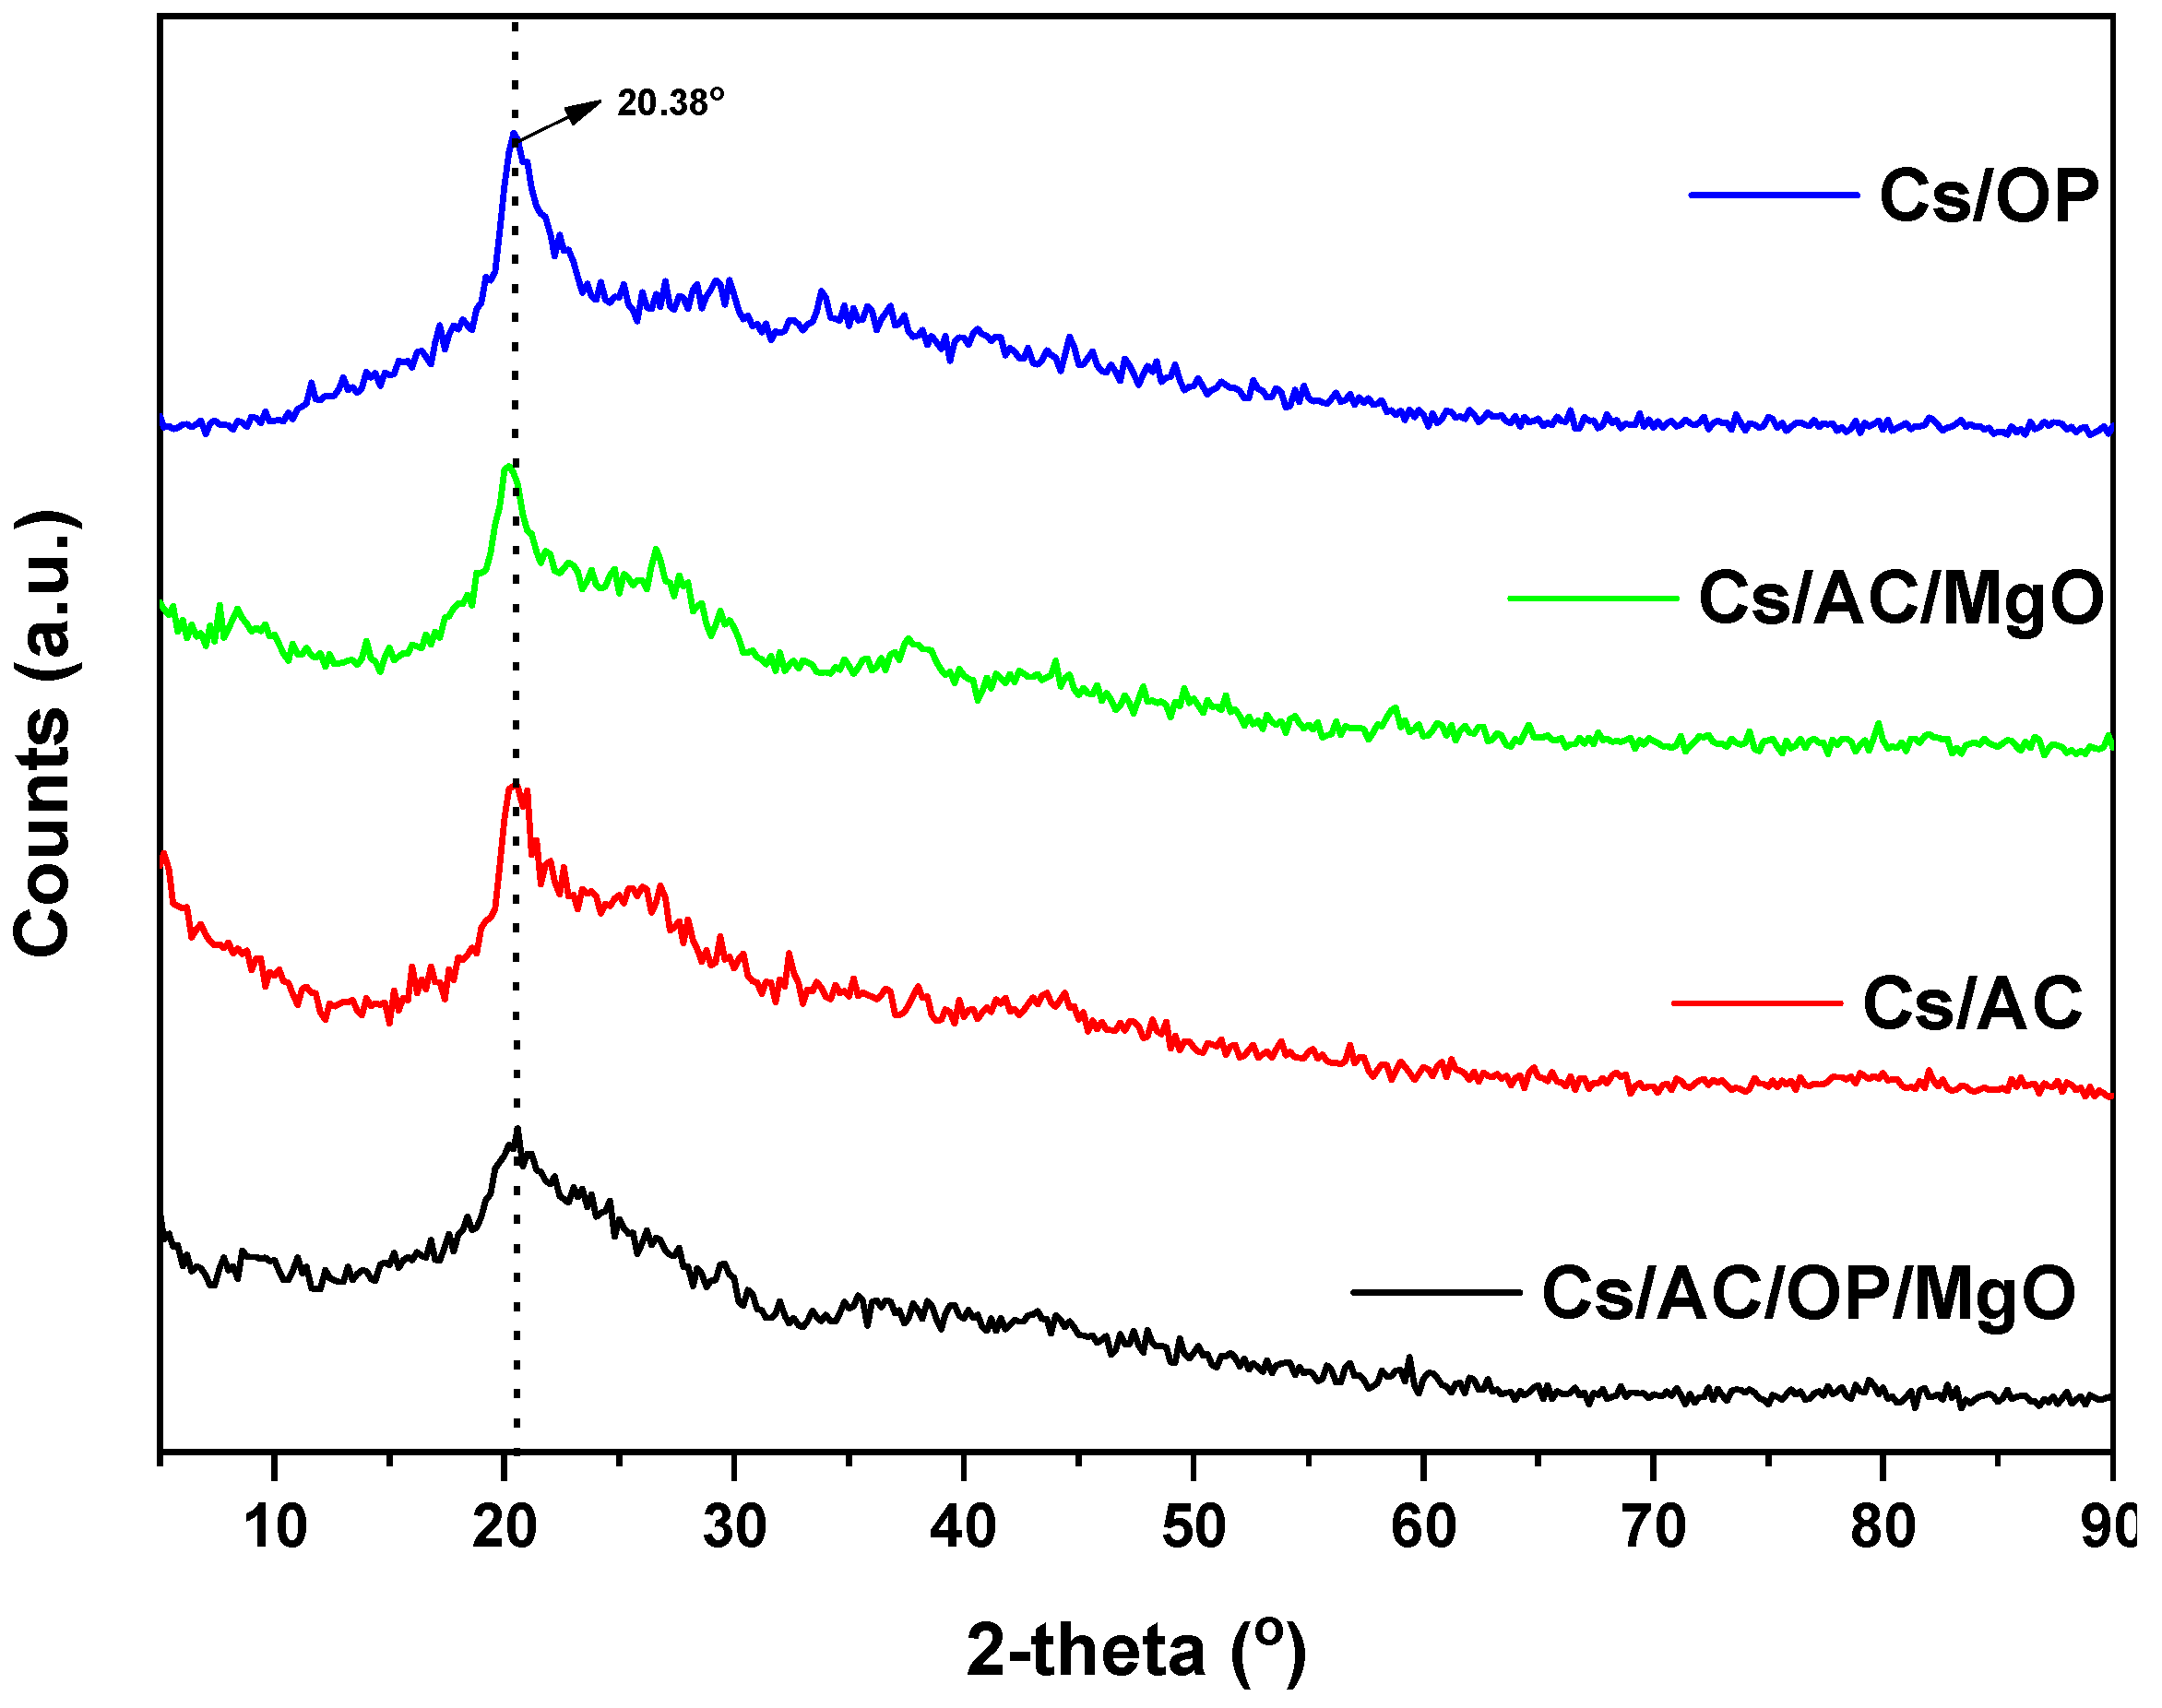
3.8. Characterization of Optimum Adsorbents before and after Adsorption
3.9. Challenges and Future Perspectives
4. Conclusions
Author Contributions
Funding
Data Availability Statement
Conflicts of Interest
References
- Miretzky, P.; Cirelli, A.F. Fluoride Removal from Water by Chitosan Derivatives and Composites: A Review. J. Fluor. Chem. 2011, 132, 231–240. [Google Scholar] [CrossRef]
- Chilton, J.; Dahi, E.; Lennon, M.; Jackson, P. Fluoride in Drinking-Water: Background Document for Development of WHO Guidelines for Drinking-Water Quality; World Health Organization: Geneva, Switzerland, 2006. [Google Scholar]
- Herschy, R.W. Water Quality for Drinking: WHO Guidelines. In Encyclopedia of Lakes and Reservoirs; Springer: Berlin/Heidelberg, Germany, 2012; pp. 876–883. [Google Scholar] [CrossRef]
- Mohapatra, M.; Anand, S.; Mishra, B.K.; Giles, D.E.; Singh, P. Review of Fluoride Removal from Drinking Water. J. Environ. Manag. 2009, 91, 67–77. [Google Scholar] [CrossRef] [PubMed]
- Lobo, C.C.; Colman Lerner, J.E.; Bertola, N.C.; Zaritzky, N.E. Synthesis and Characterization of Functional Calcium-Phosphate-Chitosan Adsorbents for Fluoride Removal from Water. Int. J. Biol. Macromol. 2024, 264, 130553. [Google Scholar] [CrossRef]
- Demelash, H.; Beyene, A.; Abebe, Z.; Melese, A. Fluoride Concentration in Ground Water and Prevalence of Dental Fluorosis in Ethiopian Rift Valley: Systematic Review and Meta-Analysis. BMC Public Health 2019, 19, 1298. [Google Scholar] [CrossRef]
- Nwankwo, C.B.; Hoque, M.A.; Islam, M.A.; Dewan, A. Groundwater Constituents and Trace Elements in the Basement Aquifers of Africa and Sedimentary Aquifers of Asia: Medical Hydrogeology of Drinking Water Minerals and Toxicants. Earth Syst. Environ. 2020, 4, 369–384. [Google Scholar] [CrossRef]
- Tolkou, A.K.; Meez, E.; Kyzas, G.Z.; Torretta, V.; Collivignarelli, M.C.; Caccamo, F.M.; Deliyanni, E.A.; Katsoyiannis, I.A. A Mini Review of Recent Findings in Cellulose-, Polymer- and Graphene-Based Membranes for Fluoride Removal from Drinking Water. C 2021, 7, 74. [Google Scholar] [CrossRef]
- Brindha, K.; Elango, L. Fluoride in Groundwater: Causes, Implications and Mitigation Measures. Fluoride Prop. Appl. Environ. Manag. 2011, 1, 113–136. [Google Scholar]
- Mei, L.; Wei, J.; Yang, R.; Ke, F.; Peng, C.; Hou, R.; Liu, J.; Wan, X.; Cai, H. Zirconium/Lanthanum-Modified Chitosan/Polyvinyl Alcohol Composite Adsorbent for Rapid Removal of Fluoride. Int. J. Biol. Macromol. 2023, 243, 125155. [Google Scholar] [CrossRef]
- Prasad, K.S.B.; Jakeer Hussain, P.; Bharath Kumar, P. Defluorination of Groundwater by Low-Cost Adsorbents. In IOP Conference Series: Materials Science and Engineering; IOP Publishing: Bristol, UK, 2021; Volume 1025. [Google Scholar] [CrossRef]
- Rahman, A.; Yoshida, K.; Islam, M.M.; Kobayashi, G. Investigation of Efficient Adsorption of Toxic Heavy Metals (Chromium, Lead, Cadmium) from Aquatic Environment Using Orange Peel Cellulose as Adsorbent. Sustainability 2023, 15, 4470. [Google Scholar] [CrossRef]
- Tolkou, A.K.; Mitrakas, M.; Katsoyiannis, I.A.; Ernst, M.; Zouboulis, A.I. Fluoride Removal from Water by Composite Al/Fe/Si/Mg Pre-Polymerized Coagulants: Characterization and Application. Chemosphere 2019, 231, 528–537. [Google Scholar] [CrossRef]
- Malalagama, T.P.; Binghui, T.; Jinadasa, K.B.S.N.; Samaraweera, D.R.; Yang, F. Removal of Fluoride in Water and Wastewater Using Electrodialysis/Electrodialysis Reverse Process: A Review BT—ICSBE 2020; Dissanayake, R., Mendis, P., Weerasekera, K., De Silva, S., Fernando, S., Eds.; Springer: Singapore, 2022; pp. 553–564. [Google Scholar]
- Lou, X.Y.; Wang, J.; Liang, J.; Liu, S.; Wang, R.; Deng, L.; Li, D.; Hu, X.; Chen, H. Sequence Closed-Loop Recovery of Fluoride, Phosphate, and Sulfate Anions from Phosphogypsum Leachate via Precipitation-Electrodialysis-Crystallization Approaches. Sep. Purif. Technol. 2024, 342, 127014. [Google Scholar] [CrossRef]
- Arab, N.; Derakhshani, R.; Sayadi, M.H. Approaches for the Efficient Removal of Fluoride from Groundwater: A Comprehensive Review. Toxics 2024, 12, 306. [Google Scholar] [CrossRef] [PubMed]
- Singh, J.; Singh, P.; Singh, A. Fluoride Ions vs Removal Technologies: A Study. Arab. J. Chem. 2016, 9, 815–824. [Google Scholar] [CrossRef]
- Tolkou, A.K.; Manousi, N.; Zachariadis, G.A.; Katsoyiannis, I.A.; Deliyanni, E.A. Recently Developed Adsorbing Materials for Fluoride Removal from Water and Fluoride Analytical Determination Techniques: A Review. Sustainability 2021, 13, 7061. [Google Scholar] [CrossRef]
- Tolkou, A.K.; Zouboulis, A.I. Fluoride Removal from Water Sources by Adsorption on MOFs. Separations 2023, 10, 467. [Google Scholar] [CrossRef]
- Kyzas, G.; Tolkou, A.K.; Al Musawi, T.J.; Mengelizadeh, N.; Mohebi, S.; Balarak, D. Fluoride Removal from Water by Using Magnetic Activated Carbon Derived from Canola Stalks. SSRN Electron. J. 2022, 233, 424. [Google Scholar] [CrossRef]
- Lim, Y.J.; Goh, K.; Goto, A.; Zhao, Y.; Wang, R. Uranium and Lithium Extraction from Seawater: Challenges and Opportunities for a Sustainable Energy Future. J. Mater. Chem. A 2023, 11, 22551–22589. [Google Scholar] [CrossRef]
- Pillai, P.; Dharaskar, S.; Pandian, S.; Panchal, H. Overview of Fluoride Removal from Water Using Separation Techniques. Environ. Technol. Innov. 2021, 21, 101246. [Google Scholar] [CrossRef]
- Yazdi, F.; Anbia, M.; Sepehrian, M. Recent Advances in Removal of Inorganic Anions from Water by Chitosan-Based Composites: A Comprehensive Review. Carbohydr. Polym. 2023, 320, 121230. [Google Scholar] [CrossRef]
- Turki, T.; Hamdouni, A.; Enesca, A. Fluoride Adsorption from Aqueous Solution by Modified Zeolite—Kinetic and Isotherm Studies. Molecules 2023, 28, 4076. [Google Scholar] [CrossRef]
- Tolkou, A.K.; Maroulas, K.N.; Theologis, D.; Katsoyiannis, I.A.; Kyzas, G.Z. Comparison of Modified Peels: Natural Peels or Peels-Based Activated Carbons for the Removal of Several Pollutants Found in Wastewaters. C-J. Carbon Res. 2024, 10, 22. [Google Scholar] [CrossRef]
- Dago-Serry, Y.; Maroulas, K.N.; Tolkou, A.K.; AbdelAll, N.; Alodhayb, A.N.; Khouqeer, G.A.; Kyzas, G.Z. Composite Super-Adsorbents of Chitosan/Activated Carbon for the Removal of Nonsteroidal Anti-Inflammatory Drug from Wastewaters. J. Mol. Struct. 2024, 1298, 137044. [Google Scholar] [CrossRef]
- Venault, A.; Vachoud, L.; Pochat, C.; Bouyer, D.; Faur, C. Elaboration of Chitosan/Activated Carbon Composites for the Removal of Organic Micropollutants from Waters. Environ. Technol. 2008, 29, 1285–1296. [Google Scholar] [CrossRef] [PubMed]
- Mondal, N.K.; Roy, A. Potentiality of a Fruit Peel (Banana Peel) toward Abatement of Fluoride from Synthetic and Underground Water Samples Collected from Fluoride Affected Villages of Birbhum District. Appl. Water Sci. 2018, 8, 90. [Google Scholar] [CrossRef]
- Solangi, N.H.; Kumar, J.; Mazari, S.A.; Ahmed, S.; Fatima, N.; Mubarak, N.M. Development of Fruit Waste Derived Bio-Adsorbents for Wastewater Treatment: A Review. J. Hazard. Mater. 2021, 416, 125848. [Google Scholar] [CrossRef]
- Akinhanmi, T.F.; Ofudje, E.A.; Adeogun, A.I.; Aina, P.; Joseph, I.M. Orange Peel as Low-Cost Adsorbent in the Elimination of Cd(II) Ion: Kinetics, Isotherm, Thermodynamic and Optimization Evaluations. Bioresour. Bioprocess. 2020, 7, 34. [Google Scholar] [CrossRef]
- Tolkou, A.K.; Tsoutsa, E.K.; Kyzas, G.Z.; Katsoyiannis, I.A. Sustainable Use of Low—Cost Adsorbents Prepared from Waste Fruit Peels for the Removal of Selected Reactive and Basic Dyes Found in Wastewaters. Environ. Sci. Pollut. Res. 2024, 31, 14662–14689. [Google Scholar] [CrossRef]
- Ayala, J.R.; Montero, G.; Coronado, M.A.; García, C.; Curiel-Alvarez, M.A.; León, J.A.; Sagaste, C.A.; Montes, D.G. Characterization of Orange Peel Waste and Valorization to Obtain Reducing Sugars. Molecules 2021, 26, 1348. [Google Scholar] [CrossRef]
- Li, L.X.; Xu, D.; Li, X.Q.; Liu, W.C.; Jia, Y. Excellent Fluoride Removal Properties of Porous Hollow MgO Microspheres. New J. Chem. 2014, 38, 5445–5452. [Google Scholar] [CrossRef]
- Sairam Sundaram, C.; Viswanathan, N.; Meenakshi, S. Defluoridation of Water Using Magnesia/Chitosan Composite. J. Hazard. Mater. 2009, 163, 618–624. [Google Scholar] [CrossRef]
- Azamzam, A.A.; Rafatullah, M.; Yahya, E.B.; Ahmad, M.I.; Lalung, J.; Alam, M.; Siddiqui, M.R. Enhancing the Efficiency of Banana Peel Bio-Coagulant in Turbid and River Water Treatment Applications. Water 2022, 14, 2473. [Google Scholar] [CrossRef]
- APHA Standard Methods for the Examination of Water and Wastewater; American Public Health Association: Washington, DC, USA, 1981.
- Freundlich, H. Über Die Adsorption in Lösungen. Z. Für Phys. Chem. 1907, 57U, 385–470. [Google Scholar] [CrossRef]
- Langmuir, I. The Evaporation, Condensation and Reflection of Molecules and the Mechanism of Adsorption. Phys. Rev. 1916, 8, 149–176. [Google Scholar] [CrossRef]
- Kostoglou, M.; Karapantsios, T.D. Why Is the Linearized Form of Pseudo-Second Order Adsorption Kinetic Model So Successful in Fitting Batch Adsorption Experimental Data? Colloids Interfaces 2022, 6, 55. [Google Scholar] [CrossRef]
- Kyzas, G.Z.; Kostoglou, M. Green Adsorbents for Wastewaters: A Critical Review. Materials 2014, 7, 333–364. [Google Scholar] [CrossRef]
- Tien, C. (Ed.) 1—INTRODUCTION. In Adsorption Calculations and Modelling; Butterworth-Heinemann: Boston, MA, USA, 1994; pp. 1–7. ISBN 978-0-7506-9121-5. [Google Scholar]
- Kyzas, G.Z.; Christodoulou, E.; Bikiaris, D.N. Basic Dye Removal with Sorption onto Low-Cost Natural Textile Fibers. Processes 2018, 6, 166. [Google Scholar] [CrossRef]
- Takmil, F.; Esmaeili, H.; Mousavi, S.M.; Hashemi, S.A. Nano-Magnetically Modified Activated Carbon Prepared by Oak Shell for Treatment of Wastewater Containing Fluoride Ion. Adv. Powder Technol. 2020, 31, 3236–3245. [Google Scholar] [CrossRef]
- Hashemkhani, M.; Rezvani Ghalhari, M.; Bashardoust, P.; Hosseini, S.S.; Mesdaghinia, A.; Mahvi, A.H. Fluoride Removal from Aqueous Solution via Environmentally Friendly Adsorbent Derived from Seashell. Sci. Rep. 2022, 12, 9655. [Google Scholar] [CrossRef]
- Tai, M.H.; Saha, B.; Streat, M. Determination of Point Zero Charge (PZC) of Homemade Charcoals of Shorea Robusta (Sakhuwa) and Pinus Roxburghii (Salla). Int. J. Eng. Res. Technol. 2020, 9, 153–155. [Google Scholar]
- Bhatt, P.; Joshi, S.; Urper Bayram, G.M.; Khati, P.; Simsek, H. Developments and Application of Chitosan-Based Adsorbents for Wastewater Treatments. Environ. Res. 2023, 226, 115530. [Google Scholar] [CrossRef]
- Dar, F.A.; Kurella, S. Recent Advances in Adsorption Techniques for Fluoride Removal—An Overview. Groundw. Sustain. Dev. 2023, 23, 101017. [Google Scholar] [CrossRef]
- da Silva Alves, D.C.; Healy, B.; Pinto, L.A.d.A.; Cadaval, T.R.S.; Breslin, C.B. Recent Developments in Chitosan-Based Adsorbents for the Removal of Pollutants from Aqueous Environments. Molecules 2021, 26, 594. [Google Scholar] [CrossRef] [PubMed]
- de Carvalho Costa, L.R.; Jurado-Davila, I.V.; De Oliveira, J.T.; Nunes, K.G.P.; Estumano, D.C.; de Oliveira, R.A.; Carissimi, E.; Féris, L.A. Exploring Key Parameters in Adsorption for Effective Fluoride Removal: A Comprehensive Review and Engineering Implications. Appl. Sci. 2024, 14, 2161. [Google Scholar] [CrossRef]
- Tan, T.L.; Krusnamurthy, P.A.; Nakajima, H.; Rashid, S.A. Adsorptive, Kinetics and Regeneration Studies of Fluoride Removal from Water Using Zirconium-Based Metal Organic Frameworks. RSC Adv. 2020, 10, 18740–18752. [Google Scholar] [CrossRef]
- Simonin, J.P. On the Comparison of Pseudo-First Order and Pseudo-Second Order Rate Laws in the Modeling of Adsorption Kinetics. Chem. Eng. J. 2016, 300, 254–263. [Google Scholar] [CrossRef]
- Wang, L.; Xie, Y.; Yang, J.; Zhu, X.; Hu, Q.; Li, X.; Liu, Z. Insight into Mechanisms of Fluoride Removal from Contaminated Groundwater Using Lanthanum-Modified Bone Waste. RSC Adv. 2017, 7, 54291–54305. [Google Scholar] [CrossRef]
- Salonikidou, E.D.; Giannakoudakis, D.A.; Kostoglou, M.; Triantafyllidis, K.S. Modeling the Liquid Fuel Desulfurization Efficiency of Activated Carbons before and after Chemical Treatment: The Competitive Role of Mono- and Diaromatics. Ind. Eng. Chem. Res. 2022, 61, 15933–15947. [Google Scholar] [CrossRef]
- Jeyaseelan, A.; Viswanathan, N.; Naushad, M. Fabrication of Covalent Organic Frameworks Incorporated Hydroxyapatite Based Chitosan–Gelatin Hybrid Magnetic Beads for Fluoride Removal. J. Mol. Liq. 2024, 399, 124327. [Google Scholar] [CrossRef]
- Swenson, H.; Stadie, N.P. Langmuir’s Theory of Adsorption: A Centennial Review. Langmuir 2019, 35, 5409–5426. [Google Scholar] [CrossRef]
- Budnyak, T.M.; Błachnio, M.; Slabon, A.; Jaworski, A.; Tertykh, V.A.; Deryło-Marczewska, A.; Marczewski, A.W. Chitosan Deposited onto Fumed Silica Surface as Sustainable Hybrid Biosorbent for Acid Orange 8 Dye Capture: Effect of Temperature in Adsorption Equilibrium and Kinetics. J. Phys. Chem. C 2020, 124, 15312–15323. [Google Scholar] [CrossRef]
- Gkika, D.A.; Mitropoulos, A.C.; Kyzas, G.Z. Why Reuse Spent Adsorbents? The Latest Challenges and Limitations. Sci. Total Environ. 2022, 822, 153612. [Google Scholar] [CrossRef] [PubMed]
- Zhou, K.; Li, L.; Ma, X.; Mo, Y.; Chen, R.; Li, H.; Li, H. Activated Carbons Modified by Magnesium Oxide as Highly Efficient Sorbents for Acetone. RSC Adv. 2018, 8, 2922–2932. [Google Scholar] [CrossRef] [PubMed]
- Kim, S.; Kim, S.; Lee, S. Activated Carbon Modified with Polyethyleneimine and MgO: Better Adsorption of Aldehyde and Production of Regenerative VOC Adsorbent Using a Photocatalyst. Appl. Surf. Sci. 2023, 631, 157565. [Google Scholar] [CrossRef]
- He, M.; Kwok, R.T.K.; Wang, Z.; Duan, B.; Tang, B.Z.; Zhang, L. Hair-Inspired Crystal Growth of HOA in Cavities of Cellulose Matrix via Hydrophobic–Hydrophilic Interface Interaction. ACS Appl. Mater. Interfaces 2014, 6, 9508–9516. [Google Scholar] [CrossRef] [PubMed]
- Michael-Igolima, U.; Abbey, S.J.; Ifelebuegu, A.O.; Eyo, E.U. Modified Orange Peel Waste as a Sustainable Material for Adsorption of Contaminants. Materials 2023, 16, 1092. [Google Scholar] [CrossRef]
- Wu, X.; Yang, S.; Xu, S.; Zhang, X.; Ren, Y. Measurement and Correlation of the Solubility of Sodium Acetate in Eight Pure and Binary Solvents. Chin. J. Chem. Eng. 2022, 44, 474–484. [Google Scholar] [CrossRef]
- Borgohain, X.; Boruah, A.; Sarma, G.K.; Rashid, M.H. Rapid and Extremely High Adsorption Performance of Porous MgO Nanostructures for Fluoride Removal from Water. J. Mol. Liq. 2020, 305, 112799. [Google Scholar] [CrossRef]
- Aguilar-Pozo, V.B.; Chimenos, J.M.; Soto, R.; Da Silva, C.; Botines, P.; Izquierdo, J.F.; Astals, S. Kinetic Study of Magnesium Dissolution Using a Magnesium Oxide Industrial By-Product. Sep. Purif. Technol. 2025, 353, 128406. [Google Scholar] [CrossRef]
- Nga, N.K.; Thuy Chau, N.; Viet, P. Preparation and Characterization of a Chitosan/MgO Composite for the Effective Removal of Reactive Blue 19 Dye from Aqueous Solution. J. Sci. Adv. Mater. Devices 2020, 5, 65–72. [Google Scholar] [CrossRef]
- Puccini, M.; Licursi, D.; Stefanelli, E.; Vitolo, S.; Galletti, A.; Heeres, H.J. Levulinic Acid from Orange Peel Waste by Hydrothermal Carbonization (HTC). Chem. Eng. Trans. 2016, 50, 223. [Google Scholar] [CrossRef]
- de Freitas, F.P.; Carvalho, A.M.M.L.; Carneiro, A.d.C.O.; de Magalhães, M.A.; Xisto, M.F.; Canal, W.D. Adsorption of Neutral Red Dye by Chitosan and Activated Carbon Composite Films. Heliyon 2021, 7, e07629. [Google Scholar] [CrossRef] [PubMed]
- Rahmadani, D.; Rahmada, A.; Marendra, F.; Rimbawan, H.; Cahyono, R.; Suherman; Ariyanto, T. Biogas Purification Using Chitosan-Impregnated Porous Carbon. In Proceedings of the International Conference on Sustainable Biomass (ICSB 2019), Lampung, Malaysia, 15–17 October 2019; Atlantis Press: Amsterdam, The Netherlands, 2021. [Google Scholar]
- Hong, T.; Yin, J.-Y.; Nie, S.-P.; Xie, M.-Y. Applications of Infrared Spectroscopy in Polysaccharide Structural Analysis: Progress, Challenge and Perspective. Food Chem. X 2021, 12, 100168. [Google Scholar] [CrossRef] [PubMed]
- Pavithra, S.; Thandapani, G.; Sugashini, S.; Sudha, P.N.; Alkhamis, H.H.; Alrefaei, A.F.; Almutairi, M.H. Batch Adsorption Studies on Surface Tailored Chitosan/Orange Peel Hydrogel Composite for the Removal of Cr(VI) and Cu(II) Ions from Synthetic Wastewater. Chemosphere 2021, 271, 129415. [Google Scholar] [CrossRef] [PubMed]
- Bakhta, S.; Sadaoui, Z.; Bouazizi, N.; Samir, B.; Cosme, J.; Allalou, O.; Le Derf, F.; Vieillard, J. Successful Removal of Fluoride from Aqueous Environment Using Al(OH)3 @AC: Column Studies and Breakthrough Curve Modeling. RSC Adv. 2024, 14, 1–14. [Google Scholar] [CrossRef]
- Davoodi, S.M.; Brar, S.K.; Galvez-Cloutier, R.; Martel, R. Performance of Packed and Fluidized Bed Columns for the Removal of Unconventional Oil Using Modified Dolomite. Fuel 2021, 285, 119191. [Google Scholar] [CrossRef]
- Chang, C.; Zheng, Q.; Xu, D.; Wang, Y.; Su, H.; Kuang, S. A Scalable Extraction Column Utilizing Discrete Liquid Films for Lithium Recovery from Salt Lake Brines. J. Environ. Chem. Eng. 2024, 12, 113706. [Google Scholar] [CrossRef]
- Kulkarni, R.M.; Dhanyashree, J.K.; Varma, E.; Sirivibha, S.P. Batch and Continuous Packed Bed Column Studies on Biosorption of Nickel (II) by Sugarcane Bagasse. Results Chem. 2022, 4, 100328. [Google Scholar] [CrossRef]


| A/A | Adsorbent | Constituents |
|---|---|---|
| 1 | CS/OP | Chitosan and orange peels (ratio of 1:2) |
| 2 | CS/AC | Chitosan and activated carbon |
| 3 | CS/MgO | Chitosan and magnesium oxide |
| 4 | AC/MgO | Activated carbon and magnesium oxide |
| 5 | CS/OP/AC | Chitosan, orange peels, and activated carbon |
| 6 | CS/OP@MgO | Chitosan, orange peels, and magnesium oxide |
| 7 | CS/AC@MgO | Chitosan, activated carbon, and magnesium oxide |
| 8 | CS/OP/AC@MgO | Chitosan, orange peels, activated carbon, and magnesium oxide |
| Adsorbent | Qe.exp (mg/g) | PFO Model | PSO Model | ||||
|---|---|---|---|---|---|---|---|
| K1 (L/mg∙min) | Qe.cal (mg/g) | R2 | K2 (L/mg∙min) | Qe.cal (mg/g) | R2 | ||
| CS/OP | 5.73 | 0.02342 | 5.69 | 0.9763 | 0.00354 | 7.03 | 0.9777 |
| CS/AC | 6.49 | 0.02215 | 6.10 | 0.9697 | 0.00308 | 7.57 | 0.9744 |
| CS/AC@MgO | 6.96 | 0.00208 | 8.89 | 0.9605 | 0.01901 | 6.95 | 0.9613 |
| CS/OP/AC@MgO | 7.57 | 0.0355 | 6.89 | 0.9561 | 0.00604 | 7.93 | 0.9789 |
| Langmuir Isotherm Model | |||
|---|---|---|---|
| Adsorbent | Qm (mg/g) | KL (L/mg) | R2 |
| CS/OP | 25.3 | 0.1121 | 0.9952 |
| CS/AC | 25.4 | 0.1359 | 0.9969 |
| CS/AC@MgO | 26.92 | 0.1752 | 0.9969 |
| CS/OP/AC@MgO | 61.3 | 0.0663 | 0.9986 |
| Freundlich Isotherm Model | |||
| Adsorbent | 1/n | KF (mg/g)(L/mg)1/n | R2 |
| CS/OP | 0.4694 | 3.862 | 0.9567 |
| CS/AC | 0.4409 | 4.470 | 0.9591 |
| CS/AC@MgO | 0.4018 | 5.716 | 0.9513 |
| CS/OP/AC@MgO | 0.5931 | 5.623 | 0.9937 |
| Adsorbent | T (K) | ∆G0 (kJ/mol) | ∆H0 (kJ/mol) | ∆S0 (kJ/mol∙K) | R2 |
|---|---|---|---|---|---|
| CS/OP | 303 | −0.521 | 15.933 | 0.0543 | 0.9811 |
| 313 | −1.064 | ||||
| 323 | −1.607 | ||||
| CS/AC | 303 | −0.731 | 17.512 | 0.0602 | 0.9541 |
| 313 | −1.333 | ||||
| 323 | −1.935 | ||||
| CS/AC@MgO | 303 | −1.374 | 23.593 | 0.0824 | 0.9834 |
| 313 | −2.198 | ||||
| 323 | −3.022 | ||||
| CS/OP/AC@MgO | 303 | −2.854 | 19.481 | 0.0737 | 0.9998 |
| 313 | −3.591 | ||||
| 303 | −4.328 |
| Physical Properties | CS/OP | CS/AC | CS/AC@MgO | CS/OP/AC@MgO |
|---|---|---|---|---|
| BET surface area, SBET (m2/g) | 10.45 | 167 | 193 | 79.45 |
| BJH pore size (Å) | 12.8 | 8.1 | 6.8 | 6.4 |
| Micropore volume, Vmicro (cm3/g) | 0.00023 | 0.050 | 0.072 | 0.022 |
| Total pore volume, VT (cm3/g) | 0.013 | 0.107 | 0.127 | 0.057 |
| % (w/w) | CS/AC@MgO | CS/OP/AC@MgO |
|---|---|---|
| Au 1 | 65.89 | 47.61 |
| C | 4.98 | 13.13 |
| Mg | 5.00 | 6.65 |
| N | 2.64 | 4.86 |
| Na | 1.65 | 2.32 |
| Cu | 2.98 | 2.17 |
| Re | 4.56 | 2.57 |
| Zn | 1.04 | 1.31 |
| Ca | 2.86 | 0.98 |
| Al | 0.74 | 0.95 |
| Tc | 0.85 | 0.66 |
| O | 6.81 | 16.79 |
Disclaimer/Publisher’s Note: The statements, opinions and data contained in all publications are solely those of the individual author(s) and contributor(s) and not of MDPI and/or the editor(s). MDPI and/or the editor(s) disclaim responsibility for any injury to people or property resulting from any ideas, methods, instructions or products referred to in the content. |
© 2024 by the authors. Licensee MDPI, Basel, Switzerland. This article is an open access article distributed under the terms and conditions of the Creative Commons Attribution (CC BY) license (https://creativecommons.org/licenses/by/4.0/).
Share and Cite
Tolkou, A.K.; Posantzis, A.; Maroulas, K.N.; Kosheleva, R.I.; Koumentakou, I.; Kostoglou, M.; Kyzas, G.Z. Fluoride Removal from Aqueous Solutions by Using Super-Adsorbents of Chitosan/Orange Peels/Activated Carbon@MgO: Synthesis, Characterization, and Adsorption Evaluation. Processes 2024, 12, 2043. https://doi.org/10.3390/pr12092043
Tolkou AK, Posantzis A, Maroulas KN, Kosheleva RI, Koumentakou I, Kostoglou M, Kyzas GZ. Fluoride Removal from Aqueous Solutions by Using Super-Adsorbents of Chitosan/Orange Peels/Activated Carbon@MgO: Synthesis, Characterization, and Adsorption Evaluation. Processes. 2024; 12(9):2043. https://doi.org/10.3390/pr12092043
Chicago/Turabian StyleTolkou, Athanasia K., Apostolos Posantzis, Konstantinos N. Maroulas, Ramonna I. Kosheleva, Ioanna Koumentakou, Margaritis Kostoglou, and George Z. Kyzas. 2024. "Fluoride Removal from Aqueous Solutions by Using Super-Adsorbents of Chitosan/Orange Peels/Activated Carbon@MgO: Synthesis, Characterization, and Adsorption Evaluation" Processes 12, no. 9: 2043. https://doi.org/10.3390/pr12092043
APA StyleTolkou, A. K., Posantzis, A., Maroulas, K. N., Kosheleva, R. I., Koumentakou, I., Kostoglou, M., & Kyzas, G. Z. (2024). Fluoride Removal from Aqueous Solutions by Using Super-Adsorbents of Chitosan/Orange Peels/Activated Carbon@MgO: Synthesis, Characterization, and Adsorption Evaluation. Processes, 12(9), 2043. https://doi.org/10.3390/pr12092043