Article

Simulation and Local Parametric Sensitivity Analysis of a Computational Model of Fructose Metabolism

1
Faculty of Food Technology and Biotechnology, University of Zagreb, Pierottijeva 6, 10000 Zagreb, Croatia
2
Institute of Public Health of Zagreb County, Mokrička 54, 10290 Zaprešić, Croatia
*
Author to whom correspondence should be addressed.
Processes 2025, 13(1), 125; https://doi.org/10.3390/pr13010125
Submission received: 19 November 2024 / Revised: 20 December 2024 / Accepted: 25 December 2024 / Published: 6 January 2025
(This article belongs to the Special Issue Feature Papers in the "Food Process Engineering" Section)

Abstract

:
This research utilized a mathematical model of fructose metabolism within the CellDesigner software package to investigate the effects of varying dietary fructose intake on fat metabolism. By simulating different meal patterns with varying levels of fructose, the model provided valuable insights into the relationship between fructose consumption and hepatic triglyceride accumulation. The results demonstrated a clear correlation between increased fructose intake and elevated hepatic triglycerides. Additionally, a local parametric sensitivity analysis identified glyceraldehyde-3-phosphate and pyruvate as key regulatory factors in this process. Importantly, the model accurately simulated changes in fructose concentration and its metabolites, validating its predictive capabilities. These findings underscore the importance of systems biology in elucidating the complex mechanisms underlying nutrition-related diseases. By integrating computational modeling with experimental data, researchers can gain a deeper understanding of how dietary factors influence metabolic pathways and contribute to health outcomes. Ultimately, systems biology holds the promise of enabling personalized nutrition recommendations tailored to individual needs and genetic predispositions.

1. Introduction

Systems biology, an interdisciplinary field integrating biology, chemistry, physics, and mathematics, provides a holistic framework for understanding complex biological systems [1,2,3]. Integrating multi-omics data with sophisticated computational models allows for the investigation of dynamic interactions within and between biological components. This approach is particularly valuable in nutrition research, enabling a deeper understanding of how dietary components interact with and influence human physiology [4]. Researchers in this field utilize data generated from various omics technologies—such as genomics, transcriptomics, proteomics, and metabolomics—to create a holistic view of systems ranging from individual cells to entire organisms and communities. This approach allows for a deeper insight into how these systems adapt, develop, grow, and progress towards disease [5,6,7,8].
One of the key advantages of systems biology lies in its ability to go beyond traditional reductionist approaches, which often focus on individual proteins and genes. Instead, systems biology emphasizes the importance of understanding the dynamics and structure of biological systems as integrated wholes. While mapping the interconnections within a system is an essential first step, systems biology recognizes that this alone is insufficient to fully grasp the complexity of life [9,10]. This mechanistic exploration provides critical insights into how known components interact to produce the functional properties that characterize living organisms [11,12,13,14]. Nutrition is a critical environmental factor that plays a fundamental role in health preservation and disease prevention. Recent advancements in science and technology have paved the way for the integration of systems biology into the field of nutrition [15,16,17]. This interdisciplinary approach allows for a more comprehensive understanding of the complex interactions between dietary components and biological systems, facilitating the development of personalized nutrition strategies and more effective interventions for promoting health and preventing disease [18,19].
Computational modeling has emerged as a cornerstone of systems biology, providing invaluable insights into the intricate dynamics of nutrient pathways [8,20]. By integrating computational tools, theoretical frameworks, and experimental data, researchers can unravel complex interactions and gain a deeper understanding of metabolic processes. The increasing accessibility of free modeling software has significantly facilitated the application of computational approaches in nutrition research [21,22,23,24,25]. These tools enable the construction of dynamic simulations, providing a quantitative platform for analyzing nutrient interactions and uncovering non-linear relationships. Beyond their scientific utility, computational models offer several advantages, including the following: (i) Ethical considerations—Reducing the need for animal experimentation; (ii) Efficiency—Accelerating the study of long-term effects; and (iii) Disease modeling—Representing pathologies associated with aging [26,27,28,29,30]. While the limitations of existing simulation algorithms pose challenges, ongoing advancements are continuously addressing these issues. Furthermore, the integration of systems biology and computational modeling is revolutionizing the analysis of high-dimensional omic data. By establishing mechanistic, quantitative relationships between traditional nutritional measurements, researchers can gain a more comprehensive understanding of nutrient metabolism.
Humans have an innate preference for sweet tastes, a factor that has contributed significantly to the overconsumption of sugary foods throughout history. The widespread availability of highly palatable, sweetened products, particularly those containing high-fructose corn syrup (HFCS), has dramatically increased sugar intake in recent decades [31,32,33]. Sweetened beverages, in particular, represent a major source of dietary fructose [32].
Humans have a long history of seeking and consuming sweet foods. This innate preference for sweetness has driven the evolution of our diets and significantly influenced food production and consumption patterns throughout history [34]. However, the modern food environment is characterized by an unprecedented abundance of highly palatable, processed foods and beverages laden with added sugars, particularly high-fructose corn syrup (HFCS). This overconsumption of added sugars has emerged as a major public health concern, contributing significantly to the global rise of obesity, type 2 diabetes, cardiovascular disease, and other chronic illnesses [34,35]. Excessive consumption of added sugars, particularly through sweetened beverages and processed foods, is a well-established risk factor for obesity and its complications [35]. While the recommended daily intake of added sugars is 10% of total energy, many individuals in developed countries exceed this limit, consuming between 40 and 100 g daily [36]. It is crucial to differentiate between naturally occurring and added sugars. Fructose in fruits is accompanied by fiber, vitamins, and antioxidants, which mitigate its potential negative impacts [34,37,38,39]. In contrast, excessive consumption of added sugars, devoid of these beneficial components, can disrupt metabolic homeostasis and contribute to the development of chronic diseases [40,41].
This study aims to investigate the impact of fructose intake on fat metabolism and the development of nonalcoholic fatty liver disease (NAFLD) by employing a systems biology approach. To achieve this, a mathematical model of fructose metabolism was constructed using CellDesigner software. This model will be used to simulate various dietary scenarios and explore the dynamic interactions within key metabolic pathways involved in fructose metabolism. By analyzing the model’s output, we aim to elucidate the underlying mechanisms linking fructose consumption to NAFLD development. Furthermore, this research demonstrates the versatility of systems biology approaches, particularly computational modeling, in investigating the impact of various dietary components on human health. The modeling framework developed in this study can be readily adapted to analyze the effects of other carbohydrates, including oligosaccharides and polysaccharides, on metabolic pathways and disease development.

2. Materials and Methods

2.1. Materials

2.1.1. Recommendations for Menu Planning

For the purposes of this study, three distinct dietary menus were designed, each characterized by varying levels of fructose intake: a low-fructose menu (<25 g/day), a moderate-fructose menu (25–40 g/day), and a very high-fructose menu (<100 g/day). The daily caloric intake for each menu was standardized at 2200 kcal (±100 kcal). The specific macronutrient composition and fructose content of each meal were documented. The USDA Food Database and USDA Nutrient Database were utilized for meal planning and fructose quantification.

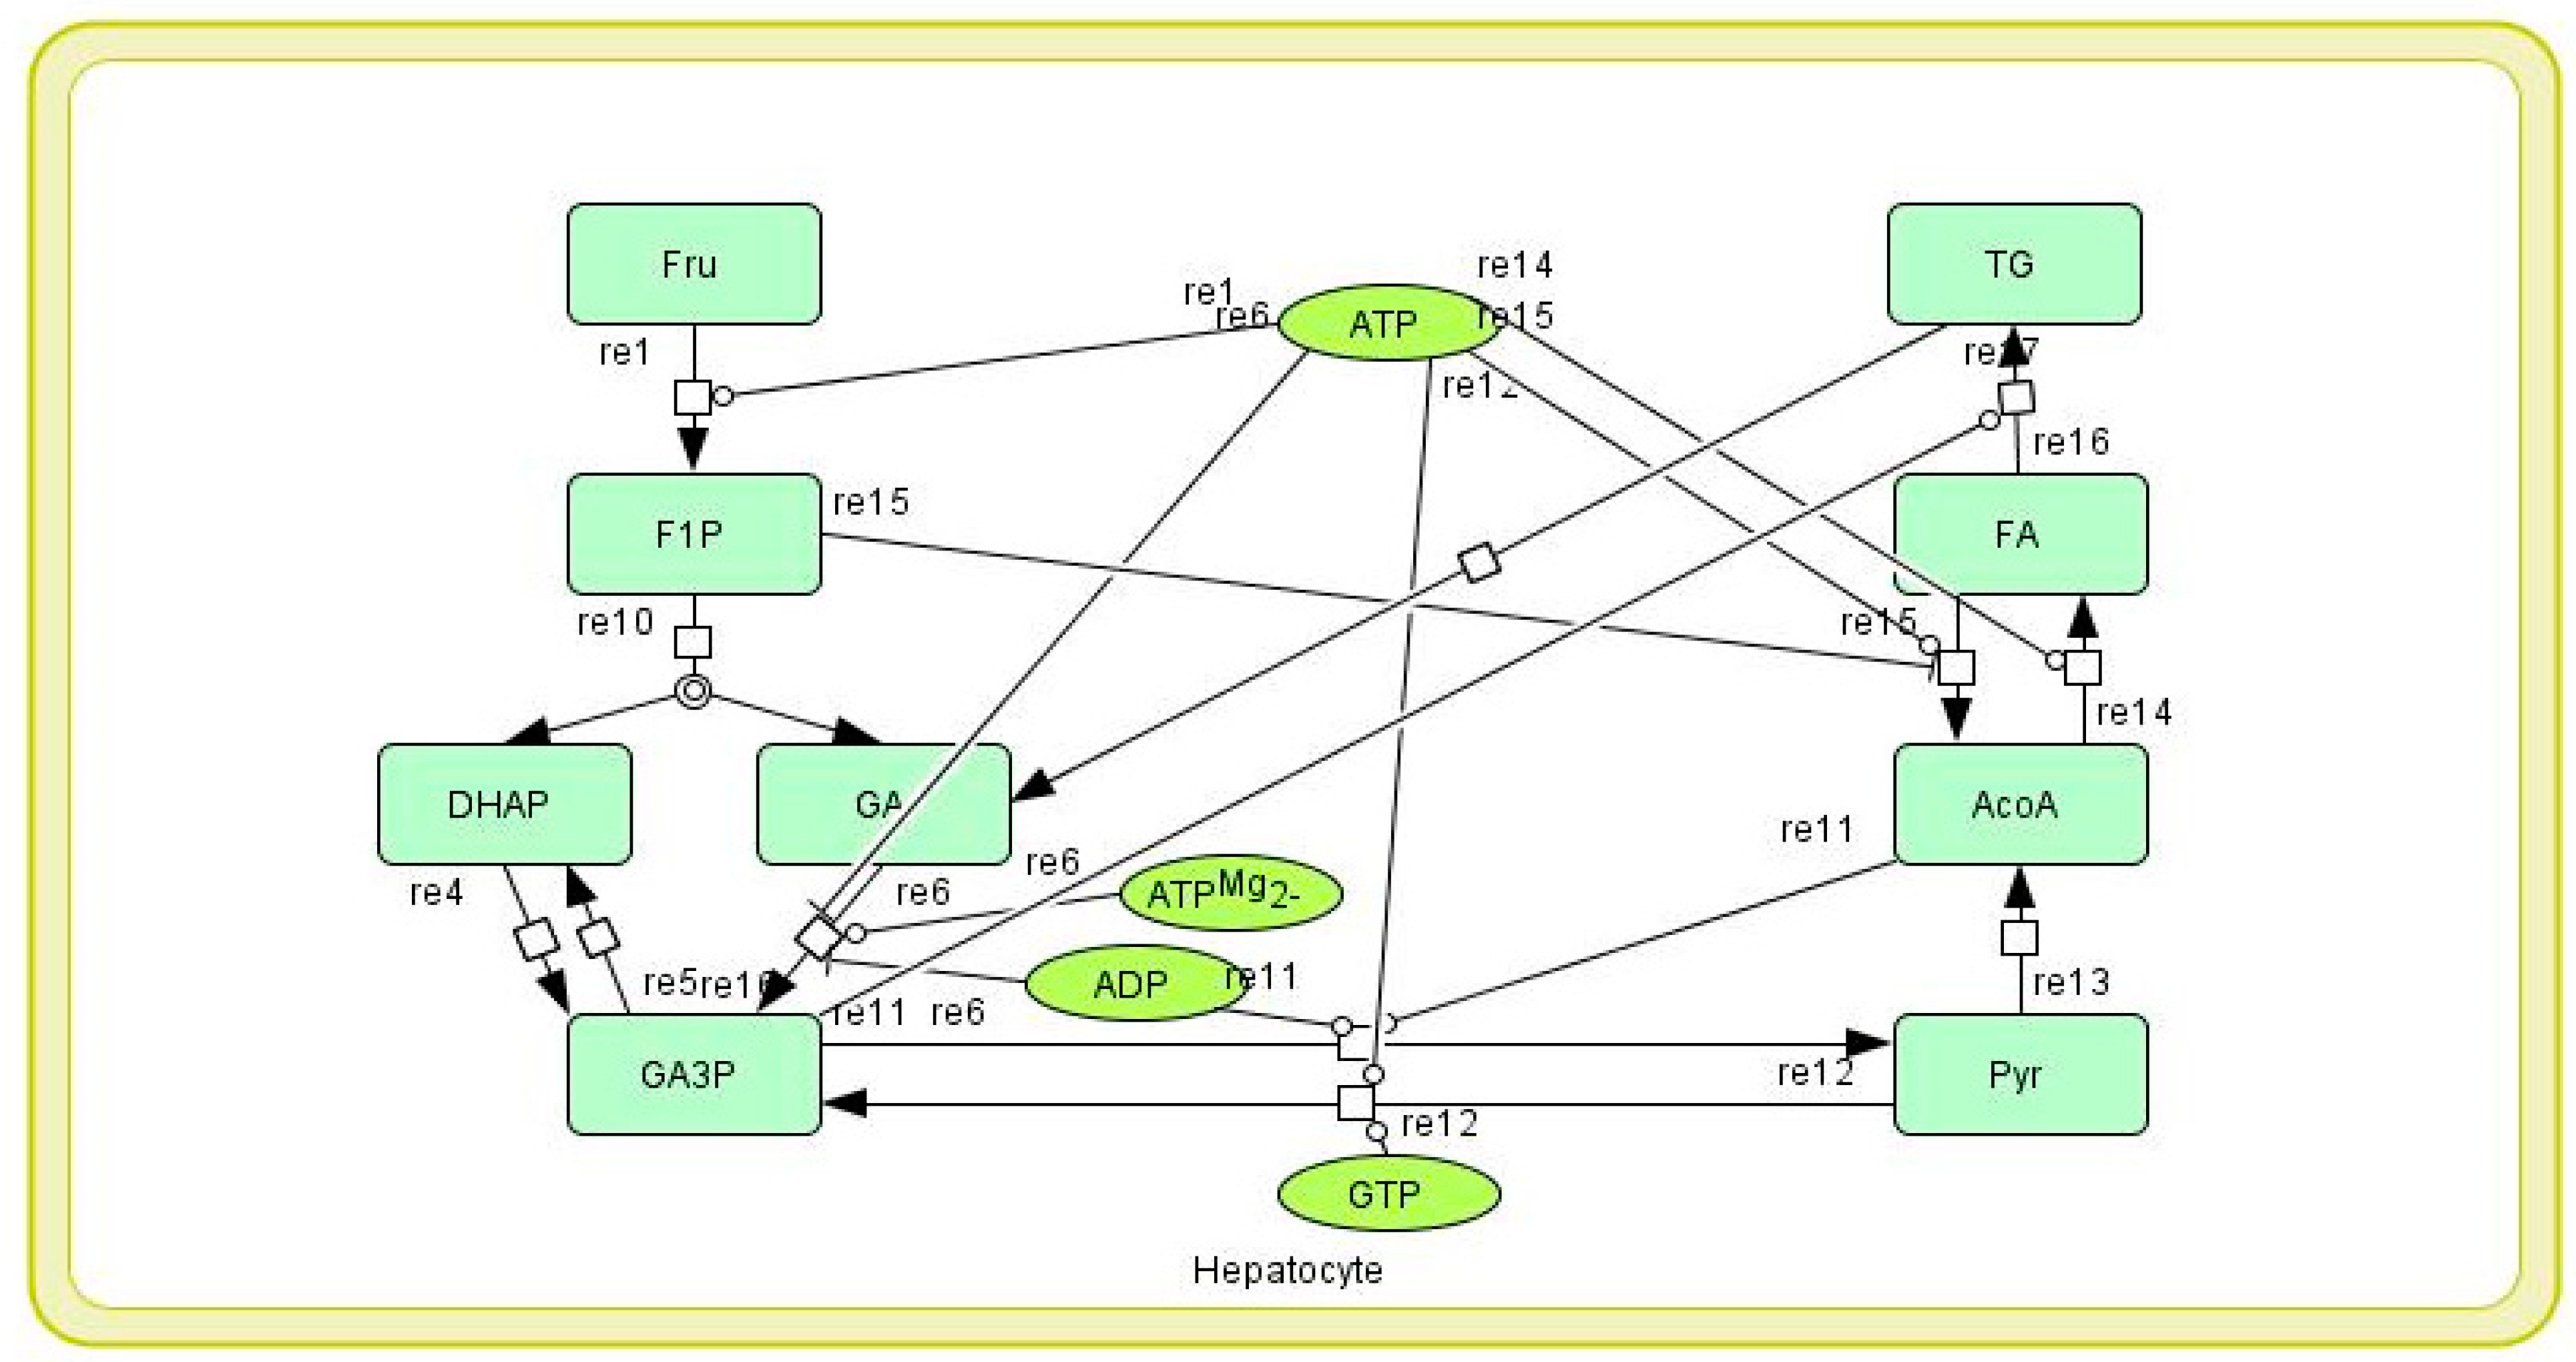
2.1.2. Mathematical Model of Hepatic Fructose Metabolism

In this study, we conducted an analysis of a mathematical model of hepatic fructose metabolism. This model characterizes the organism’s metabolic response to meals with varying fructose concentrations and is based on the metabolic pathway proposed by Liao et al. [42].
The model comprises 11 biochemical reactions, accompanied by their respective kinetic expressions. Mass balances of the nine model variables and corresponding initial values are given in Table 1. The values of 56 kinetic parameters from the literature used for model simulations are given in Table 2.

2.2. Methods

2.2.1. Simulation of Mathematical Model of Hepatic Fructose Metabolism

A model of fructose metabolism was developed using the CellDesigner 4.4.2 (System Biology Institute, Tokyo, Japan), based on the framework established by Liao et al. [42]. The simulation was conducted to assess the dynamic changes in the concentrations of fructose, fructose-1-phosphate, fatty acids, and triglycerides following meals with varying initial fructose concentrations.

2.2.2. Local Sensitivity Analysis of the Kinetic Parameters of the Mathematical Model of Hepatic Fructose Metabolism

Sensitivity analysis is a method used to assess how variations in the outputs of a mathematical model can be attributed to changes in its inputs [43]. In biological systems, data uncertainty arises from their stochastic nature and the presence of numerous free parameters, which can significantly influence model behavior and the interpretation of results [44]. To address this, local parametric sensitivity analysis is often employed to evaluate the precision of computational and mathematical models of biological systems. This analysis involves examining all model parameters to identify those with the greatest impact on the outcomes, thereby providing insights into the behavior of the actual system [45]. Mathematically, local parametric sensitivity analysis is expressed through the first-order derivatives of model outputs with respect to model parameters [43]. The relative sensitivity of the output variables is calculated using Equations (1) and (2), where SX/i denotes the sensitivity coefficient, cx represents the concentration vector, ki is the system parameter vector, and a parameter value variation.
S x / i = k i c x   ·   c x k i   · 100   %     k i · c x c x · k i   · 100   %
S x / i = k i c x   ·   c x · 1.01 · 1 + a c x · k i a · k i   · 100   %
In this study, a local parametric sensitivity analysis was conducted by systematically varying the value of each individual input parameter while keeping the other parameters constant. The impact of these changes on the output results of the mathematical model simulation was then assessed. Specifically, each of the 56 kinetic parameters was individually increased and decreased by 3% and 5%, and the resulting values of the model variables and reaction rates were measured following a 2-h simulation.

3. Results and Discussion

3.1. Analysis of the Meal Plans

This study utilized three distinct dietary menus, each providing approximately 2200 kcal per day, to investigate the effects of varying fructose intake. Each menu includes five meals: breakfast, brunch, lunch, snack, and dinner.
Menus 1 and 2 were created to align with the dietary guidelines for the adult population as recommended by the World Health Organization (WHO). The WHO guidelines emphasize: (i) Regular consumption of fruits, vegetables, legumes, nuts, and whole grains; (ii) A daily intake of five servings of fruits and vegetables; (iii) Free sugar intake constituting less than 10% of total energy intake, equivalent to 50 g for an individual of healthy body weight consuming about 2000 kcal per day, with an ideal intake of less than 5% for additional health benefits; (iv) Less than 30% of total energy intake from fat, with a preference for unsaturated fats over saturated and trans fats. Saturated fat intake should be reduced to less than 10%, and trans-fat intake to less than 1% of total energy intake; (v) a daily salt intake of less than 5 g [46]. Menu 1, detailed in Table 3 and Figure 1, provides an energy intake of 2133.6 kcal, composed of 212.4 g of carbohydrates (39.2%), 134 g of fat (24.7%), and 86.9 g of protein (36.1%). This menu represents a low-fructose intake, with a daily fructose content of 12.8 g. Menu 1 closely adheres to WHO recommendations, promoting a balanced intake of macronutrients with minimal fructose consumption, which is likely beneficial in preventing metabolic disorders. Menu 2 offers 2237.6 kcal, consisting of 255.5 g of carbohydrates (44.8%), 120 g of fat (21%), and 86.8 g of protein (34.2%). This menu corresponds to an average fructose intake, with a daily fructose content of 34.2 g. Menu 2, while still in line with WHO guidelines, represents a moderate increase in fructose intake that remains within recommended limits.
Menu 3, in contrast, deviates from these WHO dietary guidelines, focusing solely on foods high in fructose. It is representative of a Western diet, characterized by low consumption of fruits and vegetables and high intake of fats and sodium [19,47,48,49]. This diet typically includes large portions of calorie-dense foods with high sugar content, with more than 13% of daily calories derived from sugars in beverages, which constitute 47% of total added sugars. Additional sources of added sugars include cakes, biscuits, and sweets. The prevalence of obesity is strongly linked to the adoption of the Western diet in recent decades, increasing the risk of comorbidities such as diabetes, cardiovascular diseases, and cancer [47,50,51]. Menu 3 provides 2245.5 kcal, with 325.5 g of carbohydrates (56.4%), 89.4 g of fat (15.5%), and 72.1 g of protein (28.1%). This menu is high in fructose, containing 100.3 g of fructose per day. Menu 3, with a high fructose content, served as a model for a high-fructose diet, allowing for the investigation of its potential metabolic effects. Excessive fructose consumption can contribute to several adverse health outcomes: (i) hepatic lipogenesis—fructose, unlike glucose, is primarily metabolized in the liver. This leads to increased de novo lipogenesis, where excess fructose is converted into fat, contributing to hepatic fat accumulation (fatty liver) and potentially progressing to non-alcoholic fatty liver disease (NAFLD); (ii) insulin resistance—fructose metabolism can impair insulin signaling in the liver and other tissues. This insulin resistance disrupts glucose uptake and utilization, leading to elevated blood sugar levels and increasing the risk of type 2 diabetes; (iii) dyslipidemia- fructose metabolism can promote the production of uric acid, a potent inflammatory molecule. Elevated uric acid levels can contribute to insulin resistance and dyslipidemia, characterized by elevated triglycerides and reduced levels of “good” cholesterol (HDL); and (iv) oxidative stress- fructose metabolism can generate reactive oxygen species, leading to oxidative stress and inflammation, which contribute to the development of chronic diseases, including cardiovascular disease. By modeling these diets, this study provides valuable insights into the metabolic consequences of varying fructose levels and the potential health impacts, underscoring the critical role of diet in the prevention and management of metabolic disorders.

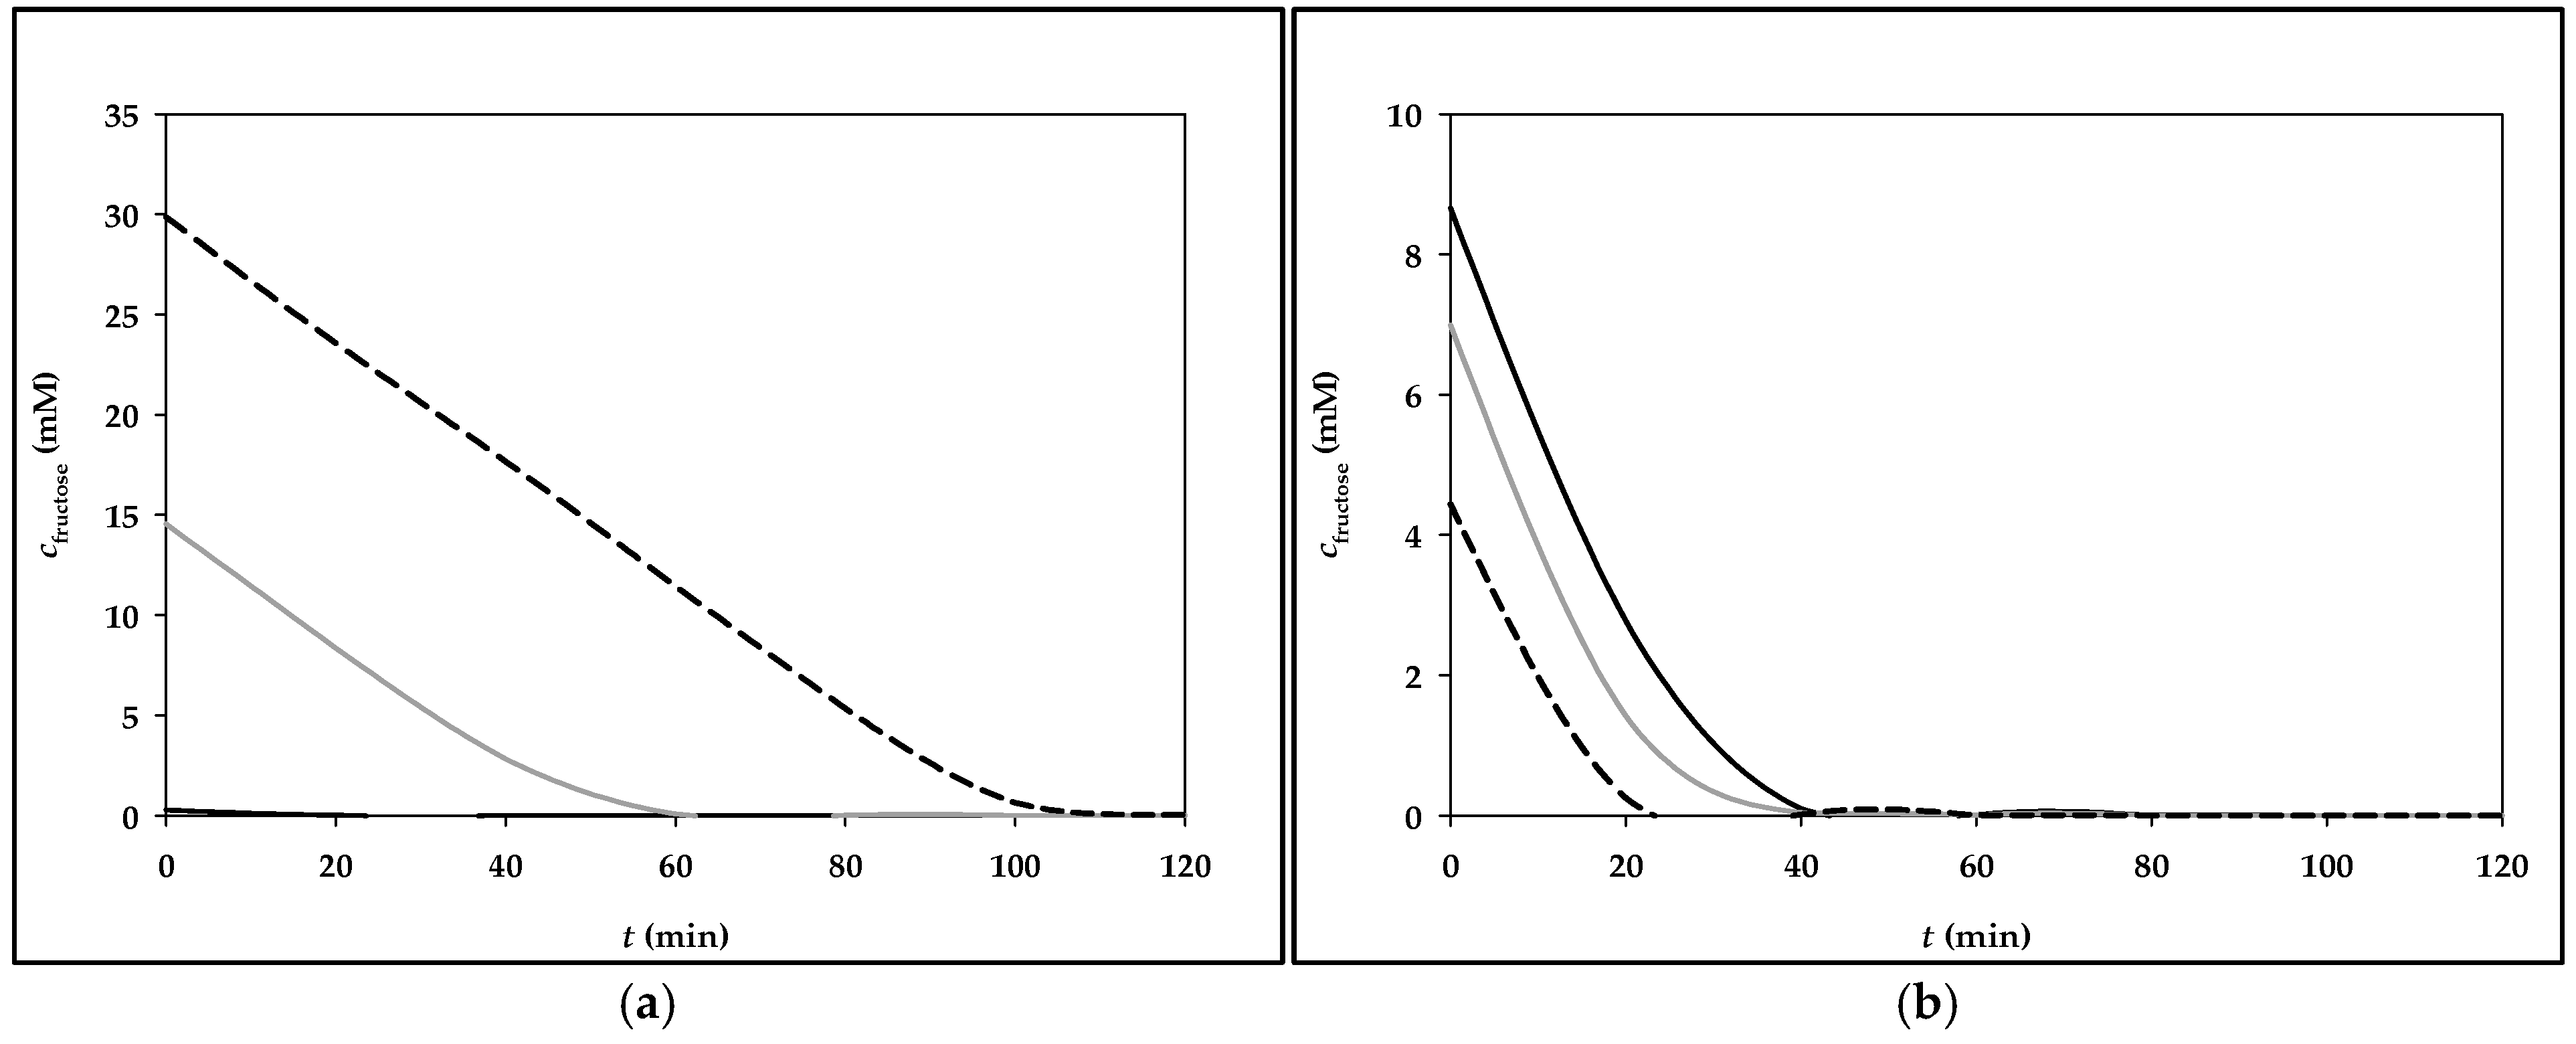
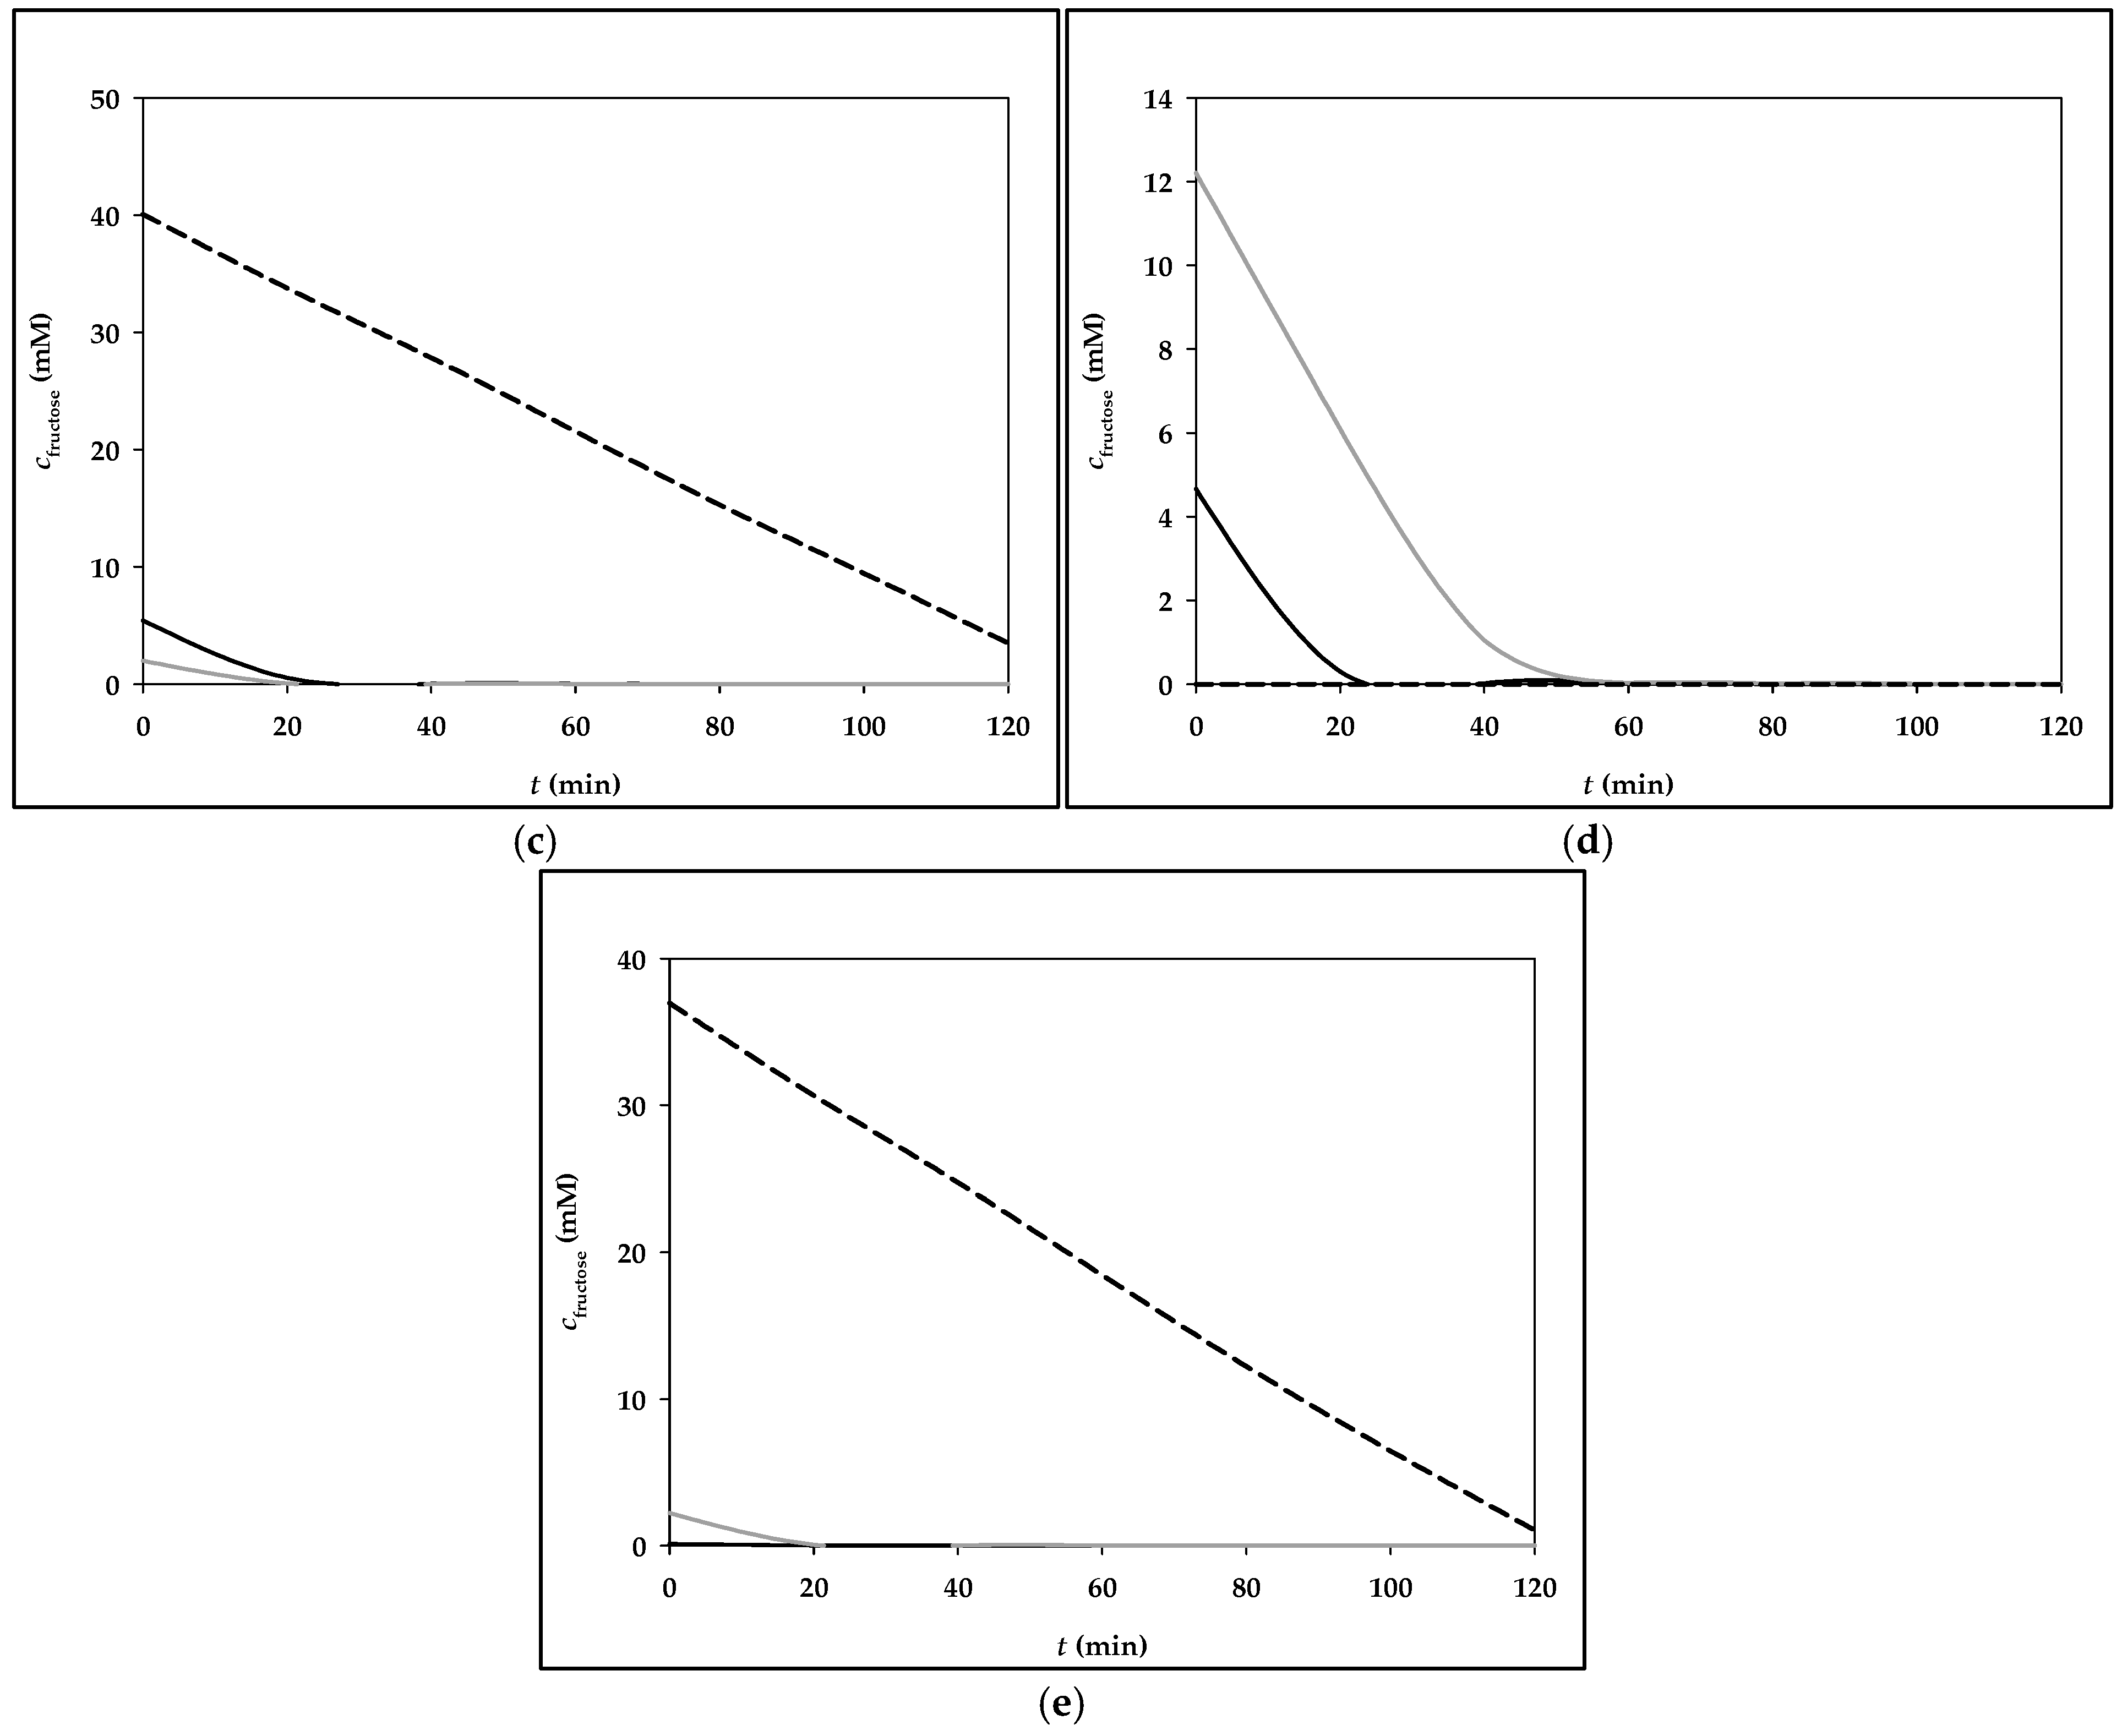
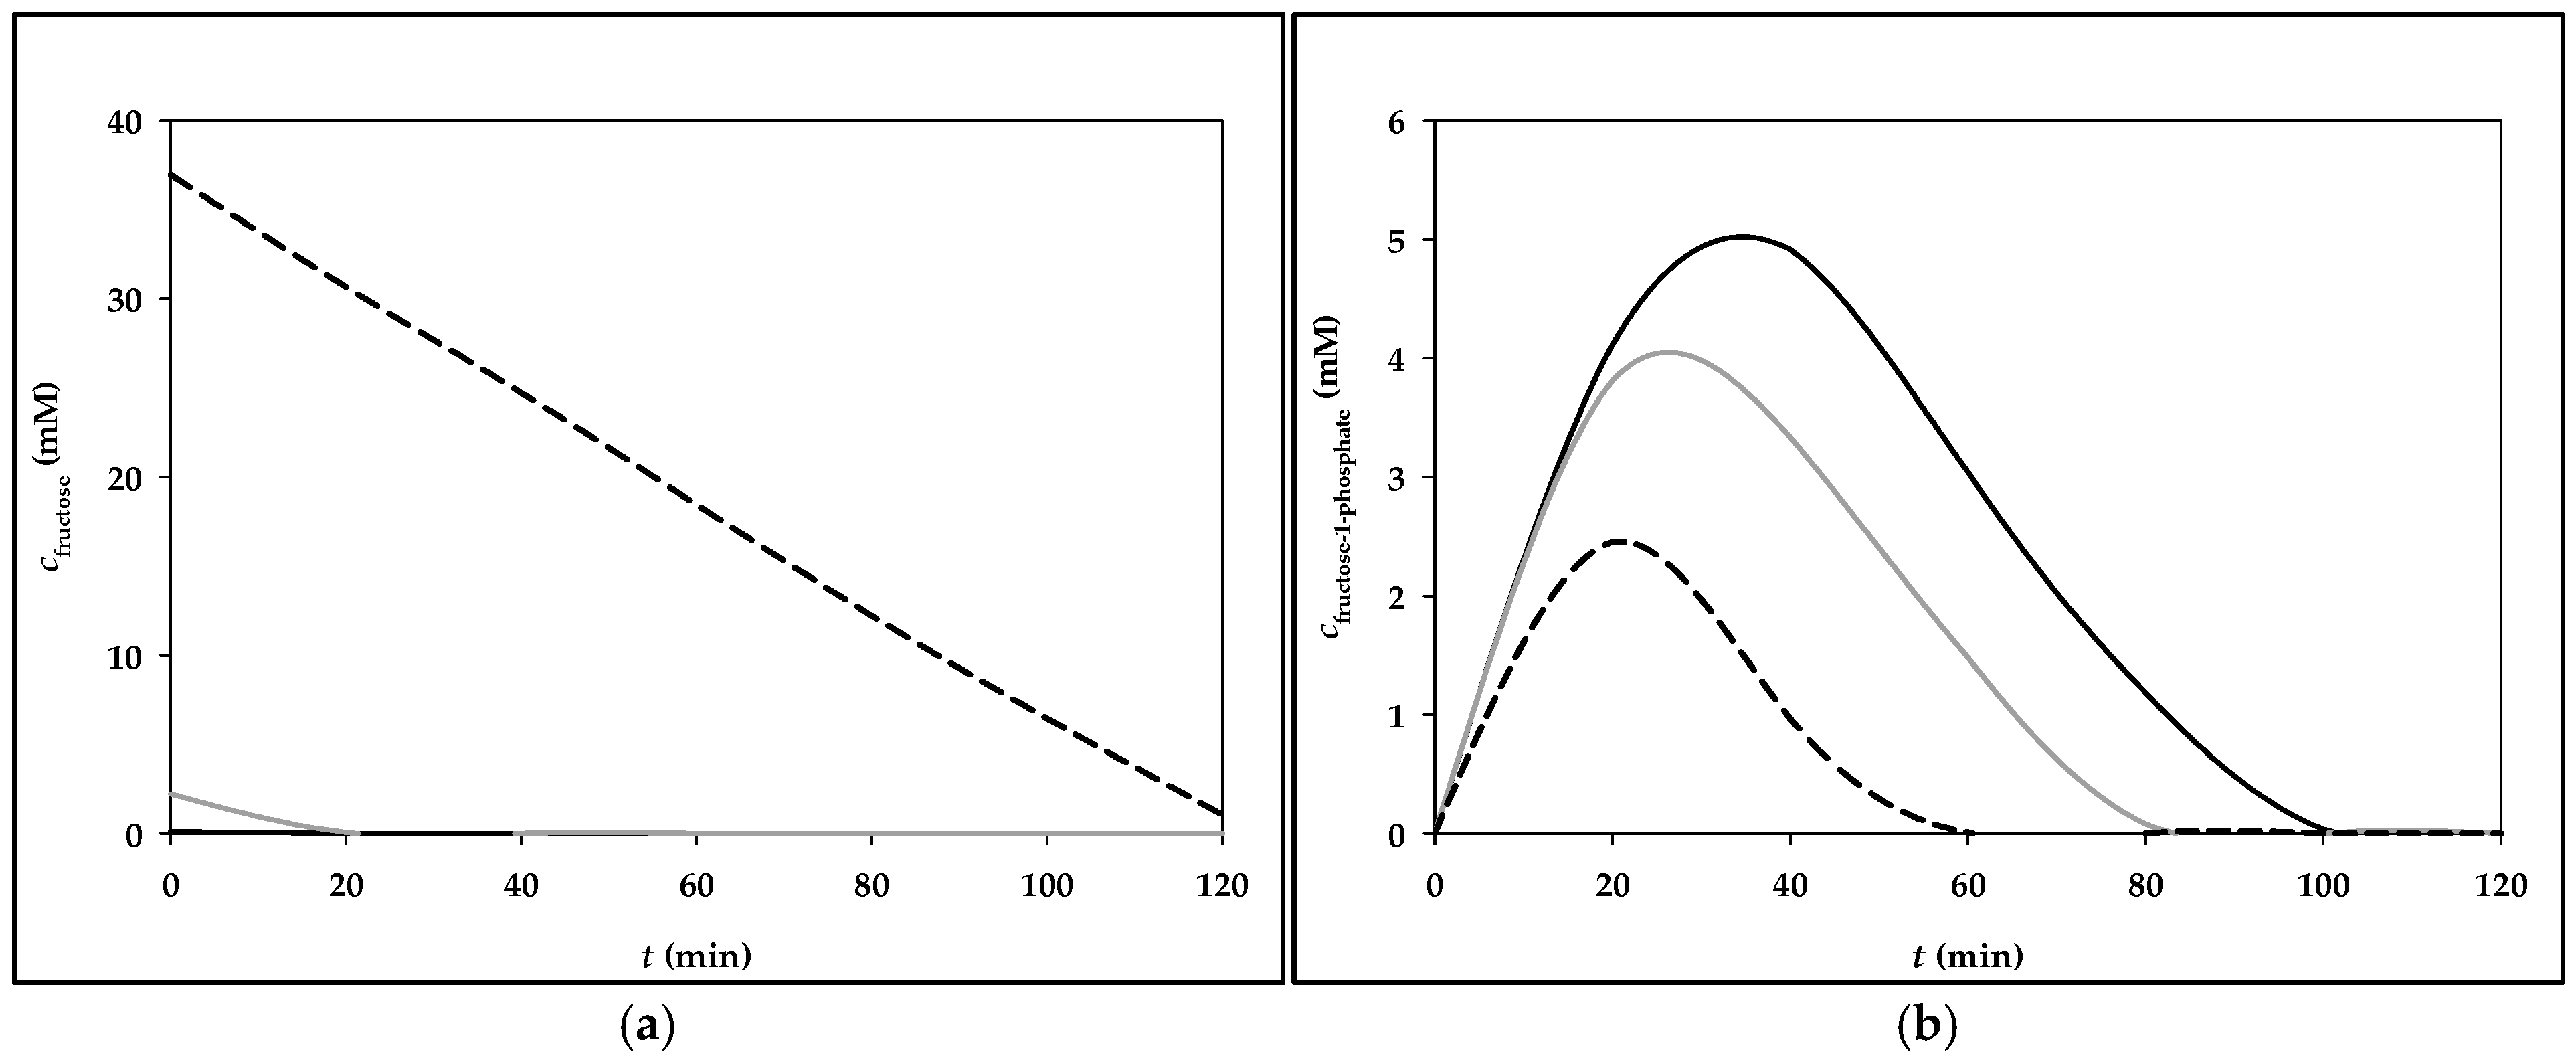
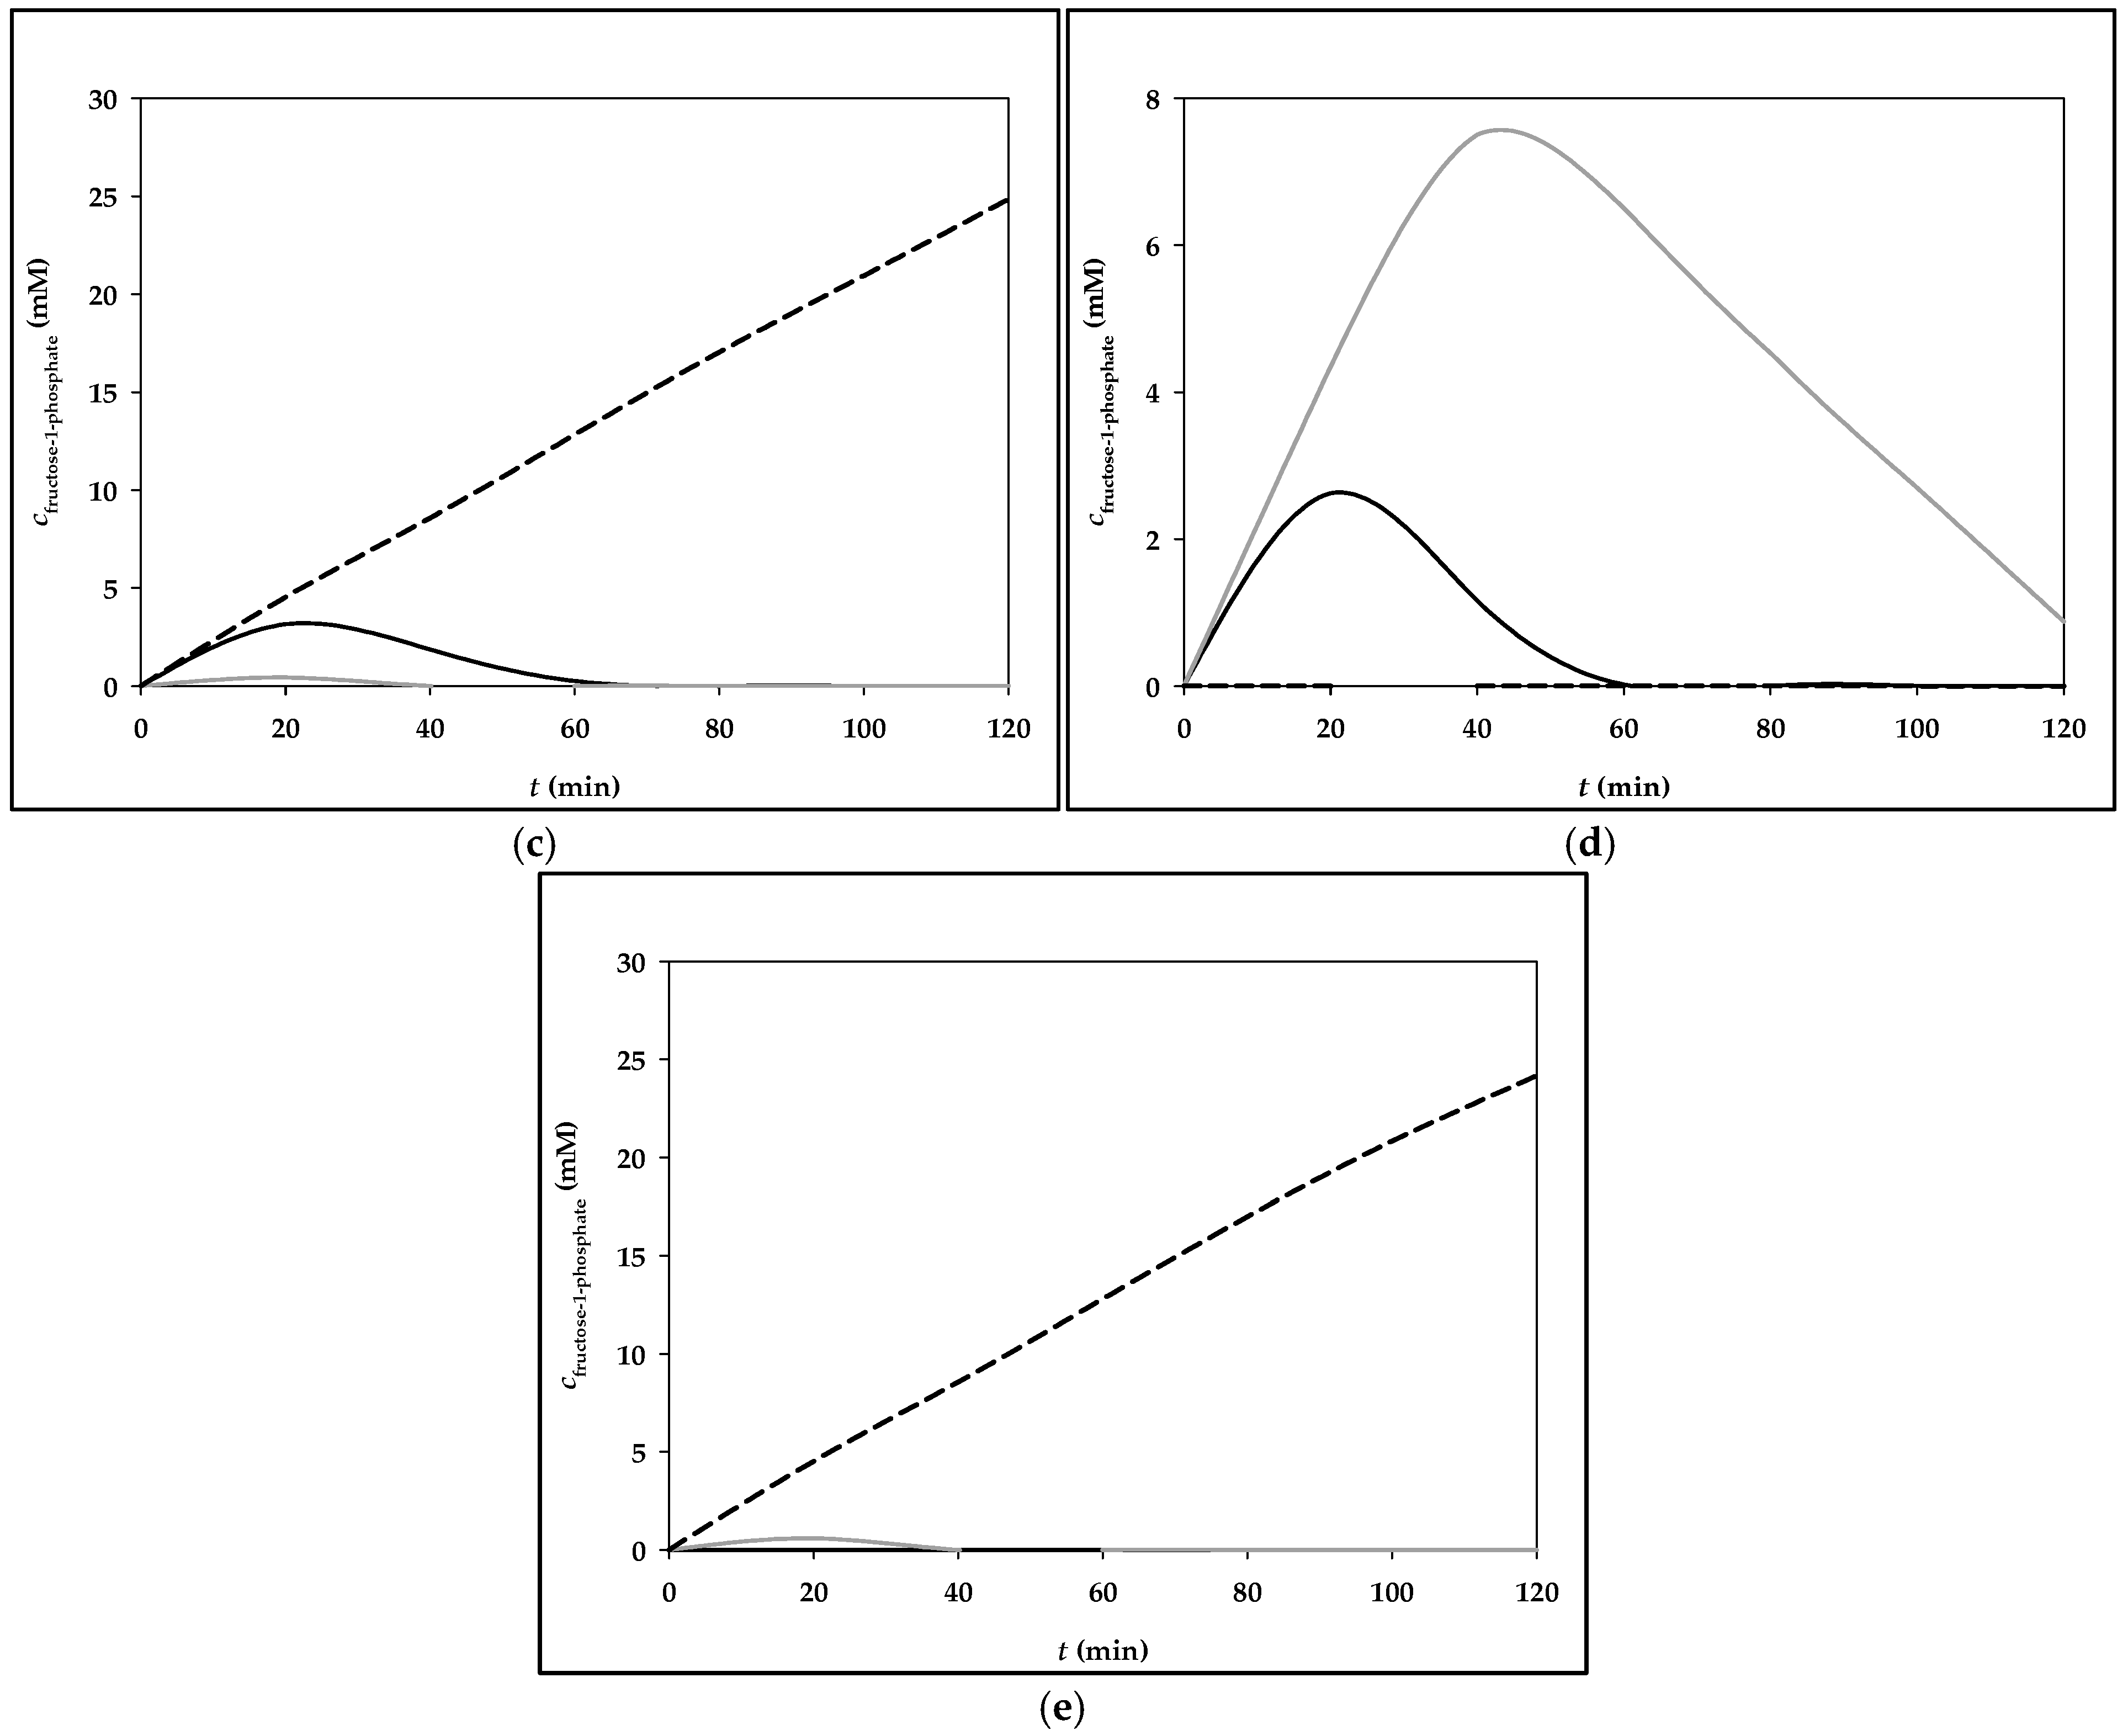
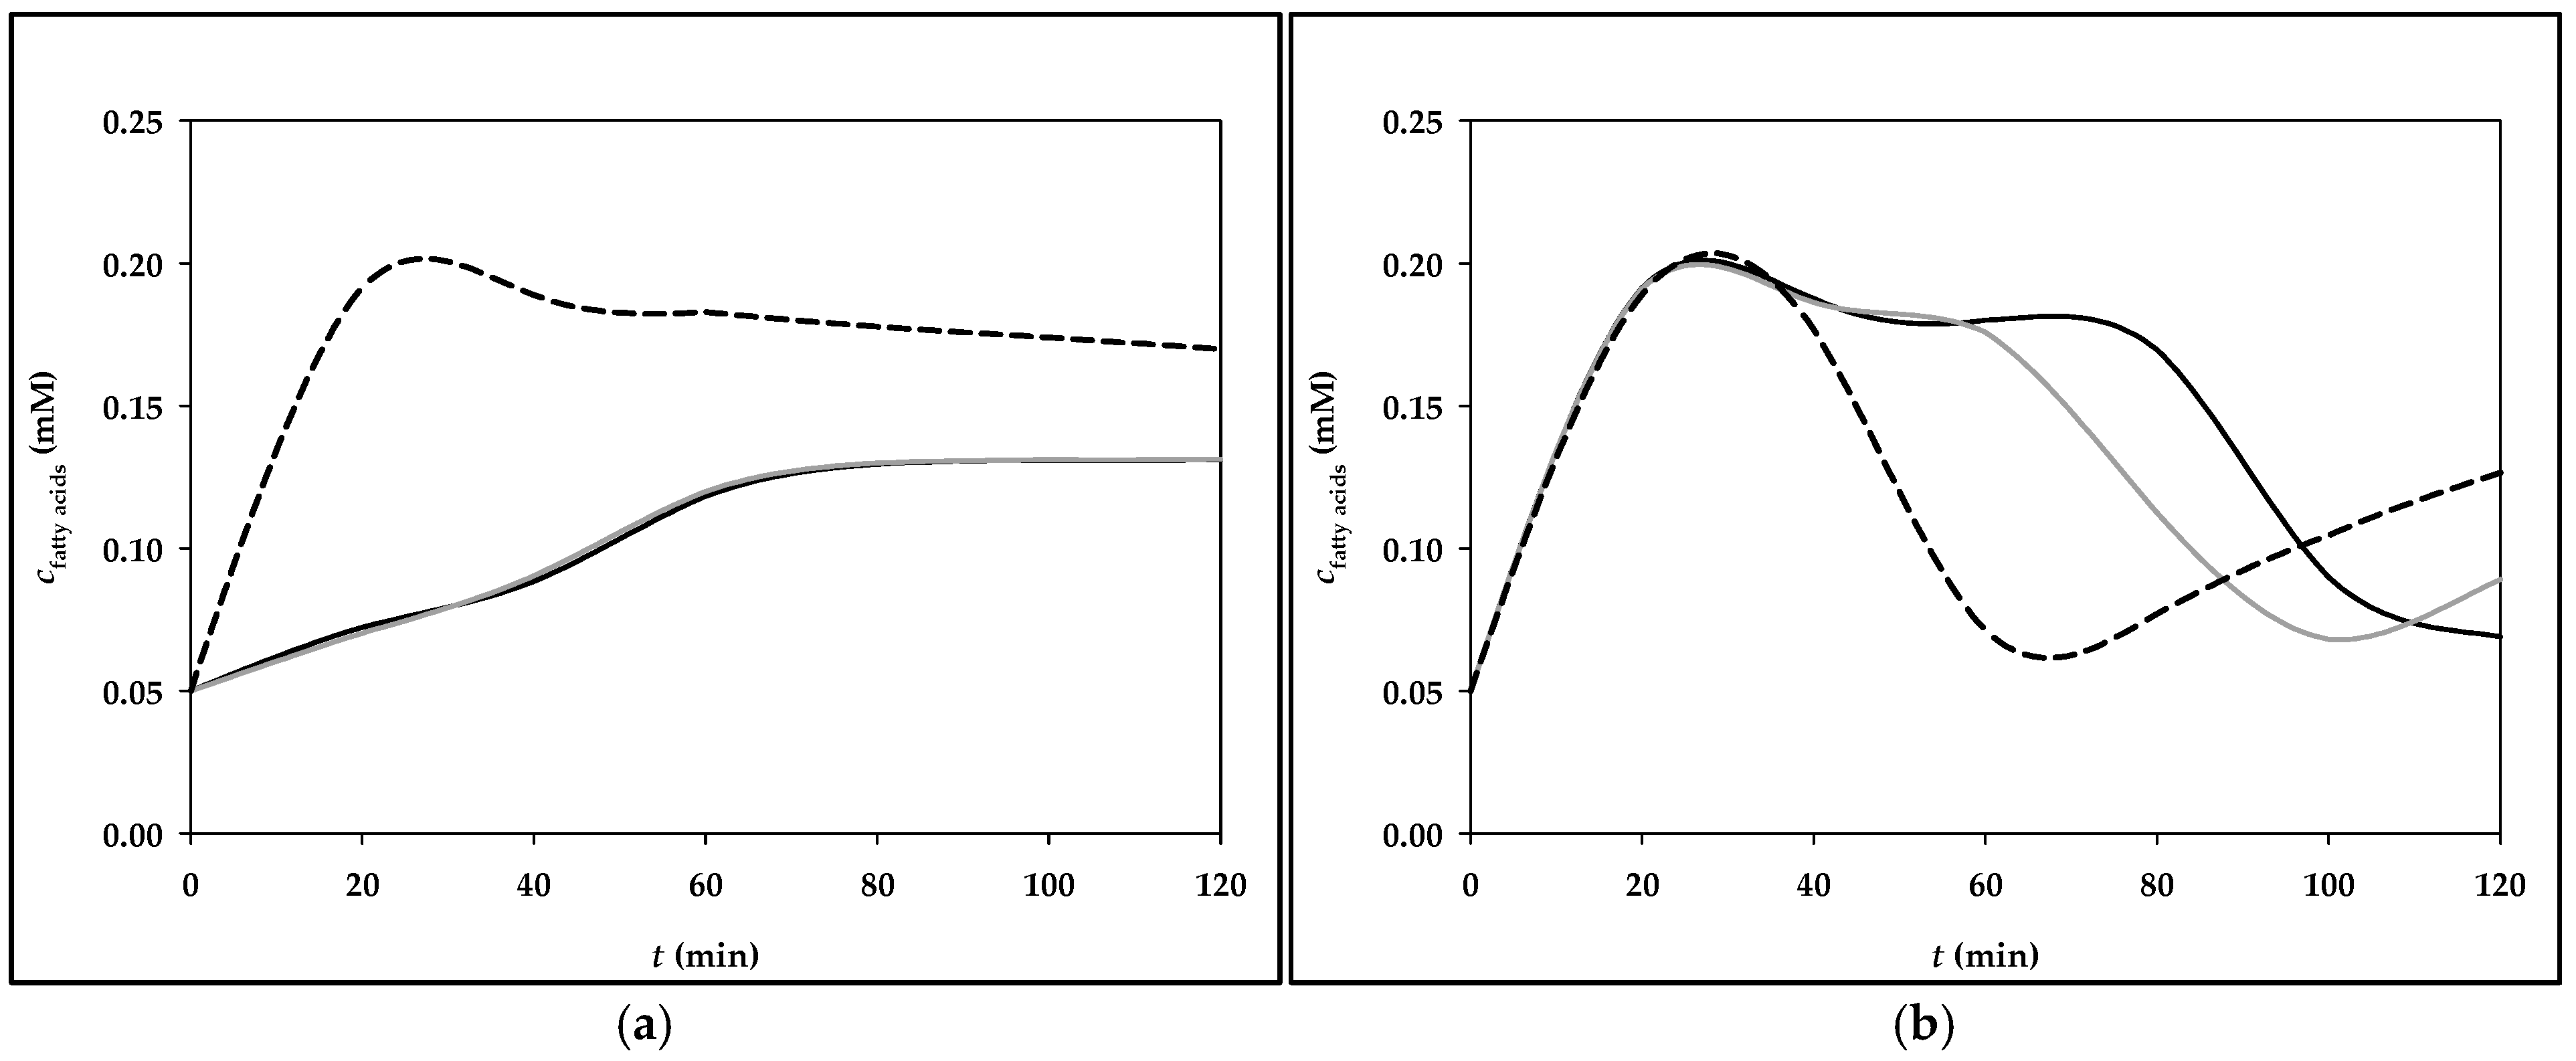
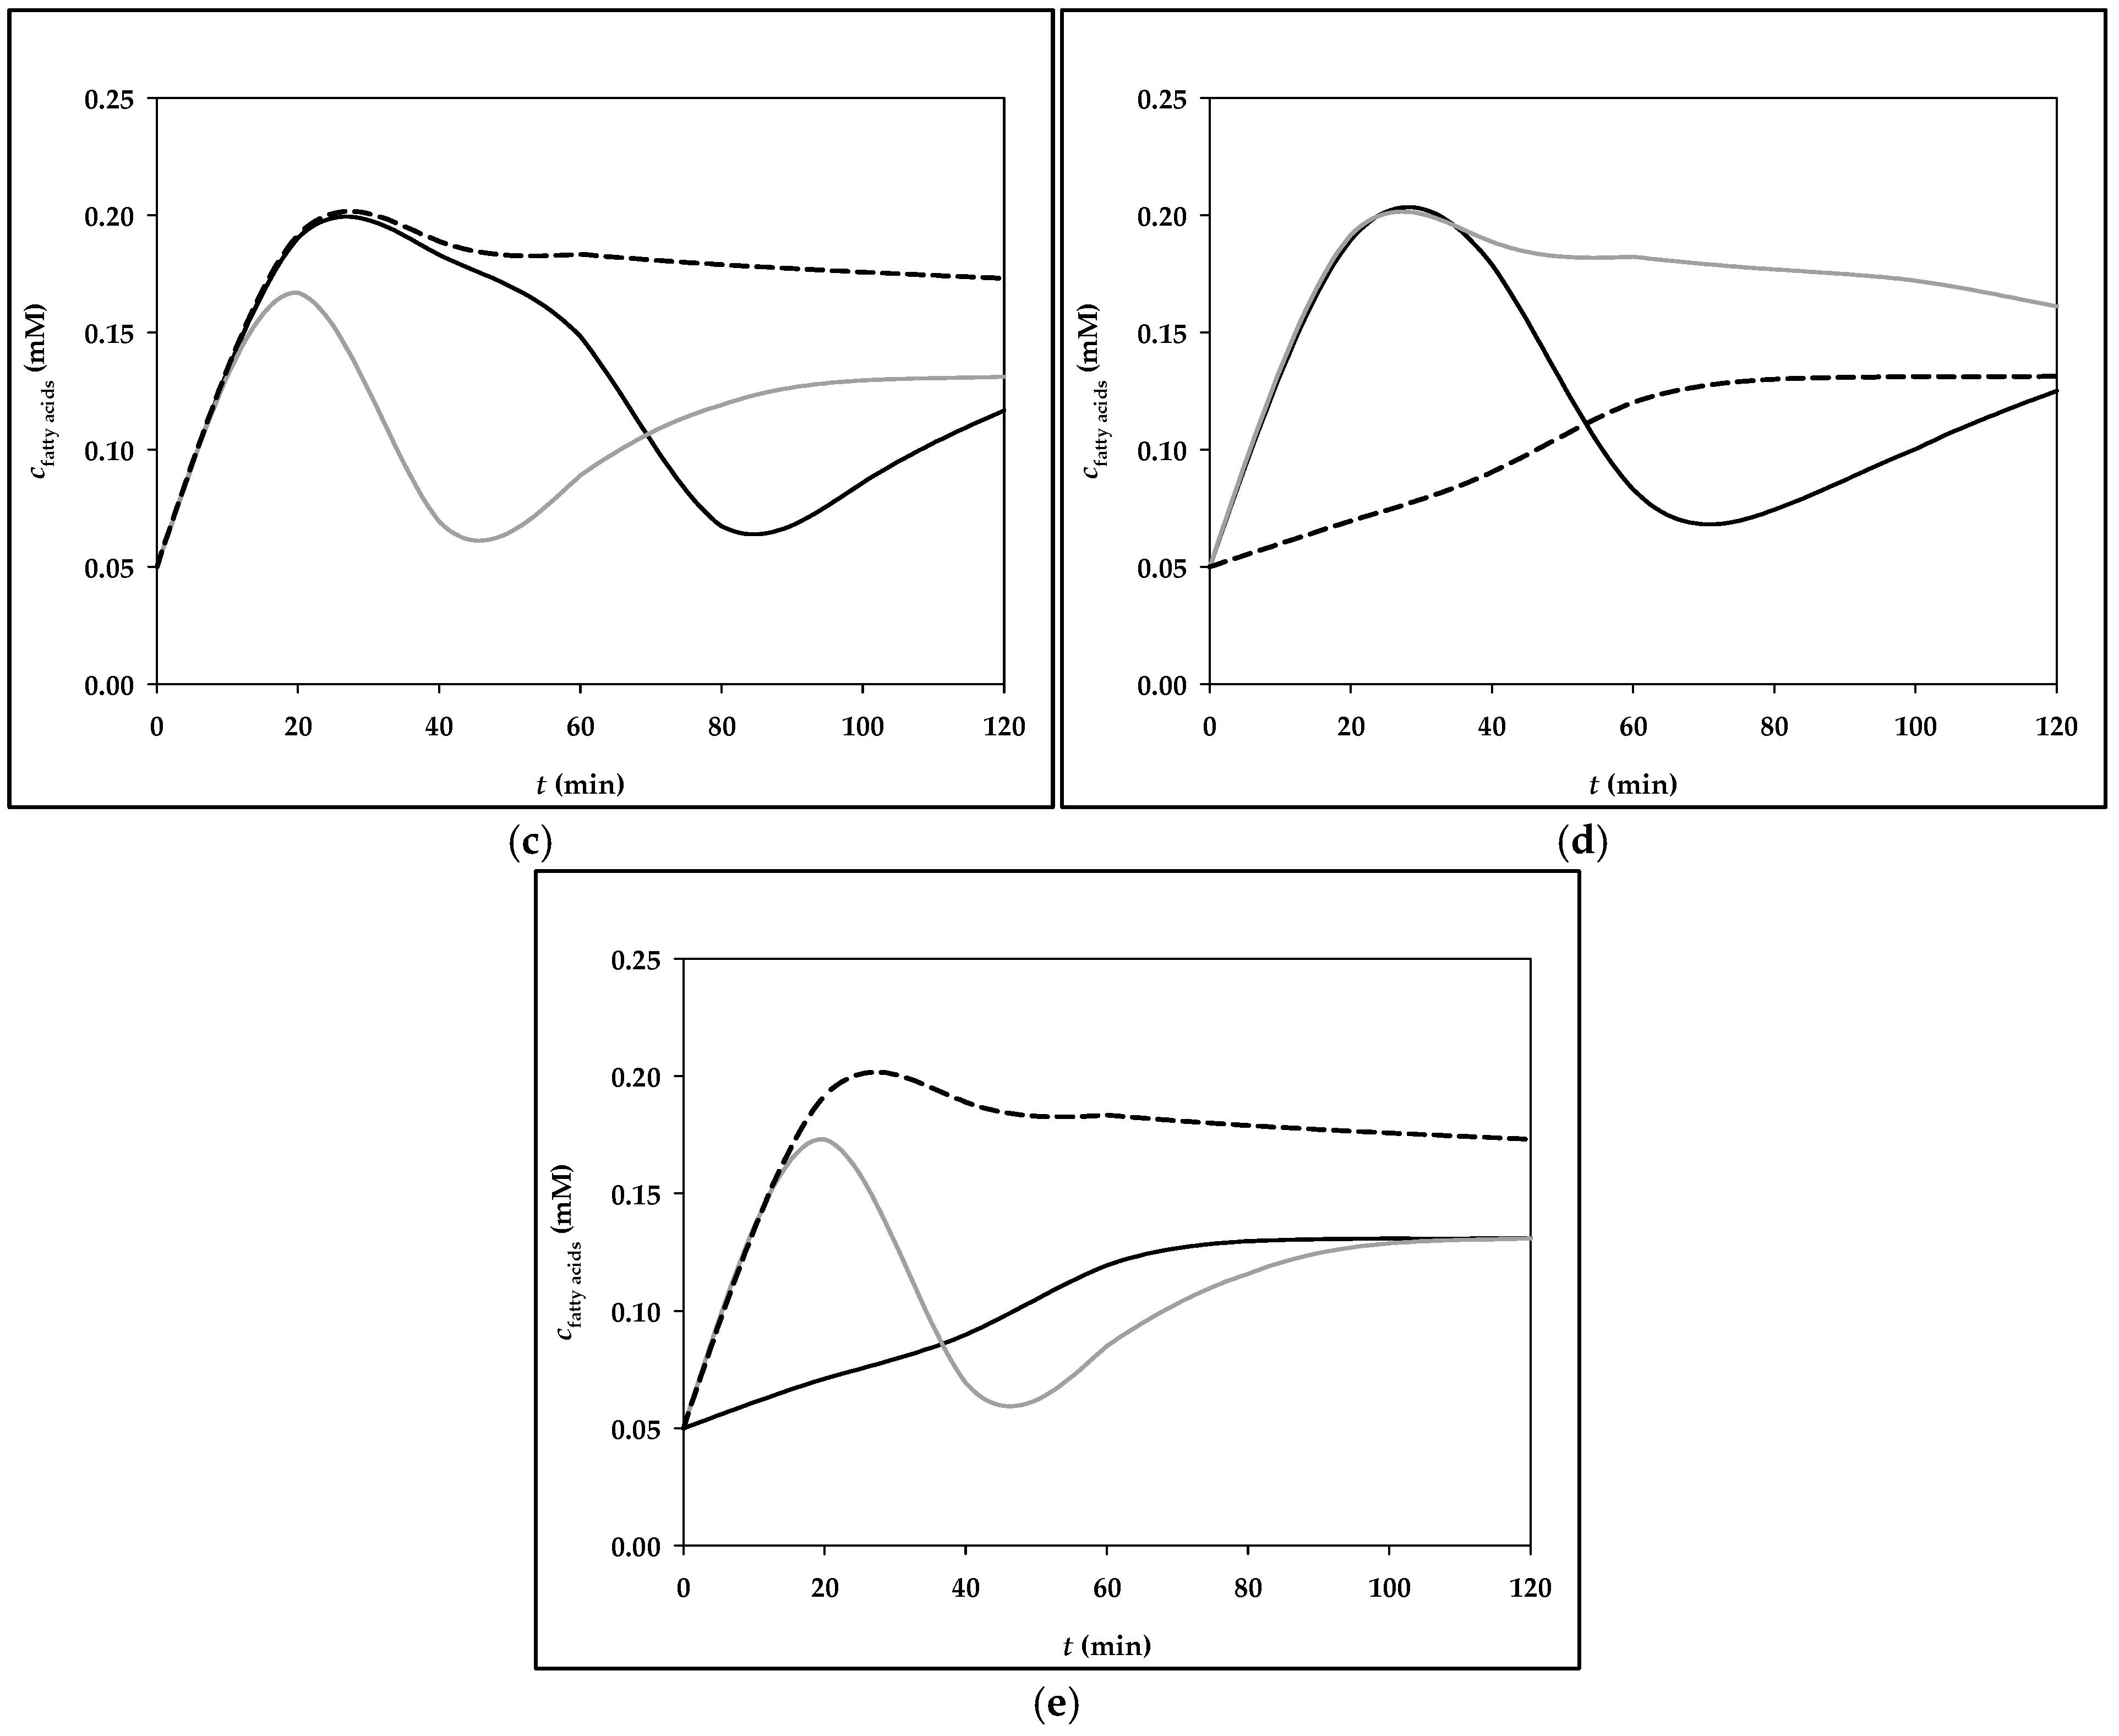
3.2. Simulation of Fructose Metabolism Model

Fructose metabolism modeling involves the creation of mathematical and computational models to simulate and understand the biochemical processes by which fructose is metabolized in the body, particularly in the liver [42,52,53]. These models are essential for exploring the complex interactions and dynamics of metabolic pathways, predicting the effects of various dietary and environmental conditions, and investigating the potential impacts on health. By running simulations, these models can predict the flow of metabolites through different pathways. For instance, they can be used to estimate how much fructose is converted into glucose, fatty acids, or stored as glycogen [54]. This is particularly useful for understanding the balance between energy production and storage and how it is affected by different levels of fructose intake [42,52,53].
The fructose metabolism model in this study was analyzed using the CellDesigner 4.2.2 software. CellDesigner is a powerful tool for visualizing and analyzing biological networks. It’s designed to create and share diagrams of gene regulatory and biochemical pathways. By using a standardized graphical notation [1,9], CellDesigner helps researchers communicate complex biological processes effectively. The software also integrates with other tools for simulation and analysis, making it a valuable asset in systems biology research. A graphical representation of the constructed model is presented in Figure 2. The primary focus of this study is on hepatocyte metabolism, as fructose is predominantly metabolized in the liver parenchyma. The model incorporates three key enzymes specifically involved in fructose metabolism: fructokinase, aldolase B, and triokinase [52,53]. Given the substantial evidence linking high fructose consumption to the stimulation of de novo lipogenesis, inhibition of fatty acid oxidation, and enhancement of triglyceride synthesis, these metabolic pathways are also integrated into the model. Although the model does not encompass all components of liver metabolism, it includes critical metabolites such as pyruvate, acetyl-CoA, fatty acids, and triglycerides, selected for their significance in monitoring and calibrating model parameters [52,53]. These metabolites are pivotal intermediates and end products of carbohydrate metabolism linked to lipid accumulation, making them essential for assessing the model’s accuracy. Moreover, the inclusion of these metabolites allows for potential validation and refinement of the model through clinical experiments. While the complexity of actual biochemical reactions is greater, the selection of enzymes in this model serves to simplify these processes, yielding relevant insights into the actual reaction rates within the human body [42].
Throughout the day, the liver encounters numerous metabolic challenges and engages in intricate processes to manage energy production and storage. It is central to the metabolism of fatty acids, glucose, and amino acids. Given the rising incidence of non-alcoholic fatty liver disease (NAFLD), a comprehensive understanding of liver metabolism regulation is crucial [54]. Among the various risk factors, excessive fructose consumption has been consistently identified in both clinical and experimental studies as a significant contributor to the development of NAFLD [42,53].
For this study, various simulations of the fructose metabolism model, developed in the CellDesigner software, were conducted. These simulations were performed using different initial concentrations of fructose, which were determined based on the distributed meal menus. Along with the variations in fructose concentration (Figure 3), the simulations also monitored changes in fructose-1-phosphate (Figure 4) and fatty acid (Figure 5) levels. Each simulation was carried out over a 120 min period.
Compared to glucose metabolism, the metabolism and hepatic extraction of fructose are significantly more pronounced (Figure 3). This is primarily due to the high levels of fructokinase in the liver, an enzyme with a strong affinity for fructose, and the fact that fructose metabolism bypasses key regulatory steps, particularly in the conversion of fructose-1-phosphate into triose phosphates. Consequently, fructose is metabolized more rapidly than glucose, leading to a greater conversion of fructose into liver glycogen [55]. As illustrated in Figure 4, fructose-1-phosphate accumulates rapidly due to the absence of negative feedback mechanisms when fructose is abundant. As fructose concentrations decline, the rate of fructose-1-phosphate formation correspondingly decreases. According to Brouwers [56], fructose-1-phosphate may have evolved as a signaling molecule that facilitates nutrient absorption, lipid storage, and reproduction. This signaling role could explain why fructose contributes to the onset of diseases like non-alcoholic fatty liver disease (NAFLD) in environments where food is abundant, reflecting maladaptive evolutionary responses. Furthermore, studies on individuals with aldolase B deficiency—the enzyme responsible for converting fructose-1-phosphate into glyceraldehyde and dihydroxyacetone phosphate—have demonstrated increased hepatic fat accumulation due to the buildup of fructose-1-phosphate. These findings suggest that the lipogenic effects of fructose might not be the primary driver in the pathogenesis of NAFLD. Instead, it is the accumulation of intermediates in fructolysis, particularly fructose-1-phosphate, that could play a more critical role [55,57,58].
Figure 5 illustrates the dynamics of fatty acid formation in the liver. The observed decrease in fatty acid concentration at specific points along the curves corresponds to the consumption of fatty acids in triglyceride synthesis during the postprandial period. Notably, after 2 h, the liver exhibits the highest levels of fatty acids when the initial fructose concentrations were elevated. This observation aligns with existing literature, which indicates that fructose and sucrose enhance hepatic fatty acid synthesis under basal conditions [59]. Conversely, dietary restrictions on fructose intake are associated with a reduction in hepatic fatty acid levels [60,61]. Fructose consumption significantly impacts hepatic fatty acid formation through enhanced de novo lipogenesis, leading to various health issues such as NAFLD, insulin resistance, and metabolic syndrome. Understanding these mechanisms is crucial for developing dietary and therapeutic strategies to mitigate the adverse effects of excessive fructose intake [21,22,23,24,25]. For instance, targeted dietary modifications that limit fructose intake can reduce hepatic fat accumulation and improve metabolic outcomes. Additionally, therapeutic approaches may include pharmacological agents that inhibit key enzymes involved in fructose metabolism or modulate pathways linked to fatty acid synthesis. Such strategies are essential not only for managing current metabolic disorders but also for preventing their onset in at-risk populations. Therefore, a deeper understanding of fructose-induced fatty acid formation is integral to developing comprehensive solutions to mitigate the growing public health challenges associated with excessive fructose consumption and also has the potential to inform dietary recommendations, particularly for individuals consuming high-fructose diets, which are prevalent in Western populations. By identifying key metabolic pathways and regulatory points affected by fructose, this research can contribute to the development of personalized dietary interventions aimed at mitigating the adverse health effects of excessive fructose consumption.

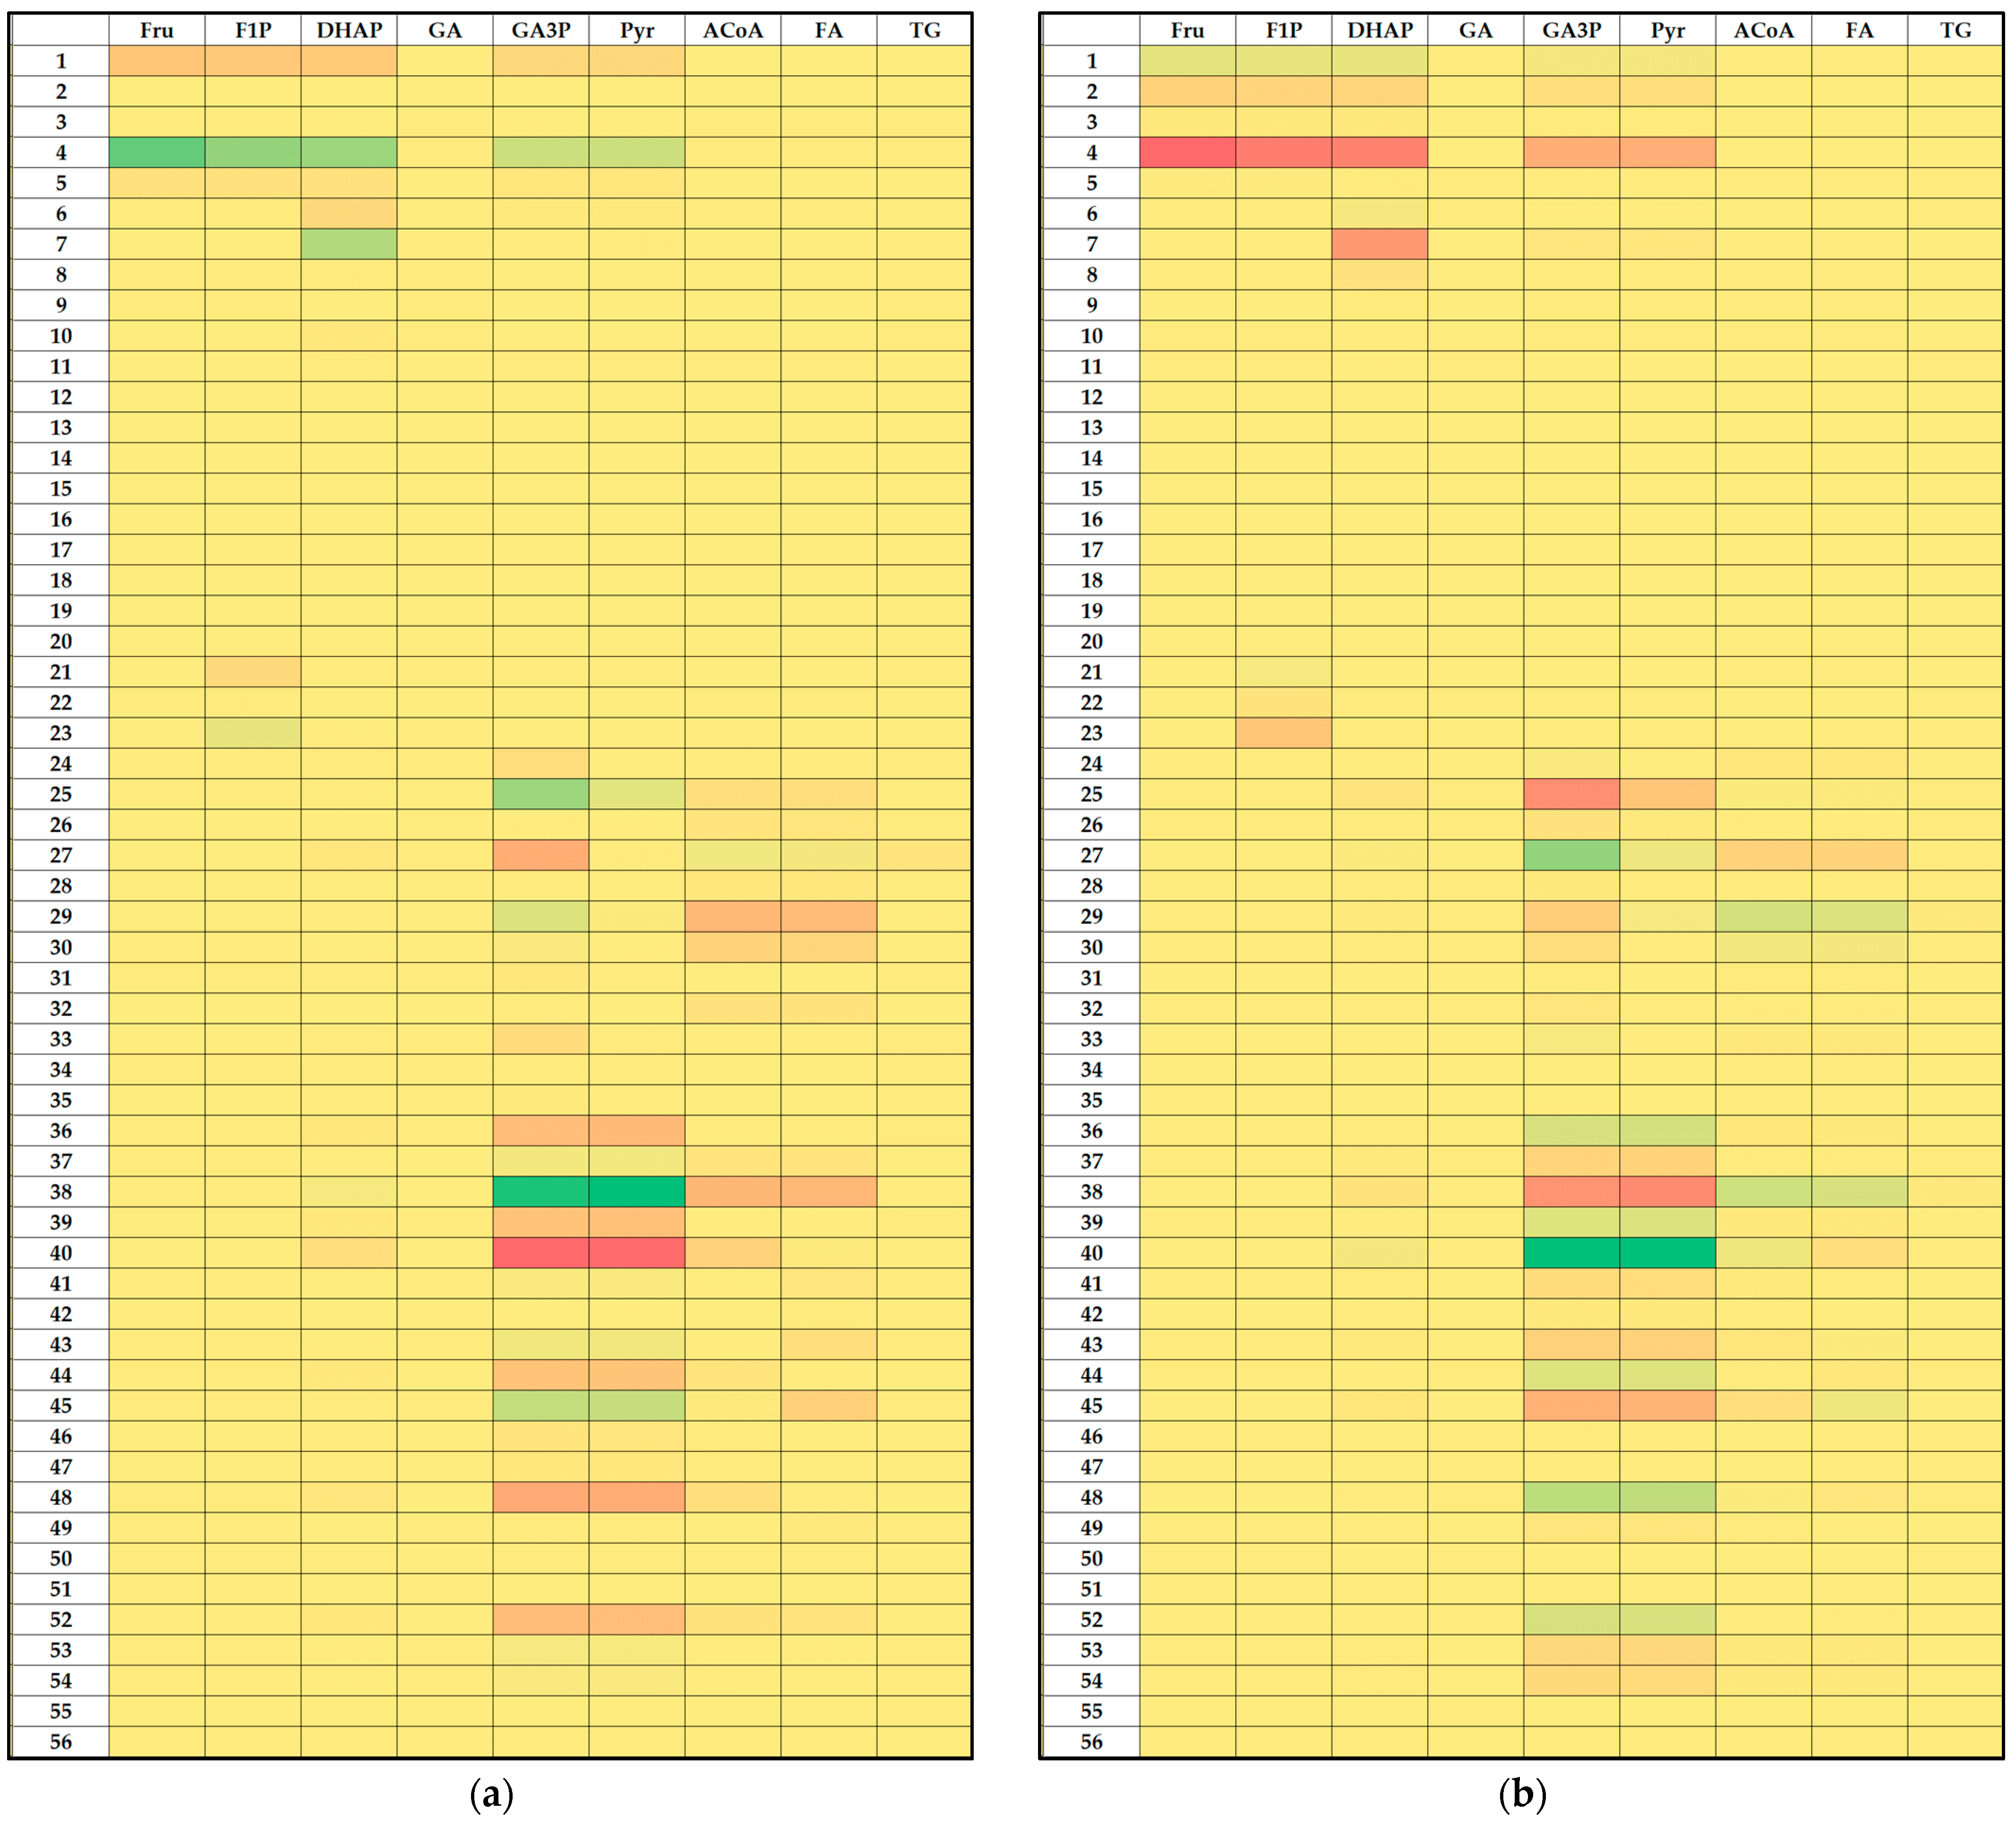
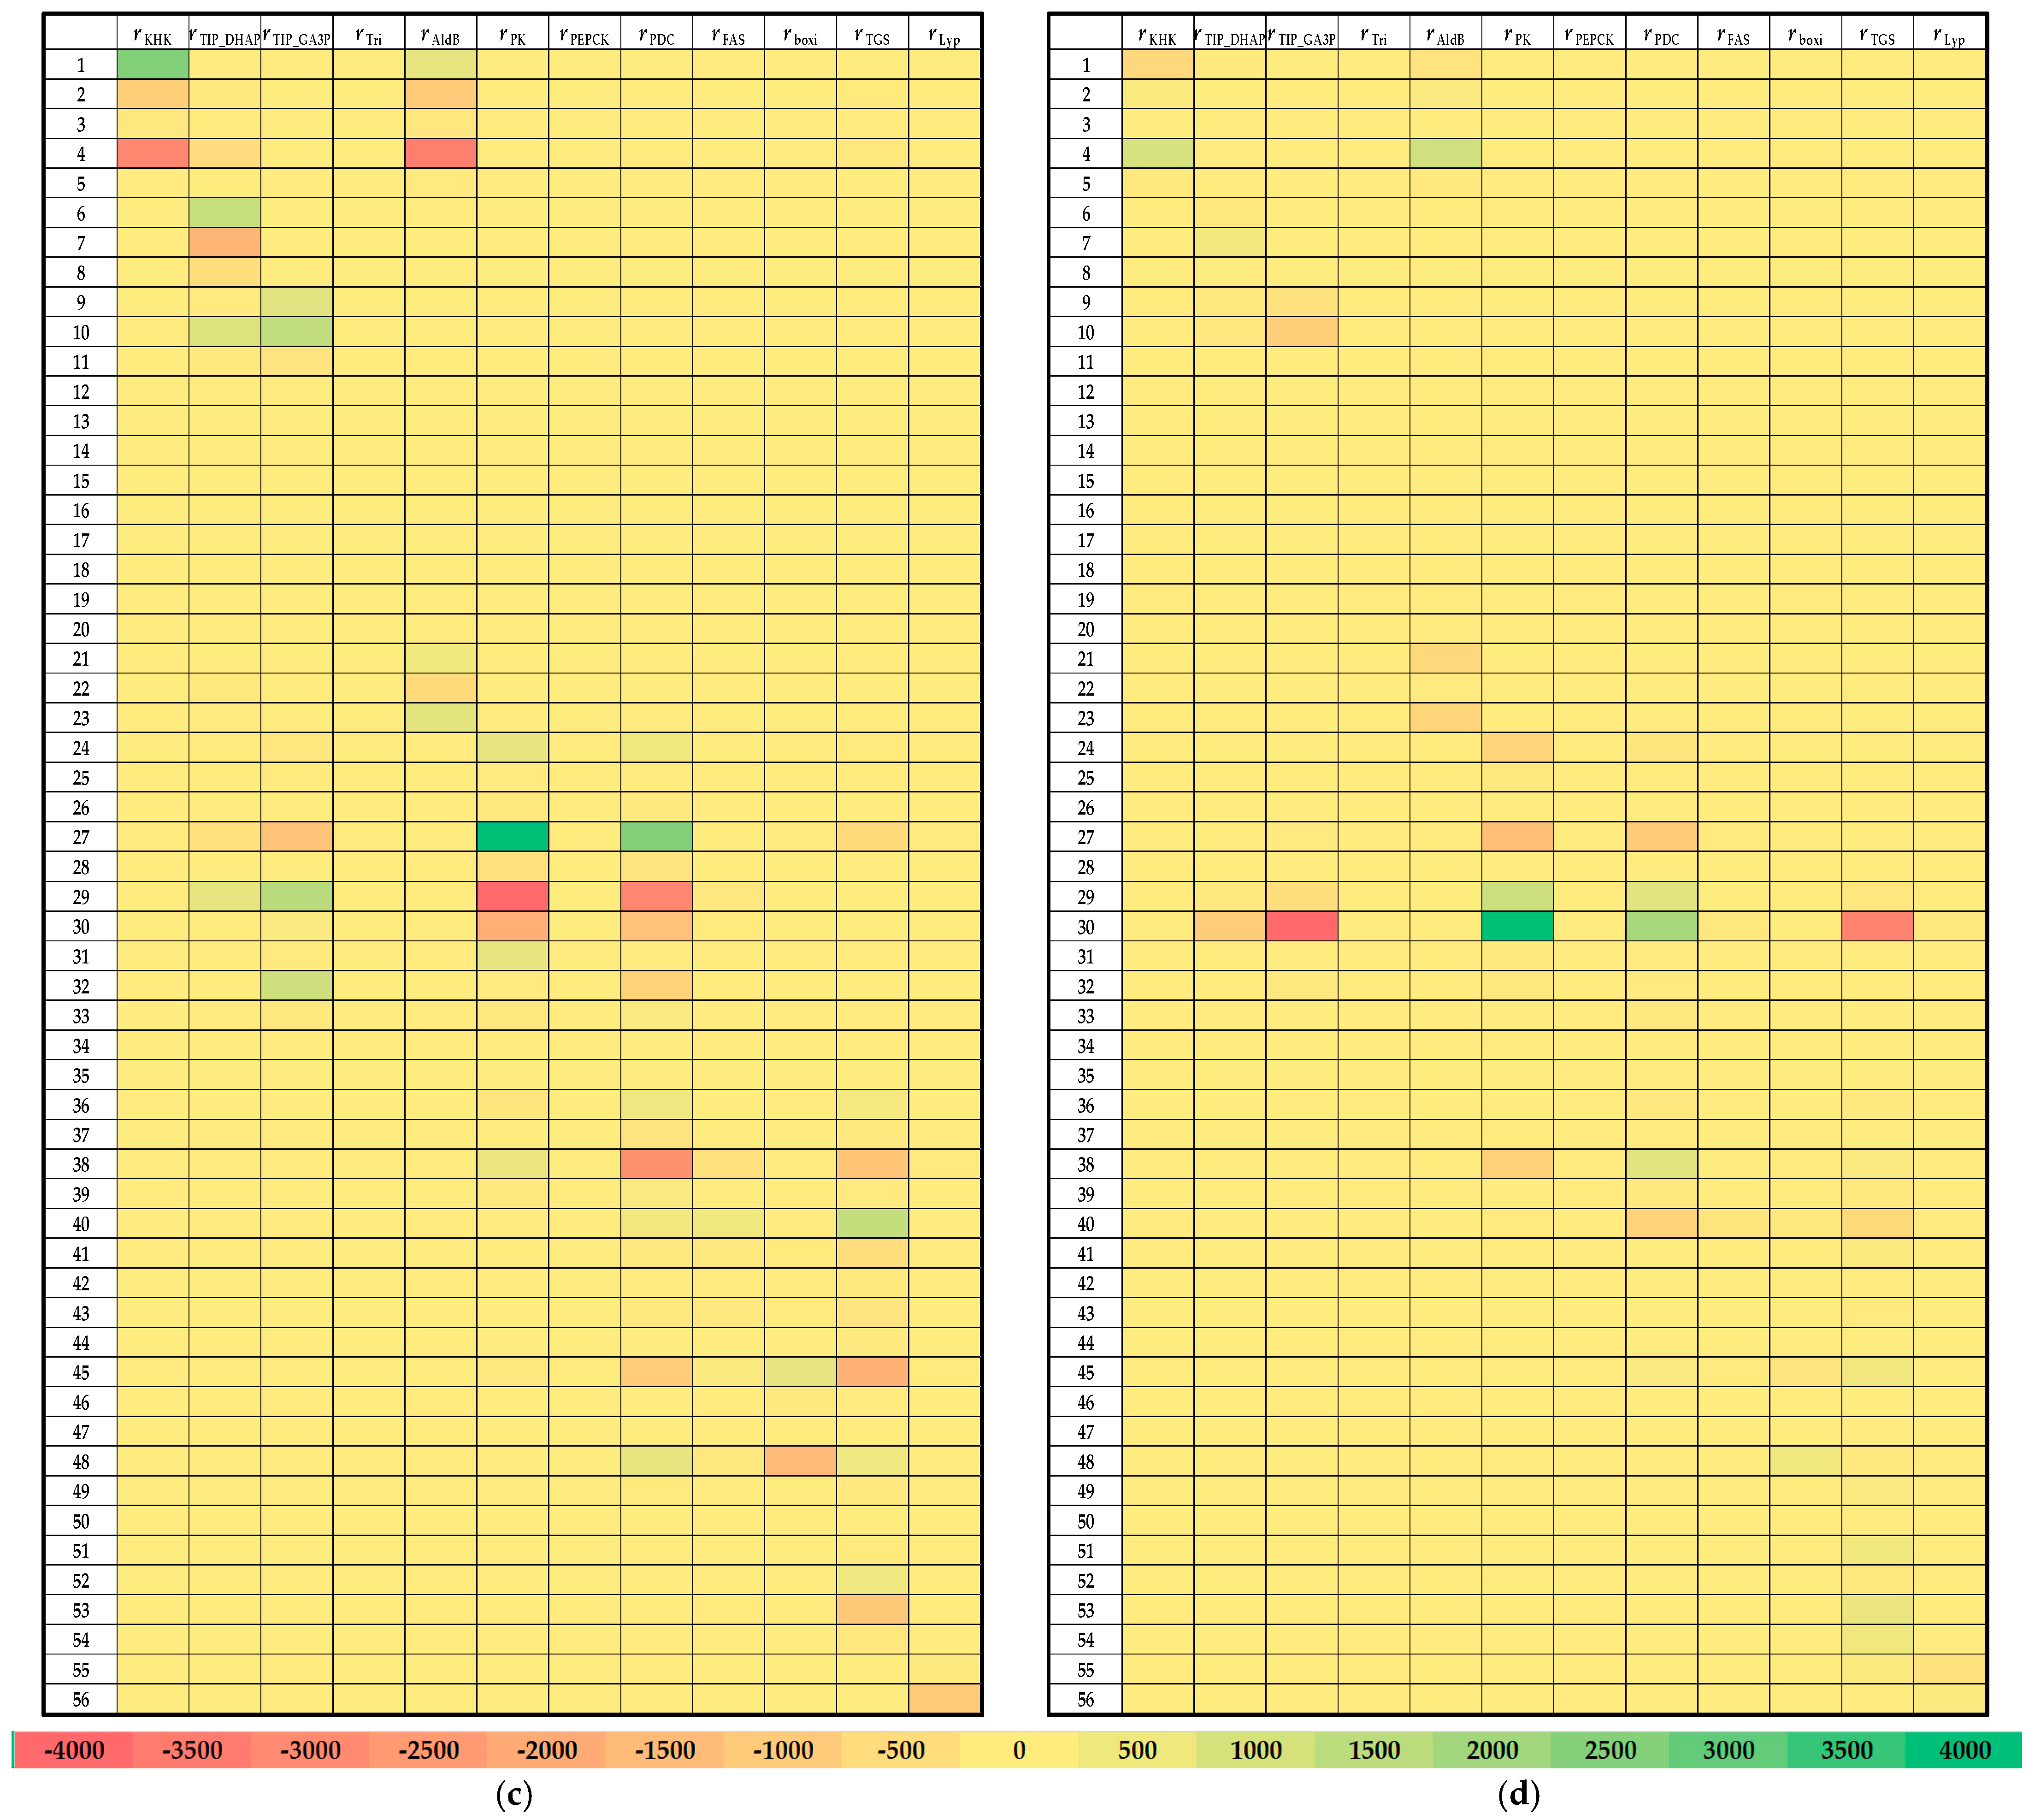
3.3. Local Sensitivity Analysis of the Fructose Metabolism Model

Local parametric sensitivity analysis is a method used to examine how small changes in individual parameters of a mathematical model affect the model’s output [62,63,64]. This type of analysis focuses on understanding the influence of specific parameters on the behavior and performance of the model, typically in the vicinity of a particular set of parameter values. Local parametric sensitivity analysis is vital for understanding, validating, and optimizing mathematical models of metabolic pathways [65,66]. It provides crucial insights into model behavior, guides experimental design, enhances system stability, and informs targeted interventions, ultimately leading to more accurate and effective applications in both research and practical settings.
In this study, a local parametric sensitivity analysis was conducted on the kinetic parameters of a mathematical model of fructose metabolism in hepatocytes. Accurately estimating kinetic parameters is crucial for reliable model predictions. However, obtaining precise experimental data for all parameters can be difficult, leading to uncertainties in the model [16,67,68,69,70]. The analysis focused on evaluating how small perturbations—specifically, a 3% and 5% increase or decrease in the value of individual parameters—affected all variables and reactions within the model at a steady state. This approach allowed for the identification of key parameters that significantly influence the behavior of the metabolic network, providing insights into the robustness and sensitivity of the system to changes in specific kinetic parameters. Such an analysis is critical for understanding the regulatory mechanisms within fructose metabolism and for guiding further model refinement and experimental validation.
Based on the results presented in Figure 6a–d, it is evident that 3% variations in the kinetic parameter VFAS (the rate of conversion of acetyl-CoA to fatty acids) significantly influence the concentrations of glyceraldehyde-3-phosphate (GA3P), pyruvate/lactate, and acetyl-CoA. Specifically, a 3% increase in VFAS results in a decrease in the concentrations of these metabolites, while a 3% decrease in VFAS leads to an increase in their concentrations. Additionally, changes in the parameter Vboxi (the rate of beta-oxidation) affect the levels of GA3P, pyruvate/lactate, and fatty acids. An increase in Vboxi elevates the concentrations of GA3P, pyruvate/lactate, and fatty acids. Furthermore, alterations in VTGS (the rate of conversion of fatty acids into triglycerides) also impact the concentrations of GA3P and pyruvate/lactate, with an increase in VTGS causing a reduction in their levels. From these findings, it can be concluded that the metabolites GA3P and pyruvate/lactate are highly sensitive to changes in the kinetic parameters VFAS, Vboxi, and VTGS. This sensitivity underscores the critical role these parameters play in regulating the metabolic fluxes within the fructose metabolism pathway, particularly in the context of lipid synthesis and energy production. In the case of 5% variations of the kinetic parameter values, the glyceraldehyde-3-phosphate (GA3P), pyruvate/lactate, and acetyl-CoA concentrations at the steady state were again the most sensitive. Results indicate that βACoA-PK (coefficient of the pyruvate transformation into acetyl-CoA), VPEPCK (rate of the pyruvate transformation into GA3P), and nADP (exponent of the ADP concentration in the rate of the pyruvate kinase catalyzed reaction) are the most important for the metabolite concentrations. An increased value of the coefficient of pyruvate transformation into Acetyl-CoA results in a higher proportion of pyruvate converted to acetyl-CoA, resulting in increased fatty acid synthesis. On the other hand, a reduced value of the coefficient of pyruvate transformation into Acetyl-CoA results in a lower proportion of the pyruvate being converted to acetyl-CoA and less acetyl-CoA limits fatty acid production and consequently increases the fructose metabolism. Furthermore, the increased rate of the pyruvate transformation into GA3P increases the fructose metabolism because if pyruvate is rapidly converted to glyceraldehyde-3-phosphate, fructose breakdown is accelerated. Results also showed that pyruvate/lactate and acetyl-CoA concentrations are more sensitive to a 5% kinetic parameters increase than to a 5% kinetic parameters decrease.
Figure 7a–d illustrate that the parameters associated with the formation of fatty acids exert the most significant impact on changes in reaction rates within the metabolic model for both 3% and 5% kinetic parameter values variations. Specifically, the reactions influenced include rTIP_GA3P (the reverse conversion of glyceraldehyde-3-phosphate [GA3P] to dihydroxyacetone phosphate), rPK (the conversion of GA3P to pyruvate/lactate), rPDC (the conversion of pyruvate/lactate to acetyl-CoA), and rTGS (triglyceride synthesis). In the model, GA3P represents glycerol-3-phosphate, a metabolite whose glycerol backbone is integral to triglyceride formation. The rapid interconversion between these two metabolites explains GA3P’s influence on the rate of reaction rTGS. Reaction rPDC represents the formation of acetyl-CoA, a critical metabolite that bridges fructose and glucose metabolism with lipid metabolism and serves as a substrate in de novo lipogenesis (DNL). In hepatic lipogenesis, acetyl-CoA and its derivative malonyl-CoA are the primary substrates for the synthesis of new fatty acids, which are subsequently processed into triglycerides. In mammals, fatty acid synthesis is catalyzed by two key enzymes: acetyl-CoA carboxylase (ACC) and fatty acid synthase (FAS). FAS is a complex enzyme that is tightly regulated by various nuclear receptors, reflecting the intricate control of fatty acid synthesis. Results showed higher sensitivity coefficient values for 3% kinetic parameter value variations.
The interplay between glucose/fructose metabolism and lipid metabolism is underscored by the role of nuclear receptors as mediators of insulin signaling. DNL, which involves the conversion of carbohydrates into fatty acids, is predominantly active under anabolic conditions when energy and substrates are abundant. Insulin, a critical anabolic hormone, stimulates the expression of FAS through the phosphoinositide-3-kinase (PI3K) signaling pathway. At the transcriptional level, this process is further regulated by the sterol regulatory element-binding protein 1c (SREBP-1c) and carbohydrate-responsive element-binding protein (ChREBP), which work synergistically to enhance the expression of both FAS and ACC [71]. These molecular mechanisms illustrate the profound connection between carbohydrate metabolism and lipid biosynthesis, highlighting how dietary intake of glucose and fructose can directly influence lipid accumulation in the liver through the regulation of key enzymes and pathways involved in fatty acid synthesis. The sensitivity of these reactions to changes in specific kinetic parameters underscores the importance of accurately modeling these processes to understand their contributions to metabolic health and disease.
The findings emphasize the significant impact of dietary fructose on hepatic lipid metabolism, where excessive intake can lead to increased fatty acid and triglyceride synthesis. This connection is crucial for understanding the metabolic consequences of high fructose consumption, particularly its role in the development of conditions like NAFLD. The sensitivity of the metabolic model to changes in these key parameters suggests that precise control of dietary intake and metabolic regulation could be essential strategies for mitigating the adverse effects of excessive fructose consumption on liver health.

4. Conclusions

The mathematical model of fructose metabolism developed in CellDesigner successfully simulated the effects of varying fructose intake on fat metabolism. Our analysis revealed a strong correlation between increased fructose consumption and elevated hepatic triglyceride accumulation. Sensitivity analysis identified glyceraldehyde-3-phosphate and pyruvate as key parameters influencing this relationship. These findings underscore the importance of systems biology in understanding the complex interplay between fructose metabolism and the development of nonalcoholic fatty liver disease. While the current model provides valuable insights, future iterations could benefit from incorporating plasma-free fatty acids and triglycerides for a more comprehensive representation of clinical and experimental data. Overall, this research highlights the potential of systems biology to inform personalized nutrition strategies and advance our understanding of metabolic disorders.

Author Contributions

Conceptualization, A.J.T. and J.G.K.; methodology, A.J.T.; software, M.B. and D.V.; validation, T.S.C. and T.J.; formal analysis, I.B.; investigation, I.B.; data curation, A.J.T. and J.G.K.; writing—original draft preparation, I.B.; writing—review and editing, A.J.T., D.V. and J.G.K.; visualization, T.S.C. All authors have read and agreed to the published version of the manuscript.

Funding

This research received no external funding.

Data Availability Statement

Data are contained within the article.

Conflicts of Interest

The authors declare no conflicts of interest.

References

  1. Funahashi, A.; Morohashi, M.; Kitano, H.; Tanimura, N. CellDesigner: A process diagram editor for gene-regulatory and biochemical networks. BioSilico 2003, 1, 159–162. [Google Scholar] [CrossRef]
  2. Diaz-Beltran, L.; Cano, C.; Wall, D.P.; Esteban, F.J. Systems Biology as a Comparative Approach to Understand Complex Gene Expression in Neurological Diseases. Behav. Sci. 2013, 3, 253. [Google Scholar] [CrossRef] [PubMed]
  3. Zou, Y.; Laubichler, M.D. From systems to biology: A computational analysis of the research articles on systems biology from 1992 to 2013. PLoS ONE 2018, 13, e0200929. [Google Scholar] [CrossRef] [PubMed]
  4. Oulas, A.; Minadakis, G.; Zachariou, M.; Sokratous, K.; Bourdakou, M.M.; Spyrou, G.M. Systems Bioinformatics: Increasing precision of computational diagnostics and therapeutics through network-based approaches. Brief. Bioinform. 2019, 20, 806. [Google Scholar] [CrossRef]
  5. Pinu, F.R.; Beale, D.J.; Paten, A.M.; Kouremenos, K.; Swarup, S.; Schirra, H.J.; Wishart, D. Systems Biology and Multi-Omics Integration: Viewpoints from the Metabolomics Research Community. Metabolites 2019, 9, 76. [Google Scholar] [CrossRef]
  6. Coskun, A.; Ertaylan, G.; Pusparum, M.; Van Hoof, R.; Kaya, Z.Z.; Khosravi, A.; Zarrabi, A. Advancing personalized medicine: Integrating statistical algorithms with omics and nano-omics for enhanced diagnostic accuracy and treatment efficacy. Biochim. Biophys. Acta—Mol. Basis Dis. 2024, 1870, 167339. [Google Scholar] [CrossRef]
  7. Chi, J.; Shu, J.; Li, M.; Mudappathi, R.; Jin, Y.; Lewis, F.; Boon, A.; Qin, X.; Liu, L.; Gu, H. Artificial intelligence in metabolomics: A current review. TrAC Trends Anal. Chem. 2024, 178, 117852. [Google Scholar] [CrossRef]
  8. Puniya, B.L.; Verma, M.; Damiani, C.; Bakr, S.; Dräger, A. Perspectives on computational modeling of biological systems and the significance of the SysMod community. Bioinform. Adv. 2024, 4, vbae090. [Google Scholar] [CrossRef]
  9. Funahashi, A.; Matsuoka, Y.; Jouraku, A.; Morohashi, M.; Kikuchi, N.; Kitano, H. CellDesigner 3.5: A versatile modeling tool for biochemical networks. Proc. IEEE 2008, 96, 1254–1265. [Google Scholar] [CrossRef]
  10. Kitano, H. Systems Biology: A Brief Overview. Science 2002, 295, 1662–1664. [Google Scholar] [CrossRef]
  11. Bruggeman, F.J.; Westerhoff, H.V. The nature of systems biology. Trends Microbiol. 2007, 15, 45–50. [Google Scholar] [CrossRef] [PubMed]
  12. Madhavan, M.; Mustafa, S. Systems biology-the transformative approach to integrate sciences across disciplines Systems Biology: Integrating Biological Sciences. Phys. Sci. Rev. 2023, 8, 2523–2545. [Google Scholar] [CrossRef]
  13. Bartlett, A.; Lewis, J.; Williams, M.L. Generations of interdisciplinarity in bioinformatics. New Genet. Soc. 2016, 35, 186–209. [Google Scholar] [CrossRef]
  14. Tavassoly, I.; Goldfarb, J.; Iyengar, R. Systems biology primer: The basic methods and approaches. Essays Biochem. 2018, 62, 487–500. [Google Scholar] [CrossRef]
  15. Badimon, L.; Vilahur, G.; Padro, T. Systems biology approaches to understand the effects of nutrition and promote health. Br. J. Clin. Pharmacol. 2017, 83, 38. [Google Scholar] [CrossRef]
  16. Kosić, M.; Benković, M.; Jurina, T.; Valinger, D.; Gajdoš Kljusurić, J.; Jurinjak Tušek, A. Analysis of Hepatic Lipid Metabolism Model: Simulation and Non-Stationary Global Sensitivity Analysis. Nutrients 2022, 14, 4992. [Google Scholar] [CrossRef]
  17. Lee, B.Y.; Ordovás, J.M.; Parks, E.J.; Anderson, C.A.M.; Barabási, A.L.; Clinton, S.K.; de la Haye, K.; Duffy, V.B.; Franks, P.W.; Ginexi, E.M.; et al. Research gaps and opportunities in precision nutrition: An NIH workshop report. Am. J. Clin. Nutr. 2022, 116, 1877–1900. [Google Scholar] [CrossRef]
  18. de Hoogh, I.M.; Winters, B.L.; Nieman, K.M.; Bijlsma, S.; Krone, T.; van den Broek, T.J.; Anderson, B.D.; Caspers, M.P.M.; Anthony, J.C.; Wopereis, S. A novel personalized systems nutrition program improves dietary patterns, lifestyle behaviors and health-related outcomes: Results from the habit study. Nutrients 2021, 13, 1763. [Google Scholar] [CrossRef]
  19. Clemente-Suárez, V.J.; Peris-Ramos, H.C.; Redondo-Flórez, L.; Beltrán-Velasco, A.I.; Martín-Rodríguez, A.; David-Fernandez, S.; Yáñez-Sepúlveda, R.; Tornero-Aguilera, J.F. Personalizing Nutrition Strategies: Bridging Research and Public Health. J. Pers. Med. 2024, 14, 305. [Google Scholar] [CrossRef]
  20. Ma, C.; Gurkan-Cavusoglu, E. A comprehensive review of computational cell cycle models in guiding cancer treatment strategies. NPJ Syst. Biol. Appl. 2024, 10, 1234567890. [Google Scholar] [CrossRef]
  21. Martins, M.L.; Pacza, T.; Müller, K.; Baranyi, J. A computational approach to nutrition science reveals the dynamics of the protein content of human milk. Innov. Food Sci. Emerg. Technol. 2022, 82, 103167. [Google Scholar] [CrossRef]
  22. Nunes, C.A.; Alvarenga, V.O.; de Souza Sant’Ana, A.; Santos, J.S.; Granato, D. The use of statistical software in food science and technology: Advantages, limitations and misuses. Food Res. Int. 2015, 75, 270–280. [Google Scholar] [CrossRef] [PubMed]
  23. Knights, V.; Kolak, M.; Markovikj, G.; Gajdoš Kljusurić, J. Modeling and Optimization with Artificial Intelligence in Nutrition. Appl. Sci. 2023, 13, 7835. [Google Scholar] [CrossRef]
  24. Langellier, B.A.; Bilal, U.; Montes, F.; Meisel, J.D.; de Cardoso, L.O.; Hammond, R.A. Complex Systems Approaches to Diet: A Systematic Review. Am. J. Prev. Med. 2019, 57, 273. [Google Scholar] [CrossRef]
  25. Ahmed, S.; de la Parra, J.; Elouafi, I.; German, B.; Jarvis, A.; Lal, V.; Lartey, A.; Longvah, T.; Malpica, C.; Vázquez-Manjarrez, N.; et al. Foodomics: A Data-Driven Approach to Revolutionize Nutrition and Sustainable Diets. Front. Nutr. 2022, 9, 874312. [Google Scholar] [CrossRef]
  26. Brodland, G.W. How computational models can help unlock biological systems. Semin. Cell Dev. Biol. 2015, 47–48, 62–73. [Google Scholar] [CrossRef]
  27. Atwell, K.; Dunn, S.J.; Osborne, J.M.; Kugler, H.; Hubbard, E.J.A. How computational models contribute to our understanding of the germ line. Mol. Reprod. Dev. 2016, 83, 944. [Google Scholar] [CrossRef]
  28. Sordo Vieira, L.; Laubenbacher, R.C. Computational models in systems biology: Standards, dissemination, and best practices. Curr. Opin. Biotechnol. 2022, 75, 102702. [Google Scholar] [CrossRef]
  29. Roman, M.; Olaru, S. Model-Based Design for Biosystems. Control Opportunities and Discrete-Time Modelling Challenges. IFAC-Pap. 2018, 51, 666–671. [Google Scholar] [CrossRef]
  30. Liu, C.; Ma, Y.; Zhao, J.; Nussinov, R.; Zhang, Y.C.; Cheng, F.; Zhang, Z.K. Computational network biology: Data, models, and applications. Phys. Rep. 2020, 846, 1–66. [Google Scholar] [CrossRef]
  31. Douard, V.; Ferraris, R.P. The role of fructose transporters in diseases linked to excessive fructose intake. J. Physiol. 2013, 591, 401–414. [Google Scholar] [CrossRef] [PubMed]
  32. Tappy, L.; Lê, K.A.; Tran, C.; Paquot, N. Fructose and metabolic diseases: New findings, new questions. Nutrition 2010, 26, 1044–1049. [Google Scholar] [CrossRef] [PubMed]
  33. Tappy, L.; Le, K.A. Metabolic effects of fructose and the worldwide increase in obesity. Physiol. Rev. 2010, 90, 23–46. [Google Scholar] [CrossRef] [PubMed]
  34. He, K.; Li, Y.; Guo, X.; Zhong, L.; Tang, S. Food groups and the likelihood of non-alcoholic fatty liver disease: A systematic review and meta-analysis. Br. J. Nutr. 2020, 124, 1–13. [Google Scholar] [CrossRef]
  35. Inci, M.K.; Park, S.H.; Helsley, R.N.; Attia, S.L.; Softic, S. Fructose impairs fat oxidation: Implications for the mechanism of western diet-induced NAFLD. J. Nutr. Biochem. 2023, 114, 109224. [Google Scholar] [CrossRef]
  36. Hengist, A.; Koumanov, F.; Gonzalez, J.T. Fructose and metabolic health: Governed by hepatic glycogen status? J. Physiol. 2019, 597, 3573–3585. [Google Scholar] [CrossRef]
  37. Rippe, J.M.; Angelopoulos, T.J. Sucrose, High-Fructose Corn Syrup, and Fructose, Their Metabolism and Potential Health Effects: What Do We Really Know? Adv. Nutr. 2013, 4, 236–245. [Google Scholar] [CrossRef]
  38. Koene, E.; Schrauwen-Hinderling, V.B.; Schrauwen, P.; Brouwers, M.C.G.J. Novel insights in intestinal and hepatic fructose metabolism: From mice to men. Curr. Opin. Clin. Nutr. Metab. Care 2022, 25, 354–359. [Google Scholar] [CrossRef]
  39. Roeb, E.; Weiskirchen, R. Fructose and Non-Alcoholic Steatohepatitis. Front. Pharmacol. 2021, 12, 634344. [Google Scholar] [CrossRef]
  40. Wang, D.D.; Li, Y.; Bhupathiraju, S.N.; Rosner, B.A.; Sun, Q.; Giovannucci, E.L.; Rimm, E.B.; Manson, J.A.E.; Willett, W.C.; Stampfer, M.J.; et al. Fruit and Vegetable Intake and Mortality Results From 2 Prospective Cohort Studies of US Men and Women and a Meta-Analysis of 26 Cohort Studies. Circulation 2021, 143, 1642–1654. [Google Scholar] [CrossRef]
  41. Aune, D.; Giovannucci, E.; Boffetta, P.; Fadnes, L.T.; Keum, N.N.; Norat, T.; Greenwood, D.C.; Riboli, E.; Vatten, L.J.; Tonstad, S. Fruit and vegetable intake and the risk of cardiovascular disease, total cancer and all-cause mortality—A systematic review and dose-response meta-analysis of prospective studies. Int. J. Epidemiol. 2017, 46, 1029–1056. [Google Scholar] [CrossRef] [PubMed]
  42. Liao, Y.; Davies, N.A.; Bogle, I.D.L. Computational Modeling of Fructose Metabolism and Development in NAFLD. Front. Bioeng. Biotechnol. 2020, 8, 537669. [Google Scholar] [CrossRef] [PubMed]
  43. Zi, Z. Sensitivity analysis approaches applied to systems biology models. IET Syst. Biol. 2011, 5, 336–346. [Google Scholar] [CrossRef]
  44. Qian, G.; Mahdi, A. Sensitivity analysis methods in the biomedical sciences. Math. Biosci. 2020, 323, 108306. [Google Scholar] [CrossRef]
  45. Marino, S.; Hogue, I.B.; Ray, C.J.; Kirschner, D.E. A methodology for performing global uncertainty and sensitivity analysis in systems biology. J. Theor. Biol. 2008, 254, 178–196. [Google Scholar] [CrossRef]
  46. Hartley, L.; Igbinedion, E.; Holmes, J.; Flowers, N.; Thorogood, M.; Clarke, A.; Stranges, S.; Hooper, L.; Rees, K. Increased consumption of fruit and vegetables for the primary prevention of cardiovascular diseases. Cochrane Database Syst. Rev. 2013, 2013, CD009874. [Google Scholar]
  47. Rakhra, V.; Galappaththy, S.L.; Bulchandani, S.; Cabandugama, P.K. Obesity and the Western Diet: How We Got Here. Mo. Med. 2020, 117, 536. [Google Scholar]
  48. López-Taboada, I.; González-Pardo, H.; Conejo, N.M. Western Diet: Implications for Brain Function and Behavior. Front. Psychol. 2020, 11, 564413. [Google Scholar] [CrossRef]
  49. Zhang, H.; Li, M.; Mo, L.; Luo, J.; Shen, Q.; Quan, W. Association between Western Dietary Patterns, Typical Food Groups, and Behavioral Health Disorders: An Updated Systematic Review and Meta-Analysis of Observational Studies. Nutrients 2024, 16, 125. [Google Scholar] [CrossRef]
  50. Kris-Etherton, P.M.; Petersen, K.S.; Hibbeln, J.R.; Hurley, D.; Kolick, V.; Peoples, S.; Rodriguez, N.; Woodward-Lopez, G. Nutrition and behavioral health disorders: Depression and anxiety. Nutr. Rev. 2021, 79, 247–260. [Google Scholar] [CrossRef]
  51. Bermudez, B.; Ortega-Gomez, A.; Varela, L.M.; Villar, J.; Abia, R.; Muriana, F.J.G.; Lopez, S. Clustering effects on postprandial insulin secretion and sensitivity in response to meals with different fatty acid compositions. Food Funct. 2014, 5, 1374–1380. [Google Scholar] [CrossRef] [PubMed]
  52. Dholariya, S.J.; Orrick, J.A. Biochemistry, Fructose Metabolism. In StatPearls [Internet]; StatPearls Publishing, 2022. Available online: https://www.ncbi.nlm.nih.gov/sites/books/NBK576428/ (accessed on 18 November 2024).
  53. Skenderian, S.; Park, G.; Jang, C. Organismal Fructose Metabolism in Health and Non-Alcoholic Fatty Liver Disease. Biology 2020, 9, 405. [Google Scholar] [CrossRef] [PubMed]
  54. Parry, S.A.; Turner, M.C.; Hodson, L. Lifestyle interventions affecting hepatic fatty acid metabolism. Curr. Opin. Clin. Nutr. Metab. Care 2020, 23, 373–379. [Google Scholar] [CrossRef]
  55. Bizeau, M.E.; Pagliassotti, M.J. Hepatic adaptations to sucrose and fructose. Metabolism. 2005, 54, 1189–1201. [Google Scholar] [CrossRef]
  56. Brouwers, M.C.G.J. Fructose 1-phosphate, an evolutionary signaling molecule of abundancy. Trends Endocrinol. Metab. 2022, 33, 680–689. [Google Scholar] [CrossRef]
  57. Aldámiz-Echevarría, L.; de las Heras, J.; Couce, M.L.; Alcalde, C.; Vitoria, I.; Bueno, M.; Blasco-Alonso, J.; Concepción García, M.; Ruiz, M.; Suárez, R.; et al. Non-alcoholic fatty liver in hereditary fructose intolerance. Clin. Nutr. 2020, 39, 455–459. [Google Scholar] [CrossRef]
  58. Simons, N.; Debray, F.G.; Schaper, N.C.; Kooi, M.E.; Feskens, E.J.M.; Hollak, C.E.M.; Lindeboom, L.; Koek, G.H.; Bons, J.A.P.; Lefeber, D.J.; et al. Patients With Aldolase B Deficiency Are Characterized by Increased Intrahepatic Triglyceride Content. J. Clin. Endocrinol. Metab. 2019, 104, 5056–5064. [Google Scholar] [CrossRef]
  59. Geidl-Flueck, B.; Hochuli, M.; Németh, Á.; Eberl, A.; Derron, N.; Köfeler, H.C.; Tappy, L.; Berneis, K.; Spinas, G.A.; Gerber, P.A. Fructose- and sucrose- but not glucose-sweetened beverages promote hepatic de novo lipogenesis: A randomized controlled trial. J. Hepatol. 2021, 75, 46–54. [Google Scholar] [CrossRef]
  60. Lodge, M.; Dykes, R.; Kennedy, A. Regulation of Fructose Metabolism in Nonalcoholic Fatty Liver Disease. Biomolecules 2024, 14, 845. [Google Scholar] [CrossRef]
  61. Simons, N.; Veeraiah, P.; Simons, P.I.H.G.; Schaper, N.C.; Kooi, M.E.; Schrauwen-Hinderling, V.B.; Feskens, E.J.M.; Van Der Ploeg, E.M.C.; Van Den Eynde, M.D.G.; Schalkwijk, C.G.; et al. Effects of fructose restriction on liver steatosis (FRUITLESS); a double-blind randomized controlled trial. Am. J. Clin. Nutr. 2021, 113, 391–400. [Google Scholar] [CrossRef]
  62. Sysoev, A. Sensitivity Analysis of Mathematical Models. Computation 2023, 11, 159. [Google Scholar] [CrossRef]
  63. Savatorova, V. Exploring Parameter Sensitivity Analysis in Mathematical Modeling with Ordinary Differential Equations. CODEE J. 2023, 16, 4. [Google Scholar] [CrossRef]
  64. Nguyen Quang, M.; Rogers, T.; Hofman, J.; Lanham, A.B. Global Sensitivity Analysis of Metabolic Models for Phosphorus Accumulating Organisms in Enhanced Biological Phosphorus Removal. Front. Bioeng. Biotechnol. 2019, 7, 234. [Google Scholar] [CrossRef]
  65. Carta, J.A.; Díaz, S.; Castañeda, A. A global sensitivity analysis method applied to wind farm power output estimation models. Appl. Energy 2020, 280, 115968. [Google Scholar] [CrossRef]
  66. Link, K.G.; Stobb, M.T.; Paola, J.D.; Neeves, K.B.; Fogelson, A.L.; Sindi, S.S.; Leiderman, K. A local and global sensitivity analysis of a mathematical model of coagulation and platelet deposition under flow. PLoS ONE 2018, 13, e0200917. [Google Scholar] [CrossRef]
  67. McDonald, A.G.; Tipton, K.F. Parameter Reliability and Understanding Enzyme Function. Molecules 2022, 27, 263. [Google Scholar] [CrossRef]
  68. Manheim, D.C.; Detwiler, R.L. Accurate and reliable estimation of kinetic parameters for environmental engineering applications: A global, multi objective, Bayesian optimization approach. MethodsX 2019, 6, 1398–1414. [Google Scholar] [CrossRef]
  69. Lagrotta, C.E.; Barbet, M.C.; Lei, L.; Burke, M.P. Towards a high-accuracy kinetic database informed by theoretical and experimental data: CH3 + HO2 as a case study. Proc. Combust. Inst. 2021, 38, 1043–1051. [Google Scholar] [CrossRef]
  70. Miskovic, L.; Béal, J.; Moret, M.; Hatzimanikatis, V. Uncertainty reduction in biochemical kinetic models: Enforcing desired model properties. PLoS Comput. Biol. 2019, 15, e1007242. [Google Scholar] [CrossRef]
  71. Bechmann, L.P.; Hannivoort, R.A.; Gerken, G.; Hotamisligil, G.S.; Trauner, M.; Canbay, A. The interaction of hepatic lipid and glucose metabolism in liver diseases. J. Hepatol. 2012, 56, 952–964. [Google Scholar] [CrossRef]
Figure 1. Distribution of macronutrients in meals: (a) proportion of carbohydrates in meals; (b) proportion of proteins in meals; (c) proportion of fats in meals () menu 1, () menu 2, () menu 3; (d) distribution of energy in meals; (e) percentage of macronutrients in daily energy intake () carbohydrates, () proteins, () fats (%).
Processes 13 00125 g001
Figure 2. Mathematical model of fructose metabolism in the CellDesigner software.
Processes 13 00125 g002
Figure 3. Dynamic change of fructose concentration after (a) breakfast, (b) brunch, (c) lunch, (d) snack, and (e) dinner according to meal 1 (−−), meal 2 (−−) and meal 3 (− −).
Processes 13 00125 g003aProcesses 13 00125 g003b
Figure 4. Dynamic change of fructose-1-phosphate concentration after (a) breakfast, (b) brunch, (c) lunch, (d) snack, and (e) dinner according to meal 1 (−−), meal 2 (−−) and meal 3 (− −).
Processes 13 00125 g004aProcesses 13 00125 g004b
Figure 5. Dynamic change of fatty acid concentration after (a) breakfast, (b) brunch, (c) lunch, (d) snack, and (e) dinner according to meal 1 (−−), meal 2 (−−) and meal 3 (− −).
Processes 13 00125 g005aProcesses 13 00125 g005b
Figure 6. Coefficients of the local parametric sensitivity (%) of the variables of the fructose metabolism model to an (a) increase in the value of the parameter by 3%, (b) decrease in the value of the parameter by 3%, (c) increase in the value of the parameter by 5% and (d) decrease in the value of the parameter by 5%. Simulations were performed with an initial fructose value of 30 µM for 120 min. Kinetic parameters are listed in order as presented in Table 2 (red color presents negative effect and green positive effect).
Processes 13 00125 g006aProcesses 13 00125 g006b
Figure 7. Coefficients of the local parametric sensitivity (%) of the reactions of the fructose metabolism model to an (a) increase in the value of the parameter by 3%, (b) decrease in the value of the parameter by 3%, (c) increase in the value of the parameter by 5% and (d) decrease in the value of the parameter by 5%. Simulations were performed with an initial fructose value of 30 µM for 120 min. Kinetic parameters are listed in order as presented in Table 2 (red color presents negative effect and green positive effect).
Processes 13 00125 g007aProcesses 13 00125 g007b
Table 1. Mass balances and initial values of the model variables [42].
Model VariableMass BalanceInitial Value
Fructose (Fru) d F r u d t = Τ F r u V K H K · F r u n F r u K m K H K n F r u + F r u n F r u · A T P n A T P K m A T P n A T P + A T P n A T P According to menu
Fructose-1-phosphate (F1P) d F 1 P d t = V K H K · F r u n F r u K m K H K n F r u + F r u n F r u · A T P n A T P K m A T P n A T P + A T P n A T P V a l d B · F 1 P n F 1 P K m F 1 P n F 1 P + F 1 P n F 1 P 0.2 µM
Dihydroxyacetone phosphate (DHAP) d D H A P d t = V a l d B · F 1 P n F 1 P K m F 1 P n F 1 P + F 1 P n F 1 P V T P I _ D H A P · D H A P n D H A P K m D H A P n D H A P + D H A P n D H A P + V T P I _ G A 3 P · G A 3 P n G A 3 P K m T P I G A 3 P n G A 3 P + G A 3 P n G A 3 P 15 µM
Glyceraldehyde (GA) d G A d t = V a l d B · F 1 P n F 1 P K m F 1 P n F 1 P + F 1 P n F 1 P V T r i · G A n G A K m G A n G A + G A n G A · A T P M g 2 n A T P M g 2 K m A T P M g 2 n A T P M g 2 + A T P M g 2 n A T P M g 2 · 1 β A T P A T P K i A T P + A T P · 1 β A D P A D P K i A D P + A D P 1500 µM
Glyceraldehyde-3-phosphate (GA3P) d G A 3 P d t = V T P I _ D H A P · D H A P n D H A P K m D H A P n D H A P + D H A P n D H A P V T P I _ G A 3 P · G A 3 P n G A 3 P K m T P I G A 3 P n G A 3 P + G A 3 P n G A 3 P + V T r i · G A n G A K m G A n G A + G A n G A · A T P M g 2 n A T P M g 2 K m A T P M g 2 n A T P M g 2 + A T P M g 2 n A T P M g 2 · 1 β A T P A T P K i A T P + A T P · 1 β A D P A D P K i A D P + A D P V P K · G A 3 P n G A 3 P K m G A 3 P n G A 3 P + G A 3 P n G A 3 P · A D P n A D P p k K m A D P p k n A D P p k + A D P n A D P p k · 1 β A C o A P K A C o A K i A C o A P K + A C o A + V P E P C K · P y r K m P E P C K + P y r · A T P K m A T P p e p c k + A T P · G T P K m G T P + G T P 480 µM
Pyruvate/Lactate (Pyr) d P y r d t = T L a c + V P K · G A 3 P n G A 3 P K m G A 3 P n G A 3 P + G A 3 P n G A 3 P · A D P n A D P p k K m A D P p k n A D P p k + A D P n A D P p k · 1 β A C o A P K A C o A K i A C o A P K + A C o A V P D C · P y r K m P y r + P y r · 1 β A C o A P D C A C o A A C o A + k i C o A p y r V P E P C K · P y r K m P E P C K + P y r · A T P K m A T P p e p c k + A T P · G T P K m G T P + G T P 1200 µM
Acetyl-CoA (ACoA) d A C o A d t = V P D C · P y r K m P y r + P y r · 1 β A C o A P D C A C o A A C o A + k i C o A p y r 8 · V F A S · A C o A K m A C o A + A C o A · A T P K m A T P f a s + A T P · 1 β F A F A F A + k i F A i n h i b + 8 · V b o x i · F A K m b o x i + F A · A T P K m A T P b o x i + A T P · 1 β b o x i A C o A A C o A + k i C o A b o x i · 1 β P P A R α F 1 P F 1 P + k i F 1 P i n h i b 40 µM
Fatty acids (FA) d F A d t = T F A + V F A S · A C o A K m A C o A + A C o A · A T P K m A T P f a s + A T P · 1 β F A F A F A + k i F A i n h i b V b o x i · F A K m b o x i + F A · A T P K m A T P b o x i + A T P · 1 β b o x i A C o A A C o A + k i C o A b o x i · 1 β P P A R α F 1 P F 1 P + k i F 1 P i n h i b 3 · V T G S · F A K m F A + F A · G A 3 P K m T G S G A 3 P + G A 3 P + 3 · V L p l y · T G K m T G + T G 50 µM
Triglycerides (TG) d T G d t = T T G + 3 · V T G S · F A K m F A + F A · G A 3 P K m T G S G A 3 P + G A 3 P 3 · V L p l y · T G K m T G + T G 1050 µM
Table 2. Values of the fructose model kinetic parameters [42].
Num.Kinetic ParametarValueNum.Kinetic ParametarValue
1 V K H K 4.5 µ M / s 29 n A D P p k
2 K m K H K 800 µ M 30 β A C o A P K 0.8
3 K m A T P 1430 µ M 31 K i A C o A P K 30
4nFru 32 V P E P C K 35 µ M / s
5nATP 33 K m P E P C K 500 µ M
6 V T P I _ D H A P 2.7 µ M / s 34 K m A T P p e p c k 10 µ M
7nDHAP 35 K m G T P 64 µ M
8 K m D H A P 590 µ M 36 V P D C 15 µ M / s
9 V T P I _ G A 3 P 0.05 µ M / s 37 K m P y r 540 µ M
10nGA3P138 β A C o A P D C 1
11 K m T P I G A 3 P 400 µ M 39 k i C o A p y r 35
12 V T r i 16.7 µ M / s 40 V F A S
13nGA141 K m A C o A 58 µ M
14 K m G A 18 µ M 42 K m A T P f a s 120 µ M
15 n A T P M g 2 143 β F A 1
16 K m A T P M g 2 770 µ M 44 k i F A i n h i b 300
17 β A T P 145 V b o x i 3.3 µ M / s
18 K i A T P 38046 K m b o x i 5 µ M
19 β A D P 147 K m A T P b o x i 87 µ M
20 K i A D P 110048 β b o x i 0.4
21 V a l d B 1.7 µ M / s 49 k i C o A b o x i 47.8
22 K m F 1 P 230 µ M 50 β P P A R α 1
23 n F 1 P 151 k i F 1 P i n h i b 100
24 V P K 87 µ M / s 52 V T G S
25 n G A 3 P 153 K m F A 645 µ M
26 K m G A 3 P 250 µ M 54 K m T G S G A 3 P 460 µ M
27 n A D P 155 V L p l y 0.085 µ M / s
28 K m A D P p k 240 µ M 56 K m T G 50715 µ M
Table 3. Meal plans with different proportions of fructose.
MenuMeals Components with Corresponding MassesFructose Mass (g)
Menu 1Breakfast: whole grain tortilla, (45 g), whole egg, (94 g), butter (5 g), spinach (50 g), fresh reduced fat cheese (30 g), yogurt (200 g)0.25 g
Brunch: integral toast (25 g), peanut butter (13.3 g), banana (154 g)7.8 g
Lunch: integral pasta (60 g), chicken white meat (150 g), champignons (250 g), cooking cream, 10% m.m. (200 g), olive oil (10 g)0.49 g
Snack: almonds (13.5 g), orange (176 g)4.2 g
Dinner: hake (150 g), white rice (60 g), peas (100 g), olive oil(5 g)0.1 g
Menu 2Breakfast: granola (40 g), Greek yogurt (150 g), raspberries (100 g), honey (8 g), flax seeds (9 g), squeezed orange juice (200 g)13.1 g
Brunch: wholemeal toast (50 g), marmalade (40 g), 6.3 g
Lunch: cream spinach soup (250 g), salmon (150 g), kale (150 g), potatoes (150 g), olive oil (10 g)1.8 g
Snack: vanilla ice cream (100 g), chocolate milk (200 g)11 g
Dinner: turkey white meat (150 g), quinoa (50 g), paprika (50 g), carrot (50 g), zucchini (50 g), red onion (50 g), olive oil (10 g)2 g
Menu 3Breakfast: corn flakes (40 g), milk (200 g), pear (130 g), grape juice, 100% (200 g)26.9 g
Brunch: croissant (50 g), mango (100 g)4 g
Lunch: Whopper burger (270 g), Burger King side salad (98 g), yogurt sauce (250 g), cooking cream, 10% m.m. (15.4 g), Coca-Cola (475 g)36.1 g
Snack: peanuts (20 g)0 g
Dinner: bottle of Sprite (500 g), drained canned tuna (100 g), canned chickpeas (150 g), paprika (100 g), cucumber (150 g), onion, red (50 g), honey (8 g), mustard (8 g), lemon juice (10 g)33.3 g
Disclaimer/Publisher’s Note: The statements, opinions and data contained in all publications are solely those of the individual author(s) and contributor(s) and not of MDPI and/or the editor(s). MDPI and/or the editor(s) disclaim responsibility for any injury to people or property resulting from any ideas, methods, instructions or products referred to in the content.

