Article

Performance Simulation and Experimental Verification of a Low-Temperature Differential Free-Piston Stirling Air Conditioner Under Multi-Harmonic Drive

1
College of Coal and Chemical Industry, Shaanxi Energy Institute, Xianyang 712000, China
2
School of Mechatronic Engineering, Xi’an Technological University, Xi’an 710021, China
*
Author to whom correspondence should be addressed.
Processes 2025, 13(1), 134; https://doi.org/10.3390/pr13010134
Submission received: 22 November 2024 / Revised: 25 December 2024 / Accepted: 31 December 2024 / Published: 6 January 2025
(This article belongs to the Section Energy Systems)

Abstract

:
This study seeks to improve the performance of a low-temperature differential free-piston Stirling air conditioner (FPSAC). To achieve this, a novel approach is proposed, which replaces the conventional simple harmonic drive with a multi-harmonic drive. This modification aims to optimize the motion of the driving piston, bringing it closer to the ideal movement pattern. The research involves both thermodynamic and dynamic coupling simulations of the FPSAC, complemented by experimental verification of its key performance parameters. A thermodynamic model for the gas medium, employing a quasi-one-dimensional dynamic approach for compressible fluids, and a nonlinear two-dimensional vibration dynamic model for the solid piston are developed, focusing on the low-temperature differential FPSAC physical model. The finite difference method is employed to numerically simulate the entire system, including the electromagnetic thrust of the multi-harmonic-driven linear oscillating motor, fluid transport equations, and the nonlinear dynamic equations of the power and gas control pistons. Variations in displacement, velocity, and pressure for each control volume at any given time are obtained, along with the indicator and temperature–entropy diagrams after the system stabilizes. The simulation results show that, in cooling mode, assuming no heat loss or mechanical friction, the Stirling cooler operates at a frequency of 80 Hz. Using the COPsin value for the simple harmonic drive as a baseline, performance is improved by altering the driving method. Under the multi-harmonic drive, the COPc5 increased by 10.03% and COPc7 by 14.23%. In heating mode, the COP under the multi-harmonic drive improved by 0.51% for COPh5 and 2.61% for COPh7. Performance experiments were conducted on the low-temperature differential FPSAC, and the key parameter test results showed good agreement with the simulation outcomes. The maximum deviation at the trough was found to be less than 2.45%, while at the peak, the maximum error did not exceed 3.61%. When compared to the simple harmonic drive, the application of the multi-harmonic drive significantly enhances the overall efficiency of the FPSAC, demonstrating its superior performance. The simulation analysis and experimental results indicate a significant improvement in the coefficient of performance of the Stirling cooler under the multi-harmonic drive at the same power level, demonstrating that the multi-harmonic drive is an effective approach for enhancing FPSAC performance. Furthermore, it should be noted that the method proposed in this study is applicable to other types of low-temperature differential free-piston Stirling air conditioners.

1. Introduction

Stirling cycle technology has attracted significant attention across various fields, including engines [1], heat pumps [2], and refrigeration systems [3], with several advancements already being applied in industrial settings. A free-piston Stirling device capable of both heating and cooling functions in room temperature environments is termed a low-temperature-difference free-piston Stirling air conditioning (FPSAC) system [4]. FPSAC, as an innovative air conditioning technology, offers numerous advantages such as high efficiency, low noise, and environmental friendliness. It is particularly suitable for applications where noise sensitivity and environmental requirements are high. One potential application of the FPSAC system is in the air conditioning systems of purely electric vehicles, where it meets the green and efficient requirements of electric vehicles. Currently, FPSAC has garnered widespread interest in research initiatives, such as the BEETIT project by the Energy Agency [5], Stirling-based air conditioning for extreme environments [6], and low-temperature-difference Stirling air conditioning systems [7,8,9].
The startup and stable operation of a free-piston Stirling engine are more complex and occur under more stringent conditions [10,11,12,13], making them one of the primary challenges faced by free-piston Stirling engines. In contrast to traditional engines, the FPSAC is driven by a linear oscillating motor, which powers both the power piston and the displacer. Consequently, the startup issue is no longer the primary challenge [13]. Investigating the key thermodynamic and dynamic parameters of the FPSAC is essential [14]. Due to the complex structure of the FPSAC, the displacer and power piston are coupled through gas forces [15], and its operation involves the coupling of thermodynamic, dynamic, and electromagnetic mechanics [16]. Notably, thermodynamic analysis is the most critical aspect. Furthermore, the temperature difference between the hot and cold chambers of the FPSAC is minimal, a stark contrast to the several hundred degrees Celsius temperature range seen in traditional Stirling technology. This small temperature difference involves irreversible thermodynamic processes, unsteady fluid flow, and unstable heat and mass transfer phenomena [17]. Of course, some scholars have analyzed the factors and mechanisms influencing the energy and thermal efficiency of the system [18,19,20], but these issues are not addressed in this paper.
Free-piston Stirling engines have primarily been studied as a distinct type of motion, with modeling approaches generally focusing on predicting the movement patterns of the power piston and displacer through linear dynamics analysis. This research typically relied on ideal or adiabatic cycle analysis while accounting for inherent loss mechanisms. Frankenstein laid the theoretical foundation for nodal analysis, which involves dividing the entire system into multiple subsystems. By considering heat, work, and mass exchange at the boundaries with the external environment, continuity, momentum, and energy equations were formulated for each subsystem and solved simultaneously. Due to the complexity of these equations, which include partial differential equations, numerical methods involving multiple iterations were employed to obtain instantaneous values and average parameters such as the pressure, temperature, and mass flow rate over a complete cycle [21]. Compared to ‘first-order’ and ‘second-order’ analysis methods, the ‘third-order’ method more effectively addresses spatial error issues, making it a more advanced technique. A comprehensive design calculation program using the finite element method was developed by Uriel. This model remains the most complete third-order model published in the literature, preserving the integral forms of conservation equations for mass, momentum, and energy [22]. Commonly used commercial software, such as SAGE, employs a one-dimensional analysis method and effectively manages spatial and temporal implicit control equations. However, it is not suitable for analyzing the transient startup process of the engine. In contrast, Schock developed a rigorous third-order computer model to address this limitation [23]. Goldberg developed a fully implicit third-order model for free-piston Stirling engines and derived a linear dynamics analysis model based on state space theory. This model included a turbulent flow model for the engine’s heat exchanger section and was validated against the experimental results from NASA’s space demonstration engine [24]. Andersen used an implicit one-dimensional model to simulate thermodynamic cycle processes, and the model demonstrated good correlation with the experimental results from the SM5 Stirling engine and the Twinbird free-piston cooler [25]. Deetlefs derived a ‘non-rigorous’ quasi-static third-order model and validated the results with the improved Beale B-10 engine from Sunpower [26]. Mohammad also developed an implicit third-order model, with the experimental results showing strong agreement with the theoretical analysis [27]. Despite the advanced nature of these ‘third-order’ analysis software packages, such as GLIMP and SAGE, the implicit solutions of the control equations required to obtain periodic solutions are unable to effectively simulate the transient startup process. A comparison of existing modeling methods shows that first- and second-order analyses are suitable for the preliminary design phase, as they can quickly offer theoretical insights; however, they are not capable of accurately predicting actual performance. Third- and fourth-order analyses are suitable for optimization design and industrial applications, offering more accurate performance evaluations. However, they require high computational demands, particularly fourth-order analysis, which necessitates extensive experimental validation and high-quality data support. These methods are typically applied in the optimization phase.
Many researchers recognized the importance of employing various driving technologies; however, these driving mechanisms primarily focus on sinusoidal motion, which differs significantly from ideal motion [28,29,30]. Scheunert et al. [31] investigated the non-sinusoidal motion of two pistons in an α-type engine and demonstrated a potential power increase of up to 50%. They further explored the enhancement of power by optimizing piston motion while considering the effects of mechanical friction [32,33]. These studies, based on internal reversible thermodynamic models, altered the dwell time of the piston at the top dead center (TDC) and bottom dead center (BDC). The common outcome of both studies is that optimizing piston motion leads to an increase in power output. Reference [34] discussed the impact of geometric variables in diamond drive on performance. This theoretical study, based on an isothermal model, indicated that the optimal phase angle had a positive effect on power and thermal efficiency due to the reduction in unproductive volume. Briggs [35] conducted an isothermal analysis of the ideal engine and showed that the use of ideal piston and gas control piston waveforms increased the power density of the Stirling engine, with the extent of the increase depending on the constraint method. Experimental data indicated that by superimposing second or third harmonics onto the original simple harmonic piston waveform, the engine could generate up to 14% additional power while operating outside the same piston motion limits. Craun et al. [36] proposed the active control of the displacement piston in a β-type Stirling engine. Using Schmidt’s isothermal method, they aimed to increase the mechanical power and achieved a power increase of approximately 42% through displacement piston control. They also noted that this improvement occurred with non-sinusoidal motion, which exhibited a higher harmonic content. Wong et al. [37] experimentally investigated the impact of non-sinusoidal motion on the performance of a γ-type Stirling engine. They conducted experiments by driving the two pistons using the cam profiles of the flywheels on both sides. Through tests with different cam profiles, they achieved up to a 36% improvement in thermal efficiency compared to sinusoidal piston motion. Karabulut et al. [38] conducted a thermodynamic analysis of the α-type Stirling engine. They noted that heating under constant volume conditions could improve thermal efficiency by up to 25%. Erkan [39] used a cycloidal drive mechanism to achieve the ideal piston trajectory for a β-type Stirling engine. The optimization aimed to improve the constant-volume heating and cooling processes, as well as the isothermal compression and expansion processes, with the cycle work also serving as an optimization objective. Compared to the crank mechanism, the near-ideal piston trajectory resulted in a 10% increase in cycle work, while some non-ideal trajectories led to a maximum cycle work improvement of 14%. The above studies focused solely on the theoretical optimization of piston motion or were centered on FPSE, without proposing specific mechanisms for low-temperature differential FPSAC.
Through the review of the existing literature, two major gaps have been identified. Firstly, there is limited research on the driving characteristics of the linear oscillating motor in FPSAC, particularly regarding the relationship between sinusoidal drive and the ideal (or near-ideal) startup behavior. The influence of these two driving methods on key parameters, such as power output in FPSAC, requires further investigation. Secondly, compared to traditional Stirling heat pumps and engines, the temperature difference between the hot and cold chambers of a low-temperature-difference free-piston Stirling air conditioner is typically less than tens of kelvins, resulting in relatively lower efficiency and output power.
This study addresses the above two research gaps by focusing on improving the performance of low-temperature-difference FPSAC. A combination of theoretical modeling, numerical simulation, and experimental research is employed to conduct an in-depth investigation into the performance of low-temperature-difference FPSAC under multi-harmonic driving. The main innovations of this study are as follows: (1) A quasi-one-dimensional dynamic-thermodynamic model for compressible flow and a two-dimensional nonlinear vibration dynamic model are established for the low-temperature-difference FPSAC physical model. These models reveal the coupling behavior between the thermodynamic and dynamic parameters of the Stirling air conditioner during the steady-state operation phase. (2) To achieve a motion pattern of the displacer closer to ideal motion, a composite harmonic driving approach for low-temperature-difference FPSAC is proposed and implemented. Under the same power input, the performance coefficient of the low-temperature-difference Stirling air conditioner improves with composite harmonic driving, demonstrating that this driving method is an effective way to enhance FPSAC performance.

2. Derivation of the Numerical Model

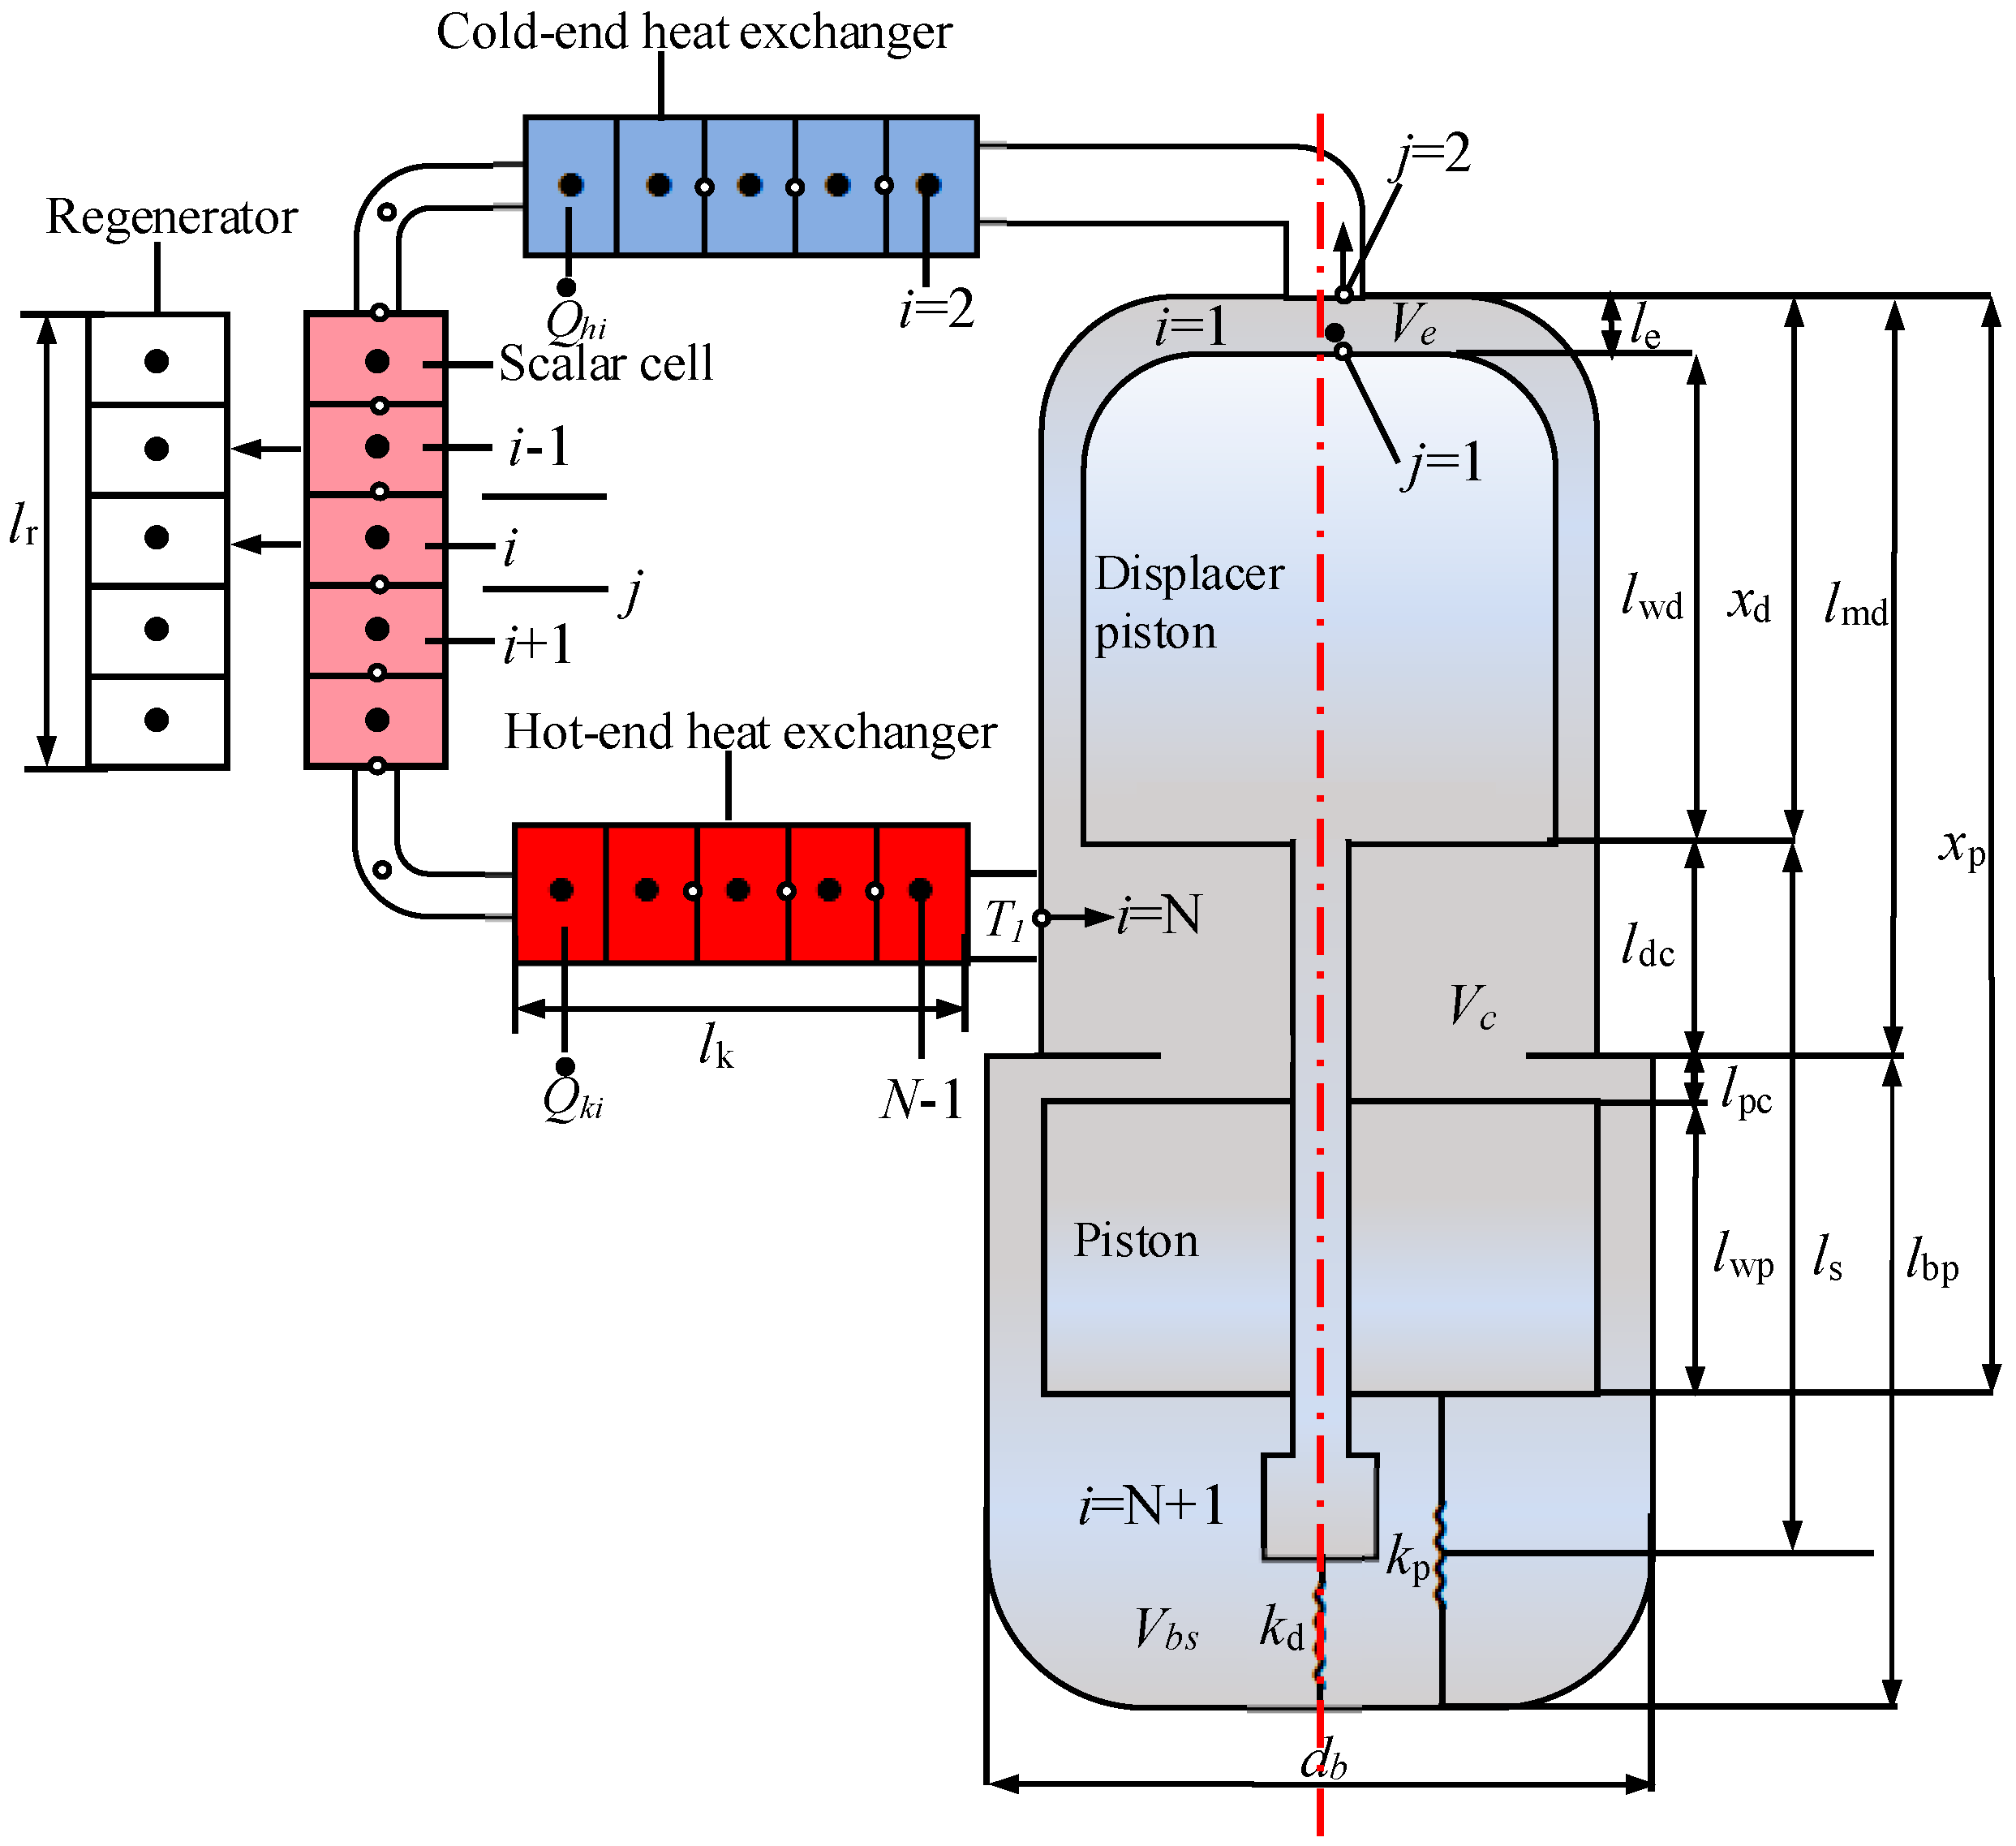
This study focuses specifically on a low-temperature-difference FPSAC. The FPSAC system comprises a linear oscillating motor, displacer, power piston, regenerator, cold-end heat exchanger, and hot-end heat exchanger. The linear oscillating motor drives the reciprocating motion of the power piston, which is coupled to the displacer through gas forces. This coupling enables the completion of the Stirling cycle, facilitating cooling or heating within the working chamber. A three-dimensional diagram of the entire FPSAC model is presented in Figure 1.

2.1. Physical Model of the FPSAC

The working process of the FPSAC is exceptionally complex, involving irreversible electromagnetism, thermodynamics, unsteady three-dimensional gas flow, and unstable heat and mass transfer processes [40]. Moreover, the heat transfer process in the key component of the FPSAC, the regenerator, is highly intricate, encompassing oscillatory flow, radial heat transfer, and other factors [41,42,43]. As a result, obtaining exact solutions for these unsteady processes is highly challenging, necessitating simplifications in the overall system model. The following assumptions were made in deriving the fundamental equations for simulating the operating process of the FPSAC system [44]: (1) The thermodynamic and dynamic parameters of the working fluid are uniform across any cross-section perpendicular to the flow direction. (2) A quasi-one-dimensional steady-flow model is used to study the unsteady flow within the working chamber of the FPSAC. (3) The pressure drop in the flow is neglected. (4) The surface temperature of the regenerator matrix is assumed to be equal to the internal temperature. (5) The kinetic energy of the gas is neglected. (6) It is assumed that the wall temperatures of the high-temperature heat exchanger, thermal cavity, and cold cavity, except for the regenerator, remain constant. (7) The heat conduction of the gas along the axial direction is negligible. To accurately simulate the operation of the FPSE from first principles, a quasi-one-dimensional compressible flow model was established based on fundamental thermodynamic and kinematic theories, as described by De la Bat [45]. The thermodynamic modeling approach for the working fluid is based on sequentially applying the conservation equations for mass, momentum, and energy to a discrete array of one-dimensional finite control volumes (cells), as illustrated in Figure 2. The novelty of this modeling approach lies in the fact that it only requires setting the hot- and cold-end temperatures as boundary conditions and the electromagnetic thrust of the linear motor as the input. Subsequently, the time-varying dynamics of the Stirling air conditioner, including the displacement, velocity, pressure, and other key thermodynamic–dynamic parameters, are output as instantaneous simulation results.

2.2. Physical Model of the FPSAC Derivation of the Numerical Model

Figure 2 illustrates the division of both the working fluid and metal walls into multiple control volumes within the Stirling air conditioner. The center of each control volume was designated as i, with values ranging from 1 to N. The expansion chamber (i = 1) and the compression chamber (i = N) were represented as adiabatic control volumes with moving boundaries. The backspace was labeled as N + 1 and treated as a single control volume, Vbs, with no convective heat loss to the surroundings (Qbs = 0). The hot end was maintained at a constant temperature Th, and the cold end was maintained at a constant temperature Tw. Axial conduction through the metal walls of the Stirling air conditioner was neglected.
The control volumes for the working fluid, referred to as scalar cells, were defined as regions containing a finite mass with uniform thermodynamic properties, including density, pressure, and temperature. These control volumes were indexed by the subscript ‘i’, and the centers of the units were denoted by ‘•’ (solid black dot). The working fluid control volumes, also referred to as scalar cells (e), were defined as containing a finite mass and thermal energy. Mass and energy conservation principles were applied to each scalar control volume, enabling the calculation of the mass and internal energy for each unit over time steps as the simulation progressed. The ideal gas law was applied to each scalar cell to relate the density and temperature to the local pressure. These variables were stored at the centers of the cells, though they exhibited discontinuities at the interfaces between adjacent cells. At the interface between two consecutive advecting control volumes, a boundary node, denoted by the subscript j, was defined. The boundary nodes determined the magnitude and direction of the fluid flow, which resulted from pressure imbalances between the adjacent upstream and downstream scalar control volumes. The gas momentum balance equation was applied to the so-called vector control volumes, which were staggered backward around the boundary nodes, in order to calculate the fluid velocity at the interfaces of the scalar units [46].

2.3. Governing Transport Equations

As outlined by Bird, the transport equations for the working fluid are derived from the principles of the conservation of the mass, momentum, and energy [47]. Using the Gauss divergence theorem, the transport equations are spatially integrated over a one-dimensional fluid volume, resulting in solvable finite difference equations in the integral form for the mass, momentum, and energy. Hence, by applying Euler time integration, finite difference equations are obtained to calculate the mass, momentum, and thermal energy within the control volume at the subsequent time step t + dt. By applying the ideal gas law as the equation of state, the volume, mass, and temperature of the working fluid are related to the pressure in each control volume. To simulate heat transfer and fluid friction, appropriate empirical formulas are used in each heat exchanger section of the FPSAC.

2.3.1. The Electromagnetic Thrust of a Permanent Magnet Linear Oscillation Motor Under Multi-Harmonic Drive

According to magnetostatic energy theory, the electromagnetic force of the motor is equal to the partial derivative of the magnetostatic energy with respect to displacement, while keeping the winding current constant, i.e.,
F E = W ( i , x ) x i = c o n s tant
where FE is the electromagnetic force, and W ( i , x ) represents the magnetostatic energy, which is a function of the winding current and the mover’s position [48,49]:
F E = ( B p m + B p m 1 ) N w l r i
Among them, Bpm represents the magnetic flux density produced by the permanent magnet; Bpm1 represents the magnetic flux density produced by the permanent magnet at the air gap; Nw is the number of turns in the coil; lr is the circumference of the outer circle of the permanent magnet; lr = 2πR2, R2 is the outer diameter of the permanent magnet; i is the magnitude of the current flowing through the motor. The electromagnetic thrust of the linear oscillation motor under the multi-harmonic drive is given by.
In this context, Bpm represents the magnetic flux density produced by the permanent magnet, while Bpm1 denotes the magnetic flux density generated by the permanent magnet at the air gap. Nw is the number of turns in the coil, and lr is the circumference of the outer circle of the permanent magnet, given by lr = 2πR2, where R2 is the outer diameter of the permanent magnet. The variable i represents the current magnitude flowing through the motor. The electromagnetic thrust of the linear oscillation motor under the multi-harmonic drive is expressed as follows [50].
F E ( t ) = ( B p m + B p m 1 ) N w l r [ A 1 sin ( ω 0 t ) + A 2 sin ( 3 ω 0 t ) + A 3 sin ( 5 ω 0 t ) + A n sin ( 2 n 1 ) ω 0 t ]
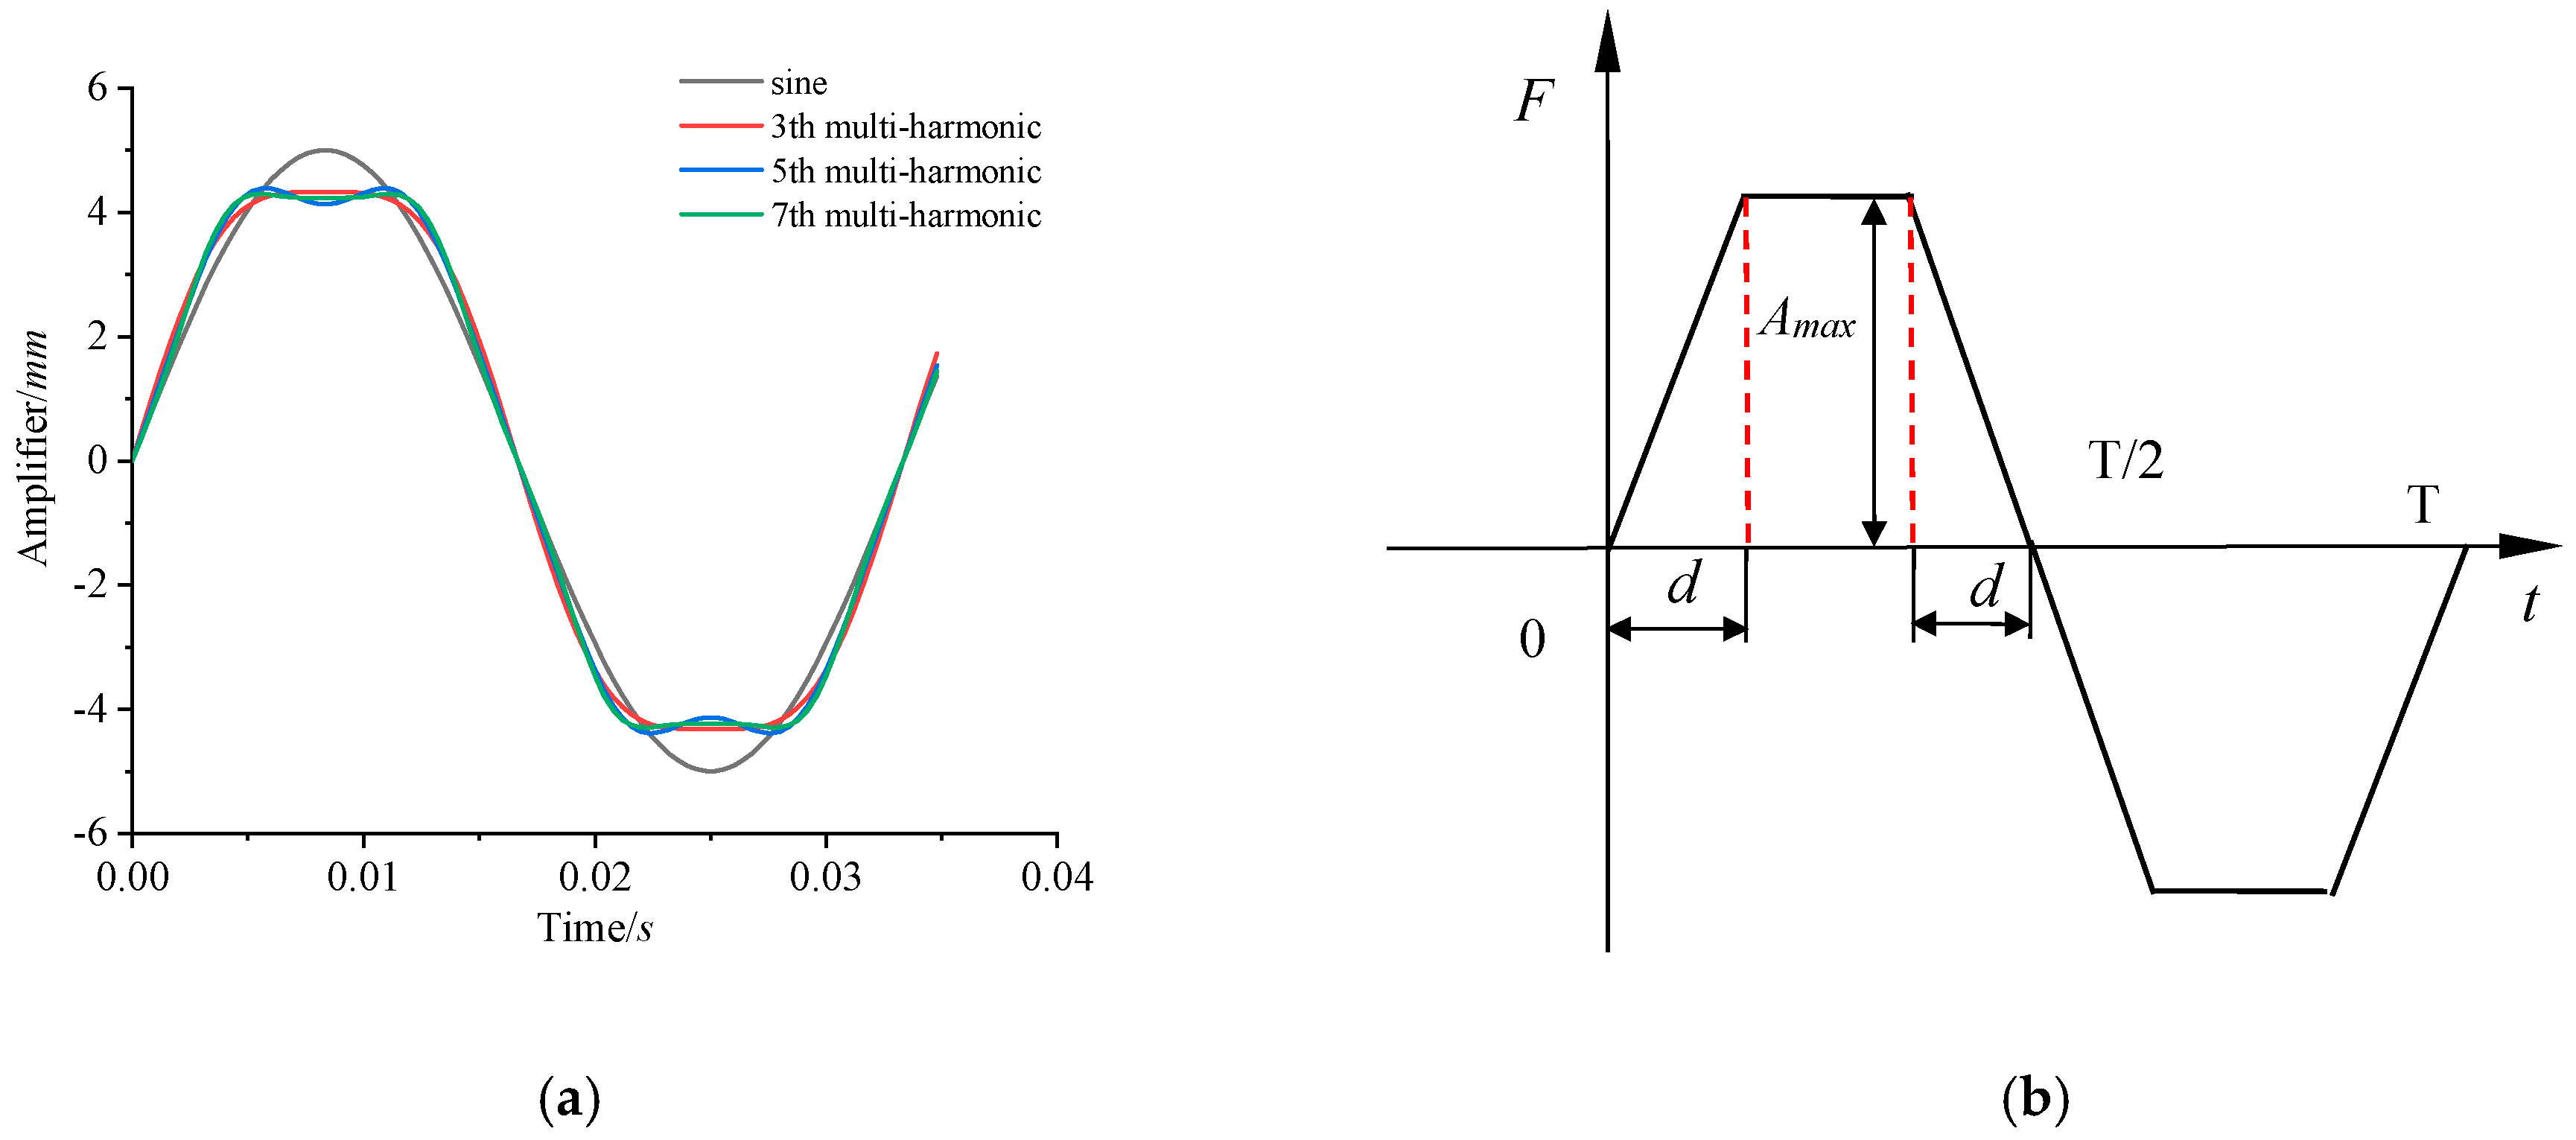
When n > 3, the influence of higher-order harmonics on the multi-harmonic waveform becomes negligible and can be ignored. Consequently, this study focuses on orders n ≤ 3. In this context, when the power piston is driven by the multi-harmonic drive of the linear oscillation motor, most of the heat generated by the FPSAC is primarily carried by the fundamental harmonic.
The multi-harmonic waveforms lie between ideal waveforms and simple harmonic waveforms. By superimposing the third, fifth, seventh, or even higher-order simple harmonic waves on the original simple harmonic wave, multi-harmonic waveforms can be obtained. The more harmonics are superimposed, the closer the resulting waveform is to the ideal motion. As the multi-harmonic waveform approaches the ideal waveform, the output power diagram becomes increasingly similar to the ideal power diagram. This is the principle behind improving the pressure ratio and, consequently, the FPSAC performance through the use of multi-harmonic waveforms. Figure 3 illustrates the waveforms of simple harmonic and multi-harmonic waves at different harmonic orders. As the order of the multi-harmonic wave increases, its waveform becomes closer to the ideal waveform. Figure 3a displays the multi-harmonic waveform and Figure 3b shows the ideal waveform.

2.3.2. Discretization of the Thermodynamic-Dynamic Control Equations by the Finite Differences

(1)
Conservation of mass
The rate of finite mass change within a finite control volume i can be expressed discretely as follows:
Δ m i Δ t = ρ j v j A j ρ j + 1 v j + 1 A j + 1
The density ρj is determined using first-order upwind differencing, while the cross-sectional velocity vj is derived from the momentum equation. The contact area between the fluids is represented as Aj. Applying Euler integration, the mass at each time step is given by the following:
m i t + Δ t = m i t + Δ t [ ρ j v j A j ρ j + 1 v j + 1 A j + 1 ] t
here, Δt represents the finite time step, and the superscript t denotes variables that have already been computed from the previous time step.
(2)
Conservation of momentum
The momentum control equation, which incorporates the finite rate of momentum change within the vector control volume j, is expressed in discrete form as follows:
Δ Δ t ( m j v j ) = [ ρ i 1 v i 1 2 A x i 1 ρ i v i 2 A x i ] + [ p i 1 p i ] A j [ τ i 1 A z i 1 2 + τ i A z i 2 ]
where fluid mass mj consists of half the neighboring scalar control volume masses over which the control volume is staggered. The fluid velocity vi is calculated using a linear interpolation of volumetric flow between the neighboring interface velocities vj and vj+1. Here, Aj denotes the fluid-to-fluid interface area, Az is the wet flow area parallel to the velocity, and Ax represents the cross-sectional flow area perpendicular to the velocity.
The shear stress τi acting over the cell is computed as a function of an empirically related skin coefficient of friction Cf, given by the following:
The shear stress τi acting on the cell is calculated as a function of the empirically derived skin friction coefficient Cf, expressed as follows:
τ i = 1 2 C f i ρ i v i v i
Using Eulerian time integration, the velocity at subsequent time steps is provided in a fully explicit form as follows:
v j t + Δ t = ( m j v j ) t + Δ t [ D M + D P + D F ] t m j t + Δ t
Here, DM, DP, and DF correspond to the first, second, and third terms of Equation (6), respectively.
D M = ρ i 1 v i 1 2 A x i 1 ρ i v i 2 A x i D P = [ p i 1 p i ] A j D F = [ τ i 1 A z i 1 2 + τ i A z i 2 ]
(3)
Conservation of energy
The finite rate of internal energy change within scalar control volume i is expressed in discrete form as follows:
Δ Δ t ( m i e i ) = [ ρ j e j A j v j ρ j + 1 e j + 1 A j + 1 v j + 1 ] + p i [ A j v j A j + 1 v j + 1 ] + Q ˙ n e t + W ˙ b + τ f i A z i v i
In this case, the specific internal energy uj at the interface of the control volume is obtained using first-order upwind differencing, Q ˙ n e t represents the net heat transfer rate from the surroundings to the working fluid, W ˙ b represents the net rate of work performed on the working fluid by the power piston and the displacer, and for the expansion chamber, the boundary work is given by the following equation:
W ˙ b i = 1 = p 1 A d v d W ˙ b i = N = p N [ v p ( A p A s ) v d A d )
Additionally, in Equation (10), τ f i A z i v i accounts for the irreversible increase in internal energy due to viscous dissipation, which results from surface friction that is independent of the flow direction. However, this heat energy conversion through viscous dissipation is found to be insignificant compared to the external heat transfer processes occurring within each heat exchanger unit.
( m i e i ) t + Δ t = ( m i e i ) t + Δ t [ D M e + Q ˙ n e t + D P e + W ˙ b + D F e ] t
where DMe, DPe, and DFe represent the first, second, and fifth terms of Equation (10), respectively.
The heat transfer area of the vector unit is calculated as the average of the cross-sectional scalars of the adjacent surfaces.
A j ( i ) = 1 2 [ A x i ( i 1 ) + A x i ( i ) ]
the heat transfer area Aj is associated with Dp in the mass and momentum conservation equations, and with DMe and DPe in the energy conservation equation.
The mass within the heat exchanger is proportional to its initial volume. The volumes of the expansion and compression chambers are related as follows:
V e = ( x d l w d ) A d V c = ( x p l d c l e l w d l w p ) ( A p A s ) + ( l d c + l e + l w d x d ) ( A d A s )
Volume variations lead to changes in density, which subsequently influence pressure variations. Consequently, the densities within the expansion and compression chambers are as follows:
ρ i e = m i / V e ρ i c = m i / V c
Applying the ideal gas law as the equation of state, the pressure within the control volume is expressed as follows:
p i e t + Δ t = ρ i e t + Δ t R g t + Δ t T i t + Δ t p i c t + Δ t = ρ i c t + Δ t R g t + Δ t T i t + Δ t
Here, the temperature Ti is related to the internal energy ei. The specific heat equation, when applied in its fully explicit form, gives the following:
T i t + Δ t = T i t + ( e i t + Δ t e i t ) / c v
Based on thermodynamic principles, the relationship between the specific heat capacity at constant pressure cp and at constant volume cv is expressed as follows:
c p = c v + T ( v ( T , p ) T ) ( p ( v , T ) T )
By substituting the ideal gas equation of state into the above expression, we obtain the following:
c p = c v + R
Thus, the differential equation for entropy is given by the following:
s ˙ = 1 T m R ( c v V p ˙ + c p p V ˙ )

2.3.3. Calculation of Heat Transfer and Fluid Friction Coefficient in the Heat Exchanger

(1)
Heat transfer in cold-end heat exchangers and hot-end heat exchangers
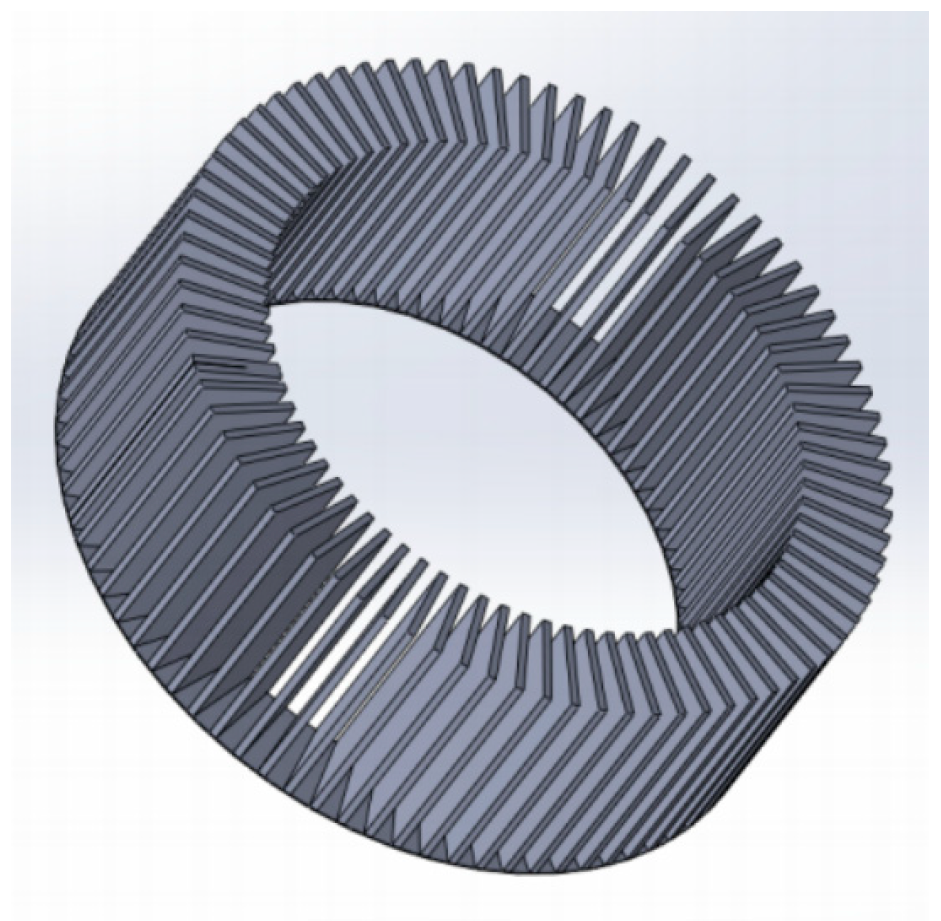
For the heat exchangers used in Stirling air conditioners, the channels of both the cold-and hot-end heat exchangers are modeled as fins with equal cross-sectional areas for the purpose of computational analysis. Each fin has a length of 4.4 mm, a width of 0.3 mm, and a height of 12.5 mm, with a total of 90 fins arranged in a circular pattern, as shown in Figure 4. These fins play a crucial role in regulating the wall temperature by increasing the contact area with the fluid, thereby reducing convective heat transfer resistance and improving the temperature differential between the compression and expansion chambers. Based on the heat transfer calculation formula for fins with equal cross-sectional areas, the heat transfer rate Q ˙ n e t for both the cold- and hot-end heat exchangers was calculated as follows:
Q ˙ n e t = λ A m ( T 0 T f ) t h ( m H )
where λ was the thermal conductivity of the fin material, δ was the thickness of the fin, H was the height of the fin, and the cross-sectional area of the fin A = l δ, p = 2(l + δ), m 2 = h P λ A , T0 was the temperature at the base of the fin, and Tf was the temperature of the surrounding fluid; th(mH) was the hyperbolic tangent function, and the expression was as follows:
t h ( m H ) = e m H e m H e m H + e m H
The discretized expression for the heat transfer rate of both the cold-end and the single-tube heat exchangers at the hot end is derived from Equation (23) as follows:
Q ˙ n e t , i = λ A i m ( T 0 , i T f , i ) t h ( m H i )
The total heat transfer for the entire heat exchanger is the product of the heat transfer of a single unit and the number of units, N.
(2)
The friction factor Cf of the fluid within the heat exchanger
The fluid’s friction factor Cf is determined as a function of the Reynolds number Ref. The expression for the Reynolds number is given by the following:
Re f = ρ i v i Δ x h / μ
Here, μ represents the dynamic viscosity of the fluid, and the friction factor Cf is calculated using an empirical formula [51].
C f = 16 Re f 1 64 / Re f 1 < Re f 2000 0.3164 Re f 0.25 2000 < Re f 100000 0.184 Re f 0.2 Re f > 100000
(3)
The heat transfer rate Q of the regenerator
The regenerator matrix, unlike other thermodynamic subsystems in the Stirling air conditioner, can be simplified as a capillary porous medium, as illustrated in Figure 5. The thermal balance equation for the regenerator matrix is discretized as shown below:
d T w i d t = 1 ρ m C m A m [ λ m i A m i Δ x i ( T w i + 1 T w i Δ x i + 1 T w i T w i 1 Δ x i ) + α i ( T T w i ) α H i
At times t = 0 and t = π, the thermodynamic parameters are equal at the beginning and end of the working cycle, during which α H = d A H d x is the heat transfer area per unit length of the base.
Q ˙ r _ n e t , i = α A z , i ( T w , i T i )
therefore, Equations (4), (6), (10) and (26) form the basic set of control equations for the FPSAC together as follows:
(4)
Iterative formula for temperature change in the regenerator matrix
T w i ( k + 1 ) = T w i ( k ) + Δ t ρ m C m A m [ λ m i A m i Δ x i ( T w i + 1 ( k ) T w i ( k ) Δ x i + 1 T w i ( k ) T w i 1 ( k ) Δ x i ) + α i ( T i ( k + 1 ) T w i ( k ) ) α H i ]
For a single tube in the regenerator, the heat transfer per unit is calculated using Newton’s law of cooling.
Q ˙ r _ n e t , i = α A z , i ( T w , i T i )
the total heat transfer for the entire regenerator is the product of the heat transfer rate of a single tube and the number of units, N.
(5)
Boundary temperature of the control volume
Given the number of variables, the current system of equations is not yet closed. To resolve this, the relationship between the boundary temperature and the unit temperatures must be defined. When the boundary temperature is approximated as the average of the adjacent unit temperatures, it may result in numerical instability in the solution. This is because the choice of the control volume boundary temperature not only influences the computational accuracy but also affects the stability of the numerical solution. Applying an improved upwind differencing method can help mitigate instability. As depicted in Figure 6, it is assumed that the working fluid within the regenerator exhibits the same axial temperature gradient as the matrix, let m ˙ i * > 0 , and take the integration step size as Δt. Within the interval Δt, the mass of the working fluid that will flow through the i boundary surface into the i control volume is m ˙ i * Δ t , as indicated by the shaded part in the figure. Clearly, it is more reasonable to use the average temperature of this mass as the temperature of the fluid passing through the i-th interface. Therefore, we have the following:
T v , i = T s , i 1 1 2 Δ T s , i 1 + m ˙ i * m i 1 1 2 Δ T s , i 1 ,    m ˙ i * 0 T v , i = T s , i + 1 2 Δ T s , i + m ˙ i * m i 1 2 Δ T s , i ,    m ˙ i * 0 m ˙ i * = A v , i ρ v , i v v , i
Substituting m ˙ i * into Equation (30), we obtain the following:
T v , i = T s , i 1 1 2 Δ T s , i 1 + A v , i ρ v , i v v , i m i 1 1 2 Δ T s , i 1 ,    A v , i ρ v , i v v , i 0 T v , i = T s , i + 1 2 Δ T s , i + A v , i ρ v , i v v , i m i 1 2 Δ T s , i ,    A v , i ρ v , i v v , i 0
(6)
Fluid Friction Factor Cf in the Capillary Tubes of the Regenerator
The friction factor Cf can be given by the Ergun equation with a ‘correction’ parameter [52]:
C f = 64 Re f 1 1 4 ( 129 / Re f + 2.91 / Re f 0.103 ) Re f > 1

2.3.4. Discretization of Two-Dimensional Nonlinear Dynamics Equations

The displacer and power piston are treated as moving rigid bodies, each connected to the engine casing by a single mechanical flexible spring. By applying Newton’s second law and employing Euler integration, the instantaneous relationships for velocity and displacement are derived, which then lead to the motion control equations [45].
The pressures acting on the compression chamber and expansion chamber are represented by Pc(AdAs) and PeAd, respectively. The backspace pressure is PbsAs, and the spring force is KdΔxd. There is a friction force τdpAzs between the displacer shaft and the piston, and there is also a fluid shear friction τdAzd between the displacer and the port. Ignoring gravity, the forces acting on the power piston include the compression force and the backspace pressure, represented by (PcPbs)(AdAs), the spring force KpΔxp, and the electromagnetic force Fm exerted by the linear motor on the power piston (see Equation (3)). The net body force acting on the displacer and piston in the positive x-direction is given by the following:
F d = P e A d P c ( A d A s ) P b s A s K d Δ x d τ d p A z s τ d A z d F p = ( P c P b s ) ( A d A s ) K p Δ x p + τ d p A z s τ p A z p + F m
The discretized expression is presented as follows:
( F d ) ( k ) = P e ( k ) A d P c ( k ) ( A d A s ) P b s ( k ) A s K d x d ( k ) C d p v d ( k ) v p ( k ) C d v d ( k ) ( F p ) ( k ) = ( P c ( k ) P b s ( k ) ) ( A d A s ) K p ( Δ x p ) ( k ) + C d p v d ( k ) v p ( k ) C p v p ( k ) + F m ( k )
Integrating the force balance equation for the displacer and the piston over time, assuming the acceleration of the piston is constant over a finite time step, the velocity at the time step is as follows:
v d ( k + 1 ) = v d ( k ) + Δ t ( F d m d ) ( k ) v p ( k + 1 ) = v p ( k ) + Δ t ( F p m p ) ( k )
By temporally integrating the velocity profiles, the following time-step displacements are obtained:
x d ( k + 1 ) = x d ( k ) + ( Δ t ) v d ( k ) + ( Δ t ) 2 2 ( F d m d ) ( k ) x p ( k + 1 ) = x p ( k ) + ( Δ t ) v p ( k ) + ( Δ t ) 2 2 ( F p m p ) ( k )

2.4. Simulation of the FPSAC

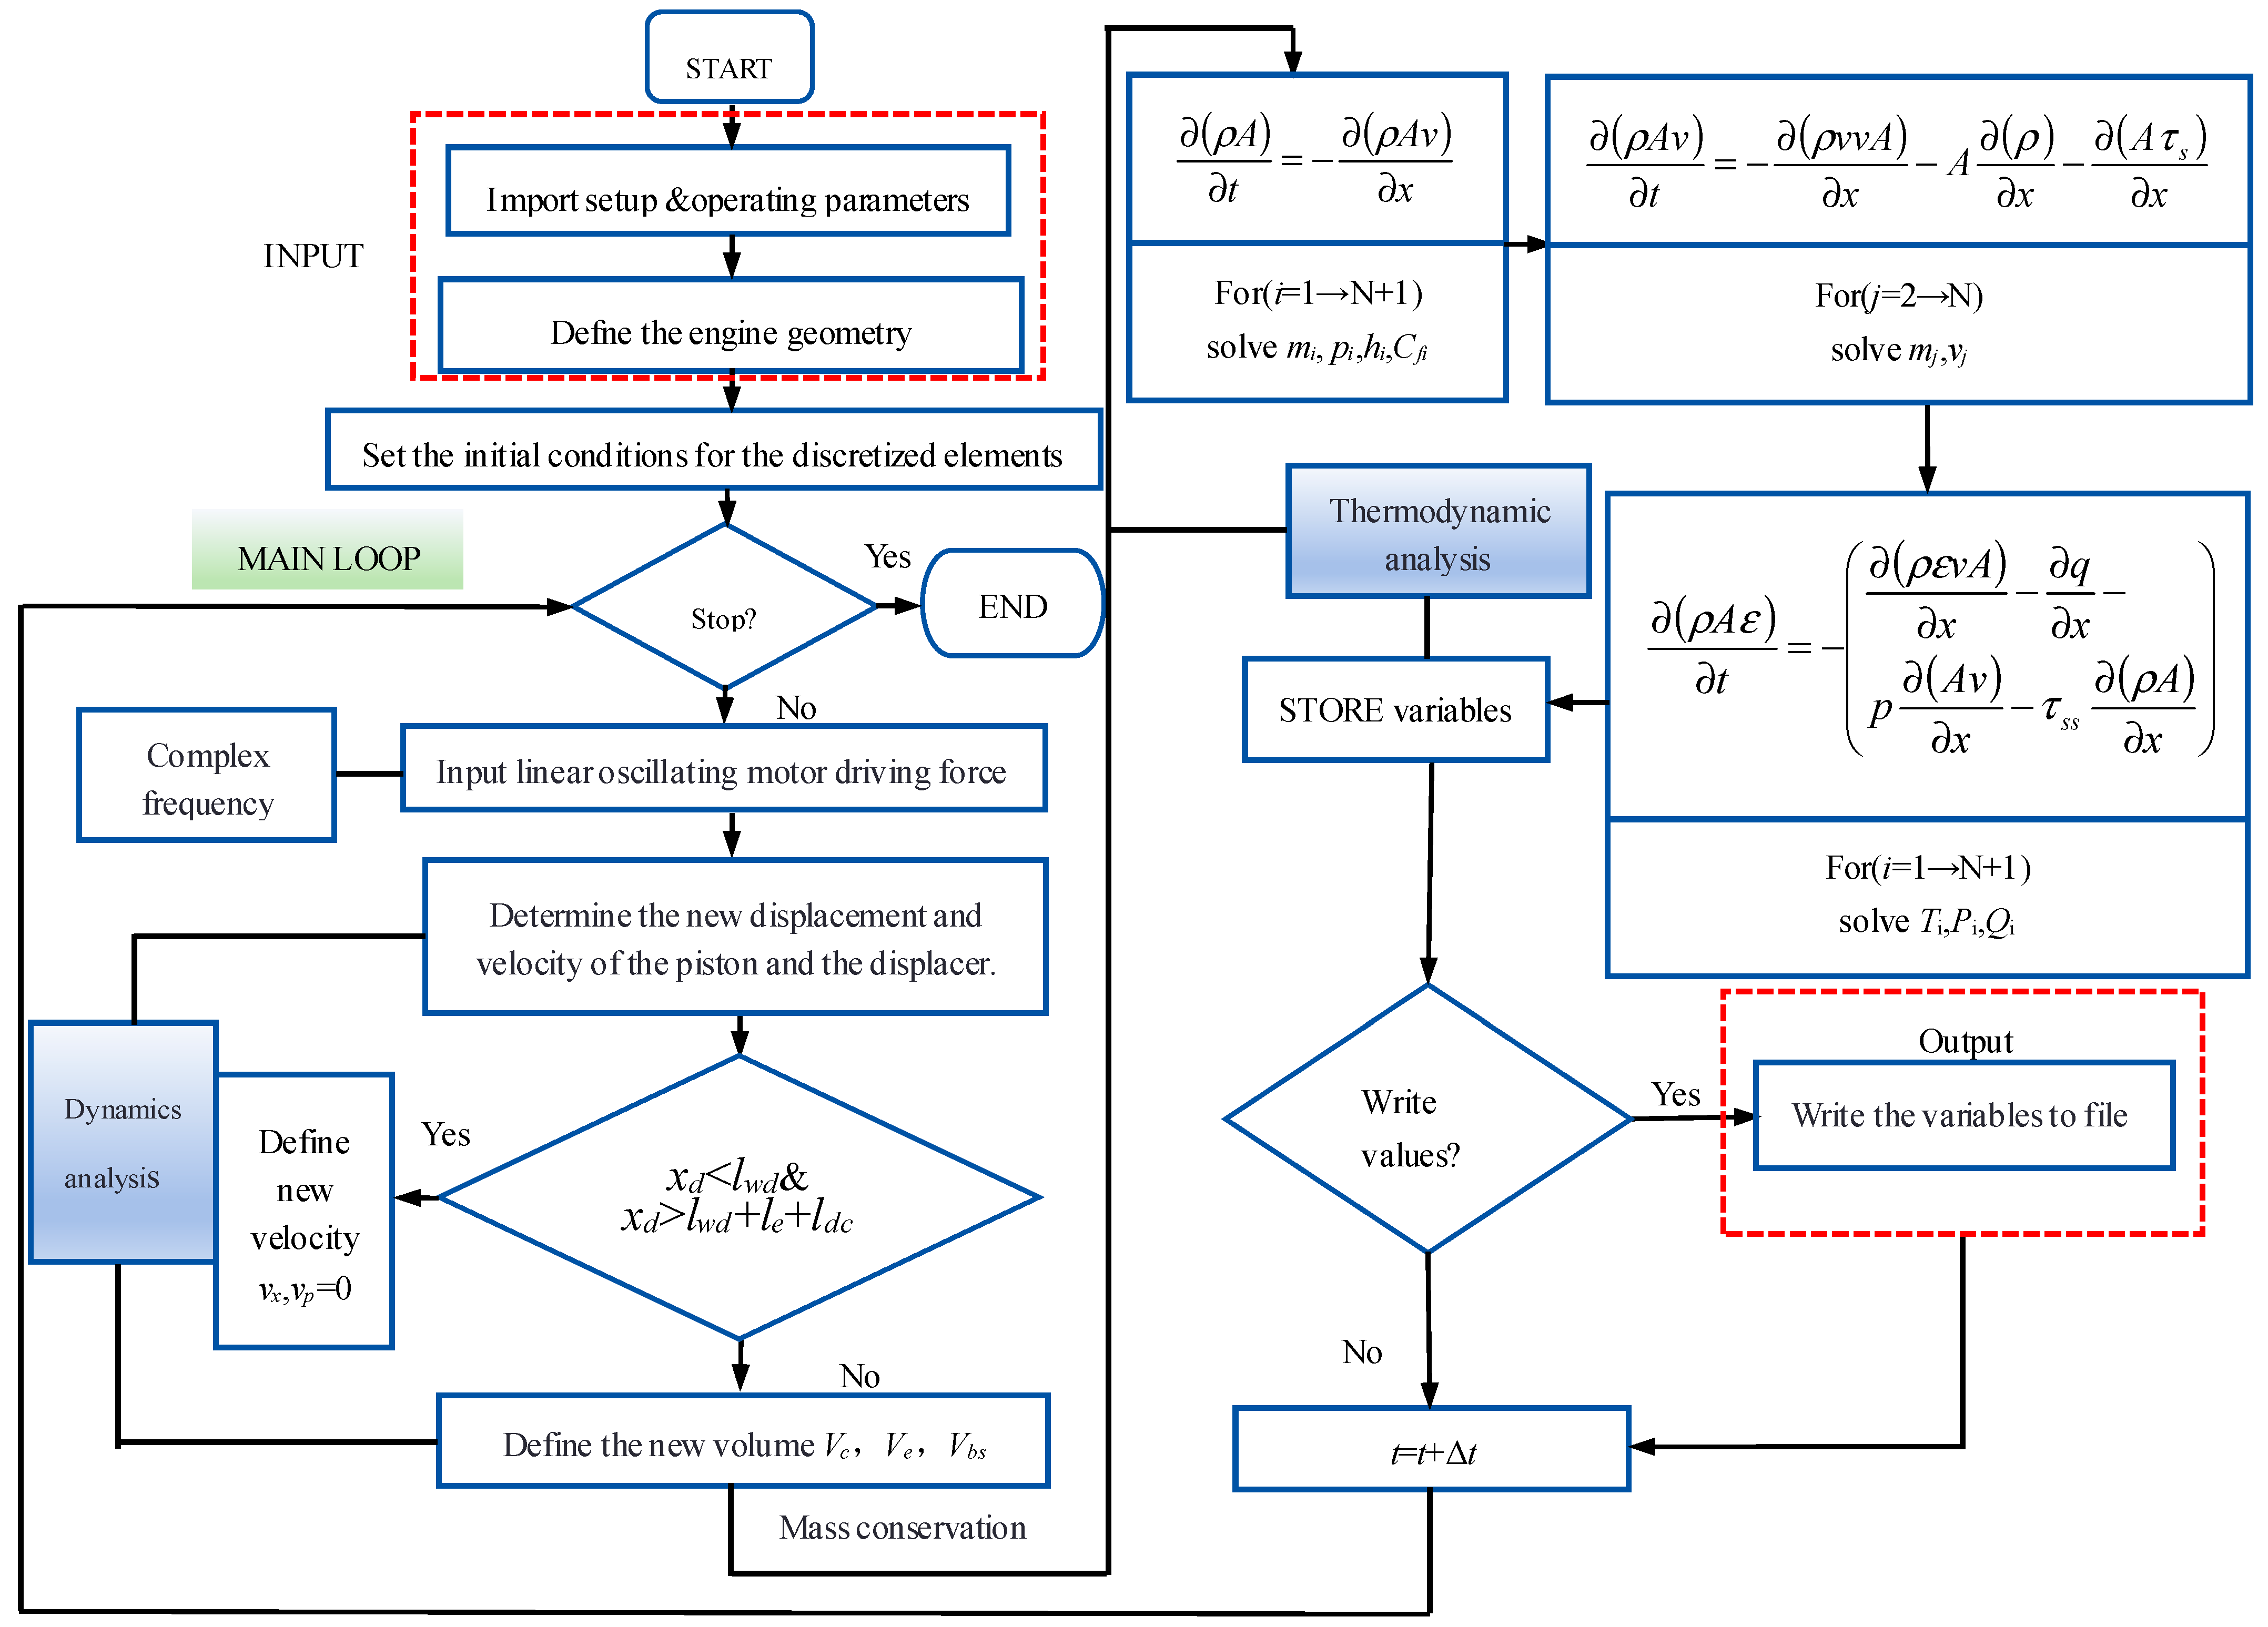
A fully explicit numerical method was employed to solve the system of control equations governing the thermodynamics of the working fluid and the dynamics of the entire machine. The program flow was implemented in MATLAB (2020a), as shown in Figure 7. Initially, the working and geometric parameters of the FPSAC were imported and initialized. Within the main loop, the time step for the motion of the power piston and displacer was calculated. Subsequently, the driving force of the linear oscillating motor was determined, and the mechanical output work was computed under its influence. Using the newly calculated positions of the displacer and power piston, the volumes of the expansion and compression chambers were then updated. The conservation of the mass, momentum, and energy equations, along with the ideal gas law, were applied to determine the new ‘gas thermodynamic’ states for each control volume, numbered from 1 to N. Before proceeding to the next time step, the program updated the ‘old’ variables by storing the ‘new’ values. A conditional function was used to determine whether the output data should be saved to memory, after which the program advanced to the next time step. By using the air conditioner efficiency as a thermal convergence indicator, it was found that a highly accurate dynamic steady-state result could be achieved within the first 150 cycles.
To accelerate the model’s convergence to a thermodynamic steady state, a linear temperature interpolation between the hot and cold ends was used to initialize the regenerator temperatures. During the first 150 cycles, the temperatures of the backspace and regenerator grid were adjusted through step changes at the end of each cycle. This temperature adjustment scheme aimed to minimize thermal energy fluctuations within each cycle. Simulating more than 20 cycles, with 50 control volumes in the heat exchanger channels, required approximately 20 h of simulation time on a 2.1 GHz Intel Core i7-11800H processor.

3. Results and Discussion

This study presents a simulation of the FPSAC operation. The simulation parameters and operating conditions are summarized in Table 1, while Table 2 details the structural and dynamic parameters. Furthermore, the study analyzes and discusses the variation patterns of key FPSAC parameters under different driving conditions in both cooling and heating modes.

3.1. Impact of Different Drives on the Thermodynamic and Kinematic Parameters of the FPSAC in Cooling Mode

3.1.1. The Impact of Harmonic Drive on Thermodynamic-Dynamic Parameters

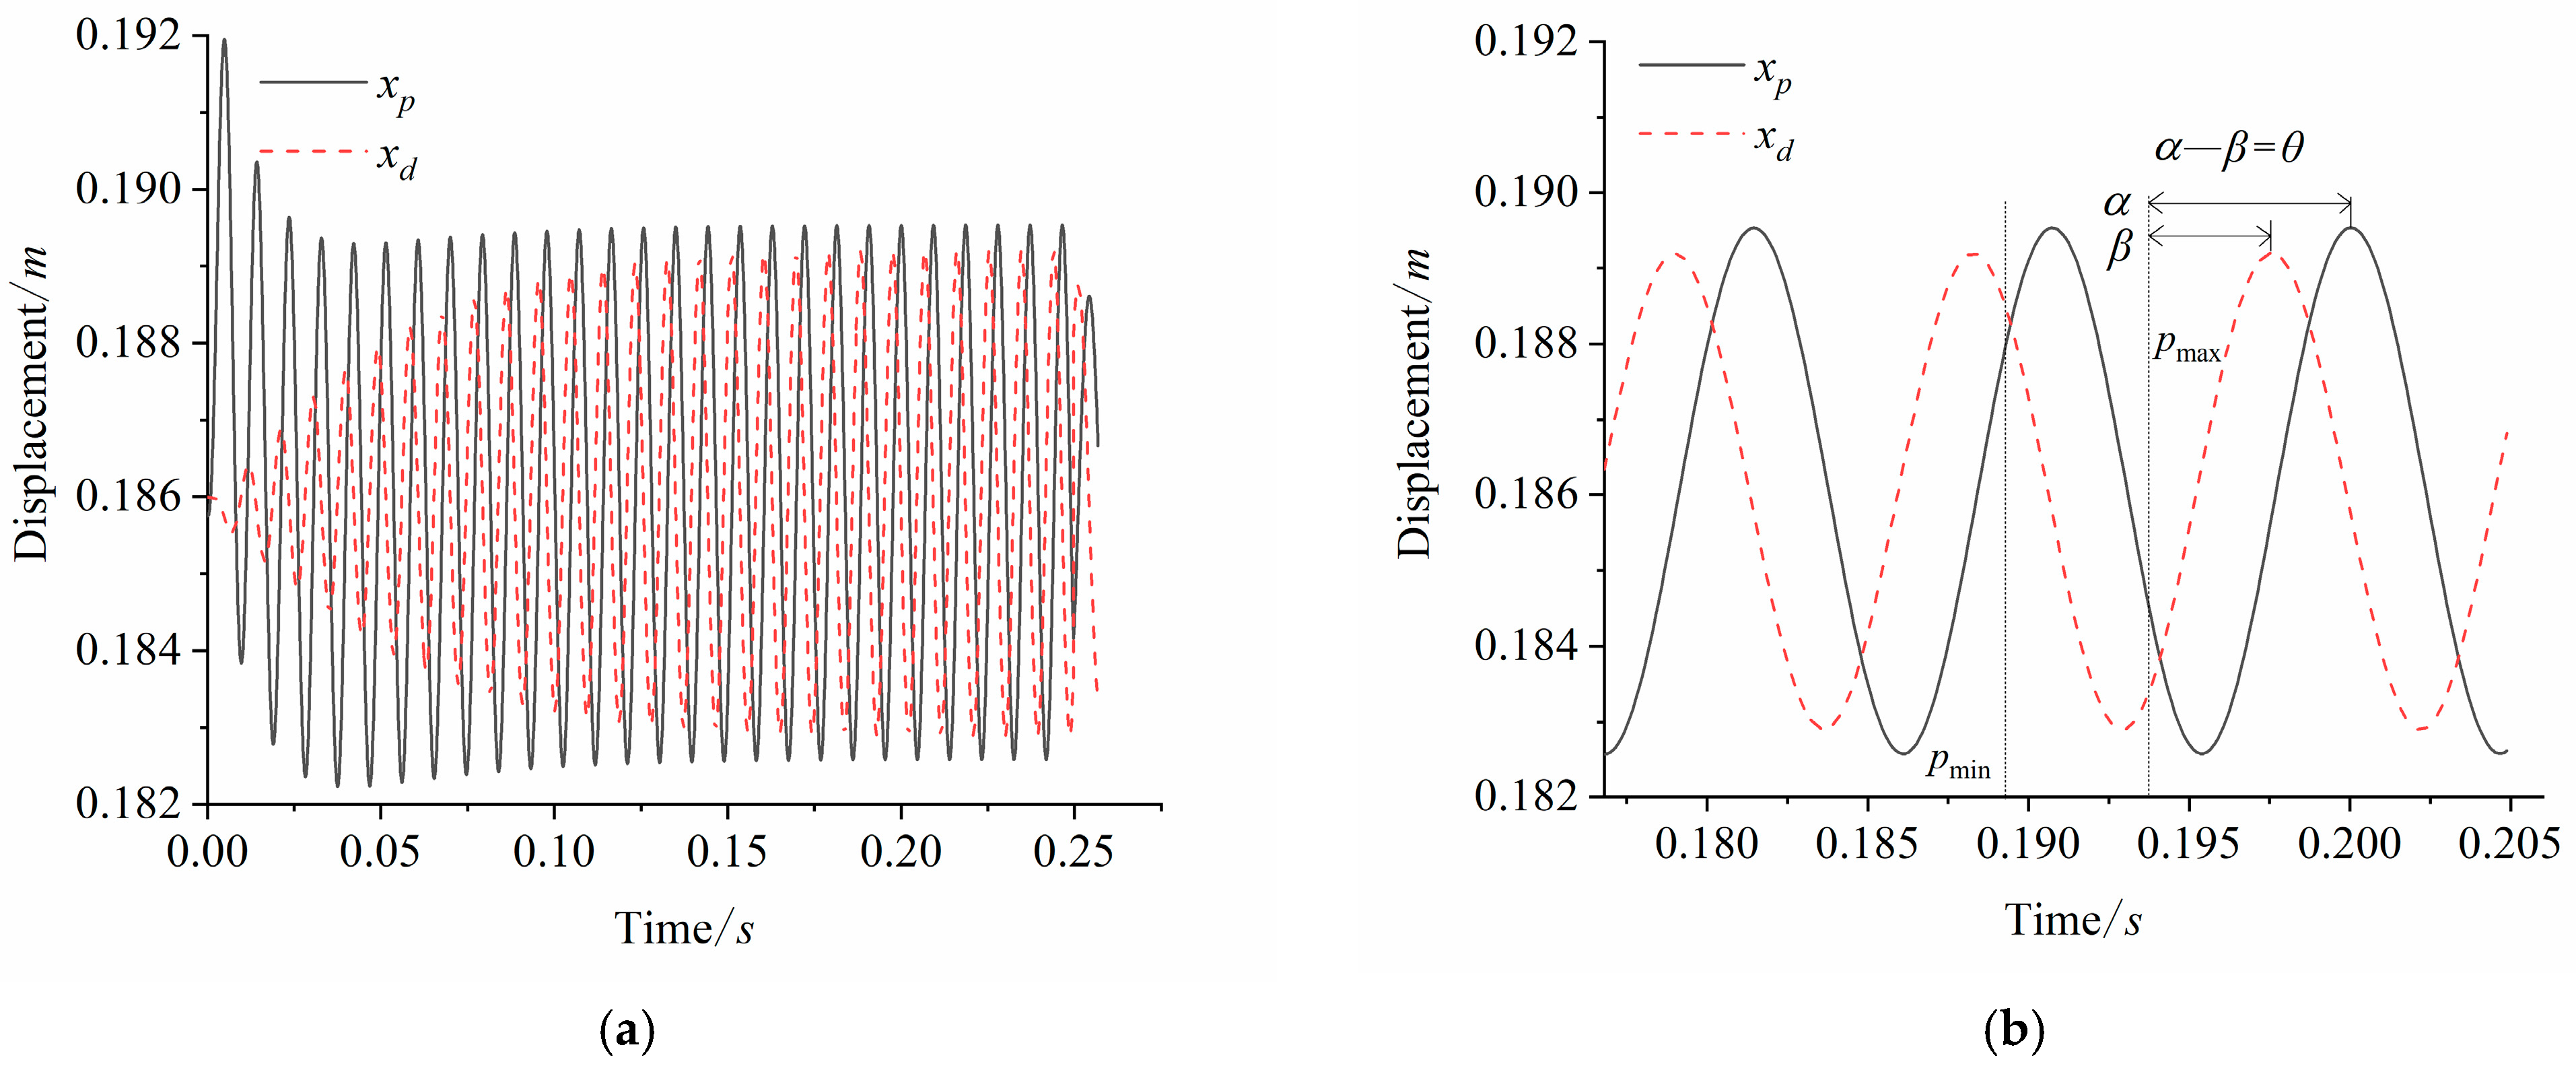
When the driving force of the linear oscillating motor is harmonic, its magnitude is given by Fm = 100sin(160πt). Figure 8 presents the displacement curves of the power piston and displacer as functions of time under harmonic wave driving. Figure 8a shows the displacement cycles of the displacer and power piston as they transition from the initial state to steady-state operation. Figure 8b displays the displacement cycles of the displacer and power piston over three periods during steady-state operation. Neither the displacer nor the power piston made contact with the casing. The peak displacement amplitude of the displacer is 6.8 mm, while the power piston has a slightly smaller stroke, with an amplitude of 5.1 mm. The peak pressure oscillation causes the power piston to lead by 183.8° (corresponding to a phase difference α), while the displacer leads by 111.4° (corresponding to a phase difference β). Thus, the power piston leads the displacer by βα = 72.4°.
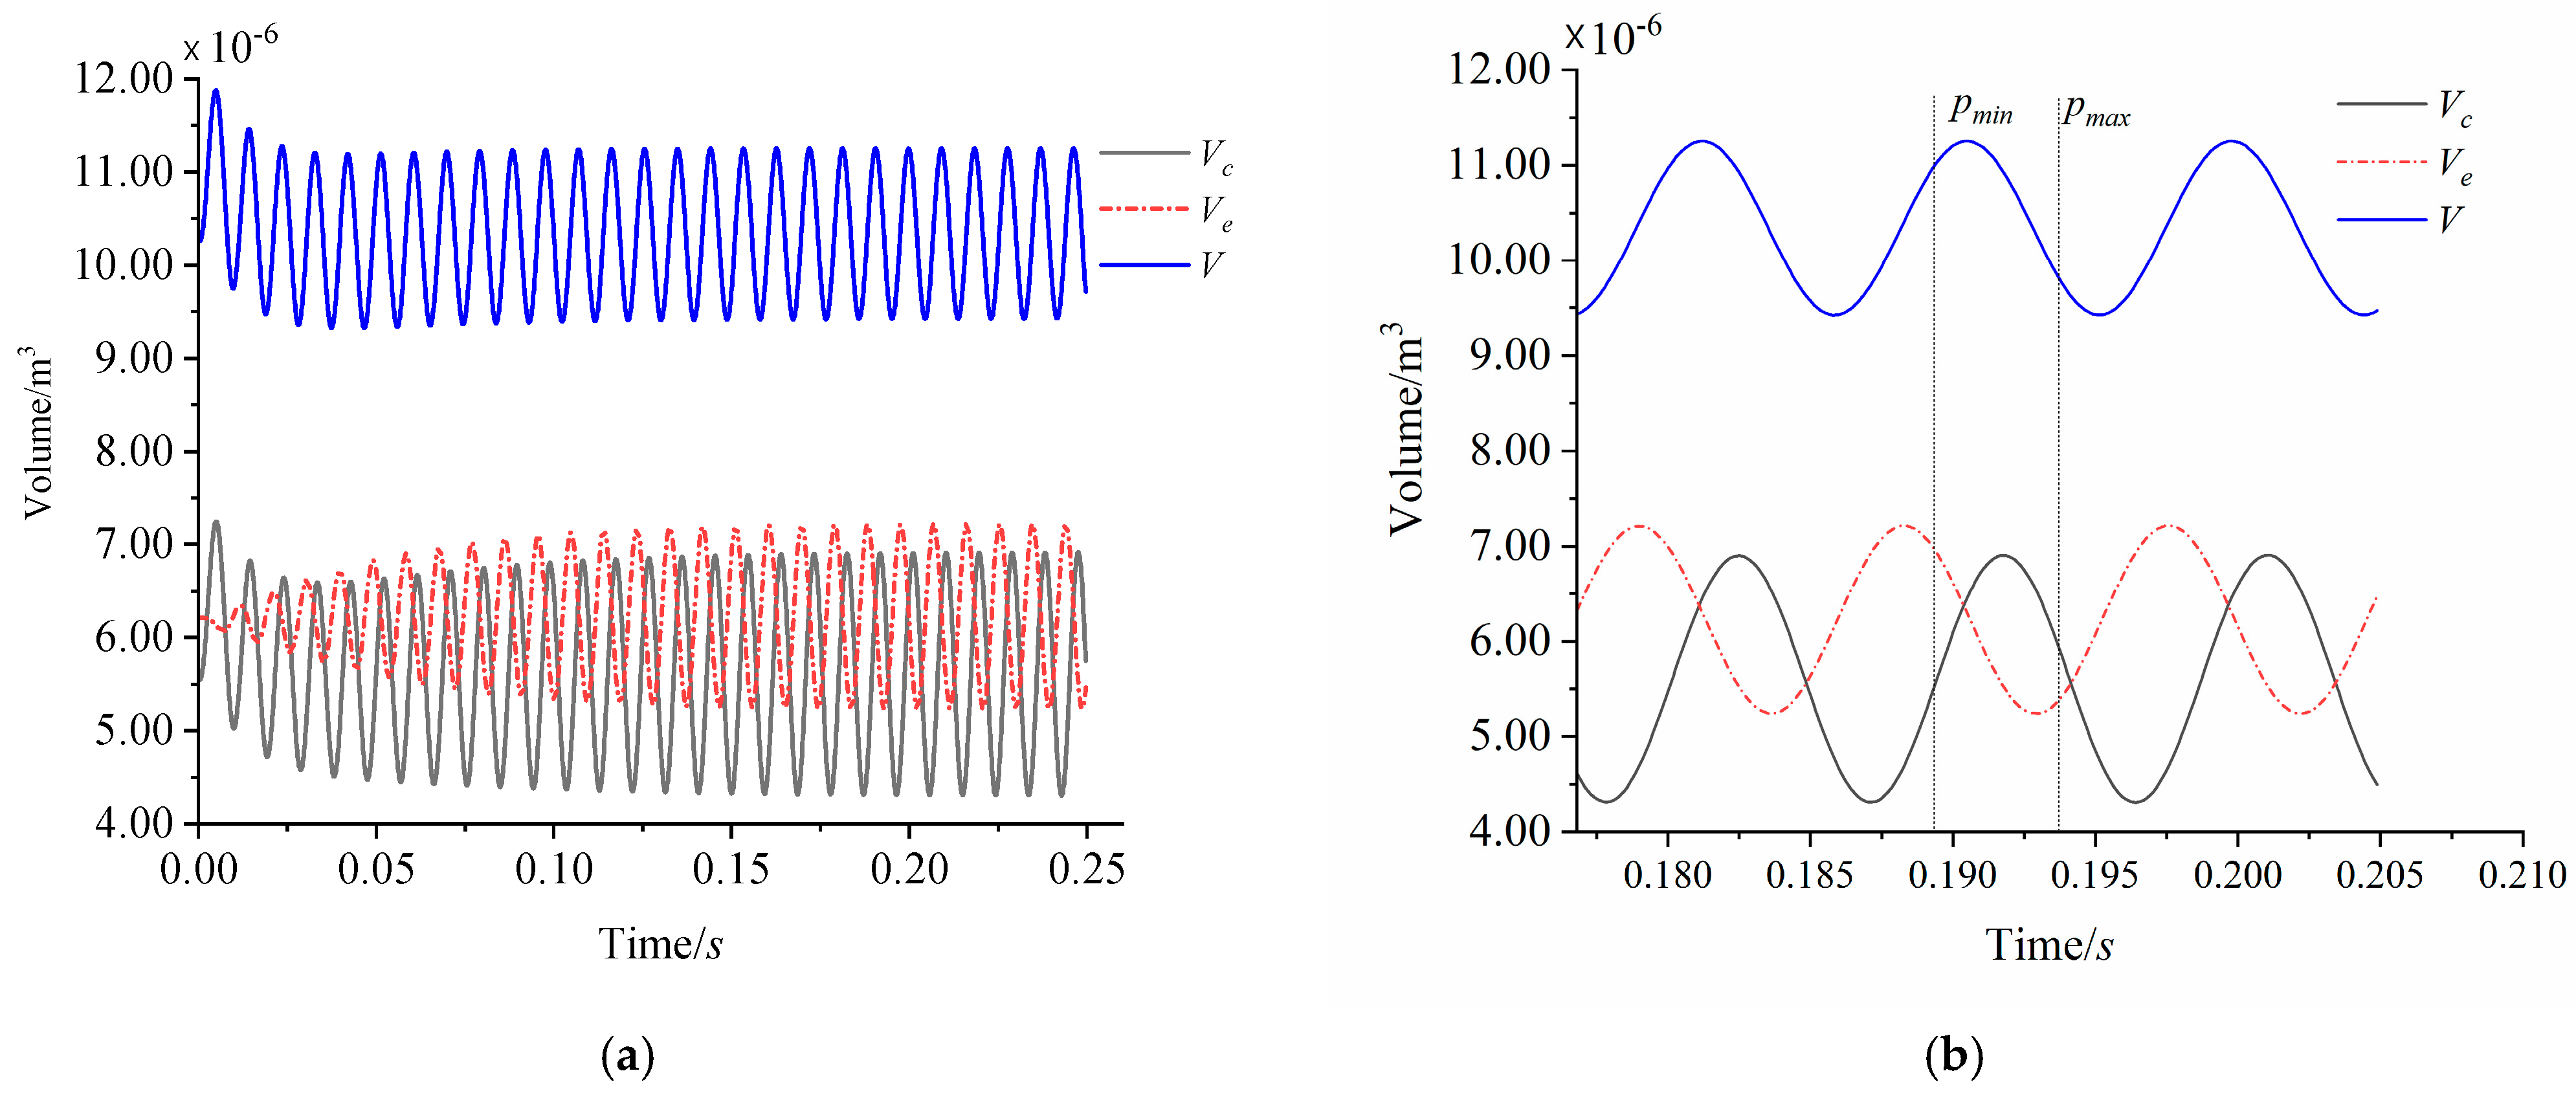
Figure 9 illustrates the volume variations in the expansion chamber Ve, compression chamber Vc, and total working chamber V under the harmonic drive. The total working chamber’s maximum volume is 11.25 cm3, with a difference of 1.82 cm3 between its minimum and maximum volumes, yielding a compression ratio Vmax/Vmin of 1.19. Stirling engines are known for their low compression ratios, typically not exceeding 2.5. In this study, the lower compression ratio is attributed to the power piston’s maximum swept volume being nearly equal to its minimum.
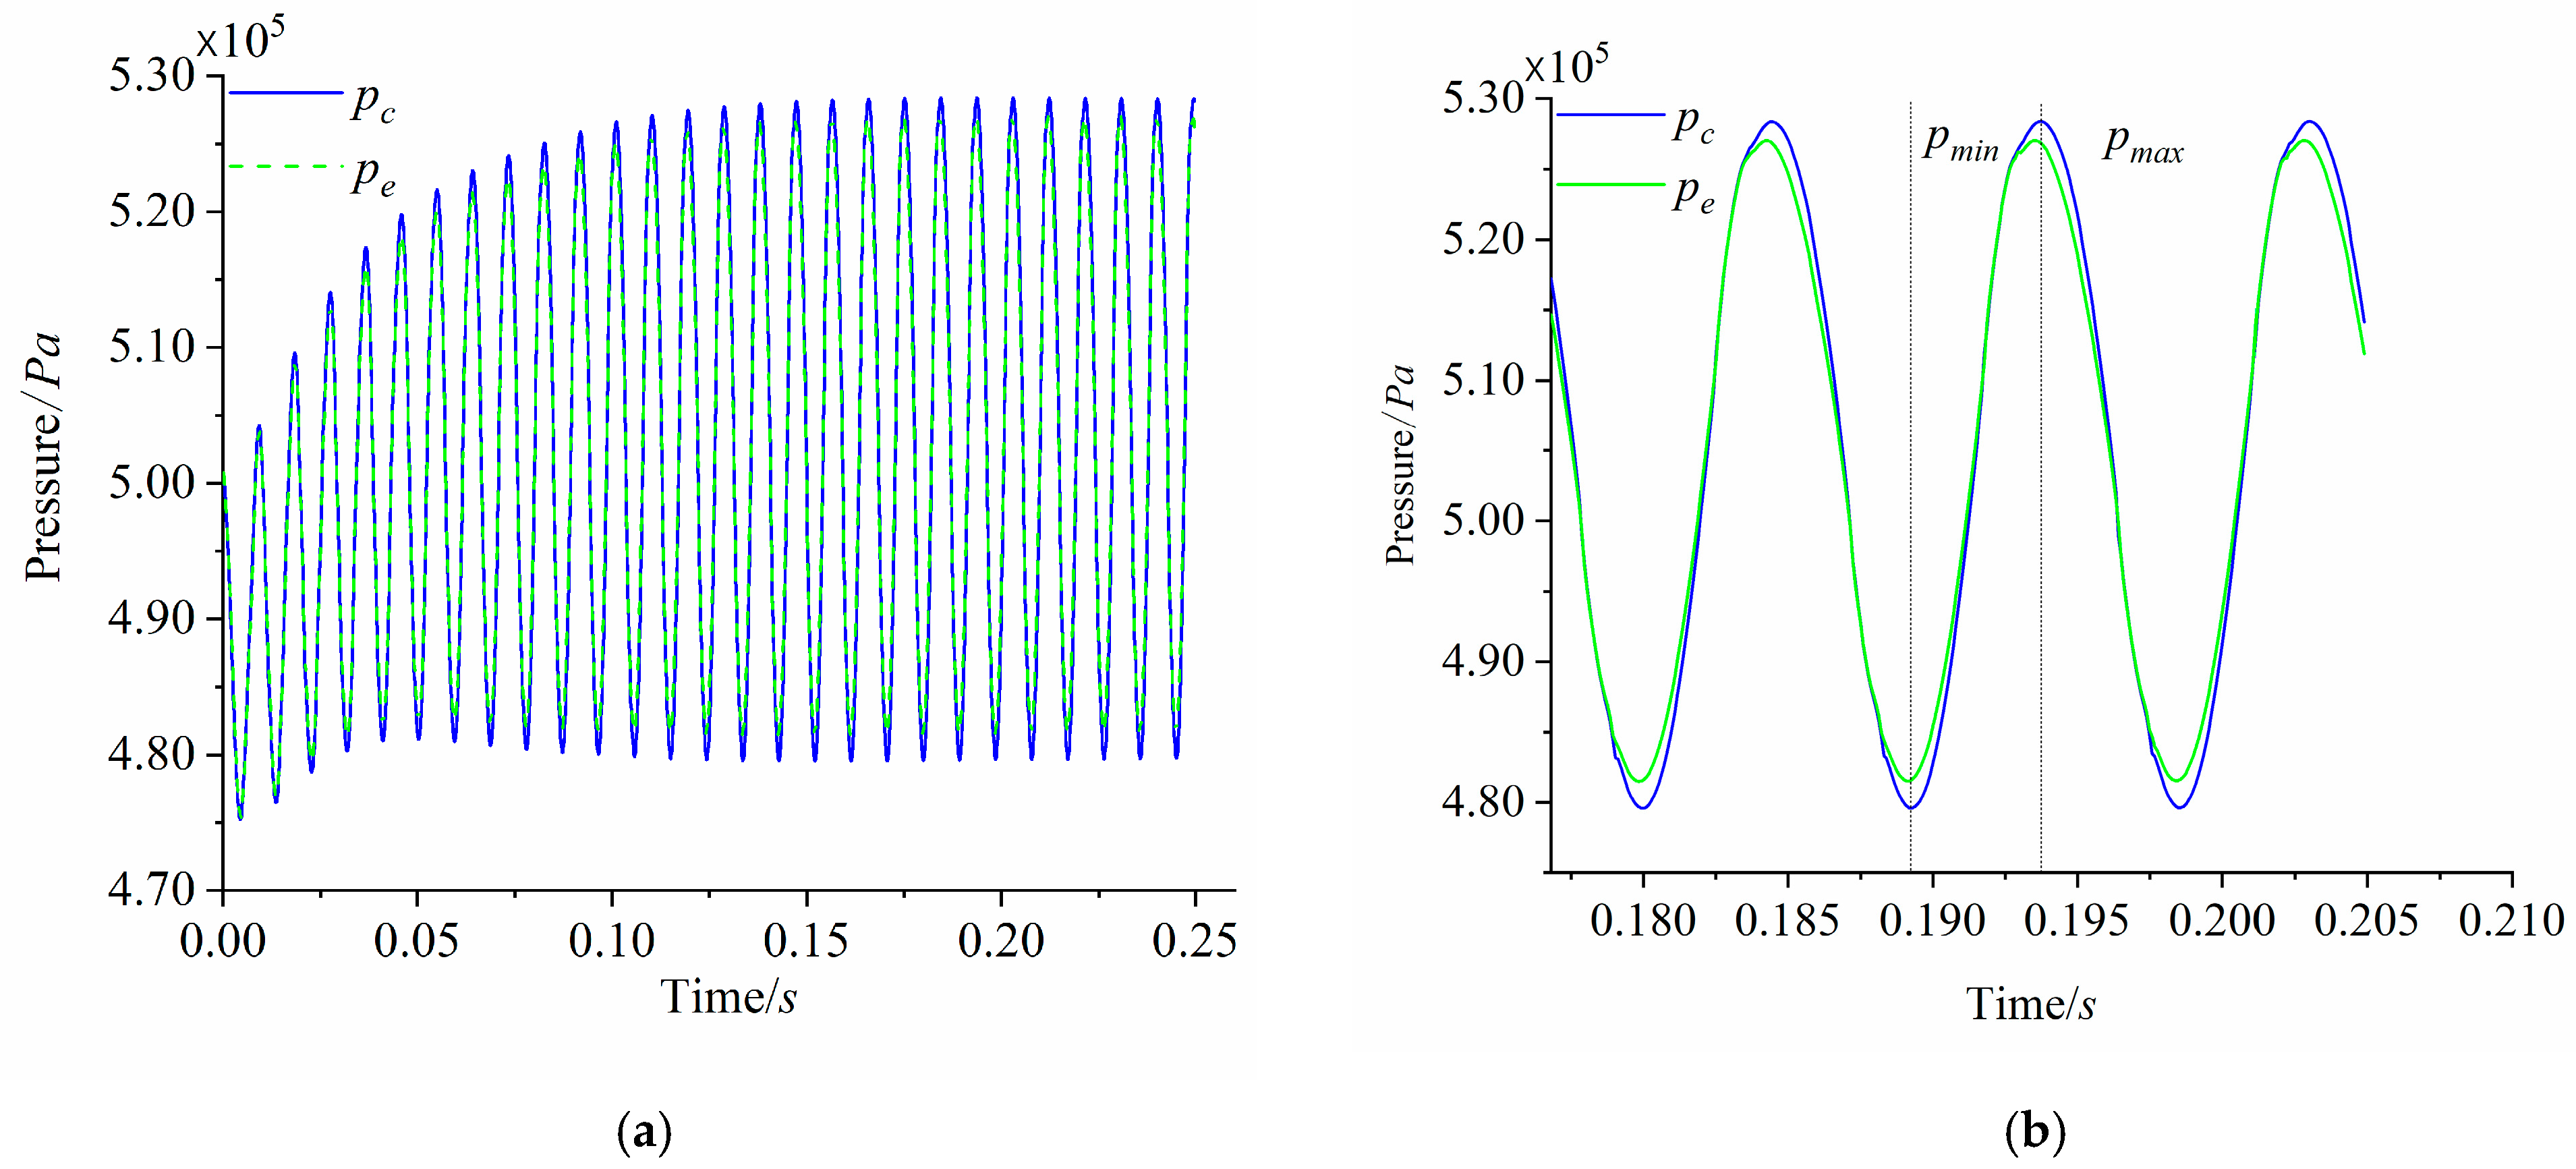
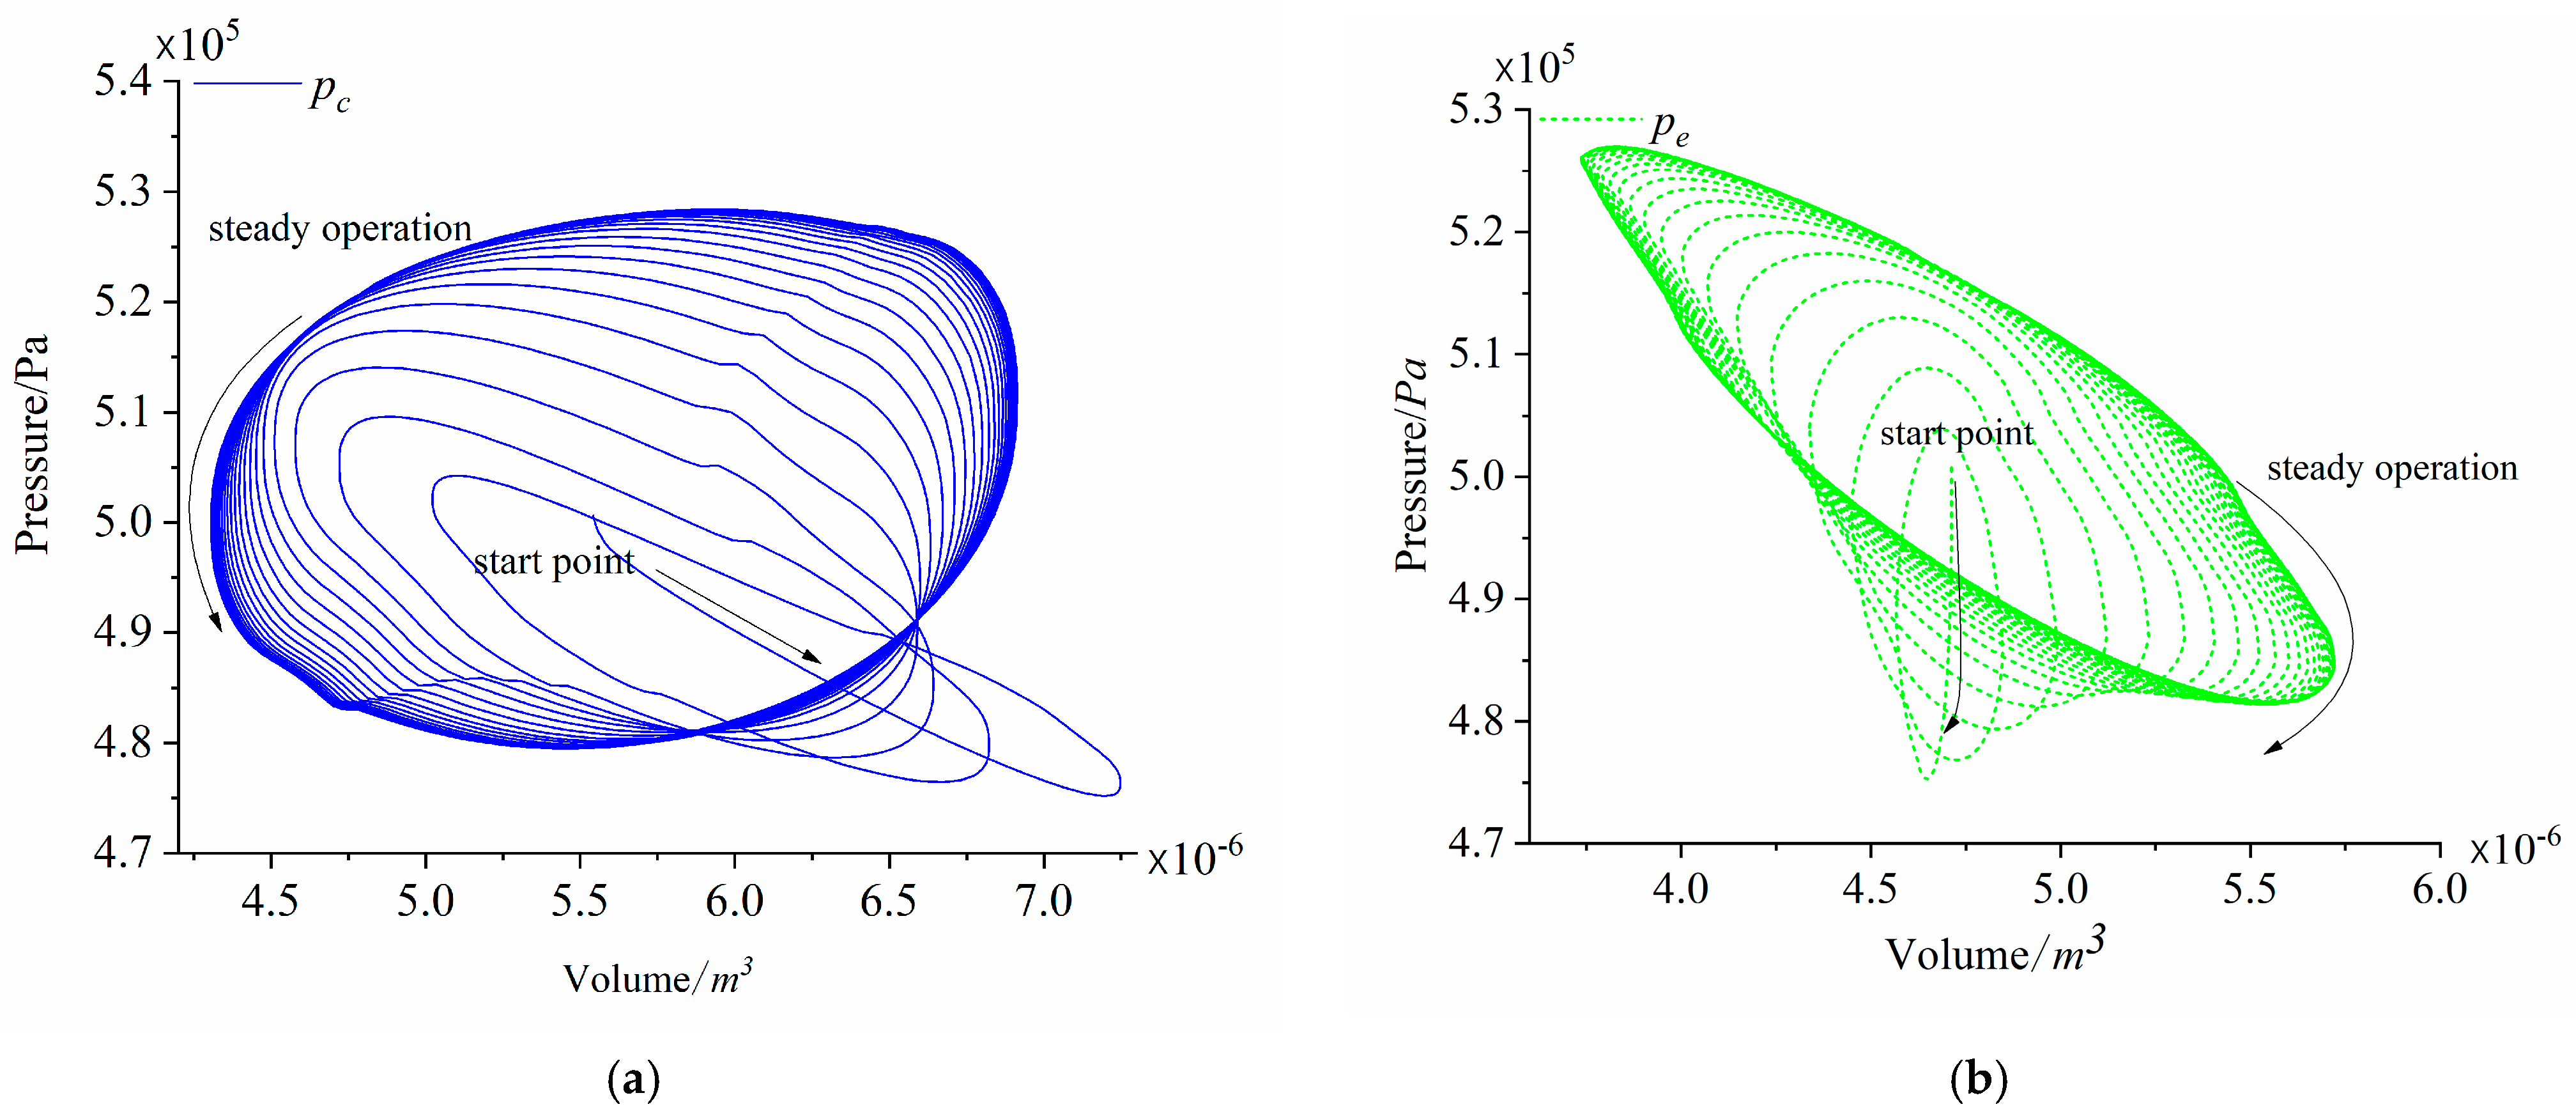
Figure 10 shows the pressure curves for the expansion and compression chambers under the harmonic drive. Figure 10 presents the p–v diagrams of the expansion and compression chambers, from startup to steady state, highlighting the periodic pressure variations with respect to the chamber volumes. This diagram effectively captures the entire transition of the FPSAC from startup to quasi-steady state and ultimately to stable operation. At the maximum pressure pmax, small fluctuations lead to irregularities in the p–v diagram at both ends. These irregularities may stem from an excessively large or small time step during the simulation. A large time step may miss rapid changes in the expansion or compression processes, while a small time step may cause numerical oscillations and instability, both of which contribute to fluctuations in the indicator diagram.
Figure 11 presents the p–v diagrams for the expansion and compression chambers, illustrating the periodic pressure fluctuations in relation to the chamber volumes, from startup to steady state. This diagram effectively captures the full transition of the FPSAC, from startup to quasi-steady state and, ultimately, to stable operation. At the maximum pressure pmax, minor fluctuations cause irregularities at both ends of the p–v diagram. Such irregularities may arise from the use of either an excessively large or small time step during the simulation. A large time step may fail to capture rapid changes during the expansion or compression processes, while a small time step can lead to numerical oscillations and instability, both contributing to fluctuations in the indicator diagram.
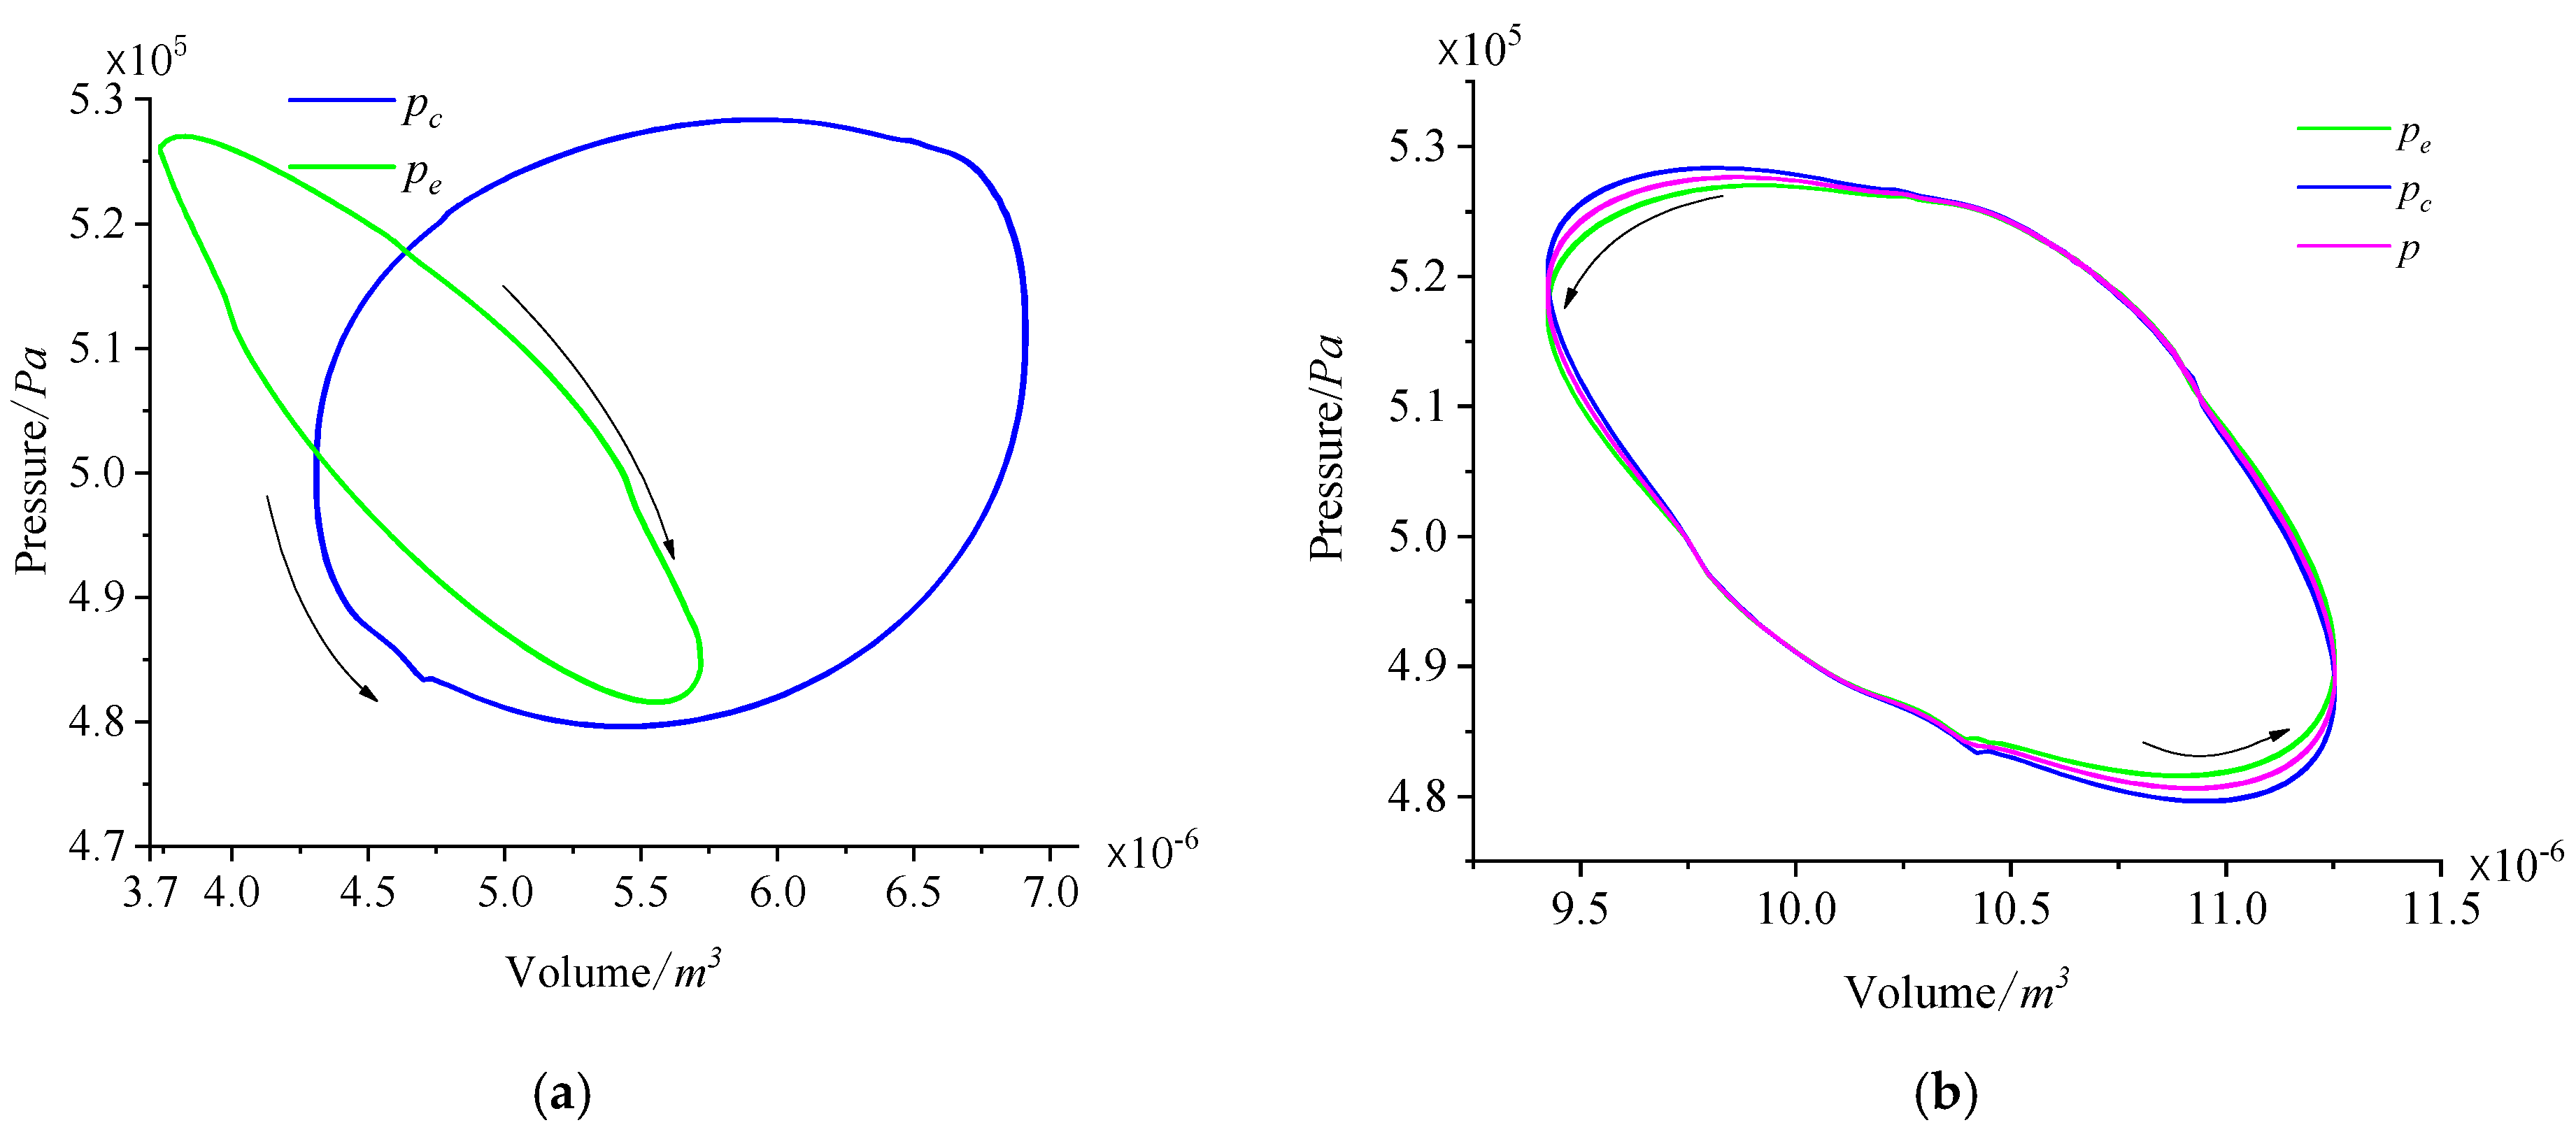
Figure 12 illustrates the p–v diagram for a steady-state cycle under the harmonic drive. Panel (a) shows the p–v diagrams for both the compression and expansion chambers during one cycle after the Stirling air conditioner has reached a steady state. By calculating the areas under these curves, it is determined that the working gas performs 8.07 J of boundary work in the compression chamber and 2.92 J in the expansion chamber. The net positive indicated work from the working chamber is 5.12 J. Panel (b) of Figure 12 presents the p–v diagram for the total working chamber, including both the expansion and compression chambers, along with the average pressure values for the entire system. Aside from a slight phase difference in the p–v diagram, likely resulting from viscous dissipation due to fluid friction and pressure variations between the chambers, the areas under the p–v curves are nearly identical. The net power calculated from the area within the expansion chamber is 4.22 W, while the net power in the compression chamber is 4.31 W. The net power at the average pressure is 4.26 W, with deviations of 0.09 W and 0.05 W compared to the net power in the compression chamber, respectively. Based on the coefficient of performance (COP) definition, the COP of the FPSAC with the harmonic drive is calculated to be 16.94%.
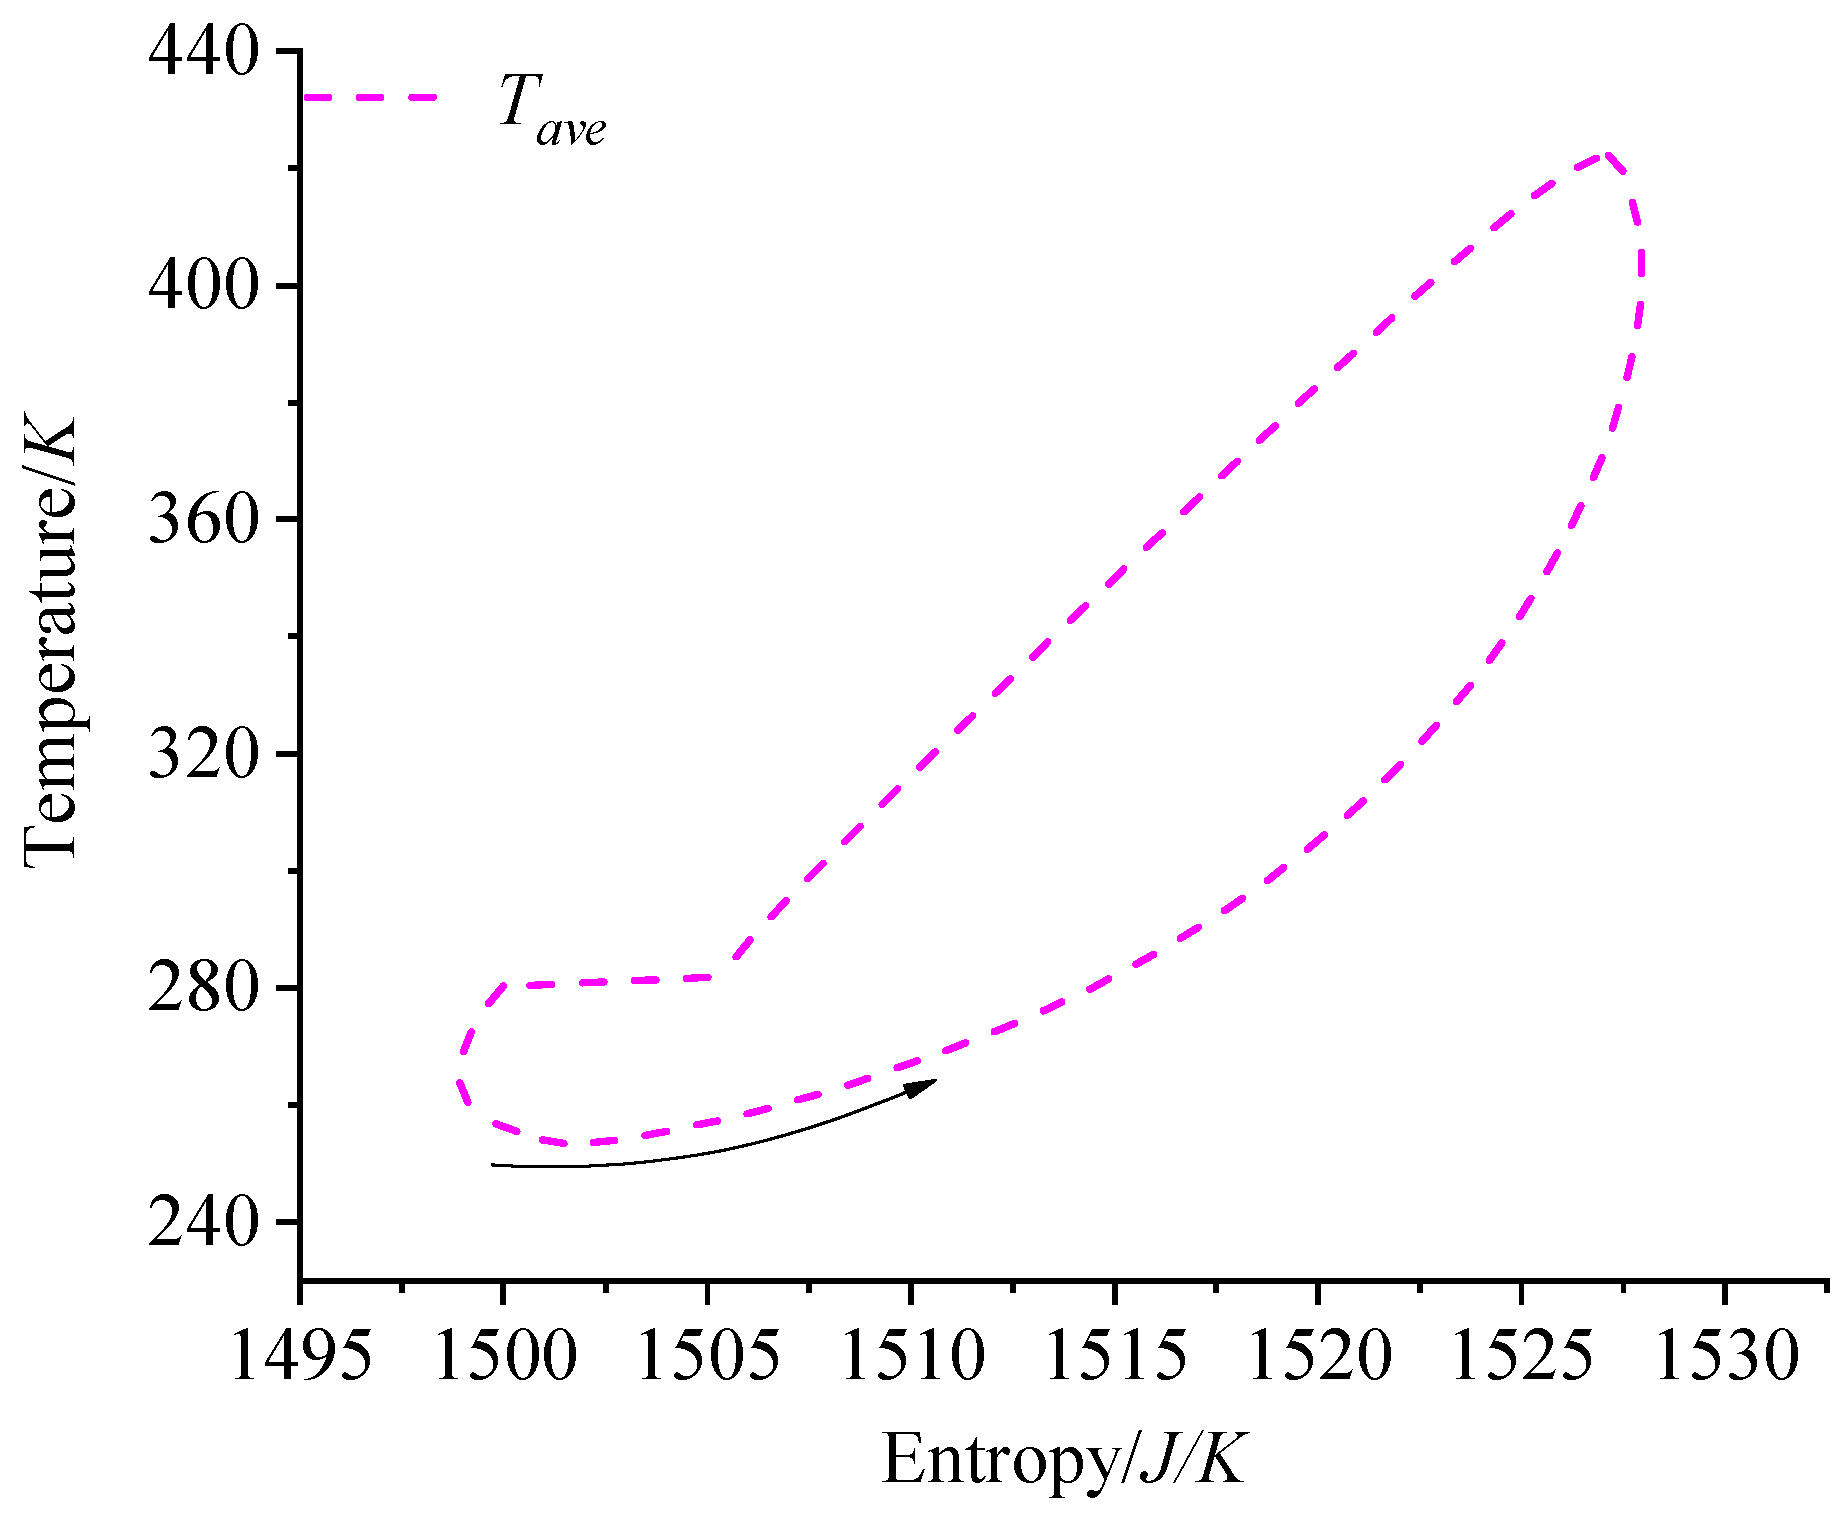
Figure 13 presents the temperature–entropy (T–s) diagram for a single steady-state cycle. The heat released during one cycle is determined by calculating the area under the curve, which results in a value of 462 J.

3.1.2. Comparison Between Harmonic Drive and Multi-Harmonic Drive

The differences in key parameters, such as displacement and pressure, between harmonic and multi-harmonic waves are analyzed at the same power level. Figure 14 and Figure 15 depict the displacement and pressure curves for different harmonic drives. It is observed that the displacement of the harmonic wave is greater than that of the multi-harmonic waves. Specifically, the displacements of the fifth and seventh multi-harmonic waves are nearly identical and slightly larger than that of the third multi-harmonic wave, whereas the displacement of the harmonic wave is the smallest.
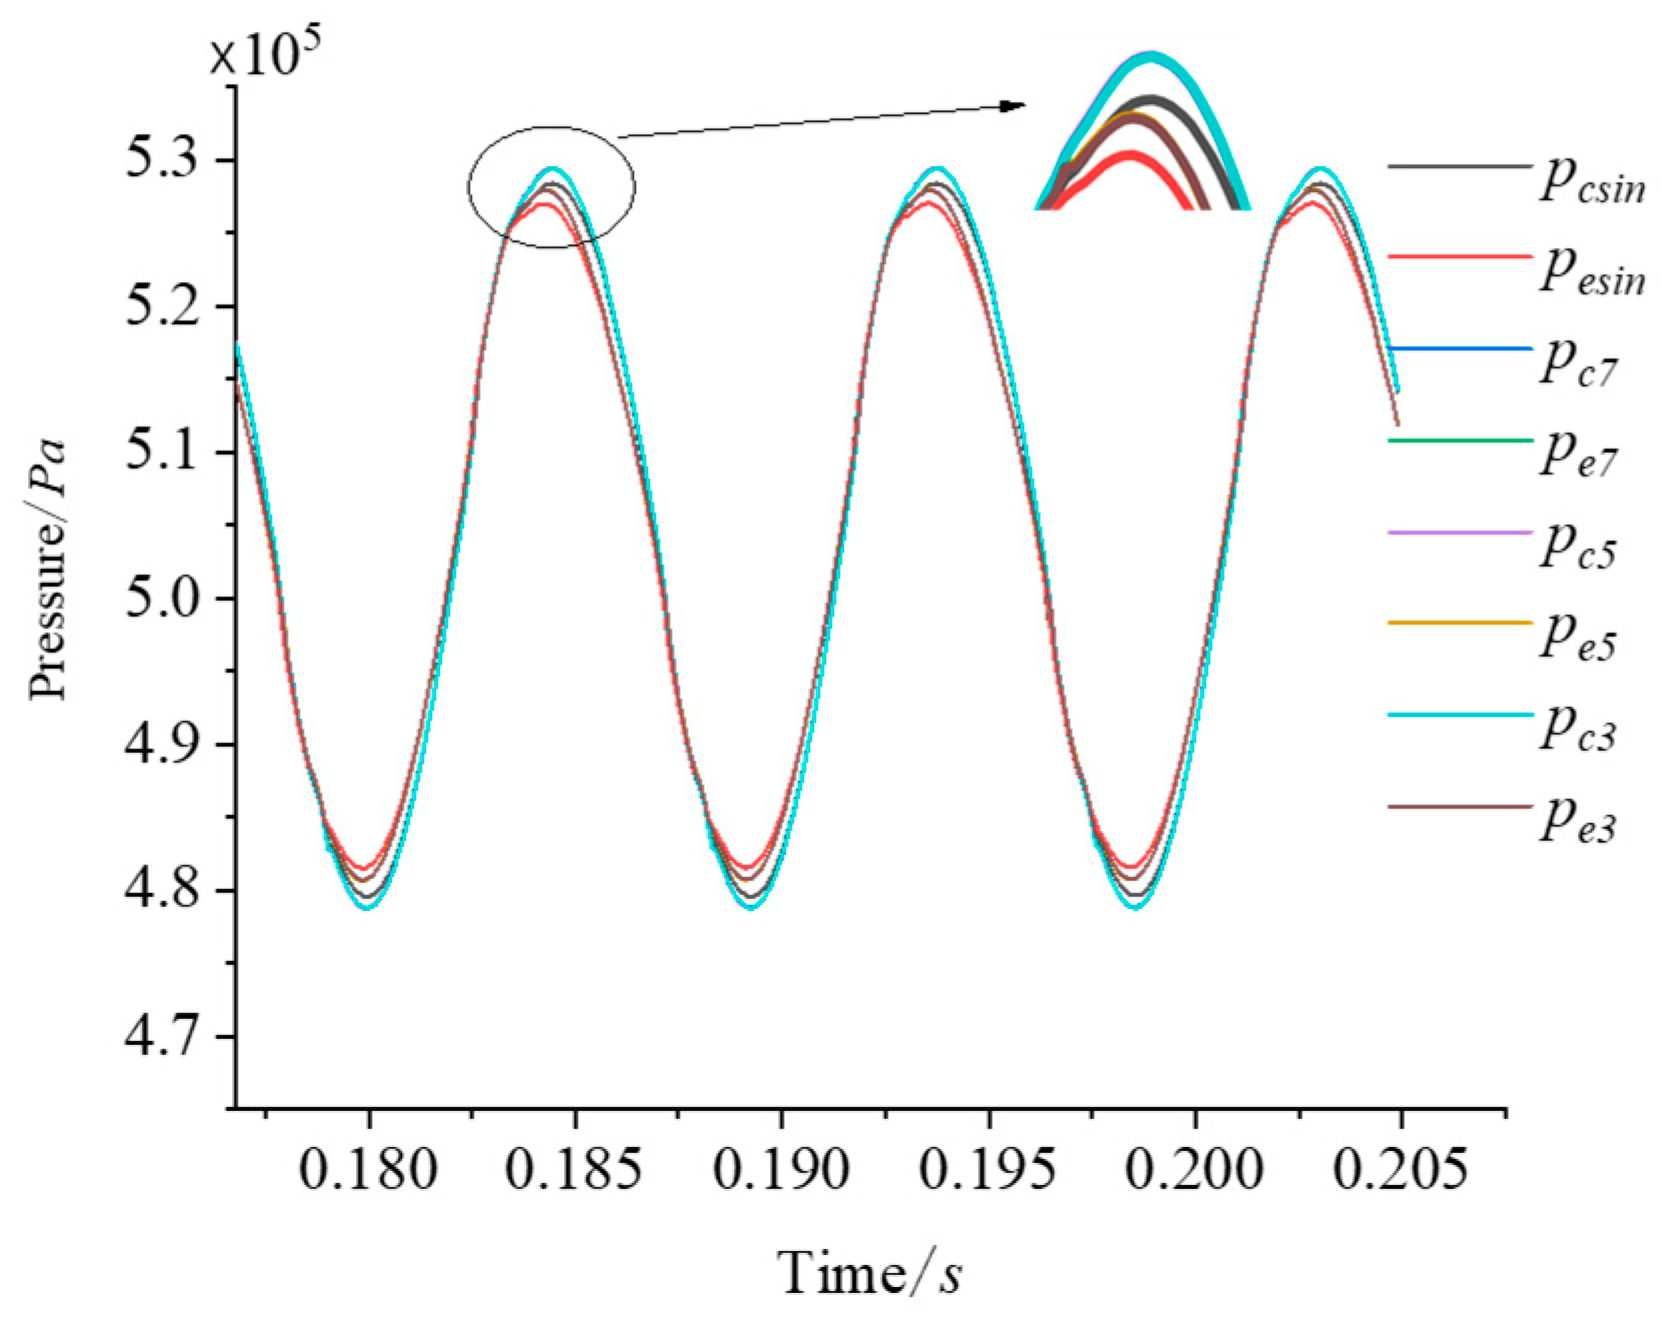
Figure 15 illustrates the relationship between the pressure in the working chamber and time for different driving mechanisms. The harmonic wave results in the lowest pressure, followed by the third and fifth multi–harmonic waves, with the seventh multi-harmonic wave yielding the highest pressure.
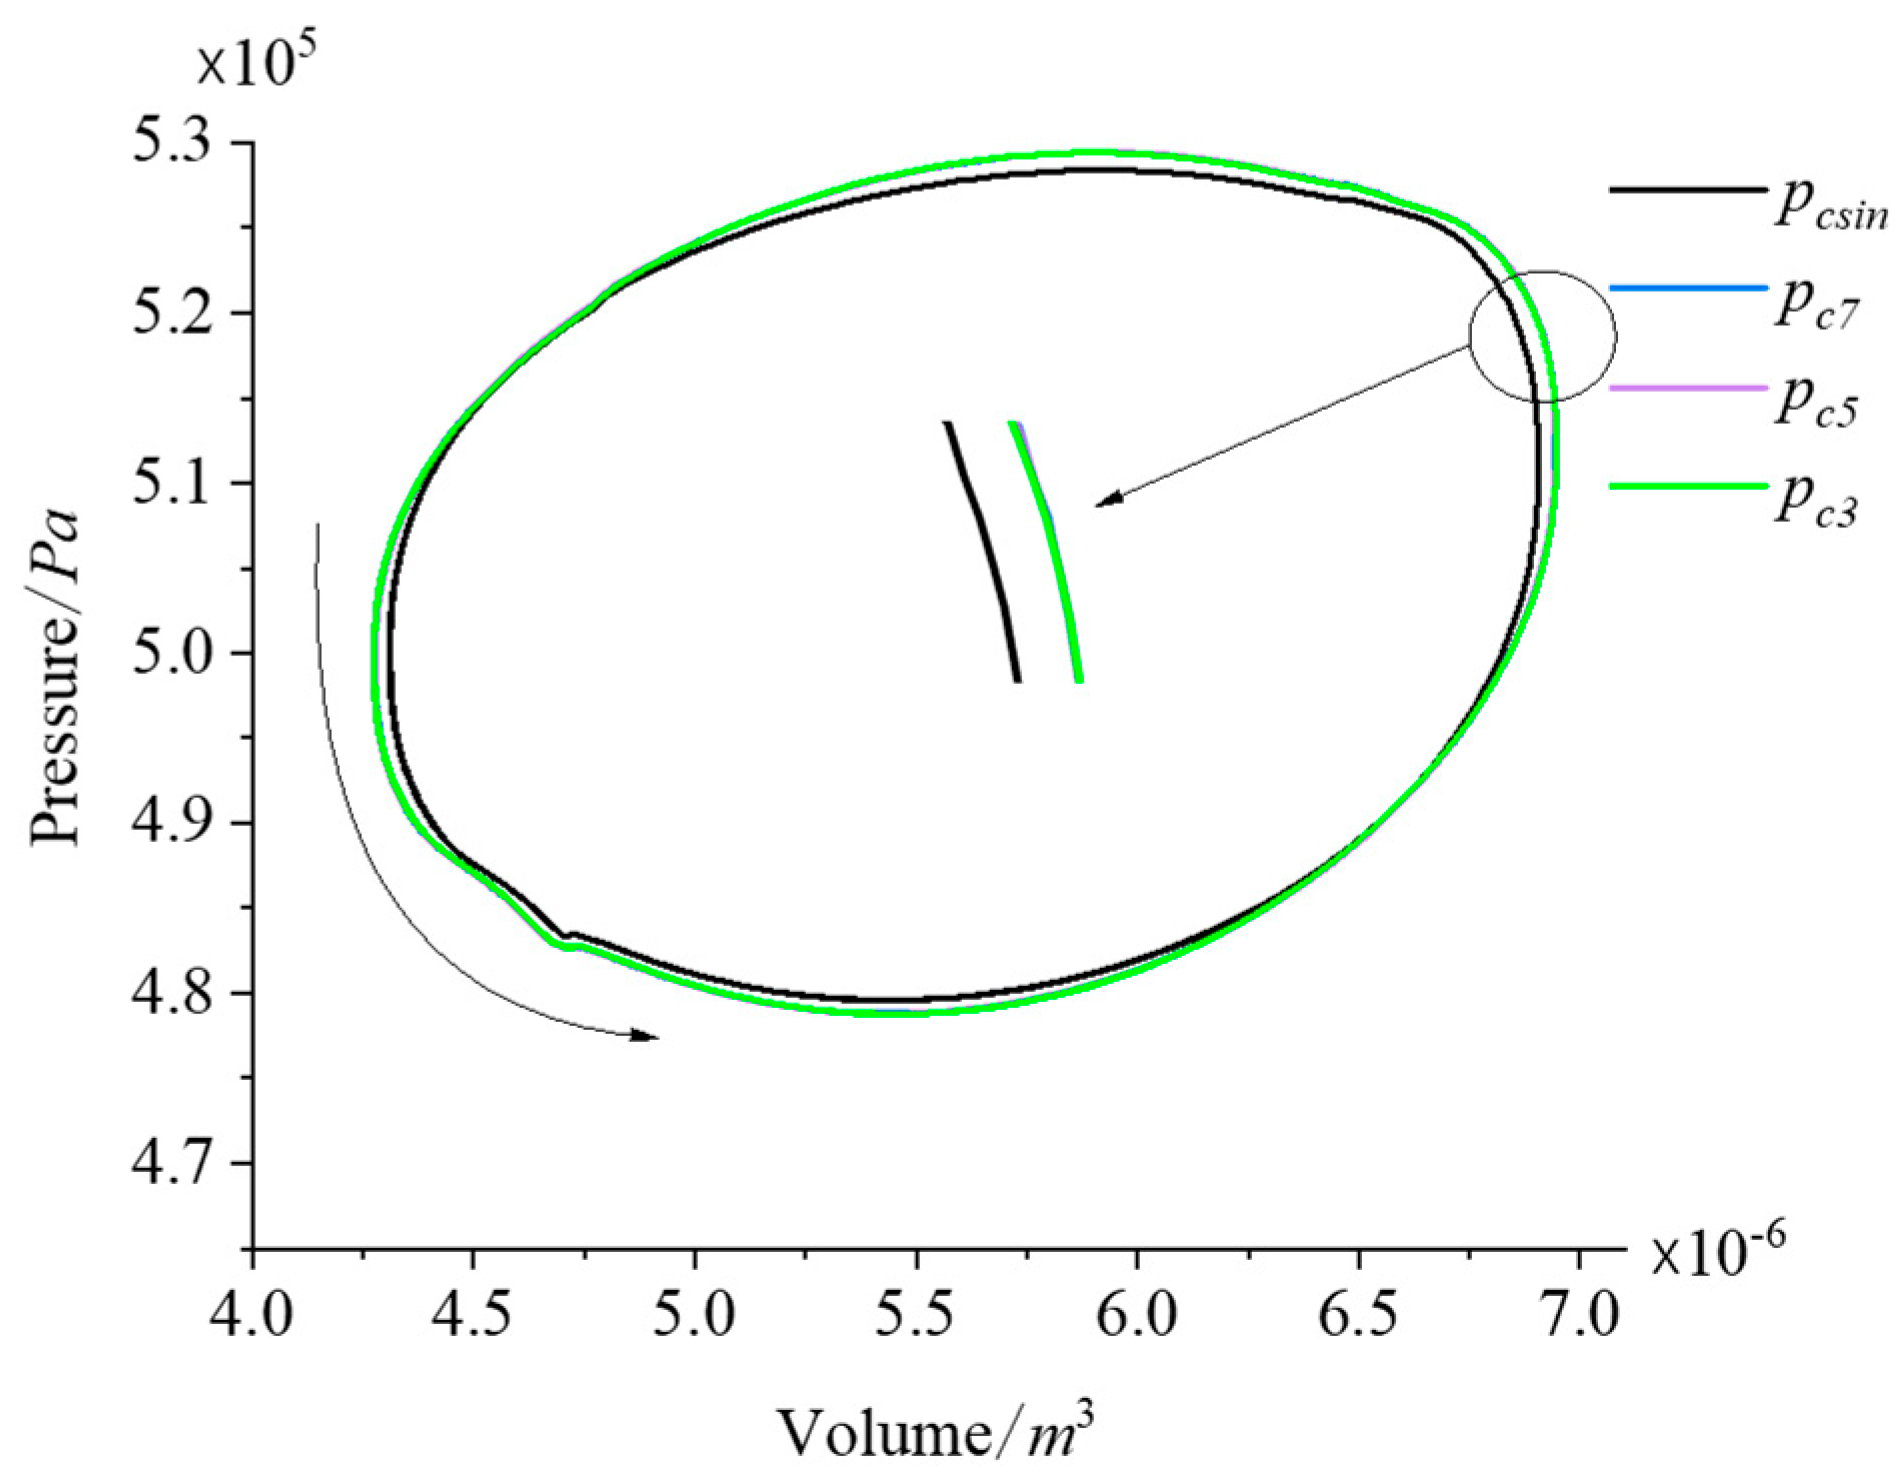
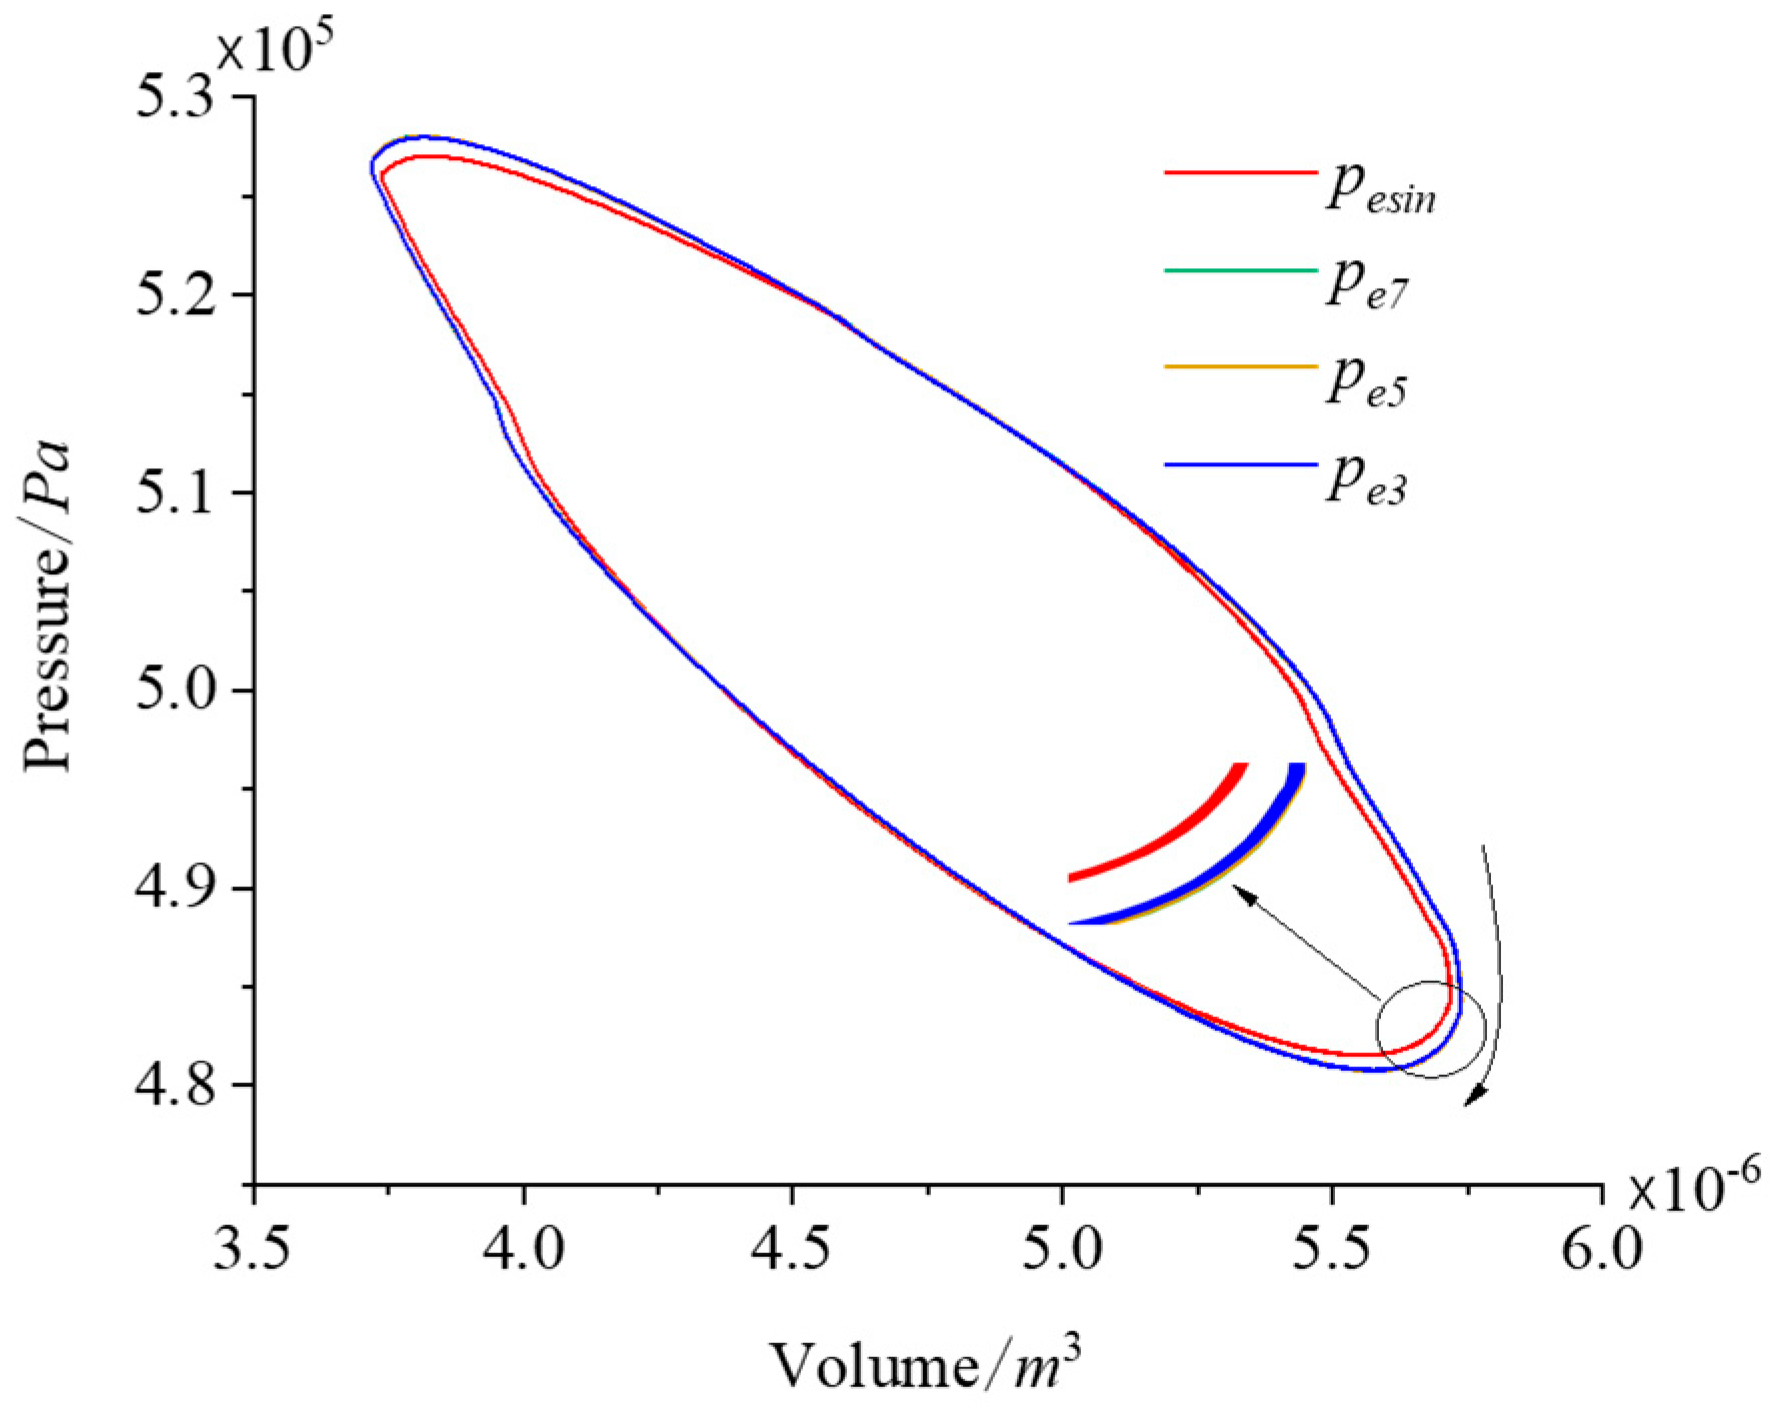
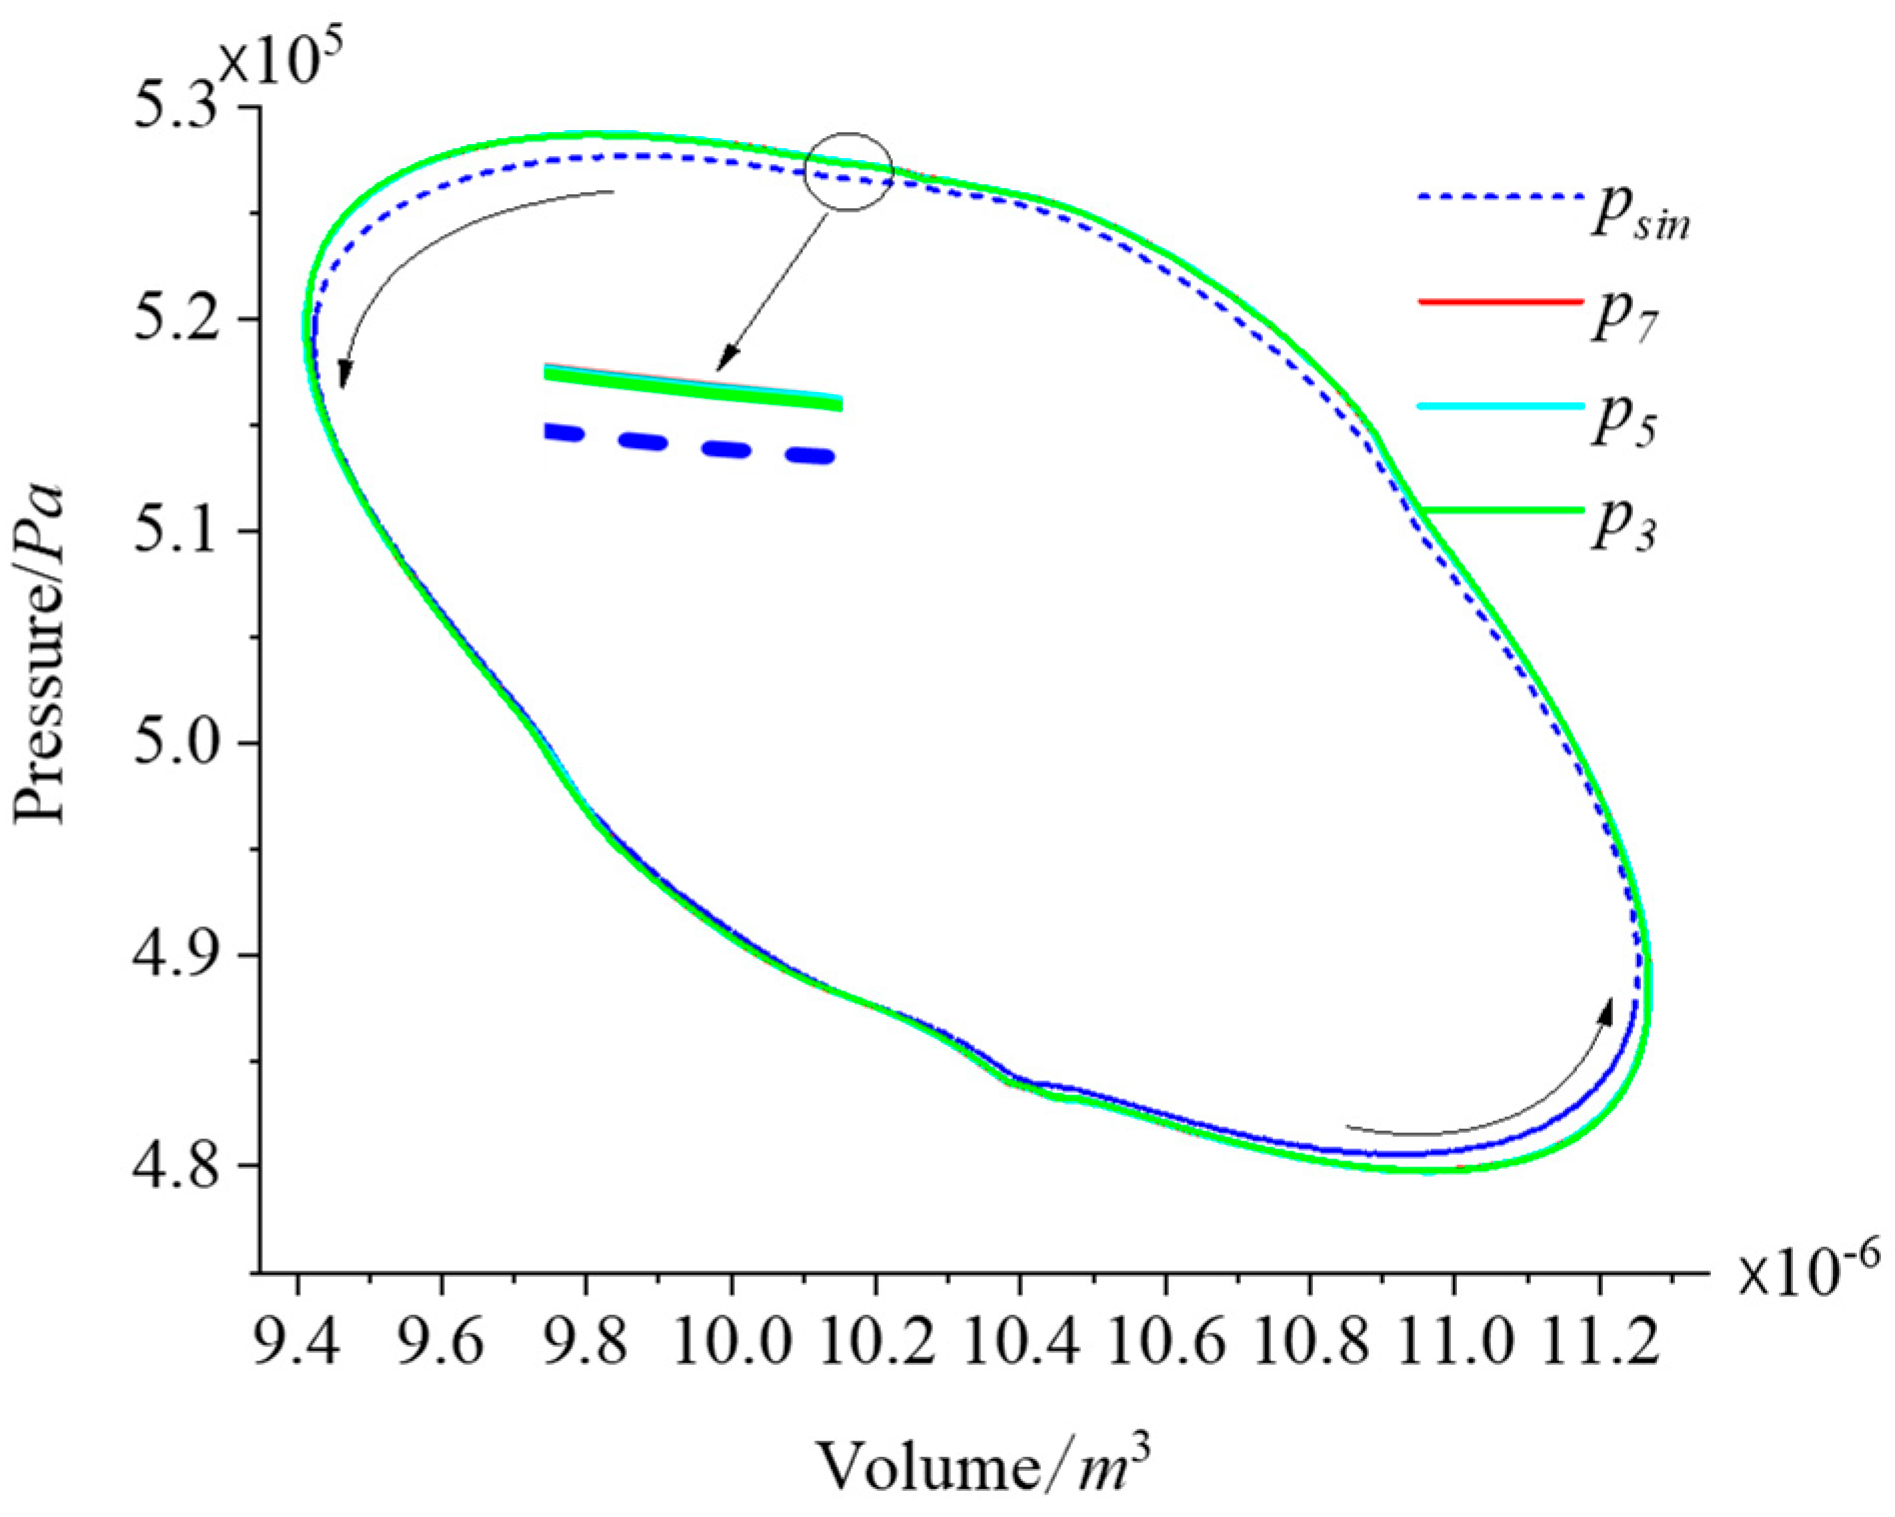
Figure 16 and Figure 17 present the pv diagrams for the expansion and compression chambers under different harmonic drives. The areas for the seventh and fifth multi-harmonic drives are identical, and both are larger than the area for the third multi-harmonic drive. The pv diagram under the harmonic drive has the smallest area.
Figure 18 illustrates the p–v diagram for the total working chamber. The calculations indicate that the power generated by the harmonic drive is 4.26 W, while the power generated by the third harmonic drive is 5.39 W. The power output for both the fifth and seventh multi-harmonic drives is 5.41 W. When using the power generated by the harmonic drive as the baseline, the power produced by the third multi-harmonic drive increases by 26.52%, whereas the power produced by the fifth and seventh multi-harmonic drives increases by 26.99%.
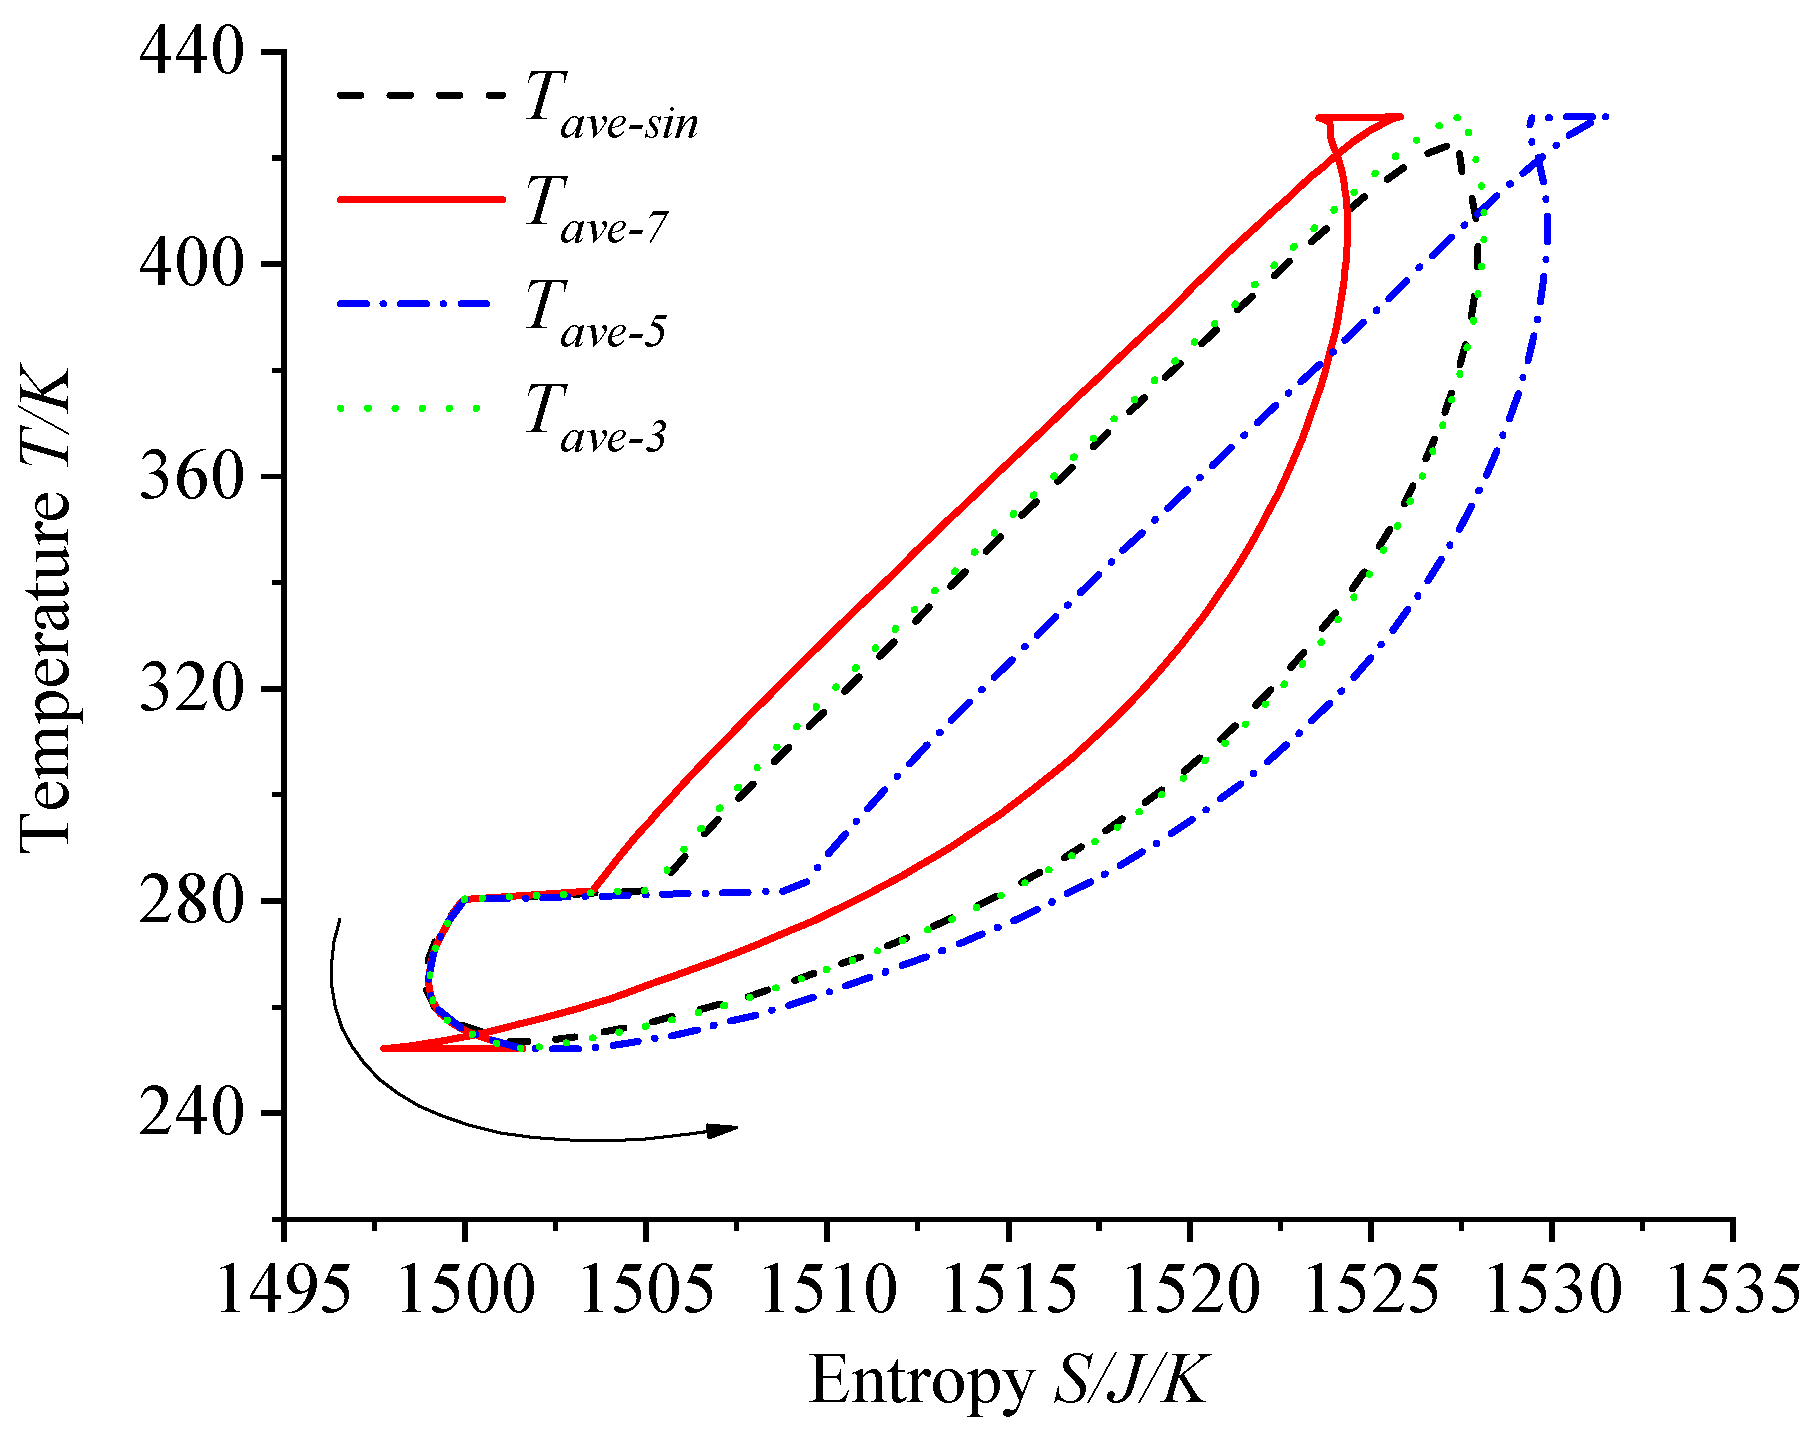
Figure 19 presents a T–s diagram comparing several different drives. It illustrates that the seventh multi-harmonic releases the most heat, followed by the fifth and third multi-harmonics, while the harmonic wave releases the least heat. The intersection points on the T–s diagram do not usually represent a physical contradiction but are instead a consequence of idealized assumptions. In simplified or idealized thermodynamic analyses, such as those neglecting heat loss or assuming quasi-static processes, such intersections can occur. These theoretical T–s curve intersections result from the idealization of the model and do not necessarily reflect actual physical conditions. Although the intersecting points share the same temperature and entropy, the state parameters (e.g., pressure, entropy) are generally different, indicating distinct physical conditions.
The COP is a crucial indicator of FPSAC performance, defined as the ratio of absorbed heat to the external work supplied. Based on the data presented in Figure 18, the COP values are as follows: COP7 = 19.35%, COP5 = 18.64%, and COP3 = COPsin = 16.94%. Using the COPsin value as a baseline, the COP values improve with changes in the drive method. Specifically, the COP for the fifth multi-harmonic increases by 10.03%, while the COP for the seventh multi-harmonic rises by 14.23%.

3.2. Impact of Different Drives on Thermodynamic and Kinetic Parameters of FPSAC in Heating Mode

In heating mode, the temperature of the expansion chamber heat exchanger Th is 290 K, while the temperature of the compression chamber Tc is 320 K, with all other operating conditions held constant. The effects of different drives on the work output and the heating performance coefficient COPh of the FPSAC are evaluated. In heating mode, the temperature of the expansion chamber heat exchanger Th is 290 K, while the compression chamber temperature Tc is 320 K, with all other operating conditions kept constant. The impact of different drive methods on the work output and heating performance coefficient COPh of the FPSAC is then evaluated.
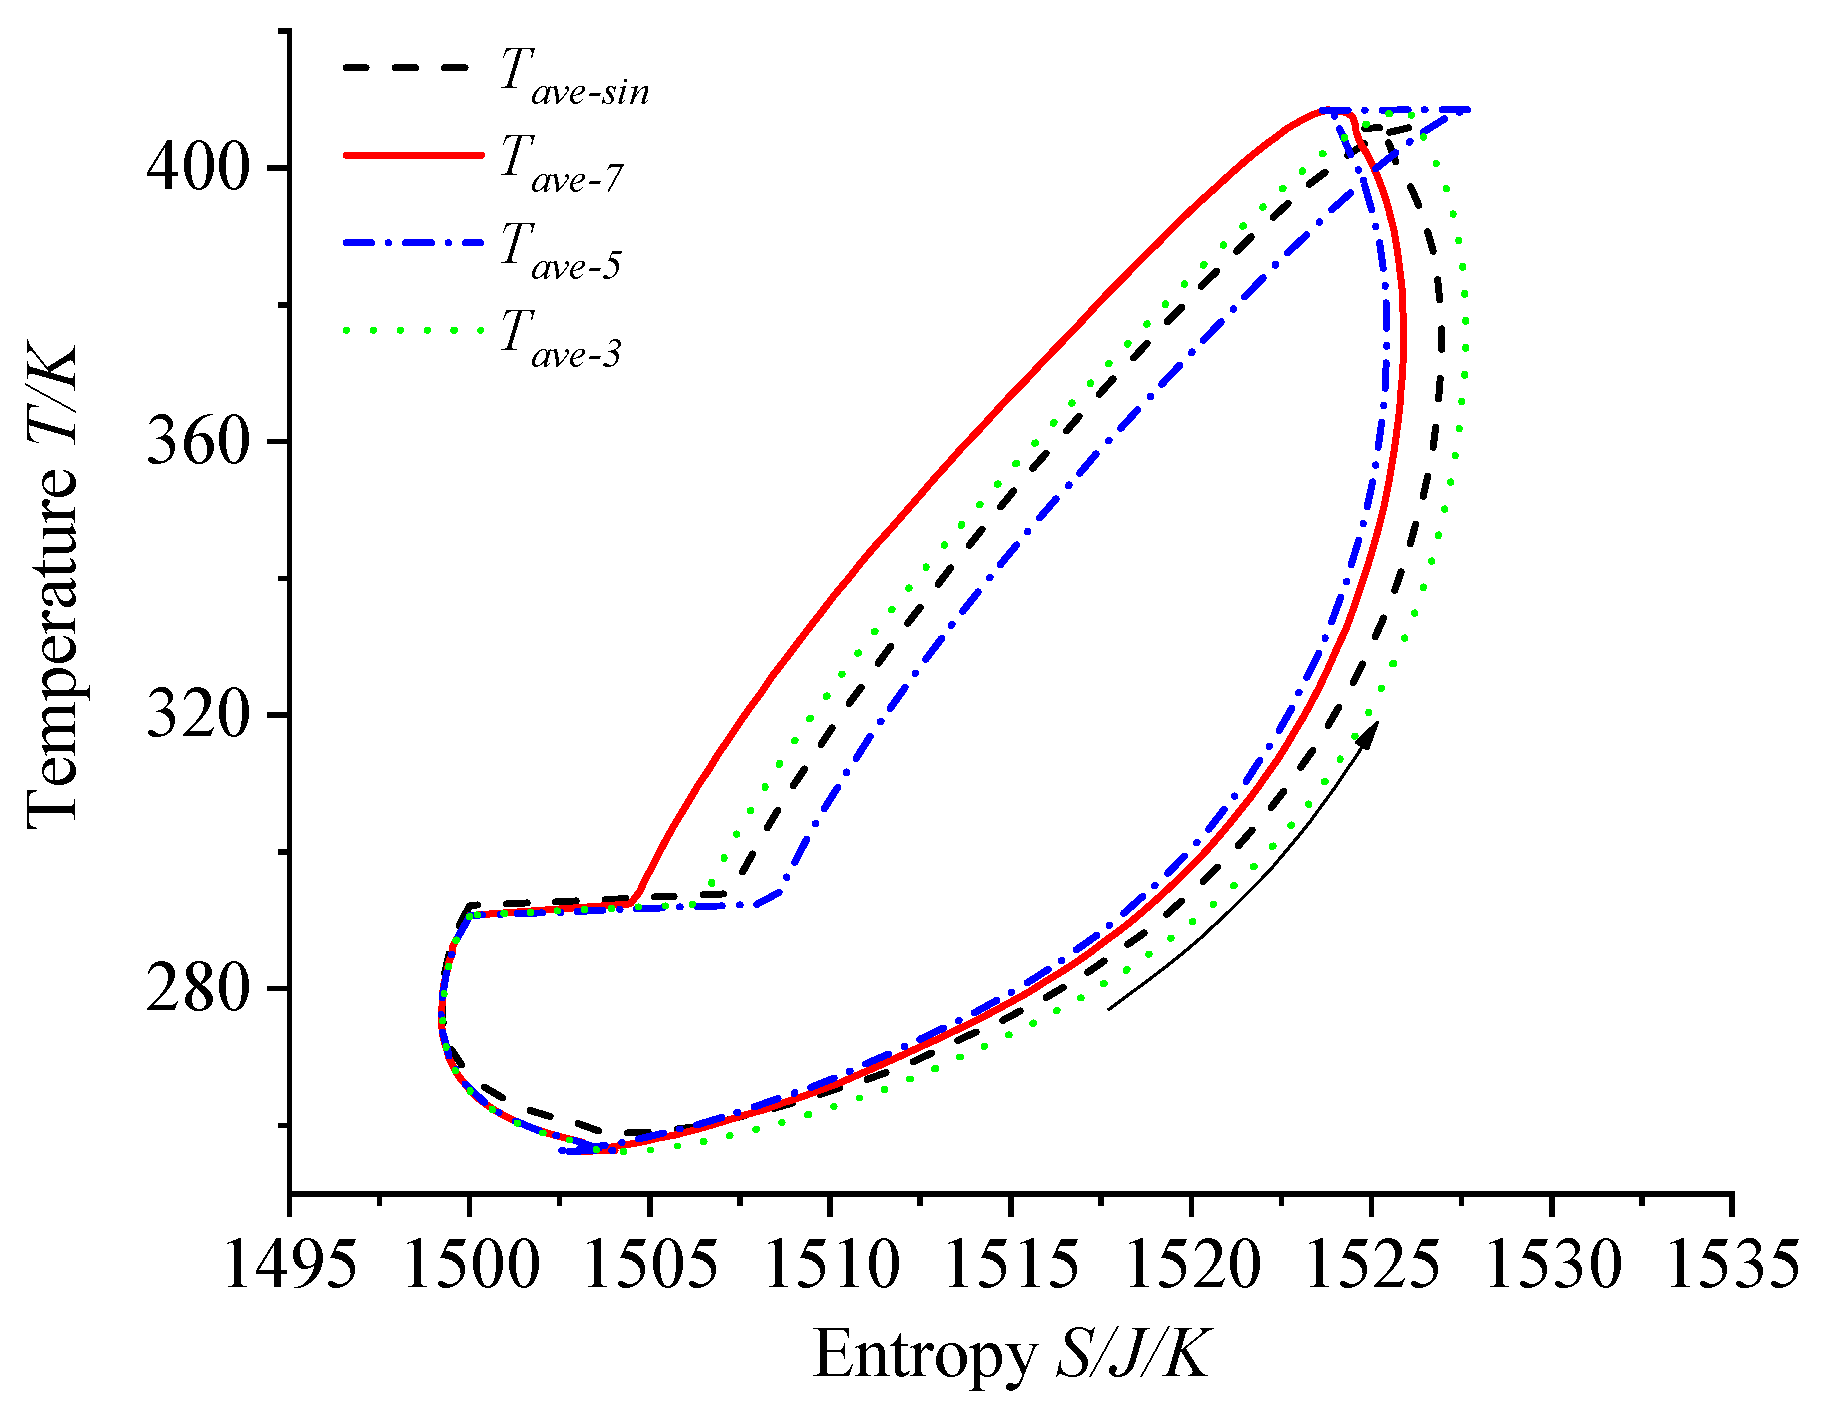
Figure 20 and Figure 21 present the p–v and T–s diagrams of the FPSAC in heating mode. As shown in Figure 21, the work performed by the harmonic drive in the working chamber is 5.01 W, while the work performed by the third, fifth, and seventh multi-harmonic drives is the same, each at 5.14 W. Using the harmonic drive as the baseline, the power output of the multi-harmonic drives increases by 2.59%. Comparing the COPh values in heating mode from Figure 19, the results are as follows: COPh7 = 108.46%, COPh5 = 106.25%, COPh3 = 105.75%, and COPhsin = 105.71%. When using the COPhsin value as the baseline, the performance coefficient COPh improves with the change in the drive method. Specifically, the COPh5 value for the fifth multi-harmonic increases by 0.51%, while the COPh7 value for the seventh multi-harmonic rises by 2.61%.

4. Performance Testing Experimental Study of FPSAC

4.1. Experimental Setup

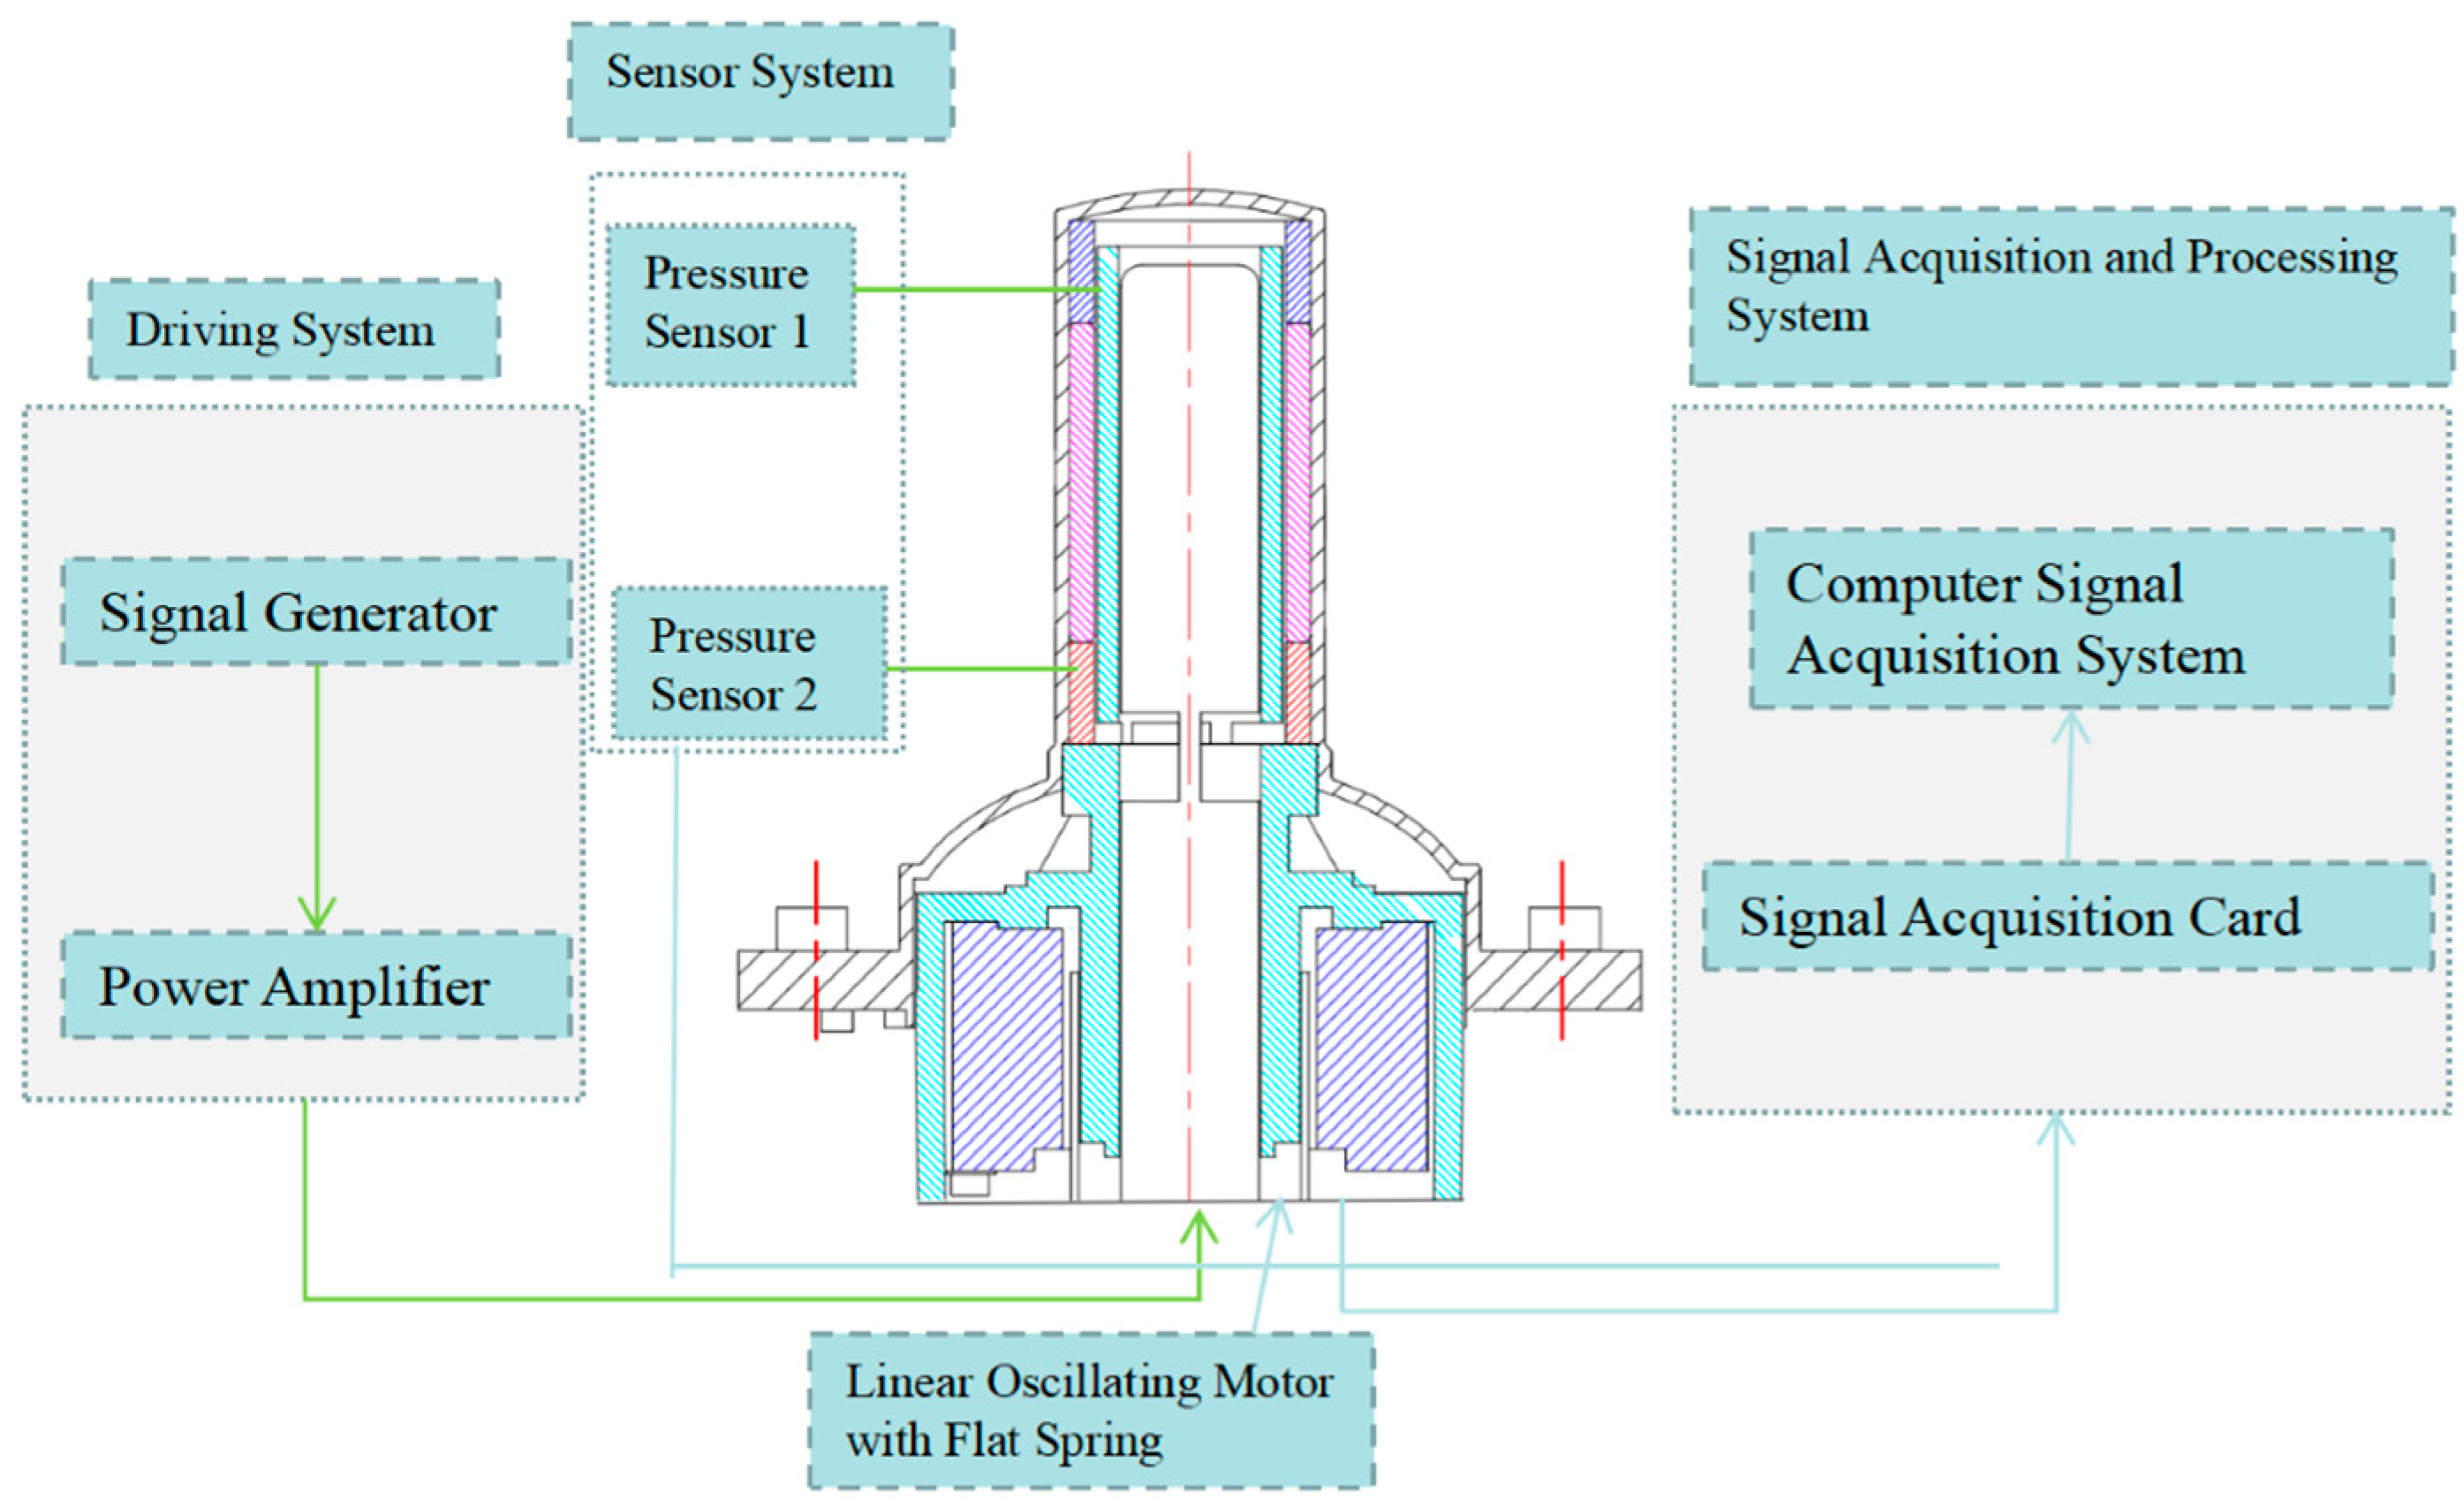
To further validate the accuracy of the numerical simulation results for the FPSAC thermodynamics–dynamics coupled model, experimental verification was conducted on the numerical solutions of both the one-dimensional third-order compressible thermodynamics and the two-dimensional nonlinear dynamics coupled models. In addition, the overall numerical results of the FPSAC under the complex frequency drive were experimentally validated. The experimental setup for the Stirling air conditioner included the drive mechanism, data acquisition system, and data processing system, as shown in the schematic in Figure 22. Prior to the experiments, the entire Stirling machine underwent vacuum treatment. Following this, the system was charged with helium gas of 99.99% purity at a specified pressure. Tests were then performed on the expansion and compression chambers of the Stirling air conditioner, with the data acquisition system primarily consisting of pressure sensors and data collection equipment.

4.2. Test Bench

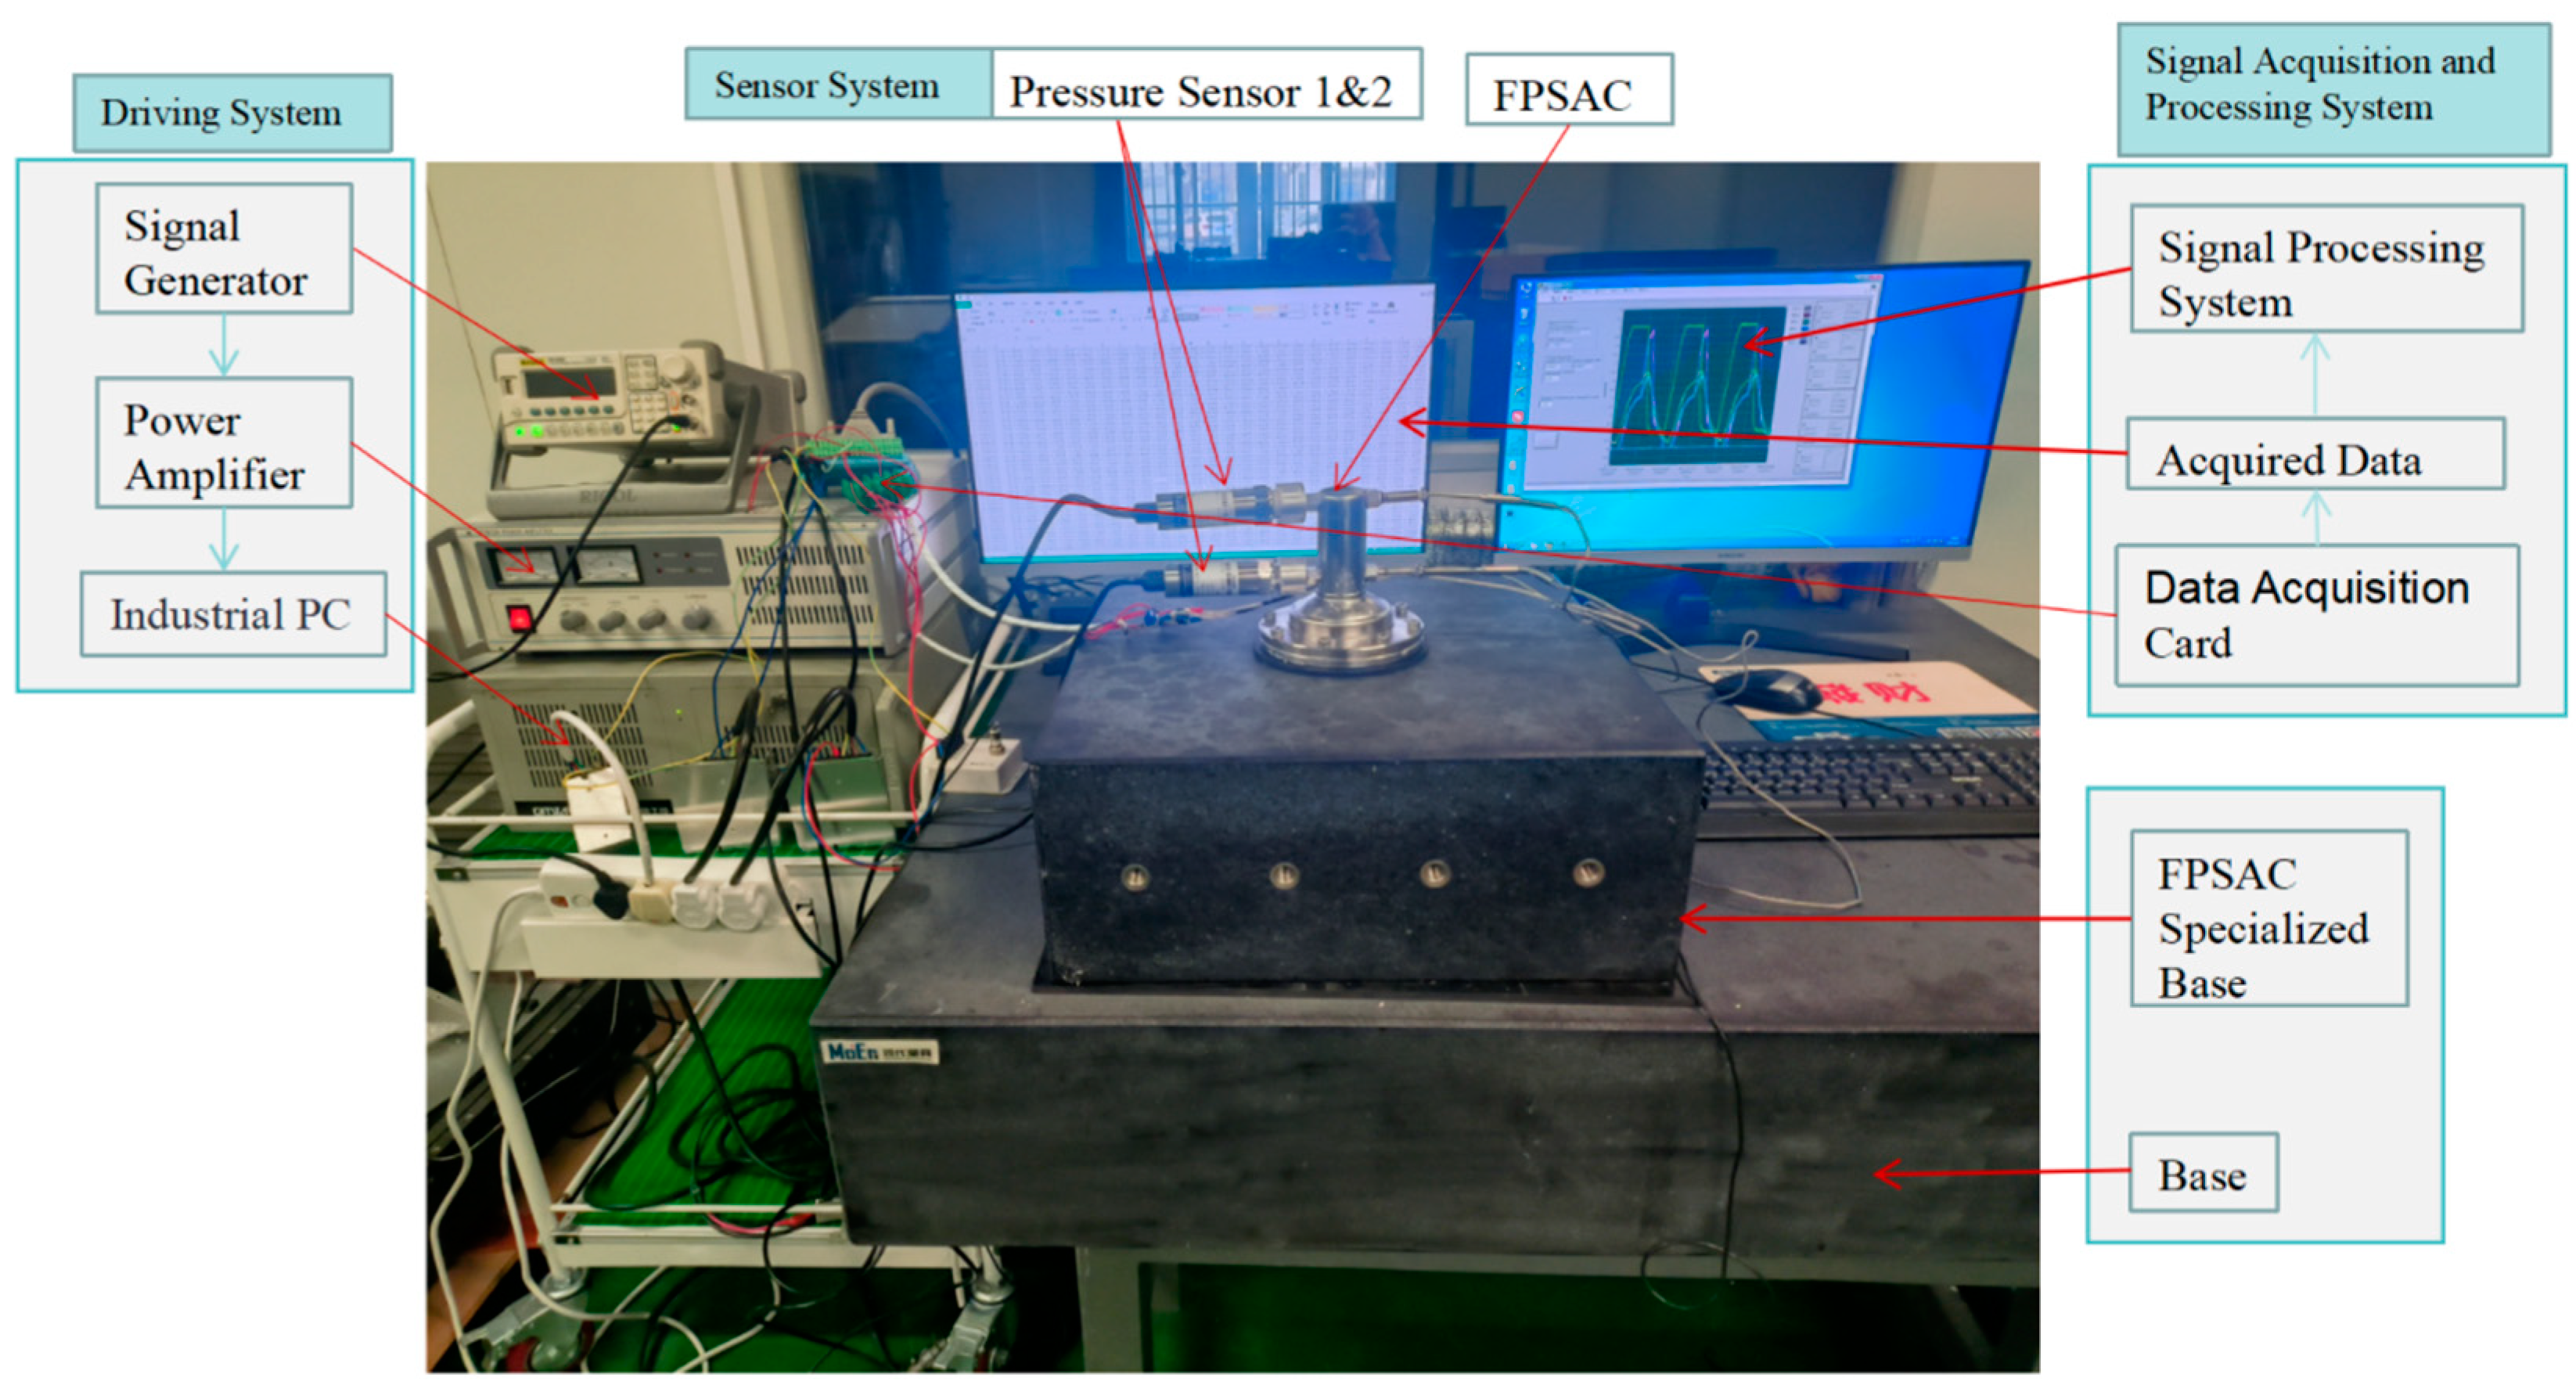
Figure 23 illustrates the test bench used for evaluating the FPSAC performance. The signal source consisted of a signal generator, a power amplifier, and an industrial PC (IPC), while the data acquisition system was equipped with pressure sensors, temperature sensors, and other measurement instruments. Additionally, the test bench included the Stirling air conditioner, its base, the Stirling unit, and other essential components.
Figure 24 shows the physical image of the high-frequency dynamic pressure sensor. The pressure sensor is primarily used to measure the pressure fluctuations in the hot and cold chambers. Given the high operating frequency of the Stirling engine and the rapid pressure variations, the pressure sensor must have a sufficiently high response rate. The pressure sensor used in the system had a measurement range of 0 to 3 MPa, an output voltage range of 0 to 5 V, a frequency response range of 0 to 2 kHz, and an accuracy of ±0.5% of the full scale (FS).

4.3. Analysis of Experimental Results

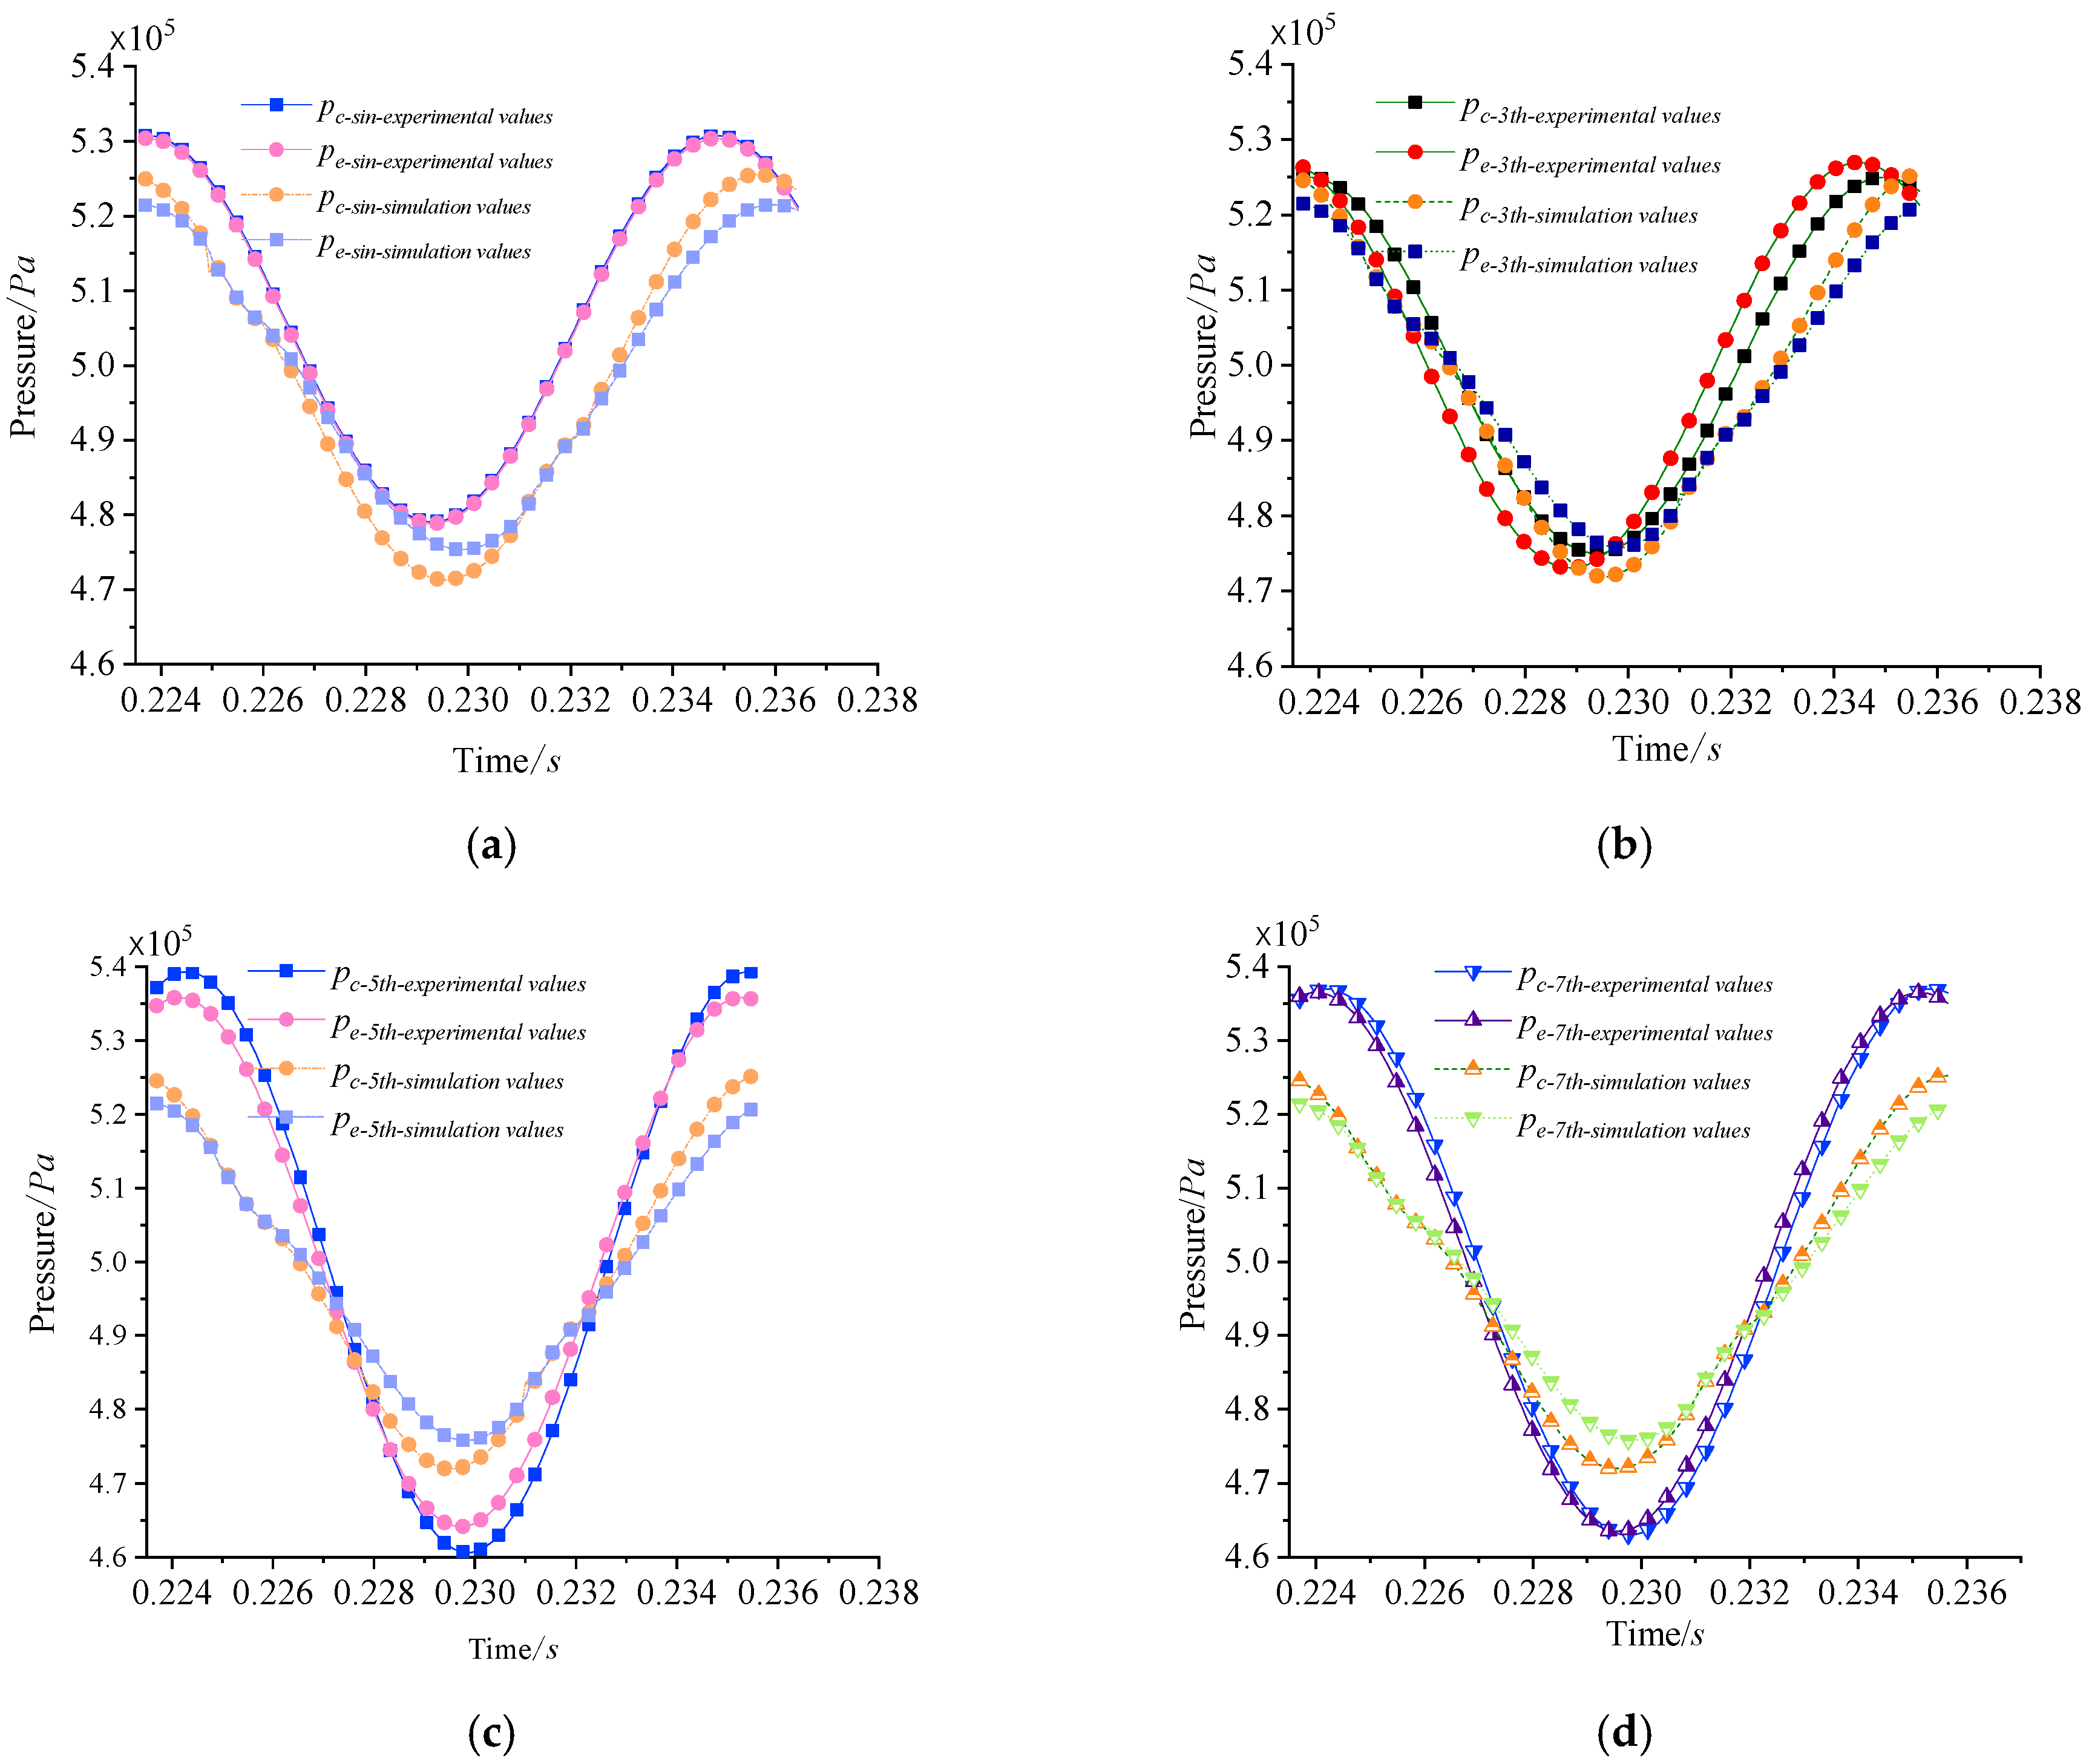
Figure 25 presents both the experimental and simulation results for the pressures in the expansion chamber pₑ and compression chamber pc. The comparison of these results, obtained using the thermodynamics–dynamics coupled model under various drive mechanisms at a filling pressure of 5 bar, is also shown for both chambers. As illustrated in Figure 25, the experimental results align well with the simulation data. Notably, the agreement between the harmonic drive and the third multi–harmonic drive was more consistent than that observed with the fifth and seventh multi-harmonic drives, which exhibited slightly larger discrepancies. For the multi-harmonic drives, the maximum error between the experimental and simulation values for both the expansion chamber pressure pe and compression chamber pressure pc was observed to be no more than 2.45% at the troughs and 3.61% at the peaks. This good agreement between the experimental and simulation results confirms the accuracy and reliability of the thermodynamics–dynamics coupled model. Furthermore, the experimental values for the first- and third-order drives (low-order drives) showed closer alignment with the simulation results compared to the fifth– and seventh–order drives (high–order drives). This discrepancy can be attributed to several factors. Firstly, low-order drive systems generally exhibit faster response times, whereas high-order systems involve more complex dynamic processes, leading to slower responses and increased delays. Secondly, the complexity and additional dynamic components of high–order systems tend to make them more susceptible to instability. As the order increases, so do the number of system poles and zeros, complicating the control of system stability and potentially resulting in more challenging dynamic behavior. Lastly, high–order drives are more prone to noise sensitivity, particularly when high-frequency noise is amplified, which can adversely affect the accuracy and stability of the system.
When the inflation pressure was set to 5 bar, the experimental results were in good agreement with the simulation results, though the experimental values were slightly higher. The observed discrepancies can be attributed to several potential factors:
(1)
Inflation pressure error. The Stirling air conditioner utilized a vacuum evacuation process, followed by the injection of air. During operation, any variations in the vacuum level, if it does not reach the desired value, could affect the final pressure readings. Furthermore, the removal of the gas nozzle after inflation could result in slight leakage, leading to deviations in the inflation pressure and contributing to measurement errors.
(2)
Modeling error. In developing the fundamental equations to simulate the operation of the Stirling air conditioner, several assumptions were made, including the consideration of axial heat conduction within the gas and the assumption of constant wall temperatures for the heat exchangers. These assumptions inevitably led to minor deviations in the simulation model.
(3)
Measurement error in experiments. Due to the structural constraints of the free-piston Stirling air conditioner, the pressure sensors could not be fully inserted into the compression and expansion chambers during the experimental tests. As a result, the measured data may deviate from the actual pressures. Although multiple measurements were taken and averaged, this process still introduces a degree of experimental measurement error.
The uncertainties in the experimental results primarily arise from the following factors:
(1)
During the development of the FPSAC system model, discrepancies between the actual performance and theoretical predictions may occur due to inaccuracies or limitations in the reference data.
(2)
Assumptions made while deriving the fundamental equations to simulate the FPSAC operating process can introduce biases into the model.
(3)
Errors resulting from the precision limitations of the chosen sensors, environmental fluctuations, and variations in the operating conditions further contribute to the overall uncertainty in the system performance experiments. Despite these factors, the cumulative effect of these uncertainties remains within an acceptable range, thereby ensuring the reliability of the experimental results.

5. Conclusions

This study is the first to propose the use of a multi-harmonic drive for a low-temperature differential linear oscillating motor to enhance the performance of a low-temperature differential FPSAC. A theoretical simulation model for the low-temperature differential free-piston Stirling air conditioner was derived based on fundamental principles. The thermodynamic-dynamic equations were decoupled, enabling the analysis of displacement, velocity, and pressure variations for any control volume. Additionally, the pv diagram and Ts diagram under stable operating conditions were obtained. These findings constitute one of the key contributions of this work. Based on the experimental and simulation results, it is confirmed that the multi-harmonic drive demonstrates higher COP values and output power, thereby proving the superiority of the multi–harmonic drive in enhancing the performance of a low-temperature differential FPSAC. This represents one of the key contributions of this study.
The FPSAC model was developed by integrating the three conservation equations of the gas, the thermal balance equation for the regenerator, and the nonlinear dynamics governing the displacer and power piston. The system of ordinary differential equations, which couples the thermodynamics of the working fluid, its distribution, and the nonlinear dynamics of the mechanical power piston, was decoupled by applying the multi-harmonic driving force from the linear oscillating motor. Based on the results from the numerical simulations and experimental tests of the FPSAC, the following conclusions can be drawn:
(1) An explicit finite difference method, utilizing upwind differencing, was employed to iteratively solve and couple the transport equations of the working fluid with the nonlinear dynamics equations, leading to a comprehensive numerical simulation. A comparative analysis was conducted on the variations in displacement, velocity, and pressure within a control volume under both multi–harmonic and harmonic wave conditions, across cooling and heating modes. Additionally, the pv and Ts diagrams for the steady–state operation of the entire machine were examined. The simulation results validated the modeling approach that couples quasi-one-dimensional third-order compressible thermodynamics with the two–dimensional nonlinear dynamics of the FPSAC.
(2) By changing the drive method, the COP value for cooling increased by 10.03% with the fifth harmonic and by 14.23% with the seventh multi-harmonic. In terms of heating performance, the COP value increased by 0.51% with the fifth harmonic and by 2.61% with the seventh harmonic. These results support the hypothesis that the multi-harmonic drive improves the overall performance of the Stirling air conditioner.
(3) The power output of the multi-harmonic drive was greater than that of the harmonic drive. In cooling mode, with the power generated by the harmonic drive as the baseline, the power output of the third multi-harmonic drive increased by 26.52%, while the fifth and seventh multi-harmonic drives exhibited a 26.99% increase. In heating mode, the power output of the multi-harmonic drive was 2.59% higher than that of the harmonic drive.
(4) During the full-machine performance test of the FPSAC, with the inflation pressure set to 5 bar, the experimental pressure results in both the expansion and compression chambers showed strong agreement with the simulation outcomes.
This study is the first to propose the use of a multi-harmonic drive to improve the performance of a low-temperature differential FPSAC. The consistency between the experimental and simulation results validates the correctness of this approach, demonstrating that a multi-harmonic drive yields higher COP values and output power. It has been demonstrated that a multi-harmonic drive enhances the performance of a low-temperature differential FPSAC. This study not only provides a theoretical framework for improving the performance of a low-temperature differential FPSAC but also expands its potential application in pure electric vehicle air conditioning systems. In terms of the industrial application of FPSAC, high-precision heat exchangers and complex drive systems may increase manufacturing costs. This issue can be addressed by developing adaptive control systems to simplify the multi-harmonic drive system.
The authors believe that future research should focus on the following areas:
(1) The numerical solution method for the Stirling air conditioner engine model should be further optimized. During the numerical simulation phase, Euler time integration was used, and the finite difference equations were presented in an entirely explicit form, leading to prolonged computation times, to enhance the applicability of the numerical.
(2) Measurements of key parameters such as the FPSAC temperature and acceleration should be conducted. The issue of FPSAC airtightness needs to be addressed, and appropriate insulation measures should be implemented. Key parameters such as the FPSAC temperature and acceleration should be measured and compared with the simulation values for a more comprehensive evaluation of the simulation model.

Author Contributions

Conceptualization, methodology, software, writing original draft, Y.W.; writing—review and editing, validation, supervision, J.Z. (Junan Zhang); writing—review and editing, J.G.; investigation, G.Z.; funding acquisition, J.Z. (Jianhua Zhang); funding acquisition, J.G. All authors have read and agreed to the published version of the manuscript.

Funding

This research was funded by Shaanxi Province’s Key Research and Development Program (General Projects) for 2024, grant number “2024-2024GX-YBXM-253”, Science and Technology Innovation Talent Program of Xianyang, grant number ”L2024-CXNL-KJRCTD-KJRC-0013”, Open Fund of State Key Laboratory of Solid Lubrication, grant number”LSL-2308”.

Data Availability Statement

Data is contained within the article.

Conflicts of Interest

The authors declare no conflicts of interest.

Nomenclature

FforceN
Bmagnetic flux densityT
xdisplacementm
x · · accelerationm2/s
llengthm
Cfriction factorN/m2
ReReynolds number
PpressurePa
Vvolumemm3
Aareamm2
Nnumber
mmassg
x · velocitym/s
cspecific heat capacityJ/kg·K
TtemperatureK
Rthermodynamic constantJ/mol·K
μdynamic viscosityN·s/m2
pxpressure gradientPa/m
QheatJ
ρdensitykg/m3

References

  1. Wong, W.A.; Wilson, K.; Smith, E.; Collins, J. Path Finding the Flight Advanced Stirling Convertor Design with the ASCE3. In Proceedings of the Tenth International Energy Conversion Engineering Conference (IECEC-2012), Atlanta, GA, USA, 30 July–1 August 2012. NASA TM-2014-21775. [Google Scholar]
  2. Jang, K.H.; Kim, H.S.; Lee, S.H. Numerical analysis of free-piston stirling cooler systems for improving cooling performance. Case Stud. Therm. Eng. 2022, 37, 102272. [Google Scholar] [CrossRef]
  3. Onwuemezie, L. Numerical study of H2-fuelled micro-free piston CHP system, coupled with thermophotovoltaic (TPV) and battolyser units. Process Saf. Environ. Prot. 2024, 192, 13–25. [Google Scholar] [CrossRef]
  4. Wang, Y.; Zhang, J.; Liu, B.; Dong, H.; Liu, X. Progress in Applications of Reverse Stirling Cycle Technology in Air Conditioning System of Pure Electric Vehicles. J. Xi’an Technol. Univ. 2021, 6, 609–620. [Google Scholar]
  5. Corporation, I. High-Efficiency Stirling Air Conditioning: Office of Scientific & Technical Information Technical Reports; Advanced Research Projects Agency: Ballston, VA, USA, 2012. [Google Scholar]
  6. Mraz, S.J. Stirling Cycle for Solar Power and Air Conditioning. Mach. Des. 2011, 83, 19. [Google Scholar]
  7. Hachem, H.; Gheith, R.; Aloui, F.; Nasrallah, S.B.; Dincer, I. Exergy Assessment of Heat Transfer inside a Beta Type Stirling Engine. Int. J. Exergy 2016, 20, 186–202. [Google Scholar]
  8. Hachem, H.; Gheith, R.; Nasrallah, S.B.; Aloui, F. Impact of Operating Parameters on Beta Type Regenerative Stirling Machine Performances. In Proceedings of the ASME-JSME-KSME 2015, Joint Fluids Engineering Conference, Seoul, Republic of Korea, 26–31 July 2015; p. 22088. [Google Scholar]
  9. Hachem, H.; Gheith, R.; Aloui, F.; Ben Nasrallah, S. Numerical characterization of a γ-Stirling engine considering losses and interaction between functioning parameters. Energy Convers. Manag. 2015, 96, 532–543. [Google Scholar] [CrossRef]
  10. Luo, K.; Sun, Y.; Luo, E.; Hu, J.; Wu, Z.; Zhang, L.; Jia, Z.; Jiang, Z.; Zhou, Y. Investigation on the Electric-Driven High Power Free-Piston Stirling Cooler at Air-Conditioning Temperature Range. J. Eng. Therm. 2022, 43, 2623–2630. [Google Scholar]
  11. Mou, J.; Hong, G. Startup mechanism and power distribution of free piston Stirling engine. Energy 2017, 123, 655–663. [Google Scholar] [CrossRef]
  12. Valenti, G.; Bischi, A.; Campanari, S.; Silva, P.; Ravida, A.; Macchi, E. Experimental and Numerical Study of a Microcogeneration Stirling Unit under On–Off Cycling Operatio. Energies 2021, 14, 801. [Google Scholar] [CrossRef]
  13. Minale, T.; Lanzetta, F.; Bégot, S.; Getie, M.Z. Review on the technological advancement of Stirling cycle heat pumps. Energy Rep. 2024, 12, 3504–3518. [Google Scholar] [CrossRef]
  14. Regalado-Rodríguez, N.; Militello, C. Comparative study of the effects of increasing heat transfer area within compression and expansion chambers in combination with modified pistons in Stirling engines. A simulation approach based on CFD and a numerical thermodynamic model. Energy Convers. Manag. 2022, 268, 115930. [Google Scholar] [CrossRef]
  15. Wang, K.; Dubey, S.; Choo, F.H.; Duan, F.A. A transient One-dimensional Numerical Model for Kinetic Stirling Engine. Appl. Energy 2016, 183, 775–790. [Google Scholar] [CrossRef]
  16. Chi, C.; Li, R.; Mou, J.; Lin, M.; Jiao, K.; Yang, M.; Liu, H.; Hong, G. Theoretical and Experimental Study of Free Piston Stirling Generator for High Cold End Temperatures. Energy 2024, 289, 129841. [Google Scholar] [CrossRef]
  17. Yang, H.S.; Zhu, H.Q.; Xiao, X.Z. Comparison of the Dynamic Characteristics and Performance of Beta-type Stirling Engines Operating with Different Driving Mechanisms. Energy 2023, 275, 127535. [Google Scholar] [CrossRef]
  18. Ukan, R.; Yakn, A.; Behet, R. Second law analysis of an internal combustion engine for different fuels consisting of NaBH4, ethanol and methanol mixtures. Int. J. Hydrogen Energy 2024, 49, 1257–1267. [Google Scholar] [CrossRef]
  19. Cabir, B.; Yakin, A. Evaluation of gasoline-phthalocyanines fuel blends in terms of engine performance and emissions in gasoline engines. J. Energy Inst. 2024, 112, 101483. [Google Scholar] [CrossRef]
  20. Yakin, A.; Mehmet, G.; Celebi, S.; Demir, U.; Yilmaz, E. Investigation of the performance and emission effects of ammonia-borane as a B–N-based amine-borane adduct in gasoline engines. Int. J. Hydrogen Energy 2024, 87, 1129–1139. [Google Scholar] [CrossRef]
  21. Finkelstein, T. Thermodynamic Analysis of Stirling Engines. J. Spacecr. Rockets 2012, 4, 1184–1189. [Google Scholar] [CrossRef]
  22. Urieli, I.; Berchowitz, D.M. Stirling Cycle Engine Analysis; Adam Hilger: Bristol, UK, 1984. [Google Scholar]
  23. Schock, A. Stirling Engine Nodal Analysis Program. J. Energy 1978, 2, 354–362. [Google Scholar] [CrossRef]
  24. Goldberg, L.F. One and Two-Dimensional Stirling Machine Simulation Using Experimentally Generated Reversing Flow Turbulence Models; NASA-CR-185285; NASA: Washington, DC, USA, 1990.
  25. Andersen, S.K. Numerical Simulation of Cyclic Thermodynamic Processes; Technical University of Denmark: Kongens Lyngby, Denmark, 2006. [Google Scholar]
  26. Deetlefs, I.N. Design, Simulation, Manufacture and Testing of a Free-Piston Stirling Engine; University of Stellenbosch: Stellenbosch, South Africa, 2014. [Google Scholar]
  27. Mohammadi, M.A.; Jafarian, A. CFD Simulation to Investigate Hydrodynamics of Oscillating Flow in a Beta-type Stirling Engine. Energy 2018, 153, 287–300. [Google Scholar] [CrossRef]
  28. Kropiwnicki, J. Low temperature rotary Stirling engine: Conceptual design and theoretical analysis. Appl. Therm. Eng. 2024, 257, 124276. [Google Scholar] [CrossRef]
  29. Yang, D.; Gschwendtner, M.; Waleed, Z.; Protheroe, M. The pressure-volume relationship in an ideal Stirling refrigerator. Cryogenics 2024, 141, 103882. [Google Scholar] [CrossRef]
  30. Ye, W.; Wang, W.; Long, H.; Sun, S.; Kong, L. Effect of thermodynamic-dynamic parameters on the oscillation and performance of a free piston Stirling engine. Appl. Ther. Eng. 2024, 253, 123845. [Google Scholar] [CrossRef]
  31. Bert, J.; Chrenko, D.; Sophy, T.; Moyne, L.; Sirot, F. Simulation, experimental validation and kinematic optimization of a Stirling engine using air and helium. Energy 2014, 78, 701–712. [Google Scholar] [CrossRef]
  32. Masser, R.; Khodja, A.; Scheunert, M.; Schwalbe, K.; Fischer, A. Optimized piston motion for an alpha-type Stirling engine. Entropy 2020, 22, 700. [Google Scholar] [CrossRef] [PubMed]
  33. Paul, R.; Khodja, A.; Fischer, A.; Masser, R.; Hoffmann, H. Power-optimal control of a Stirling engine’s frictional piston motion. Entropy 2022, 24, 362. [Google Scholar] [CrossRef] [PubMed]
  34. Zainudin, M.; Bakar, R.; Ming, G. Kinematic and thermodynamic operational analysis of rhombic-drive Stirling engine prototype. IOP Conf. Ser. Mater. Sci. Eng. 2020, 788, 012070. [Google Scholar] [CrossRef]
  35. Briggs, M. Improving power density of free-piston stirling engines. In Proceedings of the 14th International Energy Conversion Engineering Conference, Salt Lake City, UT, USA, 25–27 July 2016; p. 5016. [Google Scholar]
  36. Craun, M.; Bamieh, B. Optimal periodic control of an ideal stirling engine model. J. Dyn. Syst. Meas. Control 2015, 137, 071002. [Google Scholar] [CrossRef]
  37. Wong, H.; Goh, S. Experimental comparison of sinusoidal motion and non-sinusoidal motion of rise-dwell-fall-dwell in a Stirling engine. J. Mech. Eng. Sci. 2020, 14, 6971–6981. [Google Scholar] [CrossRef]
  38. Karabulut, H.; Okur, M.; Cinar, C. Mechanical Configuration and Thermodynamic Analysis of an Alpha-Type Stirling Engine with Crank-Shifted Driving Mechanism. Iran. J. Sci. Technol. Trans. Mech. Eng. 2022, 46, 431–448. [Google Scholar] [CrossRef]
  39. Öztürk, E. Optimization of a novel drive mechanism approaching the ideal cycle for beta type Stirling engines. Eng. Sci. Technol. Int. J. 2023, 47, 101555. [Google Scholar] [CrossRef]
  40. Wang, Y.; Zhao, K.; Zhang, J. Study on the Thermodynamic–Kinetic Coupling Characteristics of Free-Piston Stirling Air Conditioning. Energies 2024, 17, 5795. [Google Scholar] [CrossRef]
  41. Wang, Y.; Zhang, J.; Lu, Z.; Liu, B.; Dong, H. Analysis of Radial Heat Transfer Characteristics of Oscillating Flow in Regenerator with Normal Hexagonal Bundle. Energies 2023, 16, 6411. [Google Scholar] [CrossRef]
  42. Wang, Y.; Zhang, J.; Lu, Z.; Liu, J.; Liu, B.; Dong, H. Analytical Solution of Heat Transfer Performance of Grid Regenerator in Inverse Stirling Cycle. Energies 2022, 15, 7024. [Google Scholar] [CrossRef]
  43. Wang, Y.; Zhang, J.; Zhang, T.; Lu, Z.; Dong, H. Analysis and experiment of heat transfer performance of straight-channel grid regenerator. Int. J. Heat Technol. 2022, 40, 781–791. [Google Scholar] [CrossRef]
  44. Jin, D. Technologies of Stirling Engine; Harbin Engineering University Press: Harbin, China, 2009. [Google Scholar]
  45. De La Bat, J.G. Theoretical Simulation, Manufacture and Experimental Evaluation of a Free-Piston Stirling Engine Electric Generator. Ph.D. Thesis, Faculty of Engineering, University of Stellenbosch, Stellenbosch, South Africa, 2019. [Google Scholar]
  46. De la Bat, B.; Harms, T.; Dobson, R.; Bell, A. Derivation and numerical case study of a one-dimensional, compressible-flow model of a novel free-piston Stirling engine. Energy 2020, 199, 117404. [Google Scholar] [CrossRef]
  47. Bird, R.; Stewart, W.; Lightfoot, E. Transport Phenomena, 2nd ed.; John Wiley and Sons Inc.: New York, NY, USA, 2002. [Google Scholar]
  48. Sari, M.; Ouazir, Y.; Mezani, S. New 2-D Quasi-Analytical Computation of Eddy Currents in Axisymmetrical Problems: Application to Tubular Linear Induction Motor. IEEE Trans. Magn. 2023, 3, 1–13. [Google Scholar] [CrossRef]
  49. Sun, Z.; Jia, G.; Huang, C.; Zhou, W.; Mao, Y.; Lei, Z. Accurate Modeling and Optimization of Electromagnetic Forces in an Ironless Halbach-Type Permanent Magnet Synchronous Linear Motor. Energies 2023, 16, 5785. [Google Scholar] [CrossRef]
  50. Ranieri, S.; Prado, G.; MacDonald, B. Efficiency Reduction in Stirling Engines Resulting from Sinusoidal Motion. Energies 2018, 11, 2887. [Google Scholar] [CrossRef]
  51. Muzzo, L.E.; Matoba, G.K.; Ribeiro, L.F. Uncertainty of pipe flow friction factor equations. Mech. Res. Commun. 2021, 116, 103764. [Google Scholar] [CrossRef]
  52. Gedeon, D.; Wood, J. Oscillating-Flow Regenerator Test Rig: Hardware and Theory with Derived Correlations for Screens and Felts; NASA-CR-198442; NASA: Washington, DC, USA, 1996.
Figure 1. FPSAC model.
Processes 13 00134 g001
Figure 2. Illustration of the one-dimensional discretization scheme applied to working space of FPSAC.
Processes 13 00134 g002
Figure 3. Different waveforms. They should be listed as: (a)multi-harmonic; (b)ideal waveform.
Processes 13 00134 g003
Figure 4. Cold-/hot-end heat exchanger structure.
Processes 13 00134 g004
Figure 5. Energy balance of the regenerator matrix.
Processes 13 00134 g005
Figure 6. Gradient-based counter flow boundary temperature.
Processes 13 00134 g006
Figure 7. Top-level flow diagram of the simulation program.
Processes 13 00134 g007
Figure 8. Displacement curves of the power piston and the displacer under harmonic drive. They should be listed as follows: (a) the displacement changes in the displacer and the power piston from startup to steady-state operation; (b) displacement diagrams of the power piston and the displacer over three cycles.
Processes 13 00134 g008
Figure 9. Volume diagram of the expansion, compression, and total working chamber under harmonic drive. They should be listed as follows: (a) volume changes from startup to steady operation; (b) volume changes over three cycles.
Processes 13 00134 g009
Figure 10. Pressure curve diagram of the expansion and compression chamber under harmonic drive. They should be listed as follows: (a) pressure changes from startup to steady operation; (b) pressure changes over three cycles.
Processes 13 00134 g010
Figure 11. The p–v diagram of the expansion and compression chambers under harmonic drive. They should be listed as follows: (a) the p–v diagram of the compression chamber from startup to steady operation; (b) the p–v diagram of the expansion chamber from startup to steady operation.
Processes 13 00134 g011
Figure 12. The p–v diagram of the indicated work for one cycle under harmonic drive. They should be listed as follows: (a) the p–v diagram of the indicated work for the compression chamber and expansion chamber; (b) the p–v diagram of the indicated work for the total working chamber.
Processes 13 00134 g012
Figure 13. Temperature–entropy (T–s) diagram of the working chamber for one cycle under harmonic drive.
Processes 13 00134 g013
Figure 14. Displacement diagrams under different harmonic drives.
Processes 13 00134 g014
Figure 15. Pressure diagrams under different harmonic drives.
Processes 13 00134 g015
Figure 16. p–v diagram of the indicated work for the compression chamber over one cycle.
Processes 13 00134 g016
Figure 17. p–v diagram of the indicated work for the expansion chamber over one cycle.
Processes 13 00134 g017
Figure 18. P–v diagram of the indicated work for the total working chamber.
Processes 13 00134 g018
Figure 19. T–s diagram of temperature and entropy for one cycle.
Processes 13 00134 g019
Figure 20. p–v diagram of the indicated work for the total working chamber in heating mode.
Processes 13 00134 g020
Figure 21. T–s diagram for one cycle in heating mode.
Processes 13 00134 g021
Figure 22. Experimental setup for pressure performance testing of FPSAC.
Processes 13 00134 g022
Figure 23. Test bench for pressure performance testing of FPSAC.
Processes 13 00134 g023
Figure 24. The pressure sensor (Hongmu Technology Co., Ltd., Nanjing, China).
Processes 13 00134 g024
Figure 25. Comparison of experimental and simulation results for expansion chamber pe and compression chamber pc. They should be listed as follows: (a) harmonic drive; (b) third multi-harmonic drive; (c) fifth harmonic wave drive; (d) seventh harmonic wave drive.
Processes 13 00134 g025
Table 1. Simulation setup and operating parameters.
Simulation ParametersValueUnit
Time stepdt = 17 × 10−10s
No. of heater cellsNh = 50
No. of cooler cellsNc = 50
No. of regenerator cellsNr = 50
Working fluidHe
Average charge pressure p0 = 5 × 10⁵Pa
Total engine gas massmt = 0.03 g
Hot-end temperatureTh = 320 K
Cold-end temperatureTc = 290K
Table 2. Structural parameters and dynamic parameters.
Structural Parameters and Dynamic ParametersValueUnit
Heater lengthLh = 14.2mm
Cooler lengthLc = 14.2mm
Regenerator length Lr = 45.0mm
Regenerator inner diameterr = 0.7mm
Regenerator outer diameterR = 1mm
Displacer diameterD1 = 19.343mm
Displacer shaft diameterD2 = 3.2791mm
Power piston diameter D3 = 19.4602mm
Heater/cooler lengthLrl = 4.4mm
Heater/cooler widthLrw = 0.3mm
Heater/cooler heightLrh = 12.5mm
Displacer lengthL1 = 63.62mm
Power piston lengthL3 = 65.05mm
Distance between the power piston and the upper chamberLE = 6.18mm
Distance between the displacer and the upper chamberLc = 6.18mm
Displacer massmd = 18.2g
Power piston massmp = 60.4g
Displacer spring stiffnesskd = 4.7N/mm
Power piston spring stiffnesskp = 6.2N/mm
Linear motor operating frequencyf = 80Hz
Disclaimer/Publisher’s Note: The statements, opinions and data contained in all publications are solely those of the individual author(s) and contributor(s) and not of MDPI and/or the editor(s). MDPI and/or the editor(s) disclaim responsibility for any injury to people or property resulting from any ideas, methods, instructions or products referred to in the content.