

Evaluating Nitrogen Gas Injection Performance for Enhanced Oil Recovery in Fractured Basement Complex Reservoirs: Experiments and Modeling Approaches

Abstract
:1. Introduction
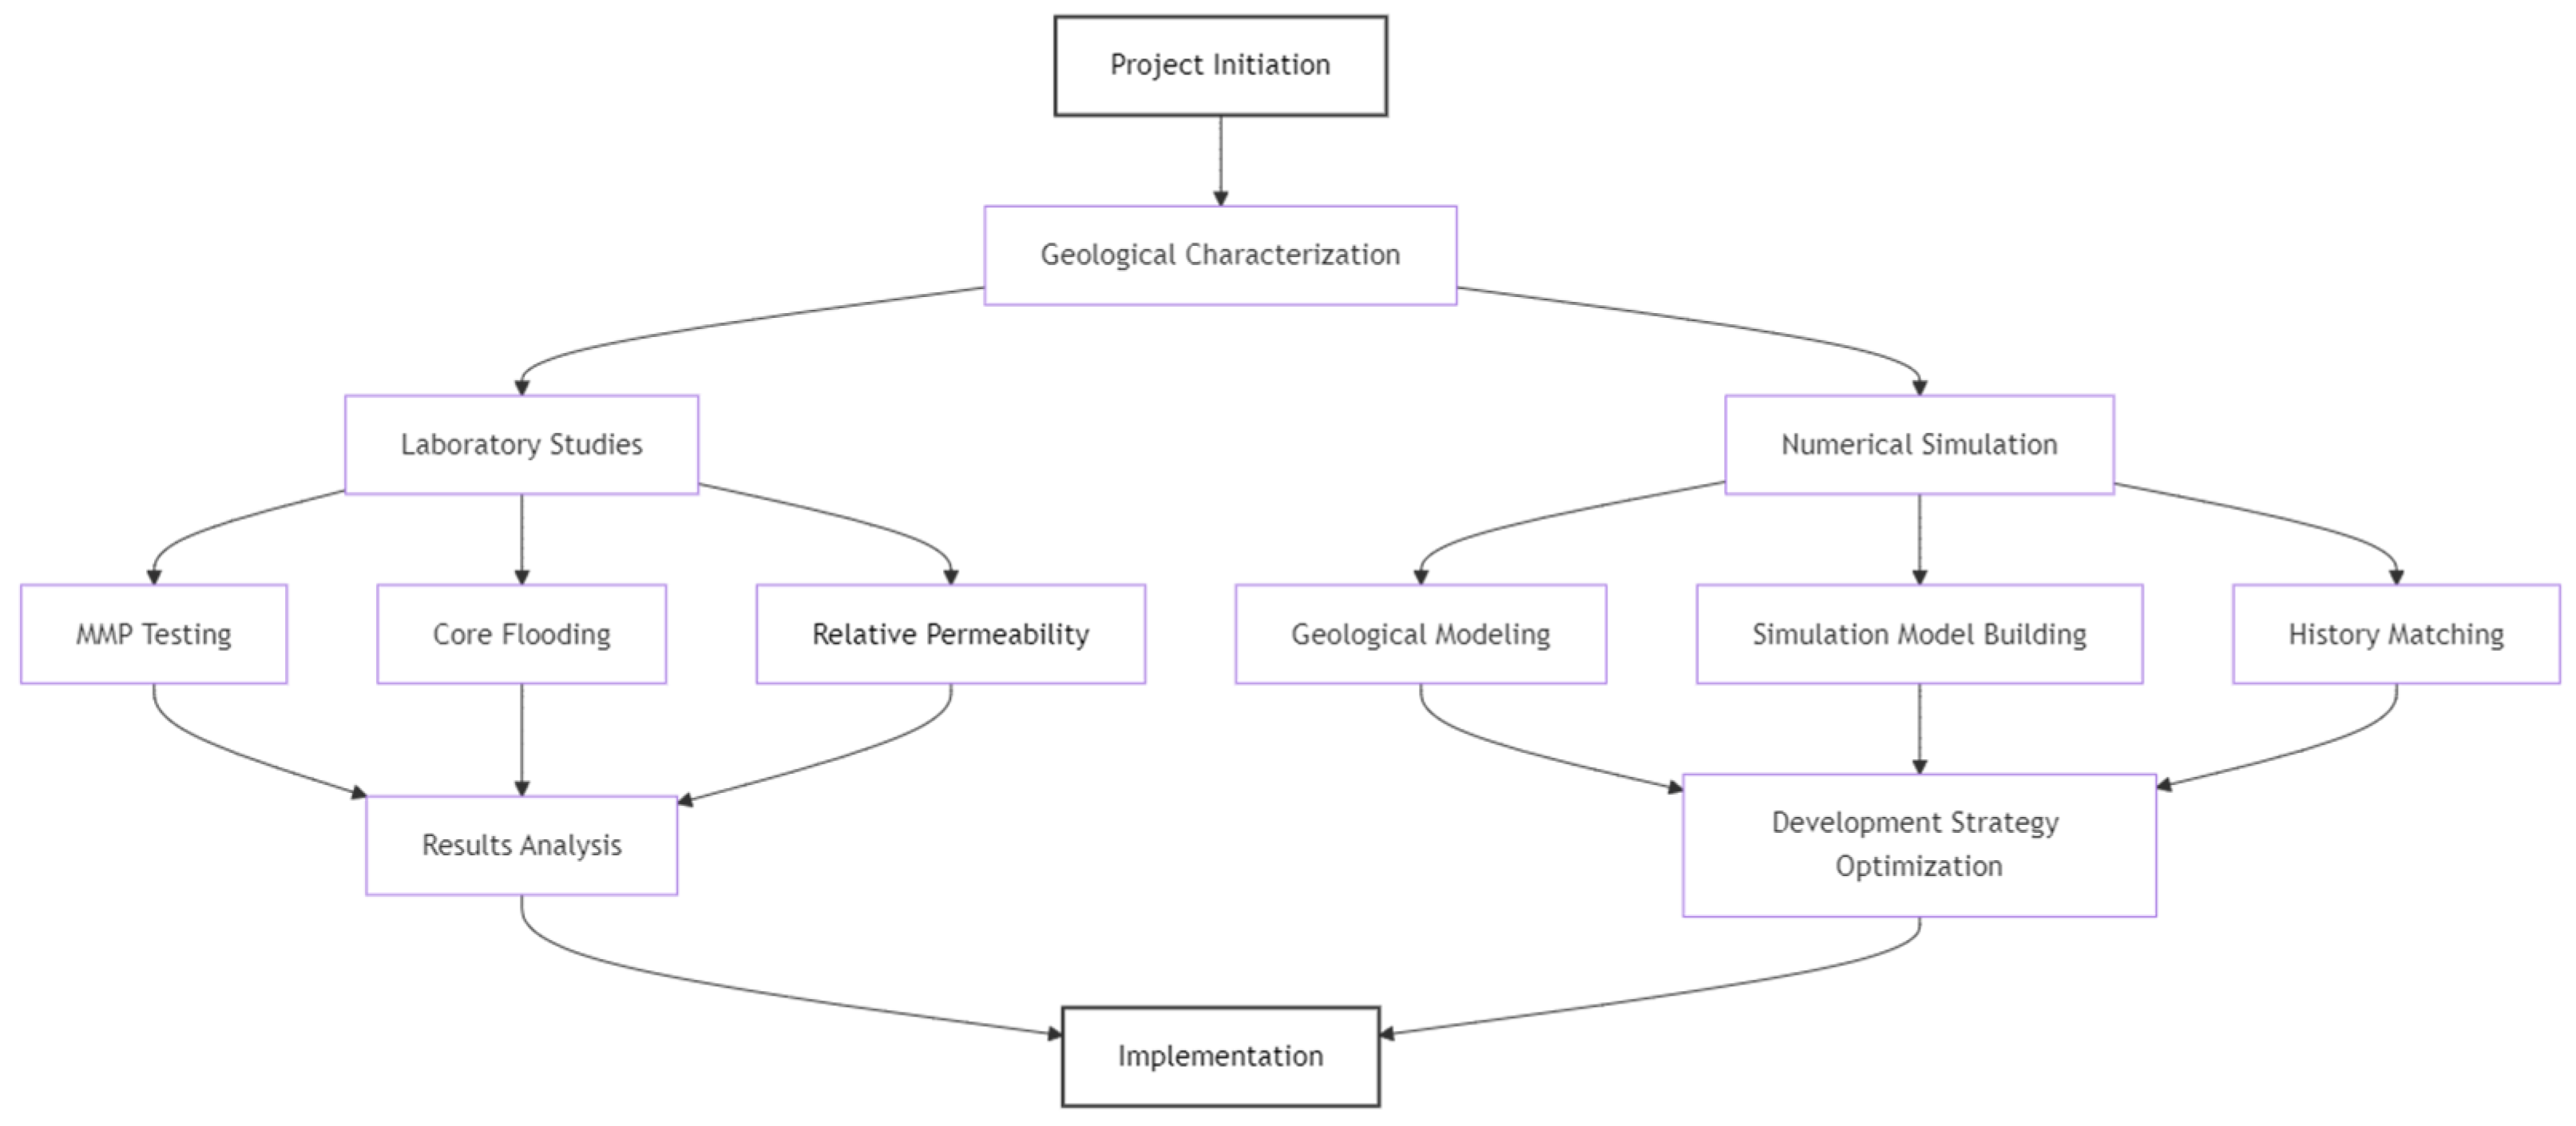
2. Methods
2.1. Laboratory Methods
2.1.1. The Minimum Miscibility Pressure (MMP) Test
2.1.2. Core Flooding Experiments
2.1.3. The Relative Permeability Experiment
2.2. Numerical Simulation Methods
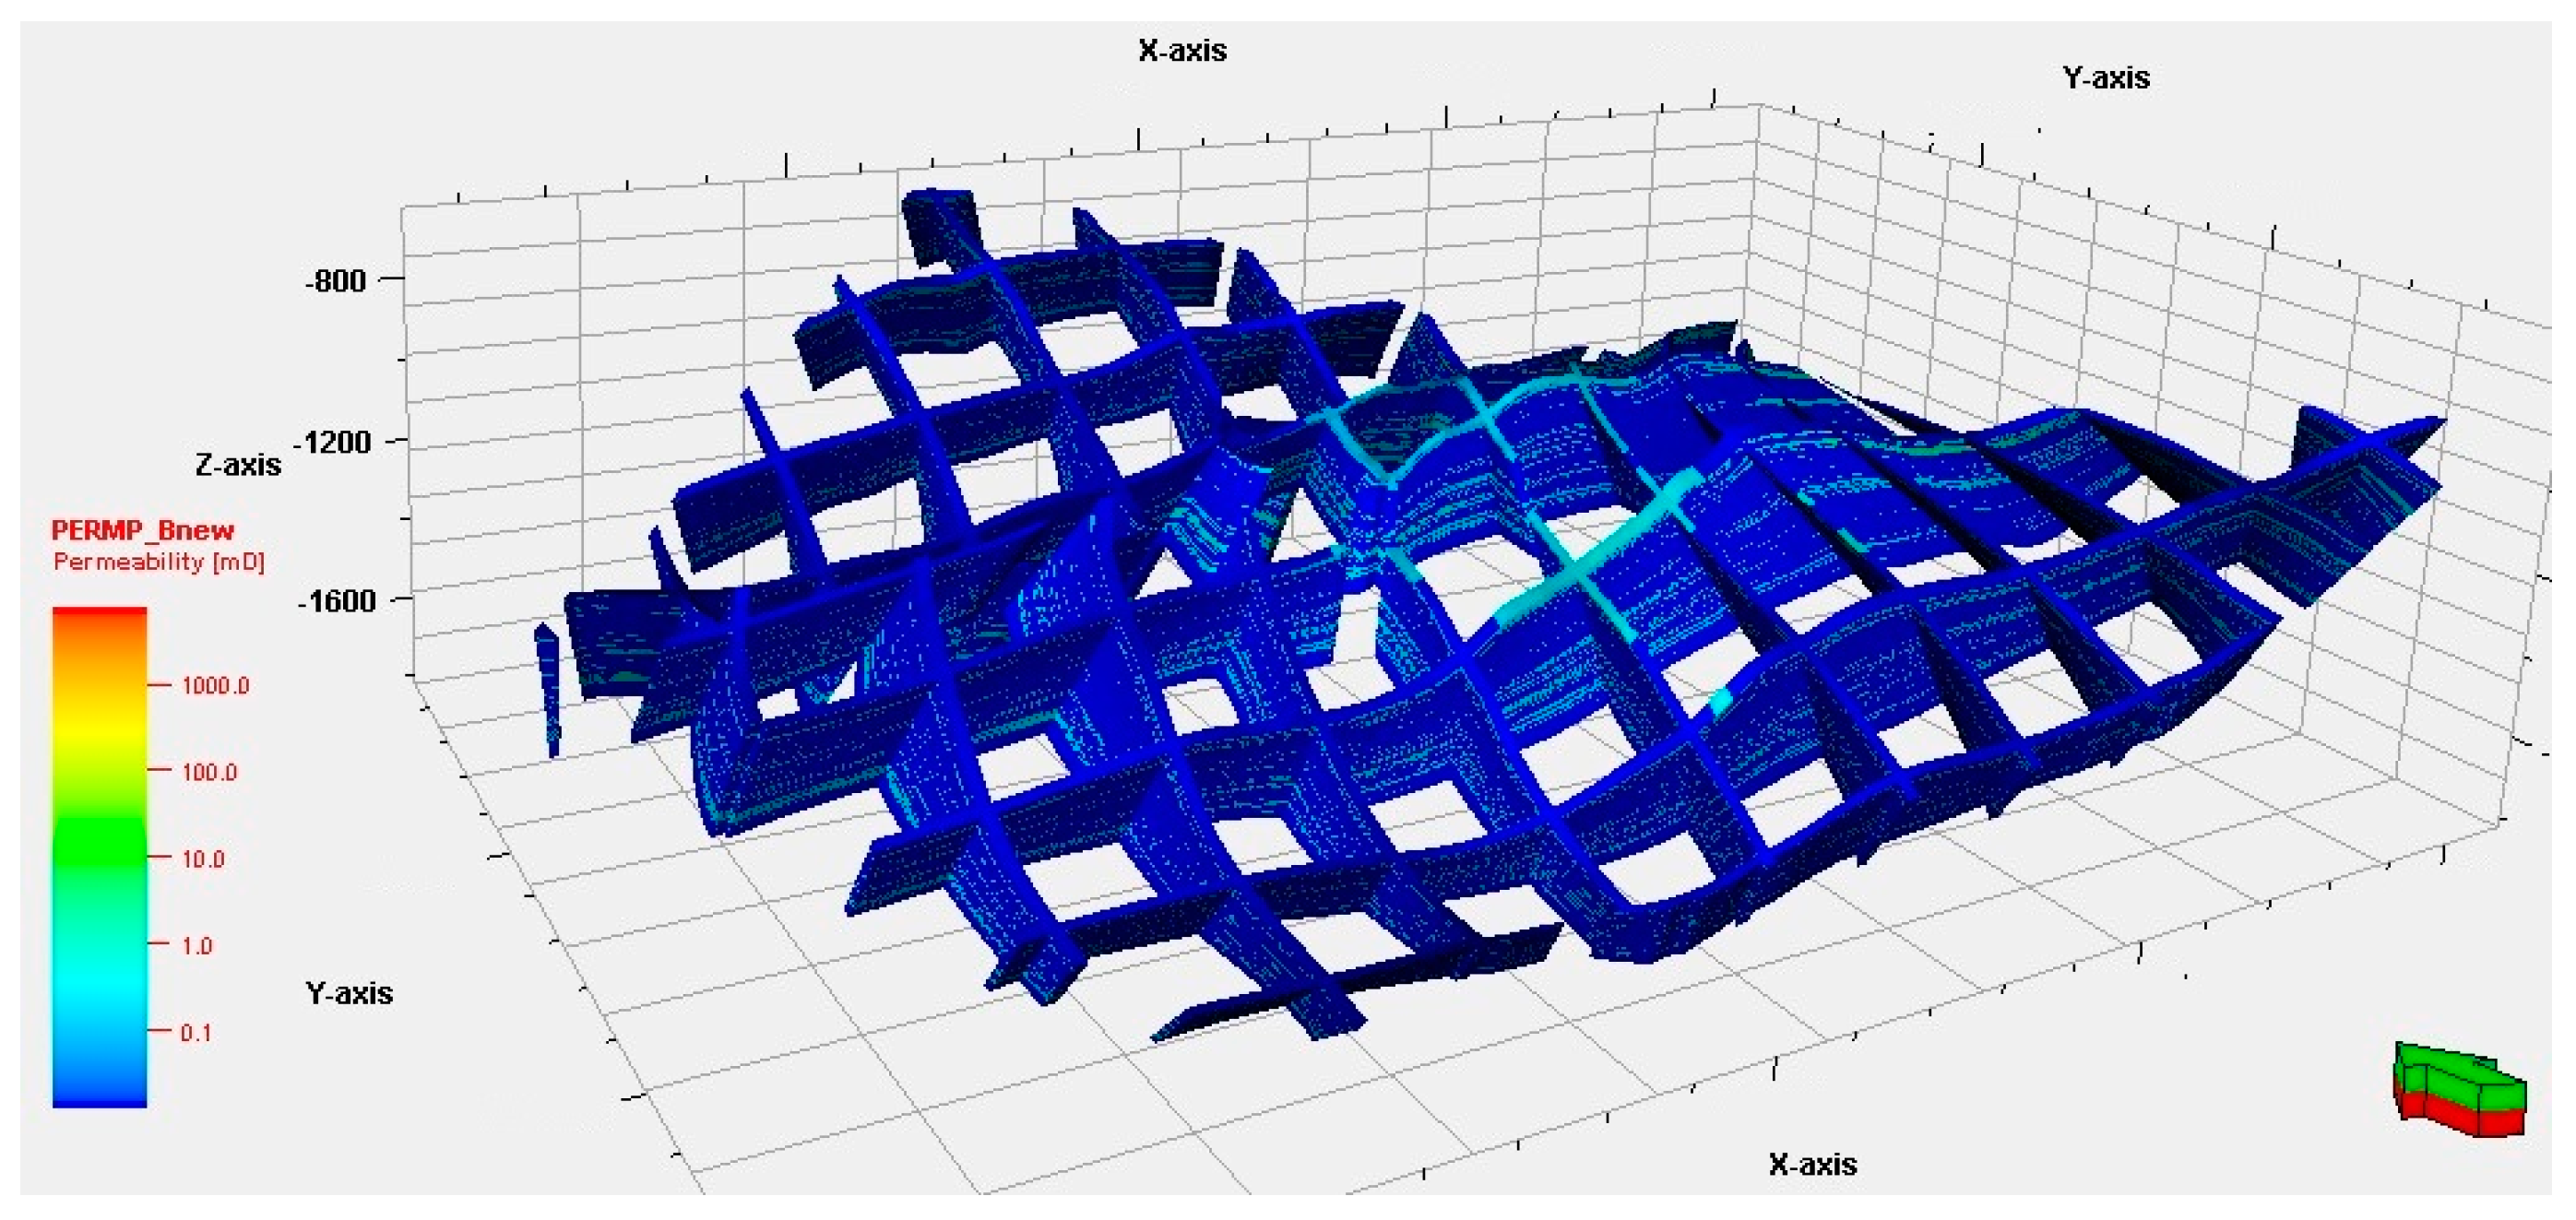
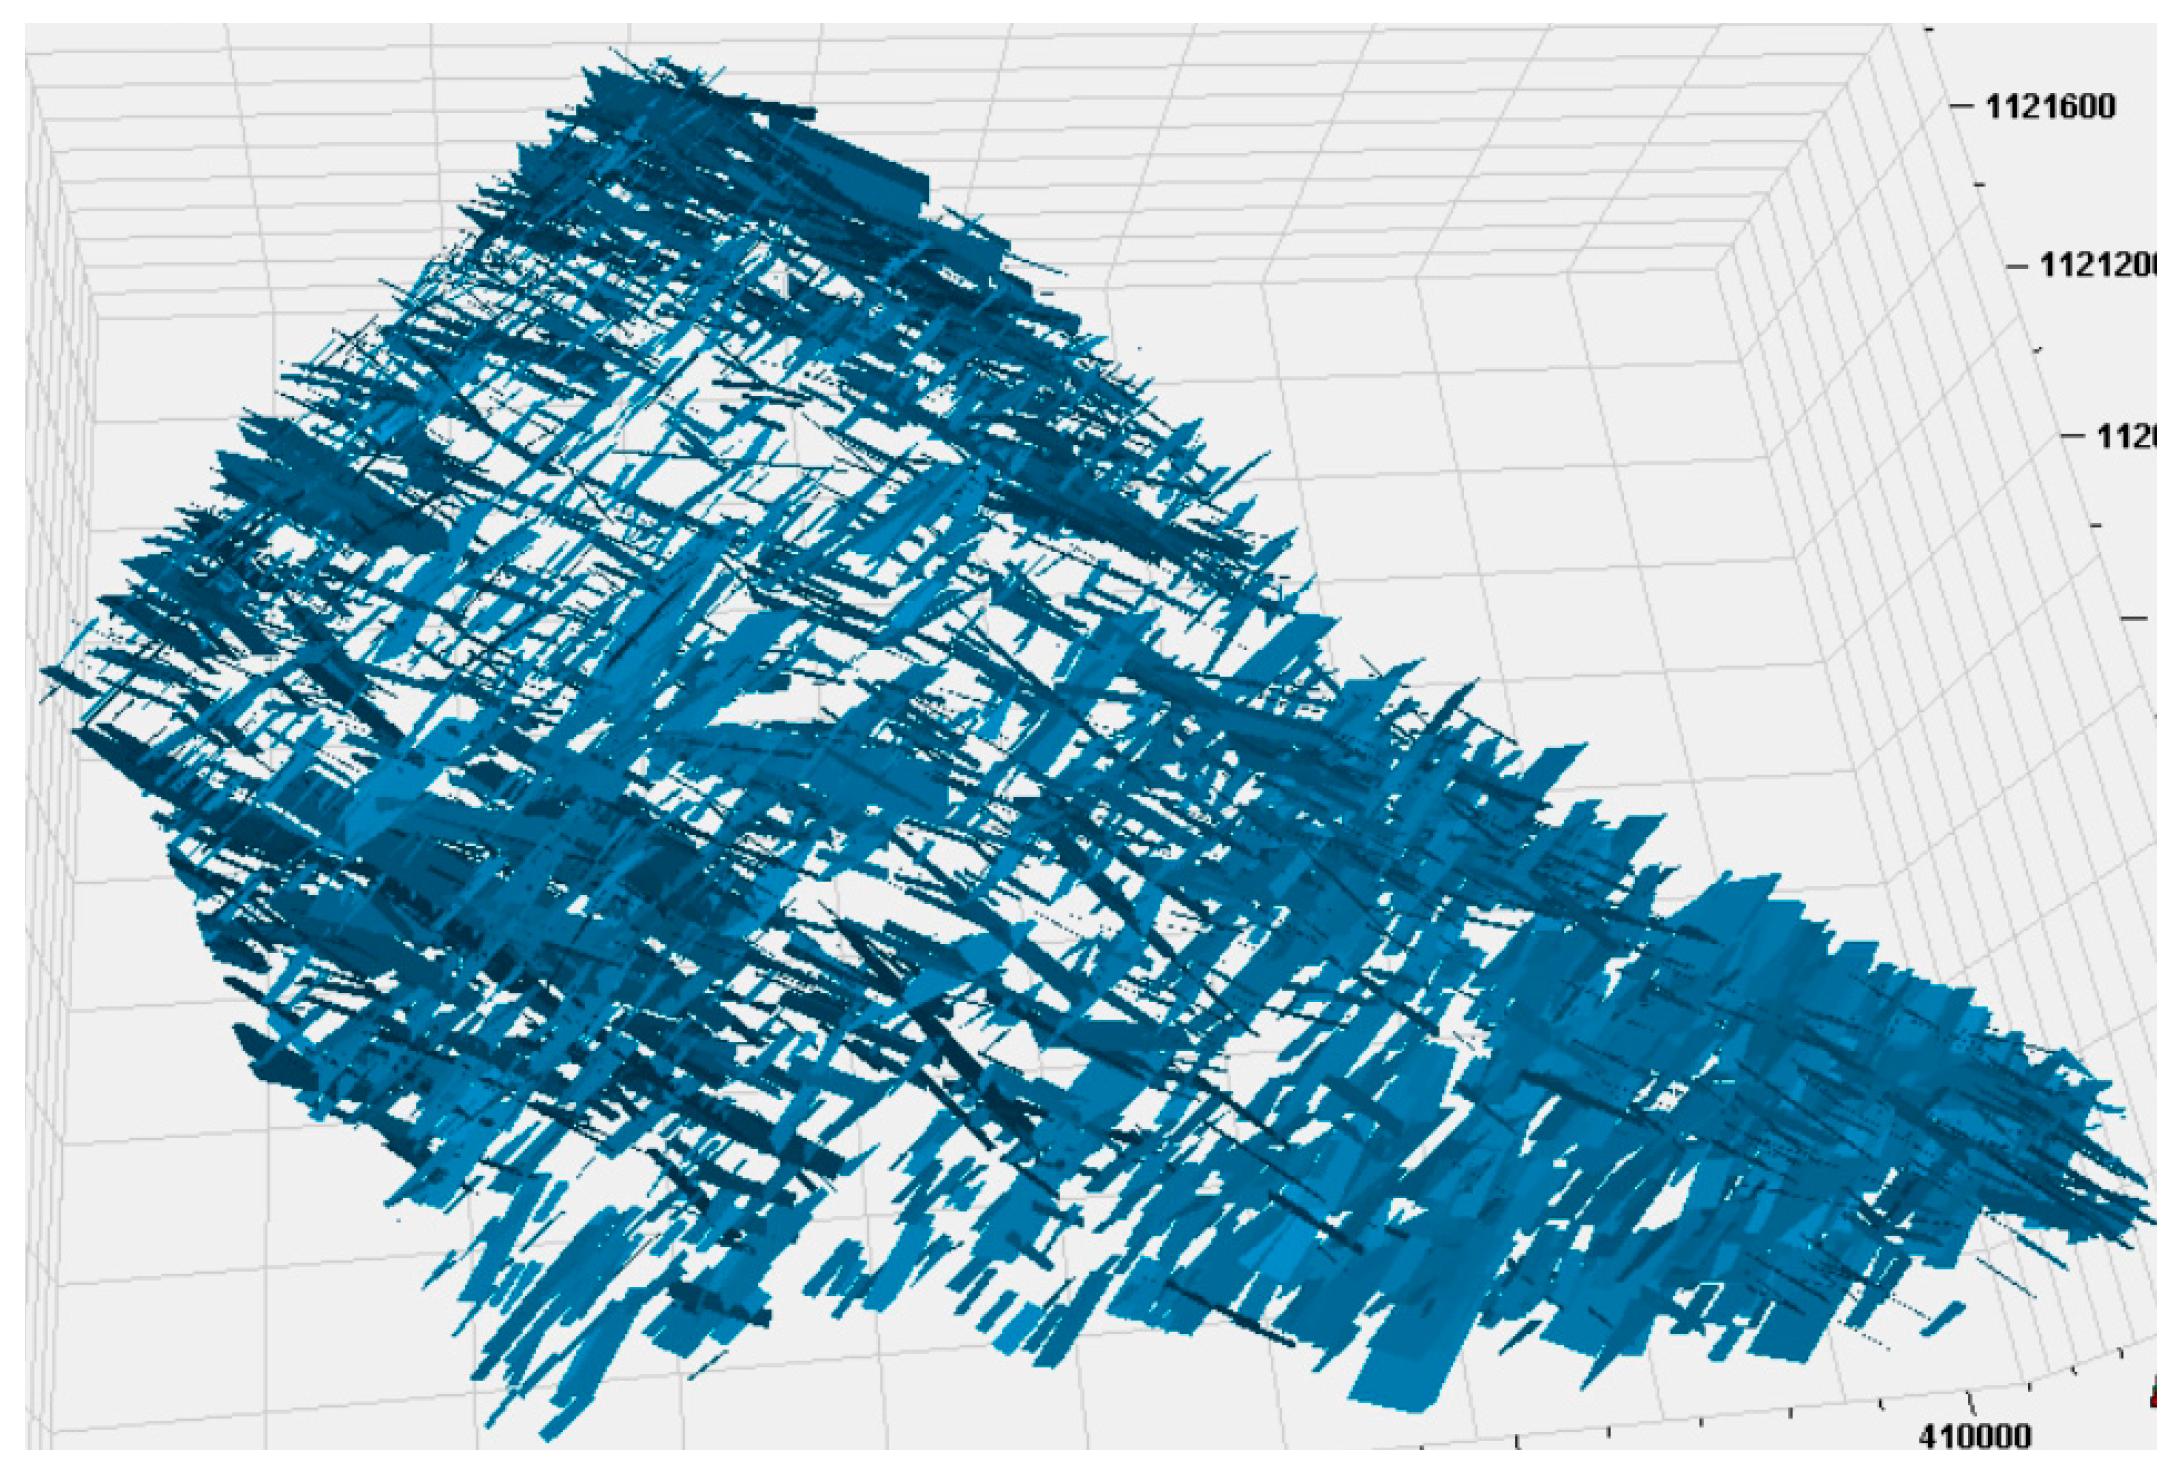
2.2.1. Geological Modeling
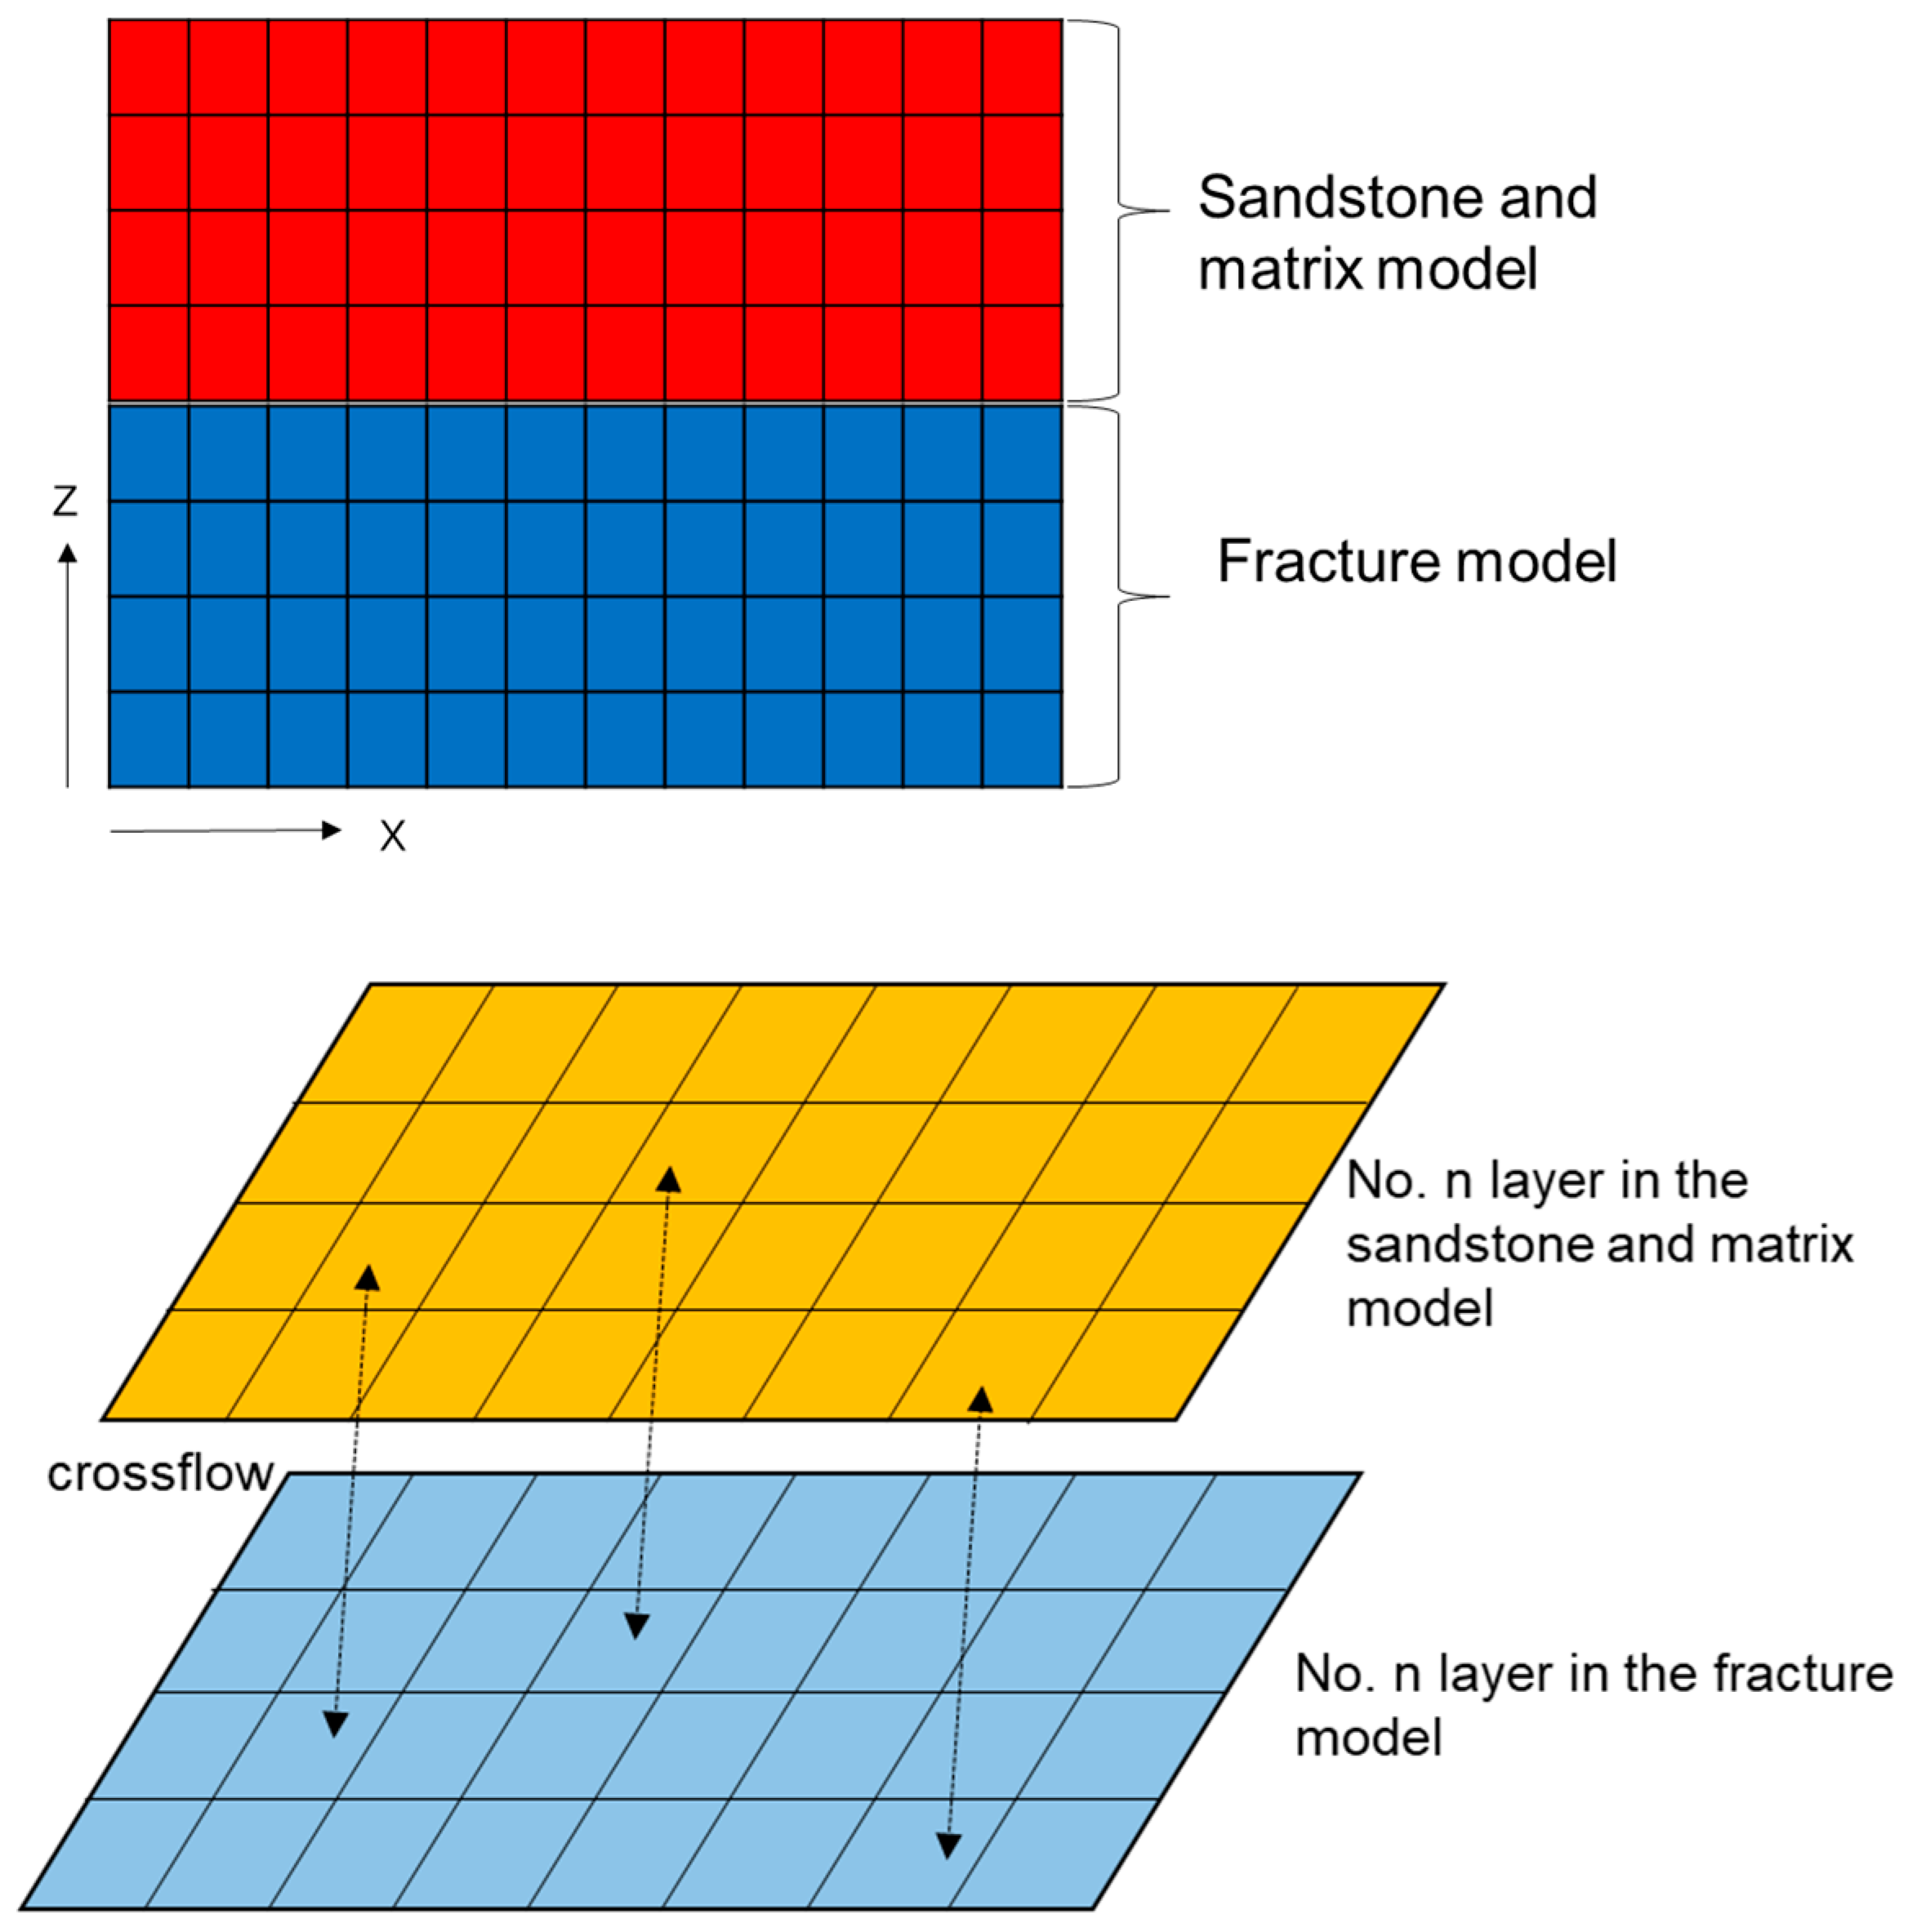
2.2.2. The Building Reservoir Simulation Model
- (1)
- The geological model was vertically divided into N layers, which were defined as 2N layers in the numerical simulation. This meant the model contained two systems: sandstone (matrix) and the fractures.
- (2)
- The sandstone (matrix) block model was assigned reservoir properties such as permeability and porosity, with the grid block size corresponding to the simulation grid size.
- (3)
- The fracture model was assigned natural fracture properties, including fracture permeability and porosity.
- (4)
- The interporosity flow coefficient represented the ease of fluid exchange between the fracture system and the matrix block system in the dual-porosity reservoir.
2.2.3. Simulation Parameters
2.2.4. History Matching
3. Results Analysis
3.1. Laboratory Results
3.1.1. The MMP Testing Results
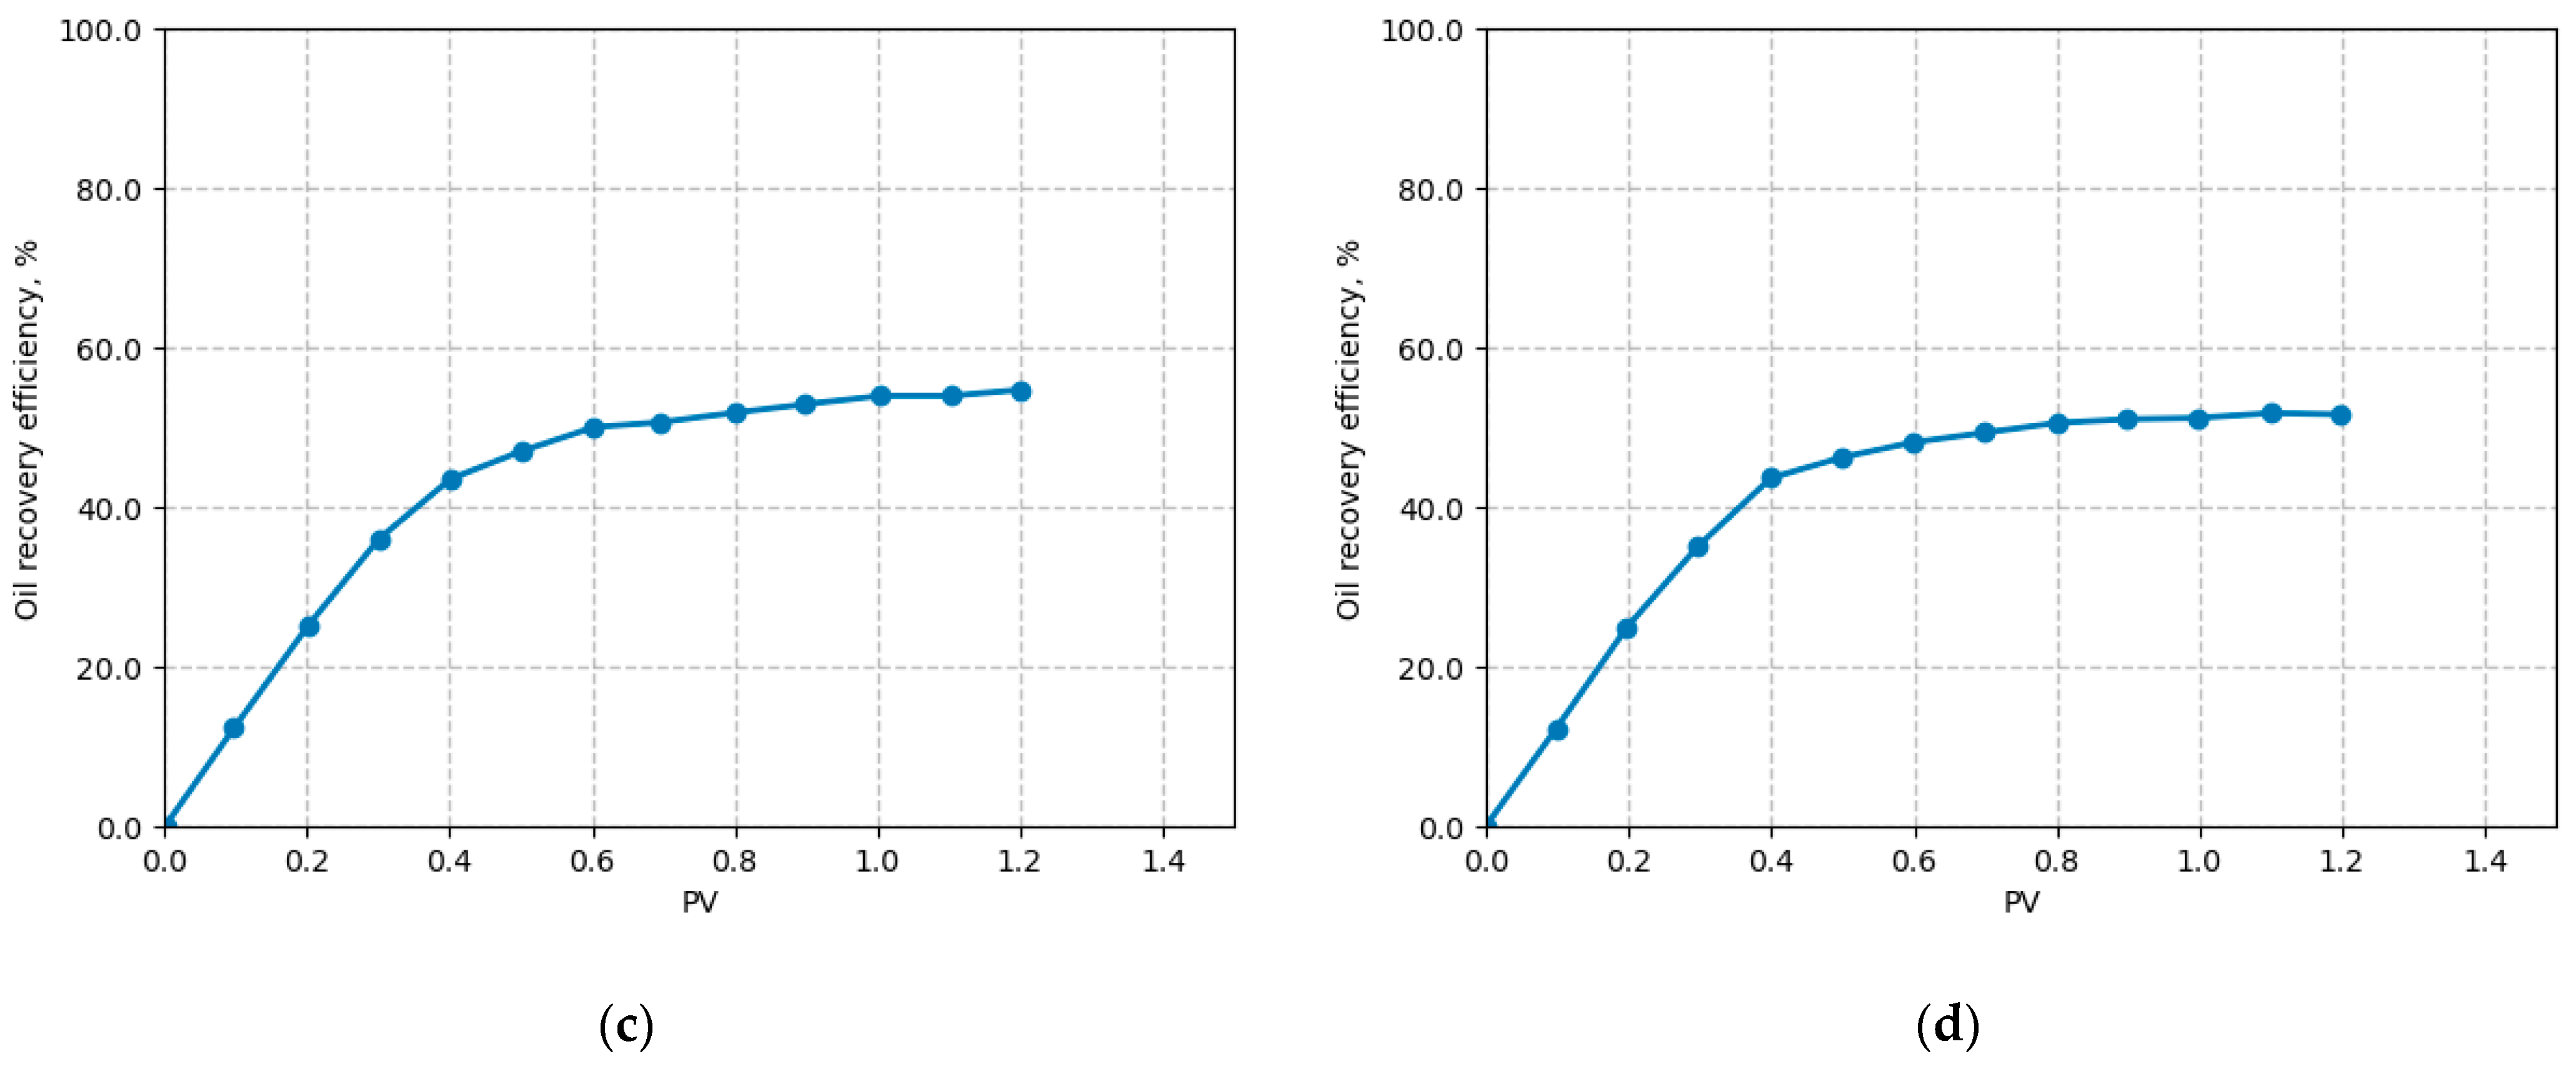
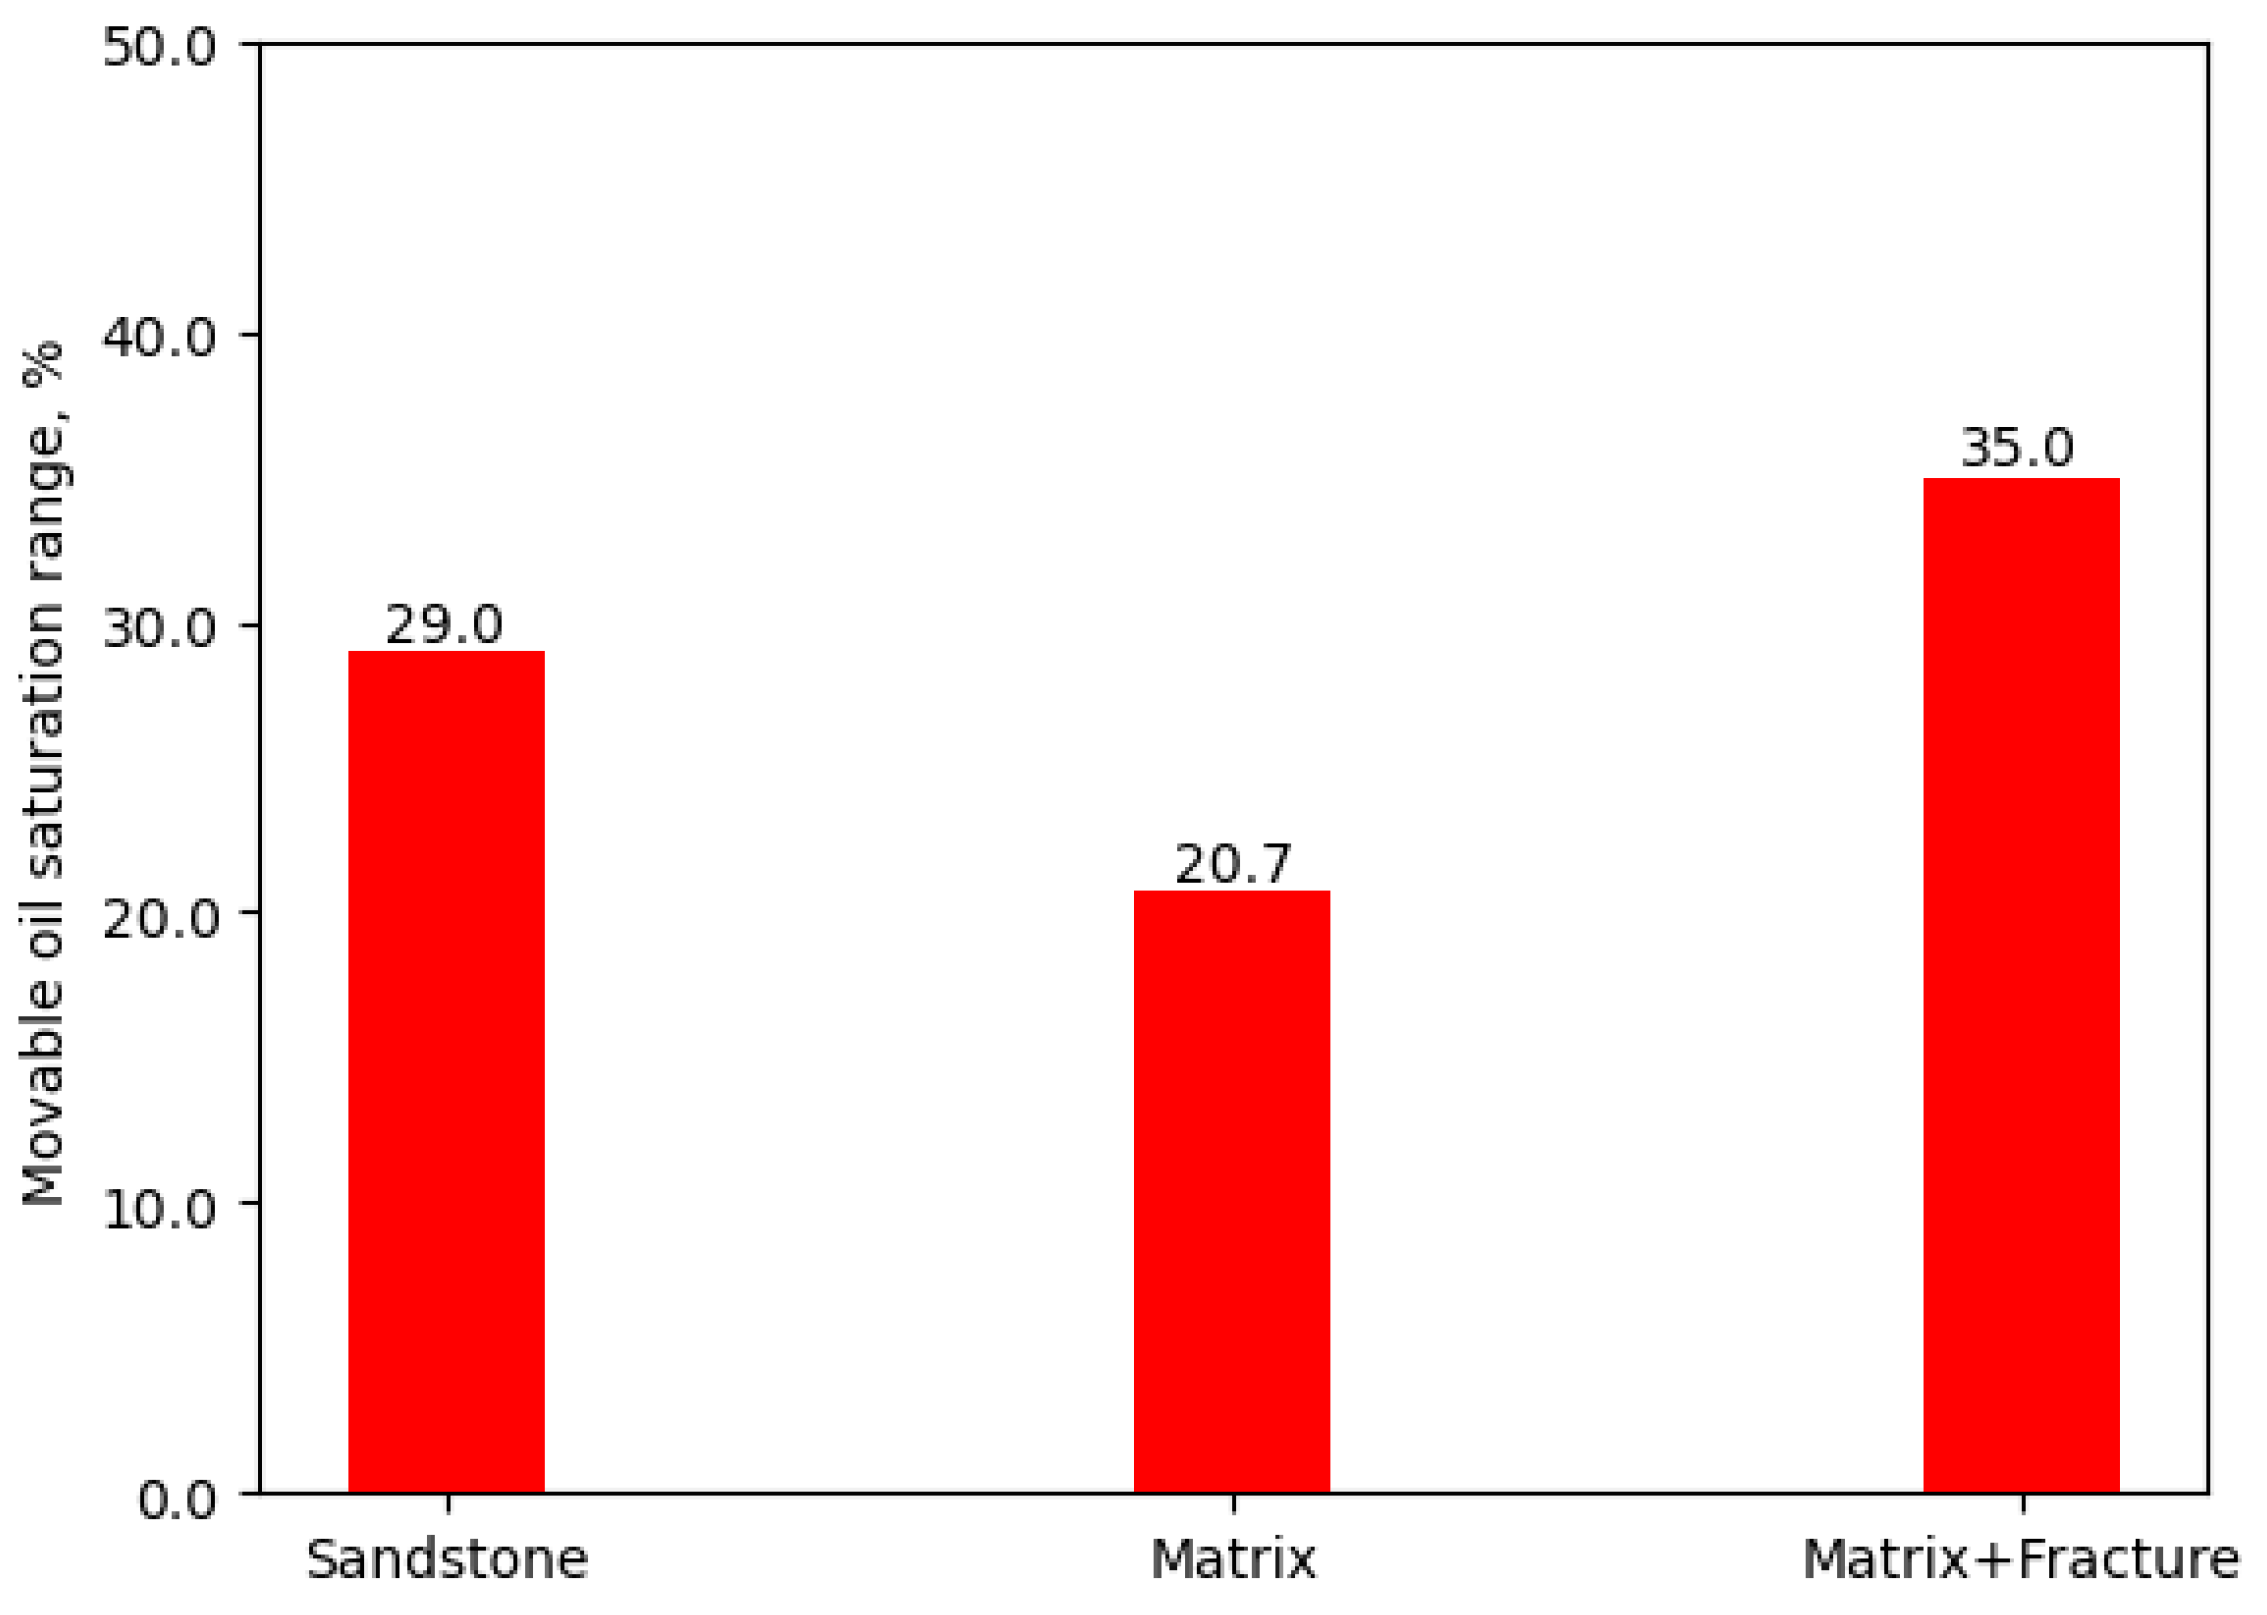
3.1.2. The Core Flooding Efficiency
3.1.3. Relative Permeability Analysis
3.2. Simulation Results
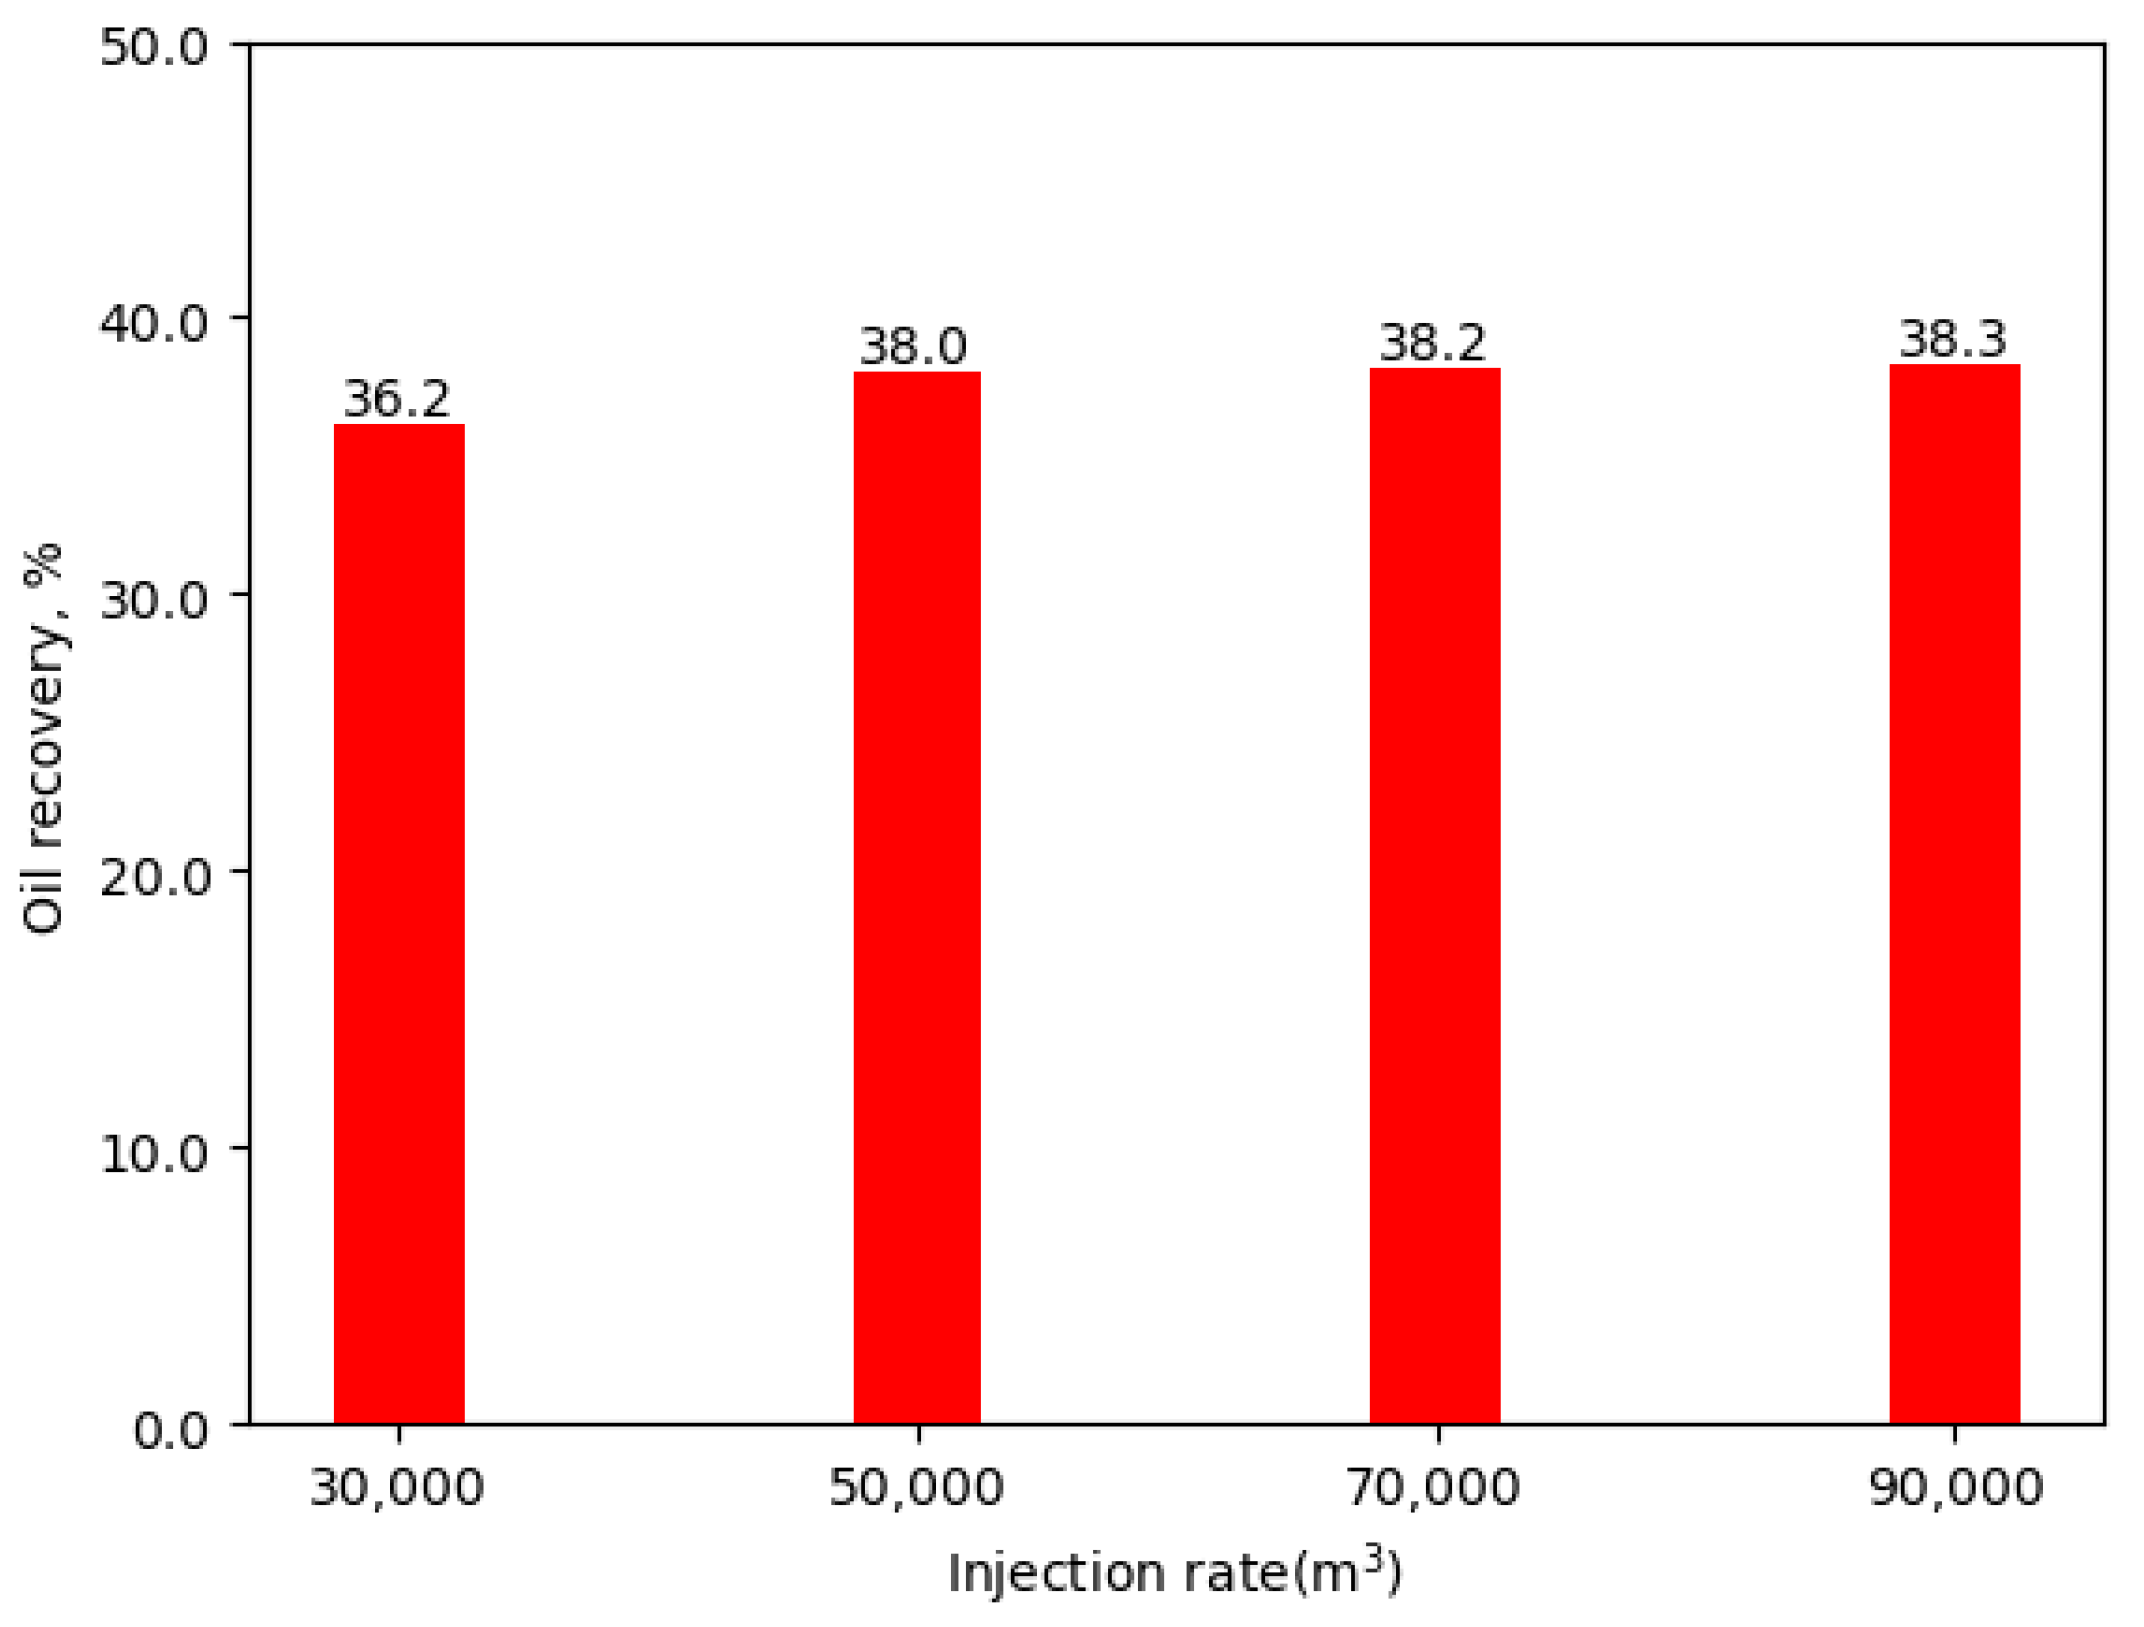
3.2.1. The Optimal Injection Rate
3.2.2. The Cyclic Injection Strategy
3.2.3. Gas Injection Location
4. Discussions
4.1. Simulation and the Geological Impact
4.2. A Comparative Analysis
4.3. Limitations and Future Work
5. Conclusions
Author Contributions
Funding
Data Availability Statement
Acknowledgments
Conflicts of Interest
References
- May, J.; Hewitt, R. The Nature of the Basement Complex Oil Reservoir, Edison Oil Field, California. AAPG Bull. 1947, 31, 2239–2240. [Google Scholar]
- Mancini, E.; Mink, R.; Tew, B.; Bearden, B. Natural gas plays in Jurassic reservoirs of southwestern Alabama and the Florida panhandle area. AAPG Bull. 1990, 40, 513–519. [Google Scholar]
- Mancini, E.; Mink, R.; Tew, B.; Kopaska-Merkel, D.; Mann, S. Upper Jurassic smackover oil plays in Alabama, Mississippi and the Florida Panhandle. Gulf Coast Assoc. Geol. Soc. Trans. 1991, 41, 475–480. [Google Scholar]
- Wilson, T.; Zheng, L.; Shumaker, R. Sequential development of structural heterogeneity in the Granny Creek oil field of West Virginia. AAPG Bull. 1993, 77, 8. [Google Scholar]
- Mink, R.; Mancini, E. Lower Cretaceous and Upper Jurassic oil reservoirs of the updip basement structure play: Southwest Alabama. AAPG Bull. 1995, 79, 10. [Google Scholar]
- Kireev, F.; Dong, T.; Tuan, P. Composition, Structure and Oil-Bearing Capacity of the Basement in the White Tiger Field. In Proceedings of the Indonesian Petroleum Association 26th Annual Convention, Jakarta, Indonesia, 18–20 May 1998. [Google Scholar]
- Malim, E.; Daungkaew, S.; Hansen, S.; Oo, A.; Hussain, R.; Kurniawan, S.; Zulkefli, Z. Integrated Fracture Evaluation of a Malaysian Basement Well Drilled with the Oil-Based Mud. In Proceedings of the Petroleum Geology Conference and Exhibition, Kuala Lumpur, Malaysia, 14–15 January 2008. [Google Scholar]
- McGeer, A.; Refani, M. Dynamically Conditioned Modeling to Address Development Challenges in a Highly Complex Fractured Basement Reservoir, Yemen. In Proceedings of the SPE Reservoir Characterisation and Simulation Conference and Exhibition, Abu Dhabi, United Arab Emirates, 17–19 September 2019. [Google Scholar]
- Kharrat, R.; Ott, H. A Comprehensive Review of Fracture Characterization and Its Impact on Oil Production in Naturally Fractured Reservoirs. Energies 2023, 16, 3437. [Google Scholar] [CrossRef]
- Amerighasrodashti, A. Immiscible and Miscible Gas-Oil Gravity Drainage in Naturally Fractured Reservoirs. Ph.D. Thesis, Delft University of Technology, Delft, The Netherlands, 2014. [Google Scholar]
- Dinh, H.; Le, N.; Peter, M.; Nguyen, V.; Dang, T.; Nguyen, V.; Hoang, N.; Truong, T.; Tran, H.; Nguyen, K. Gas-assisted gravity drainage GAGD Huff n puff application for fractured basement reservoir-Case study. In Proceedings of the SPE Asia Pacific Oil and Gas Conference and Exhibition, Jakarta, Indonesia, 17–19 October 2017. [Google Scholar]
- Ma, M.; Emami-Meybodi, H. Multiscale non-equilibrium compositional modeling of cyclic gas injection in shale reservoirs. In Proceedings of the SPE Annual Technical Conference and Exhibition, New Orleans, LA, USA, 23–25 September 2024. [Google Scholar]
- Zhao, L.; Zhang, L.; Su, Y.; Tan, X.; Li, C.; Wang, S. In-situ CT study on the effect of cyclic gas injection and depletion exploitation on the phase behavior of fractured condensate gas reservoirs. Front. Earth Sci. 2024, 12, 1418821. [Google Scholar] [CrossRef]
- Xie, J.; Neima, A. Cyclic gas injection EOR pilot in tight Viking sand pool. In Proceedings of the SPE Improved Oil Recovery Conference, Tulsa, OK, USA, 22–25 April 2024. [Google Scholar]
- Enab, K. Impact of diffusion and adsorption on the performance of CO2, CH4, and cyclic gas huff-n-puff injection into light oil reservoirs. In Proceedings of the Abu Dhabi International Petroleum Exhibition and Conference, Abu Dhabi, United Arab Emirates, 2–5 October 2023. [Google Scholar]
- Ghanizadeh, A.; Song, C.; Cesar, J.; Jiang, C. Evaluation of produced hydrocarbons composition during cyclic CO2 injection (huff-n-puff) in artificially-fractured shale core sample. In Proceedings of the SPE Canadian Energy Technology Conference, Calgary, AB, Canada, 15–16 March 2023. [Google Scholar]
- Youssif, M.I.; Sharma, K.; Piri, M. Hydrocarbon gas foam injection in fractured oil-wet carbonate samples: An experimental investigation of the effect of fracture-matrix permeability contrast on oil recovery. In Proceedings of the SPE Canadian Energy Technology Conference, Calgary, AB, Canada, 15–16 March 2023. [Google Scholar]
- Alimohammadi, N.; Pooladi-Darvish, M.; Rostami, B.; Khosravi, M. Improvement to gravity drainage recovery by repressurization as a criterion to screen and rank naturally fractured reservoirs for gas injection. SPE Reserv. Eval. Eng. 2022, 26, 1073–1090. [Google Scholar] [CrossRef]
- Gugl, R.; Kharrat, R.; Shariat, A.; Ott, H. Evaluation of gas-based EOR methods in gas-invaded zones of fractured carbonate reservoirs. Energies 2022, 15, 4921. [Google Scholar] [CrossRef]
- Wei, F.; Zhang, S.; Xi, Y.; Zhu, Z.; Xiong, C.; Zang, C.; Li, J. Conformance control for tight oil cyclic gas injection using foam. Geofluids 2022, 2022, 6571525. [Google Scholar] [CrossRef]
- Bueno Zapata, N.; Mejía Cárdenas, J.M.; Martínez Paternina, J.J. Flue gas and nitrogen co-injection during cyclic steam stimulation in heavy oil reservoirs: A numerical evaluation. Dyna 2021, 88, 143–153. [Google Scholar] [CrossRef]
- Sennaoui, B.; Pu, H.; Malki, M.L.; Afari, A.S.; Larbi, A.; Tomowewo, O.S.; Araghi, R.H.R. Laboratory experiments on the cyclic gas injection process using CO2, C2H6, and C3H8 to evaluate oil recovery performance and mechanisms in unconventional reservoirs. In Proceedings of the ARMA/DGS/SEG International Geomechanics Symposium, Abu Dhabi, United Arab Emirates, 7–10 November 2022. [Google Scholar]
- Song, Z.; Li, M.; Zhao, C.; Yang, Y.-L.; Hou, J. Gas injection for enhanced oil recovery in two-dimensional geology-based physical model of Tahe fractured-vuggy carbonate reservoirs: Karst fault system. Pet. Sci. 2020, 17, 419–433. [Google Scholar] [CrossRef]
- Sahai, R.; Moghanloo, R. Impact of stimulated reservoir volume in the efficacy of miscible gas injection EOR in shale reservoirs. In Proceedings of the SPE Improved Oil Recovery Conference, Virtual, 25–29 April 2022. [Google Scholar]
- Safaei, A.; Kazemzadeh, Y.; Riazi, M. Mini review of miscible condition evaluation and experimental methods of gas miscible injection in conventional and fractured reservoirs. Energy Fuels 2021, 35, 7064–7075. [Google Scholar] [CrossRef]
- Augustine, C.; Johnston, H.E.; Young, D.; Amini, K.; Uzun, I.; Kazemi, H. Evaluation of energy storage potential of unconventional shale reservoirs using numerical simulation of cyclic gas injection. J. Energy Resour. Technol. 2021, 143, 112004. [Google Scholar] [CrossRef]
- Nelson, R. Geologic Analysis of Naturally Fractured Reservoirs; Gulf Professional Publishing: Houston, TX, USA, 2001. [Google Scholar]
- Narr, W.; Schechter, D.; Thompson, L. Naturally Fractured Reservoir Characterization; Society of Petroleum Engineers: Richardson, TX, USA, 2006. [Google Scholar]
- Lonergan, L.; Jolly, R.; Rawnsley, K.; Sanderson, D. Fractured Reservoirs; Geological Society: London, UK, 2007. [Google Scholar]
- Ray, D.; Al-Shammeli, A.; Verma, N.; Matar, S.; De Groen, V.; De Joussineau, G.; Ghilardini, L.; Le Maux, T.; Al-Khamees, W. Characterizing and Modeling Natural Fracture Networks in a Tight Carbonate Reservoir in the Middle East: A methodology. Bull. Geol. Soc. Malays. 2012, 58, 29–35. [Google Scholar]
- Nie, Z.; Xu, F.; Ouyang, J.; Li, X.; Zhang, J.; Liu, S.; Han, J.; Li, D. Experimental tests and EDFM method to study gas injection in a fractured granite reservoir. Front. Energy Res. 2023, 10, 1008356. [Google Scholar] [CrossRef]
- Hammam, M.; Soliman, K. Novel dual porosity simulation workflow and solutions for the 3D fracture modeling. In Proceedings of the Mediterranean Offshore Conference, Alexandria, Egypt, 20–22 October 2024. [Google Scholar]
- Yu, X.; Kang, Z.; Li, Y.; Lin, X.; Xie, L.; Li, J. Integration of geological model and numerical simulation technique to characterize the remaining oil of fractured biogenic limestone reservoirs. Arab. J. Sci. Eng. 2024, 49, 1–17. [Google Scholar] [CrossRef]
- Zheng, S.; Wang, X.; Chen, J.; Gu, H.; Wu, W. Multiphase flow simulation of fractured karst oil reservoirs applying three-dimensional network models. Phys. Fluids 2024, 36, 076610. [Google Scholar] [CrossRef]
- Khoei, A.; Taghvaei, M. A computational dual-porosity approach for the coupled hydro-mechanical analysis of fractured porous media. Int. J. Numer. Anal. Methods Geomech. 2024, 48, 1745–1773. [Google Scholar] [CrossRef]
- Chen, D.; Zhang, C.; Yang, M.; Li, H.; Wang, C.; Diwu, P.; Jiang, H.; Wang, Y. Research on water invasion law and control measures for ultradeep, fractured, and low-porosity sandstone gas reservoirs: A case study of Kelasu gas reservoirs in Tarim Basin. Processes 2024, 12, 310. [Google Scholar] [CrossRef]
- Warren, J.; Root, P. The Behavior of Naturally Fractured Reservoirs. SPE J. 1963, 3, 245–255. [Google Scholar] [CrossRef]
- Cinco, L.; Samaniego, V.; Dominguez, A. Transient Pressure Behavior for a Well With a Finite-Conductivity Vertical Fracture. SPE J. 1978, 18, 253–264. [Google Scholar] [CrossRef]
- Karimi-Fard, M.; Firoozabadi, A. Numerical Simulation of Water Injection in Fractured Media Using the Discrete-Fracture Model and the Galerkin Method. SPE Reserv. Eval. Eng. 2003, 6, 117–126. [Google Scholar] [CrossRef]
- Hoteit, H.; Firoozabadi, A. Multicomponent fluid flow by discontinuous Galerkin and mixed methods in unfractured and fractured media. Water Resour. Res. 2005, 41, 1–15. [Google Scholar] [CrossRef]
- Zhou, W.; Banerjee, R.; Poe, B.; Spath, J.; Thambynayagam, M. Semianalytical Production Simulation of Complex Hydraulic-Fracture Networks. SPE J. 2013, 19, 06–18. [Google Scholar] [CrossRef]
- Yuan, X.; Feng, G.; Yang, X.; Zhang, J.; Dou, S.J.; Tian, J.; Yu, G.; Zhang, K. Geological Characteristics and Production Performance of a Sandstone-Fractured Basement Composite Reservoir. In Proceedings of the International Field Exploration and Development Conference 2020 International Field Exploration and Development Conference, Chengdu, China, 23–25 September 2020. [Google Scholar]


| Component | Composition, mol% |
|---|---|
| CO2 | 0.32 |
| N2 | 5.64 |
| C1 | 62.25 |
| C2 | 11.05 |
| C3 | 13.05 |
| iC4 | 3.63 |
| nC4 | 2.84 |
| iC5 | 0.41 |
| nC5 | 0.15 |
| C6+ | 0.67 |
| Diameter (mm) | Length (cm) | Pore Volume (mm3) | Temperature (°C) | Highest Pressure (MPa) | Medium |
|---|---|---|---|---|---|
| 1.05 | 20.0 | 73.5 | 96.8 | 25 | quartz sand |
| L cm | D cm | Ka mD | Φ % | μo mPa·s | So % |
|---|---|---|---|---|---|
| 45.25 | 2.48 | 62.13 | 5.1 | 2.55 | 65.6 |
| Sample No. | Type | L, cm | D, cm | Ka, mD | Ko, mD | Porosity, % | Swi, % | Sor, % | ED, % |
|---|---|---|---|---|---|---|---|---|---|
| 2-8-3 | Matrix | 2.442 | 2.477 | 2.929 | 0.153 | 13.8 | 38.5 | 37.5 | 42.4 |
| 2-8-1 | Matrix | 4.338 | 2.481 | 0.559 | 0.022 | 8.6 | 42.0 | 40.5 | 32.3 |
| 1-3-1 | Fracture + Matrix | 6.638 | 2.48 | 62.4 | 13.1 | 4.6 | 35.1 | 30.1 | 52.12 |
| 2-9-2 | Fracture + Matrix | 4.086 | 2.483 | 59.6 | 11.6 | 4.8 | 35.8 | 29.4 | 53.32 |
| Parameter | Value |
|---|---|
| Number of grid blocks (DX × DY × DZ) | 85 × 57× 253 (2 set) |
| Block size (x × y × z) | 50 m × 50 m × 1 m |
| Reservoir temperature | 92.4 °C |
| Reservoir permeability | 8 mD |
| Matrix porosity | 6% |
| Rock compressibility | 14.5×10⁻⁴ MPa−1 |
| Initial formation pressure | 15.0 MPa |
| Reservoir mid-depth | 1354.7 m |
| Reservoir GOR | 19.0 m3/m3 |
| Oil viscosity | 2.55 mPa·s |
| Kv/KH | 0.10 |
| Well radius | 0.15 m |
| Fracture length | 50–400 m |
| Dip angle | 40°–70° |
| Fracture conductivity | 30.5 mD·m |
| Gas Type | MMP (MPa) |
|---|---|
| CO2 | 12.23 |
| APG | 17.15 |
| Air | 83.61 |
| N2 | 107.85 |
| Gas Type | Kair (mD) | Porosity (%) | Oil Saturation (%) | Injection Rate (cm3/min) | Displacement Efficiency (%) |
|---|---|---|---|---|---|
| CO2 | 1.68 | 13.63 | 60.4 | 0.01 | 70.3 |
| APG | 0.94 | 12.58 | 59.0 | 0.01 | 64.5 |
| Air | 1.28 | 11.01 | 58.2 | 0.01 | 53.5 |
| N2 | 2.25 | 14.40 | 61.5 | 0.01 | 50.5 |
| Mode | Cumulative Gas Injection Volume (×108 m3) | Cumulative Gas Production Volume (×108 m3) | Gas Left in the Reservoir (×108 m3) | Oil Recovery (%) |
|---|---|---|---|---|
| Inject for 1 M, shut for 11 M | 0.255 | 0.069 | 0.186 | 37.24 |
| Inject for 2 M, shut for 10 M | 0.510 | 0.313 | 0.197 | 37.39 |
| Inject for 3 M, shut for 9 M | 0.765 | 0.557 | 0.208 | 37.53 |
| Inject for 6 M, shut for 6 M | 1.472 | 1.236 | 0.236 | 37.76 |
| Inject for 8 M, shut for 4 M | 1.960 | 1.703 | 0.257 | 37.88 |
| Inject for 10 M, shut for 2 M | 2.463 | 2.204 | 0.259 | 37.94 |
| Continuous injection | 3.059 | 2.797 | 0.262 | 38.00 |
Disclaimer/Publisher’s Note: The statements, opinions and data contained in all publications are solely those of the individual author(s) and contributor(s) and not of MDPI and/or the editor(s). MDPI and/or the editor(s) disclaim responsibility for any injury to people or property resulting from any ideas, methods, instructions or products referred to in the content. |
© 2025 by the authors. Licensee MDPI, Basel, Switzerland. This article is an open access article distributed under the terms and conditions of the Creative Commons Attribution (CC BY) license (https://creativecommons.org/licenses/by/4.0/).
Share and Cite
Jia, Y.; Ouyang, J.; Xu, F.; Gao, X.; Zhang, J.; Liu, S.; Li, D. Evaluating Nitrogen Gas Injection Performance for Enhanced Oil Recovery in Fractured Basement Complex Reservoirs: Experiments and Modeling Approaches. Processes 2025, 13, 326. https://doi.org/10.3390/pr13020326
Jia Y, Ouyang J, Xu F, Gao X, Zhang J, Liu S, Li D. Evaluating Nitrogen Gas Injection Performance for Enhanced Oil Recovery in Fractured Basement Complex Reservoirs: Experiments and Modeling Approaches. Processes. 2025; 13(2):326. https://doi.org/10.3390/pr13020326
Chicago/Turabian StyleJia, Ying, Jingqi Ouyang, Feng Xu, Xiaocheng Gao, Juntao Zhang, Shiliang Liu, and Da Li. 2025. "Evaluating Nitrogen Gas Injection Performance for Enhanced Oil Recovery in Fractured Basement Complex Reservoirs: Experiments and Modeling Approaches" Processes 13, no. 2: 326. https://doi.org/10.3390/pr13020326
APA StyleJia, Y., Ouyang, J., Xu, F., Gao, X., Zhang, J., Liu, S., & Li, D. (2025). Evaluating Nitrogen Gas Injection Performance for Enhanced Oil Recovery in Fractured Basement Complex Reservoirs: Experiments and Modeling Approaches. Processes, 13(2), 326. https://doi.org/10.3390/pr13020326