Article

Efficiency of Hydrogen Sulfide Removal from Biogas Using a Laboratory-Scale Biofilter Packed with Biochar, Cellular Concrete Waste, or Polyurethane Foam: A COMSOL Simulation Study

by
Kamyab Mohammadi
*,
Rasa Vaiškūnaitė
and
Ausra Zigmontienė
Department of Environmental Protection and Water Engineering, Vilnius Gediminas Technical University, LT-10223 Vilnius, Lithuania
*
Author to whom correspondence should be addressed.
Processes 2025, 13(2), 329; https://doi.org/10.3390/pr13020329
Submission received: 9 December 2024 / Revised: 15 January 2025 / Accepted: 21 January 2025 / Published: 24 January 2025

Abstract

:
This study investigated the removal of hydrogen sulfide (H2S) from biogas using a laboratory-scale biofilter packed with biochar, cellular concrete waste (CLC waste), or polyurethane foam (PUF). The biofilter was tested under varied operational conditions, including H2S concentrations ranging from 60 to 100 ppm and biogas flow rates of 0.2 to 1.0 L/min, to assess the removal efficiency and elimination capacity (EC). The COMSOL simulation framework was employed to predict biofilter performance and validate the experimental findings. The results revealed that removal efficiencies (REs) varied significantly across the packing materials and operational conditions. The biochar achieved RE values exceeding 92% and an EC of up to 150 g H2S/m3/h, while the CLC waste demonstrated a moderate RE (~75%) and an EC of 100 g H2S/m3/h. The PUF exhibited the lowest RE (~48%) but provided structural support for microbial colonization. Notably, the outlet (fourth and fifth) stages of the biofilter consistently outperformed the inlet stages (bottom and first stages), highlighting the influence of the residence time and microbial activity on H2S removal. These findings provide a foundation for optimizing biofilter design and operational parameters to improve biogas purification efficiency.

1. Introduction

The removal of hydrogen sulfide (H2S) from biogas remains a critical challenge in renewable energy applications due to the corrosive nature and environmental impact of H2S [1]. Biofilters have emerged as sustainable and efficient solutions for H2S removal, leveraging the synergistic effects of physical adsorption and biological degradation [2,3]
Hydrogen sulfide (H2S) is a hazardous substance commonly found in untreated biogas, posing various environmental and health risks if not removed before its use in electricity generation [4,5]. Several techniques exist for purifying H2S from biogas, with pilot-scale biofilters recognized as efficient and environmentally friendly methods [5,6]. The packing materials used in biofilters are crucial for their effectiveness and durability, as they determine the specific environmental conditions required for optimal performance [7,8,9]. In a typical biofiltration process, a bed of natural or inorganic permeable materials is exposed to a humid gas stream containing the targeted contaminants [10,11,12]. Ideal packing materials should exhibit high porosity to trap desulfurized hydrogen sulfide, a large specific surface area to enhance chemical interactions, and a diverse chemical structure containing heavy metals such as iron (Fe), potassium (K), and calcium (Ca) [8,9,13].
This study builds upon previous research focused on the development and optimization of biofilter systems for hydrogen sulfide removal from biogas. In our earlier work, we explored various packing materials and operational conditions to assess their effects on H2S removal efficiency. This current study expanded on these findings by utilizing a laboratory-scale biofilter packed with biochar, cellular concrete (CLC) waste, and polyurethane foam (PUF) as well as integrating COMSOL simulations to model the H2S concentration over 144 h. Our previous studies mainly evaluated the performance of individual materials, such as biochar and CLC waste, under different flow rates and moisture conditions. In this study, we further refined our understanding of how these materials perform at various stages and in combination as well as how changes in operational parameters affect removal efficiency. The continuation of this research lies in its systematic approach to improving biofilter performance for biogas purification. Building on our earlier experiments, which identified the key factors influencing the filtration process, this paper introduces new insights into the comparative performance of different materials under controlled conditions. Future studies, as outlined in the Conclusions, will further investigate the scalability, sustainability, and optimization of biofilters to enhance hydrogen sulfide removal efficiency, addressing the gaps identified in previous studies and providing pathways toward or more effective biogas purification systems. While extensive studies have been conducted on biochar and other packing materials, the integration of experimental material characterization with predictive modeling has been scarce. This study aimed to (1) characterize biochar, CLC waste, and PUF regarding their suitability in biofilters and (2) develop a COMSOL-based simulation to predict H2S removal efficiency under varying conditions.
This work is novel in combining experimental data with simulation results to assess the efficiency of different packing materials in a laboratory-scale biofilter. Additionally, this paper introduces new insights into the interaction between materials like biochar and CLC waste, which were not thoroughly explored in previous research. The comparative analysis of these materials across the different stages of the biofilter represents a significant contribution to optimizing biofilter design for H2S removal. Furthermore, integrating real-time data analysis using gas data analyzer (GDA) technology provides a more precise and dynamic assessment of removal efficiency, distinguishing this study from prior work in the field. In essence, the novelty of this work lies not only in the materials and methods used but also in the comprehensive approach taken to evaluate and optimize biofilter systems for biogas purification, contributing valuable knowledge to the field of environmental engineering and sustainable energy.

2. Materials and Methods

2.1. Operation Conditions of the Pilot-Scale Biofilter

This work controlled specific environmental and operational conditions throughout the examinations. This means that (a) the biofilter operated under steady-state conditions; (b) gas flow was uniform and laminar, ensuring consistent interaction between the gas and packing materials; (c) H2S removal involved two mechanisms: physical adsorption and biological oxidation. The biogas used in the experiment was synthetically prepared to ensure controlled and consistent H2S concentrations. The composition was designed to simulate typical biogas conditions, including methane (CH4), carbon dioxide (CO2), hydrogen sulfide (H2S), and minor components like ammonia and water vapor. The gas mixture was analyzed before injection into the biofilter using a gas data analyzer (model ITS04ATEX23415X, ultramat and fidamat gas analyzers, Munich, Germany) to confirm the target composition and H2S concentration. The gas composition was continuously monitored during the experiment to ensure stability. Table 1 shows the biogas composition in this research.
The biochar packing materials (separately measured for each pyrolysis temperature) were placed in a vertical plexiglass column (called a biofilter) that was 100 cm tall with an interior diameter of 14 cm. The biochar volume implemented in this study was approximately 0.0055 m3 (divided into 5 stages, each containing almost 0.0011 m3 of biochar particles at the same pyrolysis temperature). Regarding the nutrient supply solution used in this experiment to support the bacteria living in the biochar, K2HPO4 (0.02 g), (NH4)2SO4 (0.08 g), and Na2CO3 (0.39 g) with a pH of around 10–11 were mixed with 1 liter of deionized water, and the solution was constantly (in a circle) supplied to the biochar stages inside the biofilter [14,15,16]. The height of the biochar bed was 10 cm. The inlet and outlet biogases were at the bottom and top of the biofilter column, respectively. The biochar volume implemented was approximately 0.0055 m3 (divided into 5 stages, each containing almost 0.0011 m3 of biochar particles at the same pyrolysis temperature). The inlet concentration of H2S in the biofilter was controlled to be around 60–100 ppm, the inlet loading rate (ILR) of the biogas was 0.16 g/m3·h to 0.22 g/m3·h, and the velocity/flow rate was 30 mL/min. The biofilters were tested at flow rates ranging from 0.2 L/min to 1.0 L/min, simulating the typical conditions encountered in industrial biogas systems. Lower flow rates increased the residence time of the H2S in the biofilter, enhancing removal efficiency. Higher flow rates reduced the contact time but tested the biofilters’ capacity to handle higher throughput. Both the temperature of the biofilter, which was measured to be 27 °C to 30 °C, and velocity were analyzed using a testo 400 tool (Testo SE & Co. KGaA, Titisee-Neustadt, Germany). Humidity was controlled around 40% to 60%, and the empty bed retention time (EBRT) was measured using Equations (1)–(5) [17,18,19]:
EBRT = (Height of biofilter)/(Velocity of inlet biogas)
Q = A·V
A = π·r2
Vv = 4/3·π·r3
t = Vv/Q
In the equations above, Vv is the volume of the biogas storage ballon (m3); t is the dedicated time to fill the biogas ballon. The calculated values for the EBRT were 12.5 s, 16.6 s, and 25 s for gas flow rates of 0.08 m/s, 0.06 m/s, and 0.04 m/s, respectively. Over 6 days, which is approximately 144 h, the outlet H2S concentration in the biogas from the biochar bed was continuously monitored using an infrared biogas composition analyzer (Shimadzu gas chromatography model ITS04ATEX23415X, ultramat and fidamat gas analyzers, Munich, Germany) [20,21,22].
Figure 1 illustrates the laboratory-scale biofilter packed with biochar, CLC waste, and PUF in stages 4, 5, and 6 that was tested for its ability to remove hydrogen sulfide from biogas under varying temperatures, moisture contents, and inlet loading rates (ILRs) [23,24,25]. After the biogas was injected into the biofilter from balloons (ranging from 55 to 75 cm in size), each stage was analyzed using a GDA capable of measuring CH4, CO2, CO, H2, O2, and H2S [23,24,25]. The H2S concentration at each biofilter stage was monitored over six consecutive days. Finally, the performance of the biofilters, based on the packing materials used, was compared in terms of H2S removal efficiency from the biogas [26,27,28]. Additionally, a Testo 400 tool (Testo SE & Co. KGaA, Titisee-Neustadt, Germany) was used to evaluate the gas flow rate and the temperature inside the biofilter [24,26,28].
The biofilter beds were inoculated with a microbial culture enriched with sulfur-oxidizing bacteria (Thiobacillus) to enhance biological H2S removal. The inoculation process involved recirculating a nutrient solution containing the microbial culture over the packing materials (biochar, CLC waste, and PUF), promoting biofilm formation on the material surfaces. The biofilters were then operated under controlled conditions for an acclimation period of approximately 2–4 weeks. During this time, biogas with controlled H2S concentrations (20–25 ppm) was introduced to the biofilters to allow the microbial activity to stabilize and for the system to reach a steady state. Performance measurements were taken only after this stabilization period to ensure consistent and reliable results.
According to a review of the literature, the biofilter moisture content was ensured by humidifying the inlet gas stream, with most of the reviewed studies indicating a moisture content (H2O) ranging between 40% and 60% for different inlet loading rates [29,30]. Additionally, since the chosen packing materials were highly porous, a sufficient EBRT could be achieved within a shorter dedicated time frame [29,30]. To prevent sulfur accumulation in the biofilter packing bed, authors have mainly suggested the regular replacement of the packing material or, in experiments with lower capital investment, dust-removing components like blowers [30,31,32]. A constant temperature within the biofilter, crucial for the vital growth of aerobic sulfur-oxidizing bacteria, was achieved by controlling the temperature at room levels (22–25 °C) [33,34,35]. Lastly, the pH of the biofilter was adjusted to be more alkaline-based [7,8,9], as this was found to positively impact the desulfurization process by choosing aerobic sulfur-oxidizing Thiobacillus spp. bacteria. Periodic adjustments were made using pH buffer solutions to prevent deviations caused by the production of acidic byproducts during H2S oxidation [10,22,36].
Control experiments were conducted to validate the results and ensure the reliability of the findings [37,38,39]. For negative controls, a biofilter column without any packing material was used as a baseline to assess the removal of H2S through natural dispersion or adsorption by the column walls [37,38,39]. Columns packed with inert materials (e.g., glass beads) were included to rule out adsorption effects unrelated to the selected materials. For positive controls, a column filled with unmodified biochar served as a reference to evaluate the impact of material modifications (e.g., KOH activation, Fe2CO3 impregnation) [38,39,40]. All experiments were conducted in triplicate to ensure reproducibility and statistical reliability. Data were analyzed to determine the standard deviation and confidence intervals for H2S removal efficiency and other performance metrics [40,41,42].

2.2. Physicochemical Properties of Biochar, CLC Waste, and PUF

In this research, we first used packing material samples sourced from the Vilnius Sewage Sludge Treatment Plant, which underwent a slow pyrolysis procedure at temperatures of 300 °C, 400 °C, 500 °C, and 600 °C for 7 h within a 300 L pyrolysis apparatus in an oxygen-free environment [33,37,43]. Following pyrolysis, the apparatus was allowed to naturally cool to room temperature over 4 h [44,45]. The heating rate to reach the designated pyrolysis temperatures was 400 °C per hour, with an 8 h holding time at the final temperature [45,46]. Subsequently, the samples were cooled to 20 °C using nitrogen gas ventilation [44,46]. The resulting biochar was mechanically ground and then sifted through a 1.0 cm mesh sieve. The resulting material was chemically activated with potassium hydroxide (KOH) to enhance its porosity and functional groups. The second packing material, PUF, was solid with an open-cell structure [47,48]. PUF was used without chemical modification. It was selected for its microporous structure, providing a scaffold for microbial colonization (C27H36N2O10) [13,17,46]. PUF is often combined with more reactive materials, such as biochar or CLC waste, to balance the adsorption, catalysis, and structural stability in biofilters [13,17,46].
The third packing material, lightweight CLC waste, is one of the most widely used and popular building materials due to its strength and availability [49]. The main differences between regular concrete and CLC are the materials used, their physical properties, and their intended applications [50,51,52]. The physical density of CLC is much lower than that of traditional concrete (ranging from 400 to 1000 kg/m3 compared to 2400 kg/m3 for standard concrete) [53]. In foamed concrete, foam replaces the stone aggregates typically used in regular concrete, with the primary components being cement, sand, foam, and water [54,55]. In this study, CLC waste was collected from construction debris, cleaned, crushed, and sieved to a uniform particle size. Fe2CO3 was impregnated onto the material to introduce catalytic properties for H2S oxidation. Fe2CO3 introduced active catalytic sites for the oxidation of H2S to elemental sulfur and sulfate [20,24,25]. The modified CLC waste exhibited a 20% increase in catalytic efficiency, making it more effective in biofiltration applications [31,39,54]. Additionally, sand is removed to achieve the lowest possible density and prevent unnecessary compaction in a biofilter. The CLC waste sample used in this experiment had a median particle size of 11 mm. In this work, the physicochemical properties of these materials were analyzed [56,57]. The specific surface area and pore size distribution were measured using the Brunauer–Emmett–Teller (BET) method. Electrical conductivity and pH were measured separately; in the end, chemical functionality was assessed using Fourier-transform infrared spectroscopy (FTIR); and elemental composition was evaluated with energy-dispersive X-ray spectroscopy (EDS) [56,57].
The average experimental outcomes were derived from three replicates of each experimental treatment and are expressed as the mean ± standard deviation [9,14,19]. Data underwent variance analysis, where p-values below 0.05 were deemed acceptable [9,14,19]. An analysis of variance was conducted to ascertain significant disparities in the adsorption capacity of sewage sludge biochar across various pyrolysis temperatures.

2.3. Mathematical Modeling of the Experiment

The mass transfer of H2S within the biofilter was modeled using Fick’s diffusion and reaction kinetics laws. Reaction kinetics were assumed to follow first-order or Michaelis–Menten equations, depending on the mechanism model. Several simplifying assumptions were necessary to develop a viable mathematical model of biofiltration. These were the assumptions of the model [49,50,51]:
  • Negligible turbulence: Large turbulence was assumed negligible based on experimental data indicating a laminar flow pattern (with Reynolds number between 0.2 and 0.5 for full-scale operations) in typical biofilters.
  • Homogeneous filter material: The composition of the filter material, including porosity and water content, was assumed to be homogeneous.
  • Zero initial H2S concentration: It was assumed that the initial concentration of hydrogen sulfide (H2S) in the biofilter was zero.
  • Homogeneous biomass distribution: Biomass distribution and density within the biofilter were assumed to be homogeneous.
  • Inlet biogas: H2S concentrations ranged from 100 to 2000 ppm.
  • Outlet biogas: Zero-flux boundary conditions were applied to ensure mass conservation.
  • Diffusive flux coupled with reactive consumption were modeled at the material interface.
  • The experimentally measured surface area, porosity, and functional group data were incorporated into the adsorption parameters.
  • Microbial activity coefficients were linked to qPCR-derived population densities of sulfur-oxidizing bacteria (SOBs), particularly Thiobacillus.
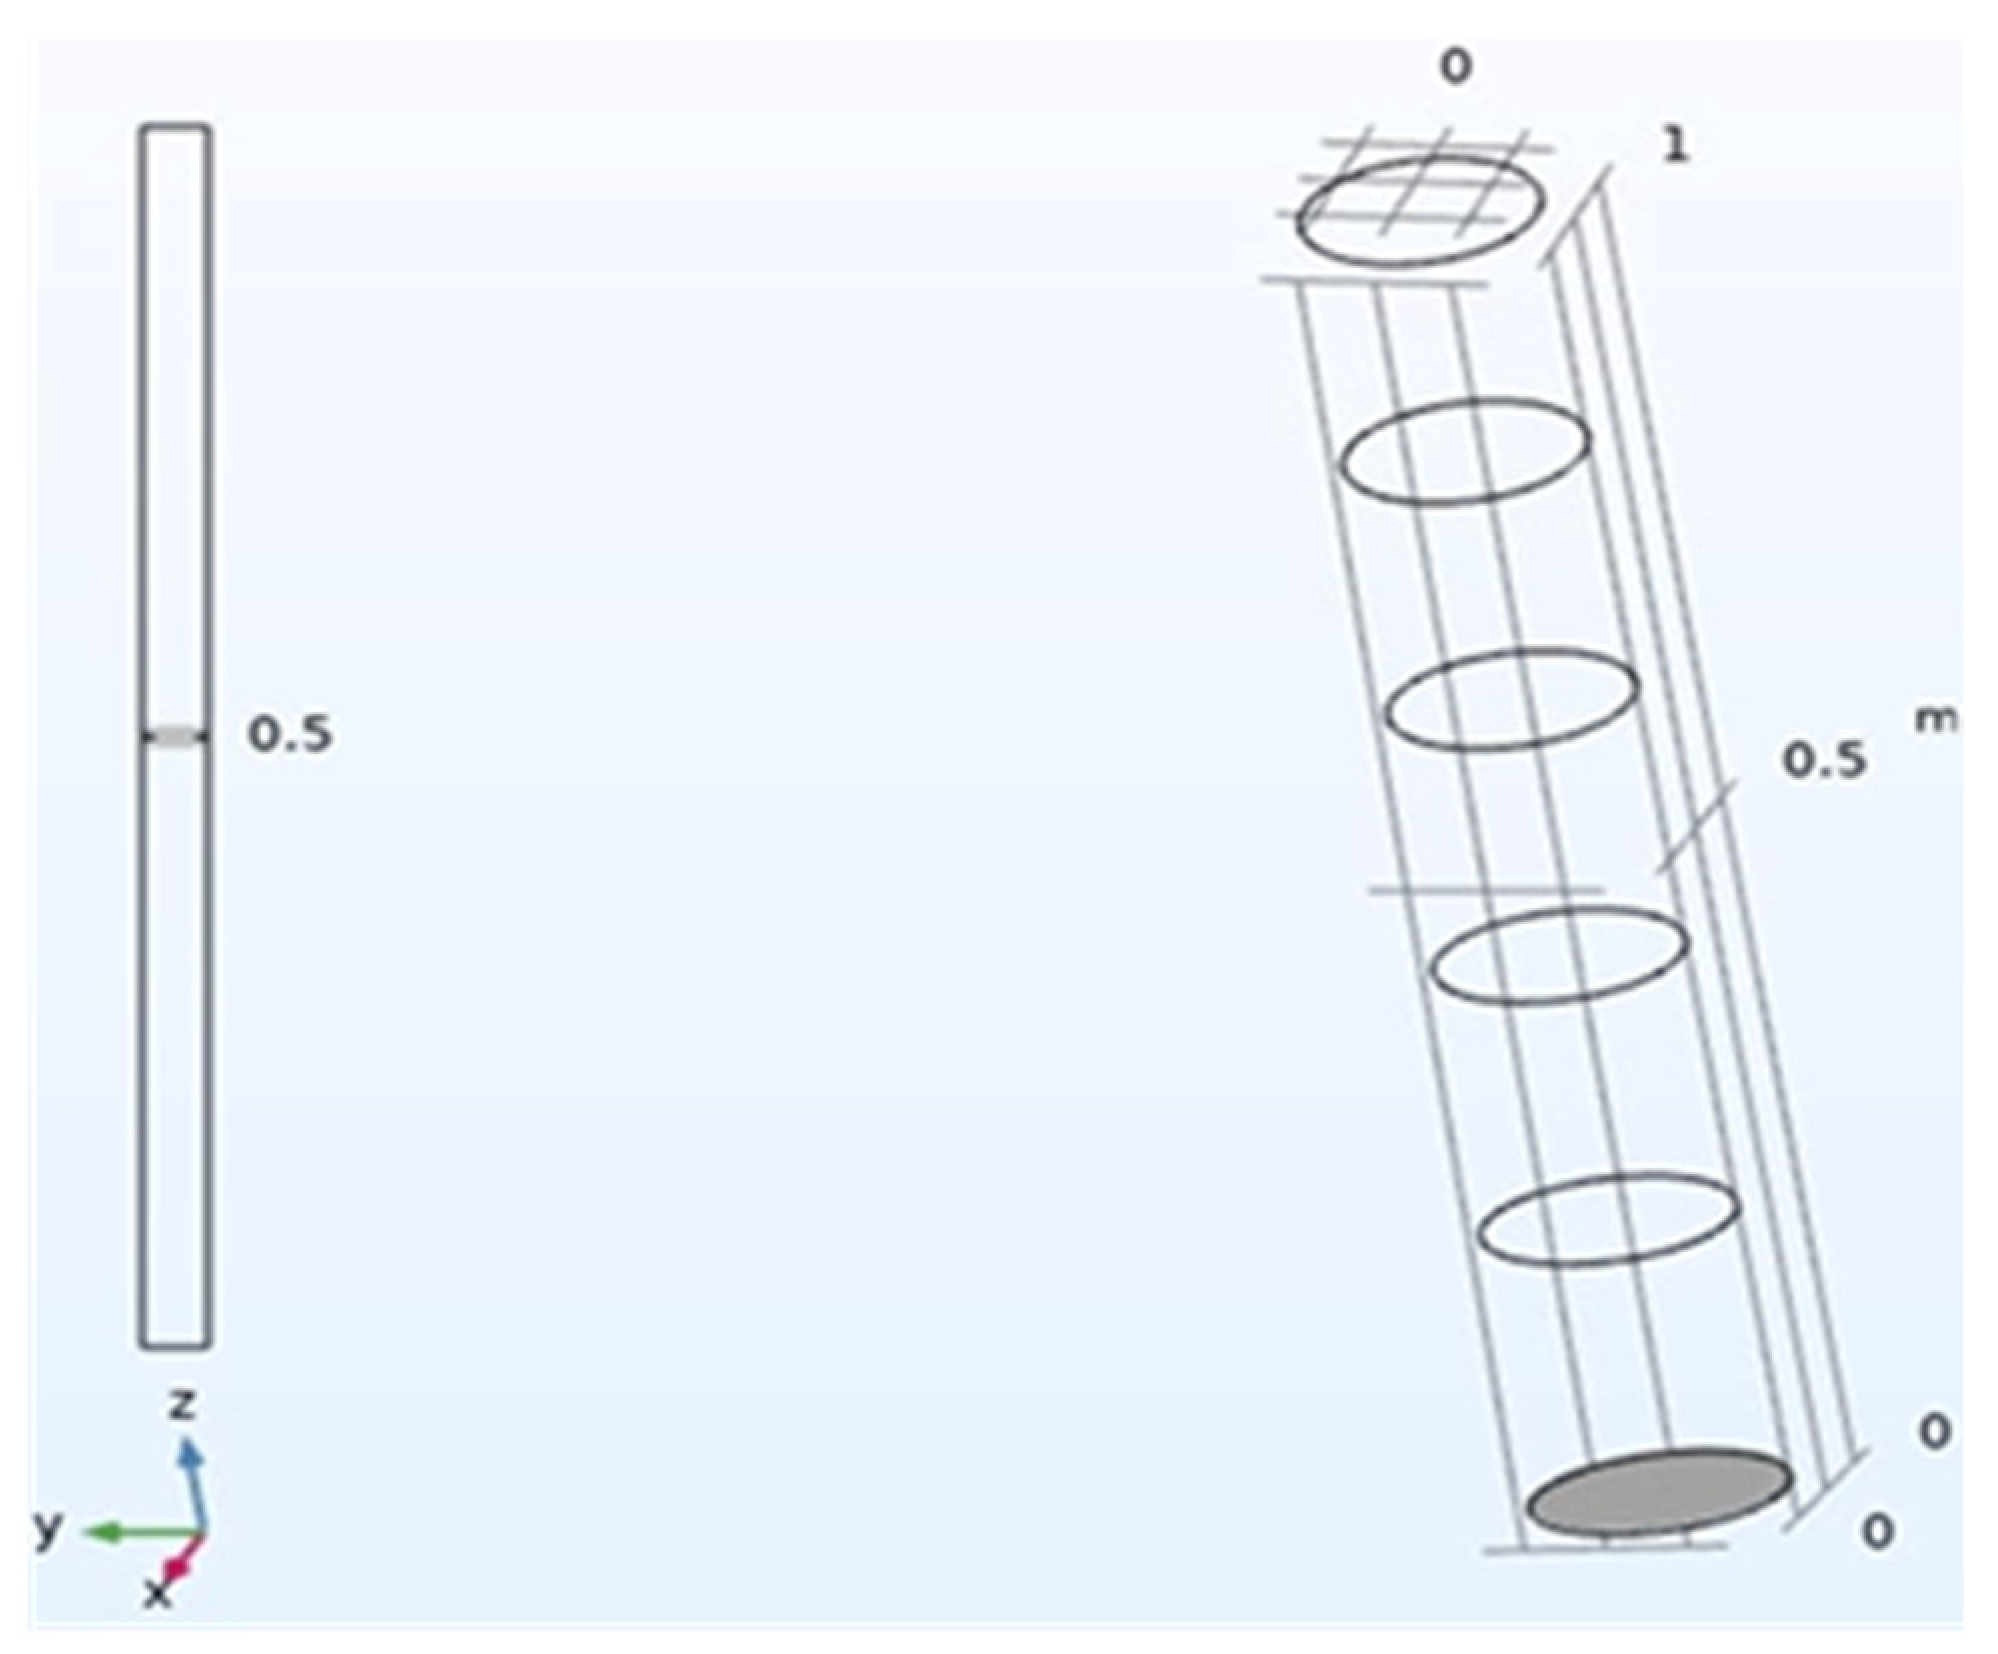
  • The COMSOL Multiphysics platform simulated the H2S removal efficiency under varying flow rates, concentrations, and packing configurations. Using input parameters from the experimental results, a 3D model of the biofilter was constructed.
  • Mesh sensitivity analysis ensured computational accuracy while minimizing processing time.
Values for adsorption capacity, reaction rate constants, and microbial activity coefficients were derived experimentally or from the literature. Sensitivity analysis was conducted to justify the parameter choices. The absorption and concentration reduction stages were as follows: Hydrogen sulfide was transferred from the gas phase to the biofilm surface surrounding the bed particles through a gas film [31,57]. Equations (6)–(9) were calculated accordingly [52,53]. The equations below, [k] represent the first-order reaction rate constant (s−1). [K] represents the Monod kinetics’ constant (kg/m3). [Cin] stands for the hydrogen sulfide concentration in the biogas (g/cm3). [Cout] denotes the hydrogen sulfide concentration at the gas film–biofilm interface (g/cm3). Depending on the pH, either H2S or HS was in the water [fx]. [D] is the rate of H2S diffusion into the water (m2/s). [m] is Henry’s constant concerning a pollutant. [µ] is the specific growth rate of a biofilm (s−1). [X] is the biofilm density (kg/m3). [A] represents the biofilm surface area. δ is the biofilm depth (m). [Y] is the yield coefficient, which equals the biomass consumed. [H] is the height of the biofilter columns (m). [V] is the velocity of air (m/s). [S] is the concentration hydrogen sulfide (H2S) in the biofilter system, typically expressed in units such as ppm or g/m3. [µmax] stands for the maximum specific growth rate (s−1).
Cout = Cin exp (−k·EBRT)
k = A m ( X · µ · f x · D K . Y ) tan ( β )
β = δ   X · µ K · Y · f x · D
µ = µ max   [ S ] K s + [ S ]

3. Results

3.1. Biofilter Performance

The hydrogen sulfide (H2S) removal efficiency of biofilters depends on the interplay between packing materials, operational parameters, and biofilter configurations. This section provides a comprehensive analysis of H2S removal efficiency, focusing on the effects of different packing materials, gas flow rates, and H2S concentrations. Additionally, the detailed comparison between single-material and mixed-material biofilters highlights the advantages of hybrid configurations. H2S removal efficiency (RE) is a primary performance indicator of biofilters, defined as the percentage reduction in H2S concentration between the inlet and outlet. The factors influencing RE, including material properties, gas flow rates, and H2S concentrations, are discussed here. The choice of packing material is critical for determining the overall performance of a biofilter, as it influences adsorption capacity, microbial activity, and catalytic properties.
This section reflects the research results obtained after injecting biogas into the laboratory-scale biofilter packed with sewage-sludge-derived biochar (biofilters packed with PUF and CLC waste will be evaluated in the future). Under specific environmental and operational conditions, hydrogen sulfide removal from the raw biogas was evaluated during the first 144 h (every 24 h, biogas was injected into the biofilter). The initial biogas chemical composition was analyzed by GDA for each storage ballon (different sizes and inlet loading rates (ILRs)). During the analysis, the room temperature was controlled at around 27 °C, the moisture content (humidity) of the packing materials was 60–80%, and the biochar pH was 8–9 depending on the stage. After the injection of biogas was started for each storage balloon, every 3 min, each stage (from the first to the fifth) filled with packing materials was separately analyzed. Each time, the evaluation from the lowest to the highest level of packing material took 15 min and was called a “round”. If the biogas chemical composition analysis by GDA finished after two rounds, the mean inlet loading time was 30 min, while for three rounds, it was about 45 min. Table 2 shows the removal efficiency of hydrogen sulfide from the biogas at different stages of the biofilter. The differences in the initial H2S concentrations meant that certain materials, such as PUF, might have adsorbed H2S during the initial stages of the experiment, leading to apparent differences in the measured initial concentrations. This phenomenon was observed when analyzing the gas mixture composition after the initial equilibration.
Biochar achieved the highest removal efficiency (RE) among the tested materials, with values exceeding 92.40% under optimal conditions. Its high surface area (>1000 m2/g) and microporosity enabled the effective adsorption of H2S molecules. The presence of functional groups (e.g., hydroxyl and carboxyl) facilitated chemical interactions with H2S, enhancing its reactivity. Regarding microbial support, the biochar provided an excellent substrate for sulfur-oxidizing bacteria (SOBs), such as Thiobacillus, contributing to sustained biological oxidation. The unmodified CLC waste exhibited moderate removal efficiency (RE ≈ 60.00–70.00%). When impregnated with Fe2CO3, the efficiency improved to 75.00%, highlighting the importance of catalytic modification. Moderate porosity (30.00–40.00%) allowed gas diffusion and microbial colonization. Fe2CO3 modification introduced catalytic sites that accelerated the oxidation of H2S into elemental sulfur and sulfate, compensating for the material’s lower adsorption capacity. PUF demonstrated the lowest RE among the materials tested (<50.00%), primarily due to its lack of adsorption and catalytic properties. While it is ineffective as a standalone material for H2S removal, PUF provides structural stability and supports microbial biofilm development, indirectly contributing to performance in mixed-material configurations. The gas flow rate was a key operational parameter influencing the contact time between the biogas and packing materials. The longer residence times at lower flow rates (0.2–0.5 L/min) resulted in higher removal efficiencies for all materials.
The biochar an achieved RE > 95.00% at a flow rate of 0.2 L/min, while Fe2CO3-modified CLC waste and mixed-material configurations performed optimally under these conditions. High flow rates (0.8–1.0 L/min) reduced the contact time, leading to a decline in the RE. At 1.0 L/min, the biochar maintained an RE = 79.90%, whereas PUF and unmodified CLC waste experienced more significant reductions. The decrease in RE at higher flow rates led to a pronounced RE for materials with lower adsorption capacities, such as PUF and modified CLC waste.
The inlet concentration of H2S significantly impacted biofilter performance, particularly the balance between physical adsorption and biological oxidation mechanisms. At low H2S concentrations (<500 ppm), all materials exhibited high removal efficiencies (RE > 90.00%), driven predominantly by biological oxidation processes. At moderate H2S concentrations (500–1500 ppm), the biochar and Fe2CO3-modified CLC waste maintained high efficiencies (RE ≈ 85.00–90.00%), while unmodified CLC waste and PUF experienced slight declines. At high H2S concentrations (>1500 ppm), adsorption site saturation and microbial activity limitations reduced the RE. The Fe2CO3-modified CLC waste outperformed the other materials under these conditions, benefiting from its catalytic properties that accelerated the conversion of H2S into sulfur compounds. Mixed-material configurations mitigated these effects, maintaining an RE > 85.00% across the tested concentration range. The configuration of the packing materials within a biofilter determines the balance between adsorption, catalysis, and microbial support, influencing overall performance. Regarding single-material biofilters (biochar, CLC waste, PUF), biochar achieved the highest removal efficiency (RE = 91.80%) among the single-material biofilters due to its superior adsorption and microbial support properties. In terms of limitations, the efficiency declined at higher H2S concentrations and flow rates due to adsorption site saturation. The modified CLC waste was limited by its lower surface area and adsorption capacity, achieving moderate performance (RE ≈ 60.50–70.50%). Fe2CO3 modification improved performance, particularly under high H2S concentrations, by introducing catalytic oxidation mechanisms. PUF alone was ineffective in H2S removal, with an RE < 50.00%, highlighting its role as a support material rather than an active component in biofilters. Figure 2 presents the removal efficiency of hydrogen sulfide from biogas when using the different packing materials.

3.2. Simulation in COMSOL

Figure 3 presents a schematic prototype of the biofilter designed for the removal of hydrogen sulfide (H2S) from biogas. This model incorporated the same statistical data and dynamic conditions outlined, with the results derived from the mathematical calculations discussed in the Section 2 [56,57].
In the simulation, we replicated the operational environment of the biofilter, allowing us to observe how it performs under various conditions [56,57]. For instance, just as a sponge absorbs water, the biofilter is engineered to capture H2S through chemical interactions, ensuring efficient removal [56,57]. The data from our earlier calculations provided the foundation for setting the boundary conditions and initial values within the simulation [57].
The prototype included various components—such as the packing material and airflow pathways—crucial for optimizing performance [49]. By adjusting parameters like temperature and flow rate within the simulation, we could predict how changes affect the system’s efficiency [49]. This approach provided insights into biofilter behavior and allowed for fine-tuning of the design to enhance H2S absorption.
Overall, the COMSOL 6.1 simulation offered a powerful tool for visualizing and optimizing the biofilter, ensuring we could achieve the best possible performance in real-world applications.
Figure 4, Figure 5, Figure 6, Figure 7 and Figure 8 display screenshots of simulating the hydrogen sulfide (H2S) removal process from biogas using COMSOL 6.1. The monitoring occurred at 24, 48, 72, 96, 120, and 144 h over the first six days following the initial exposure to the laboratory-scale biofilter. During this period, four key parameters were tracked and reported by the simulation software: H2S concentration (mol/m3), velocity/flow rate of the biogas (m/s), biogas concentration (ppm), and air pressure (Pa). The simulation was repeated for biofilters operating under identical conditions packed with biochar, CLC waste, and PUF.

4. Discussion

4.1. Results of Experimental Analysis

The results of the comparison of the biofilter material modifications and their H2S removal efficiency (RE) are summarized as follows:
  • The unmodified biochar demonstrated an H2S removal efficiency of 80.00%, which is relatively high and highlights its inherent adsorption capabilities and suitability as a packing material for biofilters.
  • KOH-activated biochar achieved a significantly higher efficiency of 92.00%, showcasing the impact of chemical activation with potassium hydroxide. The increased efficiency can be attributed to the enhanced surface area, pore structure, and chemical reactivity introduced by the activation process, facilitating greater adsorption and microbial activity.
  • Unmodified CLC waste: Its moderate removal efficiency of 60.00% indicates that while CLC waste can function as a biofilter material, its unmodified form has limitations in H2S adsorption and microbial support.
  • Fe2CO3-impregnated CLC waste: The modification with iron carbonate significantly improved the efficiency to 75.00%. This enhancement could be linked to the catalytic activity provided by Fe2CO3, which likely accelerated the oxidation of H2S as well as improved the surface chemistry of the material.
  • PUF exhibited the lowest efficiency of 48.00%, reflecting its limited capability for H2S adsorption or microbial colonization without further modification. While PUF is valuable as a structural material for supporting biofilms, it lacks the chemical properties required for significant H2S removal, emphasizing the need for additional treatment or blending with other materials.
The chemical activation and impregnation of the materials dramatically improved their performance. The KOH-activated biochar outperformed all other materials, while the Fe2CO3-modified CLC waste was substantially improved compared with its unmodified counterpart. Both the unmodified and modified biochar exhibited higher removal efficiencies than the other materials, confirming its suitability as a base material for biofilters. The performance of PUF was the lowest among all the tested materials, underscoring its limitation as a standalone material for H2S removal. However, its role as a microbial support material remains valuable when combined with other high-performing materials. These findings highlight the necessity of material modification to enhance performance and the superiority of activated biochar as a biofilter material for H2S removal.

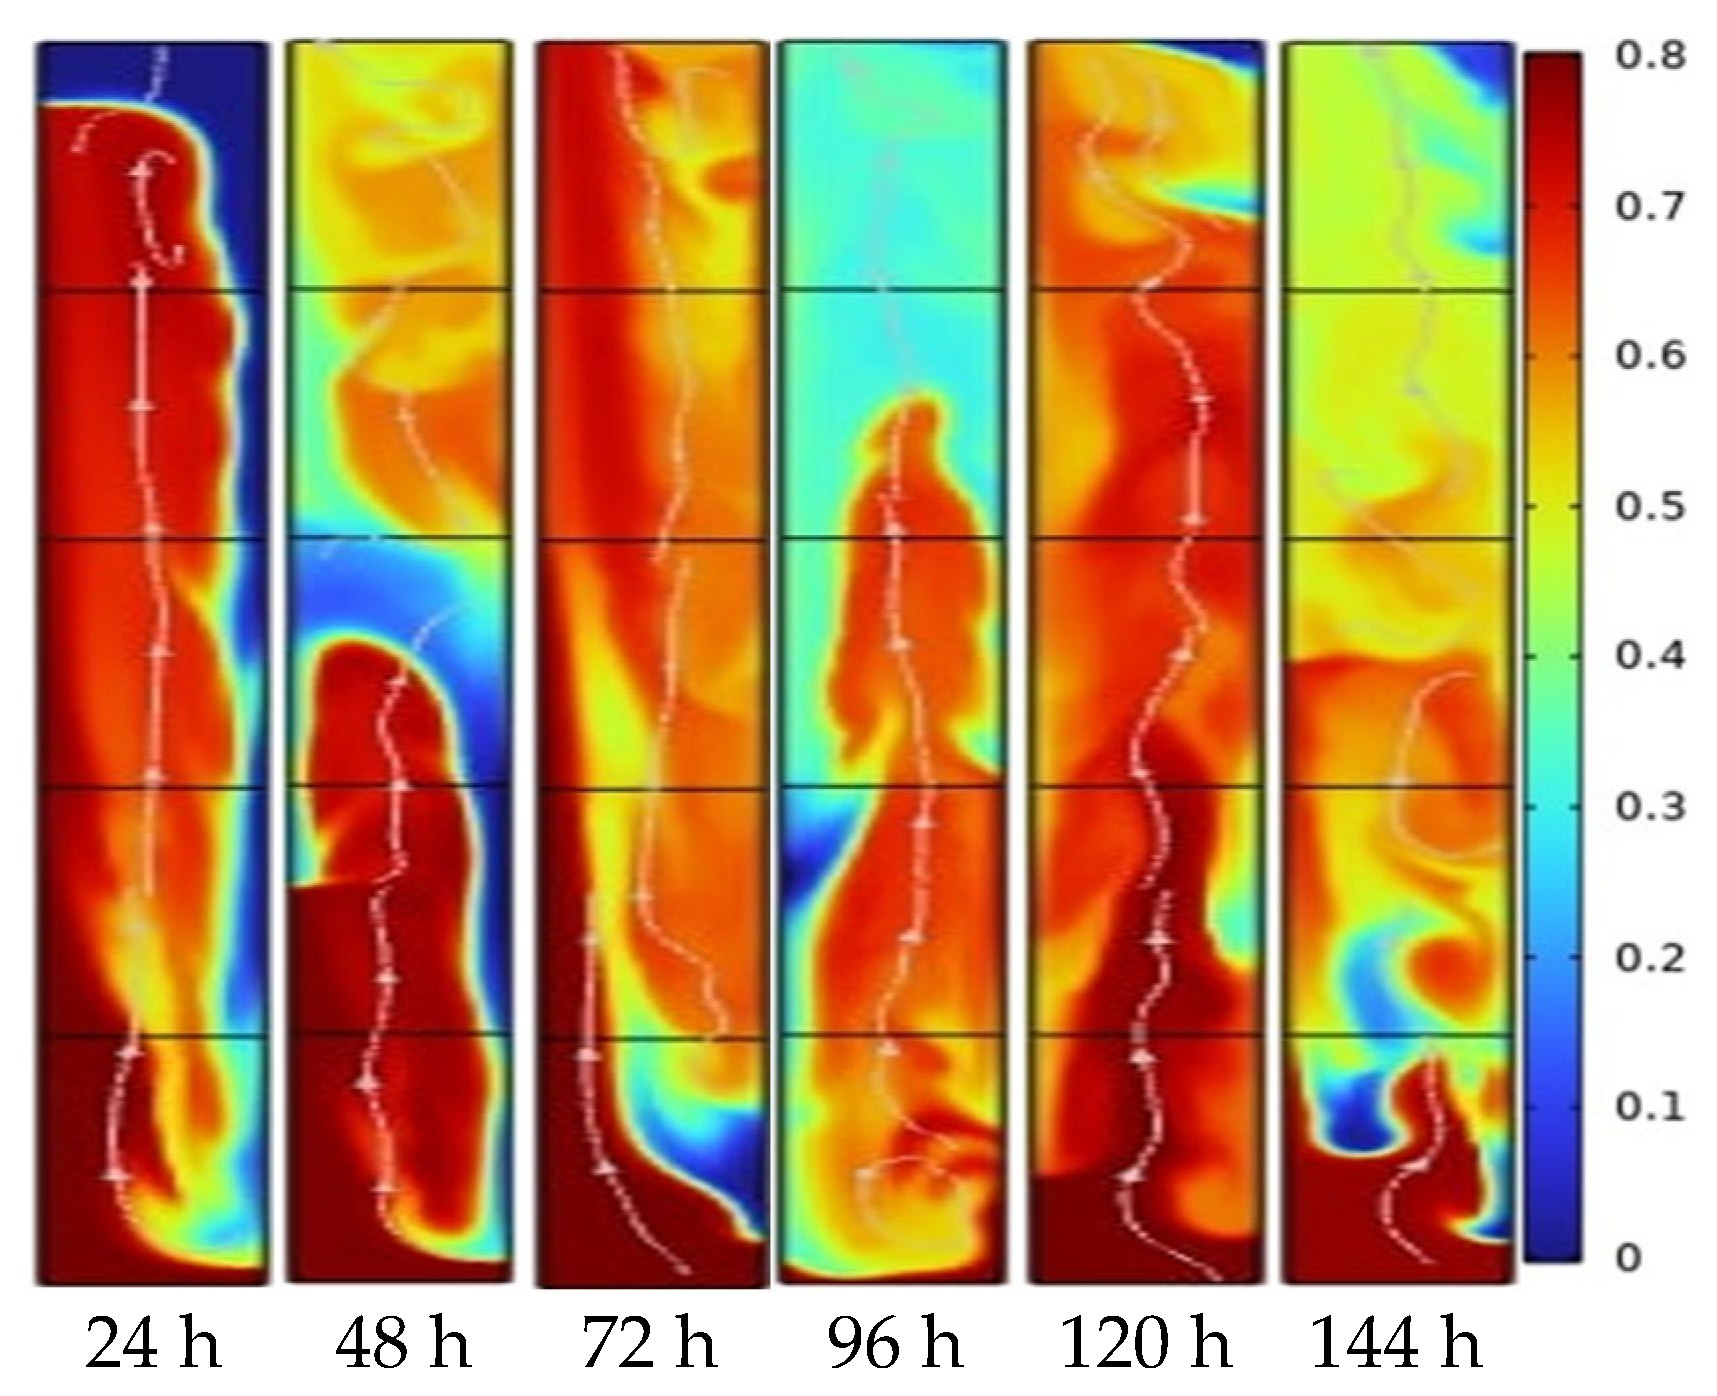
4.2. Results of Simulation Analysis

In similar simulations of H2S concentration in a biofilter packed with CLC waste (Figure 5), most of the hydrogen sulfide was not effectively trapped but was rather evenly distributed across all five stages of the packing material. Beginning from day three, the blue areas (indicating lower H2S concentrations) and red areas (indicating higher concentrations) diminished, while the green and yellow regions grew, indicating that the toxic gas infiltrated all sections of the biofilter and was being eliminated from the biogas. When comparing the initial concentration after 24 h of trapping to the levels observed after 144 h, a decrease in the red areas, especially in the upper stages, was observed, with corresponding increases in the yellow and green spaces. This indicated a reduction in the concentration from 0.8 mol/m3 to approximately 0.4–0.5 mol/m3 over the week. Similar results were reported in other studies [11,12,40], where biofilters packed with CLC waste, biochar, polypropylene strings, and other materials achieved hydrogen sulfide removal capacities of up to 20.00%. Additionally, simulations conducted [22,41] using COMSOL showed similar trends, with removal efficiencies reaching 90.00% to 93.00% over three months.
For the biofilter packed with PUF (Figure 6), the simulation of H2S concentration during the first six days showed that hydrogen sulfide was not effectively trapped but rather evenly distributed across all five stages of the PUF material. By day four, the blue and red areas began to decrease, while the green and yellow areas expanded, suggesting that the toxic gas infiltrated the entire biofilter and was beginning to be eliminated. Comparing the initial concentration after 24 h of trapping to that after 144 h, the red areas in the upper stages diminished, with increases in the yellow and green spaces. This decrease in concentration, from 0.8 mol/m3 to approximately 0.4–0.5 mol/m3, was like that in other studies [33,50], which reported up to 30.00% hydrogen sulfide removal from biogas in biofilters packed with PUF. Simulations [18] using COMSOL for biofilters packed with biochar and PUF also showed similar trends, achieving a removal efficiency of around 72.00% over three months.
The simulation of biogas velocity in the biofilter packed with CLC waste (Figure 7) demonstrated that the airflow remained relatively constant across all five stages of the packing material throughout the monitoring period. At the start, the red areas (indicating higher airflow rates) ranged from 8 × 10⁻2 m/s to 9 × 10⁻2 m/s, suggesting steady airflow across the biofilter, effectively mixing the biogas and pre-existing air in the system. Comparable simulations of biogas flow rates in biofilters packed with biochar and PUF [11,19,20,31] revealed a similar pattern of increasing biogas velocity toward the upper sections of the biofilter during the first week of analysis.
Finally, the simulation of biogas concentration during the first six days in the laboratory-scale biofilters (Figure 8) indicated that most of the biogas was not effectively trapped at any stage. Still, it was rather evenly distributed across all five stages of the CLC waste packing material. From day four, the blue areas (indicating lower biogas concentrations) began to diminish, while the red areas (indicating higher concentrations) increased. The green and yellow regions nearly disappeared, suggesting that the toxic gas infiltrated every part of the biofilter. Comparing the initial concentration after 24 h of trapping to the levels after 144 h, the blue areas faded, and the orange and red areas increased, indicating an increase in biogas distribution to 1 mol/m3 within a week. Similar results from simulations of biogas concentration in biofilters packed with biochar and PUF [11,19,20,31] also showed the same integration of biogas with the existing air within the biofilter during the first week of analysis.
The simulation results revealed that H2S removal efficiency varied significantly with flow rate and concentration. High removal efficiencies were observed at low flow rates and moderate H2S concentrations, highlighting the importance of operational conditions for biofilter performance.

5. Conclusions

In summary, the COMSOL simulation results derived from mathematical modeling using Equations (4)–(7) indicated the hydrogen sulfide concentration in the biofilter after 144 h of being trapped in the laboratory-scale biofilter packed with three selected materials. Overall, the removal efficiency at the higher (fourth and fifth) stages demonstrated superior performance compared to the lower stages for all three biofilters. Notably, the biofilter packed with CLC waste excelled, achieving removal efficiencies of approximately 60.00–70.00% in its upper stages. In contrast, the biofilter exhibited around 60.00% hydrogen sulfide purification in its higher stages. The biochar-packed biofilter showed an elimination capacity of approximately 55.00–70.00%.
It is important to note that these simulations were conducted under previously specified environmental and operational conditions over the first six days after biogas injection, and the results may vary in different scenarios. Regarding velocity/flow rate and biogas concentration, all biofilters exhibited similar performance throughout the evaluation period. By the end of the 144 h, the biogas and airflow were effectively distributed within the biofilter. Fluctuations in air pressure were observed for all three biofilters during the simulation. An air controller was integrated into the laboratory-scale biofilter to mitigate any potential disruptions to system performance. In summary, (a) the adsorption capacity of KOH-activated biochar and Fe2CO3-impregnated CLC waste was enhanced; (b) the utility of COMSOL-based simulation in predicting biofilter performance was demonstrated; (c) future directions include incorporating operational data and exploring hybrid materials for biofilter optimization. These were the main outcomes of this scientific research.
To further enhance hydrogen sulfide removal efficiency, future research could explore optimizing biofilter packing materials, as this current study found variability in performance for the different stages and materials. Experimenting with alternative biochar sources or modifying the CLC waste composition might improve the removal rates. Additionally, investigating the impact of various biogas concentrations and flow rates on performance could offer deeper insights into how biofilters respond to different operational conditions, potentially identifying more efficient operating parameters. Furthermore, developing advanced modeling techniques, potentially incorporating dynamic variables and real-time data, could refine the accuracy of future simulations and enable the development of predictive maintenance strategies for biofilter systems. Experimenting with larger-scale or long-term operational studies could provide more practical insights into biofilter durability and long-term performance under fluctuating conditions. Lastly, examining the potential for regenerating or reusing the packing materials after their saturation with hydrogen sulfide could add a sustainable dimension to this research, reducing costs and enhancing the overall sustainability of biofilter systems.

Author Contributions

Conceptualization, K.M., R.V. and A.Z.; methodology, K.M.; software, K.M.; validation, R.V. and A.Z.; formal analysis, K.M.; investigation, K.M. and R.V.; resources, R.V. and A.Z.; data curation, R.V. and A.Z.; writing—original draft preparation, K.M.; writing—review and editing, R.V. and A.Z.; visualization, R.V. and A.Z.; supervision, R.V. and A.Z.; project administration, R.V. and A.Z. All authors have read and agreed to the published version of the manuscript.

Funding

This research received no external funding.

Data Availability Statement

The raw data supporting the conclusions in this article will be made available by the authors upon request.

Acknowledgments

We would like to thank Vilnius Tech University for providing the necessary staff and resources for this research. We extend our gratitude to Tomas Zemaitis for his technical assistance in conducting the experimental tests and data collection as well as his insightful feedback throughout this project. We also acknowledge the support of the Environmental Protection Technology and Management laboratory for providing the facilities and equipment used in the experimental setup.

Conflicts of Interest

The authors declare no conflicts of interest.

References

  1. Alkhatib, I.; Khalifa, O.; Bahamon, D.; Abu-Zahra, M.R.; Vega, L.F. Sustainability criteria as a game changer in the search for hybrid solvents for CO2 and H2S removal. Sep. Purif. Technol. 2021, 277, 119516. [Google Scholar] [CrossRef]
  2. Ma, C.; Zhao, Y.; Chen, H.; Liu, Y.; Huang, R.; Pan, J. Biochars derived from by-products of microalgae pyrolysis for sorption of gaseous H2S. J. Environ. Chem. Eng. 2022, 10, 107370. [Google Scholar] [CrossRef]
  3. Bu, H.; Carvalho, G.; Huang, C.; Sharma, K.R.; Yuan, Z.; Song, Y.; Bond, P.; Keller, J.; Yu, M.; Jiang, G. Evaluation of continuous and intermittent trickling strategies for the removal of hydrogen sulfide in a biotrickling filter. Chemosphere 2021, 291, 132723. [Google Scholar] [CrossRef] [PubMed]
  4. Ćwiertniewicz-Wojciechowska, C.; Cema, G.; Ziembińska-Buczyńska, A. Sewage sludge pretreatment: Current status and future prospects. Environ. Sci. Pollut. Res. 2023, 30, 88313–88330. [Google Scholar] [CrossRef]
  5. Konkol, D.; Popiela, E.; Skrzypczak, D.; Izydorczyk, G.; Mikula, K.; Moustakas, K.; Opaliński, S.; Korczyński, M.; Krowiak, A.W. Recent innovations in various methods of harmful gases conversion and its mechanism in poultry farms. Environ. Res. 2022, 214, 113825. [Google Scholar] [CrossRef]
  6. Nhut, H.H.; Thanh, V.T.; Le, L.T. Removal of H2S in biogas using biotrickling filter: Recent development. Process Saf. Environ. Prot. 2020, 144, 297–309. [Google Scholar] [CrossRef]
  7. De Souza, F.M.; Kahol, P.K.; Gupta, K.R. Introduction to Polyurethane Chemistry. Am. Chem. Soc. 2021, 1380, 1–24. [Google Scholar]
  8. Ghimire, A.; Gyawali, R.; Lens, P.N.L.; Lohani, S.P. Technologies for removal of hydrogen sulfide (H2S) from biogas. In Emerging Technologies and Biological Systems for Biogas Upgrading; Elsevier: Amsterdam, The Netherlands, 2021; Volume 11. [Google Scholar]
  9. Shang, G.; Liu, L.; Chen, P.; Shen, G.; Li, Q. Kinetics and the mass transfer mechanism of hydrogen sulfide removal by biochar derived from rice hull. J. Air Waste Manag. Assoc. 2016, 133, 495–499. [Google Scholar] [CrossRef]
  10. Haosagul, S.; Prommeenate, P.; Hobbs, G.; Pisutpaisal, N. Sulfur-oxidizing bacteria in full-scale biogas cleanup system of ethanol industry. Renew. Energy 2020, 150, 965–972. [Google Scholar] [CrossRef]
  11. Jiang, X.; Wu, J.; Jin, Z.; Yang, S.; Shen, L. Enhancing the removal of H2S from biogas through refluxing of outlet gas in biological bubble-column. Bioresour. Technol. 2020, 299, 122621. [Google Scholar] [CrossRef]
  12. Juntarachat, N.; Onthong, U. Removal of hydrogen sulfide from biogas using banana peel and banana empty fruit bunch biochars as alternative adsorbents. Biomass Convers. Biorefinery 2022, 14, 27077–27088. [Google Scholar] [CrossRef]
  13. Lin, Q.; Zhang, J.; Yin, L.; Liu, H.; Zuo, W.; Tian, Y. Relationship between heavy metal consolidation and H2S removal by biochar from microwave pyrolysis of municipal sludge: Effect and mechanism. Environ. Sci. Pollut. Res. 2021, 28, 27694–27702. [Google Scholar] [CrossRef] [PubMed]
  14. Xia, G.; Zhou, X.; Hu, J.; Sun, Z.; Yao, J.; Chen, D.; Wang, J. Simultaneous removal of carbon disulfide and hydrogen sulfide from viscose fibre waste gas with a biotrickling filter in pilot scale. J. Clean. Prod. 2019, 230, 21–28. [Google Scholar] [CrossRef]
  15. Khan, M.U.; EnLee, J.T.; Bashir, M.A.; Dissanayake, P.D.; WahTong, Y.S.; Shariati, M.A.; Wu, S.; Ahring, B.K. Current status of biogas upgrading for direct biomethane use: A review. Renew. Sustain. Energy Rev. 2021, 149, 111343. [Google Scholar] [CrossRef]
  16. Kulawong, S.; Artkla, R.; Sriprapakhan, P.; Maneechot, P. Biogas purification by adsorption of hydrogen sulfide on NaX and Ag-exchanged NaX zeolites. Biomass Bioenergy 2022, 159, 106417. [Google Scholar] [CrossRef]
  17. Cortés, J.J.G.; Almenglo, F.; Ramírez, M.; Cantero, D. Simultaneous removal of ammonium from landfill leachate and hydrogen sulfide from biogas using a novel two-stage oxic-anoxic system. Sci. Total Environ. 2021, 750, 141664. [Google Scholar] [CrossRef]
  18. Kirchmann, H.; Börjesson, G.; Kätterer, T.; Cohen, Y. From agricultural use of sewage sludge to nutrient extraction: A soil science outlook. Ambio 2017, 46, 143–154. [Google Scholar] [CrossRef]
  19. Jedynak, K.; Charmas, B. Adsorption properties of biochars obtained by KOH activation. Environ. Manag. 2023, 30, 167–183. [Google Scholar] [CrossRef]
  20. Lee, J.T.E.; Ok, Y.S.; Song, S.; Dissanayake, P.D.; Tian, H.; Tio, Z.K.; Cui, R.; Lim, E.Y.; Jong, M.C.; Hoy, S.H.; et al. Biochar utilisation in the anaerobic digestion of food waste for the creation of a circular economy via biogas upgrading and digestate treatment. Bioresour. Technol. 2021, 333, 125190. [Google Scholar] [CrossRef]
  21. Lamastra, L.; Suciu, N.A.; Trevisan, M. Sewage sludge for sustainable agriculture: Contaminants’ contents and potential use as fertilizer. Chem. Biol. Technol. Agric. 2018, 5, 10. [Google Scholar] [CrossRef]
  22. Mohammadi, K.; Vaiskunaite, R. Analysis and evaluation of the biogas purification technologies from H2S. In Environmental Protection Technology and Management VGTU; VGTU: Vilnius, Lithuania, 2023; Volume 15, pp. 1–9. [Google Scholar]
  23. Januševičius, T.; Mažeikienė, A.; Stepova, K.; Danila, V.; Paliulis, D. The Removal of Phosphorus from Wastewater Using a Sewage Sludge Biochar: A Column Study. Water 2024, 16, 1104. [Google Scholar] [CrossRef]
  24. Mitchell, K.; Beesley, L.; Šípek, V.; Trakal, L. Chapter 3—Biochar and its potential to increase water, trace element, and nutrient retention in soils. Biochar Agric. Achiev. Sustain. Dev. Goals 2022, 36, 8–20. [Google Scholar]
  25. Bagheri, M.; Bauer, T.; Burgman, L.E.; Wetterlund, E. Fifty years of sewage sludge management research: Mapping researchers’ motivations and concerns. J. Environ. Manag. 2023, 325, 116412. [Google Scholar] [CrossRef]
  26. Danila, V.; Zagorskis, A.; Januševičius, T. Effects of Water Content and Irrigation of Packing Materials on the Performance of Biofilters and Biotrickling Filters: A Review. Processes 2022, 10, 1304. [Google Scholar] [CrossRef]
  27. Paulionyte, J.; Vaiskunaite, R.; Mazeikiene, A. Evaluation of sewage sludge biochar use in wastewater treatment from phosphate. In Environmental Protection Technology and Management VGTU; VGTU: Vilnius, Lithuania, 2022. [Google Scholar]
  28. Zhang, Y.; Kawasaki, Y.; Oshita, K.; Takaoka, M.; Minami, D.; Inoue, G.; Tanaka, T. Economic assessment of biogas purification systems for removal of both H2S and siloxane from biogas. Renew. Energy 2021, 168, 119–130. [Google Scholar] [CrossRef]
  29. Sugurbekova, G.; Nagyzbekkyzy, E.; Sarsenova, A.; Danlybayeva, G.; Anuarbekova, S.; Kudaibergenova, R.; Frochot, C.; Acherar, S.; Zhatkanbayev, Y.; Moldagulova, N. Sewage Sludge Management and Application in the Form of Sustainable Fertilizer. Sustainability 2023, 15, 6112. [Google Scholar] [CrossRef]
  30. Gaga, Y.; Benmessaoud, S.; Kara, M.; Assouguem, A.; Al-Ghamdi, A.A.; Al-Hemaid, F.M.; Elshikh, M.S.; Ullah, R.; Banach, A.; Bahhou, J. New Margin-Based Biochar for Removing Hydrogen Sulfide Generated during the Anaerobic Wastewater Treatment. Water 2022, 14, 3319. [Google Scholar] [CrossRef]
  31. Styszko, K.; Durak, J.; Kończak, B.; Głodniok, M. The impact of sewage sludge processing on the safety of its use. Sci. Rep. 2022, 12, 12227. [Google Scholar] [CrossRef]
  32. Torres, R.A.; Marín, D.; Rodero, M.D.R.; Pascual, C.; Sanchez, A.G.; Crespo, I.G.; Lebrero, R.; Torre, R.M. Biogas treatment for H2S, CO2, and other contaminants removal. In From Biofiltration to Promising Options in Gaseous Fluxes Biotreatment; Elsevier: Amsterdam, The Netherlands, 2020; pp. 153–176. [Google Scholar]
  33. Wu, J.; Jiang, X.; Jin, Z.; Yang, S.; Zhang, J. The performance and microbial community in a slightly alkaline biotrickling filter for the removal of high concentration H2S from biogas. Chemosphere 2020, 249, 126127. [Google Scholar] [CrossRef]
  34. Watsuntorn, W.; Khanongnuch, R.; Chulalaksananuku, W.; Rene, E.R.; Lens, P.N.L. Resilient performance of an anoxic biotrickling filter for hydrogen sulfide removal from a biogas mimic: Steady, transient state and neural network evaluation. J. Clean. Prod. 2020, 249, 119351. [Google Scholar] [CrossRef]
  35. Wang, S.; Nam, H.; Lee, D.; Nam, H. H2S gas adsorption study using copper impregnated on KOH activated carbon from coffee residue for indoor air purification. J. Environ. Chem. Eng. 2022, 10, 108797. [Google Scholar] [CrossRef]
  36. Xu, Y.; Chen, Y.; Ma, C.; Qiao, W.; Wang, J.; Ling, L. Functionalization of activated carbon fiber mat with bimetallic active sites for NH3 and H2S adsorption at room temperature. Sep. Purif. Technol. 2022, 303, 122335. [Google Scholar] [CrossRef]
  37. Appala, V.N.S.G.; Pandhare, N.N.; Bajpai, S. Mathematical Models for Optimization of Anaerobic Digestion and Biogas Production. In Zero Waste Biorifinery; Springer Nature Singapore: Singapore, 2022; pp. 21–36. [Google Scholar]
  38. Ying, S.; Kong, X.; Cai, Z.; Man, Z.; Xin, Y.; Liu, D. Interactions and microbial variations in a biotrickling filter treating low concentrations of hydrogen sulfide and ammonia. Chemosphere 2020, 255, 126931. [Google Scholar] [CrossRef]
  39. Zhu, H.L.; Papurello, D.; Gandiglio, M.; Lanzini, A.; Akpinar, I.; Shearing, P.R.; Manos, G.; Brett, D.J.L.; Zhang, Y.S. Study of H2S Removal Capability from Simulated Biogas by Using Waste-Derived Adsorbent Materials. Processes 2020, 8, 1030. [Google Scholar] [CrossRef]
  40. Zhang, X.; Lawan, I.; Danhassan, U.A.; He, Y.; Qi, R.; Wu, A.; Sheng, K.; Lin, H. Advances in technologies for in situ desulfurization of biogas. Adv. Bioenergy 2022, 7, 99–137. [Google Scholar]
  41. Su, J.J.; Hong, Y.Y. Removal of hydrogen sulfide using a photocatalytic livestock biogas desulfurizer. Renew. Energy 2020, 149, 181–188. [Google Scholar] [CrossRef]
  42. Zhang, Y.; Oshita, K.; Kusakabe, T.; Takaoka, M.; Kawasaki, Y.; Minami, D.; Tanaka, T. Simultaneous removal of siloxanes and H2S from biogas using an aerobic biotrickling filter. J. Hazard. Mater. 2020, 391, 122187. [Google Scholar] [CrossRef]
  43. Morgado, M.F.; Cervantes, A.T.; Sánchez, A.G.; Lebrero, R.; Muñoz, R. Integral (VOCs, CO2, mercaptans and H2S) photosynthetic biogas upgrading using innovative biogas and digestate supply strategies. Chem. Eng. J. 2018, 354, 363–369. [Google Scholar] [CrossRef]
  44. Zeng, Y.; Luo, Y.; Huan, C.; Shuai, Y.; Liu, Y.; Xu, L.; Ji, G.; Yan, Z. Anoxic biodesulfurization using biogas digestion slurry in biotrickling filters. J. Clean. Prod. 2019, 224, 88–99. [Google Scholar] [CrossRef]
  45. Vikrant, K.; Kailasa, S.K.; Tsang, D.C.; Lee, S.S.; Kumar, P.; Giri, B.S.; Singh, R.S.; Kim, K.H. Biofiltration of hydrogen sulfide: Trends and challenges. J. Clean. Prod. 2018, 187, 131–147. [Google Scholar] [CrossRef]
  46. Vaiskunaite, R. Cleaning of H2S from polluted air using peat biofilter. In Environmental Protection Technology and Management VGTU; VGTU: Lietuvos, Lithuania, 2022; Volume 12, pp. 1–5. [Google Scholar]
  47. Vaiskunaite, R. Using Biofilter Packed with Different Wood Waste Charges for Purification of Air Contaminated with Benzene. In Environmental Protection Technology and Management VGTU; VGTU: Vilnius, Lithuania, 2020; Volume 11. [Google Scholar]
  48. Shi, M.; Xiong, W.; Zhang, X.; Ji, J.; Hu, X.; Tu, Z.; Wu, Y. Highly efficient and selective H2S capture by task-specific deep eutectic solvents through chemical dual-site absorption. Sep. Purif. Technol. 2022, 283, 120167. [Google Scholar] [CrossRef]
  49. Pepper, I.L.; Brusseau, M.L. Chapter 2—Physical-Chemical Characteristics of Soils and the Subsurface. In Environmental and Pollution Science, 3rd ed.; Elsevier: Amsterdam, The Netherlands, 2019; pp. 9–22. [Google Scholar]
  50. Poser, M.; Silva, L.R.D.E.; Peu, P.; Couvert, A.; Dumont, É. Cellular concrete waste: An efficient new way for H2S removal. Sep. Purif. Technol. 2023, 309, 123014. [Google Scholar] [CrossRef]
  51. Petrauskaite, E.; Vaiskunaite, R.; Blumberga, D.; Ivanovs, K. Experimental study of droplet biofilter packed with green sphagnum to clean air from volatile organic compounds. Energy Procedia 2017, 128, 373–378. [Google Scholar] [CrossRef]
  52. Mamet, S.D.; Jimmo, A.; Conway, A.; Teymurazyan, A.; Talebitaher, A.; Papandreou, Z.; Chang, Y.F.; Shannon, W.; Peak, D.; Siciliano, S.D. Soil Buffering Capacity Can Be Used To Optimize Biostimulation of Psychrotrophic Hydrocarbon Remediation. Environ. Sci. Technol. 2021, 14, 9864–9875. [Google Scholar] [CrossRef] [PubMed]
  53. Zagorskis, A.; Vaiskunaite, R. Modelling of a biofiltration process of volatile organic compound mixtures in a biofilter. Agric. Environ. Biotechnol. 2016, 306, 1217–1222. [Google Scholar]
  54. Khanongnuch, R. Hydrogen sulfide removal from synthetic biogas using anoxic biofilm reactors. Mater. Sci. Environ. Eng. 2019, 6, 479–498. [Google Scholar]
  55. Khanongnuch, R.; Di Capua, F.; Lakaniemi, A.M.; Rene, E.R.; Lens, P.N. Transient–state operation of an anoxic biotrickling filter for H2S removal. J. Hazard. Mater. 2019, 377, 42–51. [Google Scholar] [CrossRef]
  56. Irani, V.; Tavasoli, A.; Vahidi, M. Preparation of amine functionalized reduced graphene oxide/methyl diethanolamine nanofluid and its application for improving the CO2 and H2S absorption. J. Colloid Interface Sci. 2018, 28, 57–67. [Google Scholar] [CrossRef]
  57. Hasanzadeh, V.; Alipour, V.; Goodarzi, B.; Rahmanian, O.; Dindarloo, K.; Khosravi, R.; Heidari, M. Experimental and kinetic analysis of H2S removal in a Polyurethane foam/ Palm fiber-based Biofilter with no pH control. Iran. J. Sci. Technol. Trans. Civ. Eng. 2018, 43, 781–789. [Google Scholar] [CrossRef]
Figure 1. Laboratory-scale biofilter structure and main components.
Processes 13 00329 g001
Figure 2. Comparison of single-material biofilters’ H2S RE from biogas.
Processes 13 00329 g002
Figure 3. A prototype schematic of the laboratory-scale biofilter drawn in COMSOL 6.1.
Processes 13 00329 g003
Figure 4. Simulation of H2S concentration (mol/m3) during the first 6 days after insertion into the laboratory-scale biofilter packed with biochar.
Processes 13 00329 g004
Figure 5. Simulation of H2S concentration (mol/m3) during the first 6 days after insertion into the laboratory-scale biofilter packed with CLC waste.
Processes 13 00329 g005
Figure 6. Simulation of H2S concentration (mol/m3) during the first 6 days after insertion into the laboratory-scale biofilter packed with PUF.
Processes 13 00329 g006
Figure 7. Simulation of biogas velocity (×m/s) during the first 6 days after insertion into the laboratory-scale biofilters.
Processes 13 00329 g007
Figure 8. Simulation of biogas concentration (mol/m3) during the first 6 days after insertion into the laboratory-scale biofilters.
Processes 13 00329 g008
Table 1. Biogas composition in this research.
ComponentCH4CO2H2SH2ON2O2NH3VOCs
Range (% by volume)60.10%40.50%0.006–0.01% (60–100 ppm)~1.50–5.20%0–0.90%0–0.50%Trace (<0.10%)Trace
Table 2. H2S concentrations measured after injecting the biogas to a single-material-packed biofilter.
Packing MaterialInitial H2S Concentration in BalloonBottom Stage (After 3 Days)1st Stage2nd Stage3rd Stage4th Stage5th Stage
Biochar90902010101080
CLC waste100301010101020
PUF60501010101050
Packing MaterialInitial H2S Concentration in BalloonBottom Stage (After 6 Days)1st Stage2nd Stage3rd Stage4th Stage5th Stage
Biochar90201010000
CLC waste10010101001010
PUF6020101004020
Disclaimer/Publisher’s Note: The statements, opinions and data contained in all publications are solely those of the individual author(s) and contributor(s) and not of MDPI and/or the editor(s). MDPI and/or the editor(s) disclaim responsibility for any injury to people or property resulting from any ideas, methods, instructions or products referred to in the content.

