Abstract
A hydropower station, which has been in operation for over 50 years, has a penstock located in the plant’s open pipe section. Recently, concerns have been raised regarding the potential risks to the penstock’s safe operation due to wall thinning caused by abrasion. A series of stress tests, strength mathematical model analysis, and sediment erosion tests were performed on the penstock during turbine load rejection events. A stress and strain monitoring system for the steel pressure pipe was developed, enabling real-time monitoring and providing a warning function. The current wall thickness of the steel pressure pipe is about 28 mm. The results indicate that a pipe rupture is unlikely under any load rejection scenario. However, if the wall thickness is reduced to around 24 mm, the maximum equivalent stress of the pipe will approach the safety limit during load rejection. The sediment erosion test showed an erosion rate of 3.509 × 10⁻⁵ mm/h at an average sediment concentration of 0.63 kg/m3. Assuming no other factors, such as an increase in river sediment concentration, and based on the design specifications of the steel pressure pipe and the annual average sediment concentration of 0.63 kg/m3, it is projected that the open pipe section can be operated for about 19 years before the wall thickness reaches 24 mm. It is recommended that once the wall thickness reaches 24 mm due to erosion or other factors, the pipeline system undergoes maintenance or replacement. The findings provide significant guidance for the operation of similar power stations.
1. Introduction
The penstock in a hydropower station serves as a water conduit that carries water from a reservoir, pressure forebay, or surge chamber to the turbine. In regions with rivers that have high sediment levels, the sediment flow in the steel pressure pipe leads to gradual erosion. This becomes particularly problematic when the pressure pipe wall of the power station has thinned over years of abrasion. In cases where water hammer occurs, the pressure pipe could rupture, causing damage to the unit and potentially resulting in significant destruction or disaster at the power station [1,2]. Consequently, understanding the dynamics of water flow in hydropower pipelines is crucial to maintaining the operational safety of hydropower systems, especially for long or aging pipelines affected by erosion and corrosion. Yu et al. [3] highlighted the importance of continuous load shedding for determining the maximum pressure in the volute and the maximum speed of the runner when the bifurcated pipe from the diversion hydropower station connects to the surge chamber. Under transient conditions, a large pressure difference develops across the pipe wall, and this difference becomes even greater when load rejection follows load acceptance. Bergant et al. [4] presented key findings from dynamic flow tests that simulated the behavior of air valves during events such as start-up, pump failure, and pipeline rupture. Huang Bo et al. [5] introduced an online testing method for analyzing the vibration deformation of steel pressure pipes under a water hammer using microwave sensing vibration measurement technology. Through the comparative analysis of test data, it has been confirmed that the microwave sensing vibration measurement technique is both feasible and efficient for the online monitoring and analysis of steel pressure pipe vibrations. Shi et al. [6] introduced a surface displacement measurement method using SBAS-Insar remote sensing technology, achieving millimeter-level precision in monitoring pipeline surface displacement over long distances. Zhu et al. [7] conducted finite element analysis of cracked pipelines, offering a theoretical basis for evaluating pipeline safety. Liu et al. [8,9] developed a soil-pipeline model and conducted a comprehensive study on how various factors (such as initial defects, impact energy, pipeline wall thickness, burial depth, and soil properties) affect the strain behavior of buried pipelines under impact loading. Bui et al. [10] proposed a new technique for detecting and locating cracks in pipes under high-pressure fluid conditions. Yan et al. [11], using heterogeneous sediment from the lower reaches of the Yellow River, performed sediment transport tests on the steel pressure pipe to study sediment separation behavior. The findings revealed that sediment significantly altered the flow velocity distribution. Wang et al. [12] applied the k-ε turbulence model, ZGB cavitation model, and a sediment erosion prediction model to simulate the solid–liquid two-phase flow and cavitation in the guide vane. In response to the significant pressure fluctuations and severe sediment erosion issues at the Fu Tang hydropower station, Li et al. [13] combined numerical simulations and experiments using the shear stress transfer k-ω turbulence model to modify the runner and improve operational stability. Using the principle of velocity similarity, Yao et al. [14] developed a test system for studying sediment erosion on the movable guide vanes of Francis turbines. Sediment erosion tests were carried out on the movable guide vane surface before and after tungsten carbide spraying, leading to the establishment of an erosion rate prediction model. Based on the erosion test data and numerical simulations of sand–water flow, Pang et al. [15] proposed a formula for calculating the sediment erosion rate of turbine flow components made of 0Cr13Ni5Mo in the Min Jiang River Basin. This formula allows for the estimation of sediment erosion in similar turbine flow components at other power stations in the region. Rohit SK [16,17] and Thapa SB [18] utilized numerical simulations and experiments to examine the erosion of turbine flow components, focusing on sediment characteristics and guide vane materials, and developed an enhanced model for predicting the erosion rate of these components. Liu et al. [19,20] established the k-ε two-equation turbulence model and volume fraction turbulence model for turbulent solid–liquid two-phase flow, which were used to simulate the flow and solid-wall erosion in the flow channel of water turbine machinery. Xiao et al. [21,22] carried out both experiments and numerical simulations on the sediment erosion of turbine blades, considering aspects such as flow and pressure, and conducted an extensive study on blade sediment erosion. Ge et al. [23,24,25] investigated the sediment erosion location and erosion rate of impact turbines, considering sediment particle diameter and concentration. Yang [26,27] and Zhao et al. [28] conducted numerical simulations of sand–water flow and sediment erosion tests at power stations in Xinjiang, respectively. The results from their calculations and experiments were used to derive erosion rate formulas for the specimens. Fang et al. [29,30] applied the k-ε model to simulate sand–water flow in turbines and performed sediment erosion tests on guide vanes, concluding that sediment velocity significantly affects the erosion of the guide vane.
In this study, a stress on-line monitoring system is developed by using finite element technology combined with a stress test. Firstly, the stress test of the steel pressure pipe is carried out to obtain the pressure in the pipe and the stress of the pipe wall. The numerical strength simulation of different pipe wall thicknesses is carried out by using the measured pressure in the pipe. The thickness of the tube wall is obtained when the equivalent stress is close to the material limit. Finally, the sediment wear test of the steel pressure pipe is carried out to obtain the wear rate of the steel pipe, and the life prediction research is carried out in combination with the wall thickness obtained by the numerical strength simulation to obtain the approximate life of the steel pipe.
2. Basic Parameters and Abrasion of Penstock in Hydropower Station
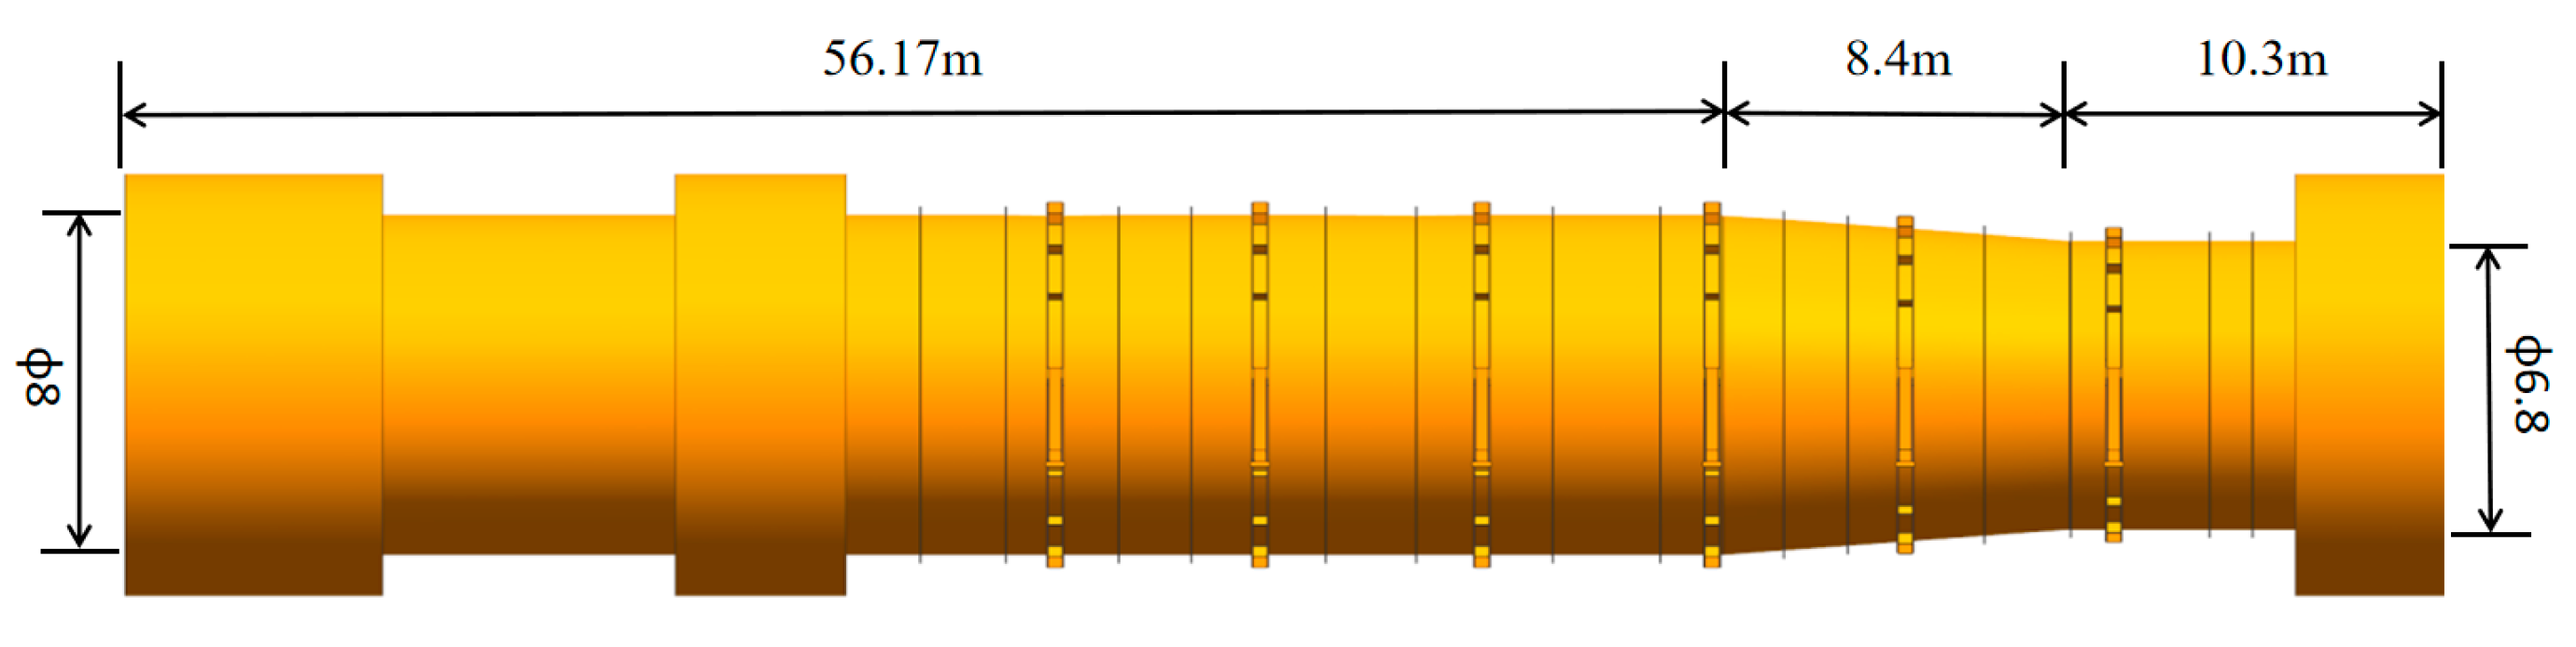
The first unit of the hydropower station was commissioned in 1971, and power generation was completed by 1979. The design head, accounting for both hydrostatic pressure and water hammer pressure during load rejection, was set at 100 m. A total of seven units were installed, with a combined capacity of 700,000 kW and an annual power generation of 3.4 billion kW·h. To address equipment defects, reduce water wastage, and improve the utilization of hydropower, the station completed an expansion and upgrade of all seven units in 2012, increasing the capacity of each unit from 100,000 kW to 110,000 kW. The ground plant includes four mixed-flow hydro-generator units, each with a capacity of 110,000 kW, fed by a single φ8 m steel pressure pipe. The four penstock inlets are located at the center of the 11#–14# dam section, each with identical shapes and a bottom elevation of 494 m. The penstocks are of the dam type, and the total length of the diversion channel, from the fast door to the volute inlet, is 112.41 m. This includes a 105.43 m steel pipe section with a φ8 m diameter. The open pipe section of the pressure pipeline is 56.17 m long, with a φ8 m diameter section spanning 37.47 m, a φ6.8 m section of 10.3 m, and an 8.4 m variable diameter section. Two expansion joints, one of φ8 m and the other of φ6.8 m, are installed behind the low dam and between the upstream wall of the main powerhouse. Additionally, a town pier and six pairs of buttresses are placed along the open pipe. The penstock is a crucial part of the water conveyance system in hydropower projects, subject to high internal water pressure, and plays a significant role in ensuring the safe operation of the power station. The station has been operating for over 50 years, since the commissioning of the first unit in 1971. With the increasing operational years and an average river sediment concentration of 0.63 kg/m3, sediment erosion has become a concern. In recent years, the sediment concentration in the river water has been rising, leading to a marked reduction in the wall thickness of the open section of the penstock. While the steel tube was originally designed with a thickness of 34 mm, testing has revealed that the current wall thickness has decreased to around 28 mm.
3. Stress Test of Load Rejection Penstock
3.1. Steel Pressure Pipe Stress Test System
Preliminary numerical calculations and theoretical analysis indicated that significant deformation and stress in the steel pressure pipe would occur at locations on the steel plate without the support ring and stiffener. Therefore, the strain gauge was placed at these weak points where the support ring and stiffener were absent. In addition, a stress and strain monitoring system was developed. The system is composed of four components: strain gauge, collector, controller, and server. As shown in Figure 1, the monitoring system enables real-time monitoring and includes a warning function. This system will also be used to perform deformation and stress tests on the steel pressure pipe in this study.
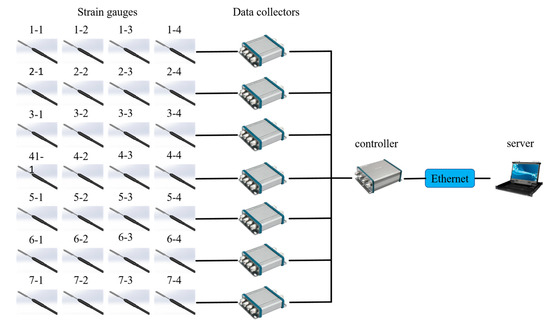
Figure 1.
Monitoring system diagram.
3.2. Stress Test of Steel Pressure Pipe
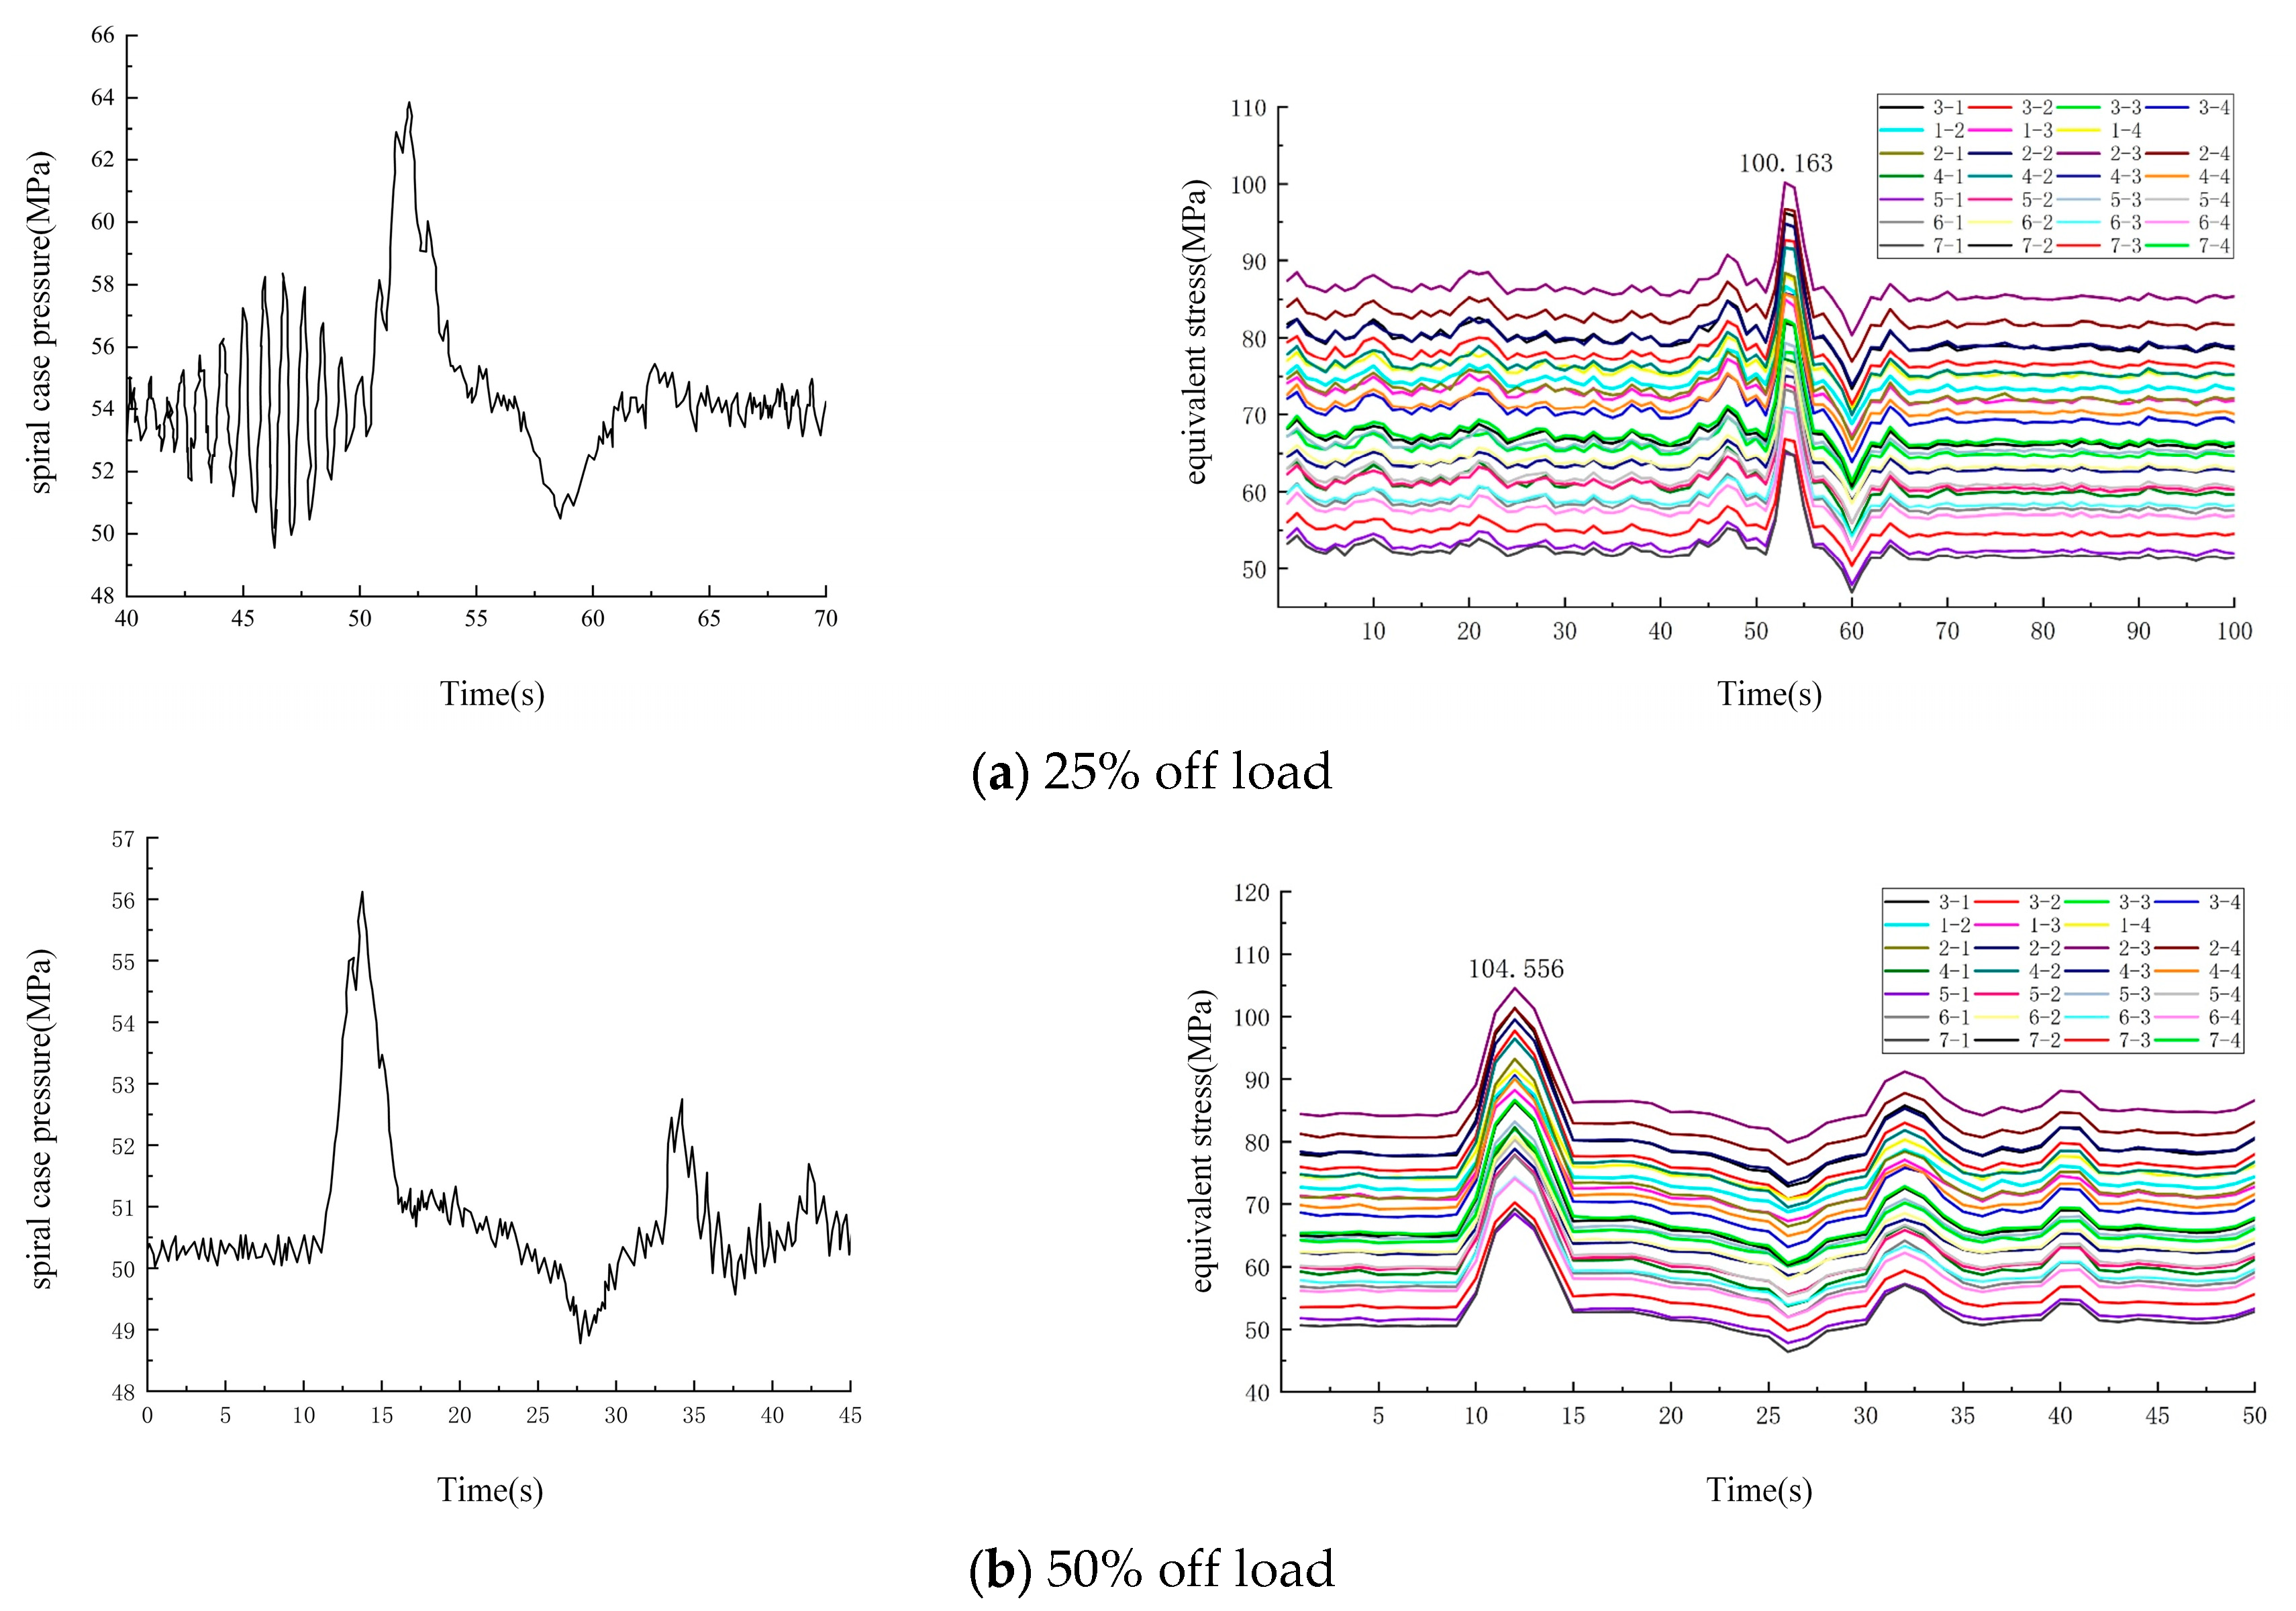
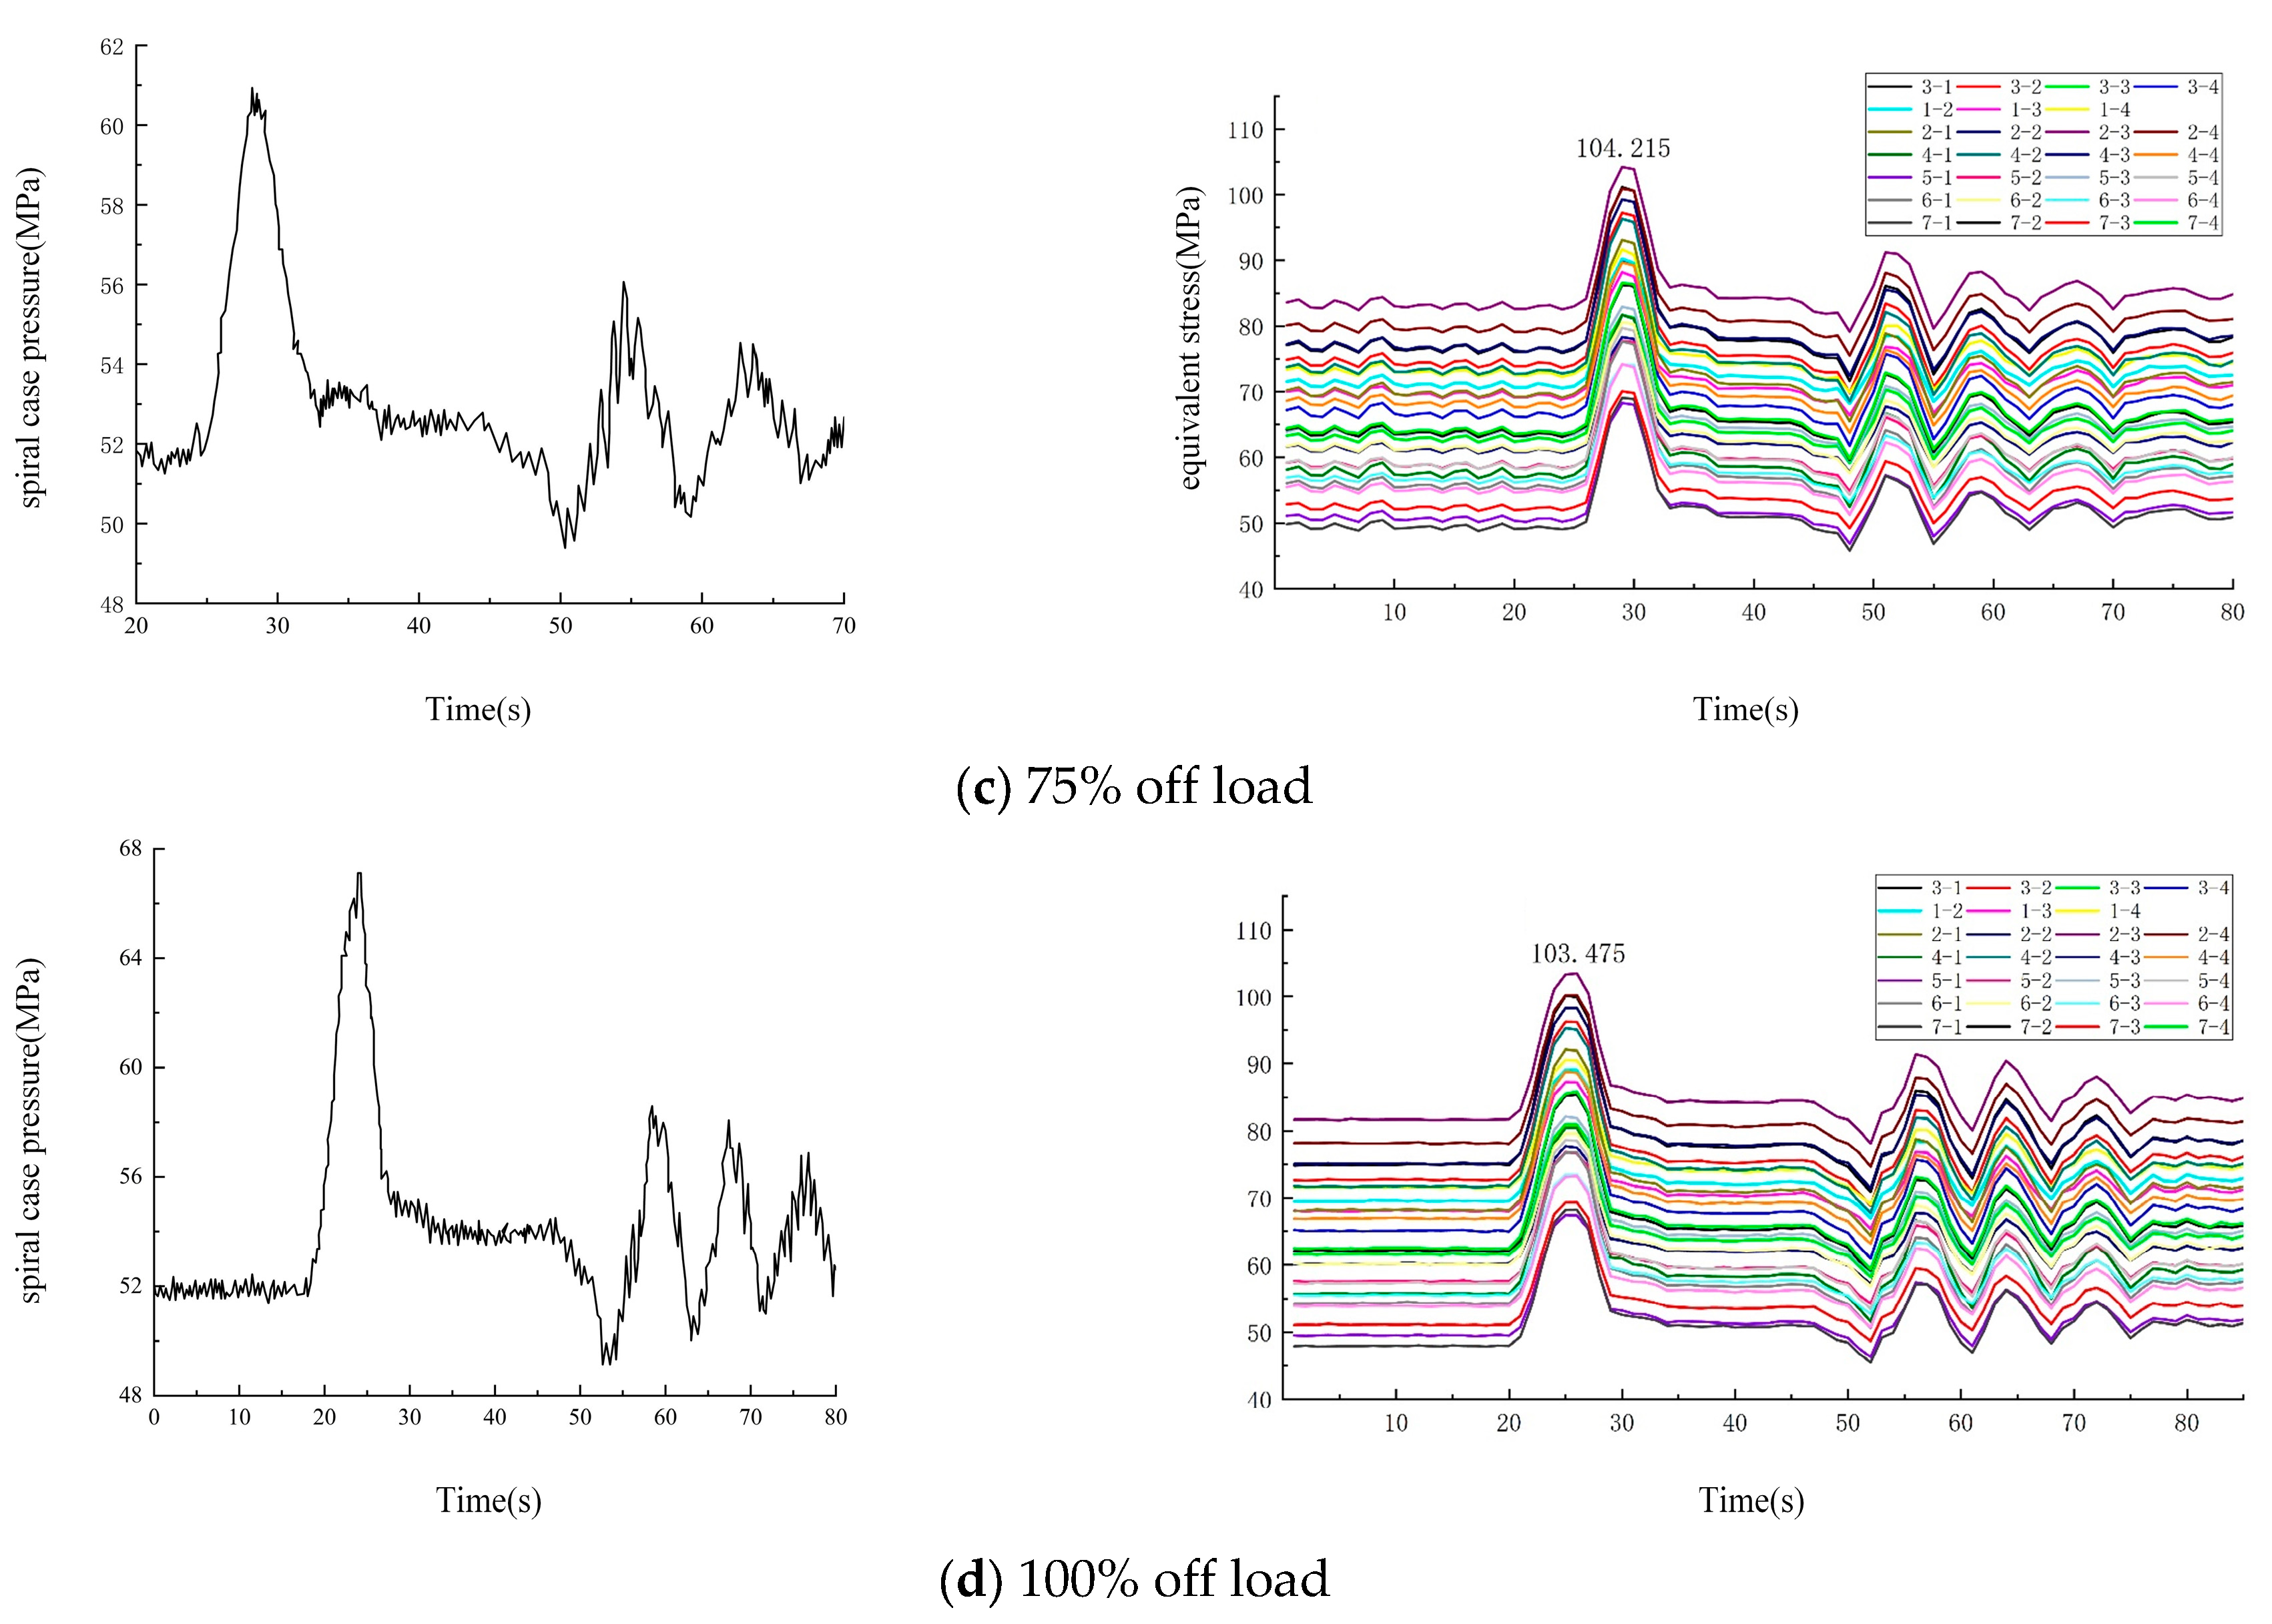
A pressure sensor was positioned at the volute inlet to monitor the pressure. Load tests were conducted at 25%, 50%, 75%, and 100% levels, respectively. The results for the volute pressure and steel tube stress are shown in Figure 2.
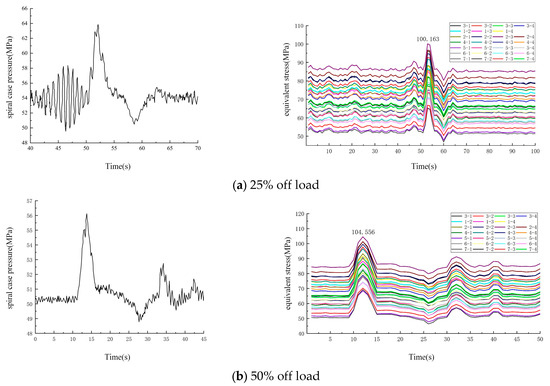
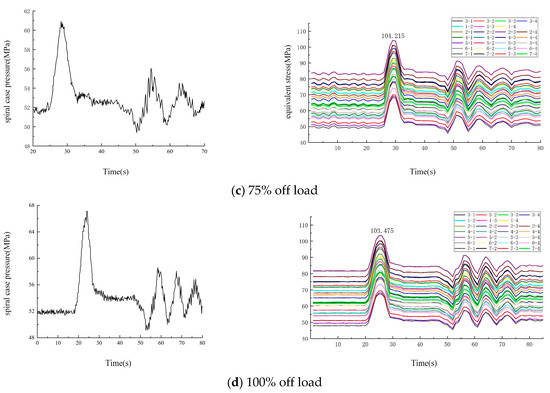
Figure 2.
Test results of volute pressure and steel pipe stress under load rejection.
According to the results of four load rejection tests, the pressure and stress changes over time exhibit a consistent pattern, with the peak values occurring at the same time. The maximum values for both the volute pressure and pipeline stress are observed for load rejections exceeding 50%. When the load rejection ranges from 50% to 100%, the peak stress in the steel pipe remains relatively constant.
4. Strength Mathematical Model Analysis of Load Rejection Penstock
4.1. Mathematical Model
In recent years, with the rapid advancement of computer technology, the finite element method has become a widely adopted numerical analysis tool in modern engineering.
{NF}e = [K]e{δ}e − [F]e
In this equation, {NF}e represents the nodal force vector, {δ}e is the displacement vector of the element nodes, [K]e is the element stiffness matrix, and [F]e is the element load vector.
4.2. Three-Dimensional Structure Modeling and Digital Model Meshing of Steel Pressure Pipe
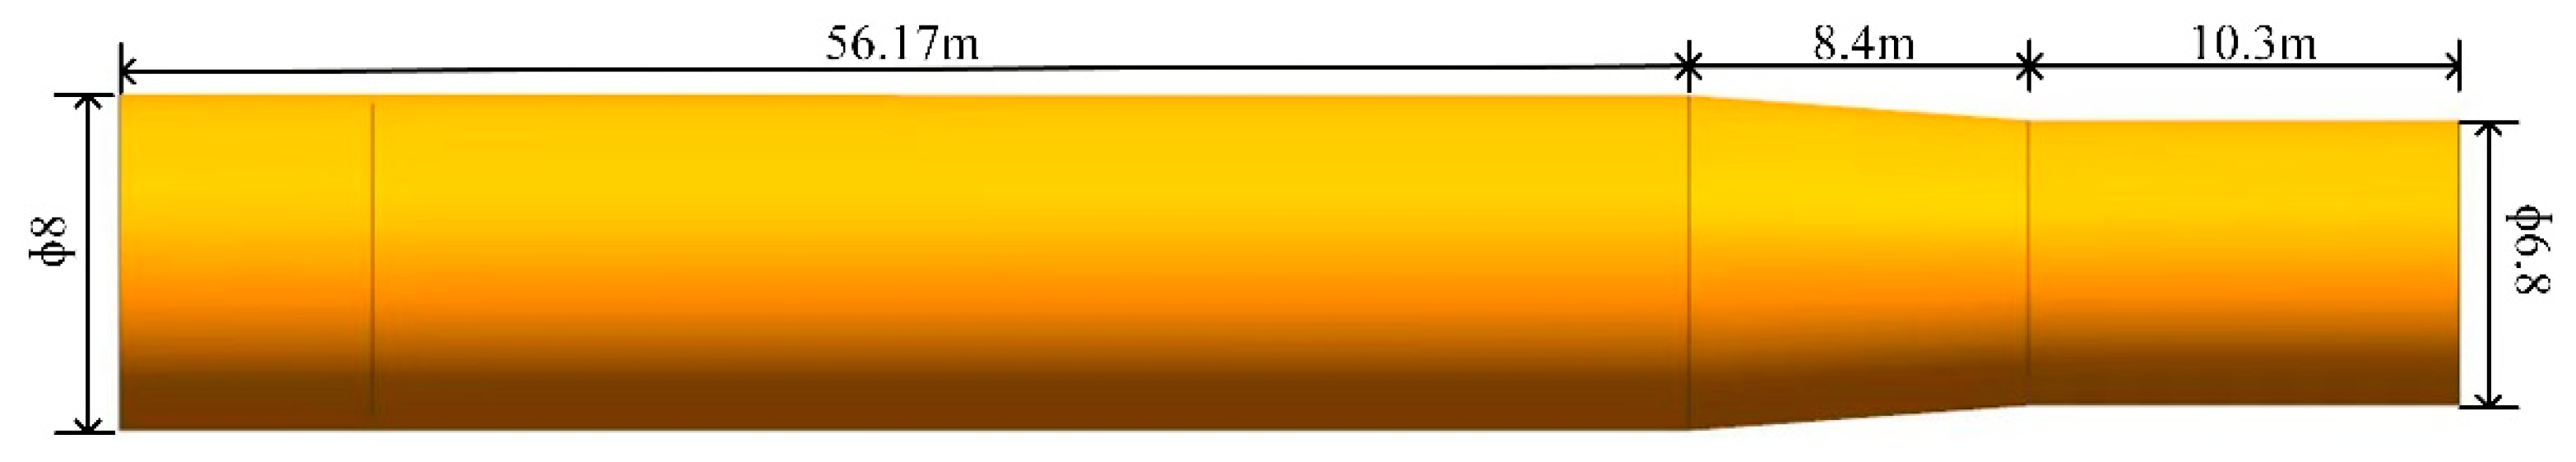
Based on the data and test results provided by the hydropower station, the total length of the open section of the pressure pipeline is 56.17 m. The φ8 m diameter section extends over 37.47 m, the φ6.8 m section spans 10.3 m, and the variable diameter section measures 8.4 m. The wall thickness is about 28 mm. The constructed model is shown in Figure 3, and the material properties of both the steel pipe and the pier are listed in Table 1.
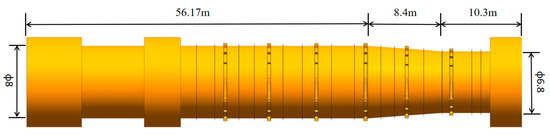
Figure 3.
Schematic diagram of steel pressure pipe structure.

Table 1.
Performance parameters of materials.
From the load rejection test, it was found that the internal pressure of the volute is about 0.62 MPa under maximum limit conditions. Given that the steel pressure pipe is elevated by 8 m, the constraints and force settings are determined as follows:
During load rejection, the internal pressure at the steel pipe outlet is 0.7 MPa, while the pressure in the φ8 m diameter section is 0.718 MPa, and the pressure in the variable diameter section is 0.704 MPa. Additionally, the static pressure load of the water fluid due to gravity, along with the gravitational load of the steel pipe, is applied. The constraints for the steel pipe are placed at both ends of the steel pressure pipe, the dam body, the pier, the rolling bearing, and six sets of piers as fixed points. Friction constraints are applied to the contact surfaces between the expansion joint, pier, and steel pipe.
The steel pressure pipe model is meshed with both overall and local grid size controls. Considering the varying sizes of the components and the accuracy requirements, the grid size for the town pier is set to 2 m. For smaller components, such as steel plates, support rings, and stiffeners, the local grid size is set to 0.4 m, with automatic grid control applied. A total of 102,446 elements and 201,538 nodes were generated.
4.3. Strength Mathematical Model Analysis of Penstock
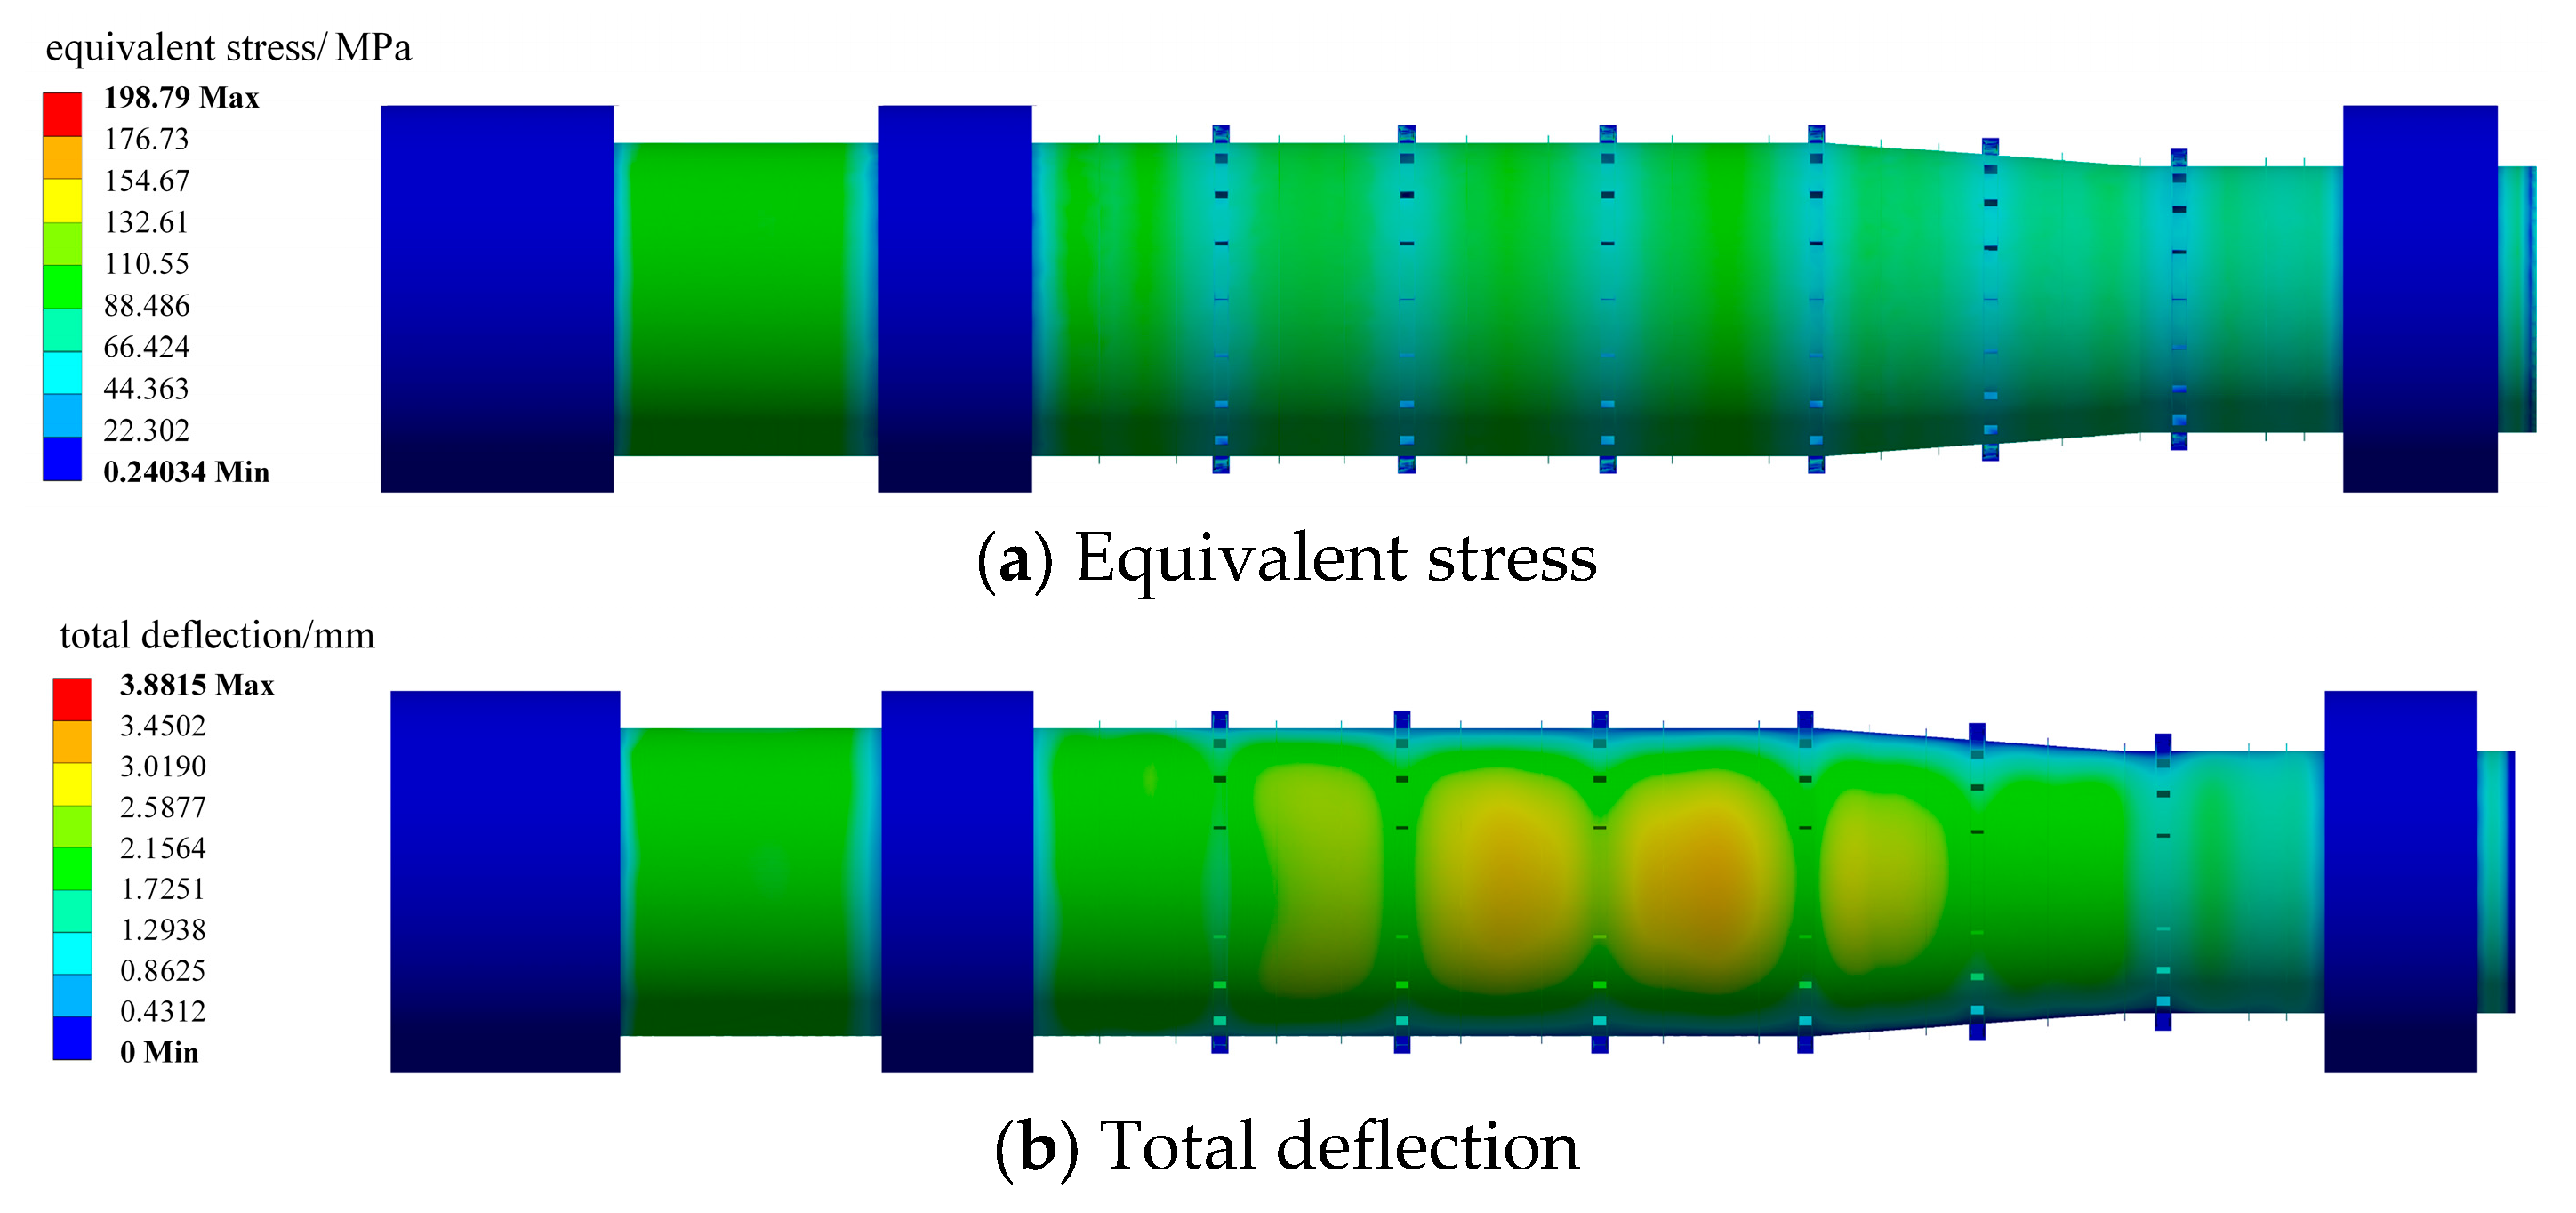
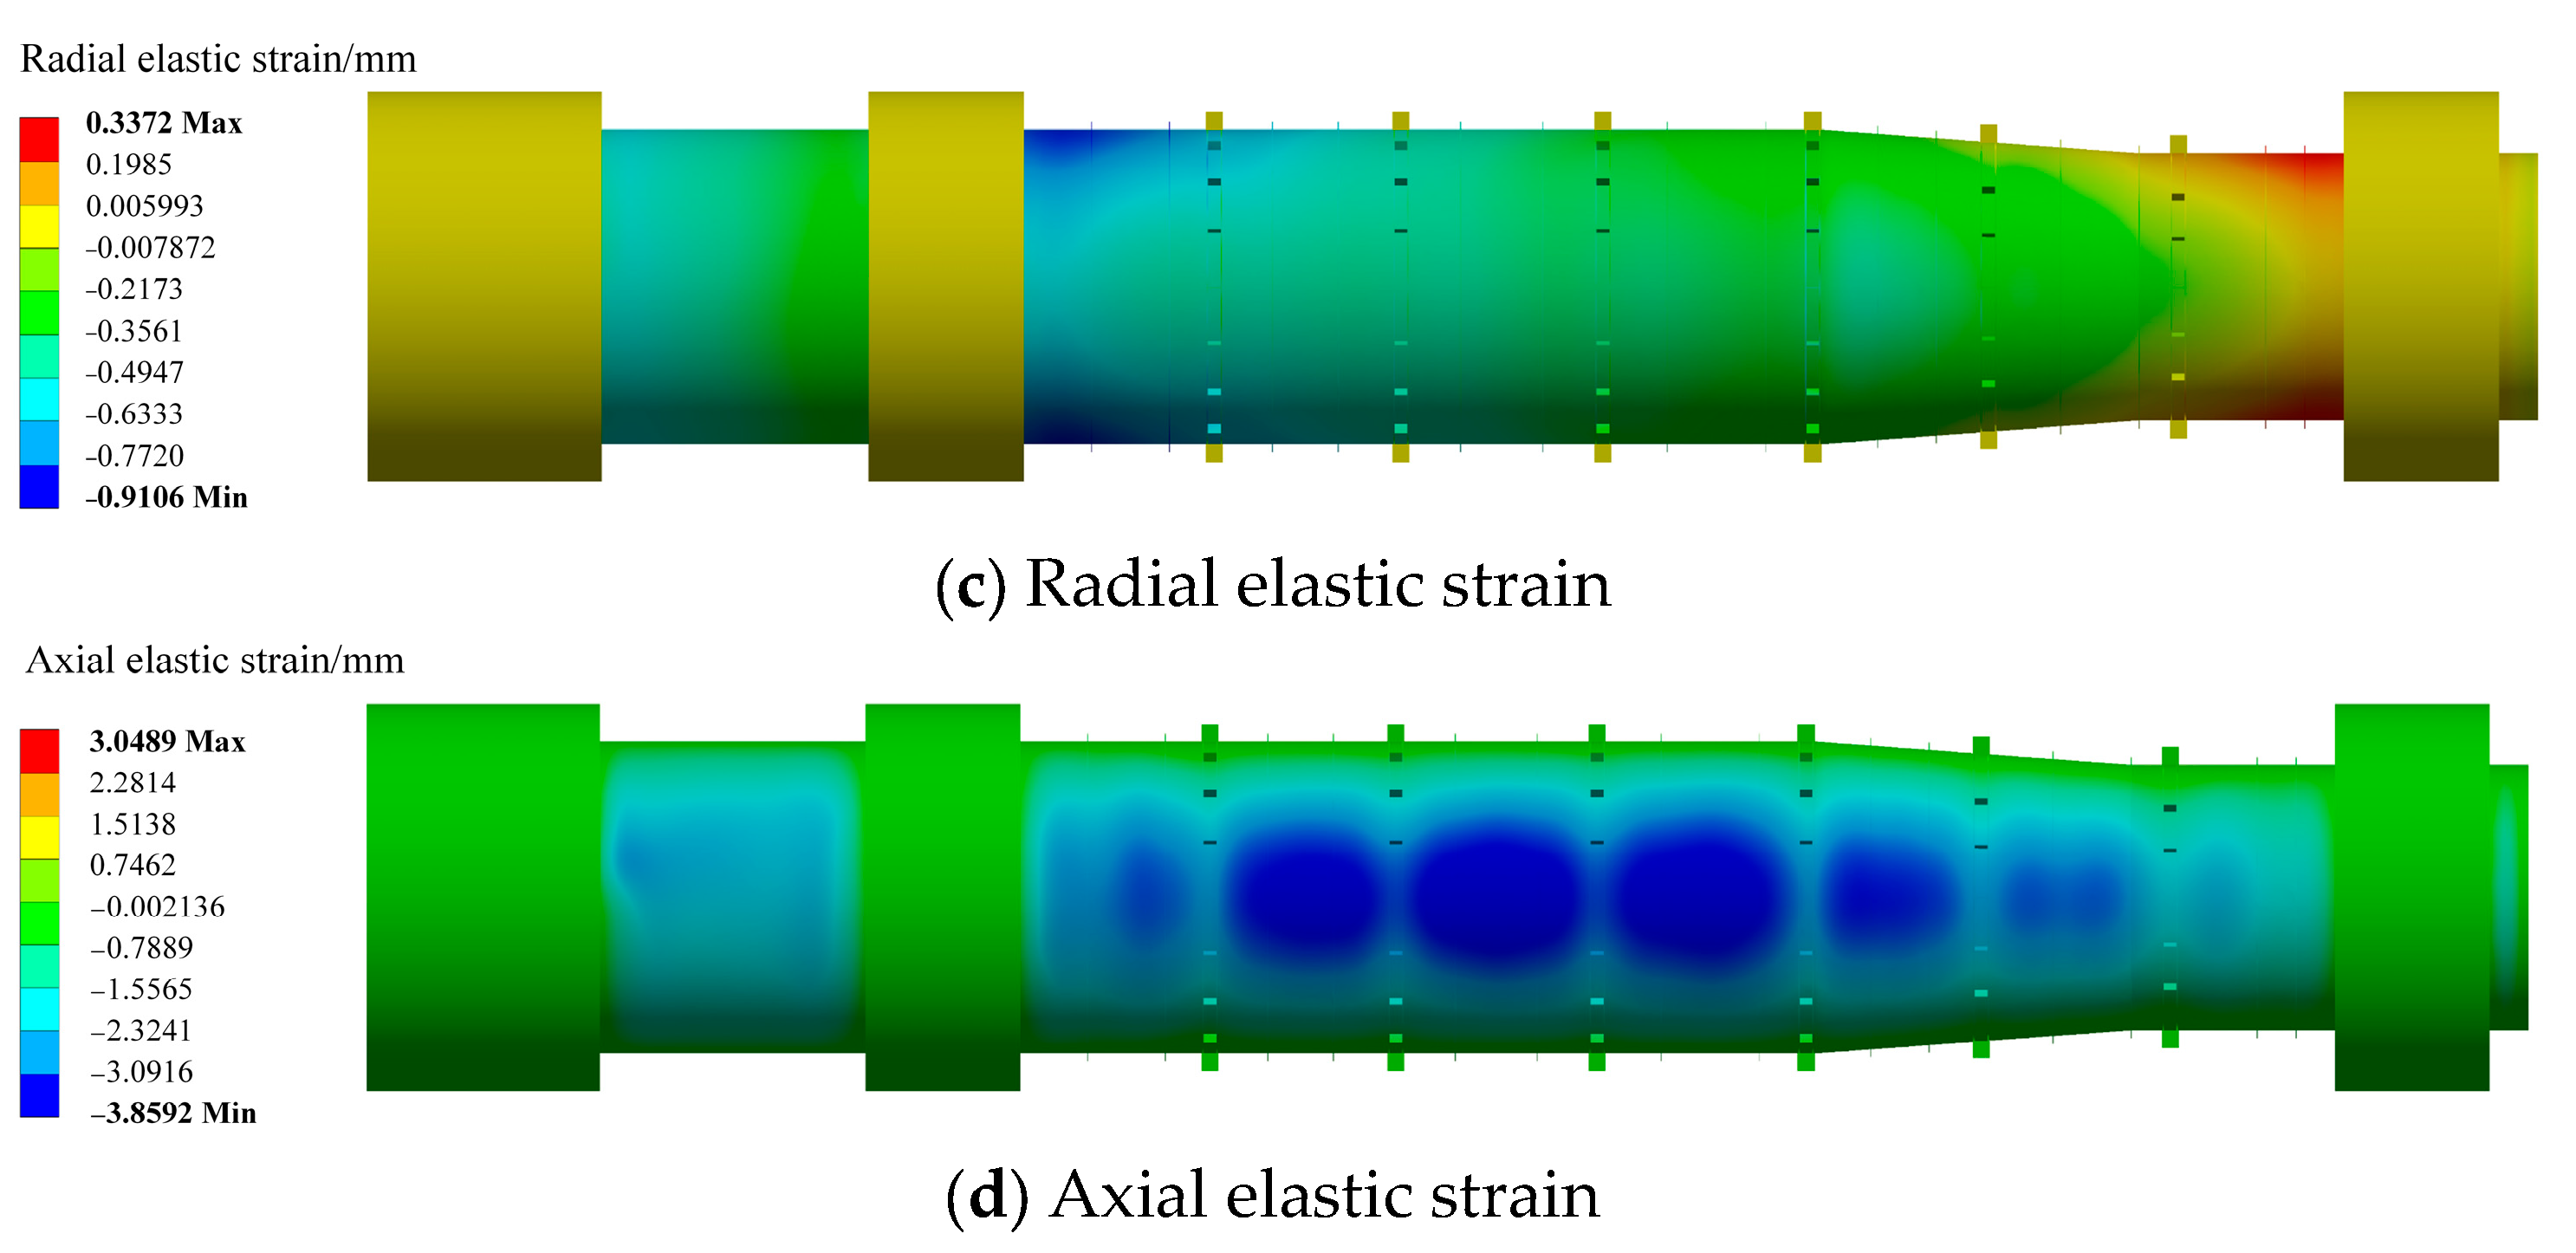
The numerical simulation results are displayed in Figure 4, which illustrates the data cloud diagrams for the equivalent stress, deformation, radial (R) direction strain, and axial (Z) direction strain of the steel pipe during load rejection.
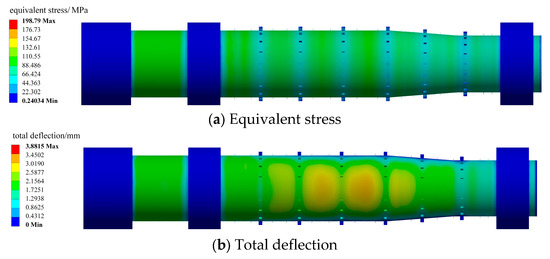

Figure 4.
Cloud image of numerical and modular results of stiffness under load rejection.
The numerical simulation results indicate that the highest equivalent stress in the steel pipe under load rejection occurs on the steel plate, which lacks a support ring and reinforcing rib between the dam body and the pier. This stress reaches 98.16 MPa, which is close to the 104.5 MPa observed in the test results, confirming the accuracy of both the test and simulation.
Based on the material of the steel pipe and accounting for the weld coefficient, the allowable stress is [α] = 1700 kg/cm2 = 166.6 MPa. With a safety factor of 1.2 to 1.4, it is apparent that the maximum equivalent stress should trigger a warning when it reaches around 120 MPa, with an alarm set at about 140 MPa. Both the test and simulation results confirm that the steel pipe will not fail or rupture under any load rejection scenarios. Furthermore, simulations show that if the steel pipe wall thickness is reduced to about 24 mm, the maximum equivalent stress during load rejection will approach 120 MPa. The results for each monitoring point are shown in Table 2, with the monitoring point positioned on the steel plate between two sets of stiffeners.
Table 2.
Numerical and modulus results of steel pipe strength under load rejection.
According to the numerical simulation results in Table 2, the maximum equivalent stress of the steel pipe is 98.16 MPa when the wall thickness is 28 mm, and it increases to 115.22 MPa when the wall thickness is reduced to 24 mm. The maximum deformation of the steel pipe is 3.88 mm at a wall thickness of 28 mm, and it increases to 4.41 mm when the wall thickness is 24 mm. In the 8 m diameter section, the overall stress of the steel pipe is about 100 MPa with a wall thickness of 28 mm and about 120 MPa when the wall thickness is 24 mm. The results from the stress test and strength simulation indicate that the steel pressure pipe becomes more critical when its thickness is reduced to 24 mm, highlighting the need for enhanced maintenance or pipeline replacement. Building on this, a sediment erosion test was conducted to calculate the erosion rate of the pipe and assess the operational life of the steel pressure pipe.
5. Abrasion Test of Steel Pressure Pipe with Sediment
5.1. Numerical Simulation of Sand–Water Flow
Before performing the sediment erosion test, a numerical simulation of the sand–water flow within the steel pressure pipe was conducted. This simulation primarily provides data on the flow characteristics and local concentration distribution, which is essential for establishing the mathematical model for sediment erosion in the steel pressure pipe.
5.1.1. Mathematical Model
In this study, the flow inside the steel pressure pipe is assumed to be turbulent. Consequently, the solid–liquid two-phase standard k-ε turbulence model [31] is applied for the sand–water flow calculations. It is assumed that the sand–water mixture behaves as an incompressible fluid, with sand particles being spherical and uniform in size, and that no phase transition occurs between the fluid and sediment particle phases. The equations for turbulent kinetic energy (k) and the turbulent energy dissipation rate (ε) in the standard k-ε model for solid–liquid two-phase turbulence are as follows:
In the formula, t denotes time, x represents the coordinate, ϕ is the volume fraction, V is the velocity, ν is the viscosity coefficient of the water flow, νt is the eddy viscosity coefficient of the water flow, Gk is the turbulent kinetic energy generated by the gradient of the average velocity, and GB is the turbulent kinetic energy generated by buoyancy. Ym represents the contribution to the dissipation rate due to the diffusion of transition. The coefficients are C1ε ≈ 1.44, C2ε ≈ 1.92, C3ε ≈ 1.2, σk ≈ 1.0, and σε ≈ 1.3. The subscript f refers to the water flow, while j corresponds to the tension coordinate.
5.1.2. Calculation Model and Grid Division
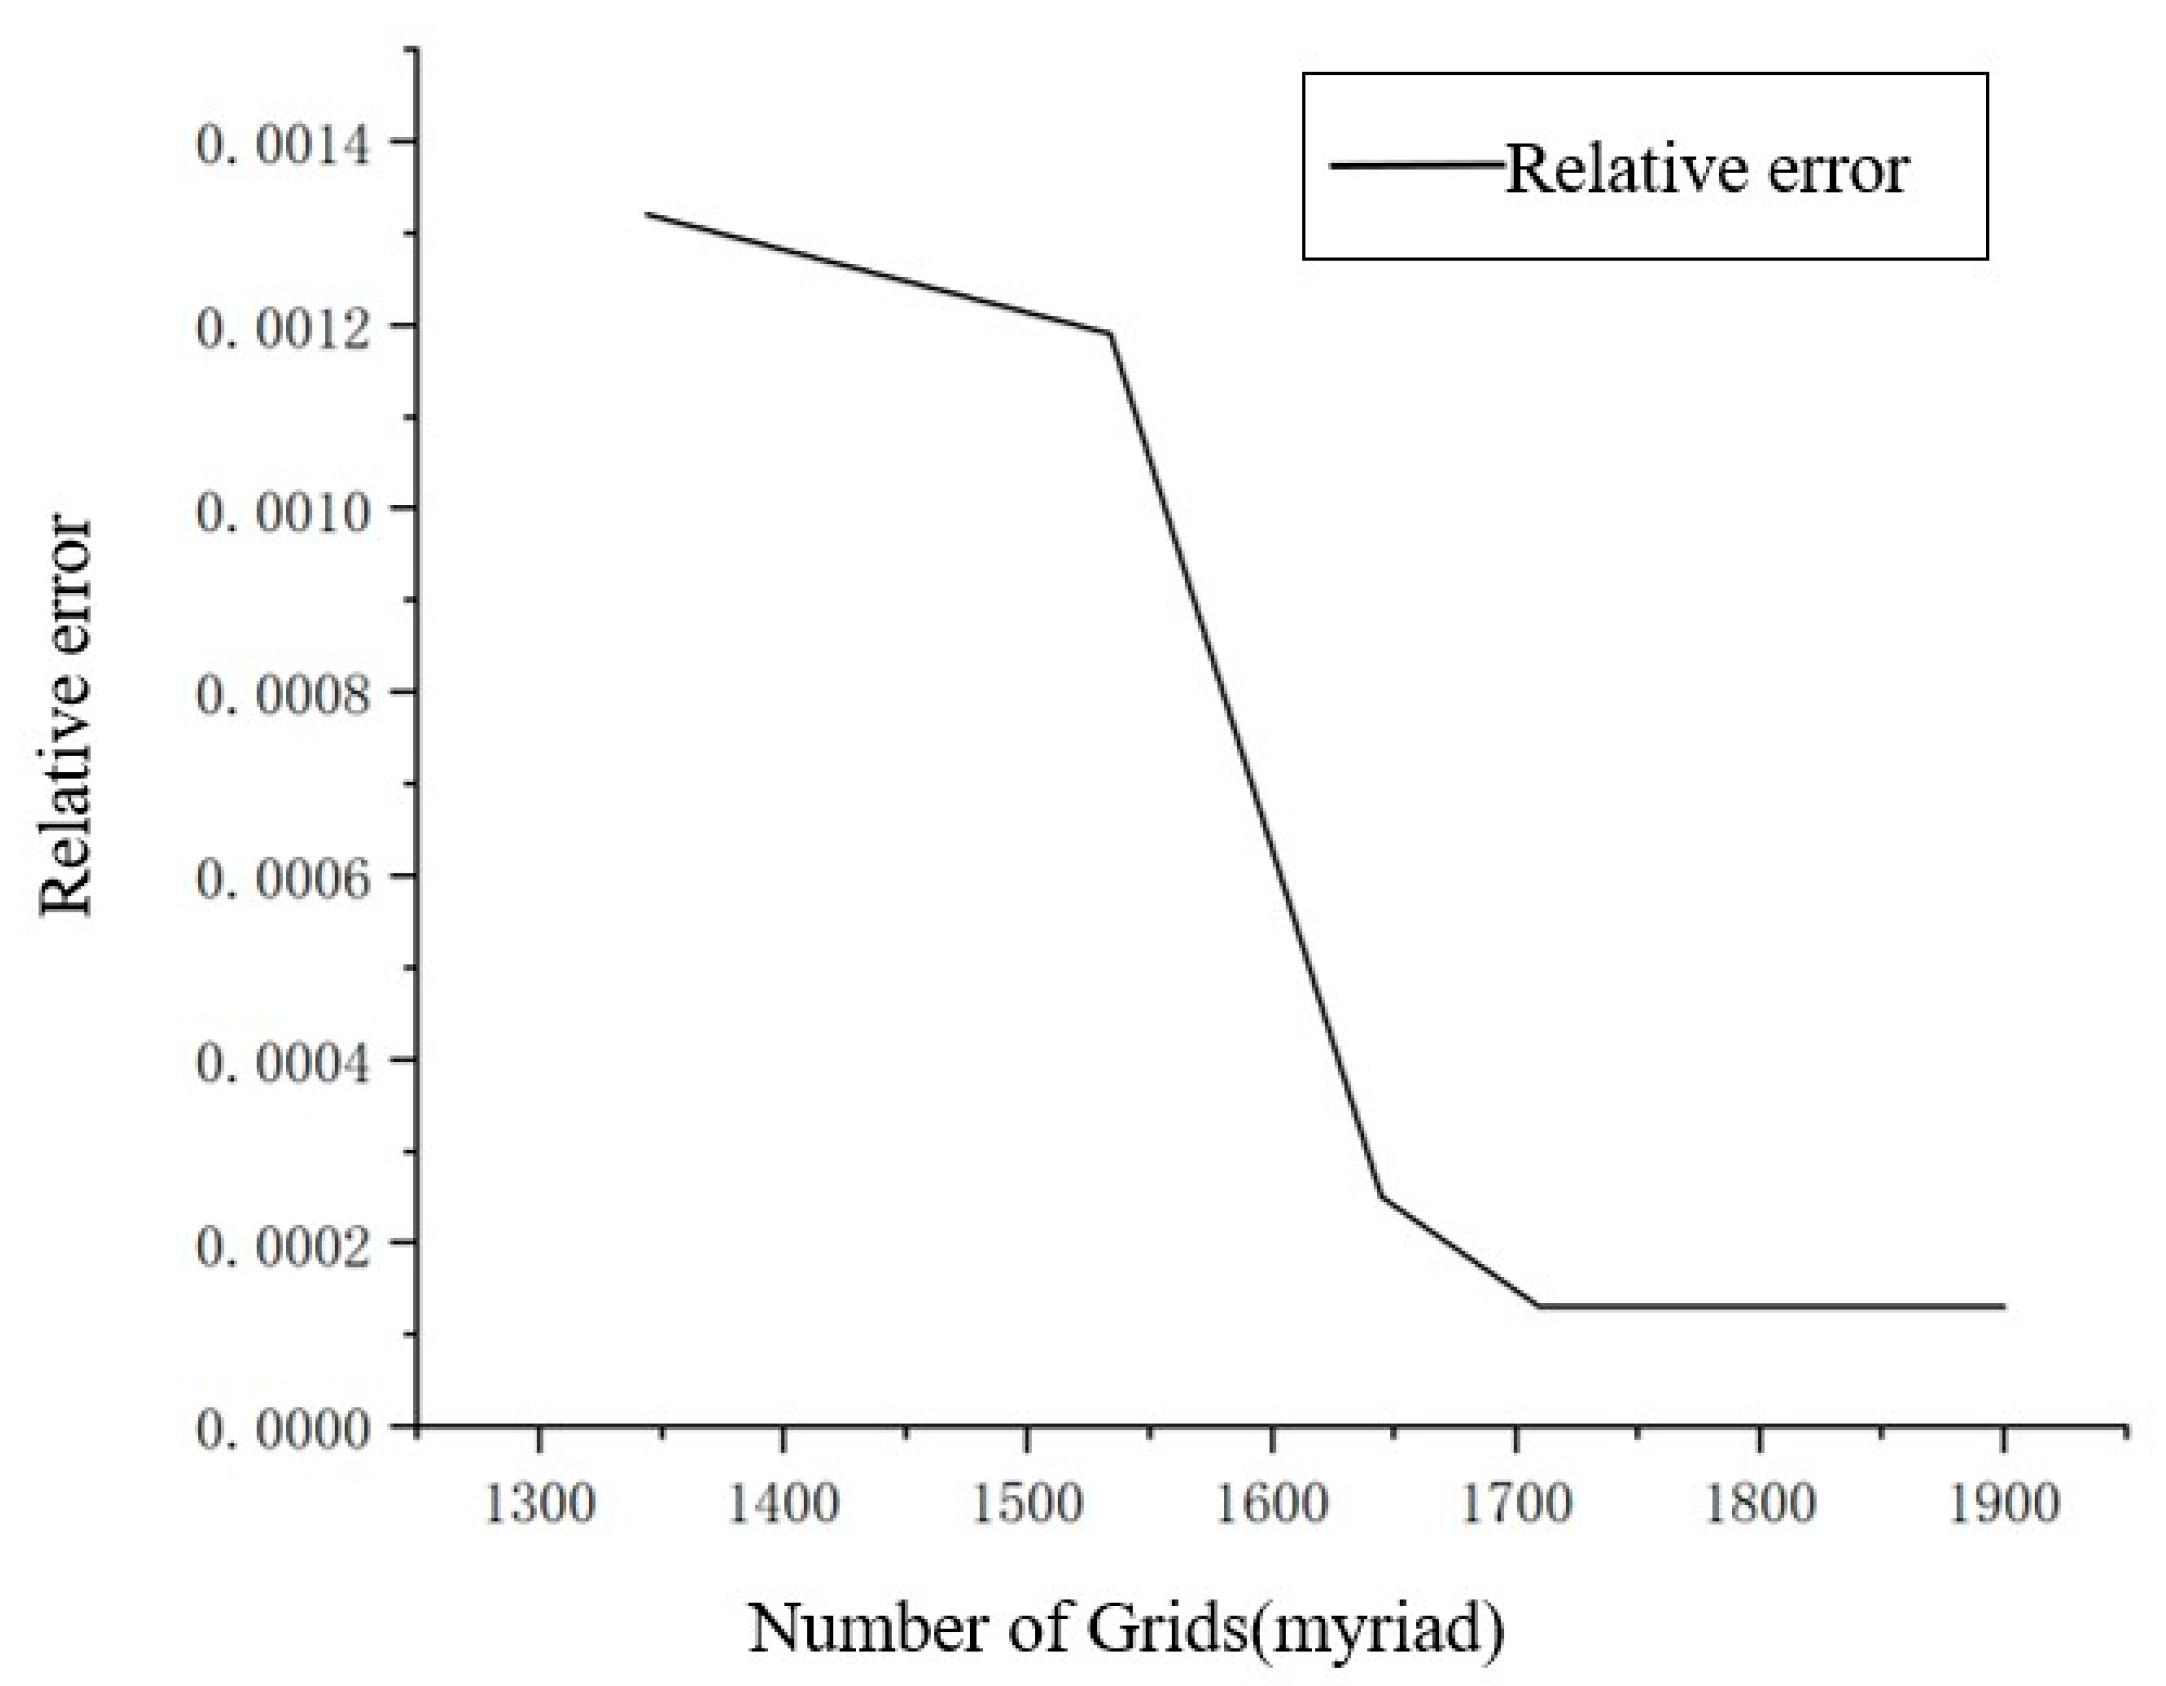
Based on the data from the hydropower station, the total length of the open pipe section in the pressure pipeline is 56.17 m. The φ8 m diameter section spans 37.47 m, the φ6.8 m diameter section measures 10.3 m, and the variable diameter section is 8.4 m. A three-dimensional model of the steel pressure pipe was created using UG software 12.0, as illustrated in Figure 5. The meshing parameters are outlined in Table 3. A mesh independence analysis was conducted, with the error remaining below 0.05% and the mesh quality exceeding 0.7. Grid independence verification is shown in Figure 6. The results from the calculation meet the required accuracy criteria.
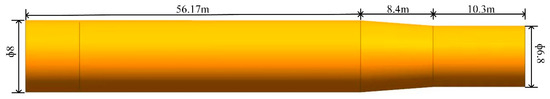
Figure 5.
Three-dimensional model of steel pressure pipe.
Table 3.
Grid parameter table.
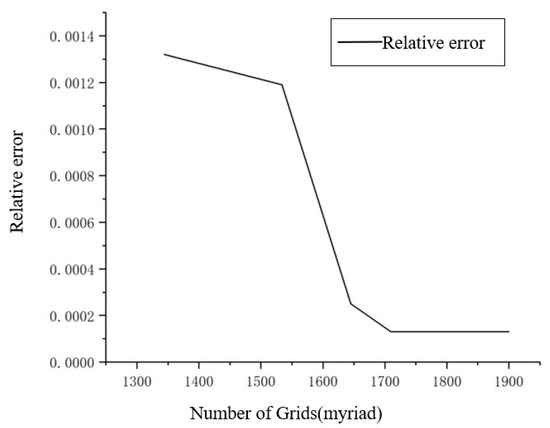
Figure 6.
Grid independence verification.
5.1.3. Numerical Calculation Results and Analysis
The calculation boundary conditions and turbine parameter settings are shown in Table 4.
Table 4.
Calculating parameters.
The internal flow characteristics of the penstock under the turbine’s design condition, as calculated, are displayed in Figure 7. From the figure, it is evident that the pressure distribution in the steel pressure pipe decreases gradually in the outlet direction, with a relatively stable transition. The highest pressure is observed at the start of the steel pipe’s reducing section, and the lowest pressure occurs at the end of this section. The velocity distribution increases progressively along the outlet direction, with the minimum velocity at the entrance of the φ8.0 m diameter section and the maximum velocity at the φ6.8 m diameter section.
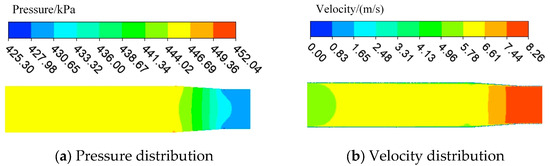
Figure 7.
Internal flow distribution diagram of steel pressure pipe.
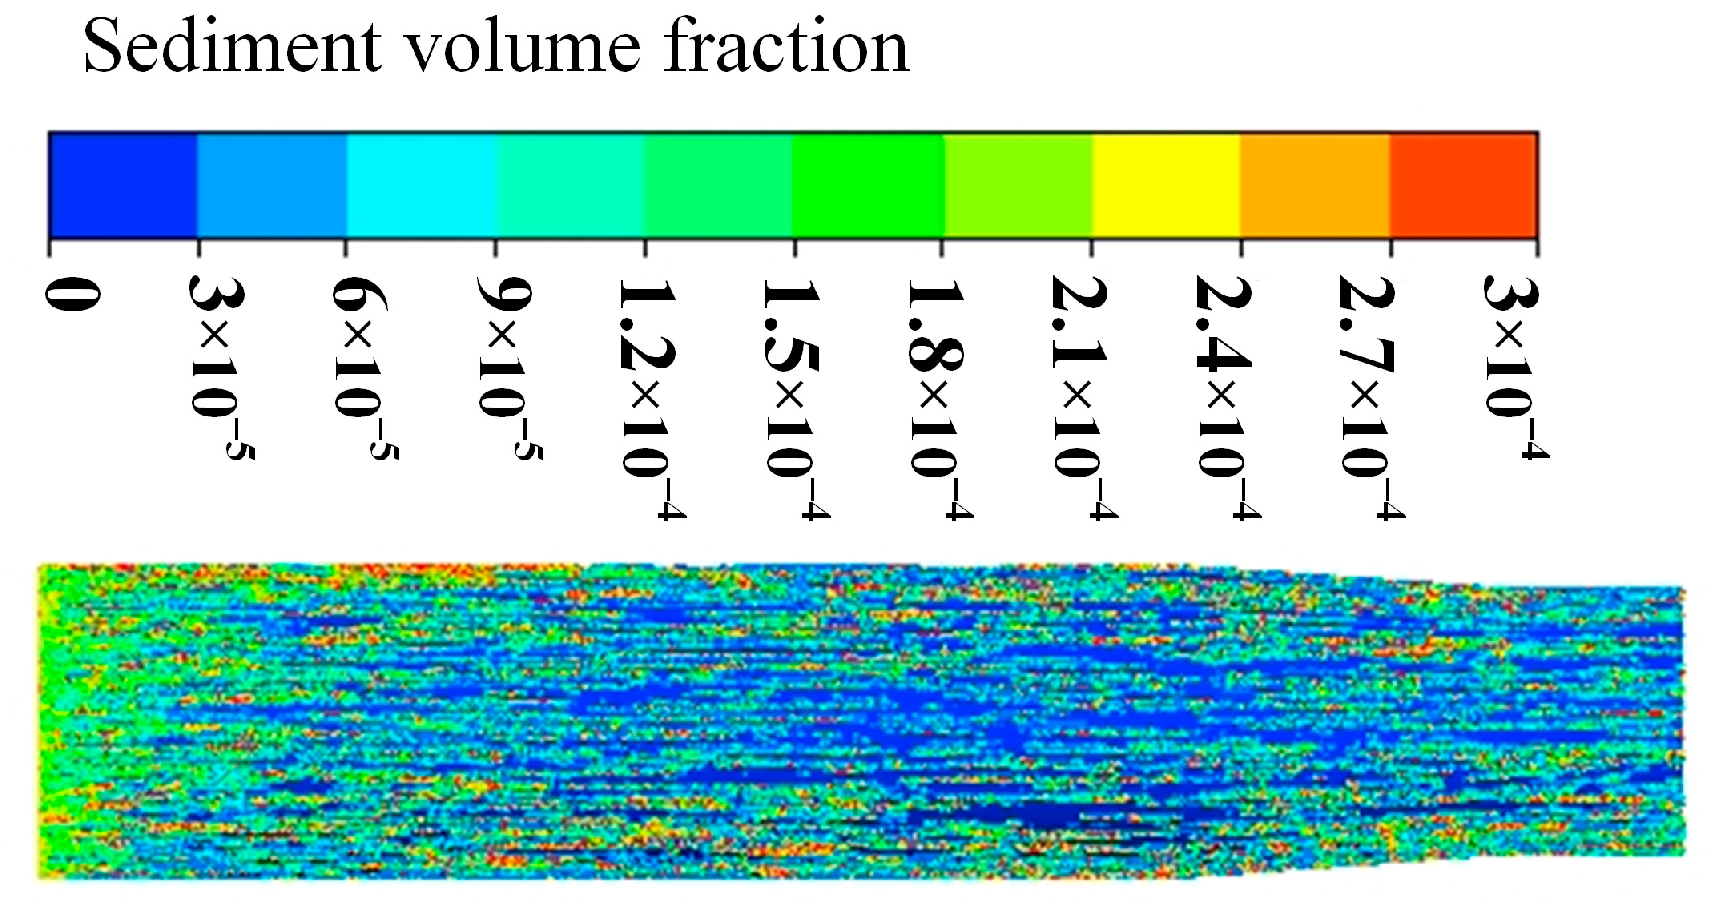
The local sediment volume fraction (sediment concentration) distribution inside the penstock was calculated, as shown in Figure 8. The sediment volume fraction on the pipeline surface is around 0.0002, and the sediment concentration is fairly uniform along the entire pipeline.
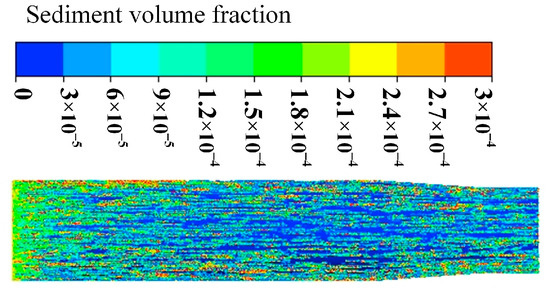
Figure 8.
Sediment volume fraction of steel pressure pipe.
5.2. Testing System
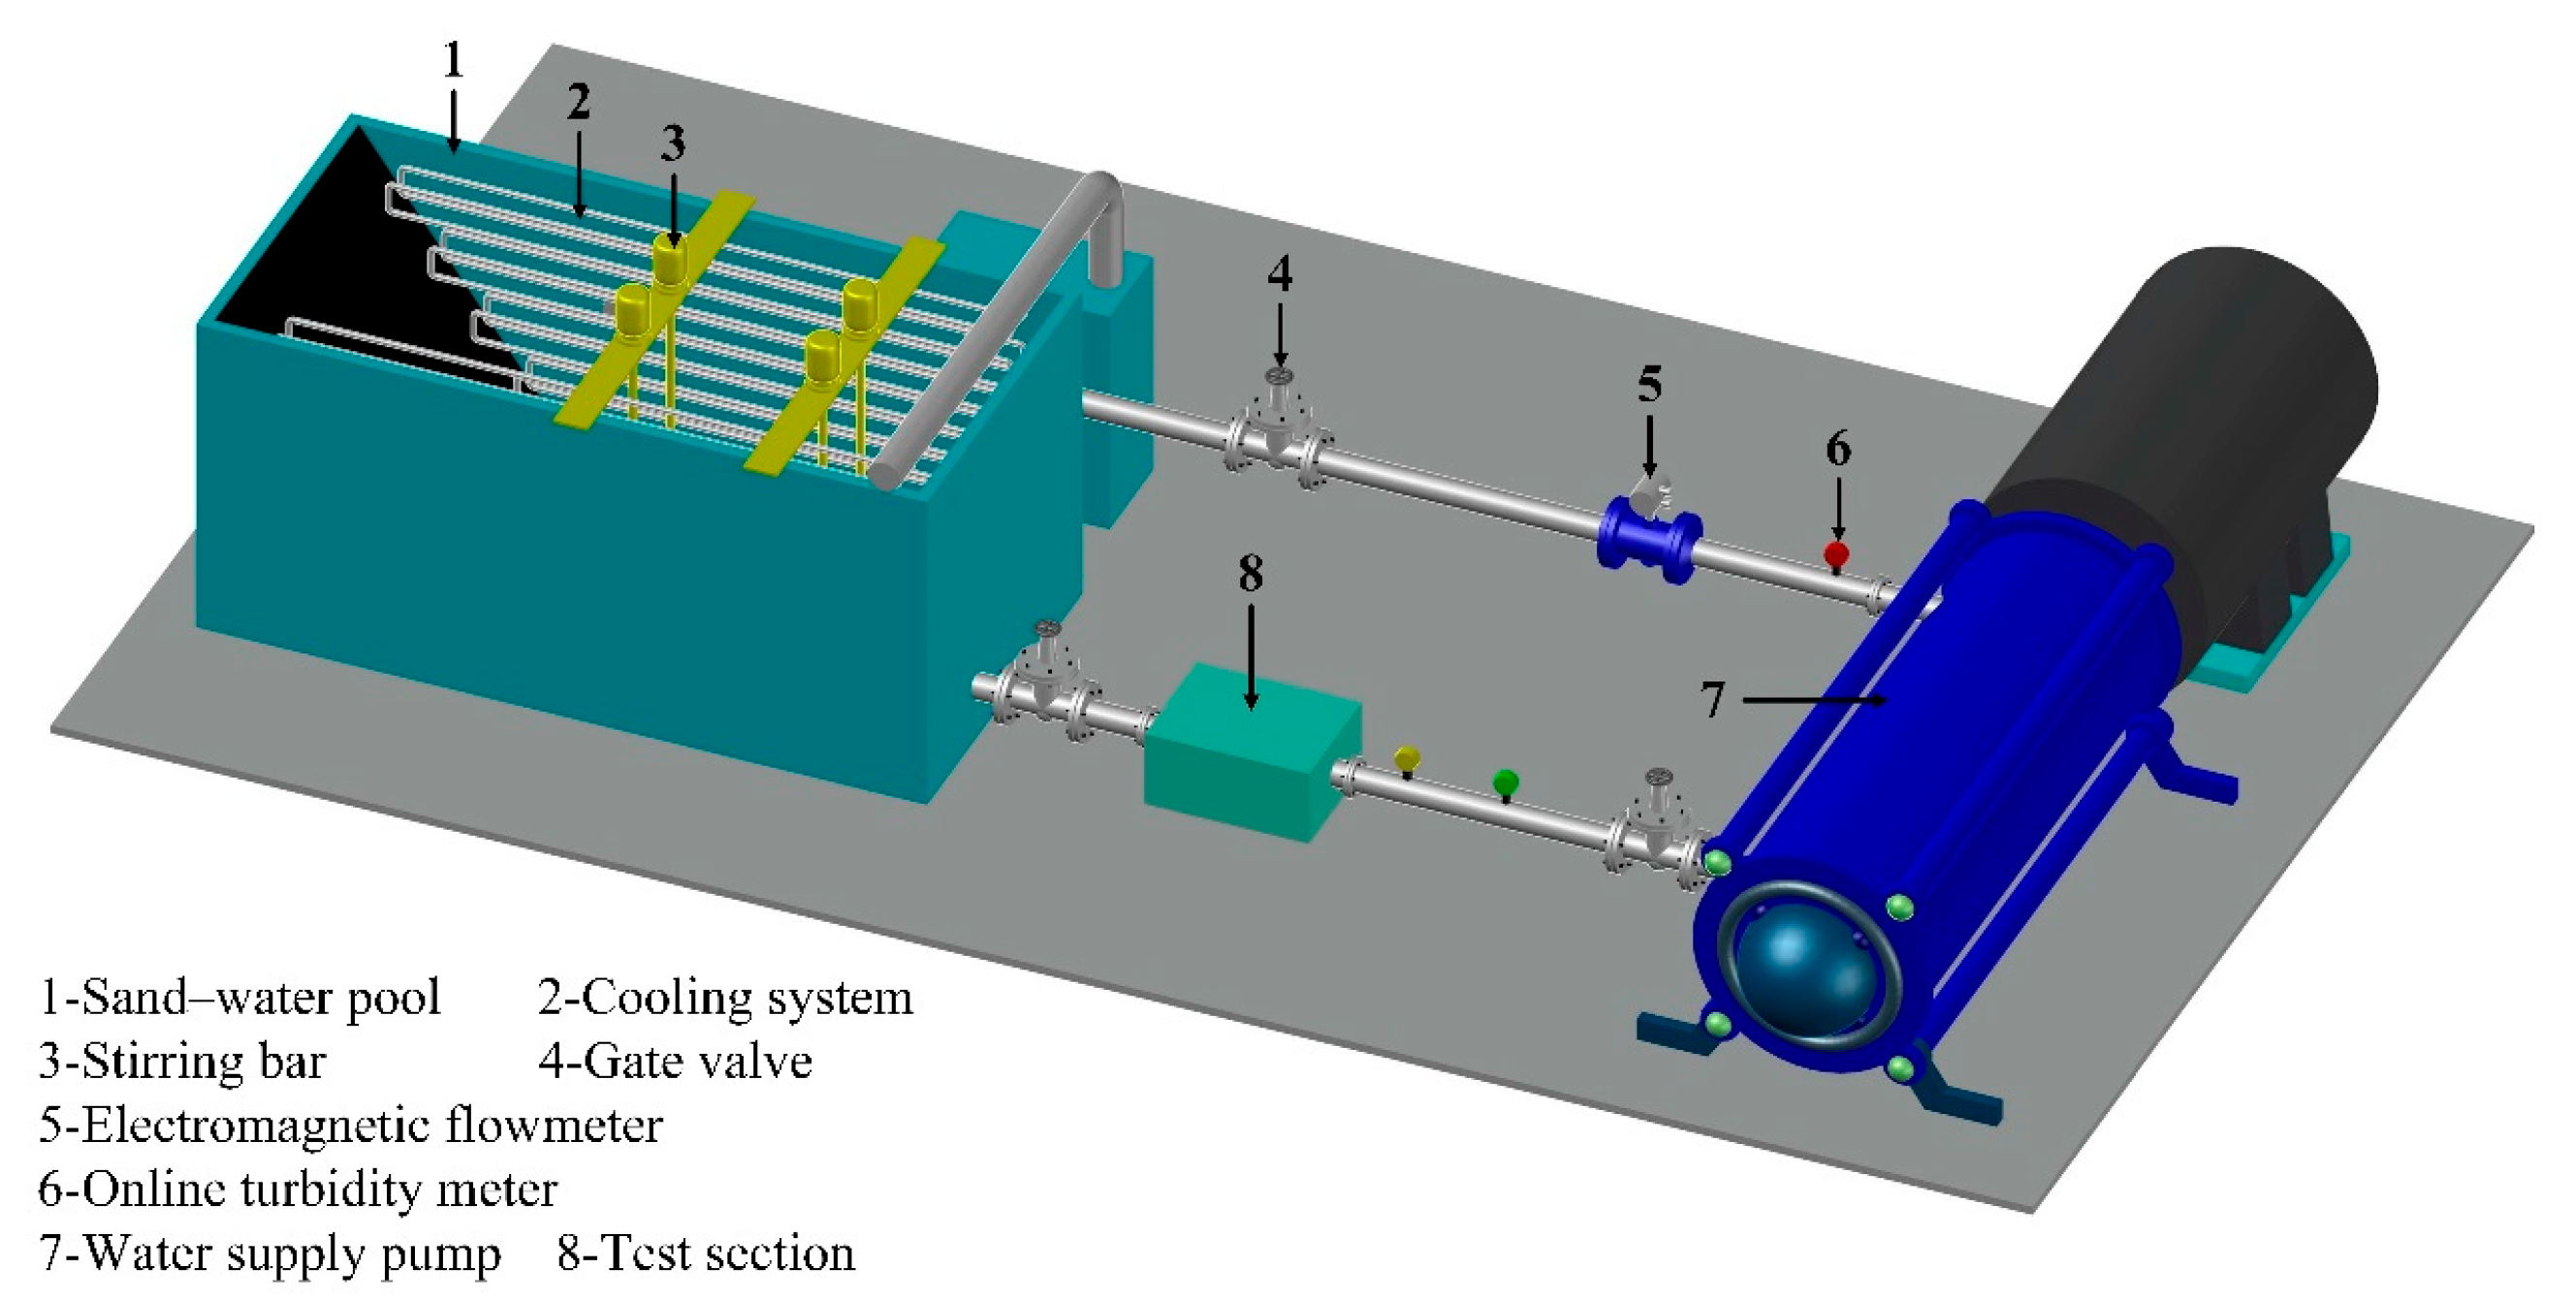
The sediment abrasion test system is composed of four subsystems: the power system, sediment mixing system, cooling system, and test section (system), as shown in Figure 9. The power system is capable of providing a maximum output of 630 kW, a maximum flow rate of 320 m3/h, and a maximum water head of 300 m. The sediment mixing system achieves uniform sediment dispersion through water flow impact. The cooling system uses a serpentine tube to extract groundwater for cooling purposes. The test section serves as the central component of the test rig, with flow channels designed for different boundary shapes based on the sand–water mixture’s numerical calculation results for various flow components.

Figure 9.
Schematic diagram of erosion test system.
5.3. Erosion Specimen and Test Section
To ensure the change in the cross-sectional area of the test section aligns with the variation in the area of the steel pressure pipe, the flow characteristics in the test section are designed to mimic those of the actual pressure pipe. An arc section of the pipe is selected to form the inner surface of the test section box. For convenience in performing the sediment erosion test, an erosion test block is positioned on the inner surface of the test section box. This test block is made from 15Mn steel, the same material as used in the actual system, with a density of 7850 kg/m3 and a surface area of 40 cm2. The test device is shown in Figure 10. The designed device allows for a test flow rate of 300 m3/h, which ensures the required sand flow velocity of 8.3 m/s within the pipeline under the turbine’s design conditions.
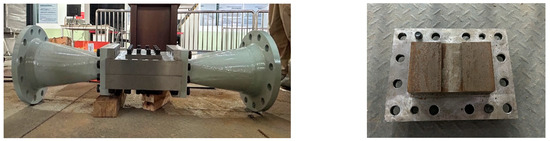
Figure 10.
Test section physical diagram.
5.4. Sediment Erosion Test and Result Analysis
Sediment was gathered from the power station site, and a sediment erosion test was conducted for 100 h after performing the sand–water gradation in the laboratory, based on the average sediment content of CV = 2.5 kg/m3 during the flood season. The sand erosion test for the steel pressure pipe test block was then carried out. An electronic balance with a precision of 0.0001 g was used to measure the mass of the test block before and after erosion, allowing for the determination of the sand erosion rate. The appearance of the test block before and after the erosion test is shown in Figure 11. The erosion rate was calculated as 1.392 × 10⁻⁴ mm/h.
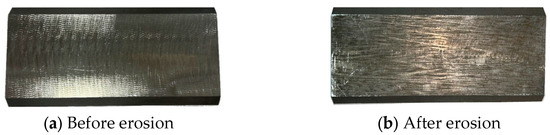
Figure 11.
Comparison of morphology of test block before and after erosion.
Based on the erosion rate data from the test and the numerical results of the sand–water flow, a mathematical model for sediment erosion in the 15Mn steel penstock of the power station can be established as follows:
Ė = kCVVn = 2.8 × 10⁻⁷CVV2.5
In this equation, Ė denotes the erosion rate of the inner wall of the steel pressure pipe (in mm/h); k is the erosion coefficient; CV represents the sediment content (concentration) in kg/m3; V is the sand–water velocity in the pipeline (in m/s); and n is the velocity index.
6. Sediment Erosion and Life Prediction of Penstock
Using the established mathematical model for sediment erosion of the 15Mn steel penstock at the power station and combining it with turbine operational data (varying flow rates corresponding to different sand–water velocities) and hydrological sediment data (sediment concentration), the cumulative erosion amount can be predicted. This allows for forecasting the sediment erosion in the steel pipe (including different diameter sections) and estimating its operational life. The calculation method is as follows:
Δz =∑Ėi × ti
In this formula, Δz represents the erosion amount of the inner wall of the penstock, Ėᵢ is the erosion rate under the same sediment concentration and operating conditions for a given period, and tᵢ is the operational time of the turbine under the same sediment concentration and conditions.
Based on the mathematical model for sediment erosion, the erosion of the penstock is predicted using an annual average sediment content of 0.63 kg/m3 and 6000 h of annual operation. Other factors, such as the gradual increase in sediment concentration in the river, are not considered. The theoretical effect of sediment erosion on the penstock wall thickness is shown in Table 5. According to the design specifications of the power station’s penstock, the minimum allowable wall thickness is 24 mm. With the current sediment concentration of 0.63 kg/m3 and a steel pipe wall thickness of 28 mm, the penstock is expected to remain operational for an additional 19 years.
Table 5.
Estimated maximum erosion of steel pressure pipe.
7. Conclusions
Considering the long operational history of the hydropower station, the penstock includes an open pipe section located in the powerhouse. Recent inspections have revealed a reduction in the penstock’s wall thickness due to sediment erosion, which presents a potential risk to its safe operation. To assess the penstock’s remaining service life, stress tests, stiffness and strength mathematical model analysis, and sediment erosion tests were performed.
- (1)
- Stress testing was conducted on the load rejection penstock of the hydraulic turbine. A monitoring system for stress and strain in the steel pressure pipe was developed, providing real-time monitoring and a warning function. Load rejection tests were carried out at 25%, 50%, 75%, and 100%. The results showed that at 25% load rejection, the maximum volute pressure reached 0.575 MPa, and the maximum pipeline stress was 100.163 MPa. At 50% load rejection, the maximum volute pressure was 0.609 MPa, and the maximum pipeline stress was 104.556 MPa. For 75% load rejection, the maximum volute pressure reached 0.622 MPa, and the maximum pipeline stress was 104.215 MPa. Finally, at 100% load rejection, the maximum volute pressure was 0.620 MPa, and the maximum pipeline stress was 103.475 MPa.
- (2)
- A strength analysis of the hydraulic turbine load rejection penstock was conducted using a mathematical model. It was observed that the maximum equivalent stress of the steel pipe is 98.16 MPa with a 28 mm wall thickness, which increases to 115.22 MPa when the wall thickness is reduced to 24 mm. The maximum deformation of the steel pipe is 3.88 mm with a 28 mm wall thickness, and 4.41 mm when the wall thickness is reduced to 24 mm. The overall stress in the steel pipe is about 100 MPa with a 28 mm wall thickness and about 120 MPa when the wall thickness is 24 mm. The results from numerical simulations closely match the experimental findings, demonstrating the high accuracy of both the experimental and numerical simulation results.
- (3)
- Based on the material of the steel pipe and a safety factor ranging from 1.2 to 1.4, the results from the test and numerical simulations indicate that the maximum equivalent stress of the steel pipe should prompt a warning when it reaches around 120 MPa, with an alarm being triggered when it reaches about 140 MPa. This should be integrated into the monitoring system. The research confirms that with the current 28 mm wall thickness, the steel pipe will not fail under any load rejection conditions. However, if the wall thickness is reduced to around 24 mm, the maximum equivalent stress during load rejection will approach the safety limit.
- (4)
- A sediment erosion test was performed with an average sediment concentration of 0.63 kg/m3, resulting in an erosion rate of 3.509 × 10⁻⁵ mm/h. If no other factors, such as an increase in river sediment concentration, are considered, and based on the design requirements of the steel pressure pipe and the annual average sediment concentration of 0.63 kg/m3, the steel pressure pipe’s open section can theoretically be worn down to 24 mm and continue to operate for 19 years. It is advised that, once the wall thickness of the steel pipe reduces to around 24 mm due to erosion or other factors, the pipeline system should undergo more rigorous maintenance or replacement.
There are also some limitations in this study. The annual average sediment concentration is used in the sediment wear test. The wear rate obtained is the current wear rate, and the conclusion is drawn without considering the change in sediment concentration in the future. In future life prediction, the wear rate should be adjusted in time with the real-time sediment concentration. This research can be used for monitoring or the life prediction of penstock in the same type of power station in the future.
Author Contributions
L.P., J.P. and X.L. proposed the simulation method; H.W. and S.L. completed the numerical simulations; W.X. and X.Y. analyzed the data; L.P. and Z.Z. complete the test; L.P. and J.P. wrote the original manuscript and X.L. reviewed and revised the manuscript. All authors have read and agreed to the published version of the manuscript.
Funding
The research was supported by Key Program of National Natural Science Foundation of China (No. U23A20669).
Data Availability Statement
The original contributions presented in this study are included in the article. Further inquiries can be directed to the corresponding author.
Conflicts of Interest
Authors Wenping Xiang and Xutao Yi Gongzui were employed by Hydropower General Plant Dadu River Co., Ltd. The remaining authors declare that the research was conducted in the absence of any commercial or financial relationships that could be construed as a potential conflict of interest.
References
- Wan, W.; Zhang, B. Investigation of water hammer protection in water supply pipeline systems using an intelligent self controlled surge tank. Energies 2018, 11, 1450. [Google Scholar] [CrossRef]
- Ghidaoui, M.S.; Zhao, M.; McInnis, D.A.; Axworthy, D.H. A review of water hammer theory and practice. Appl. Mech. Rev. 2005, 58, 49–76. [Google Scholar] [CrossRef]
- Yu, X.; Zhang, J.; Zhou, L. Hydraulic transients in the long diversion-type hydropower station with a complex differential surge tank. Sci. World J. 2014, 2014, 241868. [Google Scholar] [CrossRef]
- Bergant, A.; Kruisbrink, A.; Arregui, F. Dynamic behaviour of air valves in a large-scale pipeline apparatus. Strojniški vestnik. J. Mech. Eng. 2012, 58, 225–237. [Google Scholar] [CrossRef]
- Huang, B.; Mao, L.; Zhang, Y.; Ren, J.; Zhang, M.; He, J.; Li, G. Microwave Sensing Vibration Measurement Technology and lts Applicationin Vibration Deformation Analysis of Hydraulic Turbine Penstock under the Action of Water Hammer. Water Power 2024, 50, 94–102. [Google Scholar]
- Shi, N.; Zhang, H.; Hu, H.; Sun, P.; Yu, J. Stress calculation method designed of pipeline in landslide section based on SBAS-Insar and finite element method[C]//New Horizon Educational Institution. In Proceedings of the 9th International Conference on Energy Materials and Environment Engineering (ICEMEE 2023), Kuala Lumpur, Malaysia, 8–10 June 2023. [Google Scholar]
- Zhu, M.; Lv, Y. Based on ANASYS with finite element analysis and calculation of cracked pipeline. Adv. Mater. Res. 2014, 989, 3185–3188. [Google Scholar] [CrossRef]
- Zhang, J.; Liang, Z.; Han, C.; Zhang, H. Buckling behaviour analysis of a buried steel pipeline in rock stratum impacted by a rockfall. Eng. Fail. Anal. 2015, 58, 281–294. [Google Scholar] [CrossRef]
- Liu, M.; Min, Y. Modeling the behavior of natural gas pipeline impacted by falling objects. Eng. Fail. Anal. 2014, 42, 45–59. [Google Scholar] [CrossRef]
- Bui, T.Q.; Jong-Myon, K. Crack detection and localization in a fluid pipeline based on acoustic emission signals. Mech. Syst. Signal Process. 2021, 150, 107254. [Google Scholar]
- Li, Y.; Zhang, J.; Xu, H.; Bai, Y. Experimental study on the characteristics of sediment transport and sorting in pressurized pipes. Water 2021, 13, 2782. [Google Scholar] [CrossRef]
- Wang, H.; Pang, J.; Liu, X.; Zhou, Z.; Gang, Y.; Lai, Z.; Wang, J.; Qin, B. Analysis on cause of erosion of guide vane of high-head Francis turbine in sandy river. Energy Sci. Eng. 2024, 12, 3704–3717. [Google Scholar] [CrossRef]
- Li, S.; Yao, B.; Pang, J.; Liu, D.; Chengmei, D.; Jiang, D.; Wang, H.; Gang, Y.; Cheng, H.; Liu, X. Research on the technical improvement of the turbine runner of a power station based on improving stability. Energy Sci. Eng. 2024, 12, 4582–4597. [Google Scholar] [CrossRef]
- Yao, B.; Gang, Y.; Xiao, M.; Yu, Z.; Jiang, D.; Pang, J.; Liu, X. Influence of tungsten carbide spray treatment on anti-erosion performance of Francis turbine runner blades surface. Adv. Mech. Eng. 2024, 16. [Google Scholar] [CrossRef]
- Pang, J.; Liu, H.; Liu, X.; Yang, H.; Peng, Y.; Zeng, Y.; Yu, Z. Study on sediment erosion of high head Francis turbine runner in Minjiang River basin. Renew. Energy 2022, 192, 849–858. [Google Scholar] [CrossRef]
- Rohit, S.K.; Bhupendra, G.K. Erosive flow field investigation on guide vanes of Francis turbine—A systematic review. Sustain. Energy Technol. Assess. 2022, 53, 102491. [Google Scholar]
- Shrestha, U.; Chen, Z.; Park, H.S.; Choi, Y.D. Numerical studies on sediment erosion due to sediment characteristics in Francis hydro turbine. IOP Conf. Ser. Earth Environ. Sci. 2019, 240, 042001. [Google Scholar] [CrossRef]
- Thapa, S.B.; Dahlhaug, G.O.; Thapa, B. Sediment erosion in hydro turbines and its effect on the flow around guide vanes of Francis turbine. Renew. Sustain. Energy Rev. 2015, 49, 1100–1113. [Google Scholar] [CrossRef]
- Liu, X. Study on turbulent solid-liquid two-phase flow and erosion in turbine. J. Hydrodyn. (A Ser.) 1996, 606–609. Available online: https://www.zhangqiaokeyan.com/academic-journal-cn_chinese-journal-hydrodynamics_thesis/0201273871780.html (accessed on 2 January 2025).
- Liu, X.; Zeng, Y.; Hua, H.; Yu, Z.; Pang, J.; Tian, C. study on sediment abrasion of turbine runner blades in Yuzixi hydropower station. J. Xihua Univ. (Nat. Sci. Ed.) 2020, 39, 67–73. [Google Scholar]
- Xiao, Y.; Wang, Z.; Yan, Z.; Luo, Y.; Xiao, R.; Peng, G.; Xue, P. Experimental and numerical analysis of pressure pulses characteristics in a Francis turbine with partial load. IOP Conf. Ser. Earth Environ. Sci. 2010, 12, 012023. [Google Scholar]
- Li, Y.; Guo, B.; Xiao, Y. Simulation study on sediment erosion characteristics of high head Francis turbine runner. J. Hydropower Gener. 2020, 39, 112–120. [Google Scholar]
- Ge, X.; Sun, J.; Li, Y.; Wu, D.; Zhang, L.; Hua, H. Numerical simulation of sand abrasion characteristics of jet mechanism of impulse turbine. J. Hydraul. Eng. 2020, 51, 1486–1494. [Google Scholar]
- Ge, X.; Sun, J.; Li, Y.; Zhang, L.; Deng, C.; Wang, J.; Gao, F.; Ding, M.; Zheng, Y. The erosion characteristics of the diameter and concentration of sediment on the runner of bucket water turbine. Proc. Chin. Soc. Electr. Eng. 2021, 41, 1–13. [Google Scholar]
- Ge, X.; Sun, J.; Cai, J.; Zhang, L.; Zhang, H.; Wang, J.; Maxime, B.; Zheng, Y. Research on the influence of abrasion on the bucket profile and performance of bucket turbines. Proc. Chin. Soc. Electr. Eng. 2021, 41, 6–26. [Google Scholar]
- Yang, H.; Liu, X.; Tian, W.; Pang, J.; Xu, L. Sediment Abrasion of Turbine Guide Vanes at Xiate Hydropower Station in Xinjiang. J. Chin. Soc. Power Eng. 2022, 42, 190–196. [Google Scholar]
- Yang, H. Calculation of Sand-Water Flows in the Francis Turbine of Xiate Power Station and Study om Sediment Erosion of Sprayed Tungsten Carbide Guide Vanes. Master’s Thesis, Xihua University, Chengdu, China, 2023. [Google Scholar]
- Zhao, X.; Liu, X.; Chen, J.; Yang, J.; Pang, J. Sediment erosion of hydraulic turbine moving guide vane at Ying xiuwan Hydropower station. Chin. J. Hydrodyn. 2021, 36, 728–734. [Google Scholar]
- Fang, X.; Yu, Z.; Liu, X. Research on Sediment Erosion of Turbine Guide Vanes in High Head Sediment-Laden Power Station. Yellow River 2019, 41, 121–124. [Google Scholar]
- Zhao, X.; Peng, Y.; Yang, J.; Ren, M.; Liu, X. Experimental analysis of the effect of erosion factors on guide vane of hydraulic turbine. Machines 2022, 10, 264. [Google Scholar]
- Liu, X.; Cheng, L. A k-ε two-equation turbulence model for solid-liquid two-phase flows. Appl. Math. Mech. 1996, 17, 76–86. [Google Scholar]


Disclaimer/Publisher’s Note: The statements, opinions and data contained in all publications are solely those of the individual author(s) and contributor(s) and not of MDPI and/or the editor(s). MDPI and/or the editor(s) disclaim responsibility for any injury to people or property resulting from any ideas, methods, instructions or products referred to in the content. |
© 2025 by the authors. Licensee MDPI, Basel, Switzerland. This article is an open access article distributed under the terms and conditions of the Creative Commons Attribution (CC BY) license (https://creativecommons.org/licenses/by/4.0/).