Article

Optimization and Application of Bio-Enzyme-Enhanced Gel-Breaking Technology in Fracturing Fluids for Tight Sandstone Gas in the Linxing Block, Ordos Basin

1
CNOOC Energy Development Company Limited, Engineering and Technology Branch, Tianjin 300456, China
2
State Key Laboratory of Petroleum Resources and Engineering, China University of Petroleum (Beijing), Beijing 102249, China
*
Author to whom correspondence should be addressed.
Processes 2025, 13(2), 440; https://doi.org/10.3390/pr13020440
Submission received: 19 December 2024 / Revised: 4 February 2025 / Accepted: 5 February 2025 / Published: 6 February 2025
(This article belongs to the Special Issue Modeling, Control, and Optimization of Drilling Techniques)

Abstract

:
The main tight sandstone gas reservoirs in the Linxing block of the Ordos Basin exhibit a temperature range of 35–60 °C. Under these low-temperature conditions, conventional oxidative gum breakers used in fracturing operations react sluggishly, fail to break the gum completely, and can cause significant reservoir damage. In order to achieve complete breakage of the fracturing fluid and reduce the damage to the fracture and reservoir, active bio-enzyme-enhanced breakers have been incorporated into fracturing fluid formulations, so as to achieve rapid breakage, re-discharge at low temperature, and reduce the contact time between the fracturing fluid and the formation, which is critical for enhancing production efficiency. Based on the preliminary success of bio-enzyme-enhanced fracturing technology, this paper carries out an optimization study of bio-enzyme-enhanced fracturing technology for the low-temperature reservoir in the Ordos Linxing block. The study simulates the temperature recovery of the injected fluids under different reservoir temperatures during the fracturing process, aiming to further optimize the concentration of the bio-enzyme-enhanced fracture breakers in the fracturing phases, and to achieve optimized fracturing technology which is more in line with the temperature environment of the fluids. This can further optimize the concentration of the bio-enzyme breaker added at each fracturing stage, and achieve enhanced breaking in a stepwise manner that is more in line with the fluid temperature environment, thus improving the efficiency and production capacity for subsequent production. The optimized fracturing fluid system, incorporating the tailored concentration of the bio-enzyme breaker, was applied to 54 wells in this block, resulting in about a two-times improvement in production compared to conventional non-optimized methods, with many wells achieving high output. These results demonstrate the strong applicability of the optimized breaker procedure in this geological context. Additionally, this study investigated an optimization model for the well shut-in time during winter operations involving low-temperature fracturing fluids in low-temperature reservoirs, providing a valuable design basis for future production planning.

1. Introduction

Natural gas plays an important role in China’s and even the global energy structure. Ensuring natural gas production and stable production is the basic premise of national energy security, people’s lives, and industrial production. In the energy consumption structure, the proportion of natural gas as a clean energy continues to grow, but compared with coal and oil, its overall proportion is still low. According to the “China Natural Gas Development Report” issued by the National Energy Administration, the proportion of natural gas in China’s primary energy consumption in 2023 was about 8.5%. As an important part of unconventional natural gas, tight sandstone gas resources are widely distributed in Sichuan, Inner Mongolia, Shanxi, Shaanxi, and other places in China [1,2,3,4]. They have characteristics of low porosity and low permeability, fast sedimentary phase change, large expansion and change of sand body, and show great difficulty and uncertainty in development technology. According to the National Energy Administration, the annual production of tight sandstone gas in China exceeded 70 billion cubic meters in 2023, accounting for about 25% of the country’s total natural gas production. Its exploitable resources exceed 9 × 10¹² m3, showing great development potential [5]. However, the development of tight sandstone gas requires more complex and sophisticated technical means, especially fracturing technology, which is the key to improve the fluidity of natural gas by changing reservoir permeability. In addition to technical challenges, its development also involves many considerations such as environmental protection and resource management. With technological progress and policy support, tight sandstone gas will play an increasingly important role in China’s energy structure adjustment and security. In the World, the United States has successfully incorporated tight sandstone gas into the mainstream of energy production through horizontal drilling and hydraulic fracturing technology. At present, the production accounts for nearly 70% of its total natural gas production. The development of tight gas resources in western Canada, with policy and technical support, has become an important part of its energy supply. Australia’s tight gas extraction provides critical support for LNG exports [6,7,8]. In addition, countries such as Argentina and the United Kingdom have also increased the development of tight gas and promoted the coordinated development of technology and environmental protection. Although the development still faces challenges such as high cost and environmental impact, the position of tight sandstone gas in the global energy market is gradually increasing, and it has become an important way to replace traditional energy and ensure energy security. After years of exploration and development, the Linxing gas field in the eastern edge of Ordos Basin was verified as having very high natural gas reserves. The gas reservoir in this block has a burial depth of 900–2200 m, formation temperature of about 35–60 °C, porosity of 3.7%–15%, and permeability of only (0.01–0.50) × 10−3 μm2 [9,10,11]. It is a typical low-temperature, low-porosity, and low-permeability tight reservoir, which requires large-scale hydraulic fracturing to release production capacity in this block [12]. In the process of fracturing to increase production, the damage of the fracturing fluid to the reservoir is an important part that cannot be ignored. The formation temperature of this block is low. It can quickly break and flow back after fracturing and reducing the retention time of the fracturing fluid is the key factor to reduce reservoir damage. It is also the main difficulty in the development of low-temperature tight reservoirs [13].
This introduction highlights the significant challenges faced in low-temperature reservoir fracturing, particularly the optimization of gel-breaking processes to enhance fracture conductivity and production rates. A critical question addressed by this research is the following: How can bio-enzyme-enhanced gel-breaking technology be optimized for low-temperature reservoirs (35–60 °C) to improve fracturing efficiency and reservoir productivity? The hypothesis posits that optimizing bio-enzyme concentrations in response to temperature variations during different pumping stages will enhance the gel-breaking process, improving the field applicability. Previous research primarily focused on conventional gel-breaking technologies, often neglecting the impact of dynamic temperature changes on fracturing fluids. This study fills an important gap by accounting for both the temperature fluctuations and the enzymatic reaction dynamics in bio-enzyme gel-breakers. Its innovation lies in combining numerical simulations and experimental optimization to create a more adaptable and efficient fracturing solution. By optimizing bio-enzyme gel-breaking for low-temperature reservoirs, this research not only aims to improve production rates but also reduce construction costs, enhance fracture cleaning, and address both economic and environmental concerns in the oil and gas industry. The novelty of this approach is in its application of temperature-responsive bio-enzyme concentrations, tailoring fracturing fluid performance to real-time conditions. The impact spans across technology, engineering, economy, and the environment, offering improved fracturing techniques, better field performance at lower costs, increased resource extraction efficiency, and reduced reservoir damage for long-term sustainability.
Ammonium persulfate, a key component of conventional oxidative gel-breakers, struggles to provide effective gel breaking in low-temperature environments, often failing to meet the rapid gel-breaking needs of low-temperature reservoirs [14,15,16]. In China, a common solution combines ammonium persulfate with a low-temperature catalyst to achieve faster gel breaking in reservoirs below 60 °C [17,18,19]. However, the performance of this combination is heavily influenced by both the water and formation temperatures, often leading to incomplete gel breaking. Earlier research by He Xiaojun, Li Jun, Li Bin, and others [2,3,4,5,6,7,8,9,10,11,12,13,14,15,16,17,18,19,20,21,22,23,24,25] focused on optimizing fracturing fluid systems for low-temperature reservoirs, introducing a low-concentration guar gum fracturing fluid system suitable for such environments. This system was the first to apply internationally patented biocatalyst gel-breaking technology in China. In addition, experiments were conducted to simulate bio-enzyme dosages and their corresponding gel-breaking performance at different water temperatures, leading to the optimization of bio-enzyme gel-breaking schemes for low-temperature systems [26,27,28,29,30,31,32,33,34,35,36]. This approach was successfully applied in the development of tight sandstone gas in the Linxing block. Building on this work, this article explores various combinations of ground and formation temperatures to simulate the recovery of the formation temperature under heat exchange. It proposes a more refined biocatalyst dosage optimization scheme, tailored to the actual formation temperature after compression, to improve gel-breaking performance in low-temperature systems.

2. Understanding of the Linxing Block Reservoir

2.1. Analysis of Core Samples

(1)
Experimental samples and instruments
The experimental samples were eight core samples (A, B, C, D, E, F, G, H) taken from the main reservoir Tai 2, He 8, He 7, He 6, He 4, He 2, He 1, Qian 5 in the block. Other drugs and equipment used in the experiment include guar gum, Guangrao Liuhe Chemical Co., Ltd.; ammonium persulfate, United Initiators; Bruker D8 Endeavor (Billerica, MA, USA).
(2)
Experimental methods
The experiments were conducted according to the relevant requirements of the oil and gas industry standard SY/T 5336-2006 [37], and the specific experimental items were as follows: gas permeability (Table 1), quantitative analysis of whole-rock X-ray diffraction of sedimentary rock (Table 2), quantitative analysis of X-ray diffraction of clay minerals (Table 3); then, based on the well logging data of the block, the statistics of the different layers of formation temperature and pressure parameters (Table 4).
(1)
Gas permeability
Permeability is often measured using gas permeability experiments to assess the resistance properties of rocks to fluid flow. Experiments are usually performed at room temperature (25 °C), but in order to simulate the underground reservoir environment, a high-temperature and high-pressure permeability test system can also be used. During the experiment, the rock sample is first placed in the sample chamber of the permeability meter to ensure good sealing. Using dry helium as the test medium, the pressure difference is adjusted, and the gas flow rate is measured by a flowmeter. According to Darcy’s law, the permeability is calculated by combining flow rate, pressure difference, fluid viscosity, and sample geometry parameters.
(2)
Quantitative analysis of whole-rock X-ray diffraction of sedimentary rock
Whole rock X-ray diffraction quantitative analysis is used to determine the types and contents of the main minerals in sedimentary rocks, and is widely used in the study of the mineral composition of reservoir rocks. In the experiment, the sample was first ground to powder, and the particle diameter was controlled to be less than 200 mesh to ensure the uniformity of the test. The experimental equipment was an X-ray diffractometer, usually using Cu-Kα rays, the test conditions were 40 kV voltage, 40 mA current, scanning range 5–70° (2θ), step size 0.02°, scanning speed 1°/min. The sample powder was evenly pressed into the sample cup to ensure a smooth surface to improve signal quality. During the experiment, the characteristic diffraction peak was generated after the ray beam irradiated the sample, and the mineral type was determined by comparing with the standard mineral database. In quantitative analysis, the Rietveld method was used to optimize the diffraction data, and the internal standard method (such as adding 10% corundum powder) was used to improve the accuracy of the analysis results. In addition, the experimental environment should be kept at constant temperature and humid to avoid sample moisture absorption or deterioration. After the experiment, the main mineral contents (such as quartz, calcite, and feldspar, etc.) were calculated and counted to provide quantitative information on the mineral composition.
(3)
Quantitative analysis of X-ray diffraction of clay minerals
The X-ray diffraction analysis of clay minerals is a good test for the fine particle composition of rock with a particle size of less than 2 μm, focusing on the analysis of the types and contents of clay minerals such as bentonite, illite, chlorite, and kaolinite. The sample is subjected to a rigorous pre-treatment, including crushing, ultrasonic dispersion, centrifugation and preparation of directional slices. The directional sheet is coated with a suspension with a particle size of less than 2 μm on the glass slide, and then dried naturally to form a uniform sample layer. The tests are usually performed under three conditions: air drying (to detect initial clay minerals), ethylene glycol saturation (identification of the characteristic peak shift of bentonite), and high temperature heating (550 °C to detect the thermal stability of the mineral). Cu-Kα rays were used in the experiment. The scanning range was 2–35° (2θ), the scanning speed was 0.5°/min, the voltage was 40 kV, and the current was 40 mA. The relative content of clay minerals was obtained by analyzing the position, shape, and intensity of the diffraction peaks under different experimental conditions and combining with semi-quantitative calculation methods such as peak area, integral method, or factor method. To ensure data accuracy, results are often optimized in conjunction with quantitative analysis software. In addition, the operating environment should be kept dry during the experiment to avoid water vapor affecting the crystal structure of the clay minerals.
The study and tests show that the permeability of the reservoir within the Linxing block is low, showing typical characteristics of a tight sandstone reservoir. Clay content ranges from 11.9% to 44.5%, among which the content of transported clay such as illite and kaolinite is higher, and the reservoir is highly water-sensitive; the proportion of ilmenite-mixed layer in some layers is more than 25%, which has a strong clay swelling property. Coupled with its lower gas reservoir formation pressure, the reservoir is easy to be water locked so that the fracturing fluid enters the formation; the shorter the fluid residence time, the smaller is the chance of formation injury. In addition, the stress difference between the upper and lower mudstone of the reservoir in the block is generally small, about 3–10 MPa. The fracture height is extended into the breakthrough of the target layer, considering the problem of proppant settling, and it is necessary to have flow back as soon as possible.

2.2. Formation Temperature Statistics

The temperature distribution of the main reservoirs in the work area was compiled from several well completion data as shown in Table 5, which illustrates that the temperature range of the Taiyuan Formation (Tai 1, Tai 2) is 52.7–62.1 °C, with an average temperature of 56.9 °C; the temperature range of the Shihezi Formation (He 1, He 2, He 3, He 4, He 6, He 7, He 8) is 42.3–58.5 °C, with an average temperature of 47.9 °C; and the temperature range of the Shiqianfeng Formation (Qian 5) is 36.4–39.2 °C, with an average temperature of 37.8 °C. Unlike previous understanding, the temperature range of the main reservoirs in the block was found to be wider, thus increasing the difficulty of breaking the gel for the gel-breaking agent [24].

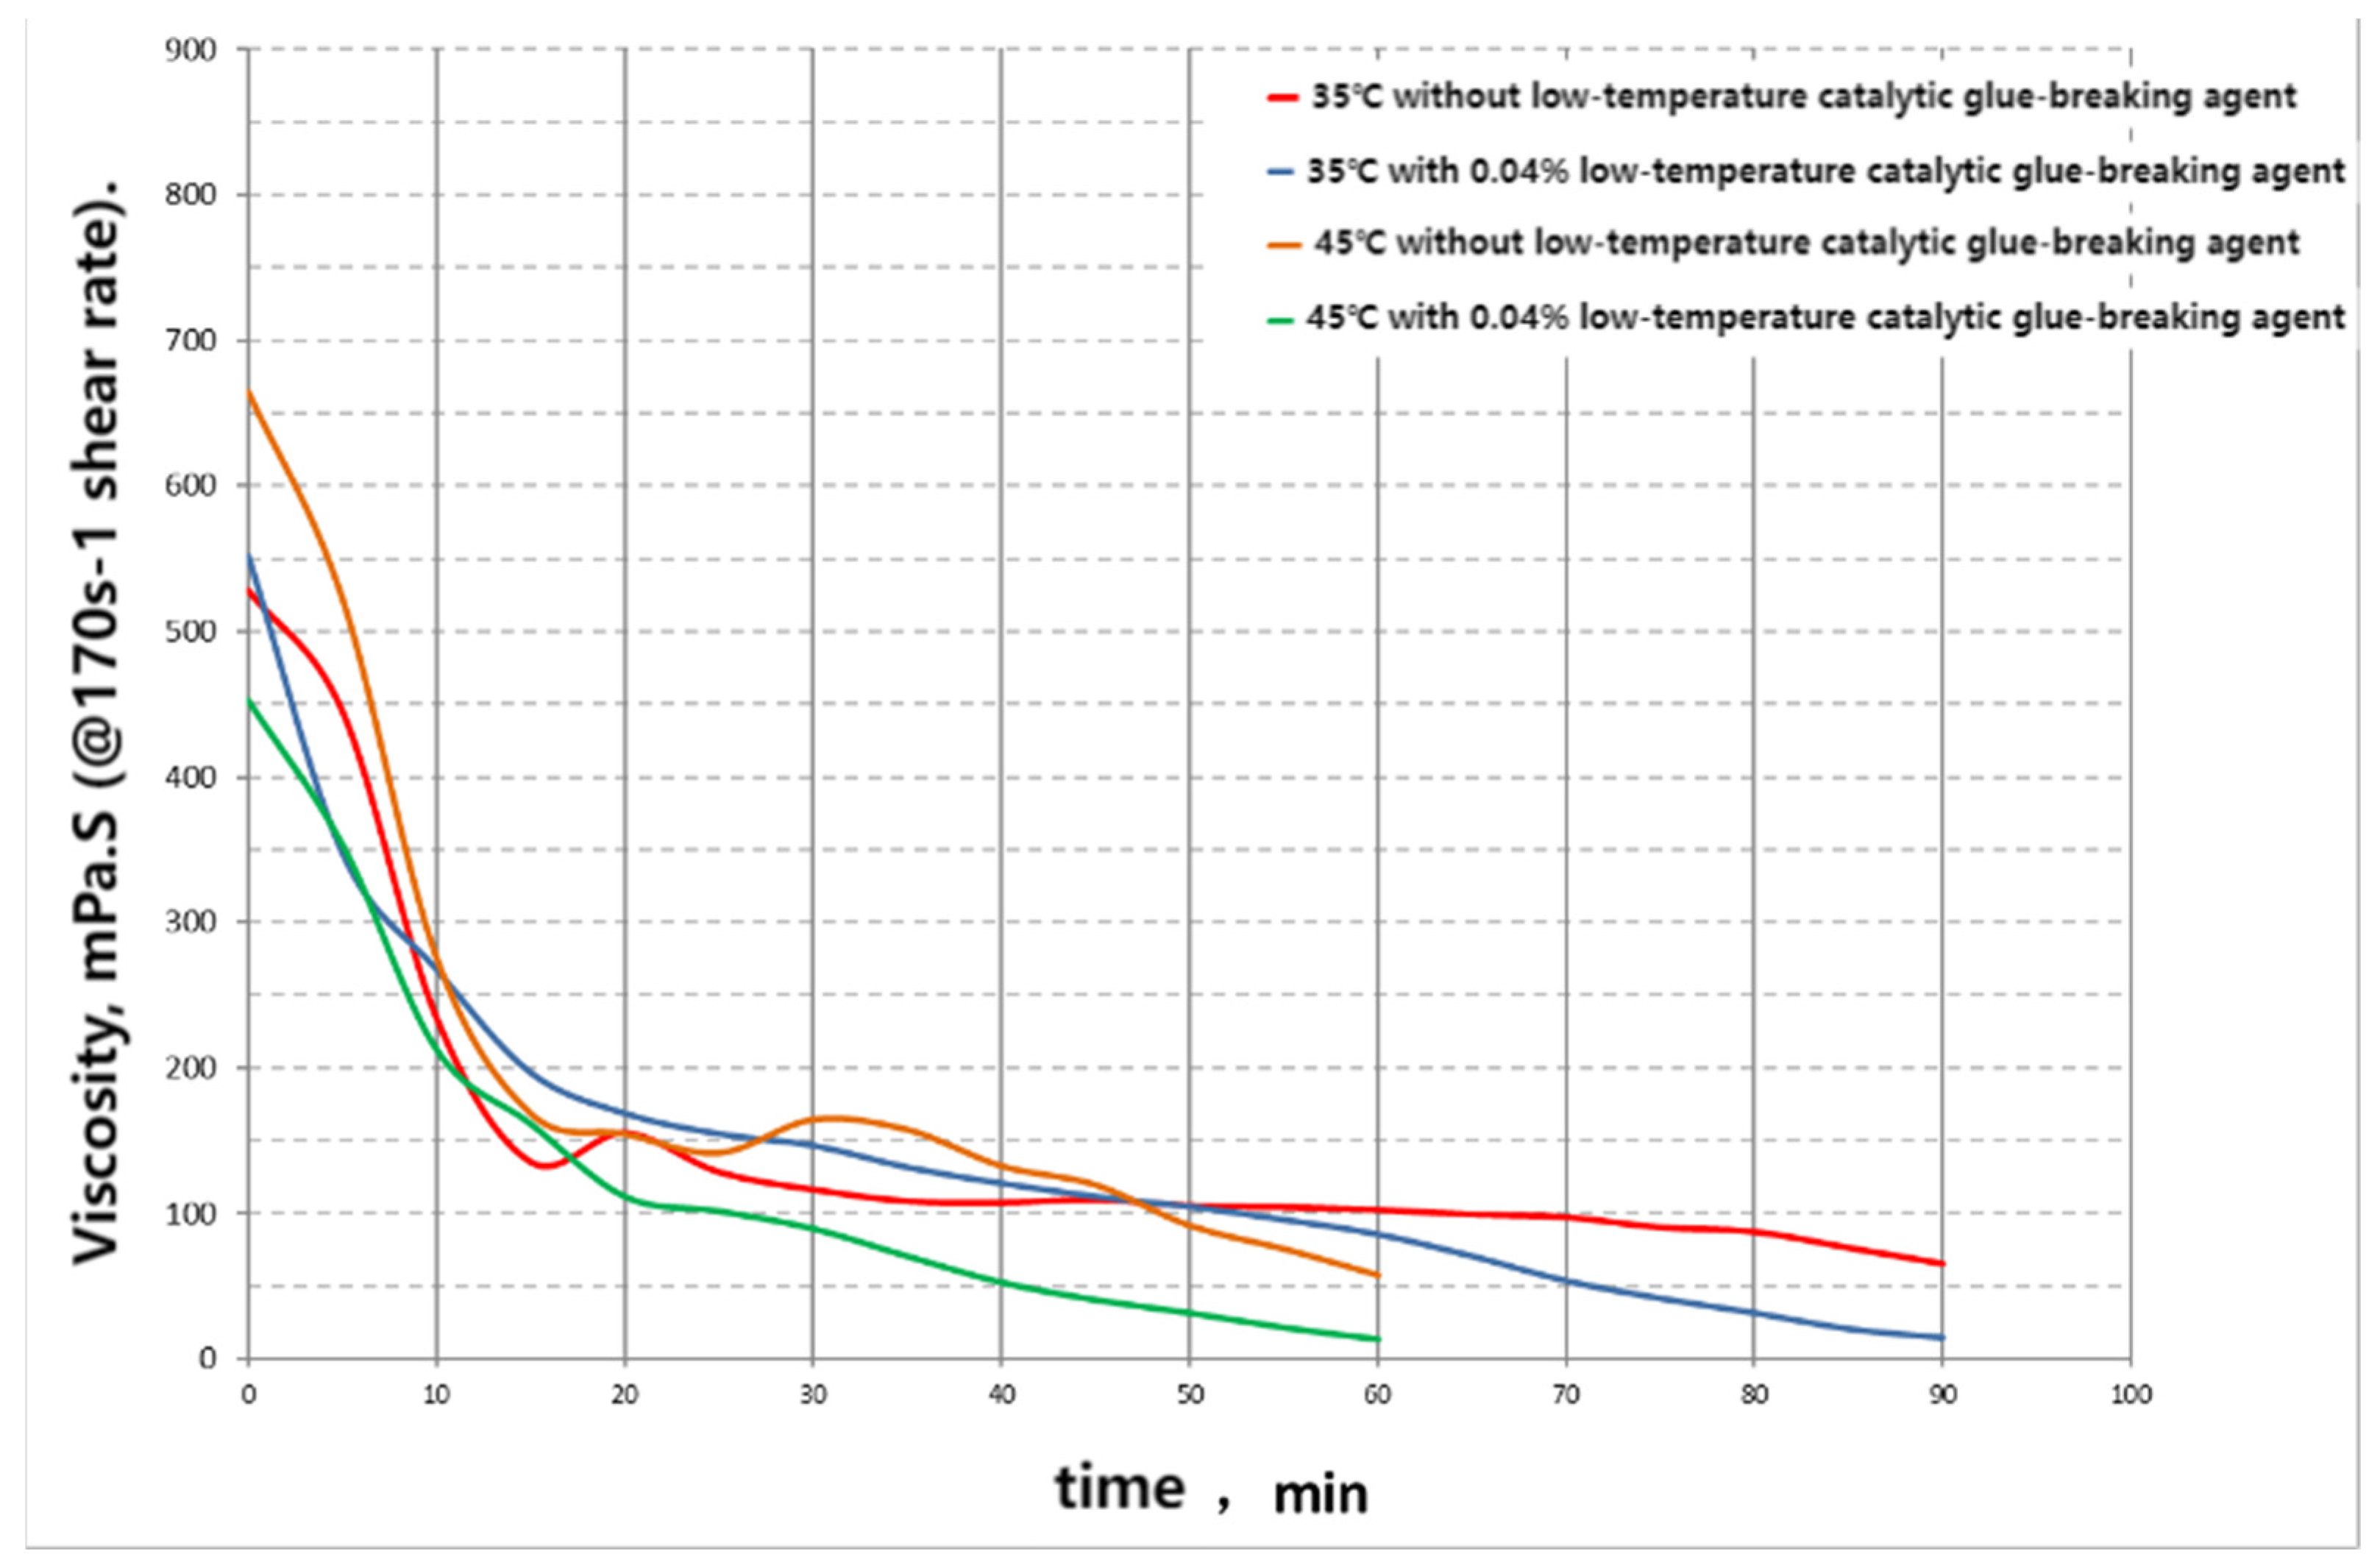
3. Comparison of the Application of Conventional Gel-Breakers and Bio-Enzymatic Gel-Breakers in the Pre-Existing Period

For the domestic mainstream use of ammonium persulfate oxidation gel breakers—the mechanism for the strong oxidative peroxide to destroy the main structure of the guanidine gel polymer and the decomposition of the structural chain so as to achieve the breakage of the gel, due to its primary use of adding solid particles—the reaction rate is affected by two processes: diffusion of the oxide molecules in water after dissolution, and oxidative decomposition after collision of the oxide molecules with the long-chain guanidine gum molecules. Under the conditions of low temperatures, the above processes are relatively slow, restricting the overall reaction rate [38]. Therefore, when the ambient temperature is below 50 °C, the oxidative breaking cycle becomes relatively longer due to a significant decrease in the rate of peroxide decomposition. At present, the formation temperature of the main reservoir in the Linxing block is generally lower than 50 °C, so ammonium persulfate exhibits low breaking efficiency, leading to incomplete gel breaking, which results in extra residue of fracturing fluid and formation of secondary damage. Historical records of early development in the block show that some wells do have high viscosity of flowback fluids, so the fracturing construction in this block should focus on the effectiveness of the fracturing fluid breaking to ensure a good fracturing effect and avoid reservoir damage.
Figure 1 compares the dynamic gel-breaking effect of the two low-temperature states of the system in the block with or without the addition of the ester low-temperature catalyst. It is based on the following formulation: 0.3% guar gum + 0.1% clay stabilizing agent A + 0.1% clay stabilizing agent C + 0.18% pH modifier + 0.015% cross-linking agent + 0.1% delayed cross-linking agent + 0.1% cleanup agent + 0.04% low-temperature gel-breaking catalyst + 0.25% ammonium persulfate. The experimental results show that the use of ester low temperature catalyst can accelerate the breaking rate of ammonium persulfate at low temperature. When the low temperature gel breaking catalyst is added, the gel breaking time is obviously shortened, but it still cannot meet the requirements of flowback after fracturing in this block, and further optimization is needed.
The breaking principle of bio-enzyme breakers is that the low activation energy transition product, formed by bio-enzyme and polysaccharide, breaks the glycosidic bond of the polymer, while the bio-enzyme itself is not consumed by the breaking process. It can be continuously reacted, so that the fracturing fluid can further continue to break the gel at low temperature for a short period of time. Thus, the length of the guanidine gel molecular chain can be greatly reduced, reducing the molecular weight, realizing the complete breaking of the gel, and reducing the damage of the fracturing fluid to the ground layer to a great extent. Compared with oxidative breakers, the optimal temperature range of bio-enzyme is 30–80 °C, which makes breakage more efficient at low temperature. Many basic experiments were carried out to investigate the effectiveness of this bio-enzyme gel breaker, and the results demonstrated the effectiveness of the bio-enzyme gel breaker [7]. Table 6 compares the results of static gel breaking after adopting the bio-enzyme gel breaker; the specific formula is as follows below.
Formulation A, i.e., single oxidative gel breaker formulation: 0.3% guar gum + 0.1% clay stabilizing agent A + 0.1% clay stabilizing agent C + 0.18% pH adjuster + 0.015% crosslinker + 0.1% delayed crosslinker + 0.1% cleanup agent + 0.25% ammonium persulphate.
Formulation B, adding low temperature catalytic gel breaker formulation: 0.3% guanidine gel + 0.1% clay stabilizing agent A + 0.1% clay stabilizing agent C + 0.18% pH adjuster + 0.015% crosslinking agent + 0.1% delayed crosslinking agent + 0.1% cleanup agent + 0.25% ammonium persulphate + 0.04% low-temperature catalytic gel breaker.
Formulation C, with bio-enzyme gel breaker formulation: 0.3% guanidine gum + 0.1% clay stabilizing agent A + 0.1% clay stabilizing agent C + 0.18% pH adjuster + 0.015% crosslinking agent + 0.1% delayed crosslinking agent + 0.1% cleanup agent + 0.25% ammonium persulfate + 0.003% bio-enzyme.
Formulation D, with the addition of both a bio-enzyme breaker and a low-temperature catalytic breaker formulation: 0.3% guanidine gum + 0.1% clay stabilizing agent A + 0.1% clay stabilizing agent C + 0.18% pH adjuster + 0.015% crosslinker + 0.1% delayed crosslinker + 0.1% cleanup agent + 0.25% ammonium persulfate + 0.04% low-temperature catalytic breaker + 0.003% bio-enzyme.
The prepared fracturing fluid was placed in a constant temperature water bath at 40 °C for static breaking experiments; the experimental results are shown in Table 6. The results of static experiments show that the low-temperature catalyst can accelerate the breaking reaction, the biological enzyme can further improve the breaking speed and thoroughness, and at the same time, the addition of biological enzyme and low-temperature catalyst can maximally ensure a reasonable breaking time to help the rapid flowback of post-fracturing, while improving the thoroughness of breaking.

4. Optimization of Gum Breaking Procedure Based on Simulation of Temperature Recovery of Incoming Fluids

The above experimental results successfully verified that the gel breaking effect of biological enzymes under low temperature and static conditions was enhanced. The optimization of gel breaker was based on the temperature environment of fluid backflow at each stage (i.e., based on the end-temperature of the fluid prior to the fluid flowback). However, in the process of practical application, as the water used for fracturing fluid is mostly extracted from natural water bodies such as rivers, its water temperature is obviously lower than the reservoir temperature. Additionally, it is easily affected by the climate, the temperature of the water used for fluid dispensing is occasionally close to 0 °C during the construction period in winter. During the fracturing construction process, the fracturing fluid at low temperature continuously enters the reservoir. This causes heat conduction, leading to a local decrease in the reservoir temperature and a gradual increase in the temperature of the fracturing fluid. After the completion of construction, it takes a certain amount of time for the reservoir and the fracturing fluid to gradually return to the original reservoir temperature level. Generally, the pump stopping time in the block is designed as 1 h. During the whole process of stopping the pump, the temperature of the fluid is constantly changing, and there is a certain difference between the average temperature environment and the reservoir temperature or the fluid temperature during backflow. Meanwhile, in the process of temperature recovery, the bioactivity of the bio-enzymatic gel-breaker will be changed due to the influence of the temperature. Therefore, the breakage time required for each stage of fracturing fluid will differ from the experimental breakage time. This is because the experimental breakage time is tested at a constant reservoir temperature or based on the temperature at the time of flowback.
To ensure that the fracturing fluid fully breaks the gel within the designated shut-in time, this paper introduced an optimization method for bio-enzyme-enhanced breaking technology based on the fluid’s average temperature. This approach involves refining the simulation of temperature recovery for both the formation and the fracturing fluid by modeling the heat exchange under varying temperature conditions. The simulation calculates the average fluid temperatures at different stages after its introduction into the well. These simulated temperature data are then used to align the fluid behavior at each stage with the corresponding breakage requirements. Using this temperature recovery simulation as a foundation, the breakage time range for each stage of the fluid is determined. A stepwise matching process for bio-enzyme breakage agents is then conducted to optimize the dosage of bio-enzymes under different temperature combinations. This ensures that the breakage time is optimized for each stage, achieving the desired results efficiently.

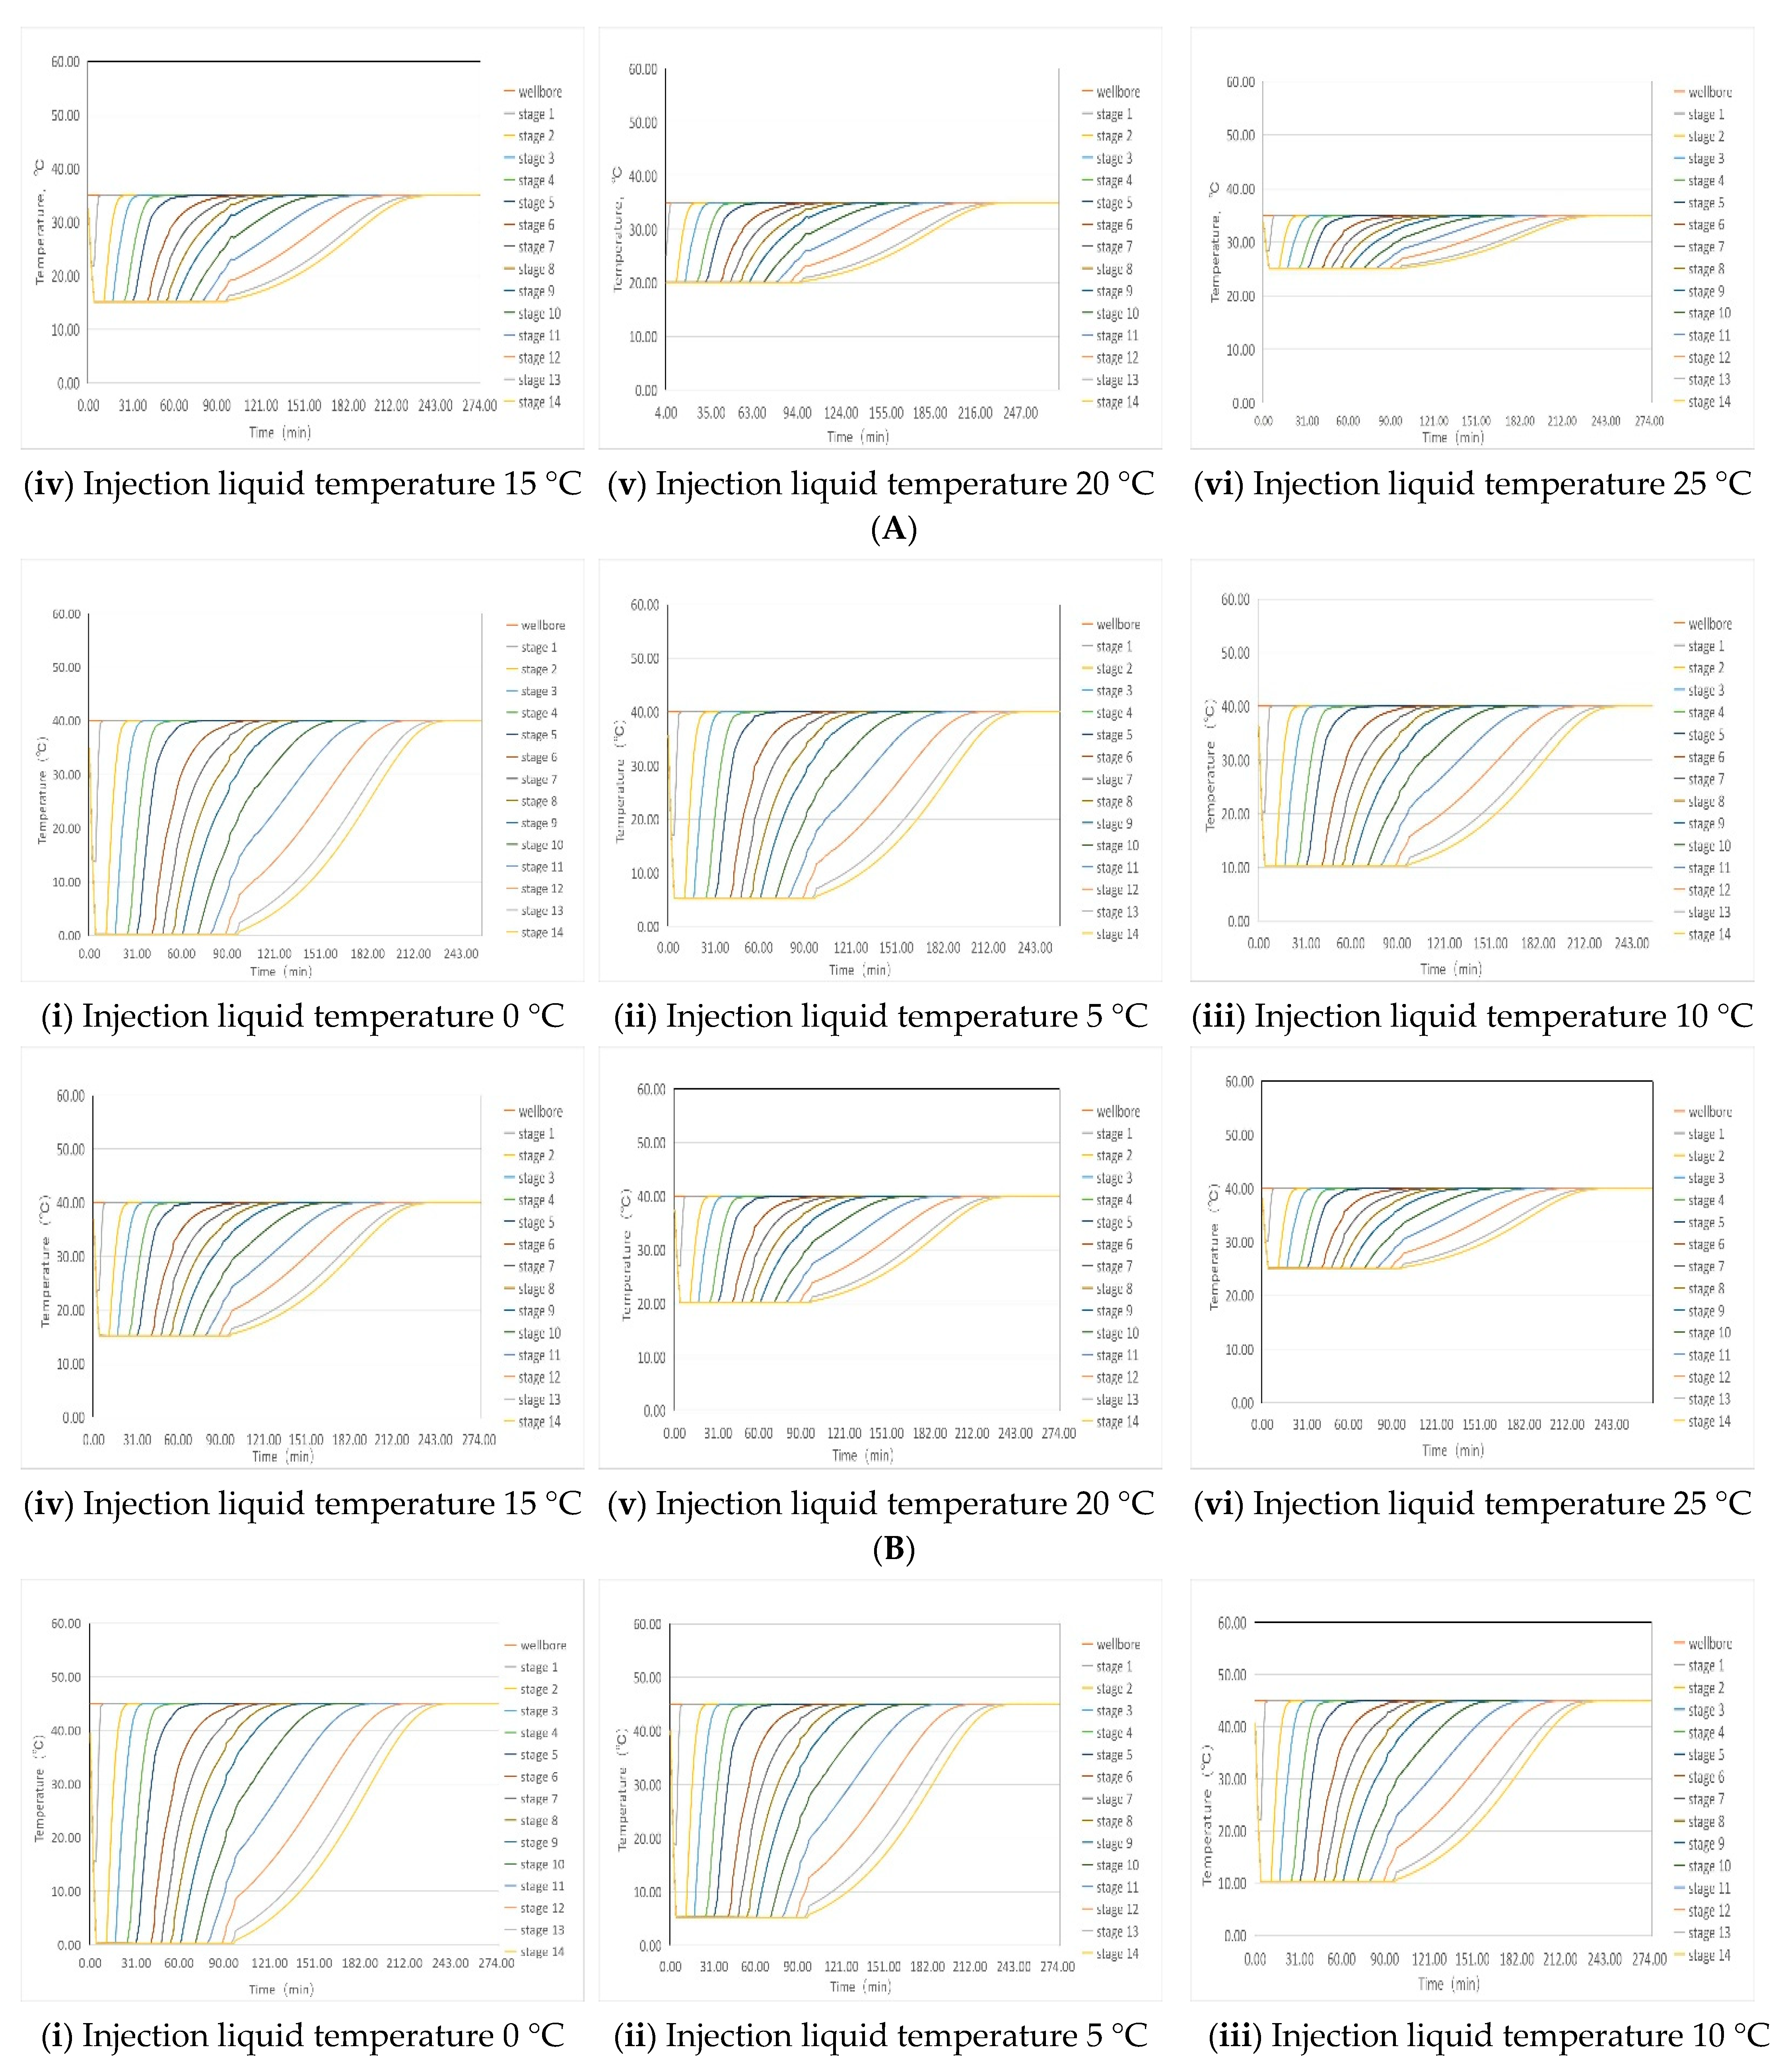
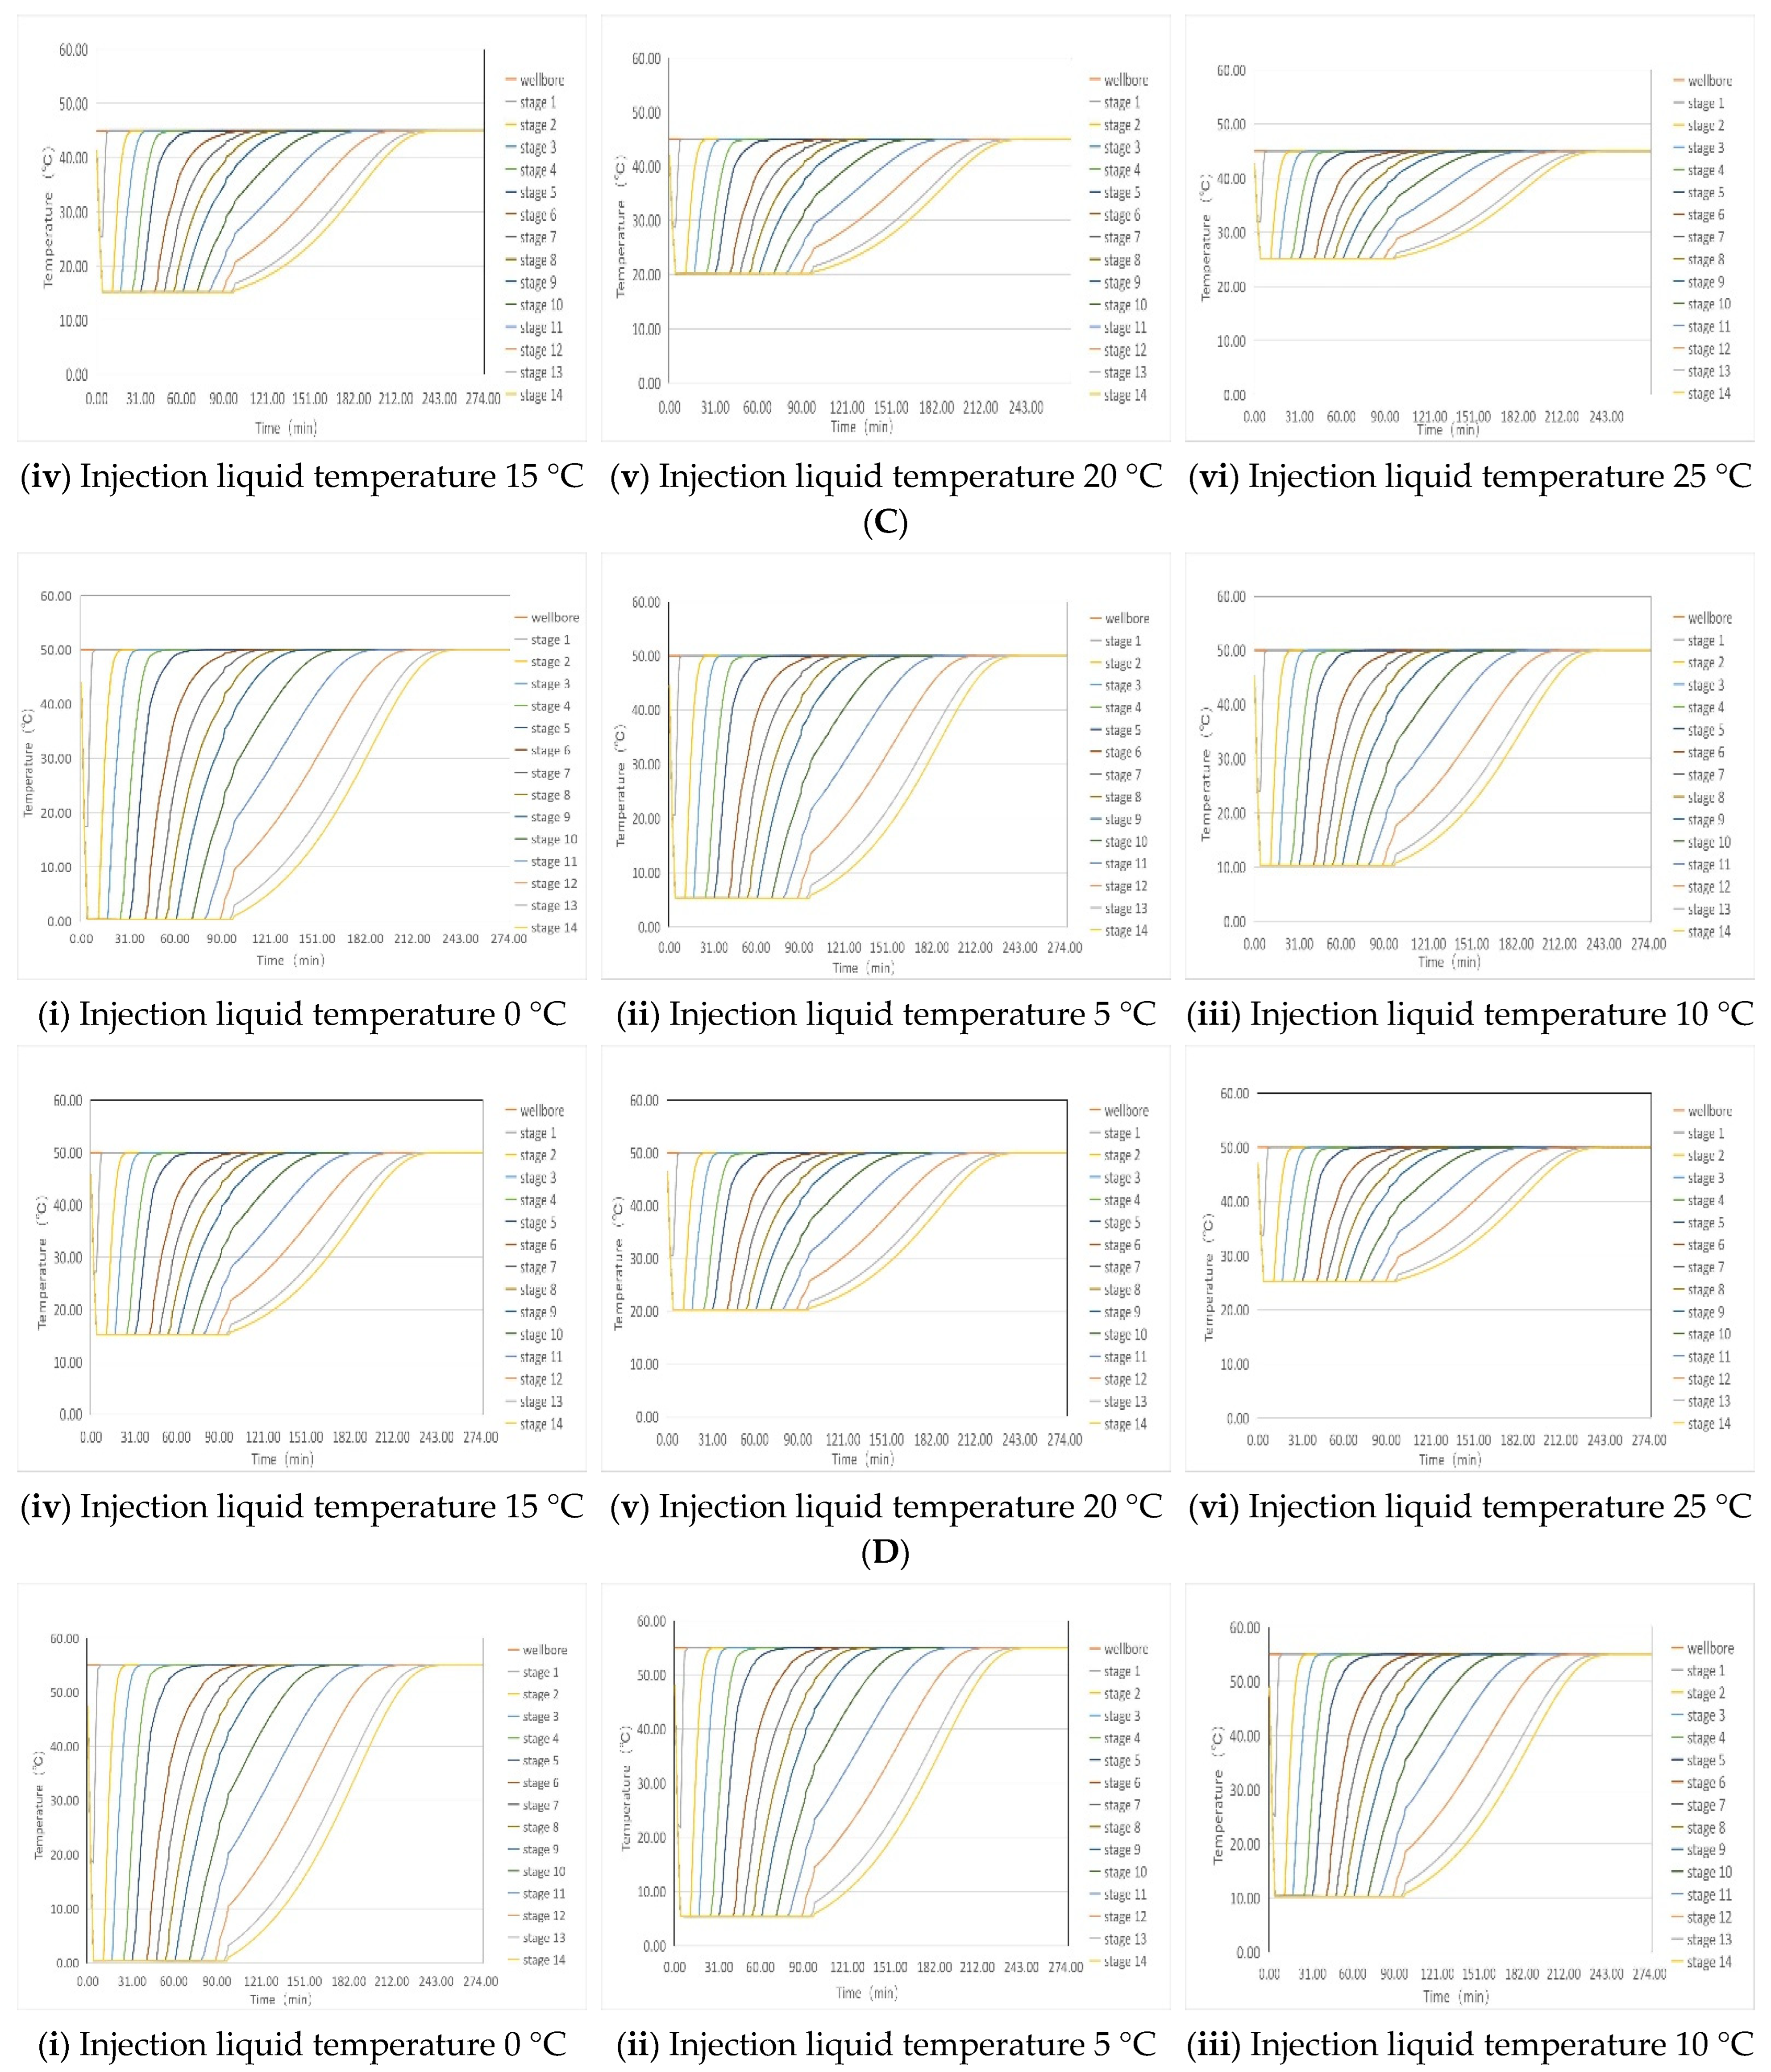
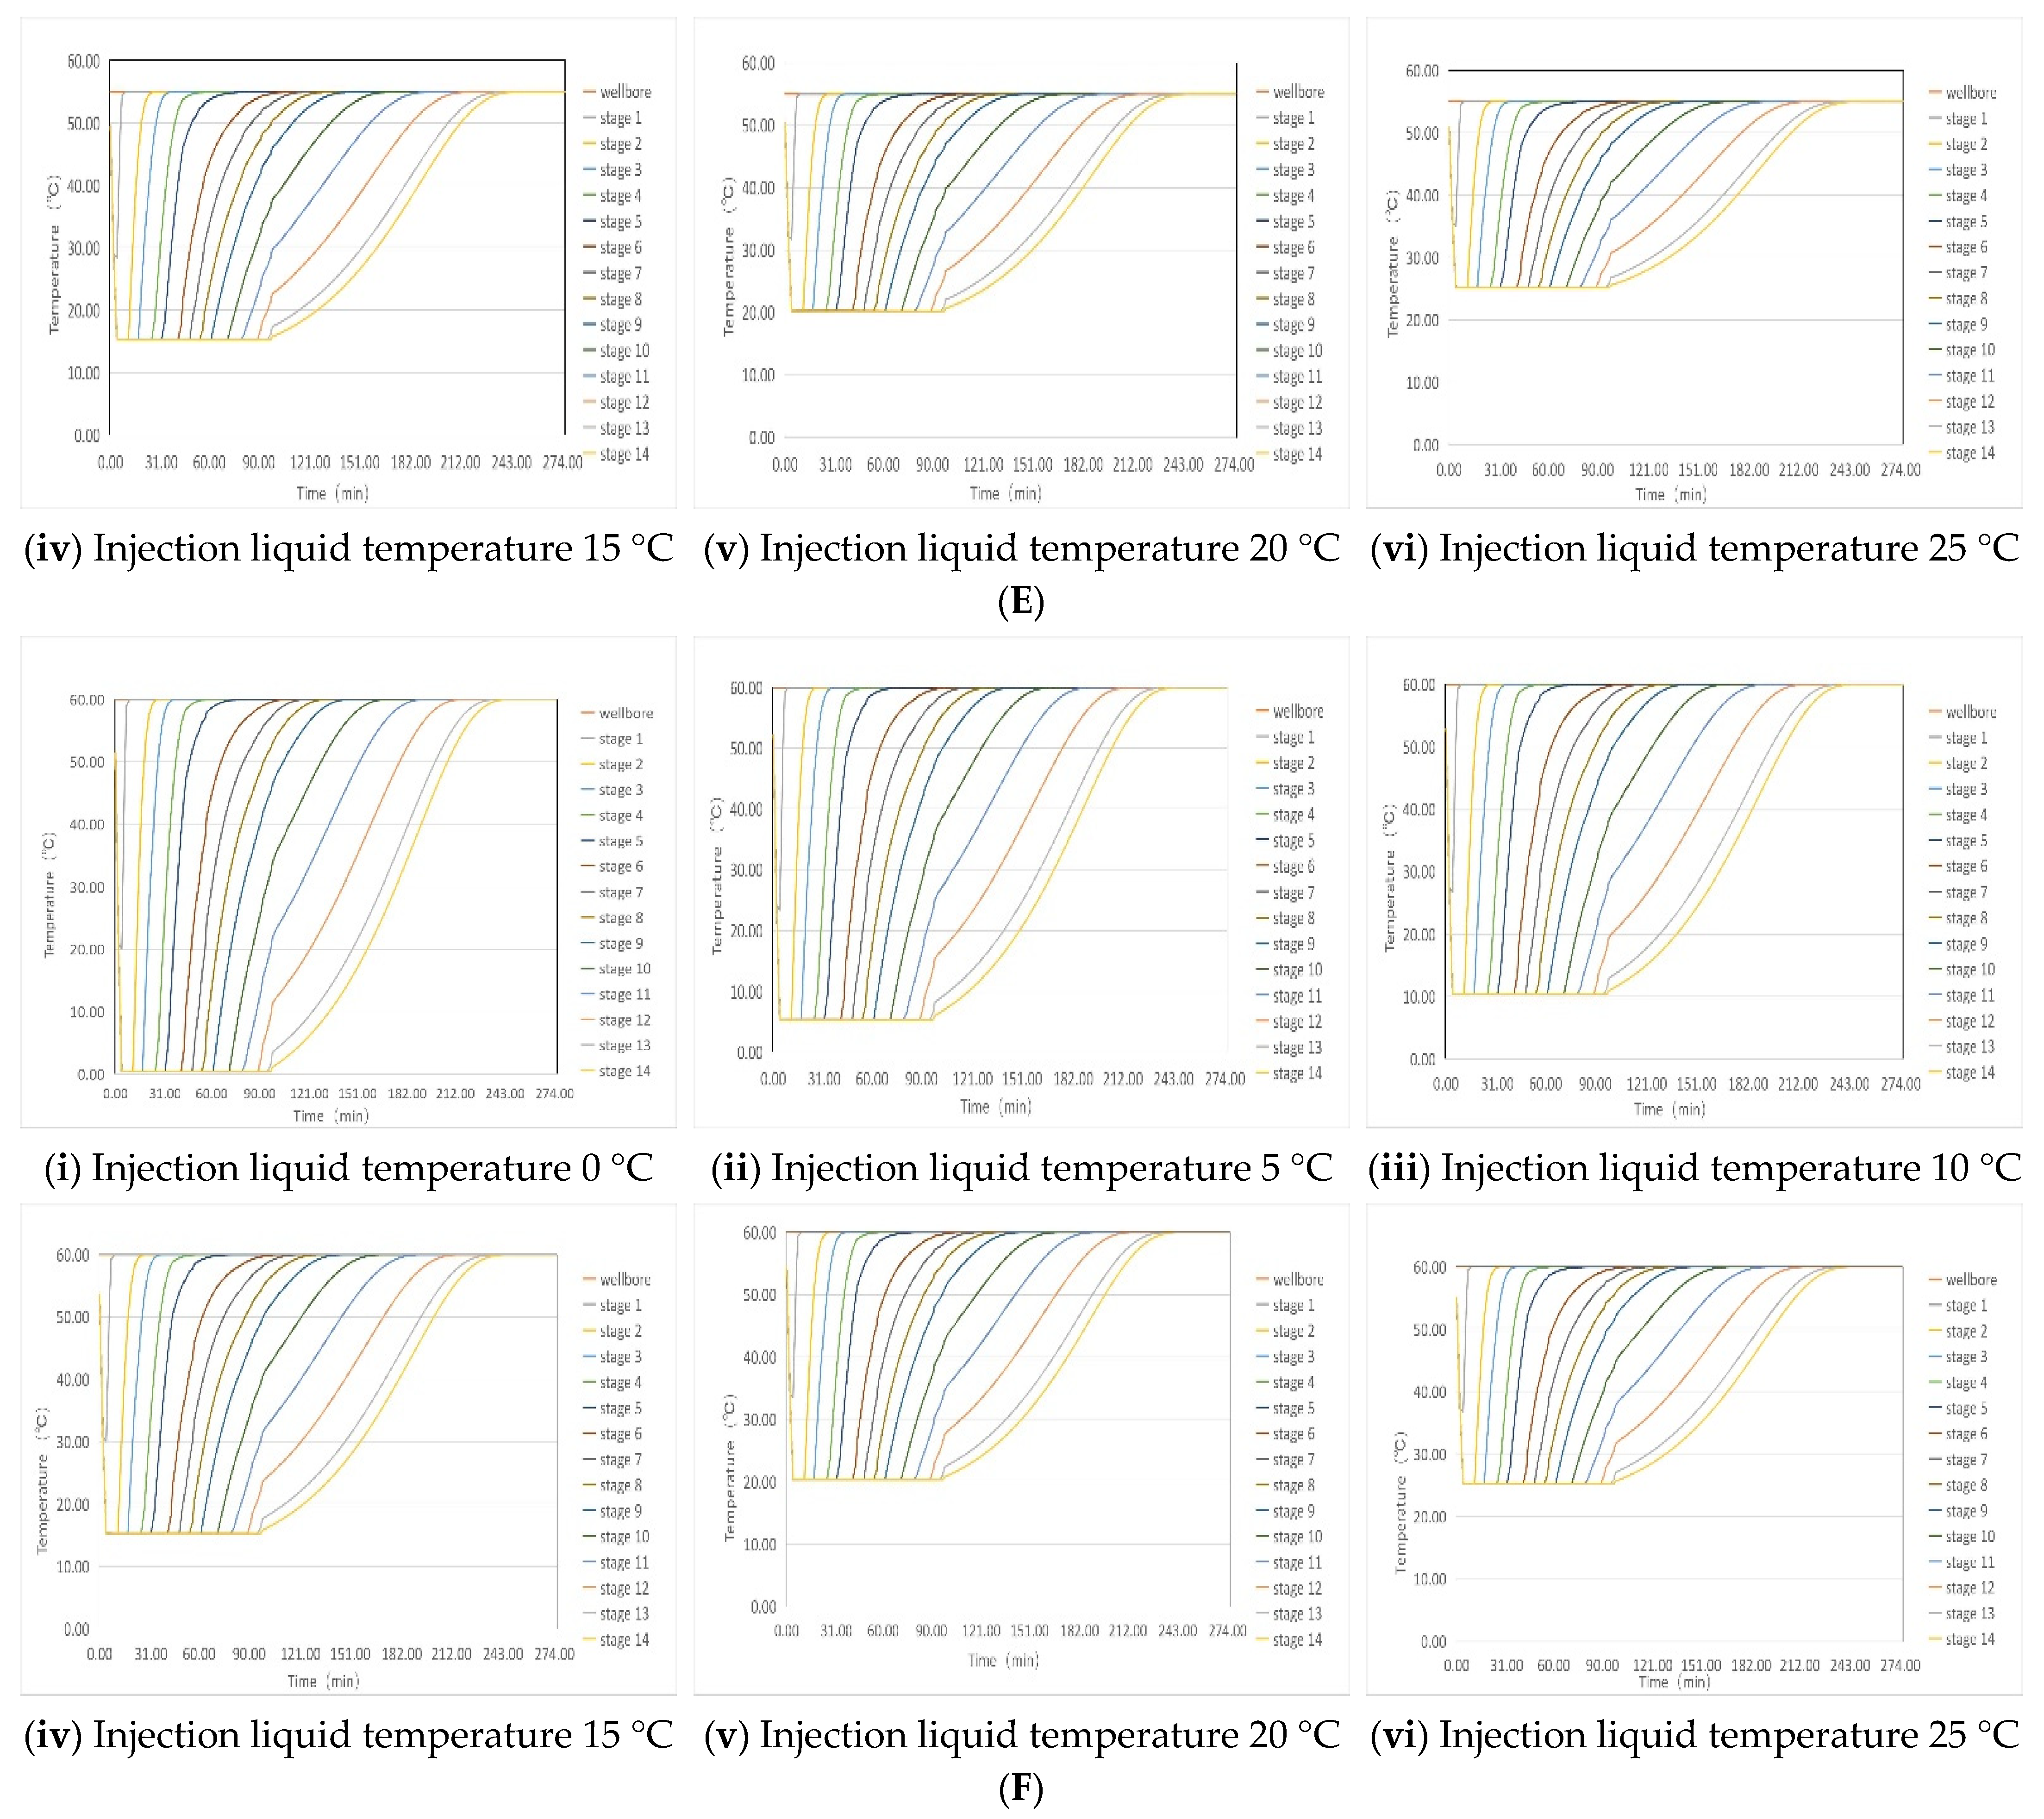
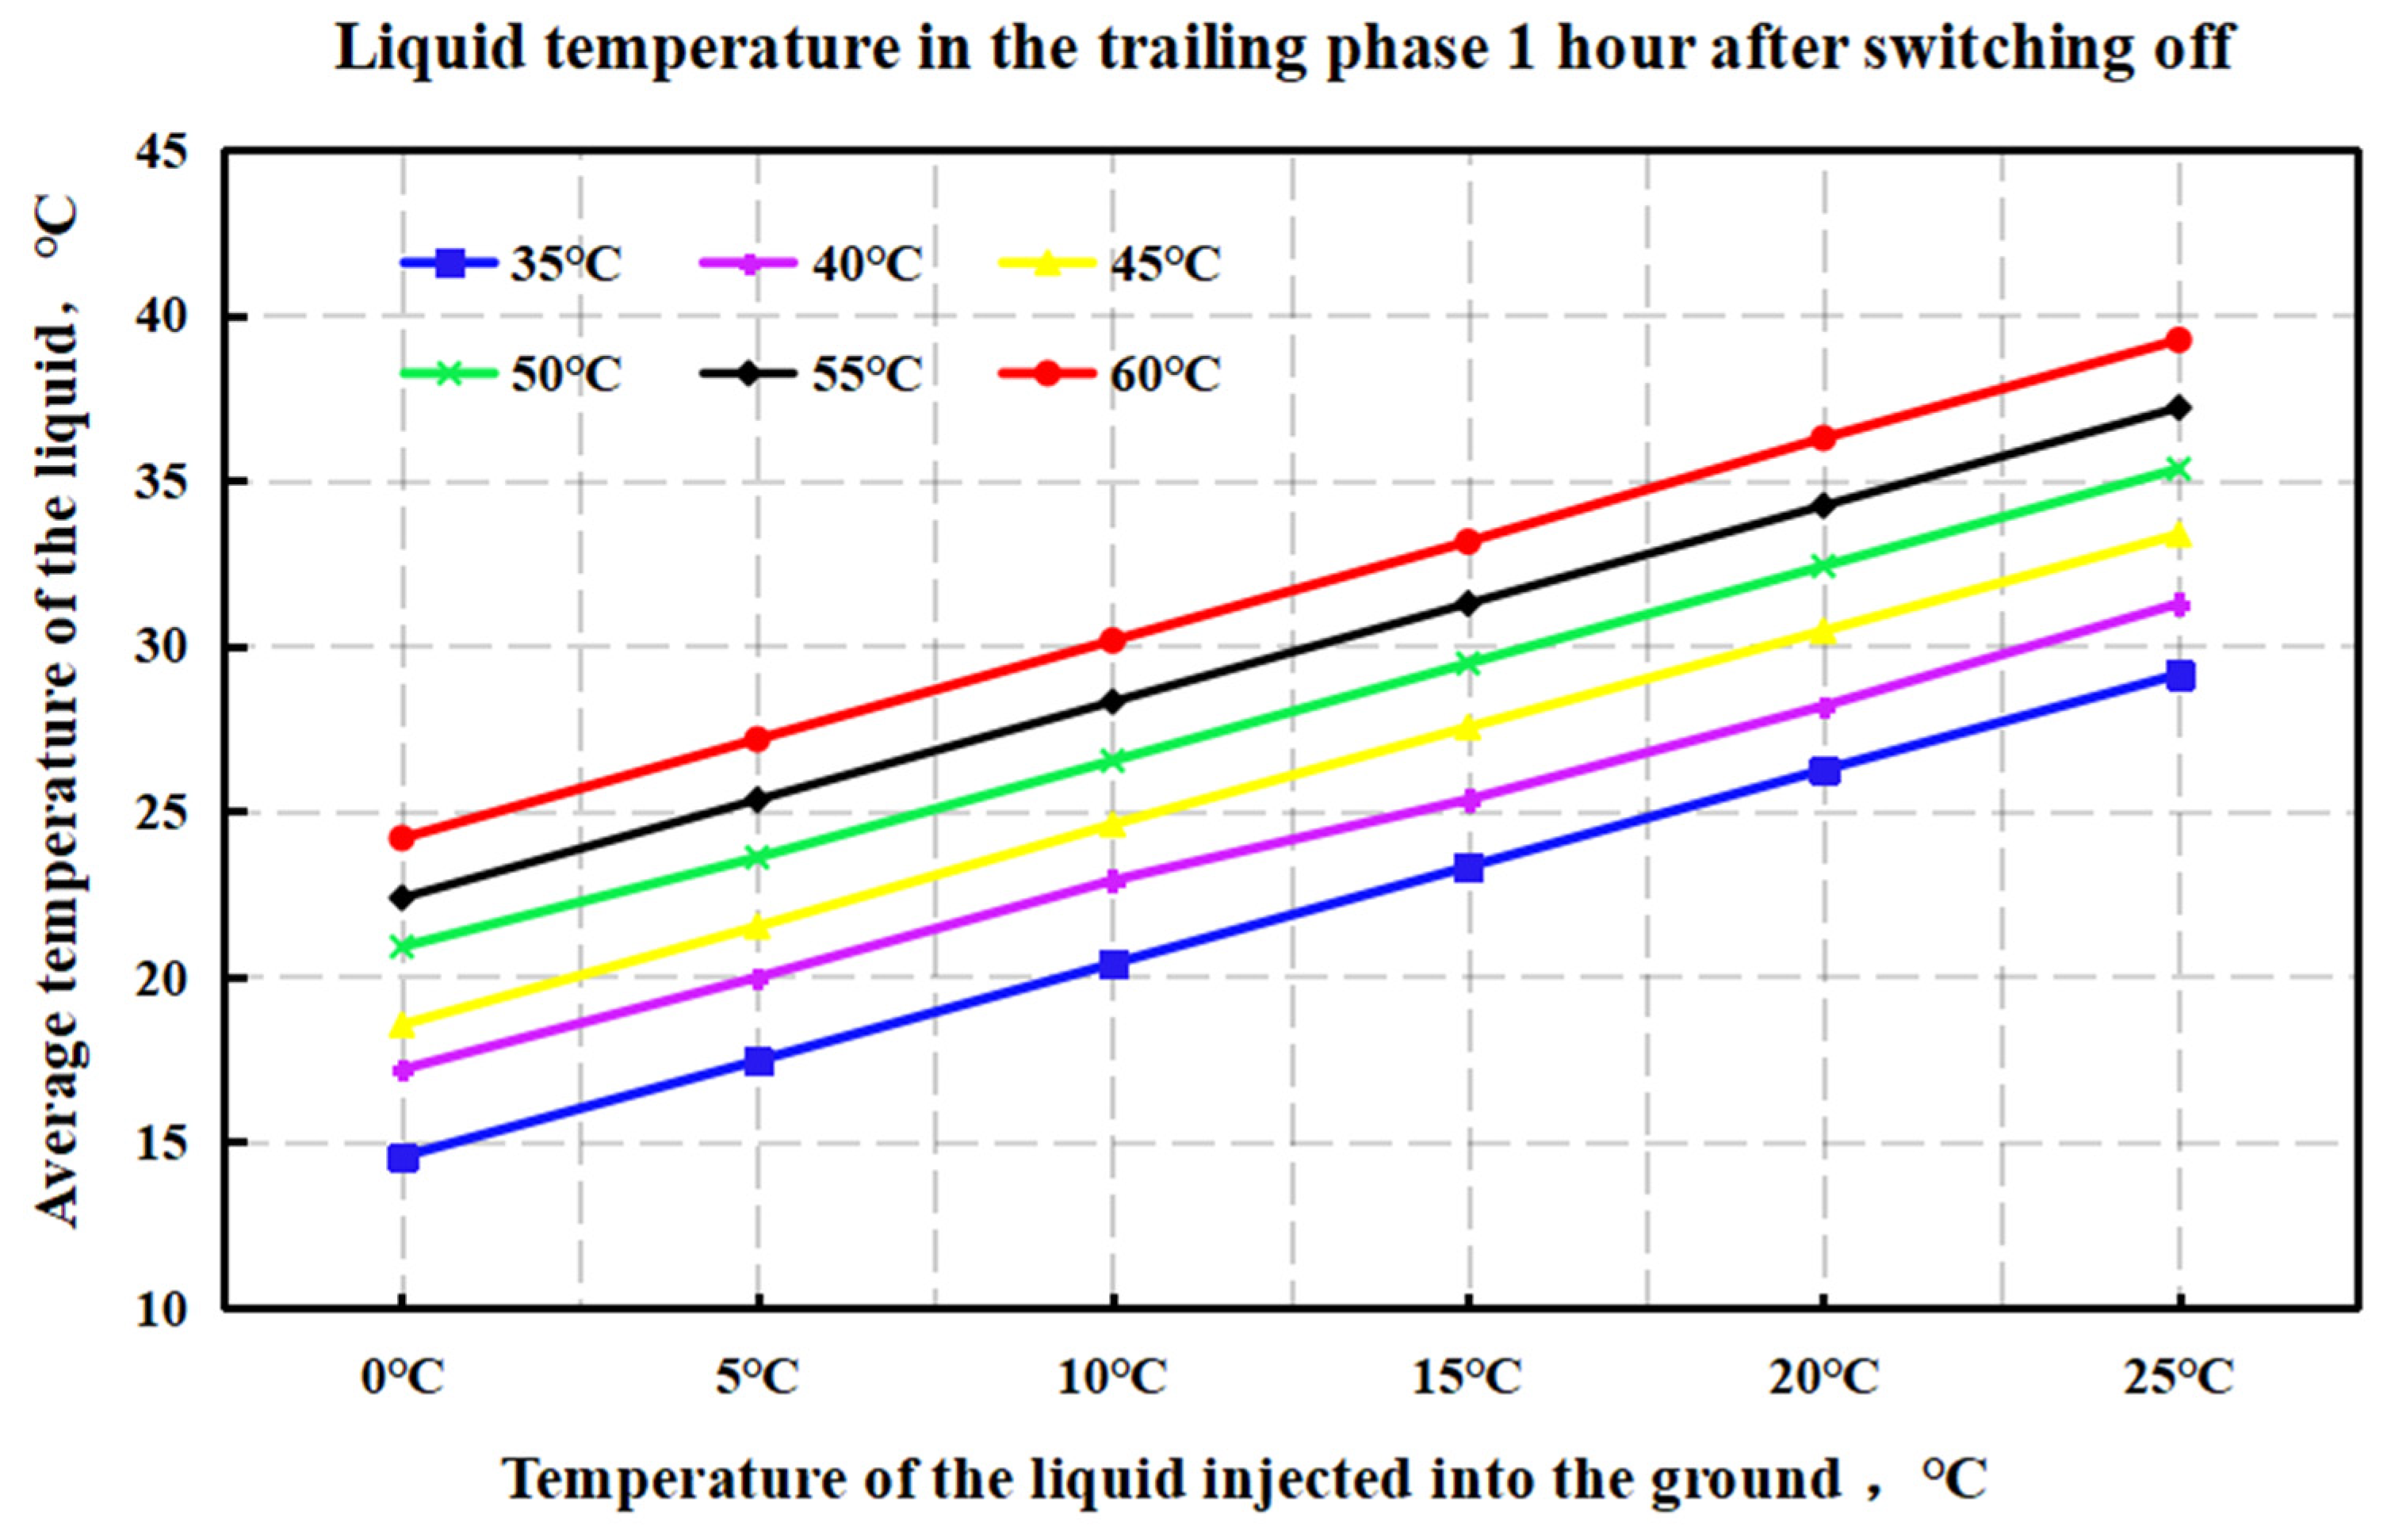
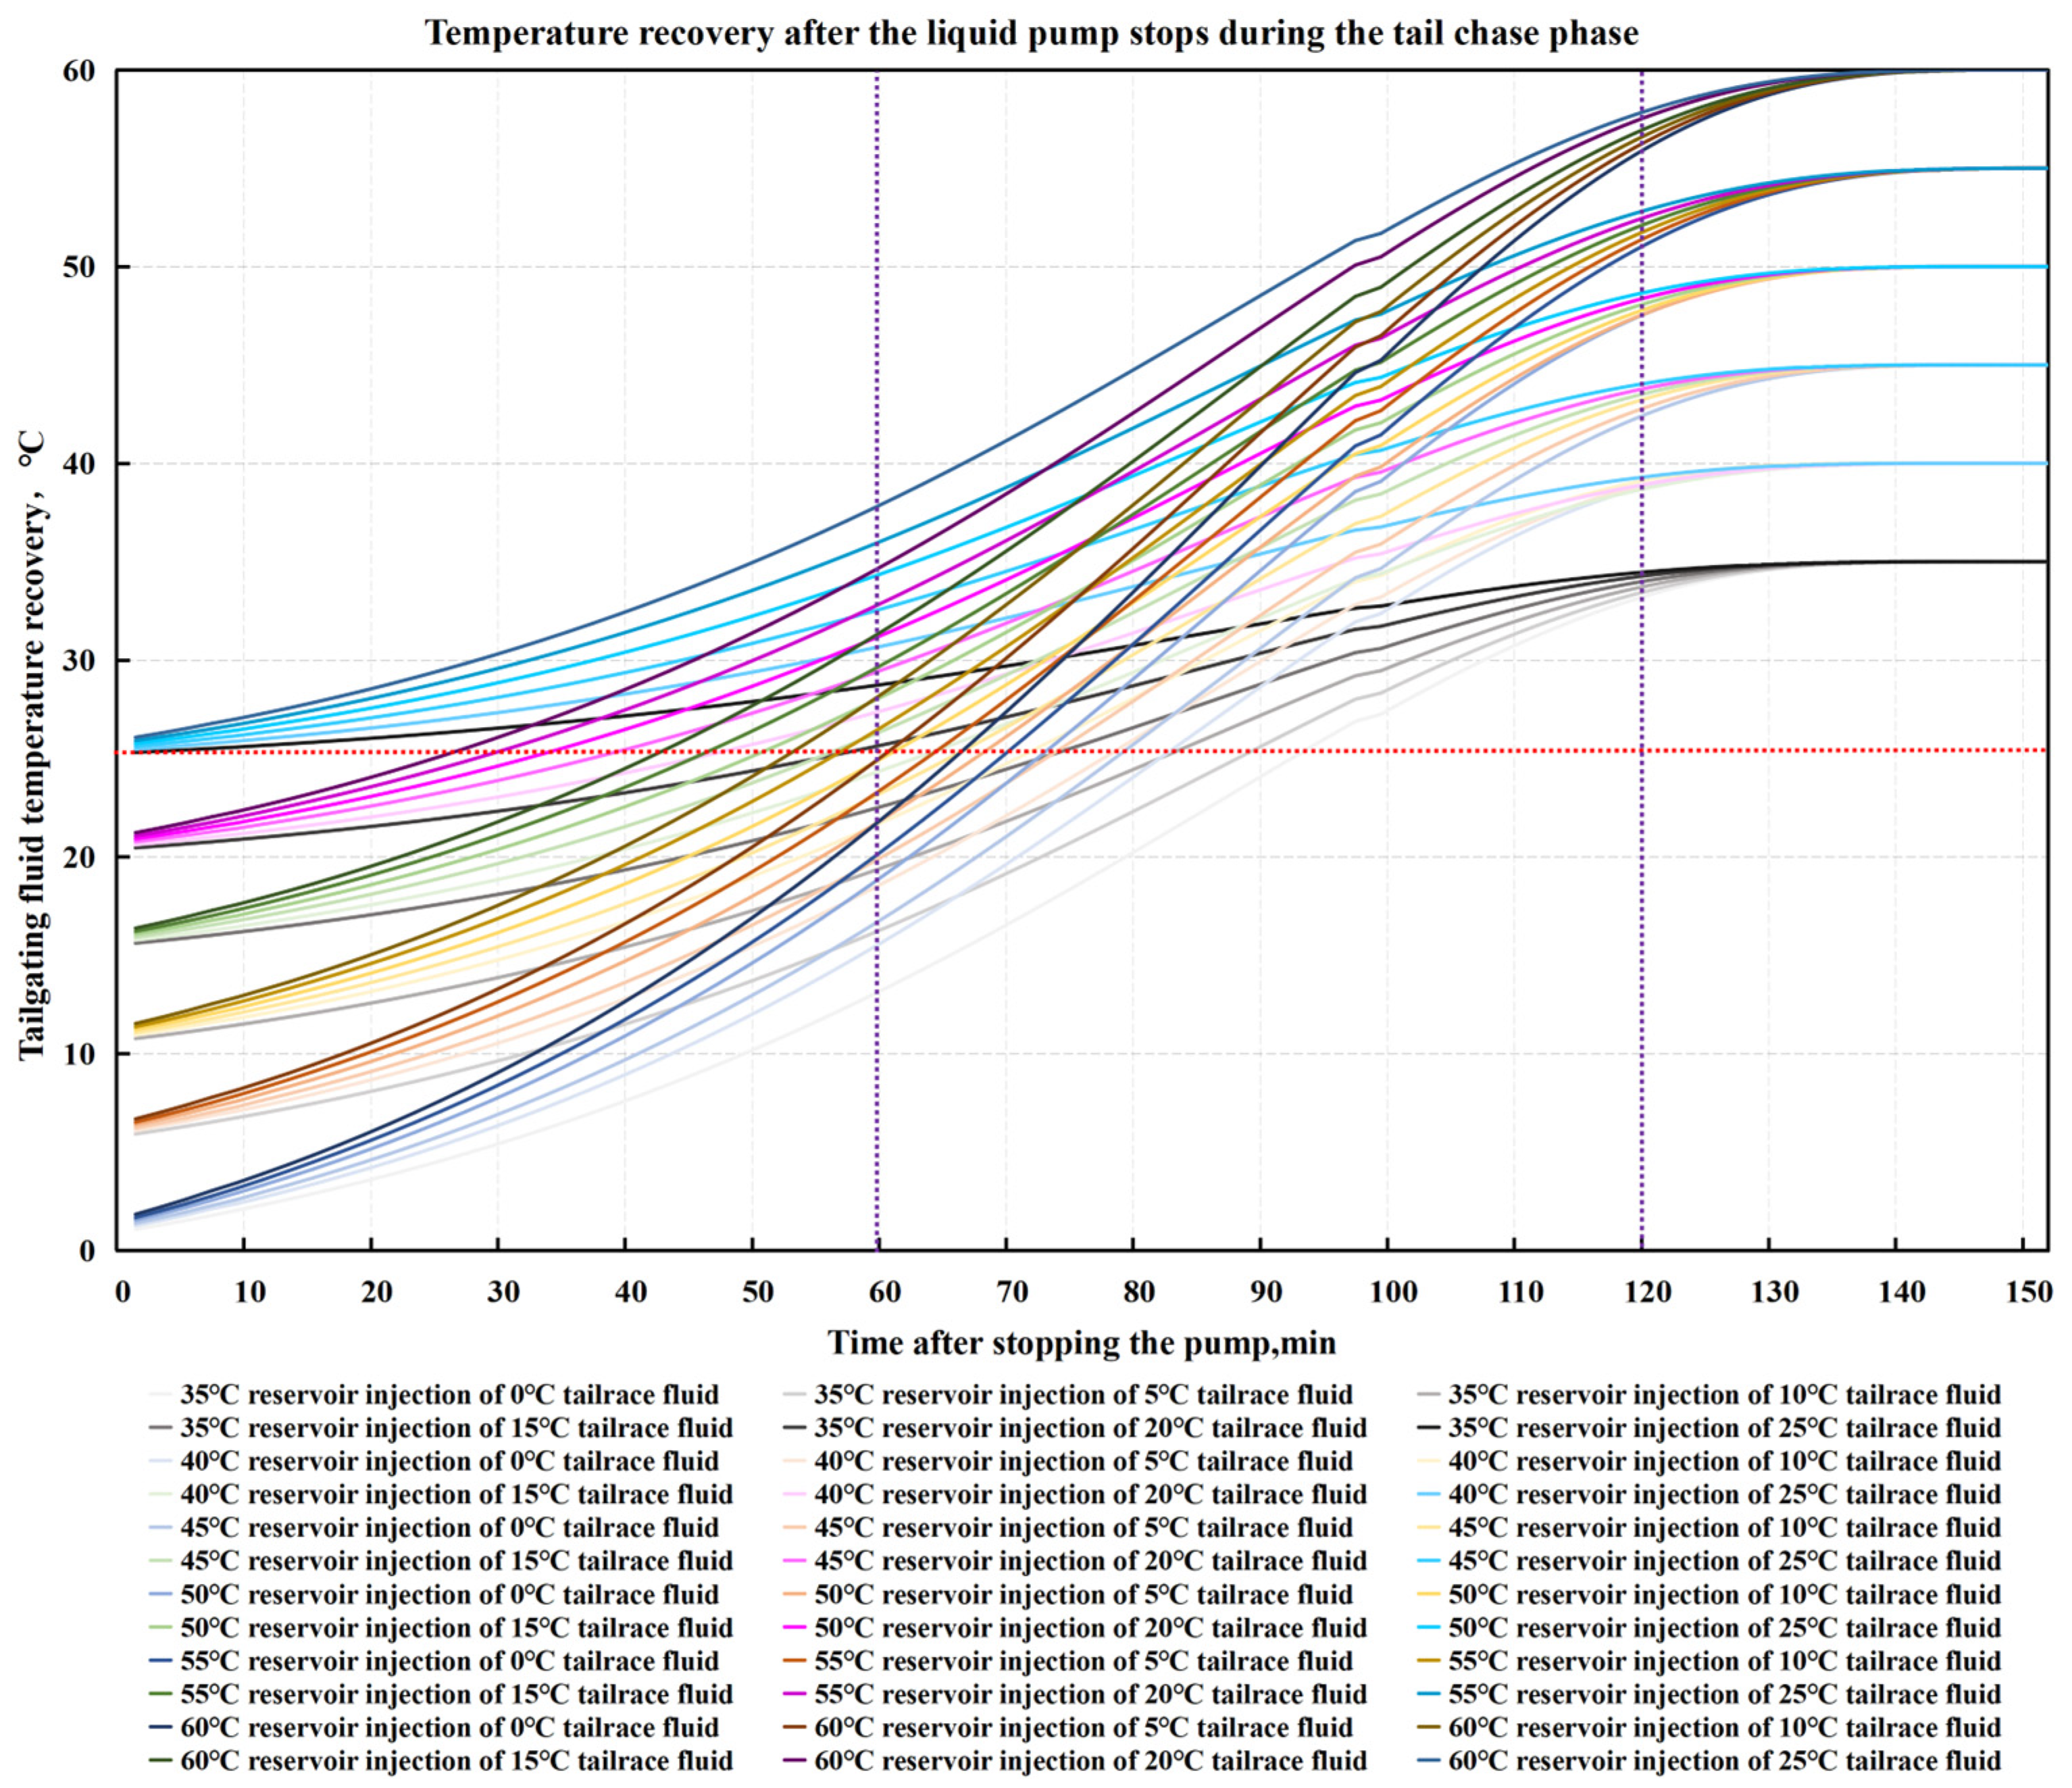
4.1. Simulation of Liquid Temperature Recovery

According to the construction experience of the Linxing block, the average amount of fluid used in a single stage of construction in the block is about 300–350 m3, and the amount of proppant used is about 40 m3. The injection of fracturing fluids with different surface temperatures (0 °C, 5 °C, 10 °C, 15 °C, 20 °C, 25 °C) at different reservoir temperatures (35 °C, 40 °C, 45 °C, 50 °C, 55 °C, 60 °C) was simulated by Meyer Fracturing Software (MFrac 2012). The recovery of the fluid temperature at each stage was simulated as shown in Figure 2 and Figure 3. In addition, Figure 4 compares the temperature recovery of 1 h after closing the well in the tail water period under different reservoir temperatures.
According to the simulation results, the higher the reservoir temperature, the faster is the temperature recovery rate. The greater the difference between the reservoir temperature and the injected liquid temperature, the longer is the temperature recovery time. The temperature recovery speed of the liquid injected in the pre-construction stage is significantly faster than that of the liquid injected in the post-construction stage. Additionally, the temperature recovery speed of the liquid in the tailrace stage, which has a high sand ratio, is the slowest among all stages. Therefore, the temperature change in this stage has the greatest impact on the performance of the liquid in breaking the gel. At the same time, the return stage will prioritize the return of the liquid in the tailing stage. As a result, optimizing the breaking procedure in the tailing stage becomes the most crucial part of the overall optimization of the bio-enzymatic enhancement process.
Under different injected liquid temperatures and reservoir temperatures, the liquid of each stage is constantly in the process of heat exchange during the pumping process, so the temperature is constantly changing. To simplify the process of analyzing the breaking rate of the liquid under variable temperature conditions, the average temperature of each phase of the liquid is considered. This temperature is measured during the time period from when the liquid enters the well until the beginning of its return. The average temperature is then taken as the benchmark for the breaking temperature of the liquid. As a result, the dynamic temperature breaking process is simplified to a dynamic constant-temperature breaking process for analysis. Based on the simulation results, compared to the liquid temperature benchmark before returning to discharge, which was used for optimizing the initial breaking procedure, the distribution of the liquid end temperature at each stage is shown in Figure 5 and Figure 6. The liquid and temperature at each stage is significantly higher than the average liquid temperature. Under a certain reservoir temperature, the liquids in several stages of the construction (e.g., Stages 1–4) have temperatures that are close to both the average temperature and the end temperature of each stage. This is due to the early injection time, low stratum cooling, and prolonged heat exchange. These temperatures are all close to the reservoir temperature, and the difference between them is very small. In the middle of the construction of several liquid phases (e.g., Stages 5–7), the formation is cooled to a certain extent. The heat exchange time between the liquid and the formation is slightly shorter in this phase, and the average temperature of the liquid is lower than the temperature of the reservoir. However, the rate of temperature drop is relatively low, and due to the longer total time of the liquid entering the ground in this phase, the heat exchange is relatively more thorough, so the end temperature can still basically reach the reservoir temperature. Among several liquid phases (e.g., Stages 8–13) in the late stage of construction, after the heat exchange between the stratum with the liquid injected in the early stage, the cooling degree of this stratum is high. In addition, the heat exchange time between the liquid injected in this stage and the stratum is short, the average temperature of the liquid is obviously lower than that of the reservoir temperature, and the rate of temperature decline is higher. The difference also can be reflected in the end temperature; without sufficient time for the liquid to realize a thorough heat exchange, the temperature cannot reach the level of the reservoir temperature.
By comparing the end temperature and average temperature of the fluid at each stage, as shown in Figure 7, it can be seen that the temperature difference between the stages at the beginning of the construction is small, originating from sufficient heat exchange with the reservoir. In the middle stage of construction, the heat exchange time is prolonged due to formation cooling. The well shut-in time is sufficient to allow for an adequate heat exchange length. As a result, the difference between the average temperature and the end temperature increases, and this trend reaches its peak in the middle and late stages of construction. In the subsequent stages, the difference between the average temperature and the end temperature showed a small decrease due to slowing down of the heat exchange caused by the cooling of the bottom layer and the gradual shortening of the heat exchange time. The distribution of the difference between the average temperature and the end temperature of the fluid at each stage is significantly affected by the temperature difference between the injected fluid and the reservoir. The fluid at each stage shows basically the same temperature change behavior under a similar reservoir-fracturing fluid temperature difference. This is illustrated in Figure 8. When there is a difference between the reservoir temperature and the fracturing fluid temperature, a significant difference appears between the average fluid temperature and the end-of-construction fluid temperature in both the mid-construction and late stages. This difference increases with the rise in the reservoir-fracturing fluid temperature difference. In such a state, the fluid end temperature only represents the final temperature before the fluid is returned to the well at each stage. The average fluid temperature, on the other hand, more closely describes the complete temperature change of the fluid in the well, especially in the mid- and late periods of construction. Using the average temperature of the fluid as a baseline to describe the breakage process of the bio-enzyme gel breaker can more accurately reflect the reaction performance of the bio-enzyme throughout the entire process. This approach will guide the designer in obtaining a more optimized process for the bio-enzyme gel-breaker.

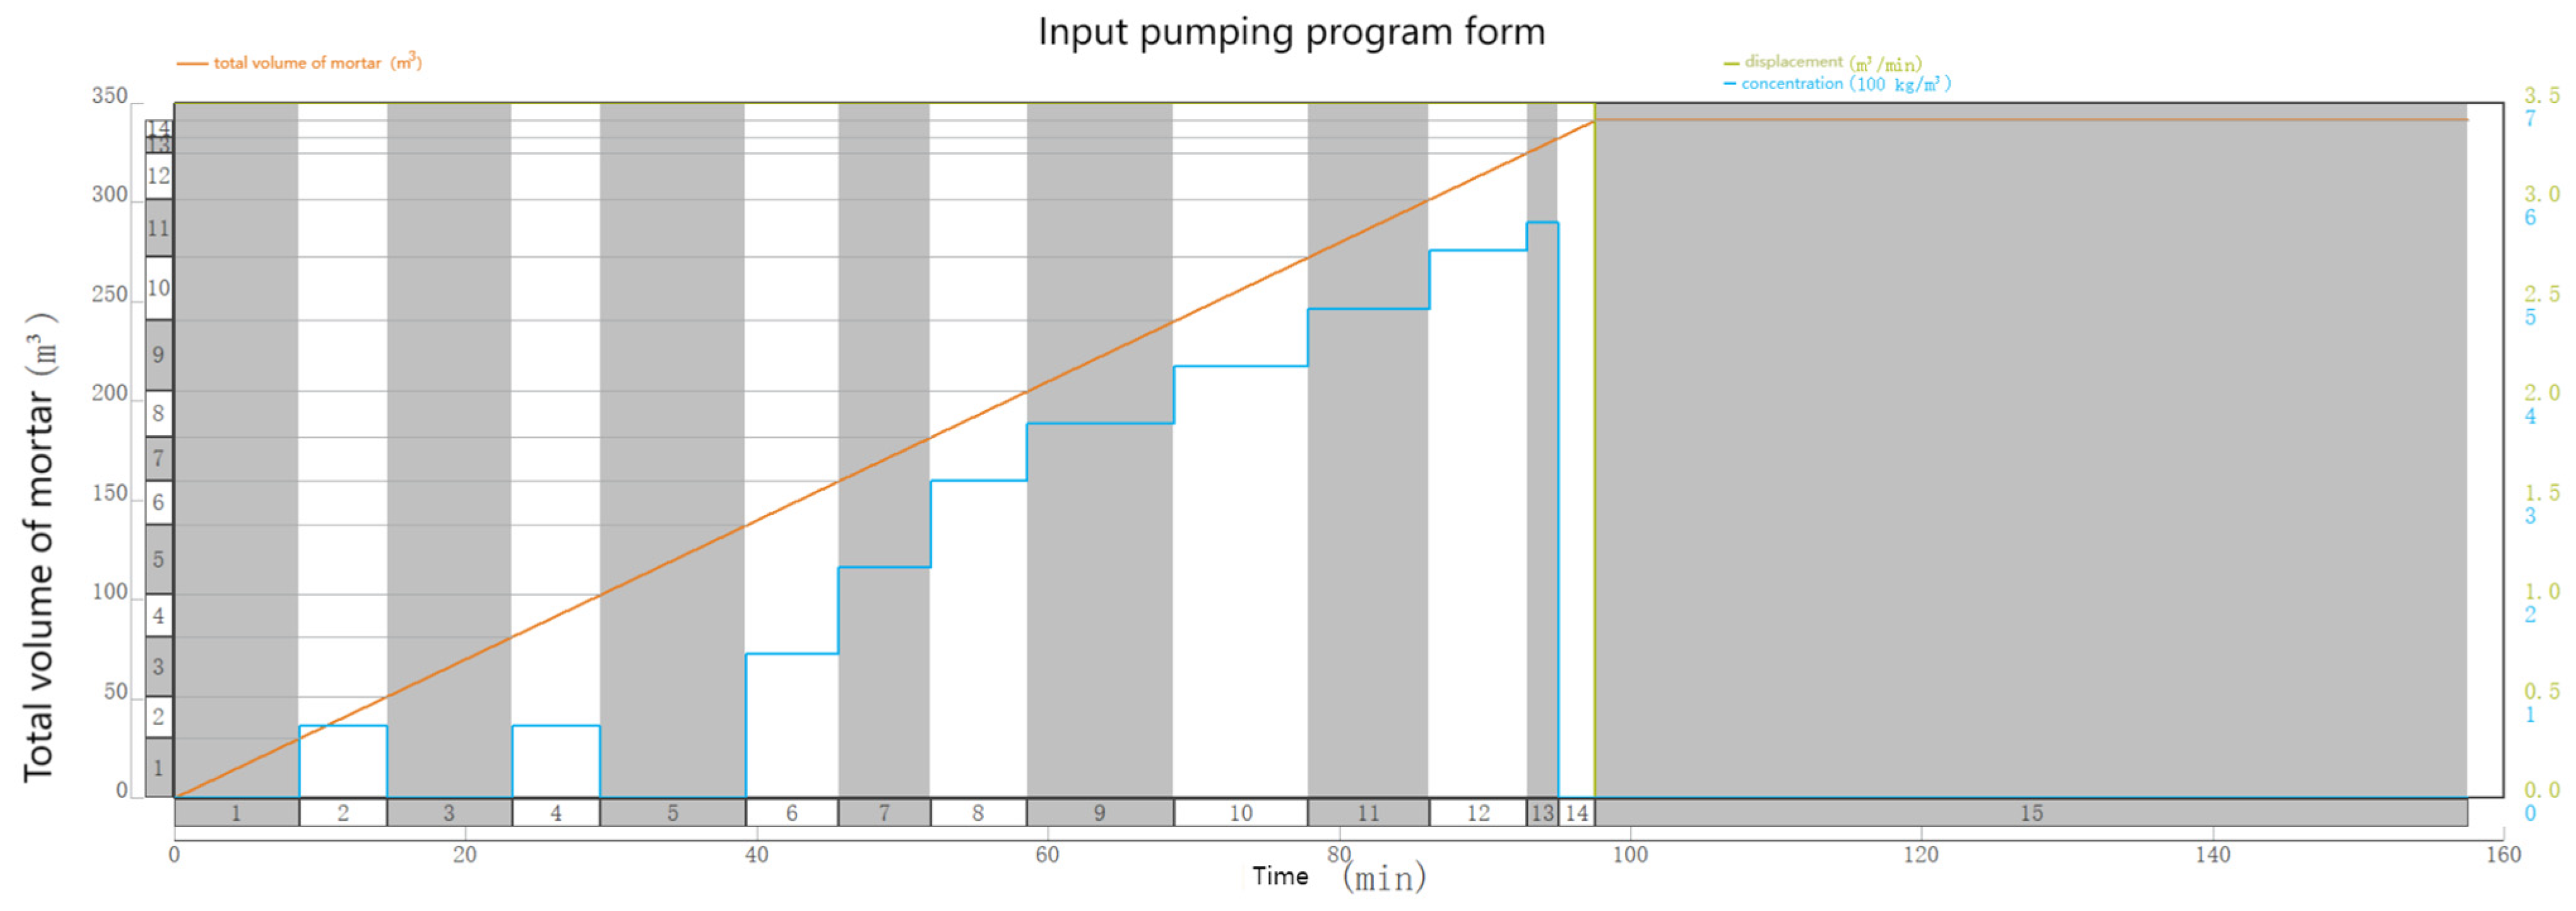
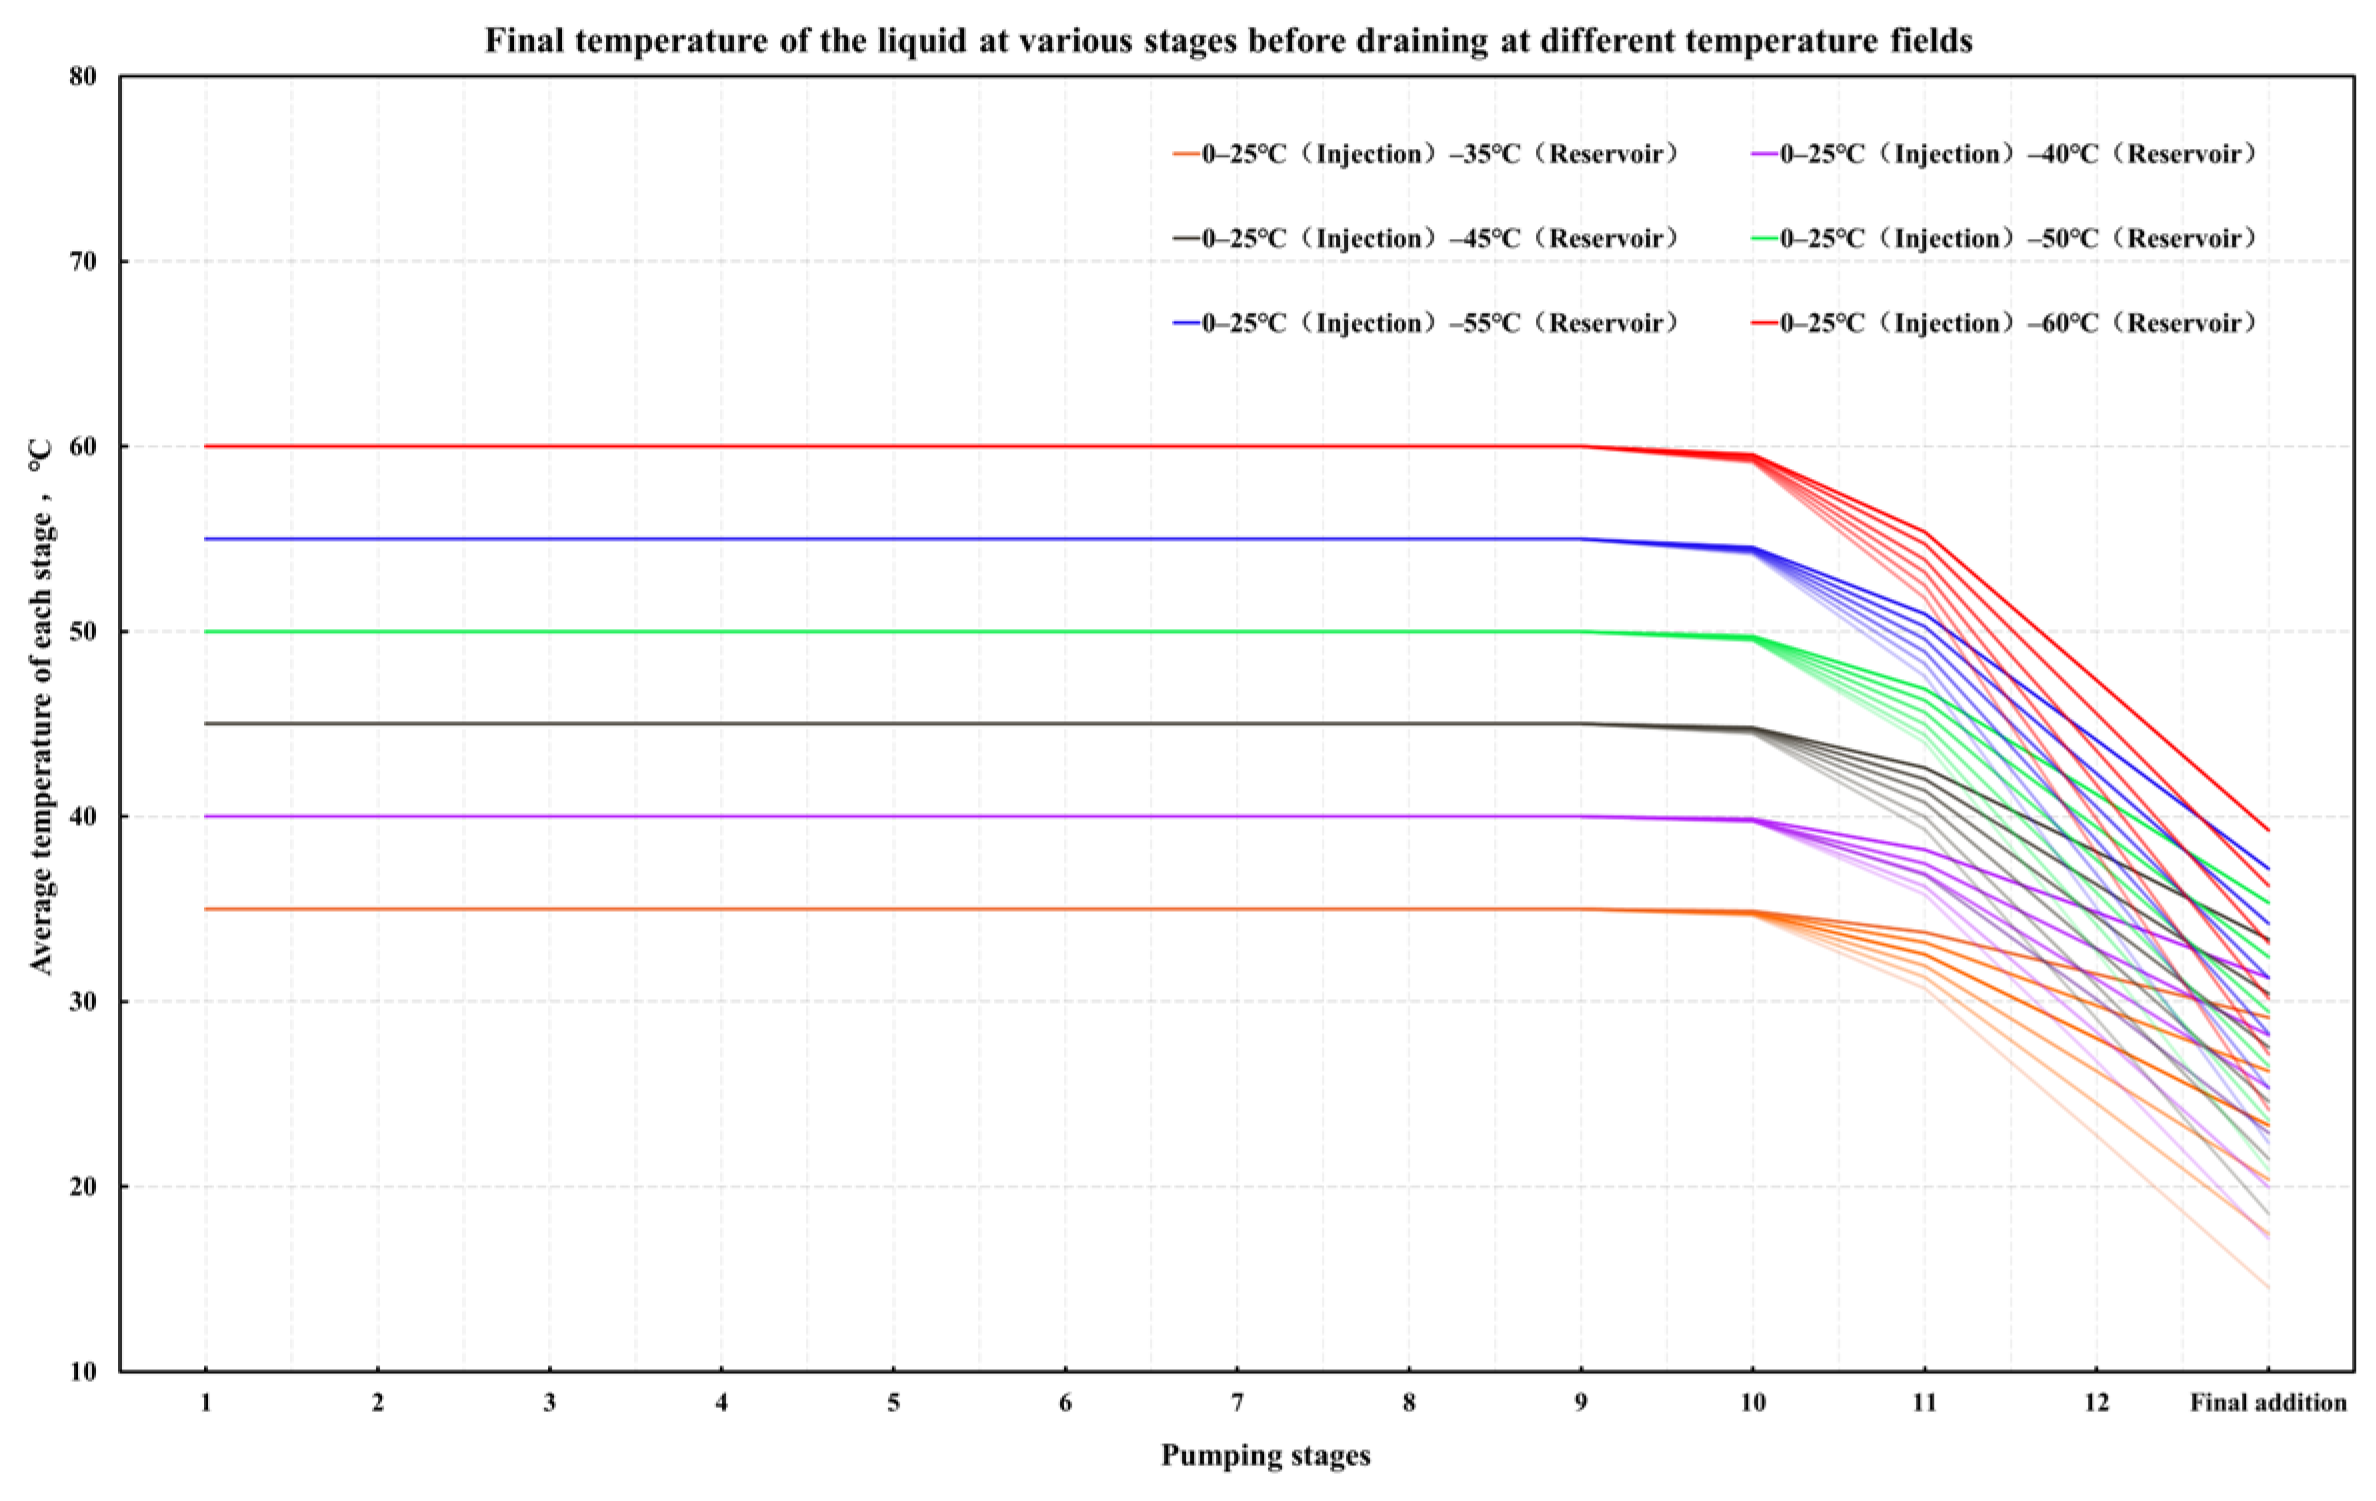
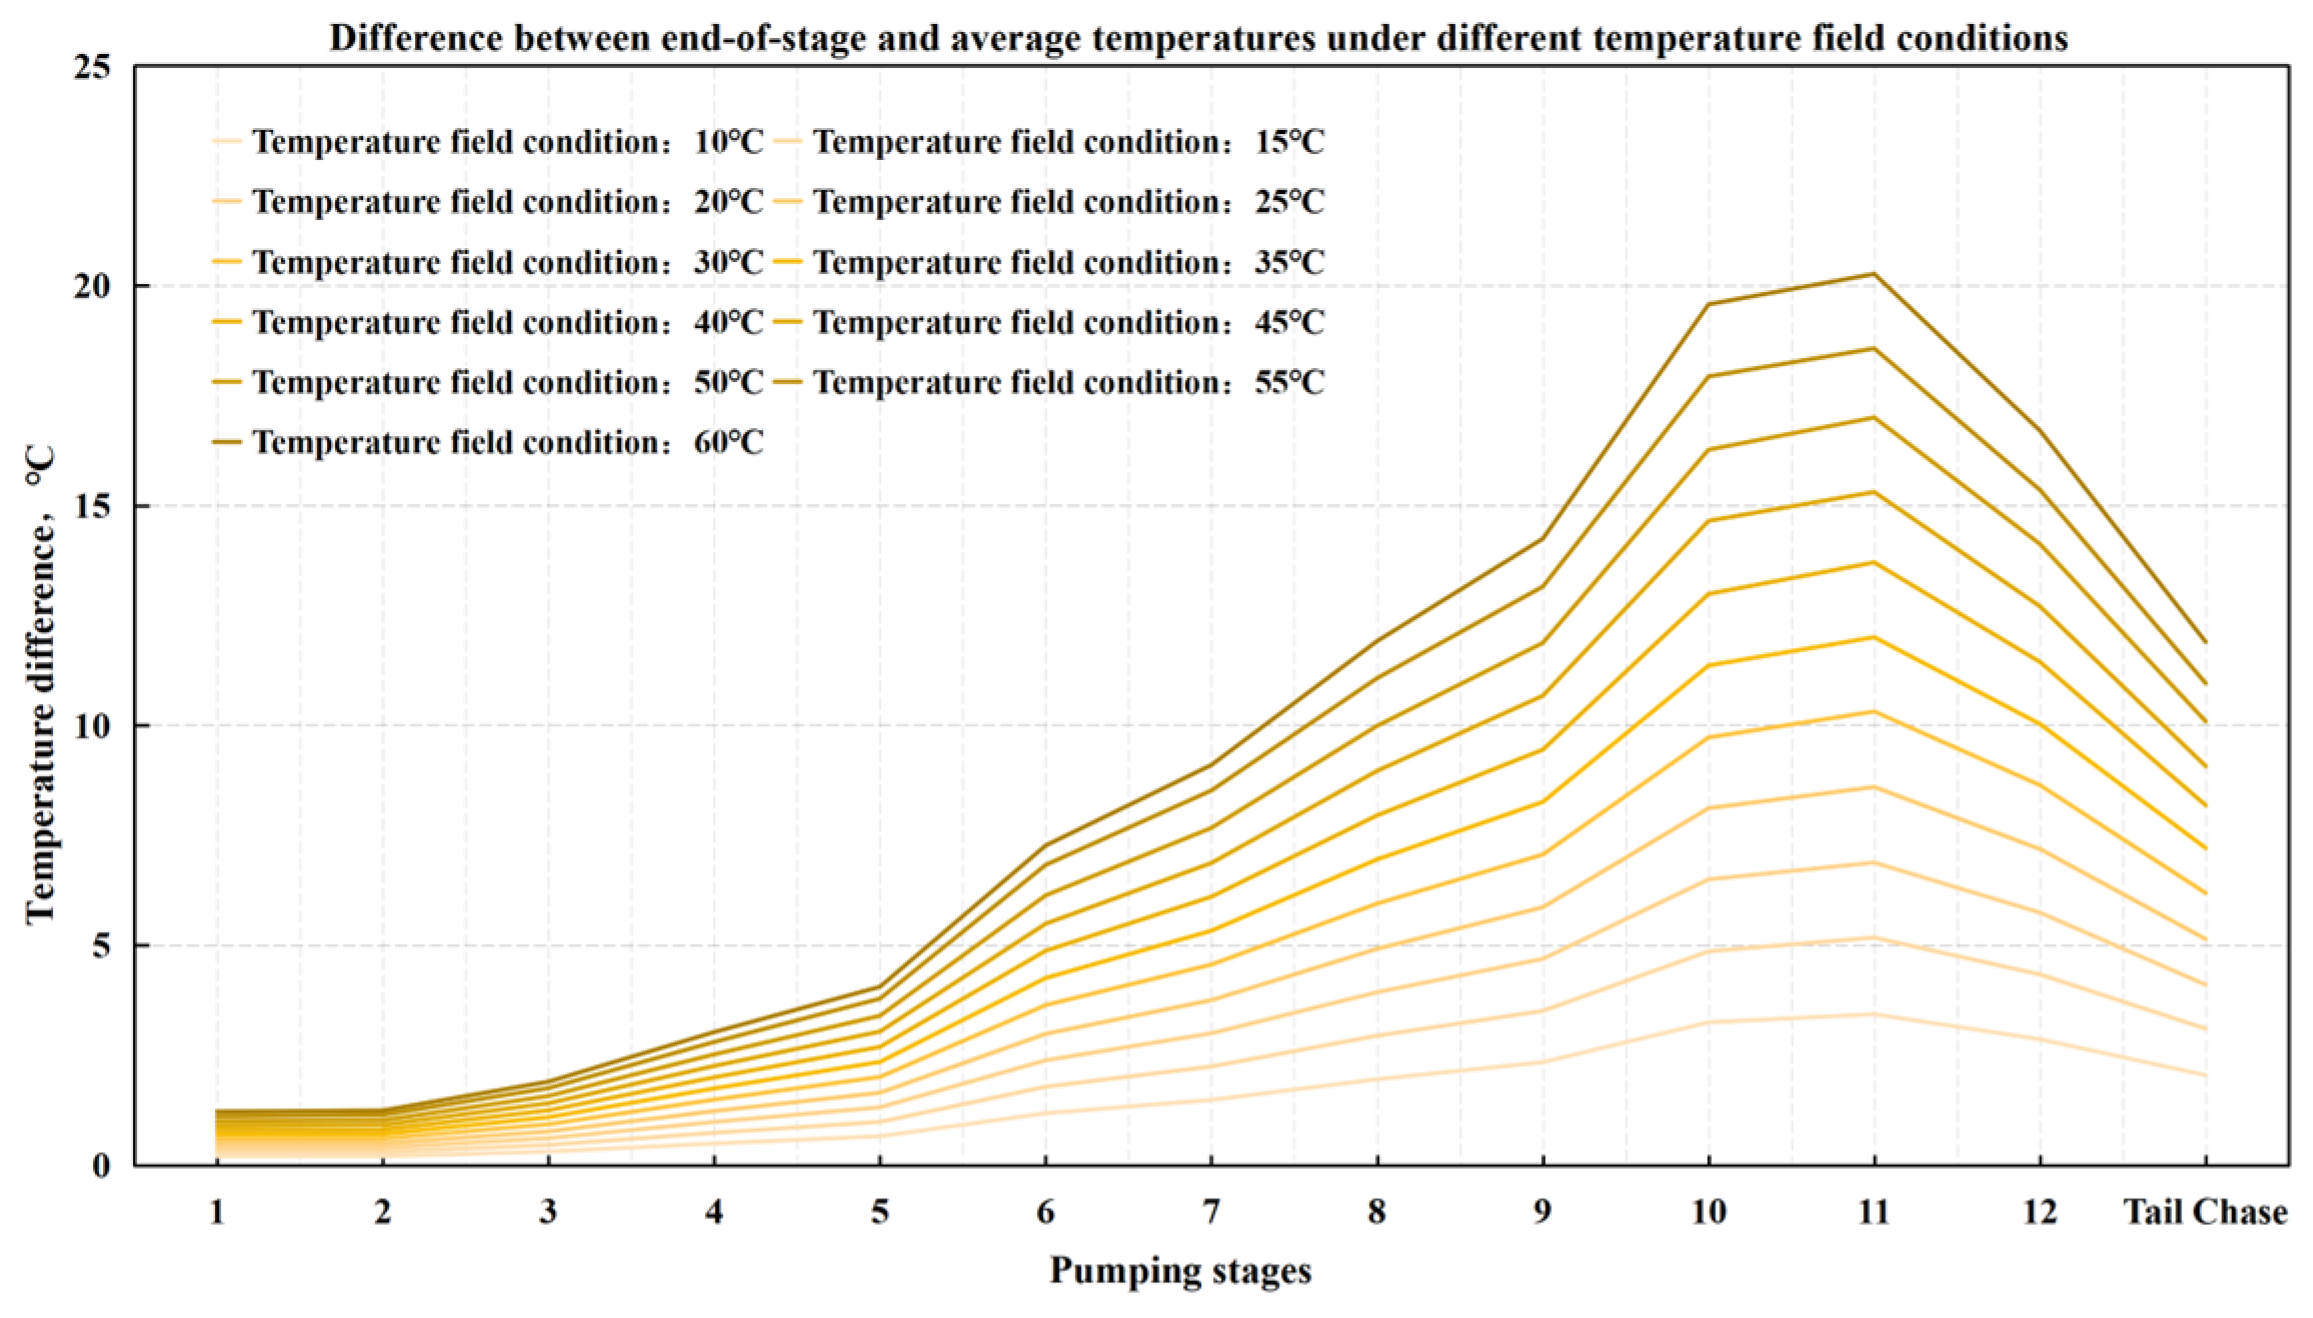
4.2. Optimization of the Stepped Gel Breaking Procedure

The optimization of the dosage of various breakthrough agents primarily refers to the breakthrough time, but it also needs to account for the cooling effect of the fracturing fluid on the formation and the fluid temperature recovery. Stepped gel breaking is a technique where the dosage of the gel breaker is applied in a staged manner, adjusting the concentration of the breaker at each stage to match the changing temperature conditions throughout the fracturing process. This approach ensures that the gel is effectively broken down in accordance with the temperature recovery, maximizing the efficiency of the treatment.
For tight sandstone gas reservoirs, the shorter the post-pressure shut-in time, the shorter is the contact time between fracturing fluid and the formation, which is more favorable for later production. In the Linxing block, the post-pressure shut-in time is controlled to be less than 1 h. This is required by CUCBM company men, that the fracturing fluid to completely break the gel is within 1 h after the fracturing operation has been completed.
Based on the aforementioned fluid temperature recovery simulation results, for low-temperature reservoirs, it is necessary to consider the slow recovery of the fluid temperature. Additionally, the breakout rate decreases when the fluid temperature is lower than the expected reservoir temperature. In such cases, if the optimization of the biomass breaker dosage is based solely on the reservoir temperature or end-of-liquid temperature, there is a risk that the fracturing fluid may not fully break down before returning to the drainage. This could carry excess proppant into the wellbore, thereby reducing the fracturing effect.
The concentration of the breaker should be adjusted based on the actual average temperature at each stage of the fracturing process before the fluid returns to the wellbore. This will ensure that the gel breaking occurs efficiently at each phase.
Taking the above typical pumping procedure as an example, each stage of fluid must maintain the sand-carrying capacity of the fluid before the construction stops pumping. The expected breakout time needs to be greater than the time from the start of pumping to the end of the fluid stage construction, and at the same time, the fracturing fluid should reach the breakout time within an hour after stopping the pumping. Therefore, the slowest breakout time for each fluid stage should not exceed one hour after well shut-in. Based on these requirements, a range of expected breakout times for each fluid stage can be obtained, as shown in Figure 9.
The optimal procedure of the bio-enzyme breaker should be the result of designing the concentration of the bio-enzyme breaker added in each stage according to the average temperature of the liquid in that stage and the expected time of breaking the gel. According to the average temperature distribution curve, in the initial construction stages (such as phases 1–4), the average temperature of several liquid phases is close to the reservoir temperature, with only a small difference between them. In the middle stages of construction (such as phases 5–7), the average temperature of the liquid is lower than the reservoir temperature, but the rate of temperature drop is relatively low. In the late construction stages (such as phases 8–13), the average temperature of the liquid is significantly lower than the reservoir temperature, and the rate of temperature decline is higher. At the same time, taking into account the expected breakage time of each liquid stage, there is a large overlap. Therefore, in the case of not affecting the breakage effect, a stepped biological enzyme breakthrough agent design mode can be adopted, which combines the adjacent liquid stage breakthrough procedures to reduce the complexity of the field construction operation. A schematic diagram of the stepped breaker design is shown in Figure 10, in which only the average temperature curve of the 15 °C fracturing fluid injected at a reservoir temperature of 50 °C is used as an example.
In the example of Figure 10, the average temperatures of the liquids in stages 1–4 are essentially the same, and there is a large overlap in their gel-breaking time windows, so that the same gel-breaking procedure can be designed to achieve gel-breaking at a close time. Stages 5–7 have minimal differences in average temperatures and can be combined into a second stage for the design of the bio-enzymatic gel-breaker. The stage 8—13 average temperature difference gradually increased, so it will be divided into multiple steps design. The construction tailing stage has the lowest average temperature and the highest gel-breaking requirements, so it is independently designed as a step for refinement.
Based on the above method, different dosages of bio-enzymatic gum breakers can be optimized according to different temperatures and different gum breaking times after static gum breaking experiments, as shown in Figure 11.
Under 20 °C, 30 °C, 40 °C, and 50 °C, the optimized gel breaker formulators were used to conduct 16 groups of comparative experiments with different target time periods of 45 min, 60 min, 90 min, and 120 min to break the gel. After reaching the target time, the viscosities were less than or equal to 4 mPa·s, and the gel breaking was thorough. At the same time, the above series of experiments can quantify the breaking procedure under different temperature combinations and form a graphic plate for the design of the bio-enzyme gel breaker. This has good operability and can be used as a basic reference for the bio-enzyme breaking and design of subsequent wells in the block. Specific experimental data are shown in Table 7.

5. Optimized Application of Bio-Enzyme-Enhanced Gel-Breaking Technology

The aforementioned method is used as follows: simulate the temperature field formed by different reservoir temperatures and fracturing fluid temperatures, analyze the average temperature of the fluid at each stage as well as the expected breakage time range for each stage, and then categorize these stages into stepped groups accordingly. Subsequently, based on the design template of the bio-enzyme gel breaker, the formulation of the bio-enzyme gel breaker was optimized. From 2021 onwards, this method was introduced into the fracturing design and construction, and the stepwise optimization of the average temperature-breaking time was carried out for each well. The formulation of the bio-enzyme breaker was adjusted to optimize the time and effect of the liquid breaking at each stage of the construction, and the final production effect was compared with that of the wells that had not been optimized with bio-enzyme-enhanced breaking technology in 2020. In order to minimize the influence of the transformation scale and the reservoir properties on the effect comparison, each well, constructed in 2020 and 2021, was normalised by the transformation scale and reservoir properties. The production results of wells not optimized by enzyme-enhanced gel breaking technology in 2020 are shown in Figure 12.
The production results of the wells using the optimized bio-enzyme enhanced gum breaking technology in 2021 are shown in Figure 13.
Comparison of the average values of a large number of data shows that, under the same construction scale and reservoir characteristics, the production of wells adopting the optimized bio-enzyme-enhanced breakage technology is significantly improved. This indicates that by more accurately simulating the average temperature of the breakage process at each stage of the liquid, the technology can be better optimized. With the help of the expected breakage time of each stage in the stepwise division, the optimized bio-enzyme-enhanced breakage technology can reduce the damage caused by the residual gel to the fracture inflow capacity. This approach better releases the production potential of the reservoir without significantly increasing the cost, achieving a more economical development.

6. Suggestions for Optimizing Pump Downtime for Winter Construction

The target block is in northwestern Shaanxi Province, where outdoor temperatures often drop below freezing in winter, resulting in near-freezing temperatures of the water used to dispense fluids on site. Currently, due to capacity requirements, the construction time in winter has been prolonged, and the probability of construction under extreme low-temperature weather conditions has increased. Therefore, it is necessary to begin to consider how to optimize the construction procedure in order to control the impact of extreme conditions on the construction effect. Through the aforementioned dynamic temperature field simulation of different reservoir temperatures and injected liquid temperatures, it was found that in extreme low-temperature reservoirs, or in the case of low reservoir temperatures and extreme weather conditions, the temperature of the injected liquid on the ground is low. As a result, the temperature recovery of the liquid phase at the end of the construction is poor, and the temperature recovery may be lower than 25 °C within one hour after construction, significantly reducing the activity of the bio-enzyme gel-breaker. The activity of the oxidation gel-breaker is also reduced under such low temperatures. At such low temperatures, the activity of the bio-enzymatic gel-breaker was significantly reduced, and the reaction rate of the oxidizing gel-breaker was also affected. However, by analyzing the liquid temperature recovery curve of the tailrace section (Figure 14), it can be seen that the liquid temperature of the tailrace section can recover to more than 90% of the reservoir temperature within 2 h after stopping the pump. This is the optimal temperature range for the activity of the biological enzyme, thereby enhancing the effect of the biological enzyme and other gel-breaking agents. Based on the results of the aforementioned temperature analysis, it is recommended that in extreme cold weather construction, if the reservoir temperature is at a lower level, the well shut-in time should be extended. To ensure the quality of the breaking gum, it is suggested to extend the well shut-in time after construction by 0.1 to 1 h. Thus, at the end of the construction, the tail water section of the liquid temperature recovery, especially, is better, so enhancing the activity of the biological enzyme breaker. This can achieve a better gel breaking effect without increasing the amount of biological enzyme breaker. The recommended shut-in times for various temperature fields are shown in Table 8.

7. Conclusions

(1)
Bio-enzyme-enhanced gel-breaking technology for low-temperature reservoirs (35–60 °C): Preliminary studies indicate that bio-enzyme-enhanced gel-breaking technology significantly improves fracture conductivity and production in low-temperature reservoirs. However, during the initial design, the impact of temperature variations on the fracturing fluid’s heat exchange with the reservoir was not fully considered. The temperature at the end of each stage before flowback was not precisely determined, leaving room for optimization of the bio-enzyme concentrations to better align with the dynamic temperature changes, thus improving overall fracturing performance.
(2)
Numerical simulation of fluid temperature variation: Using Meyer Fracturing Software, numerical simulations revealed that the fluid’s average temperature in the later pumping stages deviates from both the reservoir and endpoint fluid temperatures. This provides a more accurate picture of temperature variation, allowing for precise optimization of the biomass breaker concentration at each stage. Tailoring the enzyme concentration to the actual temperature behavior enhances the gel-breaking procedure, improving its field applicability and efficiency.
(3)
Stepwise optimization of fluid stages: To optimize bio-enzyme gel-breaking, the fracturing process is divided into steps based on the overlap of the expected breakage times and similar average temperatures between adjacent fluid stages. Experimental studies led to the creation of a concentration template for bio-enzyme breakers. This template allows for efficient gel-breaking across stages, improving fracture inflow capacity and minimizing reservoir damage.
(4)
Application and results of optimized technology: In 2021, the optimized bio-enzyme gel-breaking technology was applied in 40 wells, significantly improving the gel breaking efficiency and fracture cleaning. These wells showed higher production rates compared to earlier wells using non-optimized technology, achieving better results without a substantial increase in construction costs. The optimization proved both cost-effective and beneficial in enhancing reservoir productivity.
(5)
Impact of extreme weather and low-temperature reservoirs: Increasing fracturing in low-temperature reservoirs and extreme weather conditions raises the likelihood of insufficient fluid temperature recovery within one hour of shut-in. Extending the shut-in time allows better fluid temperature recovery, enhancing bio-enzyme reactivity, improving guar gum breakdown, and reducing reservoir damage, thereby ensuring fracture conductivity and optimizing long-term production.

Author Contributions

Conceptualization, A.D.; Methodology, M.J.; Validation, T.L.; Resources, W.Y.; Data curation, Y.L. and Z.X.; Writing—original draft, J.H.; Writing—review and editing, G.W. All authors have read and agreed to the published version of the manuscript.

Funding

This research received no external funding.

Data Availability Statement

The data presented in this study are available on request from the corresponding author.

Conflicts of Interest

Authors Jiachen Hu, Weida Yao, Yu Li, Tian Lan, Zhongxu Xie and Anxun Du were employed by CNOOC Energy Development Company Limited, Engineering and Technology Branch. The remaining authors declare that the research was conducted in the absence of any commercial or financial relationships that could be construed as a potential conflict of interest.

References

  1. Ma, X.; Jia, A.; Tan, J.; He, D. Tight sand gas development technologies and practices in China. Pet. Explor. Dev. 2012, 39, 572–579. [Google Scholar] [CrossRef]
  2. Zou, C.; Yang, Z.; Zhu, R.; Zhang, G.; Hou, L.; Wu, S.; Tao, S.; Yuan, X.; Dong, D.; Wang, Y.; et al. Progress in China’s unconventional oil & gas exploration and development and theoretical technologies. Acta Geol. Sin. 2015, 89, 979–1007. [Google Scholar]
  3. Zou, C.; Zhang, G.; Tao, S.; Hu, S.; Li, X.; Li, J.; Dong, D.; Zhu, R.; Yuan, X.; Hou, L.; et al. Geological features, major discoveries and unconventional petroleum geology in the global petroleum exploration. Pet. Explor. Dev. 2010, 37, 129–145. [Google Scholar] [CrossRef]
  4. Zhao, W.; Wang, H.; Xu, C.; Bian, C.; Wang, Z.; Gao, X. Reservoir-forming mechanism and enrichment conditions of the extensive Xujiahe Formation gas reservoirs, central Sichuan Basin. Pet. Explor. Dev. 2010, 37, 146–157. [Google Scholar] [CrossRef]
  5. Tang, H.; Yu, Y.; Sun, Q. Progress, Challenges, and Strategies for China’s Natural Gas Industry Under Carbon-Neutrality Goals. Processes 2024, 12, 1683. [Google Scholar] [CrossRef]
  6. Zhao, W.; Bian, C.; Xu, C.; Wang, H.; Wang, T.; Shi, Z. Assessment on gas accumulation potential and favorable plays within the Xu-1, 3 and 5 Members of Xujiahe Formation in Sichuan Basin. Pet. Explor. Dev. 2011, 38, 385–393. [Google Scholar] [CrossRef]
  7. Guo, Q.; Li, J.; Chen, N.; Hu, J.; Xie, H.; Gao, X. Modeling of the tight sandstone gas accumulation for the Xujiahe Formation, Hechuan-Tongnan Area, Sichuan Basin. Pet. Explor. Dev. 2011, 38, 409–417. [Google Scholar] [CrossRef]
  8. Li, W.; Qin, S.; Hu, G.; Gong, Y. Accumulation of water-soluble gas by degasification: One of important mechanisms of large gas accumulations in the Xujiahe Formation, Sichuan Basin. Pet. Explor. Dev. 2011, 38, 662–670. [Google Scholar] [CrossRef]
  9. Wu, L. Low temperature gel breaking mechanism and development application of water-based fracturing fluid. Prog. Fine Petrochem. Ind. 2018, 19, 13–15. [Google Scholar]
  10. Li, J.; Wang, W.; Wang, J. Study and application of low-temperature fracturing fluids gel-breaking technique. Spec. Oil Gas Reserv. 2009, 16, 72–75. [Google Scholar]
  11. Wei, D.; Chen, H.; Zhu, D. Study and application of super low-temperature fracturing fluids in Yanchuan area. Pet. Drill. Tech. 2000, 28, 41–43. [Google Scholar]
  12. Wang, W.; Zhang, S.; Wen, H.; Zhang, H.; Sun, G. Study and application of super low-temperature fracturing fluids in shallow horizontal well. Oilfield Chem. 2012, 29, 155–158. [Google Scholar]
  13. Chen, Z.; Wang, Y.; Yang, Q.; Du, C.; Duan, Z. Research on Fracturing Optimization Technology for Low Permeability and Low Temperature Water Sensitive Shallow Gas Reservoirs. Nat. Gas Ind. 2006, 26, 99–101. [Google Scholar]
  14. Ren, Z.; Sun, H.; Qin, L. Research on ultra-low temperature gel breaking system of hydroxypropyl guar gum fracturing fluid. Oilfield Chem. 1995, 12, 234–236. [Google Scholar]
  15. Wang, M.; Zhang, J.; Yang, Y.; Zhou, J. The effect of different additives on the low-temperature gel breaking performance of hydroxypropyl guanidine gum fracturing fluid. J. Xi’an Pet. Univ. (Nat. Sci. Ed.) 2006, 21, 65–68. [Google Scholar]
  16. Yi, X.; Lu, Y.; Ma, H. Adaptability evaluation of fracturing fluid system in low-permeability reservoirs of Tuha Oilfield. Drill. Prod. Technol. 2006, 29, 84–86. [Google Scholar]
  17. Lu, Y. New Trends in the Development of Fracturing Fluid Technology Abroad in the 1990s. Pet. Nat. Gas Chem. Ind. 1998, 27, 115–118. [Google Scholar]
  18. Deng, H.; Tao, P. Application of low-temperature frac fluids in the shallow formation of South E area. Spec. Oil Gas Reserv. 2016, 23, 142–145. [Google Scholar]
  19. Zheng, K.; Wang, Y.; Yuan, W. Low temperature breaking fracturing fluid system application in Xinjiang oilfield. Xinjiang Pet. Technol. 2008, 18, 31–32. [Google Scholar]
  20. He, X.; Li, J.; Li, N.; Zhe, H. Ammonium persulfate and enzyme technology comparative study gel breaking fracturing. Petrochem. Ind. Appl. 2012, 31, 81–83. [Google Scholar]
  21. Li, J. Research and Application of New Biological Enzymes. Pet. Mach. Manuf. 2008, 37, 90–92. [Google Scholar]
  22. Guan, B.; Liu, J. Biocatalytic Gel Breaking Technology for Fracturing in Changqing Oil and Gas Field and Its Application. Oilfield Chem. 2008, 25, 89–91. [Google Scholar]
  23. Wang, L. Research and application of SUN_Y100 biological enzyme fracturing gel breaking technology. J. Shengli Oilfield Staff. Univ. 2009, 23, 33–39. [Google Scholar]
  24. Li, B.; Zhang, H.; Zhang, Z.; Zhao, J. Optimization and Application of Low Temperature Fracturing Fluid for Tight Sandstone Gas in Linxing Shenfu Block, Ordos Basin. Pet. Drill. Prod. Technol. 2019, 41, 7. [Google Scholar]
  25. Hu, K.; Yi, S.; Deng, Y. The current situation and prospect of biological enzyme gel breaker. Sci. Technol. Advis. Guide 2007, 21, 159. [Google Scholar]
  26. Wu, J. Low-temperature fracturing fluid gel breaking technology for stimulation technology transformation in shallow gas reservoirs. Drill. Prod. Technol. 2000, 23, 79–81. [Google Scholar]
  27. Han, J.; Chen, H.; Wang, Y. New type of low-temperature gel breaker activator for fracturing fluid. Pet. Drill. Prod. Technol. 2001, 23, 821. [Google Scholar]
  28. Qi, Y.; Yang, C. Research and Application of Linxing Dense Gas Pressure Fracturing Liquid Synchronous Gel Breaking Technology. Chem. Eng. Equip. 2019, 11, 181–182. [Google Scholar]
  29. Yin, Y.; Huang, S.; Ye, H. Research and application of low-temperature gel breaking technology using biological enzymes. Petrochem. Technol. 2018, 11, 118–119. [Google Scholar]
  30. Li, H.; Cheng, Y.; Liu, Z.; Zhao, M. Physical mutagenesis and enzymatic properties of bacteria producing biological enzyme breakers. Chem. Eng. 2018, 8, 14–17. [Google Scholar]
  31. Chang, Y. Indoor performance evaluation and field application of biological enzyme breaker. Inn. Mong. Petrochem. 2019, 45, 28–30. [Google Scholar]
  32. Guan, B.; Liang, L.; Yang, W.; Liu, Y. Research and application of biological enzyme breaker. In Proceedings of the 2018 National Natural Gas Academic Annual Conference (04 Engineering Technology), Fuzhou, China, 15–16 November 2018. [Google Scholar]
  33. Wang, Z. Indoor evaluation of biological enzyme breaker and its application analysis in oilfield fracturing. China Pet. Chem. Stand. Qual. 2020, 21, 3–5. [Google Scholar]
  34. Bao, M.; Yin, Y.; Zhang, Y. Research on the on-site application process of biological enzyme gel breaking. Neijiang Technol. 2019, 5, 19. [Google Scholar]
  35. Zhao, X.; Cao, G.; Zhang, X.; Zhang, L.; Lei, T.; Han, F. Study on the Control Method of Gel Breaking Speed of Biological Enzyme Fracturing Fluid. Contemp. Chem. Ind. 2018, 47, 454–457. [Google Scholar]
  36. Cao, G.; Feng, Y.; Lin, J.; Chen, Z.; Ding, M.; Jiang, Y.; Wang, W. Research progress on bio-enzyme preparations for polymer plugging in oil fields. J. Nanjing Univ. Technol. (Nat. Sci. Ed.) 2024, 46, 131–140. [Google Scholar]
  37. SY/T 5336-2006; Core Analysis Method. Petroleum Industry Press: Beijing, China, 2006.
  38. Gong, Y.; Lei, Y.; Chen, X.; Song, H.; Liu, R. A novel silica aerogel microspheres loaded with ammonium persulfate gel breaker for mid-deep reservoirs. J. Sol-Gel Sci. Technol. 2018, 88, 105–113. [Google Scholar] [CrossRef]
Figure 1. Comparison of the results of the low-temperature catalytic gel breaker dynamic gel breaking experiment.
Processes 13 00440 g001
Figure 2. Schematic diagram of a typical pumping procedure for simulations.
Processes 13 00440 g002
Figure 3. Temperature recovery curve after fracturing fluid in ground at different stages. (A) Temperature profile of each pumping stage at 35 °C reservoir temperature. (B) Temperature profile of each pumping stage at 40 °C reservoir temperature. (C) Temperature profile of each pumping stage at 45 °C reservoir temperature. (D) Temperature profile of each pumping stage at 50 °C reservoir temperature. (E) Temperature profile of each pumping stage at 55 °C reservoir temperature. (F) Temperature profile of each pumping stage at 60 °C reservoir temperature.
Processes 13 00440 g003aProcesses 13 00440 g003bProcesses 13 00440 g003cProcesses 13 00440 g003d
Figure 4. Comparison of temperature recovery in 1 h of liquid shut-in well during tailrace phase under different reservoir temperature conditions.
Processes 13 00440 g004
Figure 5. Distribution of end temperatures of fluids in different temperature fields at each stage before returning to the drain after one hour of well shutdown.
Processes 13 00440 g005
Figure 6. Average temperature distribution of fluids in different temperature fields for each stage in the construction-well closure stage.
Processes 13 00440 g006
Figure 7. Distribution of the difference between the mean temperature and the end temperature of the liquid at each stage under different temperature fields.
Processes 13 00440 g007
Figure 8. Distribution of the difference between the mean temperature and the end temperature of the liquid at each stage in different temperature fields (similar values are combined according to the temperature difference between the reservoir and the injected liquid).
Processes 13 00440 g008
Figure 9. Distribution of expected gel breakage time for fluids at each stage of a typical fracturing procedure.
Processes 13 00440 g009
Figure 10. Schematic design of temperature–time step of stage-type gel breaking.
Processes 13 00440 g010
Figure 11. Optimization of gel breaking time with different temperatures and different dosages of bio-enzymatic gel breakers.
Processes 13 00440 g011
Figure 12. Distribution of production results by wells not optimized with bio-enzyme-enhanced gum-breaking technology in 2020.
Processes 13 00440 g012
Figure 13. Distribution of production results by wells using optimized bio-enzyme-enhanced gum-breaking technology in 2021.
Processes 13 00440 g013
Figure 14. Temperature recovery curves after liquid pumping stoppage in tailgate phase for different temperature fields.
Processes 13 00440 g014
Table 1. Core matrix permeability.
Core SampleLength/mmDiameter/mmPermeability/10−3 μm2
A60.2225.1272.53
B63.9625.240.0058
C43.3625.130.2807
D61.6725.130.5579
E61.3325.160.2037
F44.9125.150.2154
G57.6025.101.1820
H58.5825.090.1955
Table 2. X-ray diffraction whole rock analysis.
Core SampleMineral Content/per Cent
SapphirePotassium FeldsparPlagioclase
(Rock-Forming Mineral,
Type of Feldspar)
Calcite
(CaCO3 as Rock-Forming Mineral)
LimoniteFerric Oxide Fe2O3Total Clay Minerals
A58.20.613.43.0-1.123.7
B59.10.75.51.0--33.7
C65.4-22.7---11.9
D76.5-2.52.1--18.9
E56.14.710.13.4-1.324.4
F69.9---1.0-29.1
G68.00.517.30.5--13.7
H37.25.110.70.8-1.744.5
Table 3. Compositional analysis of clay minerals.
Core SampleRelative Clay Mineral ContentMixed Layer Ratio/%
II/SKaoCI/SC/S
A64118112756
B33640172656
C53532182738
D46022102510
E872841319
F31672-5-
G3472121711
H3761172521
Table 4. Reservoir temperature and pressure parameters.
Core SampleStratumReservoir
Thicknesses/m
Average Formation Temperature/°CAverage Formation
Pressure/MPa
Average Pressure Coefficient
ATai 211.356.916.10.88
BHe 89.848.515.530.95
CHe 712.048.715.440.96
DHe 611.448.415.820.97
EHe 48.047.514.30.96
FHe 27.845.512.80.97
GHe 16.943.213.940.94
HQian 52.642.112.220.98
Table 5. Reservoir temperature distribution within the block.
PositionTai 2Tai 1He 8He 7He 6He 4He 3He 2He 1Qian 5
Reservoir
temperature
58.453.150.248.447.247.643.241.742.336.4
59.652.751.446.646.448.147.844.647.439.2
56.452.647.748.944.646.444.743.3
55.553.549.151.448.24547.245.5
62.158.552.148.145.4 45.143.6
57.457.450.350.2 46.7
Table 6. Comparison of static gel breaking experiment results.
Broken Gel Time/minFormulation A/(mPa·s)Formulation B/(mPa·s)Formulation C/(mPa·s)Formulation D/(mPa·s)
3058314929
4541253512
6033192618
752615216
902114186
1051813154
1201613113
150151292
180151272
Table 7. Determination of viscosity of gel breaking liquid.
FormulasExperimental Temperature/°CViscosity of Broken Gel (mPa·s)
45 min60 min90 min120 min
A204321
B207431
C2010743
D2013864
E304211
F307431
G309642
H30151164
I404321
J407422
K4011743
L40181184
M504321
N507432
O5010742
P50181284
Table 8. Recommended well shut-in times for various temperature fields.
TestimonialsReservoir Temperature
Well Closure Time35 °C40 °C45 °C50 °C55 °C60 °C
Temperature of injected liquid0 °C90 min85 min80 min75 min70 min65 min
5 °C85 min80 min75 min70 min65 min60 min
10 °C80 min70 min60 min60 min60 min60 min
15 °C70 min60 min60 min60 min60 min60 min
20 °C60 min60 min60 min60 min60 min60 min
25 °C60 min60 min60 min60 min60 min60 min
Disclaimer/Publisher’s Note: The statements, opinions and data contained in all publications are solely those of the individual author(s) and contributor(s) and not of MDPI and/or the editor(s). MDPI and/or the editor(s) disclaim responsibility for any injury to people or property resulting from any ideas, methods, instructions or products referred to in the content.

