Article

Towards a Dynamic Optimisation of Comminution Circuit Under Geological Uncertainties

by
Alain M. Kabemba
1,*,
Kalenda Mutombo
2 and
Kristian E. Waters
1
1
Department of Mining and Materials Engineering, Faculty of Engineering, McGill University, Montreal, QC H3A 0C5, Canada
2
Advanced Materials Engineering, Manufacturing Cluster, Council for Scientific and Industrial Research (CSIR), Pretoria 0184, South Africa
*
Author to whom correspondence should be addressed.
Processes 2025, 13(2), 443; https://doi.org/10.3390/pr13020443
Submission received: 20 December 2024 / Revised: 14 January 2025 / Accepted: 3 February 2025 / Published: 6 February 2025
(This article belongs to the Section Manufacturing Processes and Systems)

Abstract

:
Geometallurgical programmes are crucial for designing mineral processing plants that maximise comminution throughput. However, the variability of complex ore bodies, such as platinum group element (PGE) deposits, poses challenges in developing these programmes into profitable mine-to-mill production. This paper investigates the geological characteristics of different lithologies hosting the complex PGE orebody located in the Northern Limb of the Bushveld igneous complex in South Africa and assessed their impact on metallurgical efficiency in comminution circuits. Regression machine learning techniques were employed to analyse the ore mineralogical dataset from two lithologies (feldspathic pyroxenite and pegmatoidal feldspathic pyroxenite) and predict the Bond Work Index (BWI), a key comminution parameter for calculating processing plant throughput. The results indicated that BWI is strongly influenced by Chlorite, silicates, iron oxides, and the relative density of the PGE deposit. Using both simulated and laboratory-measured throughput values, a particle swarm optimisation (PSO) algorithm was applied to maximise the plant’s comminution throughput through tactical blending of low-grade and high-grade ore stockpiles. The PSO algorithm was shown to be an effective tool for stockpile management and tactical mine-to-mill operation in response to feed mineralogical variability. This first-time innovative approach addresses complex geological uncertainties and lays the groundwork for future geometallurgical studies. Potential areas for further research include incorporating additional lithologies for tactical ore stockpile blending and optimising parameters critical for ore mineral flotation.

1. Introduction

The global surge in metal demand, driven by rapid infrastructure advancement and the transition to renewable energy source, has placed unprecedented pressure on the mining industry. This escalating demand, coupled with declining mineral grades and increasingly complex polymetallic orebody compositions, presents significant challenges for mineral processing operations [1,2]. The mining sector must now grapple with the task of efficiently extracting and processing low-grade and complex mineral ores while addressing environmental concerns and corporate social responsibility issues [3,4].
Geometallurgy has emerged as a crucial approach in addressing these challenges, providing a framework for integrating geological variability with metallurgical performance [5,6]. By incorporating geometallurgical studies, mining operations can better assess the impact of ore variability on both comminution and flotation processes, leading to more efficient and sustainable mineral processing [5,6].
Comminution, a fundamental step in mineral processing, is particularly susceptible to the effects of geological uncertainties and fluctuations in feed composition [7]. The Bond Work Index (BWI), a key parameter in comminution, plays a vital role in determining processing plant throughput and energy consumption and mill design. The BWI is used to estimate the energy required for comminution, or the grinding of ore into smaller particles. It is a measure of ore hardness and is essential for designing grinding systems and optimising energy consumption in mineral processing plants. However, the inherent variability of complex ore bodies, such as platinum group element (PGE) deposits, poses significant challenges in optimising comminution circuits and maintaining consistent performance [8].
To address these challenges, this paper focuses on the dynamic optimisation of comminution circuits under geological uncertainties, with a particular emphasis on a complex PGE orebody located in the Northern Limb of the Bushveld igneous complex in South Africa. A multi-faceted approach that integrates a regression machine learning (ML) technique and particle swarm optimisation (PSO) is employed to enhance ore blending stockpiles required for mine-to-mill operational tactics. Our research aims to:
  • Identify the key geometallurgical attributes that influence comminution performance in complex PGE ore deposits.
  • Develop predictive model for comminution performance based on ore variability.
  • Implement a dynamic optimisation algorithm for tactical blending of low-grade and high-grade ore stockpiles.
The remainder of this paper is structured as follows: Section 2 provides a brief background on the characteristics of the PGE ore deposit and previous studies on how ML and PSO can improve comminution performance. Section 3 provides the framework employed to predict the comminution performance and optimise the operational tactics of blending ore stockpiles. Section 4 presents the results of the machine learning predictive model and PSO strategy. Section 5 discusses the model sensitivity to changes in ore variabilities, along with their influences on mode of plant operation. Finally, Section 6 concludes with a summary and recommendations.

2. Theoretical Background

To accurately predict the comminution performance of the complex PGE Platreef ore deposit, it is important to first understand the geological behaviour of this orebody. This section provides a concise background information on complex orebodies, comminution, including the BWI and relative density, operational challenges, previous ML and PSO studies in the context of PGE Platreef ore deposit.

2.1. Complex Orebodies and the PGM Platreef Ore Deposit

Complex orebodies, characterised by their intricate mineralogy and variable composition, pose unique challenges in mineral processing. The Platreef deposit, located in the northern limb of the Bushveld Igneous Complex in South Africa, is a prime example of such complexity. Kinnaird et al. [9] describe the Platreef as a series of pyroxenites and norites with significant platinum group element (PGE) mineralization, often associated with base metal sulphides. The deposit’s heterogeneity is further complicated by the presence of various rock types, including hornfels and calc-silicates, which contribute to its geological complexity [10,11].
Hutchinson and Kinnaird [12] highlight the variability in PGE grade distribution within the Platreef, noting significant lateral and vertical changes over short distances. This variability extends to the mineralogical composition, with Holwell and McDonald [13] identifying a diverse array of platinum group minerals (PGMs) and base metal sulphides, each with distinct processing requirements.

2.2. Comminution and Bond Work Index

In mineral processing, the grinding process reduces particles to their liberation size to effectively separate valuable minerals from gangue minerals. The BWI, a key parameter in comminution, plays a vital role in determining processing plant throughput and energy consumption [7,14]. For complex orebodies like the Platreef deposit, accurately determining the BWI is crucial yet challenging due to the ore’s heterogeneous nature.
Mwanga et al. (2015) conducted a comprehensive study on various comminution tests, including the Bond Ball Mill test, and their applicability to different ore types [15,16]. They found that for complex ores, traditional comminution tests may not always accurately predict plant performance due to the influence of mineralogical variations.
In case of PGE ores, Little et al. [17] investigated the relationship between BWI and relative density for Platreef samples. Their study revealed significant correlations between these parameters and highlighted the importance of considering both in comminution circuit design. Furthermore, Little et al. [17] demonstrated how variations in relative density within the Platreef ore can lead to inconsistent grindability characteristics, affecting overall comminution efficiency.

2.3. Plant Configurations and Operational Challenges

The complexity of PGE Platreef ore deposits necessitates carefully designed comminution circuits to accommodate ore variability. Bryson discusses various plant configurations for processing PGE ores, emphasising the need for flexibility in circuit design to handle feed variations [18]. However, as noted by Rule and Schouwstra [14] the diverse mineralogy of Platreef ores can lead to suboptimal performance in standard comminution circuits, necessitating adaptive operational strategies.
The challenges posed by complex orebodies extend beyond initial plant design. Napier-Munn [19] highlights how variations in feed characteristics can negatively impact operational strategies, leading to fluctuations in throughput and recovery [19]. For the Platreef deposit, Schouwstra et al. [20] demonstrated how changes in mineralogical composition across the orebody can necessitate frequent adjustments to grinding and classification circuits, potentially reducing overall plant efficiency.

2.4. Machine Learning (ML) in Comminution Performance Prediction

Recent advancements in ML techniques have enabled more accurate predictions of comminution performance based on complex datasets. Notable work in this field includes the regression ML models developed by Compan et al. [21] for the Chuquicamata plant, and Lusambo and Mulenga [22] for the Kansanshi process plant, both treating copper sulphide ores through milling and flotation processes. McCoy and Auret [23] applied various machine learning algorithms, including Random Forests and neural networks, to predict SAG mill performance using multivariate ore characterisation data. Their results showed significant improvements in prediction accuracy compared to traditional empirical models.
Research suggests that the integration of ML in comminution performance prediction offers numerous advantages such as enhancing predictive accuracy, optimising energy consumption, process optimisation and control in mineral processing [24,25]. By leveraging advanced algorithms, ML can model complex relationships between operational parameters and output variables, leading to improved decision-making and process optimisation. According to Moraga et al. [24], ML techniques, such as neural networks, have demonstrated exceptional predictive capabilities, achieving R2 values greater than 0.99 in various scenarios. Similarly, the application of ML in predicting power consumption in semi-autogenous mills has shown substantial capacity to explain variability, with models like Random Forest achieving R2 values of 0.94, aiding in energy efficiency improvements [26,27].
In a case study by Both and Dimitrakopoulos [28], the incorporation of specific variables like power draw and particle size significantly reduced prediction errors, demonstrating the superiority of ML over traditional linear models. Moreover, proactive process control, enabled by ML, reduces reliance on laboratory testing, streamlining operations and enhancing productivity [25]. Zou et al. [29] demonstrates that a hierarchical intelligent control method using ML can increase process throughput by 6.05% and reduced power consumption by 7.25% in a mining operation.
A study by Nghipulile et al. [30] utilised ML techniques to predict the BWI of copper ores based on mineralogical and textural features. Their study demonstrated the potential of these advanced analytical methods in capturing the relationships between ore characteristics and comminution behaviour. However, for PGE ores, no studies have been explored, which prompted this investigation.

2.5. Optimisation in Stockpile Operational Tactics

Stockpile operational tactics are crucial to the integrated management of the day-to-day feed ore variability, which affects the throughput of the comminution and beneficiation circuits [31,32]. With the operation, the parameters of the comminution circuit can be altered in conjunction with the incoming feed and the separation process downstream [33]. A stockpile operational tactic subject to geological variability is a nonlinear, multi-objective programming problem. Such a problem is usually modelled under the assumption that the production process is steady, and the model parameters are deterministic. However, variations in orebody mineralogy led to frequent changes in model parameters and constraints. This results in a drive for optimisation functionality development [34].
Optimisation schemes applied to mineral processing simulations, such as multi-objective optimisation and multi-disciplinary optimisation, have identified non-intuitive solutions for comminution and other processing operations, demonstrating the potential for improving efficiency and output. Other schemes, including the fuzzy mining algorithms have been proposed for controlling and predicting optimum milling conditions, addressing the nonlinearities and extensive delays characteristic of mineral processes [35]. Despite these measures, there is still an opportunity to integrate the other intelligent optimisation functions to relate the influence of mineralogy to comminution performance. Among these, the particle swarm optimisation (PSO) algorithm can play a critical role.
PSO, originally proposed by Kennedy and Eberhart [36], has been successfully utilised to tackle diverse challenges, including scheduling issues in open mines [37], subjective classification problems related to carrying capacity grades [38], the optimisation of mine water reuse [39], and mineral exploration endeavours [40,41].
PSO is designed to balance exploration (searching through the global space) and exploitation (refining the search in promising areas) [42]. The algorithm typically converges to a solution by iteratively updating the positions of particles in the search space, reducing the time required to reach optimal solutions [43]. In a study by Su et al. [42], the PSO was used to generate noiseless gravity responses, which suggests its capability in handling clean datasets effectively. The PSO is a robust optimisation technique that can be integrated with neural networks to improve their performance in handling complex, nonlinear problems [44]. This integration is particularly beneficial in comminution, where predicting performance involves dealing with complex variables and datasets.
Therefore, the PSO is a well-established algorithm used in various geophysical inverse problems [44]. It is commonly applied due to its simplicity and effectiveness in many optimisation tasks. However, in mineral processing, the capability of a PSO algorithm to maximise material ore throughput in response to feed mineralogical variability has not been explored.

3. Materials and Methods

The overall framework of this study is shown in Figure 1, which outlines that the progress commenced with the regression ML model for predicting the BWI, and the simulation of the throughput. The PSO-based mode of operation optimizer was used to maximise the comminution throughput from the blended ore stockpiles. The authors originally collected the data for the development the geometallurgical programme for the Akanani deposit. The geometallurgical programme aimed to comprehend the orebody’s variability and identify the geological properties influencing metallurgical performance. The samples were collected from various locations within the orebody to capture its variability. A core drilling sampling technique was used for this project. The samples were prepared by crushing, grinding, and splitting to obtain a representative sub-sample for subsequent test work.

3.1. Geometallurgical Data Inputs

Two datasets were used as inputs for the downstream steps to identify specific mineralogical and metallurgical characteristics that affect the efficiency and effectiveness of operational tactics in comminution processes. The first dataset, marked with the single asterisk symbol, includes mineralogical attributes, including bulk mineralogy, mineral proportion, and mineral gangue association. The second dataset, marked with the double asterisk symbol, includes the metallurgical attributes, including BWI, P80, F80, and relative density.

3.1.1. Mineralogical Dataset

A drilling programme was undertaken to extract drillhole cores from the Platreef PGM deposit located in the northern limb of the Bushveld igneous complex in South Africa. The Platreef deposit ores consisted of a wide range of lithology types with varying amounts of PGM, base metal sulphides (BMSs), and a notable amount of silica, which poses challenges in the separation process from valuable minerals. Two specific ore categories were chosen for examination in this investigation. Ore I (FPX), characterised by high-grade PGM content, and Ore II (P-FPX), which exhibits lower PGM concentrations. Analysis of the mineralisation ratio of PGM between Ore I and Ore II indicated an expected future blend averaging 25% (Ore I) and 75% (Ore II). Table 1 contains detailed data on the overall mineralogical composition, the distribution of BMS varieties, BMS correlations, and comminution outcomes for both high-grade particles (FPX) and low-grade particles (P-FPX), covering more than 203 factors known to impact the efficiency significantly. The characteristics of the P-FPX and FPX specimens, derive from two distinct lithological categories. Thus, eight geometallurgical units were identified, with the samples extracted from eight disparate boreholes and an average thickness of 11 m per lithological category.
Mineralogical tests were conducted for specimens from P-FPX and FPX to identify the characteristics of PGM and BMSs, achieved by grinding all specimens to 80% passing 75 μm. The derived data were fundamental to evaluate the processing tendencies of different rock categories. Regarding the overall mineral composition, Quantitative Evaluation of Minerals by Scanning Electron Microscopy (QEMSCAN) was used to perform an analysis of bulk mineralogy and characterisation of BMSs. The samples were screened into three size classes (+53, +20, and −20 μm) post-grinding. A thorough examination of PGM was then performed through a bright phase/specific mineral exploration to completely delineate the PGM in each specimen. Principal components were quantified using inductively coupled plasma-optical emission spectroscopy (ICP-OES) following the dissolution of the sample [45]. The PGEs were evaluated via a fire assay. The identified PGMs were further classified based on dimensions, release, affiliation, and comparative abundance. In the context of PGM characterisation, 20 refined segments of the ground sample were prepared for each rock category and PGM, utilising QEMSCAN, with the reporting of a mineral contingent upon a statistically significant amount of grains being discovered for that mineral. The utilisation of the QEMSCAN involved the following steps:
  • Sample preparation: the sample surface was polished to a smooth finish to ensure good electron imaging and accurate X-ray analysis, followed by coating with a thin conductive layer to prevent charging under the electron beam during analysis.
  • Instrument setup: measurement parameters were defined, and energy thresholds were set.
  • Data acquisition: automatic scanning, mineral identification and mapping were used.
  • Data processing and analysis: quantitative analysis of the mineral composition, including modal mineralogy (percentage of different minerals), particle and grain size distribution, mineral associations, liberation characteristics, and textural information, was performed.
All mineralogy information is presented in Table A1, Table A2, Table A3, Table A4, Table A5 and Table A6 (Appendix A). The table provides a comprehensive overview of the bulk mineralogy composition, BMS mineral proportion, and mineral gangue association for both the P-FPX and FPX lithologies, including their respective rock types. The explanation for these results can be found in Section 4.1.

3.1.2. Metallurgical Dataset

A comminution metallurgical test (based on Bond Ball Mill standard test) was carried in the laboratory comminution tests to assess the grindability. This test was based on relative density, and BWI, and involved the grinding of approximately 1286 kilogrammes of drill core samples representing various geometallurgical units. Comminution testing was performed using samples that accurately portrayed the domain point samples of the different geometallurgical units or rock types originating from individual drill core samples. Subsequently, point sample blend composites were created that combined geometallurgical units from individual drill core samples with domain composites that blended various geometallurgical units from different drill core samples. The laboratory comminution results for FPX and PFPX results are displayed in Table 2 and are discussed in Section 4.1.

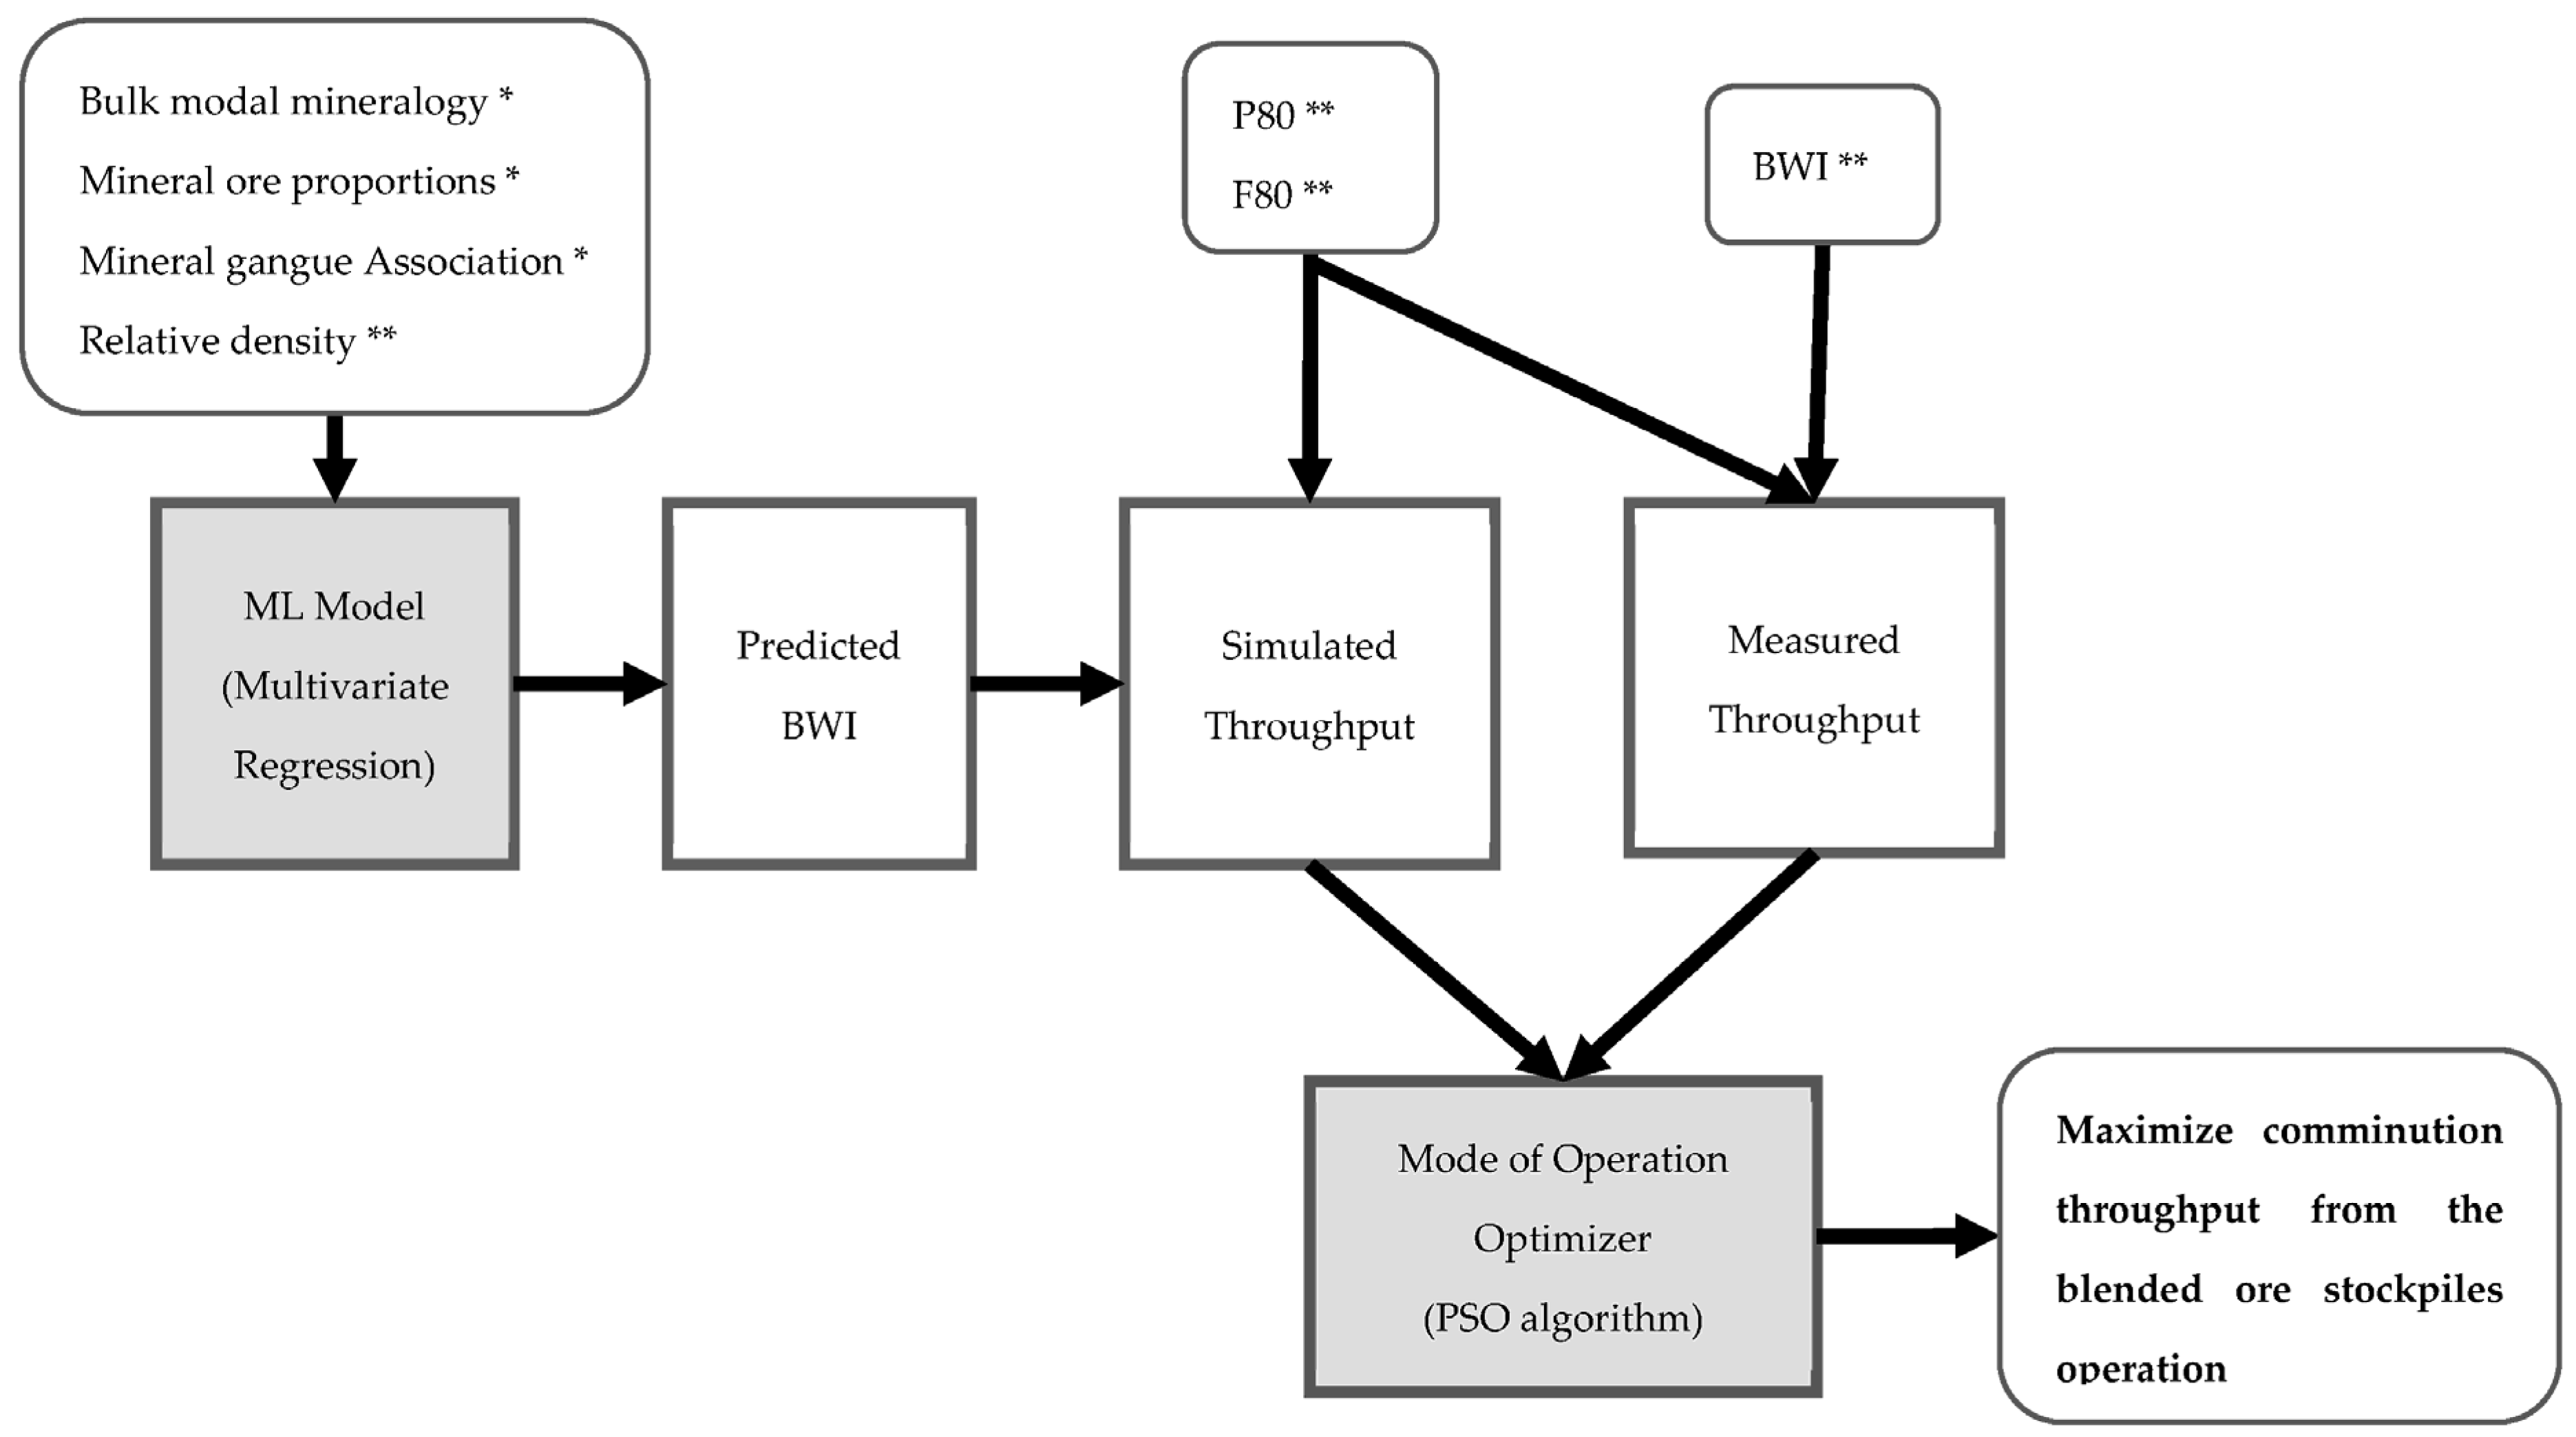
3.2. Machine Learning Model

A multivariate regression ML model was implemented to simulate a throughput model based on established mineralogical variables’ geometallurgical data inputs. In mathematical terms, the general structure for a multivariate regression model can be expressed using an equation, as shown in Equation (1). This equation serves as a fundamental framework to understand and predict the throughput BWI based on the mineralogical variables considered in the model.
y i = β 0 + β 1 Χ 𝚤 1 ^ + β 2 Χ 12 ^ + β n Χ 𝚤 n ^
where y i is the predictor variable (BWI) to be modelled, β i is a set of constant parameters, and Χ i n are explanatory variables (geometallurgical data) for j, from 0 to n.
Each explanatory variable within the dataset underwent a process of normalisation to enhance the clarity and ease of interpreting the constant parameters, as depicted in the mathematical representation provided in Equation (2). This normalisation was crucial to ensure that all the variables are on a standardised scale, facilitating a more effective comparison and analysis of their respective impacts on the overall model. Normalising the variables minimised potential biases or discrepancies in the data, allowing for a more accurate and reliable assessment of the relationships between the explanatory variables and the outcome variable.
Χ 𝚤 𝚥 ^ = Χ i n Χ 𝚤 ¯
where Χ 𝚤 ¯ is the variable’s average along the dataset.
A higher constant value of β j means that the variable Χ i is of higher significance. The data were evaluated using Root Mean Squared Error (RMSE) and the coefficient of determination R2.
Prior to the ML model, PCA was performed to reduce the dimensions of the ore characteristics and pinpoint the mineralogical components crucial for consideration in the multivariate regression analysis. The engineered features encompass the bulk mineralogical composition, BMS proportions, BMS association, and the comminution outcomes of FPX and FPX derived from a pool of over 203 variables relevant to the comminution process. Through the PCA, the quantity of input parameters is condensed to a manageable extent, facilitating the development of a flexible and valuable model for the Platreef comminution facility. Plotting PC1 against PC2 generates a bivariate representation to encapsulate the primary variance within the dataset, offering a more comprehensive overview than a plot involving any pair of original variables. The underlying concept is that the loss of information is deemed negligible in the context of this analysis. Numerous interrelated numerical metrics are transformed into a set of unrelated yet comprehensive indicators through the dimensionality reduction facilitated by PCA. This methodology simplifies the data structures and mitigates the influence of data noise, enhancing the robustness of the analytical outcomes.
The work index, BWI, for ore feed is a crucial parameter for the development of models that represent comminution performance based on the characteristics and mineralogical composition of the ore. This work index quantifies the specific energy, measured in kilowatt hours per ton (kWh/t), needed to reduce a particulate material from an infinite size down to 100 micrometres [7]. Therefore, a higher value of the work index indicates ores that require more energy. According to the definition provided by the Bond Work Index, the specific energy demanded by a particular grinding operation correlate directly with the work index through a mathematical relationship captured in Equation (3). This equation elucidates the intricate connection between the energy requirements of a grinding process and the inherent grindability characteristics of the ore material being processed. Consequently, understanding and accurately determining the work index is fundamental for optimising grinding operations and achieving desired comminution outcomes in various mineral processing scenarios.
BWI = 10 . W i .   1 P 80 1 F 80
where BWI is the specific energy consumption (kWh/t), P80 and F80 are the 80% passing 75 μm of the product (P) and feed (F).
Subsequently, the predicted BWI was inputted into Equation (4) to determine the feed rate r (plant throughput), which was denoted as “simulated throughput”. Furthermore, the metallurgical dataset was employed to calculate the throughput, which is referred to as “measured throughput” in this context.
r = P BWI
where P = Power Drawn (1000 kW) and BWI = Bond Work Index.

3.3. Optimisation of Operational Tactics

Optimisation of operational tactics shown in Table 3 are based on research con-ducted by Navarra et al. [33,46] and subsequent contributions by Órdenes et al. [47]. The operational tactics involves the use of alternating modes of operation, which offer a holistic response to variations in feed mineralogy and other operational parameters within the comminution plant. The investigation considers the analysis of two distinct types of ores, namely, Ore 1 and Ore 2, which are blended and processed under the operational Mode A and Mode B. The mineralisation ratio of PGM, determined by the PGM mineralogical compositions, indicates that the deposit will yield an average blend of 75% for Ore 2 and 25% for Ore 1 in the foreseeable future. Consequently, a continuous application of mode A is anticipated to lead to an accumulation of excess Ore 1 and a deficiency of Ore 2 over time. This situation could impede the mine pro-duction scheduling process and eventually result in feed imbalances, thus reducing the efficiency of mining equipment utilisation and causing a significant decline in down-stream performance metrics.
Considering the above context, the mining operation must use a higher percentage of ore 1, exceeding 35%, to mitigate the risk of a shortage while enhancing overall throughput capacity. The decision to transition to mode B hinges on the underlying assumption that an achievable throughput rate, measured in tons per hour (TPH), and the optimised parameters W1B and W2B will effectively operate during planned shutdowns or in the event of an upgrade in the stockpiling machinery. The potential change to a contingency plan depends on the existing volume of stockpile reserves. For example, opting for Contingency A would be preferable if the quantity of Ore 1 mate-rial falls below 35% in Mode A. Conversely, in Mode B, a shift to Contingency B would be warranted if the proportion of Ore 2 material dips below 25%. However, this scenario is improbable in cases where a substantial quantity of Ore 1 is blended with Ore 2 in Mode A. The strategic and operational approaches presented in Table 3 were de-rived from research conducted by Navarra et al. [33].
Table 3. Operational Tactics.
ParametersDepositsMode AMode B
Regular Contingency Regular Contingency
HG FPX (Ore 1) in feed (%)w1Dw1Aw1AContw1Bw1BCont
LG P-FPX (Ore 2) in feed (%)w2Dw2Aw2AContw2Bw2BCont
Throughput (t/h) Max rDrArAContrBrBCont
where
  • w1D and w2D are the deposit weight fractions of Ore 1 and Ore 2;
  • rA and rB are the feed rates of Mode A and B;
  • w1A, w2A, w1B and w2B are the blended feed weight fractions of ores 1 and 2 in Mode A and B, respectively;
  • rACont and rBCont are the blended feed rate for the Mode A and B Contingencies;
  • w1ACont, w2ACont, w1BCont and w2BCont are the weight fractions of Ore 1 and Ore 2 fed into the Mode A and B Contingencies, respectively.
The average throughput in Equation (5) describes an operational policy that would always use the Mode A configuration, experience chronic Ore 2 shortages, and be forced to switch between the regular Mode A and its Contingency.
r = w 1 A w 2 B w 2 A w 1 B w 2 B r B r A w 2 A w 1 D w 1 B r B r A w 1 A W 2 D   r B
In terms of Equation (5) and the operational tactics outlined in Table 3, the significant input parameters for determining the throughput and trigger point in the alternating mode of operation between Mode A and B are the feed rates rA, and rB the blended feed weight-fractions w1A, w2A, w1B, and w2B, the blended feed rate rACont and rBCont Mode A and B Contingency, the weight fractions w1ACont, w2ACont, w1BCont and w2BCont of Ore 1 and Ore 2.
Parameters such as the deposit weight fractions w1D and w2D of Ore 1 and Ore 2 are all physical properties of the PGM mineralisation ratio based on PGM mineralogical proportions. Although the model should consider parameters relating to the operating conditions of milling, they were omitted. This is because the parameters in Equation (5) are monitored as part of the stockpile management and blending strategies.

4. Results

This section aims to present the results of the methods described in Section 3. First, the laboratory result of mineralogical complexities in the lithologies hosting the PGM Platreef ore deposit are presented. Second, the regression ML model is used to evaluate the influence of these mineralogical attributes on the comminution performance, based on BWI. We observed that different ore variability drives the predicted BWI used to simulate the throughput. Third, the study will showcase five different throughput production campaigns improved by PSO-based mode of operation tactics.

4.1. Key Geometallurgical Attributes Influencing Comminution Performance

4.1.1. Mineralogical Attributes

Table 4 presents the mineralogical characteristics of two lithologies of six distinct production campaigns planned for future production activities. The mineral characteristics exhibited varying degrees of mineral content in the different lithologies, with Chlorite ranging between 1.14% and 8.51%, iron oxide fluctuating from 0.39% and 4.44%, and silicates ranging from 2.59% to 12.38%. This variability indicates a significant range of differences and a relatively small relative density (RD) between 2.83% and 3.32%. Despite these variations, BWI remains consistent throughout the campaigns, with the PSO falling within the 74 to 95 μm range. These laboratory findings serve as crucial input for the algorithm designed to forecast the most effective operational strategies for production processes.
A series of tables in Appendix A detail the bulk mineralogy of the samples. Table A1 illustrates the comprehensive bulk mineralogical composition of FPX (mass%) in various rock types (FPX1, FPX2, FPX3, FPX4). The results showed that three minerals, orthopyroxene, feldspar, and clinopyroxene, are dominant in the four rock types. They cumulatively make up 91.63% (FPX1), 80.89% (FPX2), 85.51% (FPX3) and 77.62% (FPX4) of the minerals. The dominant mineral in all types of rock is orthopyroxene, albeit in varying proportions. However, feldspar exhibited considerable composition diversity in different rock types. Orthopyroxene emerged as an essential mineral present in all rock types, highlighting its importance in the mineralogical composition of FPX. Therefore, FPX primarily comprised pyroxene with varying levels of feldspar (11.74–37.96%), and other silicates, in minor proportions, of olivine, serpentine, Chlorite, chromite, Fe-Oxides, carbonates, carbonates and clay.
Table A2 presents the percentage bulk mineralogical mass composition of P-FPX for various rock types (P-FPX1, P-FPX2, P-FPX3, P-FPX4). Within this table, one can observe the distribution of different minerals in each rock type, highlighting the variations in mineral composition seen among the different P-FPX samples. The dominant mineral in the P-FPX samples is pyroxene, with moderate variation, accompanied by fewer amounts of feldspar and serpentine. Variable quantities of olivine are also present. Other predominantly amphibole silicates are also found in different proportions across the samples.
Table A3 illustrates the proportions of BMSs of various minerals within four different rock types (FPX1, FPX2, FPX3, FPX4). The results showed that the dominant minerals across the rock types are pyrrhotite, pentlandite, and chalcopyrite, with a cumulative mineral content of 99.23% (FPX1), 98.94% (FPX2), 98,55% (FPX3) and 98.54% (FPX4). The distribution of minerals demonstrated notable variations among the different types of rock. Pentlandite achieved its highest representation in FPX2 (25.37%) and its lowest in FPX3 (18.23%). However, pyrrhotite emerged as the predominant mineral present in all rock types. Pyrite, in contrast, is non-existent in FPX1 and FPX2, yet registered its presence in FPX3 (0.12%) and FPX4 (1.19%).
Table A4 illustrates the proportions of various minerals in different rock types, denoting the percentages of mass of each mineral in the respective rock types. The results showed three dominant BMSs, pyrrhotite, pentlandite and chalcopyrite, in rock types, with a cumulative mineral content of 99.56% (P-FPX1), 98.14% (P-FPX2), 99.82% (P-FPX3) and 99.53% (P-FPX4). Pyrrhotite is a predominant mineral in all types of rock, although with different proportions. Pentlandite proportions exhibited some variability among rock types, suggesting fluctuations in occurrence. However, the proportions of the chalcopyrite exhibited stability across the diverse rock types, demonstrating its uniform distribution. Pyrite proportions were low, with slight variations indicating a consistent but minor presence. Other sulphides showed a minimal presence in the rock types, implying their limited contribution to the mineral composition.
Table A5 illustrates that the free surface constitutes the bulk mineral in the FPX rock type, with proportions above 85%, showing constant variation. The results showed that BMSs are free from other minerals, with the balance associated mainly with silicates. The association of BMSs with silicates was higher in FPX1. The highest percentage of free surface minerals was found in FPX3 (91.04%), whereas the lowest proportion was observed in FPX1 (56.3%). Regarding silicates, FPX1 showed the highest percentage (12.35%), while FPX3 displayed the lowest (7.52%). Chlorite shows variability with the peak percentage in FPX4 (2.27%) and the nadir in FPX1 (0.35%). The tabulated results indicated that FPX3 has the highest overall mineral content compared to the other rock types under consideration. The distribution of minerals exhibited substantial variations in the diverse rock categories, thereby highlighting the geological heterogeneity within the BMS association.
Table A6 shows the results of the BMS association in the P-FPX for different types of rock. The results showed that the BMS in the P-FPX sample is free of other minerals, with the balance associated mainly with Chlorite and silicates. Silicates had varying BMS associations in different rock types, with the highest percentage in P-FPX3. Chlorite showed significant variability in the percentages of association between rock types. The free surface had the highest percentage association among all types of rock. The distribution of minerals varied significantly between different types of rock. Certain minerals, such as Chlorite, exhibited inconsistent associations across rock types.

4.1.2. Metallurgical Attributes

Table 2 illustrates the results of the comminution variability of two different lithologies: FPX and P-FPX. For FPX, the results showed variations in BWI and the grind size achieved among the rock types (F-PXI, F-PX2, F-PX3, F-PX4). For the 90% confidence interval, the BWI ranged from 19.4 kWh/t to 23.5 kWh/t for the FPX, with an average of 23.14 kWh/t for the P-FPX. The samples were competent with respect to ball milling with hardness classifications of hard to very hard. The results of the BWI values ranged from 18.4 kWh/t to 23.5 kWh/t, with an average of 14.2 kWh/t for FPX.
Figure 2 compares the actual PGM and projected throughput in the analysed campaign. The throughput regression model’s accuracy was verified by applying comminution and the PSO across multiple campaigns. The model’s forecast shows a correlation coefficient of 83% and a mean absolute error of 0.44%.

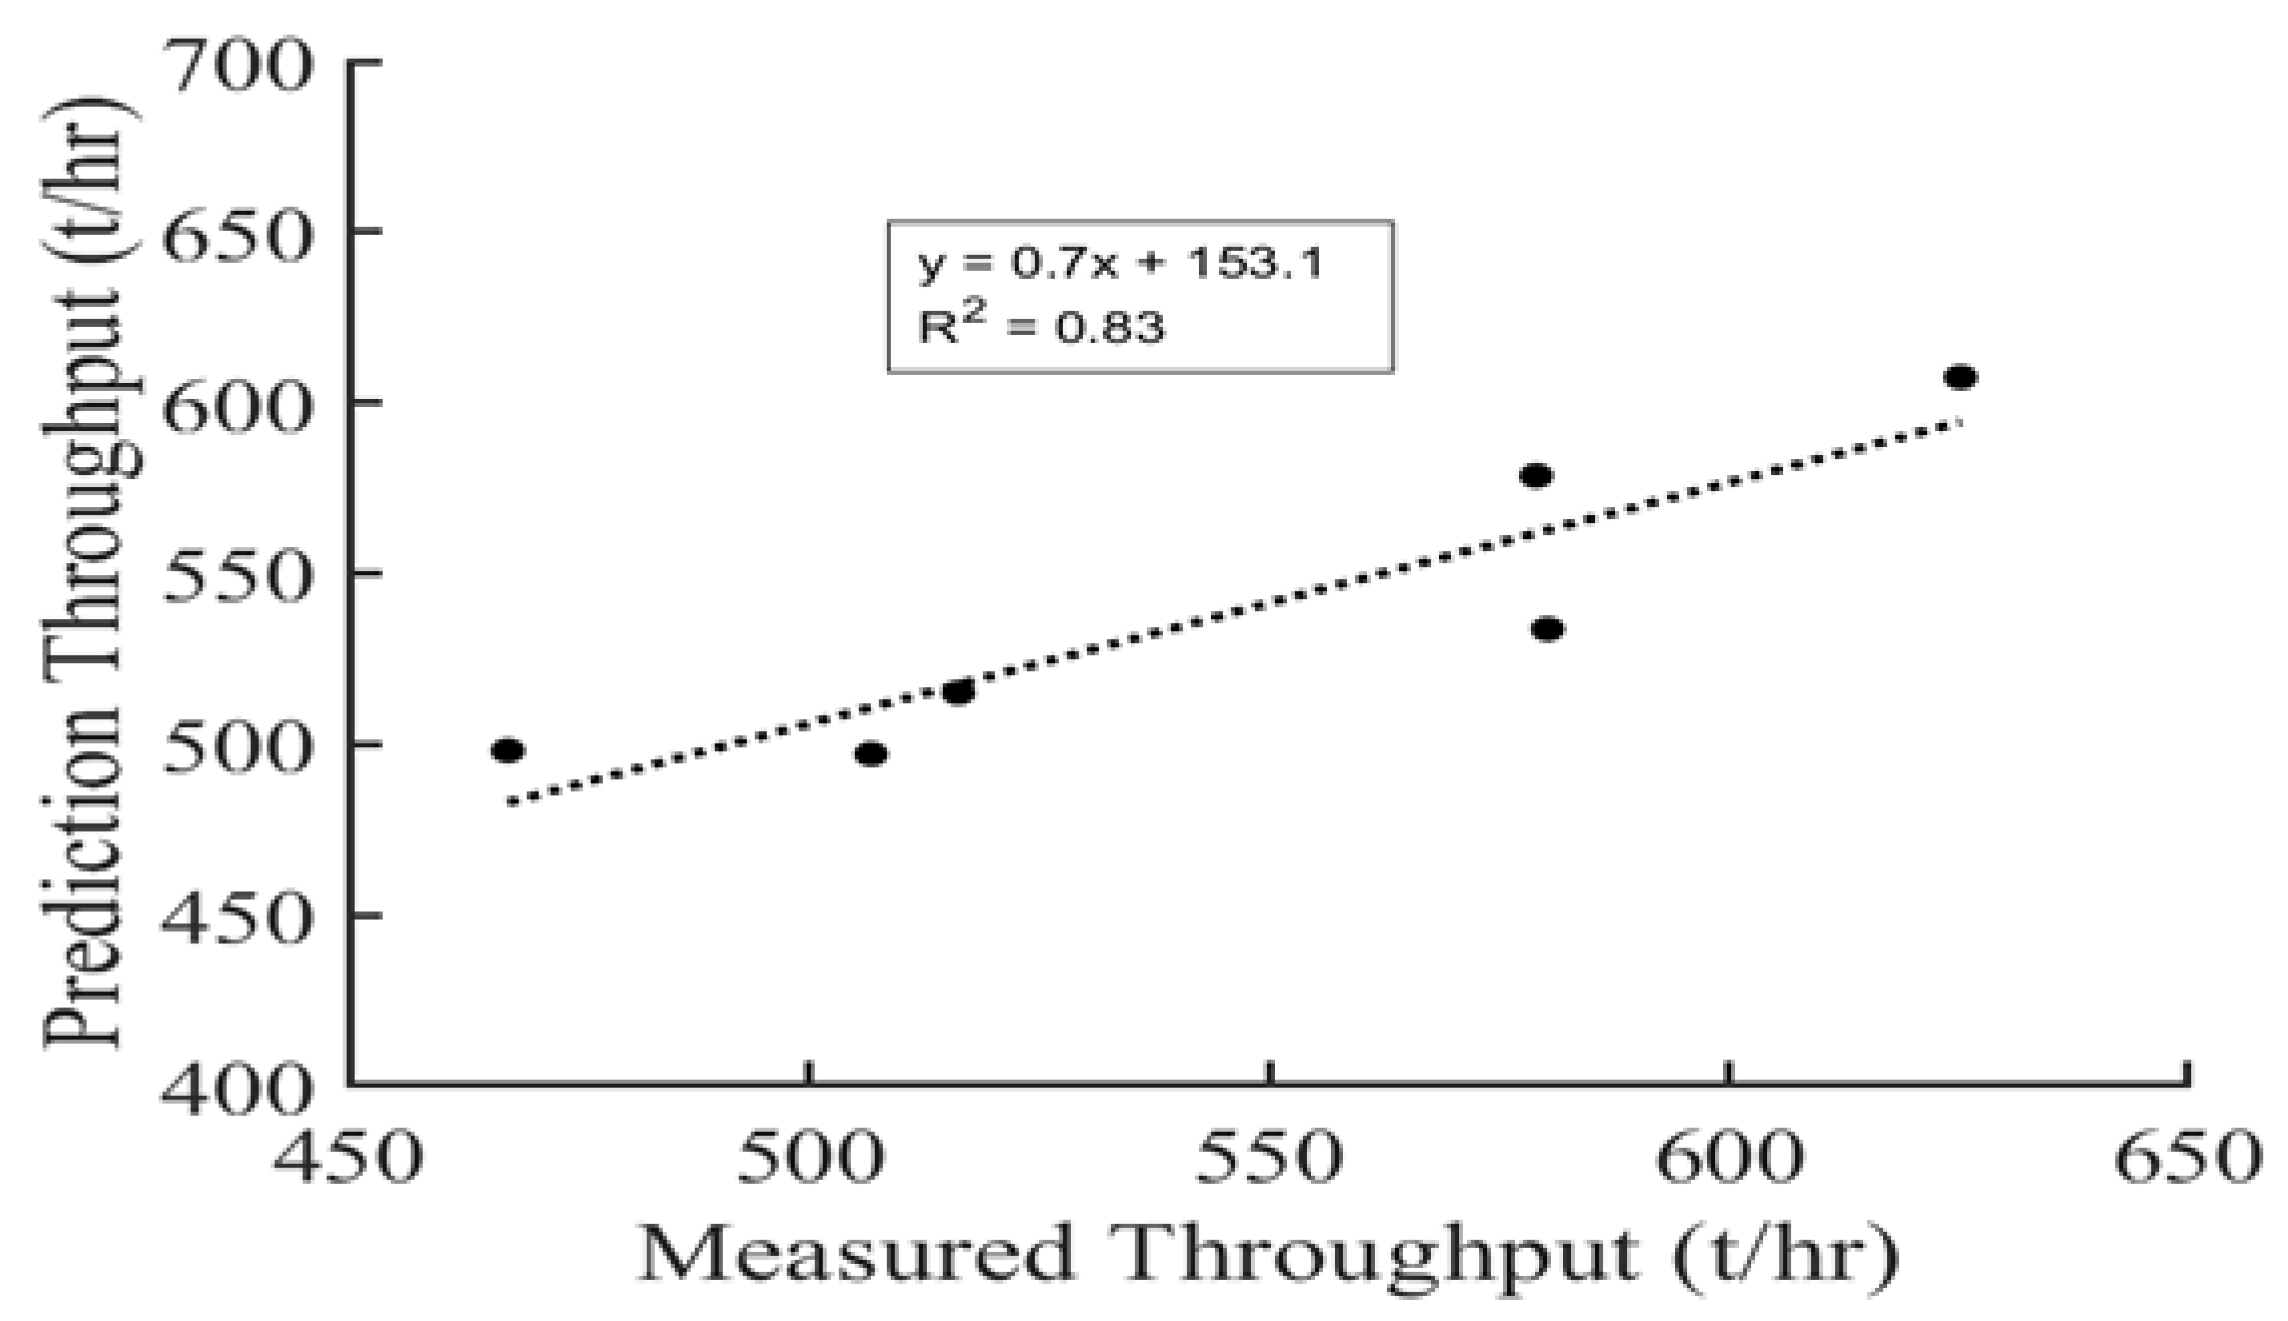
4.2. A Predictive Model for Comminution Performance

Table 5 shows the correlation results between the BWI and mineralogy. The numerical values revealed the strength and direction of the linear relationship between the variables. Chlorite had a strong positive correlation with iron oxides (0.74) and BWI (0.71) and a strong negative correlation with silicates (−0.74). Iron oxides showed a strong positive correlation with Chlorite (0.74) and a negative correlation with silicates (−0.85). Silicates strongly correlated negatively with Chlorite (−0.74) and iron oxides (−0.85). BWI has a moderate positive correlation with Chlorite (0.71) and a weaker positive correlation with iron oxides (0.51) while showing a moderate negative correlation with silicates (−0.59). This statistical analysis is valuable for identifying potential correlations between the variables under investigation. Understanding these correlations can help predict one variable’s impact on another within the study’s framework. Thus, it provides insights into how changes in one variable affect another.
To determine the number of components to keep for this optimisation process, the variation in principal components, as a function number component, as shown in Figure 3a, is needed. The principal analysis Scree plot (Figure 3a) showed that only two components can be retained to reduce the dimensionality of data and avoid overfitting. The Biplot shown in Figure 3b highlights that the objects are displayed as points, variables are displayed as arrows or vectors, and scores deviate from the average for each variable.
Figure 3b shows the numerical variables’ correlation matrix. The large obtuse angle between RD and silicates indicates that the correlation between these variables is strongly negative. The acute angle between Iron oxides and RD shows that the correlation between these variables is strongly positive. The obtuse angle between Chlorite and silicates shows their correlation is strongly negative. Thus, silicates and RD provide approximately 70% additional information, and there is a significant correlation between these factors and BWI.
In terms of the length of the variable vectors, most of the variation is explained by the bottom diagonal and top variables due to the greater length of variable vectors. Thus, the most significant contributor of the first PC is silicates, which is the diagonal variable and shows a higher variation. Rd is the most contributor of the second PC on the top, showing a higher variation.
Principal Component Analysis (PCA) was implemented prior to the regression analysis to address the problem of multicollinearity. Consequently, in datasets characterised by a several features, multicollinearity—defined as the substantial intercorrelation among features—can present significant challenges. PCA addresses this issue by producing principal components that are orthogonal, or uncorrelated, thereby enhancing both the robustness and interpretability of the regression model [48]. Furthermore, PCA can proficiently mitigate data noise by prioritising the components that contribute the most to the overall variance, thereby impacting metallurgical performance and facilitating improved model efficiency [49]. Although it is feasible to conduct a regression analysis without the application of PCA, such an approach may lead to overfitting, particularly in high-dimensional datasets, as exemplified in this study.
Figure 4 shows that the variables that had the most impact on explaining the metallurgical performance in the PCA were Chlorite, iron oxide, silicates, and RD. These variables accounted for approximately 17% of the initial 23 independent variables. PCA enables the identification of redundant variables, characterised by a strong linear correlation between two variables, as well as the determination of the factors that have the most significant impact on explaining a specific phenomenon.
Figure 4 shows the Q-Q plot where 30% of the data were used to calculate the model coefficients. In comparison, the remaining 70% assessed the predictive ability of the model proposed in Equation (3) as the objective function.
After the residual treatment, the regression equation was utilised to compute the final response function based on the mineralogical component that impacts BWI’s comminution performance. The following BWI model was developed for the Platreef deposit:
BWI = C 0 + C 1 X t 1 C 2 X t 2 C 3 X t 3 + C 4 X t 4 + C 5 X t 5 + C 6 X t 6 + C 7 X t 7 C 8 X t 8 + C 9 X t 9 + C 10 X t 10 + C 11 X t 11
where
C 0 = Constant ,   C i = Coefficients X t 6 = IronOxides*RD
X t 1 = Chlorite X t 7 = Silicates*RD
X t 2 = IronOxides X t 8 = Chlorite2
X t 3 = Silicates X t 9 = IronOxides2
X t 4 = RD X t 10 = Silicates2
X t 5 = Chlorite*Silicates X t 11 = RD2
Most of the input parameters in the Platreef response function are mineral species in the ore feed, as shown in Equation (6). The other parameters, including the RD, are all physical properties of the ore. No parameter relating to operating conditions is included, although the model considers these two processes. This is ascribed to the fact that the parameters in Equation (6) are among those monitored on the plant. The advantages of this model are that it is simple, flexible, and quick to manipulate when estimates are needed.
The statistical analysis results shown in Table 6 demonstrate that only three variables, i.e., IronOxides*RD, Silicates*RD, and Chlorite2, have a statistically significant positive effect on BWI. The results show that a one-unit change in the IronOxides*RD combination mix will result in a 4.8% upward variation in BWI, holding the impact of other variables constant. A one-unit change in the silicates*RD combination mix will result in a 15.4% upward variation in BWI, assuming no changes in different variables. Furthermore, a one-unit change in the Chlorite2 mix has an exponential effect, resulting in a 12% upward variation in BWI, holding the impact of other variables constant.
While the results show that IronOxides and silicates negatively affect BWI, it is statistically insignificant. Chlorite, RD, Chlorite*Silicates, iron oxides2, silicates2, and RD2 exhibit a positive relationship with BWI, but they are also statistically insignificant.
The repeated computation of the Root Mean Squared Error (RMSE) and the coefficient of determination R2 was used to assess the model’s efficacy in regression analysis. The model statistics are presented in Table 7. The regression analysis resulted in a coefficient of determination R2 of 0.80, indicating that 80% of the variation in BWI is represented by all the variables in the model, excluding the residual.

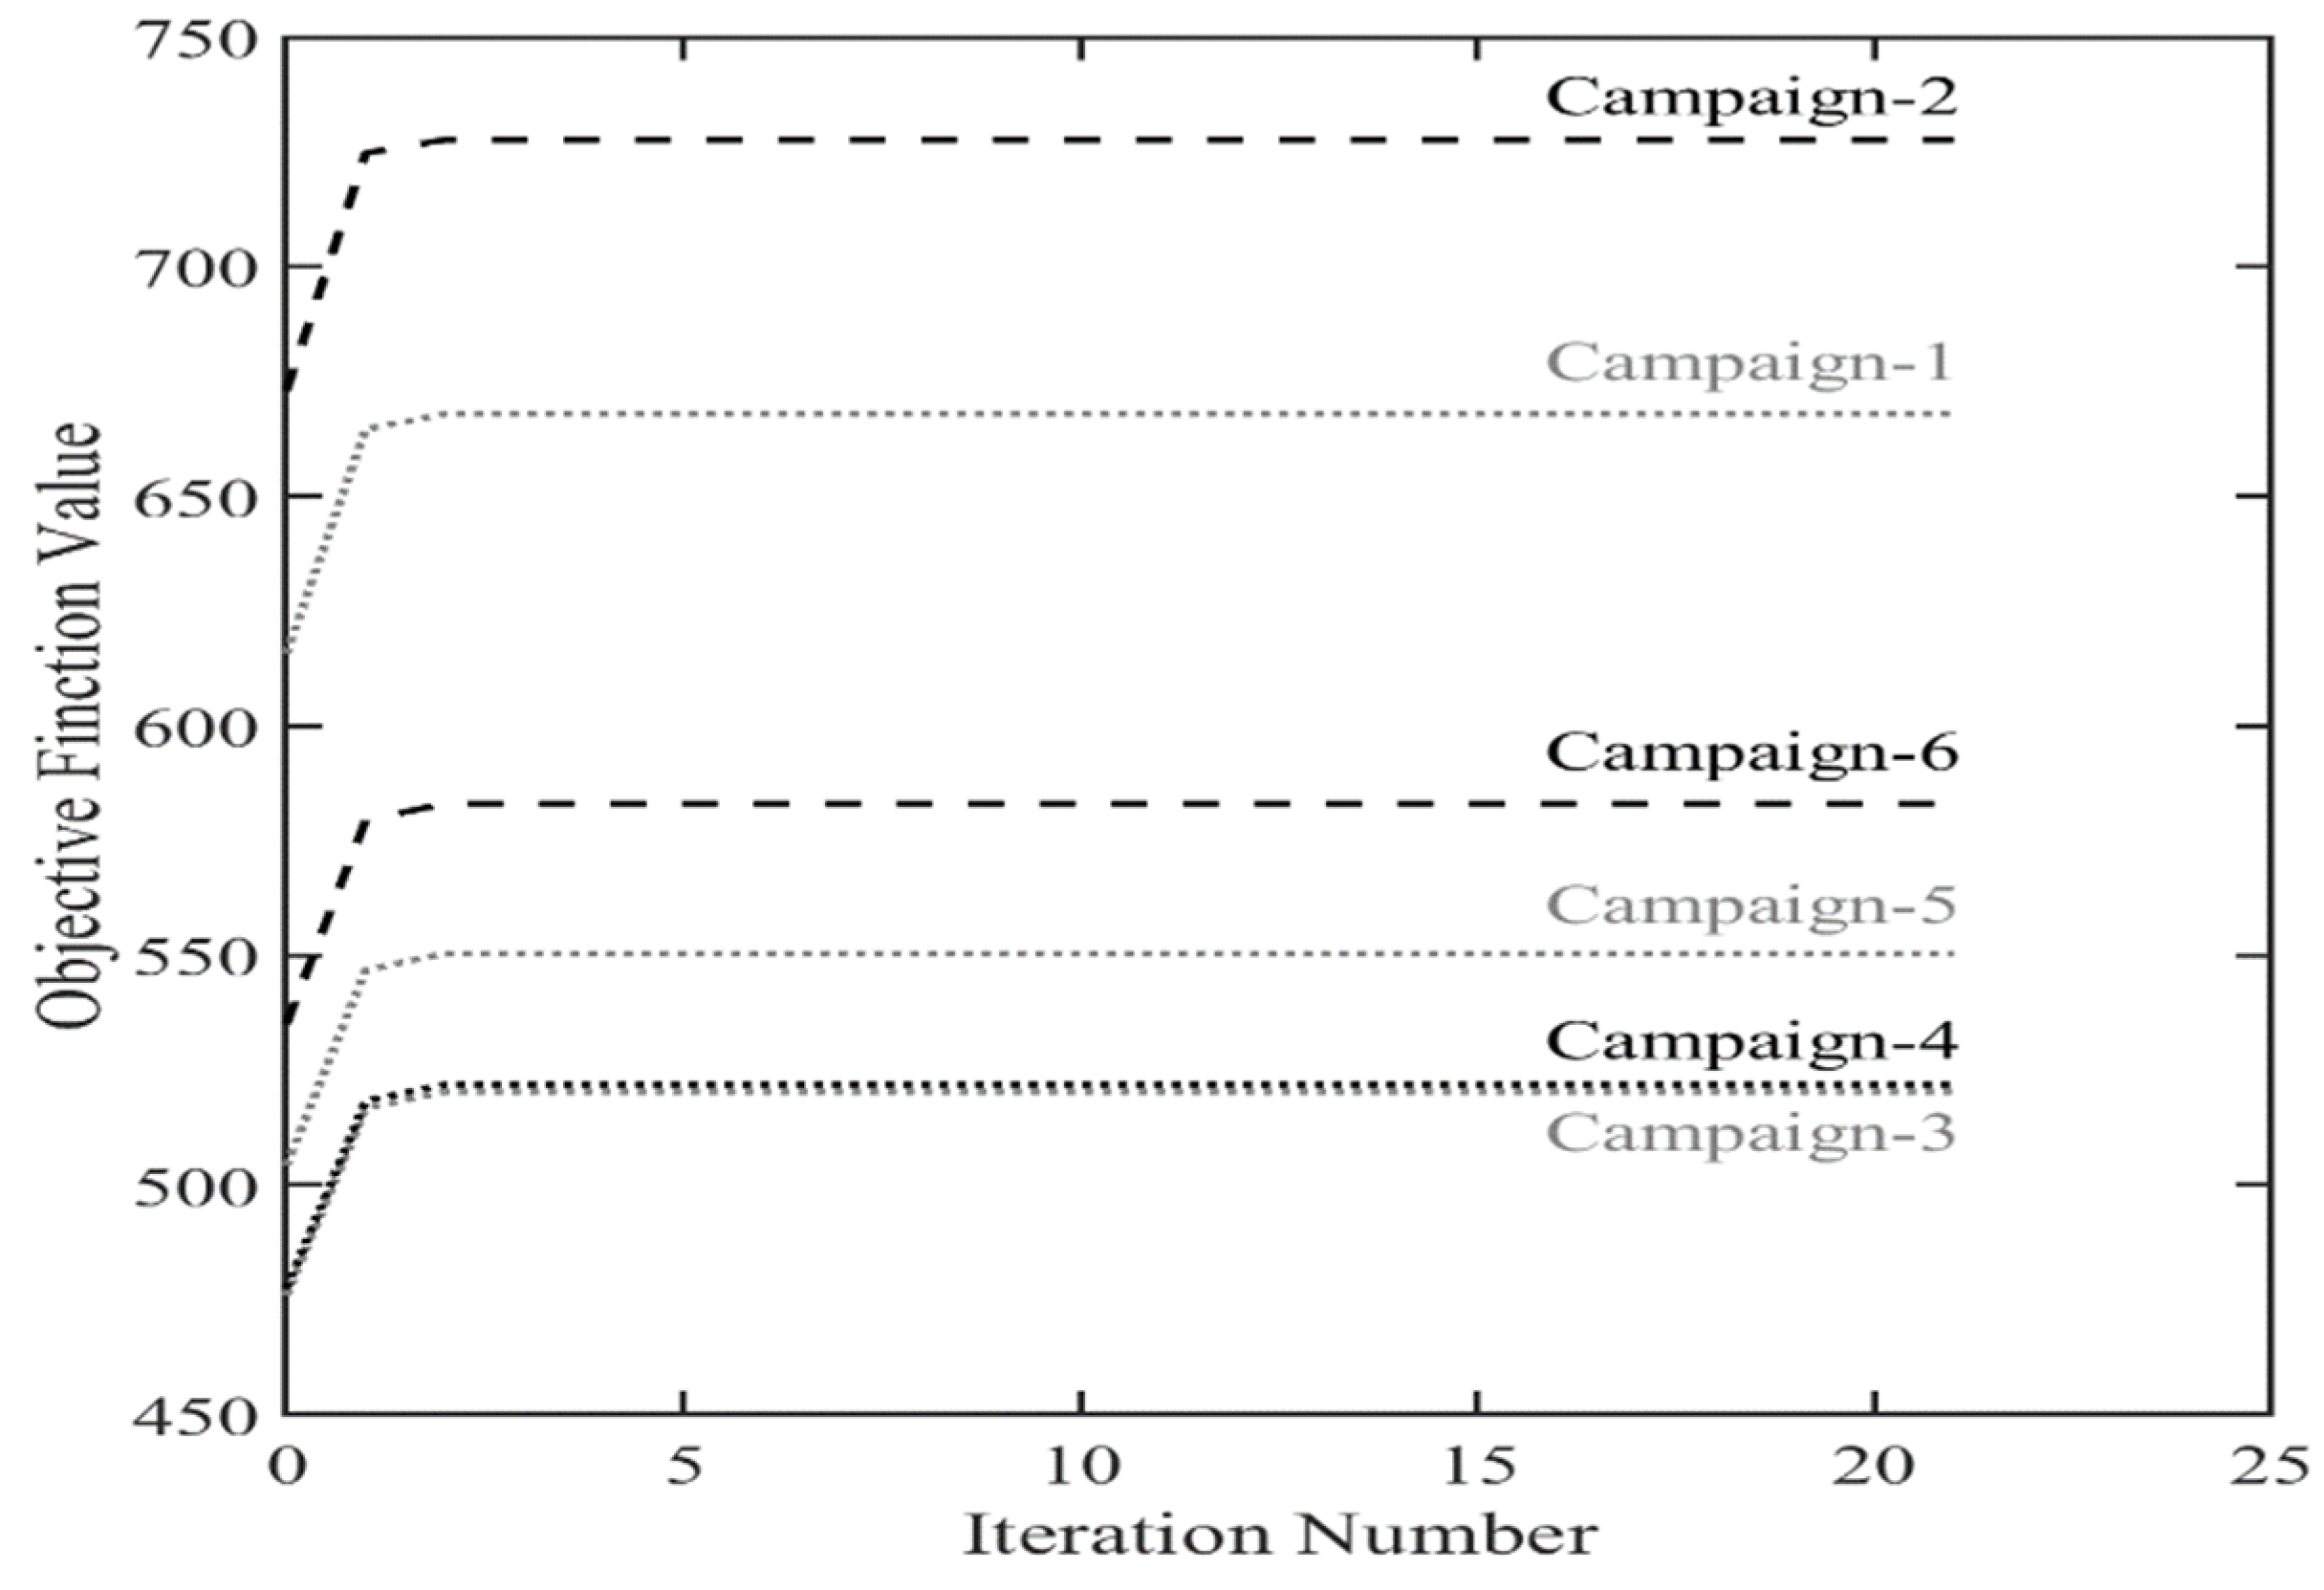
4.3. A Dynamic Optimization Algorithm for Tactical Blending

An innovative methodology for optimising multiple objectives was implemented to effectively handle comminution processes and geological uncertainties. The algorithm developed for this purpose considers various constraints and parameters influenced by geological uncertainties, impacting operational strategies and stockpile management. To prevent overstock of Ore 1, a balance between the weights w1A and w2A is maintained, where w1A + w2A = 100, w2A is greater than w1A, and the value of w1A falls between 35 and 50. Similarly, for Ore 2, the weights w1B and w2B are managed such that w1B + w2B equals 100, w1B is greater than w2B, and w2B ranges between 25 and 50.
The PSO parameters include a swarm size of 20 and 2 unknown variables. The weight inertia, w, linearly decreases from 1.1 to 0.1 during optimisation. Acceleration coefficients, c1 and c2, are set to 1.49 each to guide the particles towards optimal solutions. A termination criterion is established based on an error tolerance of 10−6, ensuring precision in the optimisation outcomes. Additionally, the maximum number of function evaluations is limited to 400 to control the computational complexity of the optimisation process and enhance efficiency. These parameters collectively contribute to the effectiveness and reliability of the optimisation methodology in addressing the complexities of comminution processes and geological uncertainties.
The feed rates, rA and rB, attributed to Mode A and B, respectively, play a crucial role in determining both the throughput and trigger point within the alternating mode of operation involving Mode A and B, as explicitly mentioned in Section 1, Equation (5), and Table 8. Prior research efforts have utilised a deterministic approach to harmonise the operational parameters of the concentrator (rA, rB, w1A, w2A, w1B, w2B) in response to the mineralogical variances present in the feed (w1D and w2D). Nonetheless, this methodology failed to account for essential model parameters like the feed rates specific to Mode A and B, geological uncertainties, and the weight fractions of Ores 1 and 2 in Mode A and B that require blending. Initially, two out of the five distinct rock formations were chosen for extraction in the preliminary phases of the project. This selection was based on a comprehensive evaluation of various factors, including mineralogical composition, physical characteristics, and operational feasibility.
In the context of processing campaigns 1 to 6 under both Mode A and Mode B, the mineralogical composition and unique physical attributes of the ore feed derived from the two ore types, Ore 1 and Ore 2, are detailed in Table 7. These ore types encompass high-grade (FPX) and low-grade (P-FPX) lithologies. The ratio of PGM mineralisation, as determined through the analysis of PGM mineral quantities, suggests that the deposit is anticipated to yield an average blend of 75% Ore 2 and 25% Ore 1 in the foreseeable future.
Following the completion of the input process for the laboratory test outcomes, Table 8 demonstrates the results of the deposit projection generated by the PSO algorithm concerning the weight proportions of Ore 1 and Ore 2, the combined feed rate for both Mode A and Mode B, as well as the Contingency aspect. The operational parameters of the concentrator (rA, rB, w1A, w2A, w1B, w2B), encompassing the variations in mineralogy within the deposit (w1D and w2D), have been replicated through simulation. The data provided in Table 8 and Figure 5 indicate that by harmonising the processing rate and the desired stockpile level, the blend of high-grade PGM Ore I (FPX) and low-grade PGM Ore II (PFPX) will be extracted at rates of 668, 728, 520, 522, 550, and 583 tons per hour for the consecutive campaigns from 1 to 6. The selection between configuration A and B was influenced by the specifics derived from the mineralogical analyses conducted in the laboratory setting. The outcomes suggest that the optimal operational efficiency can be attained at a throughput of 728 tons per hour during campaign 2, all the while upholding a consistent particle size distribution at approximately 75 micrometres, along with stable power consumption and particle size dispersion.
It is important to recognise that the percentage (%) in Table 8 denotes the weight fractions of Ore 1 and Ore 2 for both Mode A and Mode B (i.e., regular and Contingency operational modes) as well as for the deposit.

5. Discussion

The primary objective of this paper was to tackle the challenges presented by geometallurgy in dealing with complex ore deposits and the impact of variability in mineral processing, particularly in comminution processes affected by geological uncertainties and fluctuations in feed composition. The three specific objectives formulated to address this primary objective: To gain a better understanding of the variability of the complex orebody and identify the geological properties that drive metallurgical performance, to investigate the effect of mineralogical variability on comminution performance, and to develop an algorithm to balance the blending strategy.

5.1. Identification of Key Geometallurgical Attributes Influencing Comminution Performance

The study’s first objective was to determine the variability of the complex orebody and identify the geological properties that drive metallurgical performance. Thus, mineralogical analyses were conducted to enhance the efficiency and effectiveness of mining operations and improve recovery rates at Platreef ore. A similar comprehensive study of complex-structured ore bodies was performed at the Kryvyi Rih iron ore basin, where mineralogical analysis aided in selecting the most appropriate mining systems to increase the iron content in the mined ore mass, thereby enhancing recovery rates and achieving significant economic benefits [50]. Similarly, detailed mineralogical assessments conducted in the Broken Hill Sulphide Deposit provide insights that can improve ore recovery and address environmental concerns by allowing for an understanding of the complexity and variability within the deposit [8]. Mineralogical analysis also plays a critical role in identifying and mitigating the loss of valuable minerals during the preparatory stages of analysis, thereby increasing the industrial value of minerals by addressing the challenges posed by their significant mobility and the complexity of their shapes [51].
The current paper found the bulk mineralogical composition of the FPX sample to primarily contain pyroxene with varying levels of feldspar and other silicates in small proportions. Pyroxene is also a dominant mineral in the P-FPX sample, accompanied by lesser amounts of feldspar and serpentine with variable quantities of olivine present. This finding demonstrates more significant variability in the bulk mineralogy in the FPX sample compared to the P-FPX sample.
The base metal sulphides in the FPX and P-FPX rock types were dominated by pyrrhotite across all the rock types, with lesser proportions of pentlandite and chalcopyrite, with notable variations. The best comminution technique for processing base metal sulphides dominated by pyrrhotite, pentlandite, and chalcopyrite with notable variation would involve selective grinding and flotation processes. Selective grinding can optimise the grinding of cassiterite polymetallic sulphide ore by focusing on specific minerals based on their mechanical properties. Additionally, the use of a pyrrhotite mineral processing method involving flotation and magnetic separation can effectively recover valuable metals like copper, iron, sulphur, and pyrrhotite from low copper content pyrrhotite ores [52]. Furthermore, developing technologies like sulfurizing roasting followed by magnetic and flotation concentration have shown promising results in extracting lead and zinc from enrichment wastes, including pyrrhotite-rich materials [53]. These techniques can enhance the efficiency of processing base metal sulphides with varying mineral compositions.
The study also found BMS in the FPX sample to be free from other minerals, with a balance mainly associated with silicates. In this regard, the most suitable comminution technique for processing base metal sulphides in FPX rocks, predominantly associated with silicates, involves the application of high voltage pulses (HVP) for selective treatment of mineralised particles [53]. HVP has shown remarkable effectiveness in selectively targeting mineralised particles, leading to better mineralisation deportment into finer sizes with lower energy input, resulting in higher metal recovery rates and waste rejection during pre-concentration. Moreover, HVP has been found to selectively weaken mineralised particles, making them more amenable to downstream processes while sparing barren rocks from excessive damage, maximising the benefits of pre-weakening [54]. This innovative approach offers a disruptive technology that can enhance the efficiency of processing base metal sulphides in complex ore compositions.
Similarly, the BMS in the P-FPX sample is free from other minerals, with the balance associated with mainly Chlorite and silicates. The processing of such ore can be optimised through a multi-objective technical and economic analysis approach [53]. According to Guldris and Bengtsson [55], this method involves selective comminution, which could improve process capacity by 23% and reduce production costs by 10%. Therefore, according to the information obtained through the mineralogical characterisation, the ore should be processed through a multi-objective optimisation-based approach.

5.2. Development of a Predictive Model for Comminution Performance

The study’s second objective was to investigate the effect of mineralogical variability on comminution performance. The comminution tests are essential for properly designing a mineral processing plant, as they are used to compare the grinding characteristics of different ore minerals and allow for an understanding of their comminution behaviour under compression, which is influenced by their mineralogical, physical, and mechanical properties. This understanding is crucial for optimising the performance of comminution circuits, especially in processing low-grade ores, by enabling a multi-objective analysis that can improve process capacity and reduce production costs [55]. Moreover, the evaluation of ore hardness and grindability parameters through comminution tests supports the optimisation of process plants for various minerals, enhancing the energy efficiency of the comminution process [56]. It also aids in investigating improvements and alternative options for existing operational plants, considering changes in ore characteristics and the need for cost optimisation [34].
In this paper, comminution variability tests have confirmed that the plant feed can be characterised as being hard to very hard and is thus not suitable for Semi-Autogenous Grinding (SAG) milling. Thus, the energy consumption in comminution processes in this regard is relatively lower than that for harder ores. In this regard, the comminution process benefits from a method that minimises shear forces and fine reductions, which are crucial for soft to medium hard ores to prevent unnecessary particle size reduction and energy consumption. Control strategies that involve continuous adjustment and optimisation of grinding parameters to further improve the grinding process’s adaptability and efficiency for varying ore characteristics are crucial [57]. This can lead to economic benefits in mineral processing plants, as the costs associated with energy consumption can be significantly reduced [58].
Based on the abrasion index and the crusher work index, it was found that the ore can be classified as having a medium abrasion tendency. In this regard, employing a vertical roller mill with a horizontal grinding table can be advantageous because it can apply a compressive force with minimal shear, thereby reducing fines and wear on the equipment [58]. This approach aligns with the need to manage medium abrasion ores effectively by minimising unnecessary reductions in particle size, which can lead to excessive wear. Moreover, integrating accelerometer measurements of the mill shell into the control system can further optimise the milling process by adjusting it according to the lithological structure of the ore, thus improving the effectiveness of the milling and classification processes [59].
The paper found a regression coefficient of determination R2 of 0.80, demonstrating the model’s effectiveness in predicting the BWI for various ore types, which is crucial for optimising mineral processing operations. The satisfactory level of accuracy attests to the potential of advanced optimisation tools such as PSO in augmenting the performance of comminution circuits. The paper also identifies the significant positive impact of IronOxidesRD, SilicatesRD, and Chlorite2 on BWI, providing insights into how changes in these mineralogical components affect comminution performance, thereby aiding in the optimisation of grinding processes. Through the statistical analysis to establish correlations between BWI and mineralogy, the study found strong relationships between Chlorite, IronOxides, silicates, and BWI, which can guide the adjustment of processing parameters for improved efficiency. By developing a final regression model that includes coefficients for various mineralogical and physical properties, the paper offers an enhanced understanding of how these factors collectively influence the comminution process, enabling more accurate predictions of BWI. Considering these findings, a processing strategy can be designed to optimise the liberation of valuable minerals from Platreef ore while managing energy consumption and operational costs effectively.

5.3. Implementation of a Dynamic Optimisation Algorithm for Tactical Blending

The third objective of this study was to develop an algorithm to balance the blending strategy. In this regard, the study successfully integrates PSO with new constraints to mitigate excessive stockpile formation, enhancing the efficiency of comminution circuits amidst geological uncertainties, as evidenced by the innovative multi-objective optimisation methodology and the detailed mineralogical assessment highlighting significant correlations between ore properties and operational methods, particularly with Chlorite, IronOx, the Bond Work Index (BWI), and silicates. The utilisation of the PSO algorithm to optimise throughput by dynamically switching between different modes offers a promising solution to the complexities arising from heterogeneous ore deposits and the evolving nature of the concentrator feed [33].
The study provides compelling evidence that a more efficient utilisation of grinding energy can be achieved by defining operational tactics that can adapt to variations in mineralogical composition [60]. For instance, continuous reliance on Mode A could potentially lead to an overabundance of Ore 1 and a shortage of Ore 2, posing challenges in mine production scheduling, feed balance, and optimal utilisation of mining machinery. Consequently, such imbalances could result in costly reductions in downstream performance. To address this issue effectively, it is recommended to consider incorporating Ore 1 in higher proportions (>35%) while adhering to the stockpile constraint (where w2A > w1A and 35 < w1A, <50). This strategic approach aims to avert potential shortages, enhance production efficiency, and sustain a harmonised concentrator operation. Key considerations to bear in mind include the necessity of maintaining an average blend of 75% Ore 2 and 25% Ore 1 to ensure consistent throughput and the significance of using Ore 1 in higher proportions (>35%) while respecting the stockpile constraint (w2A > w1A and 35 < w1A, <50) to optimise operational strategies. w1D
Furthermore, it is assumed that the transition to Mode B entails establishing a practical throughput and optimising W1B and W2B to facilitate seamless operations during shutdowns or equipment upgrades. In scenarios where the percentage of Ore 1 material falls below 35% in Mode A, a switch to Contingency A occurs. Similarly, activating Contingency B is advised if the percentage of Ore 2 material drops below 25% in Mode B. Nevertheless, the likelihood of encountering such situations is minimal if a substantial portion of Ore 1 has already been blended with Ore 2 in Mode A. These assumptions underpin the considerations made during the estimation using the PSO algorithm. Therefore, implementing optimal blending strategies for mineralogical variability can lead to substantial energy savings and consequent cost reductions. While the current research primarily focuses on geological uncertainties and mineralogical variations, it is essential to note that external factors such as machine breakdowns and mill speeds can also significantly influence optimisation strategies.
The model’s forecast shows a correlation coefficient of 83% and a mean absolute error of 0.44%. The low mean absolute error and high correlation coefficient indicate the model’s precise prediction of actual throughput in the processing plant, falling within an acceptable range. The newly developed algorithm significantly improves the deterministic technique used for throughput estimation. The regression equation also proves its capability to accommodate variations in feed ore consistency effectively.
Overall, the study presents an improved processing model, which is outlined in Table 9, contributing to a more accurate, efficient, and adaptable processing model, capable of handling the complexities and uncertainties inherent in mineral processing, which are not addressed by the existing processing model.

6. Conclusions

The Platreef deposit was subjected to mineralogical analysis and comminution test work to evaluate and optimise the concentrator mode of operation and throughput by blending orebodies with high mineralogical variability. The metallurgical test work involved multiple drill core samples extracted from the Platreef nickel–copper–gold PGE deposit situated in the Northern Limb of the Bushveld Igneous Complex in South Africa. The test work involved comminution characterisation, bench scale flotation testing and dewatering. Mineralogical analysis was conducted to understand the characteristics of PGM and BMSs after comminution. The comminution evaluation was executed using samples that accurately portrayed the domain point samples of the distinct geometallurgical units or rock types originating from individual drill core samples. The determination of density samples was carried out by measuring weight in both air and water utilising the given formula for Specific Gravity calculation. Optimisation techniques entail the application of the PCA to reduce the dimensions of the ore characteristics and pinpoint the mineralogical components crucial for consideration in the multivariate regression analysis. The ML used a multivariate regression technique to construct a throughput model based on established mineralogical variables.
The following conclusions can be drawn from this paper:
  • The dominance of pyroxene in the FPX and P-FPX samples with lesser amounts of feldspar, other silicates, serpentine and olivine in varying amounts suggests that a multi-objective optimisation-based methodology and statistical modelling can be utilised to address these variations, making it possible to achieve superior performance at Platreef deposit.
  • The BMSs in the FPX and P-FPX rock types, dominated by pyrrhotite across all the rock types, with lesser proportions of pentlandite and chalcopyrite with notable variation, highlights that a combination of selective grinding and flotation processes would be the best comminution technique.
  • The BMSs in the FPX sample were found to be free from other minerals with a balance associated with main silicates, suggesting that the most suitable comminution technique involves the application of HVP for the selective treatment of mineralised particles. On the other hand, the BMS in the P-FPX sample was found to be free from different minerals, with the balance associated mainly with Chlorite and silicates. This also confirms that a multi-objective approach can be utilised as an optimisation approach when processing such ore.
  • Comminution variability tests confirm that the plant feed can be characterised as hard to very hard and thus not suitable for SAG milling. This suggests a processing method that minimises shear forces and fines reduction to prevent unnecessary particle size reduction and energy consumption, as well as control strategies with continuous adjustment and optimisation of crushing parameters.
  • The abrasion index and the crusher work index confirm that the ore can be classified as having a medium abrasion tendency, suggesting that employing a vertical roller mill with a horizontal grinding table and the integration of the accelerometer measurements of the mill shell into the control system to optimise the milling process further would be ideal.
  • The study demonstrates that a multi-objective technique can be implemented by defining operational tactics between Mode A and Mode B to adapt to variations in mineralogical composition.
Future work will be focused on:
  • Enhancing the predictive accuracy of the throughput model by incorporating more diverse lithologies and rock types to manage mineralogical variations more effectively.
  • Exploring the application of advanced simulation models for ore stockpile management to optimise profit in mining activities, considering the principles of geometallurgy for quantitative forecasts regarding metallurgical efficiency.
  • Investigating the economic benefits of employing vertical roller mills with horizontal grinding tables for medium abrasion ores could lead to significant reductions in energy consumption and equipment wear, aligning with the need for efficient ore processing strategies.

Author Contributions

Conceptualization, A.M.K. and K.E.W.; methodology, A.M.K.; validation, A.M.K., K.E.W. and K.M.; formal analysis, A.M.K. and K.M.; investigation, A.M.K. and K.E.W.; resources, A.M.K.; data curation, A.M.K. and K.M.; writing—original draft preparation, A.M.K.; writing—review and editing, A.M.K.; K.E.W. and K.M.; visualisation, A.M.K.; supervision, K.E.W. All authors have read and agreed to the published version of the manuscript.

Funding

The authors acknowledge the Gerald Hatch Faculty Fellowship.

Data Availability Statement

The original contributions presented in this study are included in the article. Further inquiries can be directed to the corresponding author.

Conflicts of Interest

The authors declare no conflicts of interest.

Appendix A

Table A1. Bulk mineralogical composition of FPX (wt%).
MineralRock Type
FPX1FPX2FPX3FPX4
BMS0.774.013.663.23
Feldspar11.7423.3437.9611.22
Clinopyroxene13.517.7316.5323.5
Orthopyroxene66.3939.8231.0242.9
Olivine0.481.570.220.39
Serpentine0.020.960.361.6
Chlorite2.131.141.144.99
Other silicates4.139.218.039.76
Chromite0.181.020.31.5
Fe-Oxides0.50.50.390.39
Carbonates0.130.70.370.49
Other *0.030.020.010.01
Total99.9710099.9899.97
Note: * Other silicates are mainly amphiboles.
Table A2. Bulk mineralogical composition of P-FPX (wt%).
MineralRock Type
P-FPX1P-FPX2P-FPX3P-FPX4
BMS2.940.891.932.6
Feldspar17.6110.2810.039.66
Clinopyroxene11.7517.3817.219.15
Orthopyroxene33.8521.3817.3634.58
Olivine10.139.194.412.94
Serpentine7.3413.9619.154.23
Chlorite4.627.628.789.51
Other silicates5.625.819.812.5
Chromite2.818.076.531.28
Fe-Oxides2.283.44.441.78
Carbonates0.71.260.351.69
Other *0.350.770.020.08
Total100100100100
Note: * Other silicates are mainly amphiboles.
Table A3. BMS proportions in the FPX (wt%).
MineralRock Type
FPX1FPX2FPX3FPX4
Pentlandite20.2425.3718.2326.22
Millerite0.010.020.020.02
Chalcopyrite18.6716.0910.3417.44
Pyrrhotite60.3257.4869.9854.88
Pyrite00.040.121.19
Other sulphides0.770.991.320.25
Total100.0199.99100.01100
Table A4. BMS proportions in the P-FPX (wt%).
MineralRock Type
P-FPX1P-FPX2P-FPX3P-FPX4
Pentlandite24.8535.7120.4732.25
Millerite<0.010.020.01<0.01
Chalcopyrite17.9717.2919.5118.12
Pyrrhotite56.7445.1459.8449.16
Pyrite0.081.23<0.010.11
Other sulphides *0.360.620.170.37
Total100100.01100100.01
Note: * Other silicates are mainly amphiboles.
Table A5. BMS association in the FPX (wt%).
MineralRock Type
FPX1FPX2FPX3FPX4
Other sulphides0.030.130.10.04
Silicates12.388.137.527.92
Chlorite 0.880.630.562.27
Mica0.090.340.310.28
Chromite0.020.040.020.04
Fe-Oxides0.10.180.220.21
Dolomite0.040.510.110.2
Other *0.170.370.120.12
Free Surface86.389.6891.0488.93
Total100100100100
Note: * Other silicates are mainly amphiboles.
Table A6. BMS association in the P-FPX (wt%).
MineralRock Type
P-FPX1P-FPX2P-FPX3P-FPX4
Other sulphides0.05000
Silicates2.594.253.383.32
Chlorite3.376.286.481.18
Mica0.190.260.150.22
Chromite0.040.080.190
Fe-Oxides0.631.391.020.25
Dolomite0.580.980.260.25
Other0.20.140.080.03
Free Surface92.3586.6288.4394.74
Total100100100100

References

  1. Nwaila, G.T.; Ghorbani, Y.; Becker, M.; Frimmel, H.E.; Petersen, J.; Zhang, S. Geometallurgical Approach for Implications of Ore Blending on Cyanide Leaching and Adsorption Behavior of Witwatersrand Gold Ores, South Africa. Nat. Resour. Res. 2020, 29, 1007–1030. [Google Scholar] [CrossRef]
  2. Rötzer, N.; Schmidt, M. Decreasing Metal Ore Grades—Is the Fear of Resource Depletion Justified? Resources 2018, 7, 88. [Google Scholar] [CrossRef]
  3. Spooren, J.; Abo Atia, T. Combined microwave assisted roasting and leaching to recover platinum group metals from spent automotive catalysts. Miner. Eng. 2020, 146, 106153. [Google Scholar] [CrossRef]
  4. Philander, C.; Rozendaal, A. A process mineralogy approach to geometallurgical model refinement for the Namakwa Sands heavy minerals operations, west coast of South Africa. Miner. Eng. 2014, 65, 9–16. [Google Scholar] [CrossRef]
  5. Shirazi, A.; Shirazy, A.; Nazerian, H.; Khakmardan, S. Geochemical and Behavioral Modeling of Phosphorus and Sulfur as Deleterious Elements of Iron Ore to Be Used in Geometallurgical Studies, Sheytoor Iron Ore, Iran. Open J. Geol. 2021, 11, 596–620. [Google Scholar] [CrossRef]
  6. de Castro, S.A.B.; Silva, E.M.S.; Silva, A.C. Geometallurgical modeling and reconciliation with production data in a fhosphate mine. Concilium 2024, 24, 30–42. [Google Scholar] [CrossRef]
  7. Bond, F.C. Crushing & grinding calculations—Part I. Br. Chem. Eng. 1961, 6, 378–385. [Google Scholar]
  8. McClung, C.R.; Viljoen, F. Mineralogical Assessment of the Metamorphosed Broken Hill Sulfide Deposit, South Africa: Implications for Processing Complex Orebodies. In Proceedings of the 10th International Congress for Applied Mineralogy (ICAM); Springer: Berlin/Heidelberg, Germany, 2012; pp. 427–434. [Google Scholar] [CrossRef]
  9. Kinnaird, J.A.; McDonald, I. Preface: An introduction to mineralisation in the northern limb of the Bushveld Complex. Trans. Inst. Min. Metall. Sect. B Appl. Earth Sci. 2005, 114, 194–198. [Google Scholar] [CrossRef]
  10. Cawthorn, R.G.; Merkle, R.K.W.; Viljoen, M.J. Platinum-group element deposits in the Bushveld Complex, South Africa. In The Geology, Geochemistry, Mineralogy and Mineral Beneficiation of Platinum-Group Elements; Cabri, L.J., Ed.; Canadian Institute of Mining, Metallurgy and Petroleum: Montreal, QC, Canada, 2002; Volume 54, pp. 389–429. [Google Scholar]
  11. Cawthorn, R.G.; Lee, C.A.; Schouwstra, R.P.; Mellowship, P. Relationship between PGE and PGM in the bushveld complex. Can. Miner. 2002, 40, 311–328. [Google Scholar] [CrossRef]
  12. Hutchinson, D.; Kinnaird, J.A. Complex Multistage Genesis for the Ni–Cu–PGE Mineralisation in the Southern Region of the Platreef, Bushveld Complex, South Africa. Appl. Earth Sci. 2005, 114, 208–224. [Google Scholar] [CrossRef]
  13. McDonald, I.; Holwell, D.A. Geology of the Northern Bushveld Complex and the Setting and Genesis of the Platreef Ni-Cu-PGE Deposit. Magmatic Ni-Cu and PGE Deposits. Rev. Econ. Geol. 2011, 17, 297–327. [Google Scholar]
  14. Rule, C.; Schouwstra, R.P. Process Mineralogy Delivering Significant Value at Anglo Platinum Concentrator Operations. In Proceedings of the 10th International Congress for Applied Mineralogy (ICAM); Springer: Berlin/Heidelberg, Germany, 2012; pp. 613–621. [Google Scholar] [CrossRef]
  15. Mwanga, A.; Rosenkranz, J.; Lamberg, P. Testing of Ore Comminution Behavior in the Geometallurgical Context—A Review. Minerals 2015, 5, 276–297. [Google Scholar] [CrossRef]
  16. Mwanga, A.; Lamberg, P.; Rosenkranz, J. Comminution test method using small drill core samples. Miner. Eng. 2015, 72, 129–139. [Google Scholar] [CrossRef]
  17. Little, L.; Mainza, A.N.; Becker, M.; Wiese, J.G. Using mineralogical and particle shape analysis to investigate enhanced mineral liberation through phase boundary fracture. Powder Technol. 2016, 1, 794–804. [Google Scholar] [CrossRef]
  18. Bryson, M.A.W. Mineralogical control of minerals processing circuit design. J. S. Afr. Inst. Min. Metall. 2004, 104, 307–309. [Google Scholar]
  19. Napier-Munn, T. Is progress in energy-efficient comminution doomed? Miner. Eng. 2015, 73, 1–6. [Google Scholar] [CrossRef]
  20. Schouwstra, R.; De Vaux, D.; Muzondo, T.; Prins, C. A geometallurgical approach at Anglo American’s Mogalakwena operation. In Proceedings of the Second AusIMM International Conference, Brisbane, Australia, 30 September–2 October 2013; pp. 85–92. [Google Scholar]
  21. Compan, G.; Pizarro, E.; Videla, A. Geometallurgical model of a copper sulphide mine for long-term planning. J. S. Afr. Inst. Min. Metall. 2015, 115, 549–556. [Google Scholar]
  22. Lusambo, M.; Mulenga, F.K. Empirical model of recovery response of copper sulphide circuit at Kansanshi Mine. J. S. Afr. Inst. Min. Met. 2018, 118, 1179–1184. [Google Scholar] [CrossRef]
  23. McCoy, J.T.; Auret, L. Machine learning applications in minerals processing: A review. Miner. Eng. 2019, 132, 95–109. [Google Scholar] [CrossRef]
  24. Moraga, C.; Astudillo, C.A.; Estay, R.; Maranek, A. Enhancing Comminution Process Modeling in Mineral Processing: A Conjoint Analysis Approach for Implementing Neural Networks with Limited Data. Mining 2024, 4, 966–982. [Google Scholar] [CrossRef]
  25. Silva, D.H.C.; Alves, V.K.; Souza, E.S. Machine learning for particle size prediction in iron ore grinding process. Peer Rev. 2024, 6, 157–177. [Google Scholar] [CrossRef]
  26. Vera Ruiz, M.A.; Vega Gonzales, J.A.; Bailon Villalba, F.J. Multivariable predictive models for the estimation of power consumption (kW) of a Semi-autogenous mill applying Machine Learning algorithms [Modelos predictivos multivariables para la estimación de consumo de potencia (kW) de un molino Semi—Autógeno aplicando algoritmos de Machine Learning]. J. Energy Environ. Sci. 2024, 8, 14–31. [Google Scholar] [CrossRef]
  27. Loudari, C.; Cherkaoui, M.; Bennani, R.; El Harraki, I.; Fares, O.; El Adnani, M.; Abdelwahed, E.H.; Benzakour, I.; Bourzeix, F.; Baina, K. Predicting Grinding Mill Power Consumption in Mining: A Comparative Study. In Proceedings of the 2023 7th IEEE Congress on Information Science and Technology (CiSt), Essaouira, Morocco, 16–22 December 2023; pp. 395–399. [Google Scholar] [CrossRef]
  28. Both, C.; Dimitrakopoulos, R. Applied Machine Learning for Geometallurgical Throughput Prediction—A Case Study Using Production Data at the Tropicana Gold Mining Complex. Minerals 2021, 11, 1257. [Google Scholar] [CrossRef]
  29. Zou, G.; Zhou, J.; Song, T.; Yang, J.; Li, K. Hierarchical Intelligent Control Method for Mineral Particle Size Based on Machine Learning. Minerals 2023, 13, 1143. [Google Scholar] [CrossRef]
  30. Nghipulile, T.; Moongo, T.; Dzinomwa, G.; Maweja, K.; Mapani, B.; Kurasha, J.; Amwaama, M. Effect of mineralogy on grindability—A case study of copper ores. J. S. Afr. Inst. Min. Met. 2023, 123, 133–144. [Google Scholar] [CrossRef]
  31. Navarra, A.; Marambio, H.; Oyarzún, A.; Parra, R.; Mucciardi, F. Minerals and Metallurgical Processing. Syst. Dyn. DES Copp. Smelters 2017, 34, 96–106. [Google Scholar]
  32. Navarra, A.; Menzies, A.; Jordens, A.; Waters, K. Strategic evaluation of concentror operational modes under geological uncertainty. Int. J. Min. Process 2017, 164, 45–55. [Google Scholar] [CrossRef]
  33. Navarra, A.; Alvarez, M.; Rojas, K.; Menzies, A.; Pax, R.; Waters, K. Concentrator operational modes in response to geological variation. Miner. Eng. 2019, 134, 356–364. [Google Scholar] [CrossRef]
  34. Bhadani, K.; Asbjörnsson, G.; Bepswa, P.; Mainza, A.; Andrew, E.; Philipo, J.; Zulu, N.; Anyimadu, A.; Hulthén, E.; Evertsson, M. Simulation-Driven Development for Coarse Comminution Process—A Case Study of Geita Gold Mine, Tanzania Using Plantsmith Process Simulator. Proc. Des. Soc. 2021, 1, 2681–2690. [Google Scholar] [CrossRef]
  35. Abou, S.C.; Dao, T.-M. Association rules mining approach to mineral processing control. Eng. Lett. 2010, 18, 156. [Google Scholar]
  36. Kennedy, J.; Eberhart, R. Particle swarm optimization. In Proceedings of the IEEE ICNN’95—International Conference on Neural Networks, Perth, WA, Australia, 27 November–1 December 1995; pp. 1942–1948. [Google Scholar] [CrossRef]
  37. Khan, A.; Niemann-Delius, C. Application of Particle Swarm Optimization to the Open Pit Mine Scheduling Problem. In Proceedings of the 12th International Symposium Continuous Surface Mining—Aachen 2014; Springer International Publishing: New York, NY, USA, 2015. [Google Scholar]
  38. He, S.; Luo, D.; Guo, K. Evaluation of mineral resources carrying capacity based on the particle swarm optimization clustering algorithm. J. S. Afr. Inst. Min. Met. 2020, 120, 681–691. [Google Scholar] [CrossRef]
  39. Zhang, Z.; Liu, Y.; Bo, L.; Yue, Y.; Wang, Y. Economic Optimal Allocation of Mine Water Based on Two-Stage Adaptive Genetic Algorithm and Particle Swarm Optimization. Sensors 2022, 22, 883. [Google Scholar] [CrossRef] [PubMed]
  40. Essa, K.S.; Elhussein, M. Interpretation of Magnetic Data Through Particle Swarm Optimization: Mineral Exploration Cases Studies. Nat. Resour. Res. 2020, 29, 521–537. [Google Scholar] [CrossRef]
  41. Essa, K.S.; Munschy, M. Gravity data interpretation using the particle swarm optimisation method with application to mineral exploration. J. Earth Syst. Sci. 2019, 128, 1–16. [Google Scholar] [CrossRef]
  42. Su, K.; Ai, H.; Alvandi, A.; Lyu, C.; Wei, X.; Qin, Z.; Tu, Y.; Yan, Y.; Nie, T. Hunger Games Search for the elucidation of gravity anomalies with application to geothermal energy investigations and volcanic activity studies. Open Geosci. 2024, 16, 20220641. [Google Scholar] [CrossRef]
  43. Xiao, M.; Luo, R.; Chen, Y.; Ge, X. Prediction model of asphalt pavement functional and structural performance using PSO-BPNN algorithm. Constr. Build. Mater. 2023, 407, 133534. [Google Scholar] [CrossRef]
  44. He, X.; Xu, Q.; Li, X. Research on performance prediction of asphalt pavement based on PSO-SVR model. In Proceedings of the 2023 4th International Conference on Machine Learning and Computer Application, Hangzhou, China, 27–29 October 2023; ACM: New York, NY, USA, 2023; pp. 850–854. [Google Scholar] [CrossRef]
  45. Masasire, A.; Rwere, F.; Dzomba, P.; Mupa, M. A new preconcentration technique for the determination of PGMs and gold by fire assay and ICP-OES. J. S. Afr. Inst. Min. Metall. 2022, 122, 1–8. [Google Scholar] [CrossRef]
  46. Navarra, A.; Grammatikopoulos, T.; Waters, K. Incorporation of geometallurgical modelling into long-term production planning. Miner. Eng. 2018, 120, 118–126. [Google Scholar] [CrossRef]
  47. Órdenes, J.; Toro, N.; Quelopana, A.; Navarra, A. Data-Driven Dynamic Simulations of Gold Extraction Which Incorporate Head Grade Distribution Statistics. Metals 2022, 12, 1372. [Google Scholar] [CrossRef]
  48. DelSole, T.; Tippett, M. Principal Component Analysis. In Statistical Methods for Climate Scientists; Cambridge University Press: Cambridge, UK, 2022; pp. 273–297. [Google Scholar] [CrossRef]
  49. Wang, L.Q.; Li, B.B.; Lin, J.; Xie, B.; Wang, Q.; Cheng, Y.Q.; Zhu, K.G. Noise removal based on reconstruction of filtered principal components. Acta Geophys. Sin. 2015, 58, 2803–2811. [Google Scholar] [CrossRef]
  50. Pysmennyi, S.; Fedko, M.; Chukharev, S.; Rysbekov, K.; Kyelgyenbai, K.; Anastasov, D. Technology for mining of complex-structured bodies of stable and unstable ores. IOP Conf. Ser. Earth Environ. Sci. 2022, 970, 12040. [Google Scholar] [CrossRef]
  51. Analysis for Research of Modern Bottom Sediments. Visnyk Taras Shevchenko Natl. Univ. Kyiv Geol. 2021, 93, 24–31. [CrossRef]
  52. Qiu, T.; Chen, J.; Fang, X.; Kuang, J.; Yu, W.; Ai, G. Pyrrhotite Mineral Processing Method Using Low-Alkali Process of Flotation Followed by Magnetic Separation. AU2020336795B2, 2 February 2023. [Google Scholar]
  53. Ghedin, S.C.D.; Pedroso, G.J.; Neto, J.C.B.; Preve, N.B.; Gondoreck, G.G.; Ely, F.; Angioletto, E.; Ourique, F.; Ribeiro, L.F.B.; Frizon, T.E.A. Processing of pyrite derived from coal mining waste by density separation technique using lithium heteropolytungstate (LST). Matéria 2022, 27, e20220169. [Google Scholar] [CrossRef]
  54. Huang, W. Selective Breakage of Mineralised Particles by High Voltage Pulse. Ph.D. Thesis, University of Queensland, Brisbane, Australia, 2019. [Google Scholar]
  55. Guldris, L.L.; Bengtsson, M. Selective Comminution Applied to Mineral Processing of a Tantalum Ore: A Technical, Economic Analysis. Minerals 2022, 12, 1057. [Google Scholar] [CrossRef]
  56. Lvov, V.V.; Chitalov, L.S.; Lagov, P.B. Ore Hardness Properties Evaluation Based on Industrial Comminution Circuits Surveys. Eurasian Min. 2022, 38, 54–57. [Google Scholar] [CrossRef]
  57. Pérez-García, E.; Bouchard, J.; Poulin, É. Integrating online mineral liberation data into process control and optimisation systems for grinding–separation plants. J. Process Control 2021, 105, 169–178. [Google Scholar] [CrossRef]
  58. Obasi, E.; Gundu, D.T.; Ashwe, A.; Akindele, M. Determination of Work Index of Enyigba Lead Ore, Ebonyi State, South-East Nigeria. Stud. Eng. Technol. 2015, 2, 103–110. [Google Scholar] [CrossRef]
  59. Kurzydlo, M.; Pawelczyk, M. Vibration measurements for copper ore milling and classification process optimization. Vibroeng. Procedia 2015, 6, 18–23. [Google Scholar]
  60. Lotter, N.O.; Baum, W.; Reeves, S.; Arrué, C.; Bradshaw, D.J. The business vaalue of best practice process mineralogy. Miner. Eng. 2018, 116, 226–238. [Google Scholar] [CrossRef]
Figure 1. The methodological framework for the study. The single asterisks represent inputs from the mineralogical dataset, while the double asterisks denote inputs from the mineralogical metallurgical dataset.
Processes 13 00443 g001
Figure 2. Measured PGM throughput vs. the predicted throughput.
Processes 13 00443 g002
Figure 3. Principal Component Analysis Scree plot (a) and Biplot (b).
Processes 13 00443 g003
Figure 4. Probability plots of normal distribution.
Processes 13 00443 g004
Figure 5. Throughput variability for various production campaigns.
Processes 13 00443 g005
Table 1. Characteristics of the two lithological categories: P-FPX and FPX.
LithologyRock TypesBore Hole #From (Metres)To (Metres)Difference Interval (Metres)Rock Type Description
FPXFPX1ZF1011.2121.2197Feldspathic pyroxenite
FPX2ZF1101.1041.11814
FPX3ZF1101.1381.1468
FPX4ZF1131.0971.1069
P-FPXP-FPX1ZF0021.0711.08514Pegmatoidal feldspathic pyroxenite
P-FPX2ZF0021.0851.0916
P-FPX3ZF0051.0421.05210
P-FPX4ZF0061.0421.06220
Table 2. Comminution results of FPX and PFPX.
LithologiesRock TypesRelative DensityBWIGrind Size Achieved
(g/cm)(kWh/t)(P80)
Feldspathic pyroxenite FPX13.1919.489
FPX23.1318.495
FPX33.1721.378
FPX43.1823.577
Pegmatoidal feldspathic pyroxenite P-FPX13.2123.3677
P-FPX23.3225.1487
P-FPX32.8322.3374
P-FPX42.8923.1578
Table 4. Mineralogical composition of two lithologies of 6 distinct production campaigns.
CampaignsLithologyMineralogy Attributes (%)BWI (kwt/h)P80 (μm)
ChloriteIronOxidesSilicates *RD
1PFPX—Ore 1 in feed4.622.282.593.2123.3677
FPX—Ore 2 in feed2.130.512.383.1919.489
2PFPX—Ore 1 in feed7.623.44.253.3225.1487
FPX—Ore 2 in feed1.140.58.133.1318.495
3PFPX—Ore 1 in feed8.784.443.382.8322.3374
FPX—Ore 2 in feed1.140.397.523.1721.378
4PFPX—Ore 1 in feed9.511.783.322.8923.1578
FPX—Ore 2 in feed4.990.397.923.1823.577
5PFPX—Ore 1 in feed6.73.362.963.0523.377
FPX—Ore 2 in feed3.60.458.033.1821.583
6PFPX—Ore 1 in feed8.22.843.353.0523.378
FPX—Ore 2 in feed2.130.512.383.1919.489
Note: * Silicates are primarily talc and amphiboles.
Table 5. Correlation and the statistically significant variables for BWI.
Chlorite IronOxidesSilicatesBWI
Chlorite1.000.74−0.740.71
IronOxides0.741.00−0.880.51
Silicates−0.74−0.881.00−0.59
BWI0.710.51−0.591.00
Table 6. Final regression model results.
CoefficientVariableRegressed ConstantSEp-Value
C0(Intercept)−0.0890.0360.014
C1Chlorite0.7810.030 3.729
C2IronOxides−0.7980.0653.205
C3Silicates−0.7200.0572.523
C4RD0.5910.040 6.253
C5Chlorite*Silicates0.6360.065 4.937
C6IronOxides*RD0.0480.022 0.028
C7Silicates*RD0.1540.045 0.000
C8Chlorite20.1200.041 0.003
C9IronOxides20.207 0.025 9.376
C10Silicates20.1100.0288.251
C11RD20.0760.0126.412
Table 7. Model Statistics.
Model Statistics Value
Root Mean Squared Error0.44
R20.80
Adjusted R2 0.79
RMS Error0.441
F-statistic243
p-Value2.29 *
Note: * Represents a highly significant value.
Table 8. Operational tactics and deposits forecast.
Production CampaignsParametersMode AMode BDeposit
RegularContingencyRegularContingency
1Throughput (t/h)503.00 386.00 444
Low-grade PGM (PFPX) %46.1310.0051.7890.0025
High-grade PGM (FPX) %53.8790.0048.2210.0075
2Throughput (t/h)535.00 362.73 449
Low-grade PGM (PFPX) %47.9810.0055.5790.0025
High-grade PGM (FPX) %52.0290.0044.4310.0075
3Throughput (t/h)487.00 431.00 459
Low-grade PGM (PFPX) %48.8010.0050.9190.0025
High-grade PGM (FPX) %51.2090.0049.0910.0075
4Throughput (t/h)497.00 434.00 466
Low-grade PGM (PFPX) %47.9210.0050.0190.0025
High-grade PGM (FPX) %52.0890.0049.9910.0075
5Throughput (t/h)502.00 423.00 462
Low-grade PGM (PFPX) %47.1710.0050.0190.0025
High-grade PGM (FPX) %52.8390.0049.9910.0075
6Throughput (t/h)511.00 414.00 463
Low-grade PGM (PFPX) %46.5410.0050.1890.0025
High-grade PGM (FPX) %53.4690.0049.8210.0075
Table 9. Improvements from the existing processing model.
Existing Processing ModelImproved Processing Model
  • The existing processing model faces challenges due to the variability of complex ore bodies, such as PGE deposits. These geological uncertainties can impact the accuracy and reliability of the model’s predictions.
  • The model’s performance is affected by mineralogical variability, which influences comminution performance. Thus, it can be said that the current model does not fully address the problem of variability.
  • The presence of multicollinearity in datasets, characterised by substantial intercorrelation among features, can present significant challenges. Although PCA is used to mitigate this issue, the model may struggle with high-dimensional datasets.
  • The model’s effectiveness is limited by the hardness and grindability of the ore. Comminution variability tests have shown that the plant feed can be characterised as hard to very hard, which is not suitable for certain milling processes like SAG milling.
  • While the model aims to enhance energy efficiency, the need for continuous adjustment and optimisation of crushing parameters suggests that the current model may not fully optimise energy consumption and operational costs.
  • The model has limited lithological representation. Although improvements have been made, the model’s predictive accuracy could be further enhanced by incorporating more diverse lithologies and rock types to better manage mineralogical variations.
  • The processing model has been enhanced by incorporating a wider range of lithologies and rock types. This improvement helps in managing mineralogical variations more effectively, thereby increasing the predictive accuracy of the throughput model.
  • A multivariate regression machine learning model was implemented to simulate the throughput model. This model uses established mineralogical variables and geometallurgical data inputs, providing a structured approach to predict the BWI based on these variables
  • The explanatory variables in the dataset underwent normalisation. This process was crucial for minimising potential biases or discrepancies, ensuring that all variables are on a standardised scale. This standardisation facilitates a more accurate and reliable assessment of the relationship between the BWI and mineralogy.
  • PCA was used to address multicollinearity issues in the dataset. By producing orthogonal principal components, PCA enhances the robustness and interpretability of the regression model. It also helps in mitigating data noise by prioritising components that contribute the most to the overall variance, thereby improving model efficiency
  • A dynamic optimisation algorithm was implemented for tactical blending, which considers geological uncertainties and mineralogical variations. This algorithm significantly improves the deterministic technique used for throughput estimation, leading to substantial energy savings and cost reductions
  • The PSO algorithm was applied to maximise the plant’s comminution throughput through tactical blending of low-grade and high-grade ore stockpiles. This innovative approach addresses complex geological uncertainties and enhances stockpile management and tactical mine-to-mill operations.
Disclaimer/Publisher’s Note: The statements, opinions and data contained in all publications are solely those of the individual author(s) and contributor(s) and not of MDPI and/or the editor(s). MDPI and/or the editor(s) disclaim responsibility for any injury to people or property resulting from any ideas, methods, instructions or products referred to in the content.

