

Optimization of Mexican Oregano Essential Oil (Lippia Graveolens) Extraction with Fungicidal and Oomyceticidal Effects Against Plant Pathogens

 , ,
, ,  , ,
, ,
Abstract
:1. Introduction
2. Materials and Methods
2.1. Raw Material
2.2. Plant Pathogens
2.3. Essential Oil Extraction
2.4. Gas Chromatography-Mass Spectrometry (GC/MS)
2.5. In Vitro Fungicidal and Oomyceticidal Activity Assays
2.5.1. MGI
2.5.2. SGI
2.5.3. MIC and MFC
2.6. Optimization
2.7. Statistical Analysis
3. Results and Discussion
3.1. Experimental Prediction Models
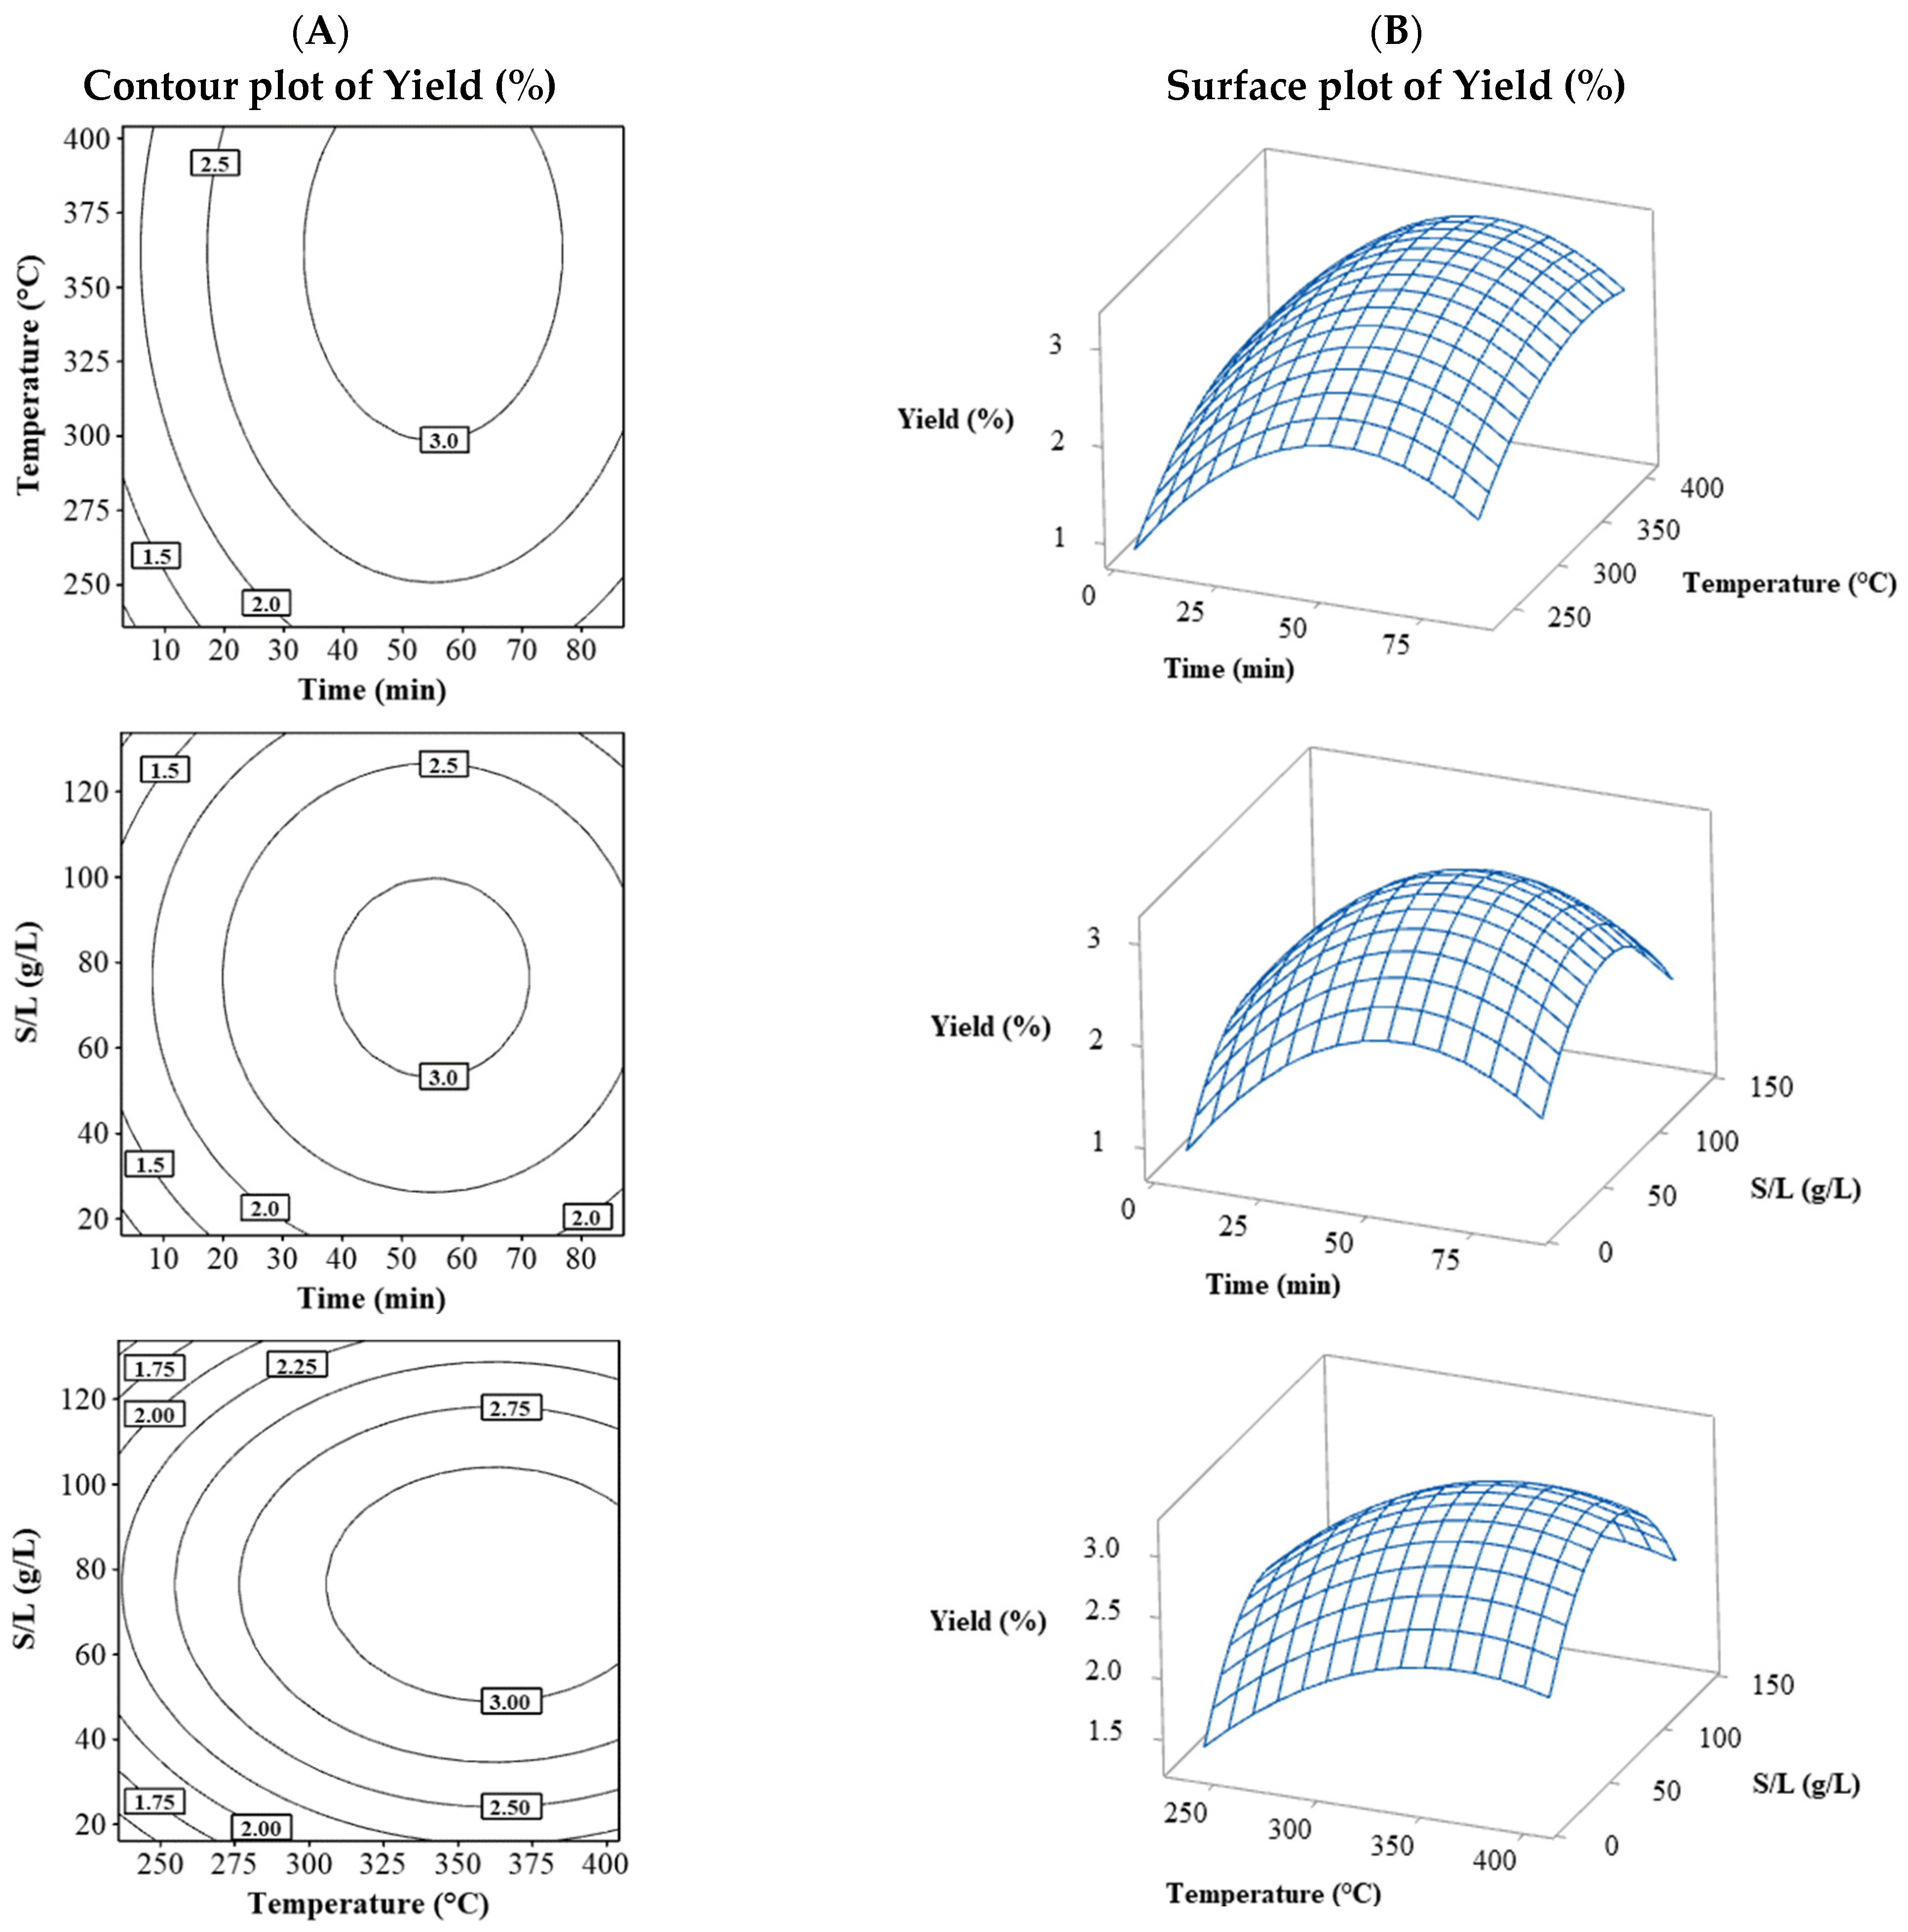
3.1.1. Yield (%)
3.1.2. MGI (%)
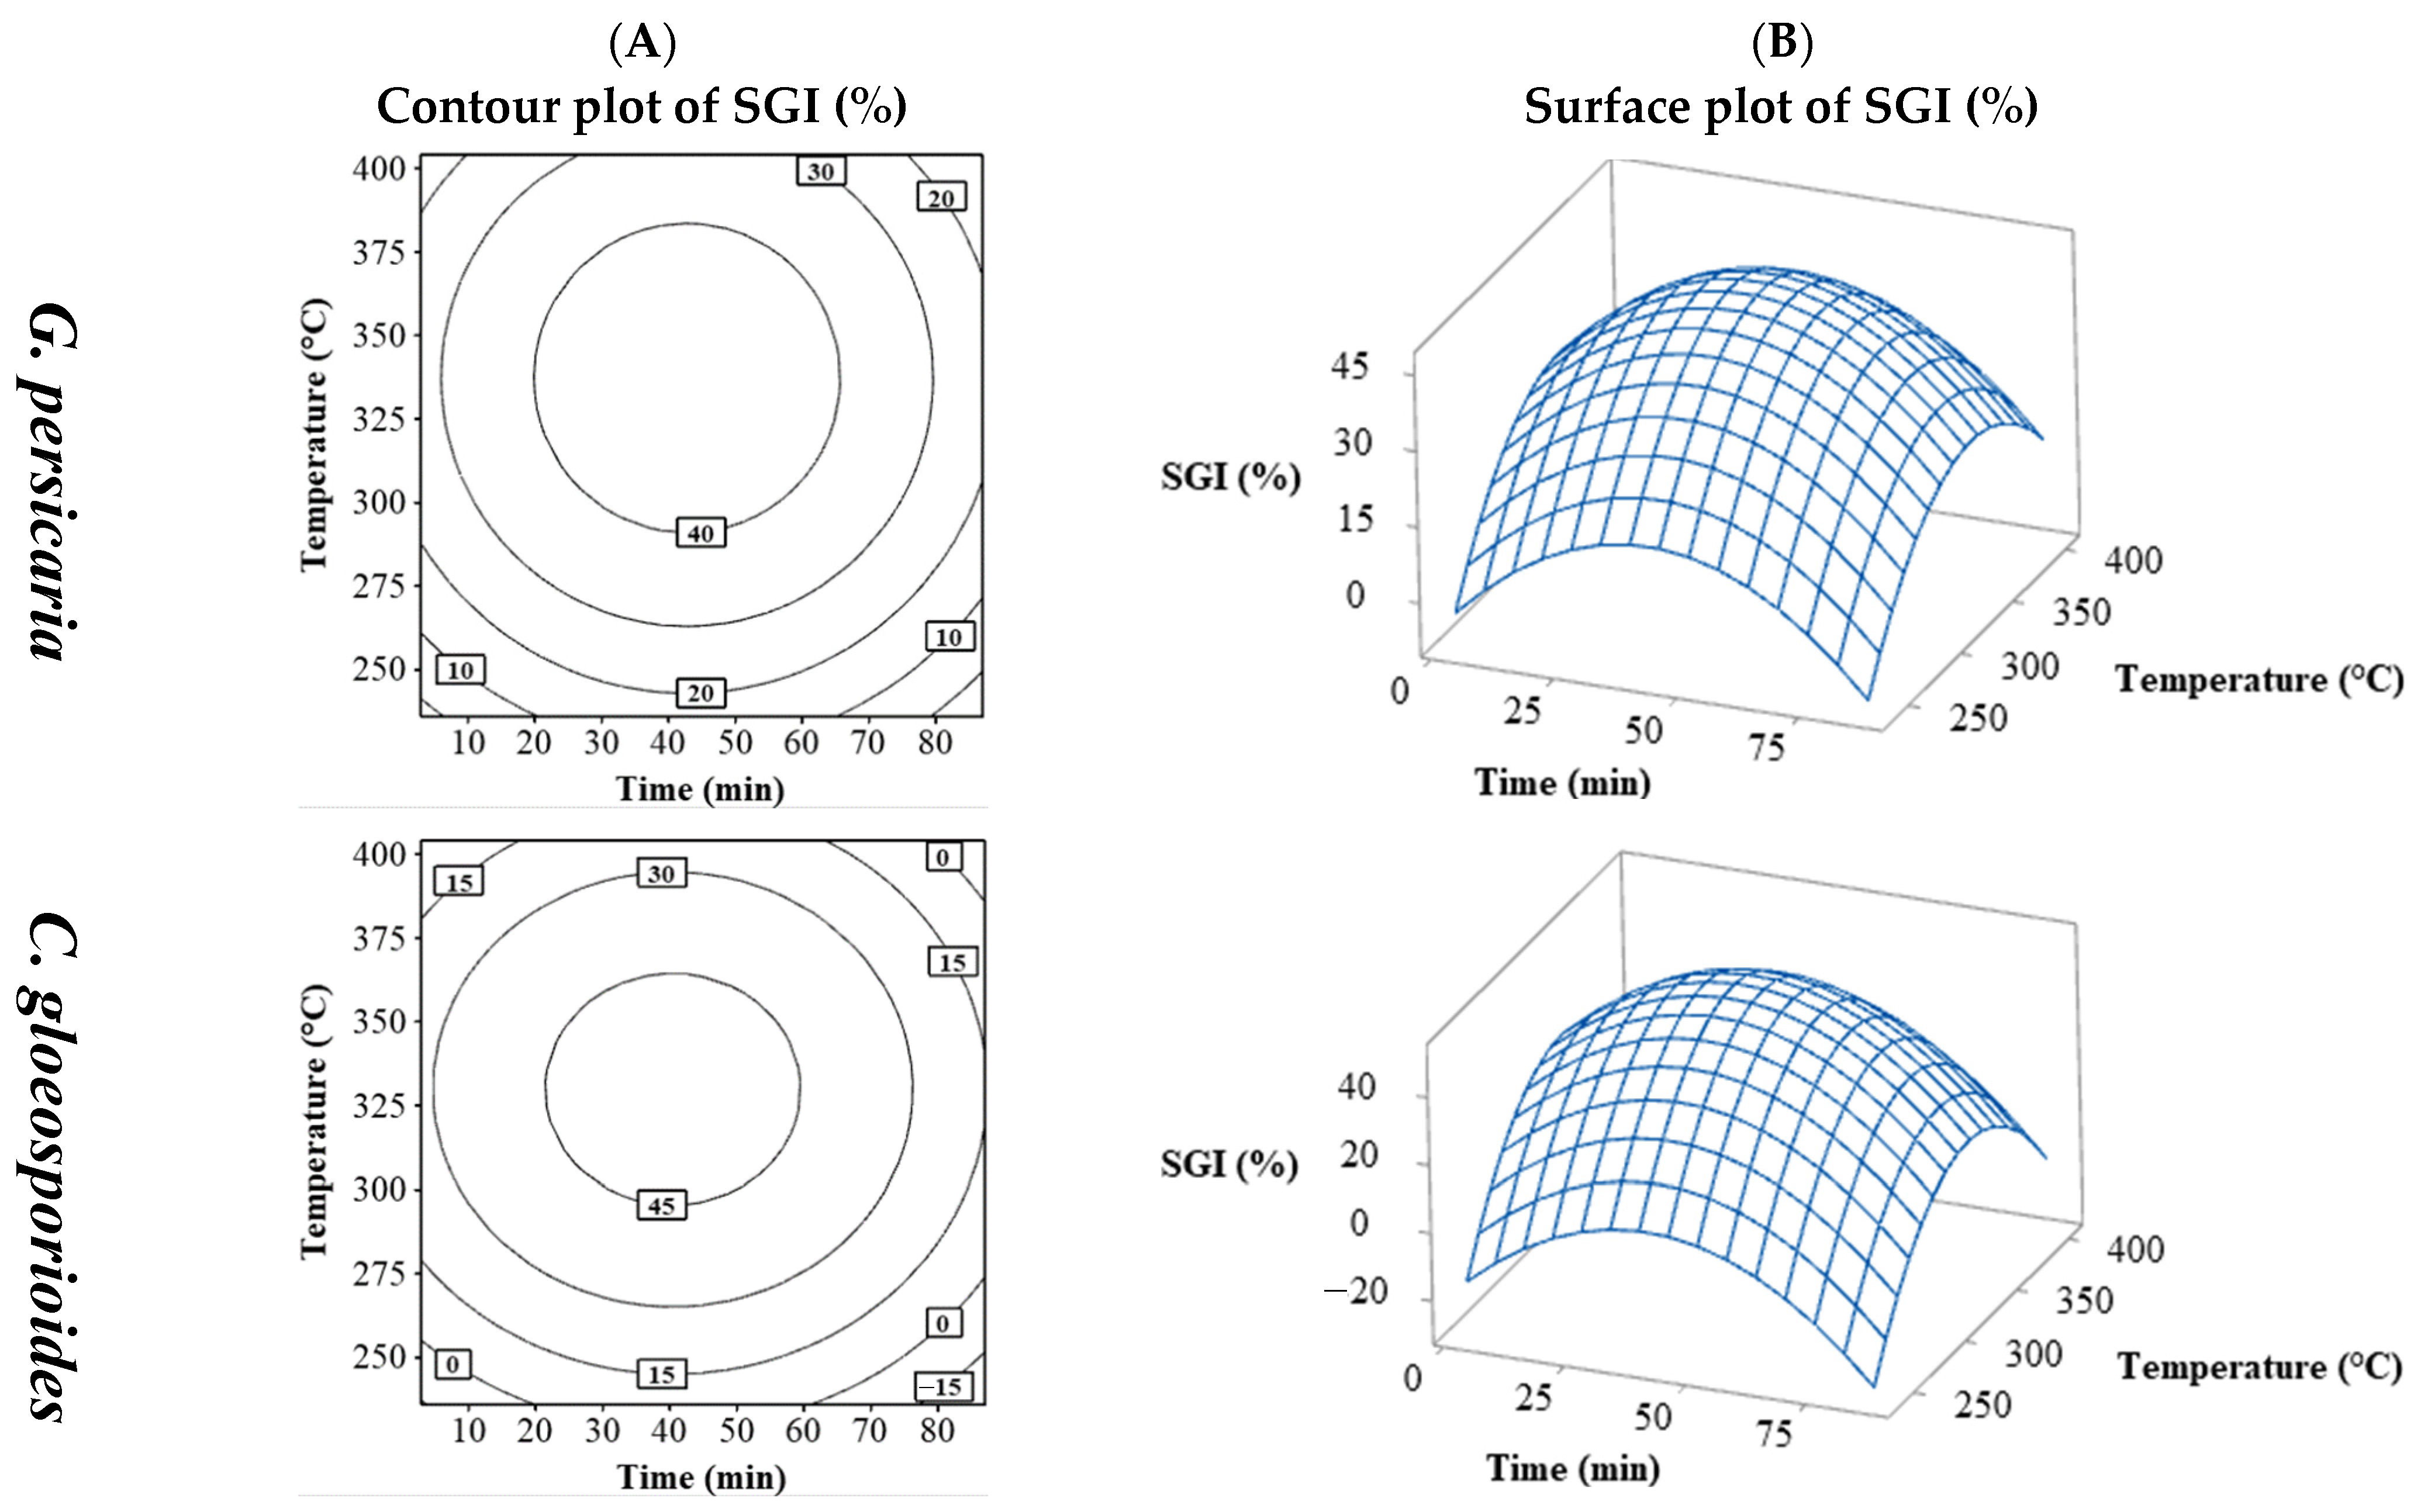
3.1.3. SGI (%)
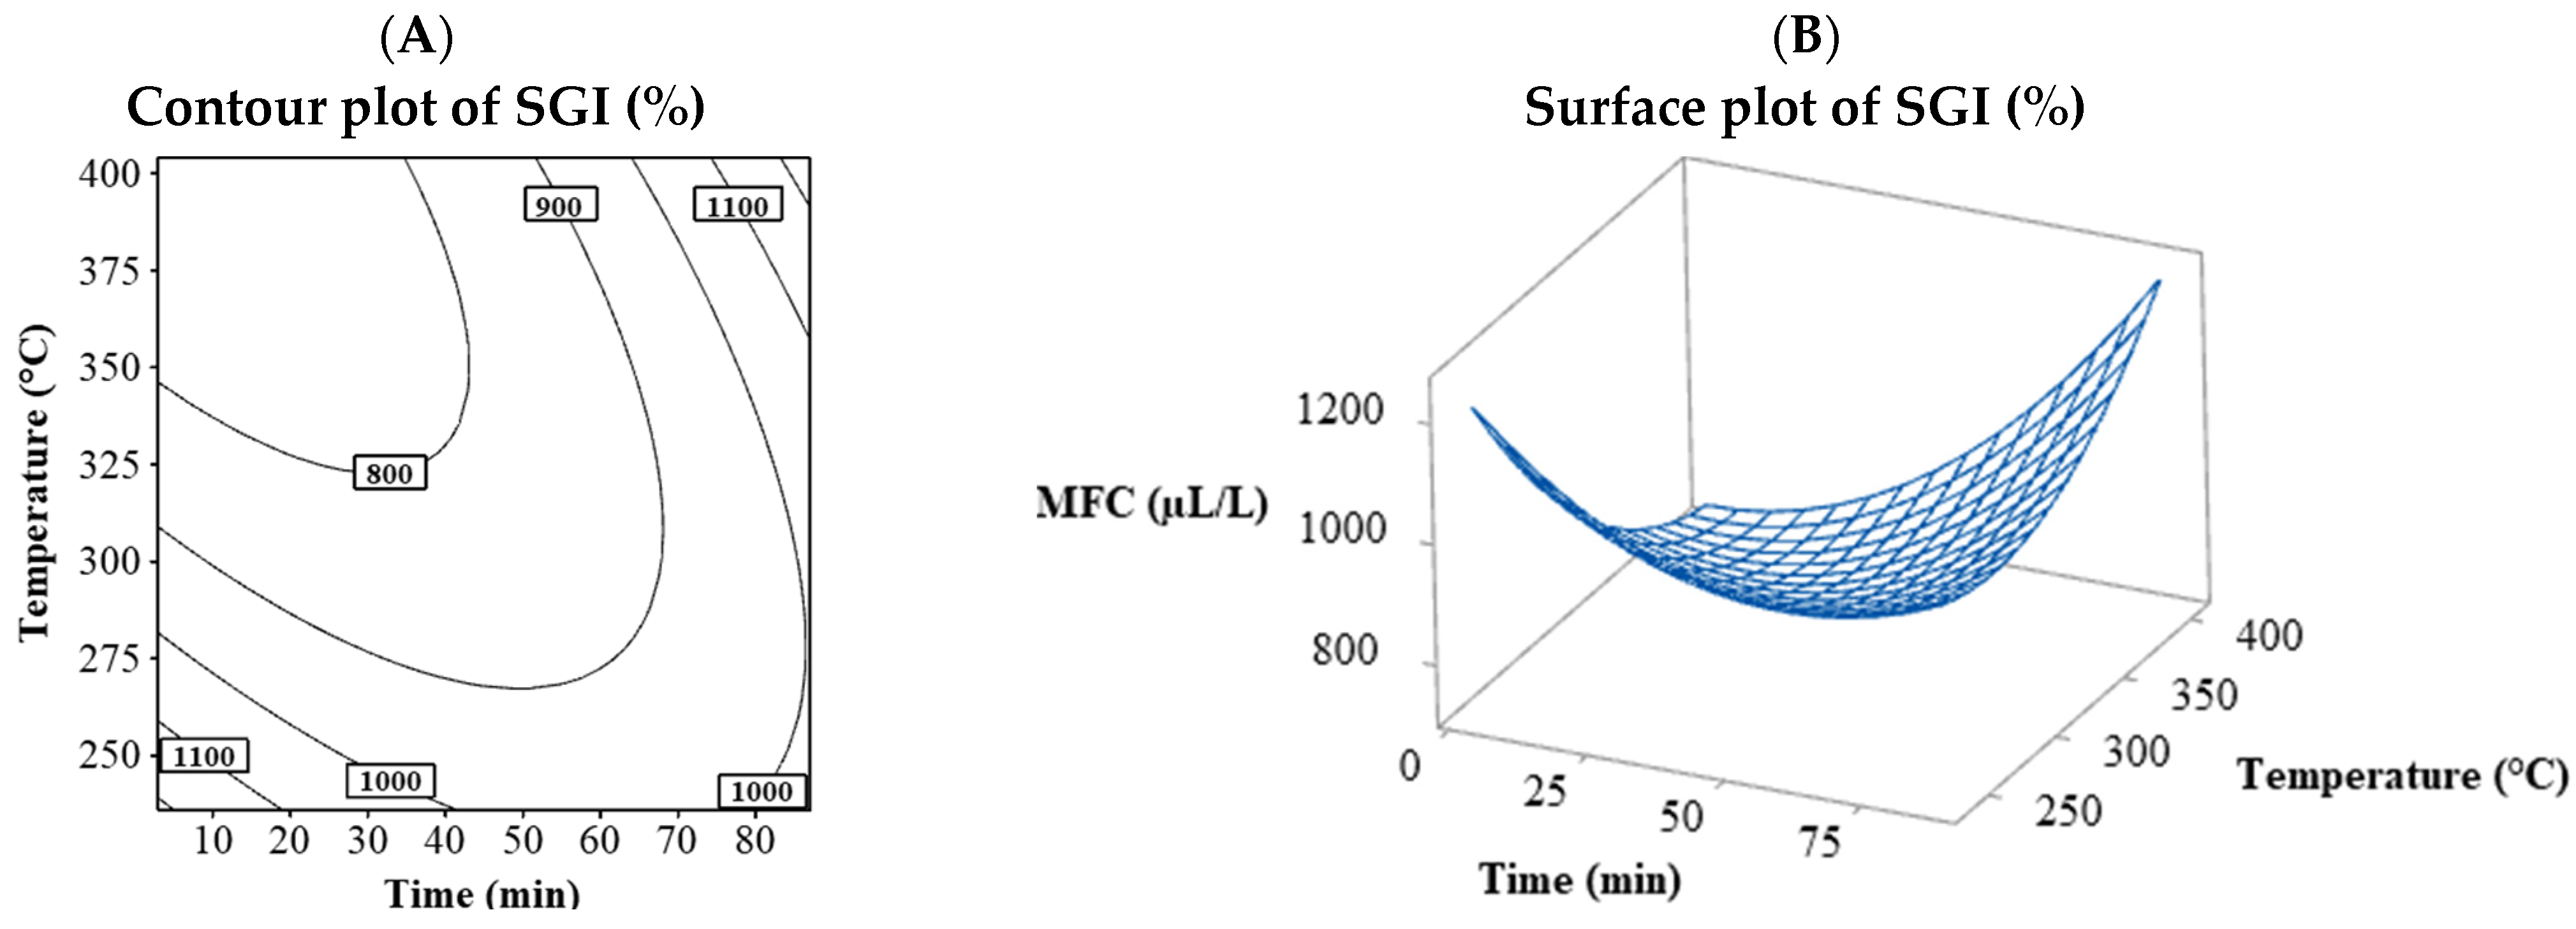
3.1.4. MFC
3.2. Optimization
Prediction Validation
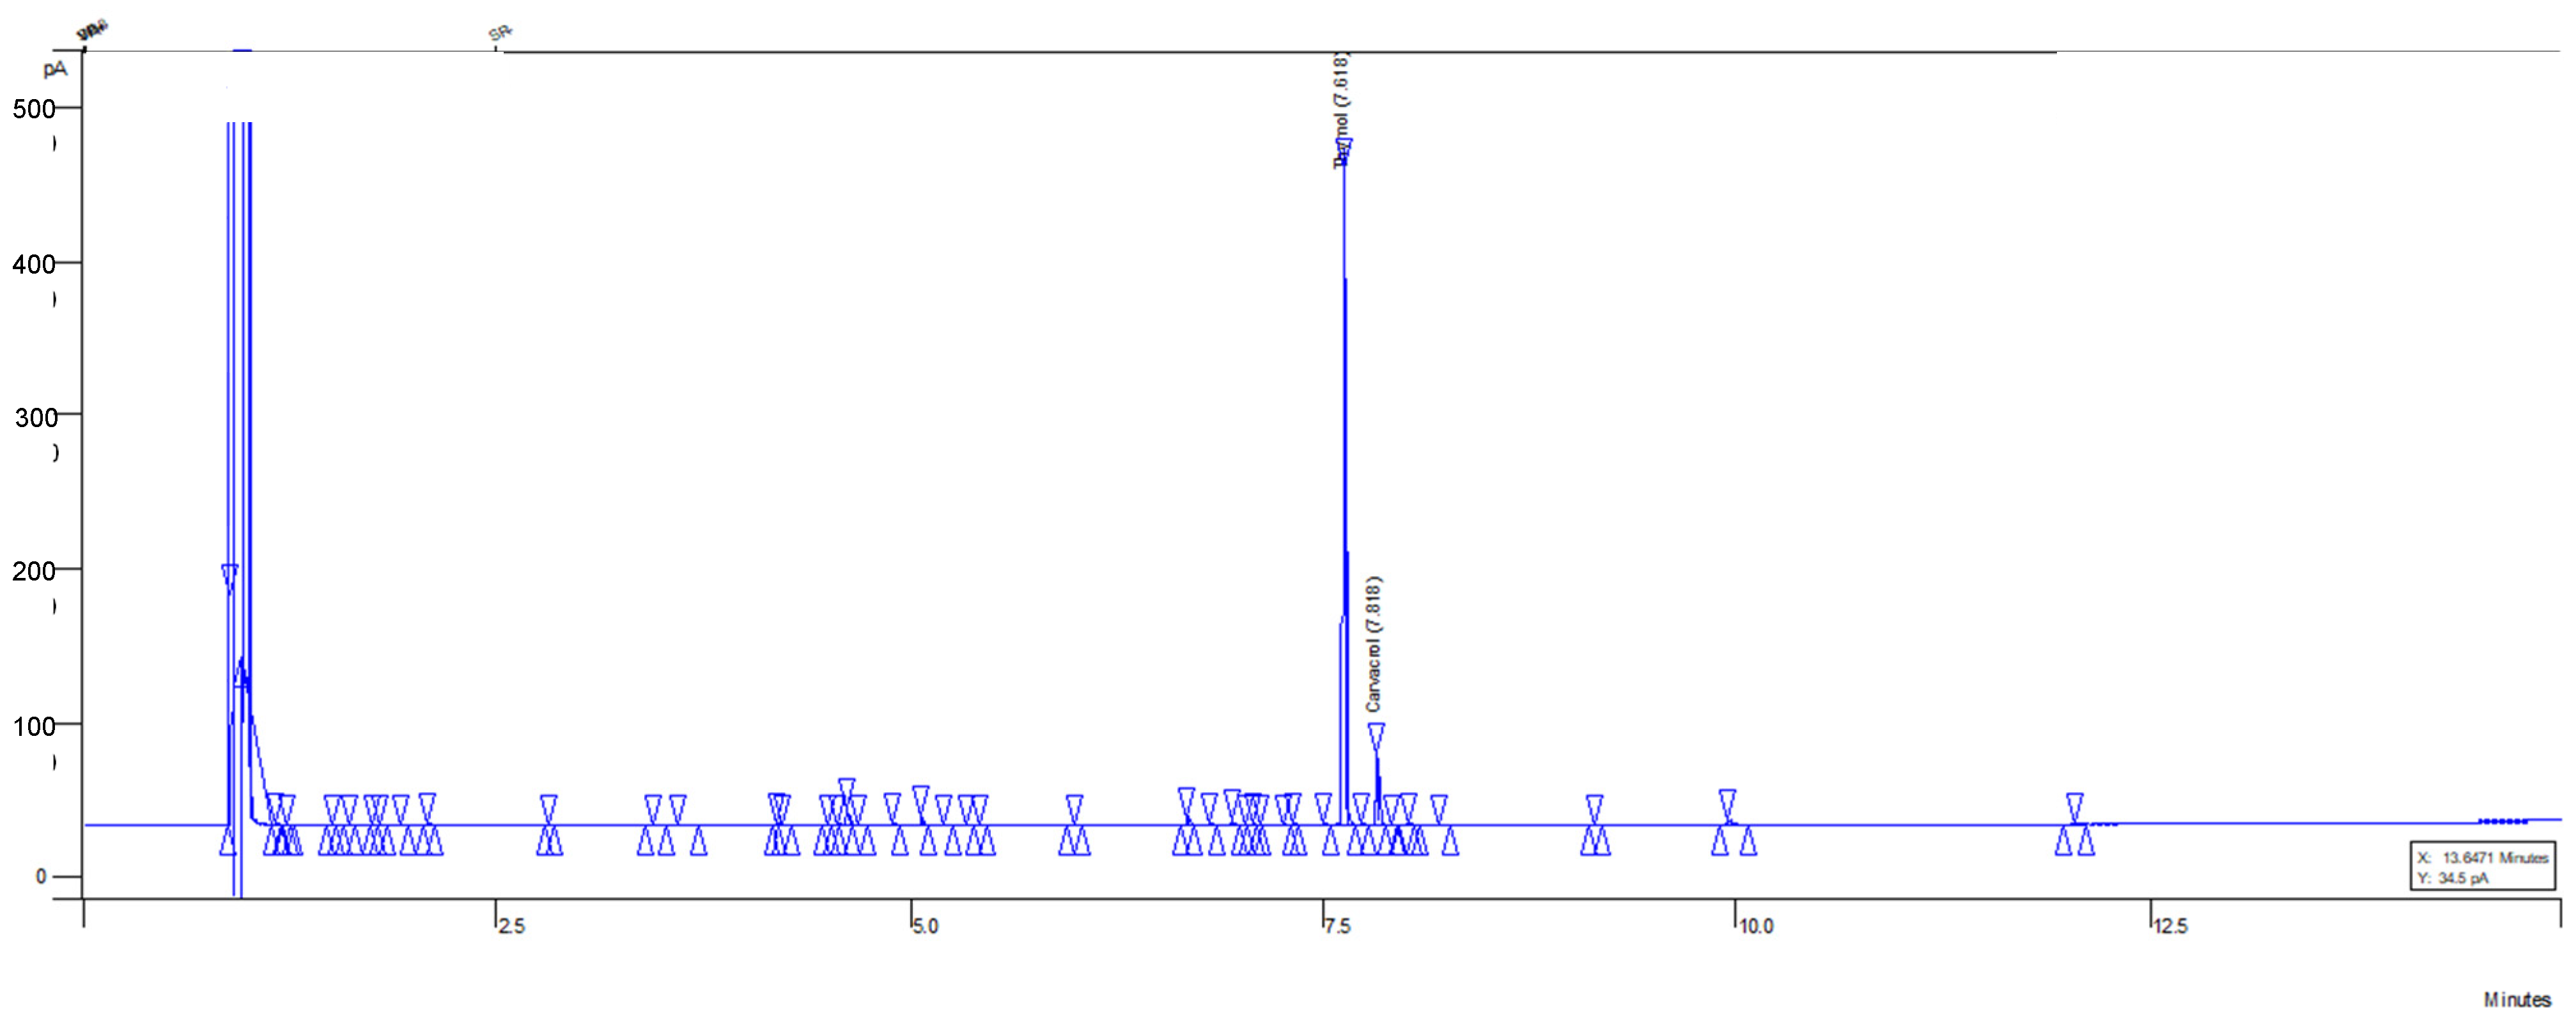
3.3. Chemical Profile of Optimized MOEO
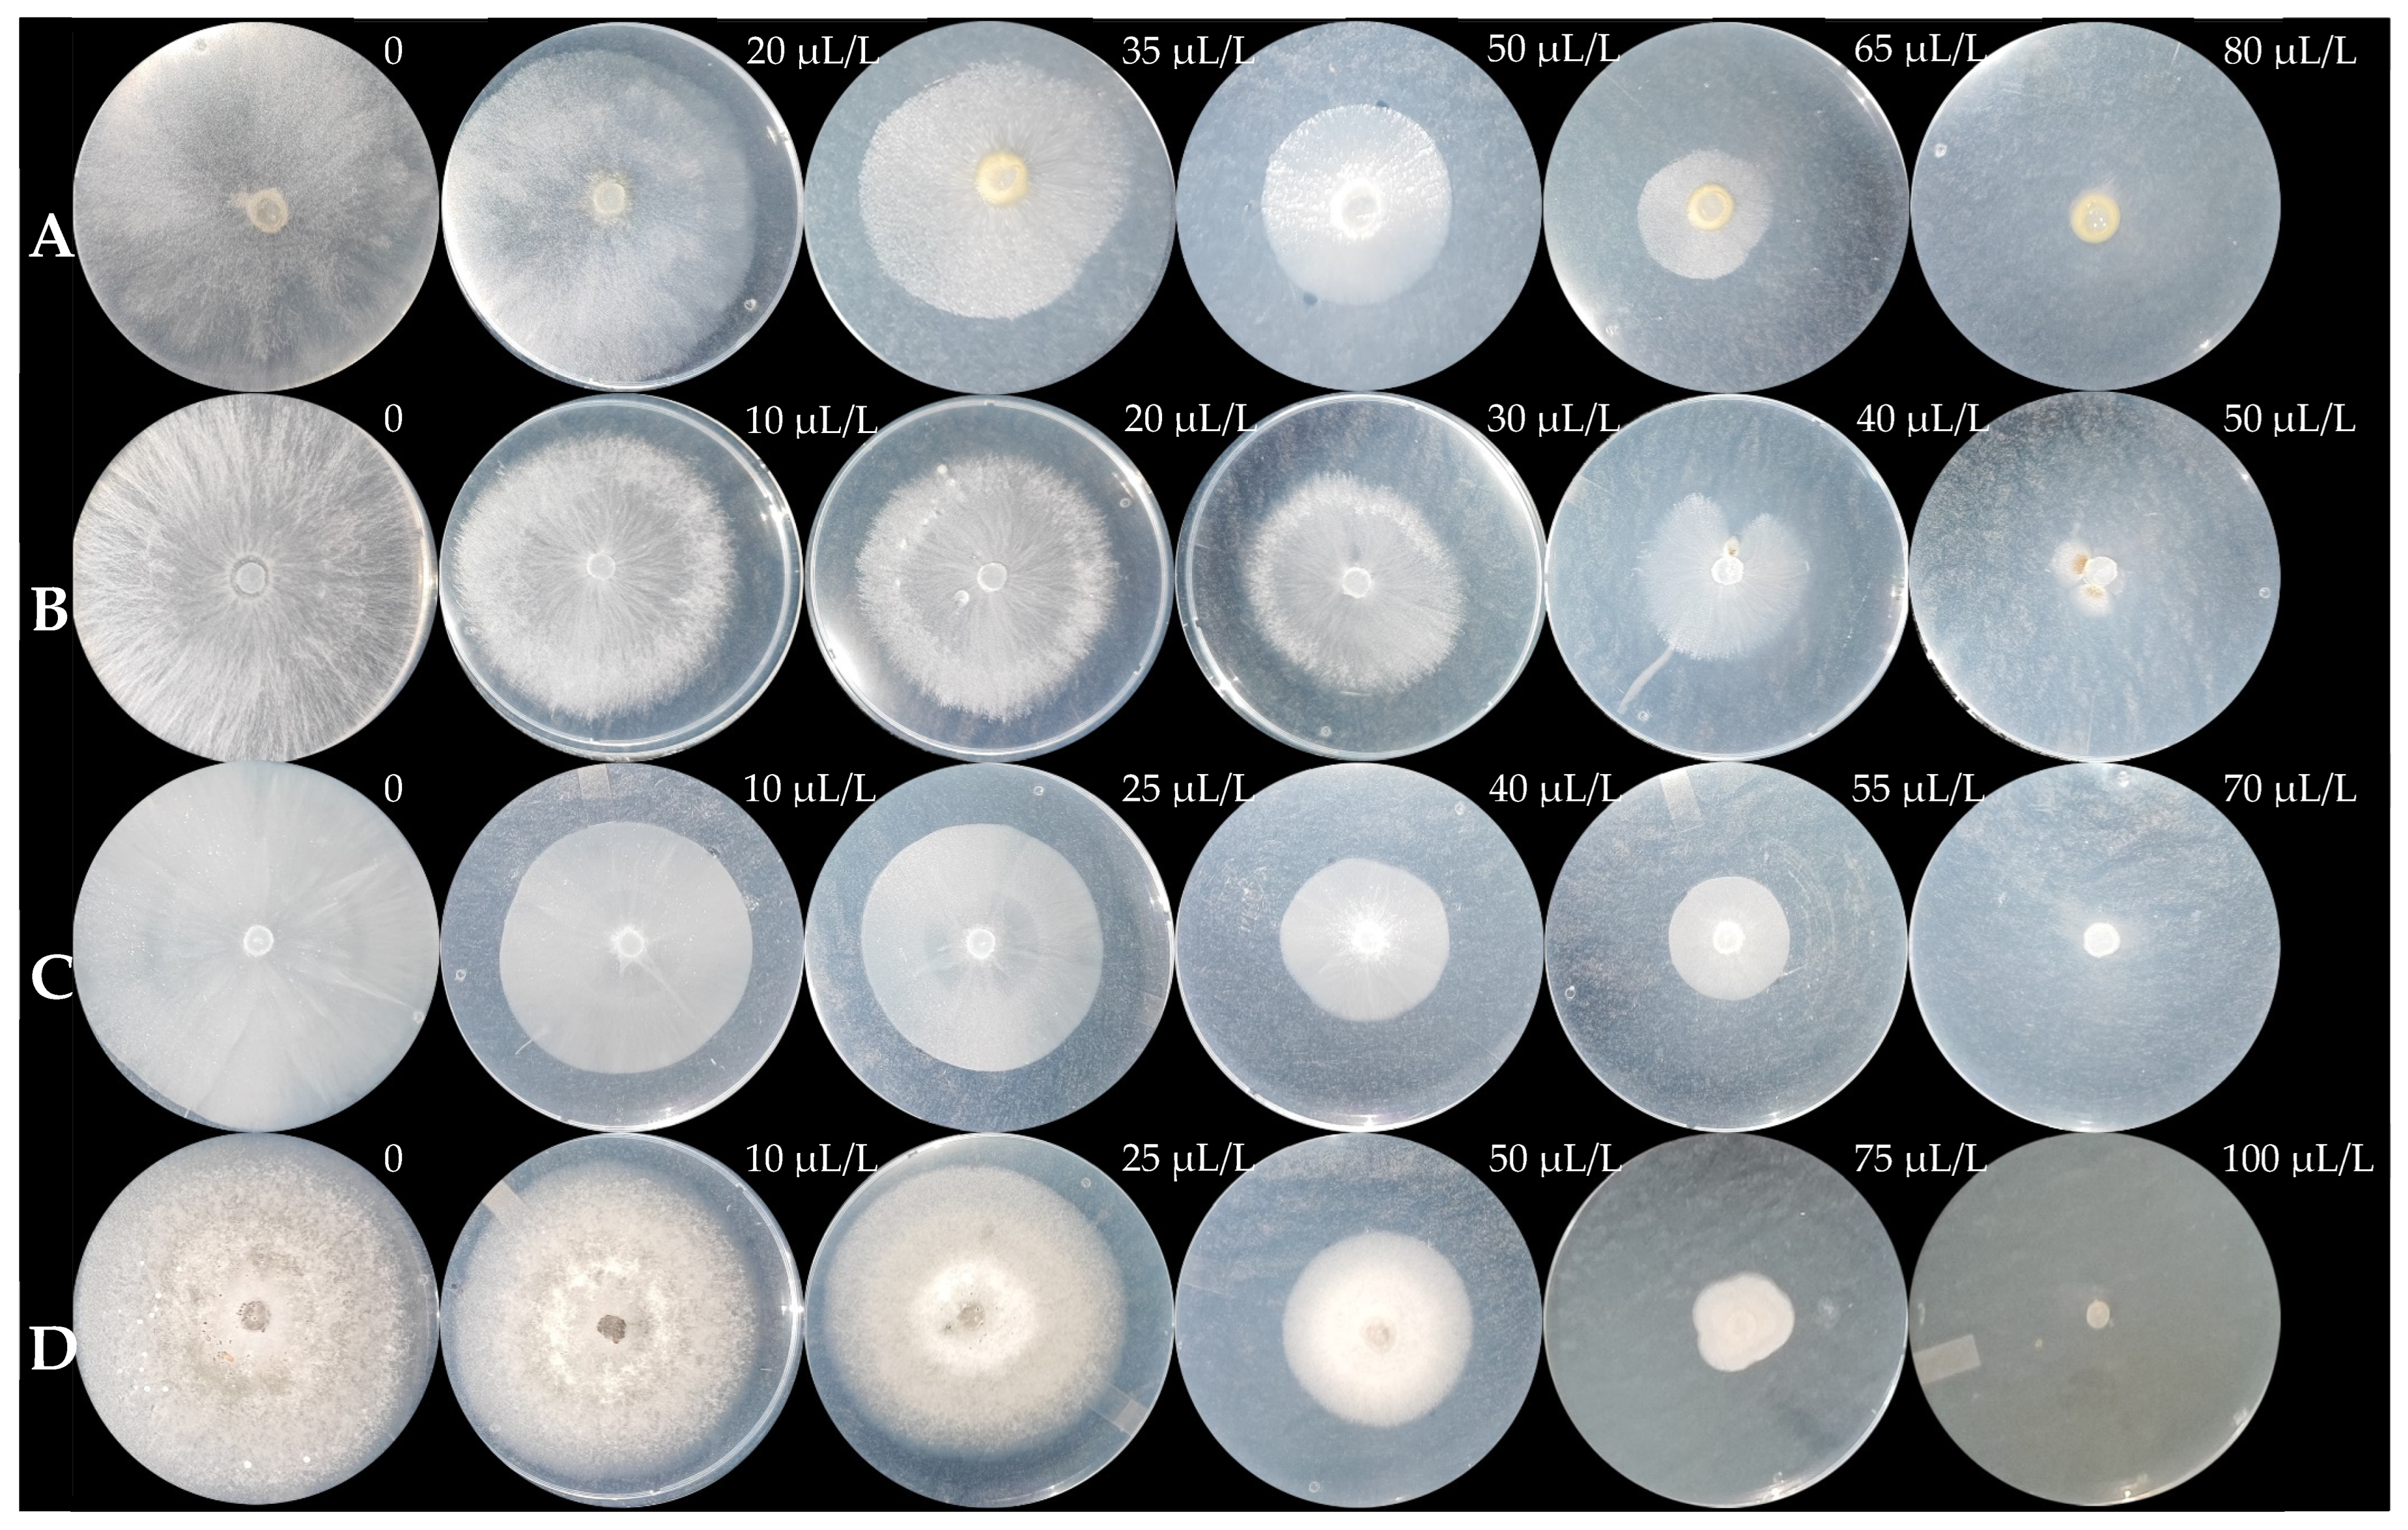
3.4. In Vitro Fungicidal and Oomyceticidal Activity Assays
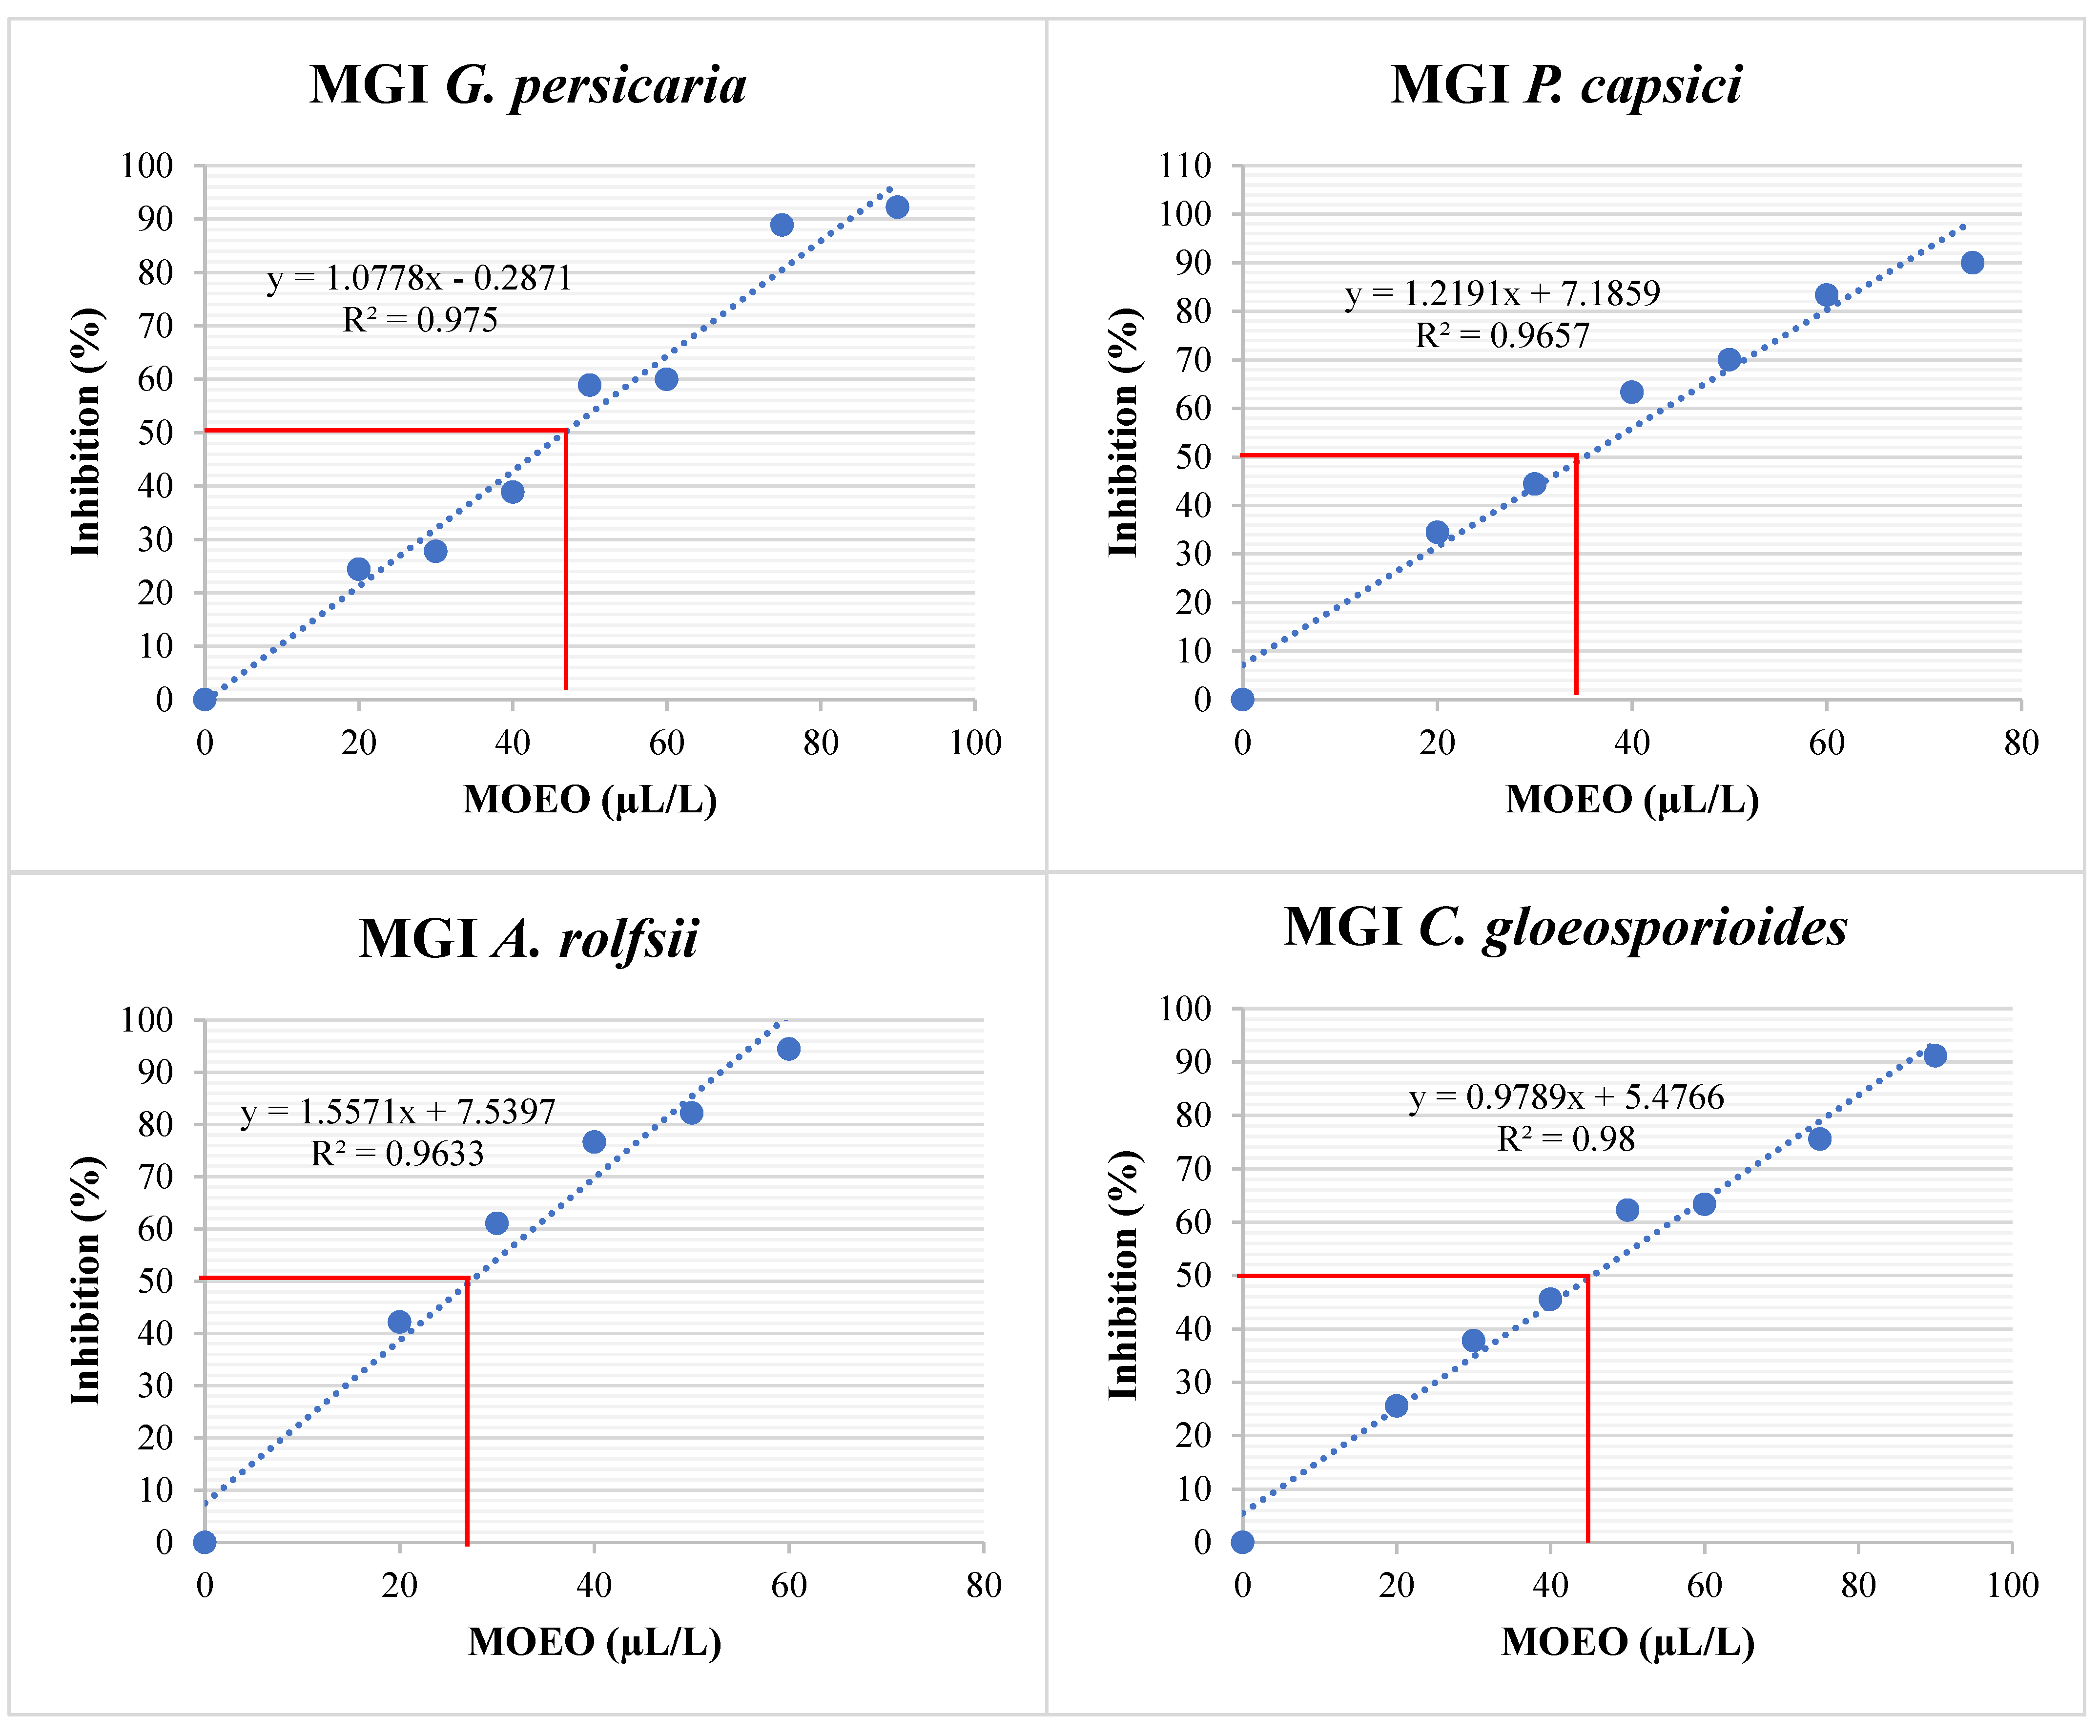
3.4.1. MGI (%)
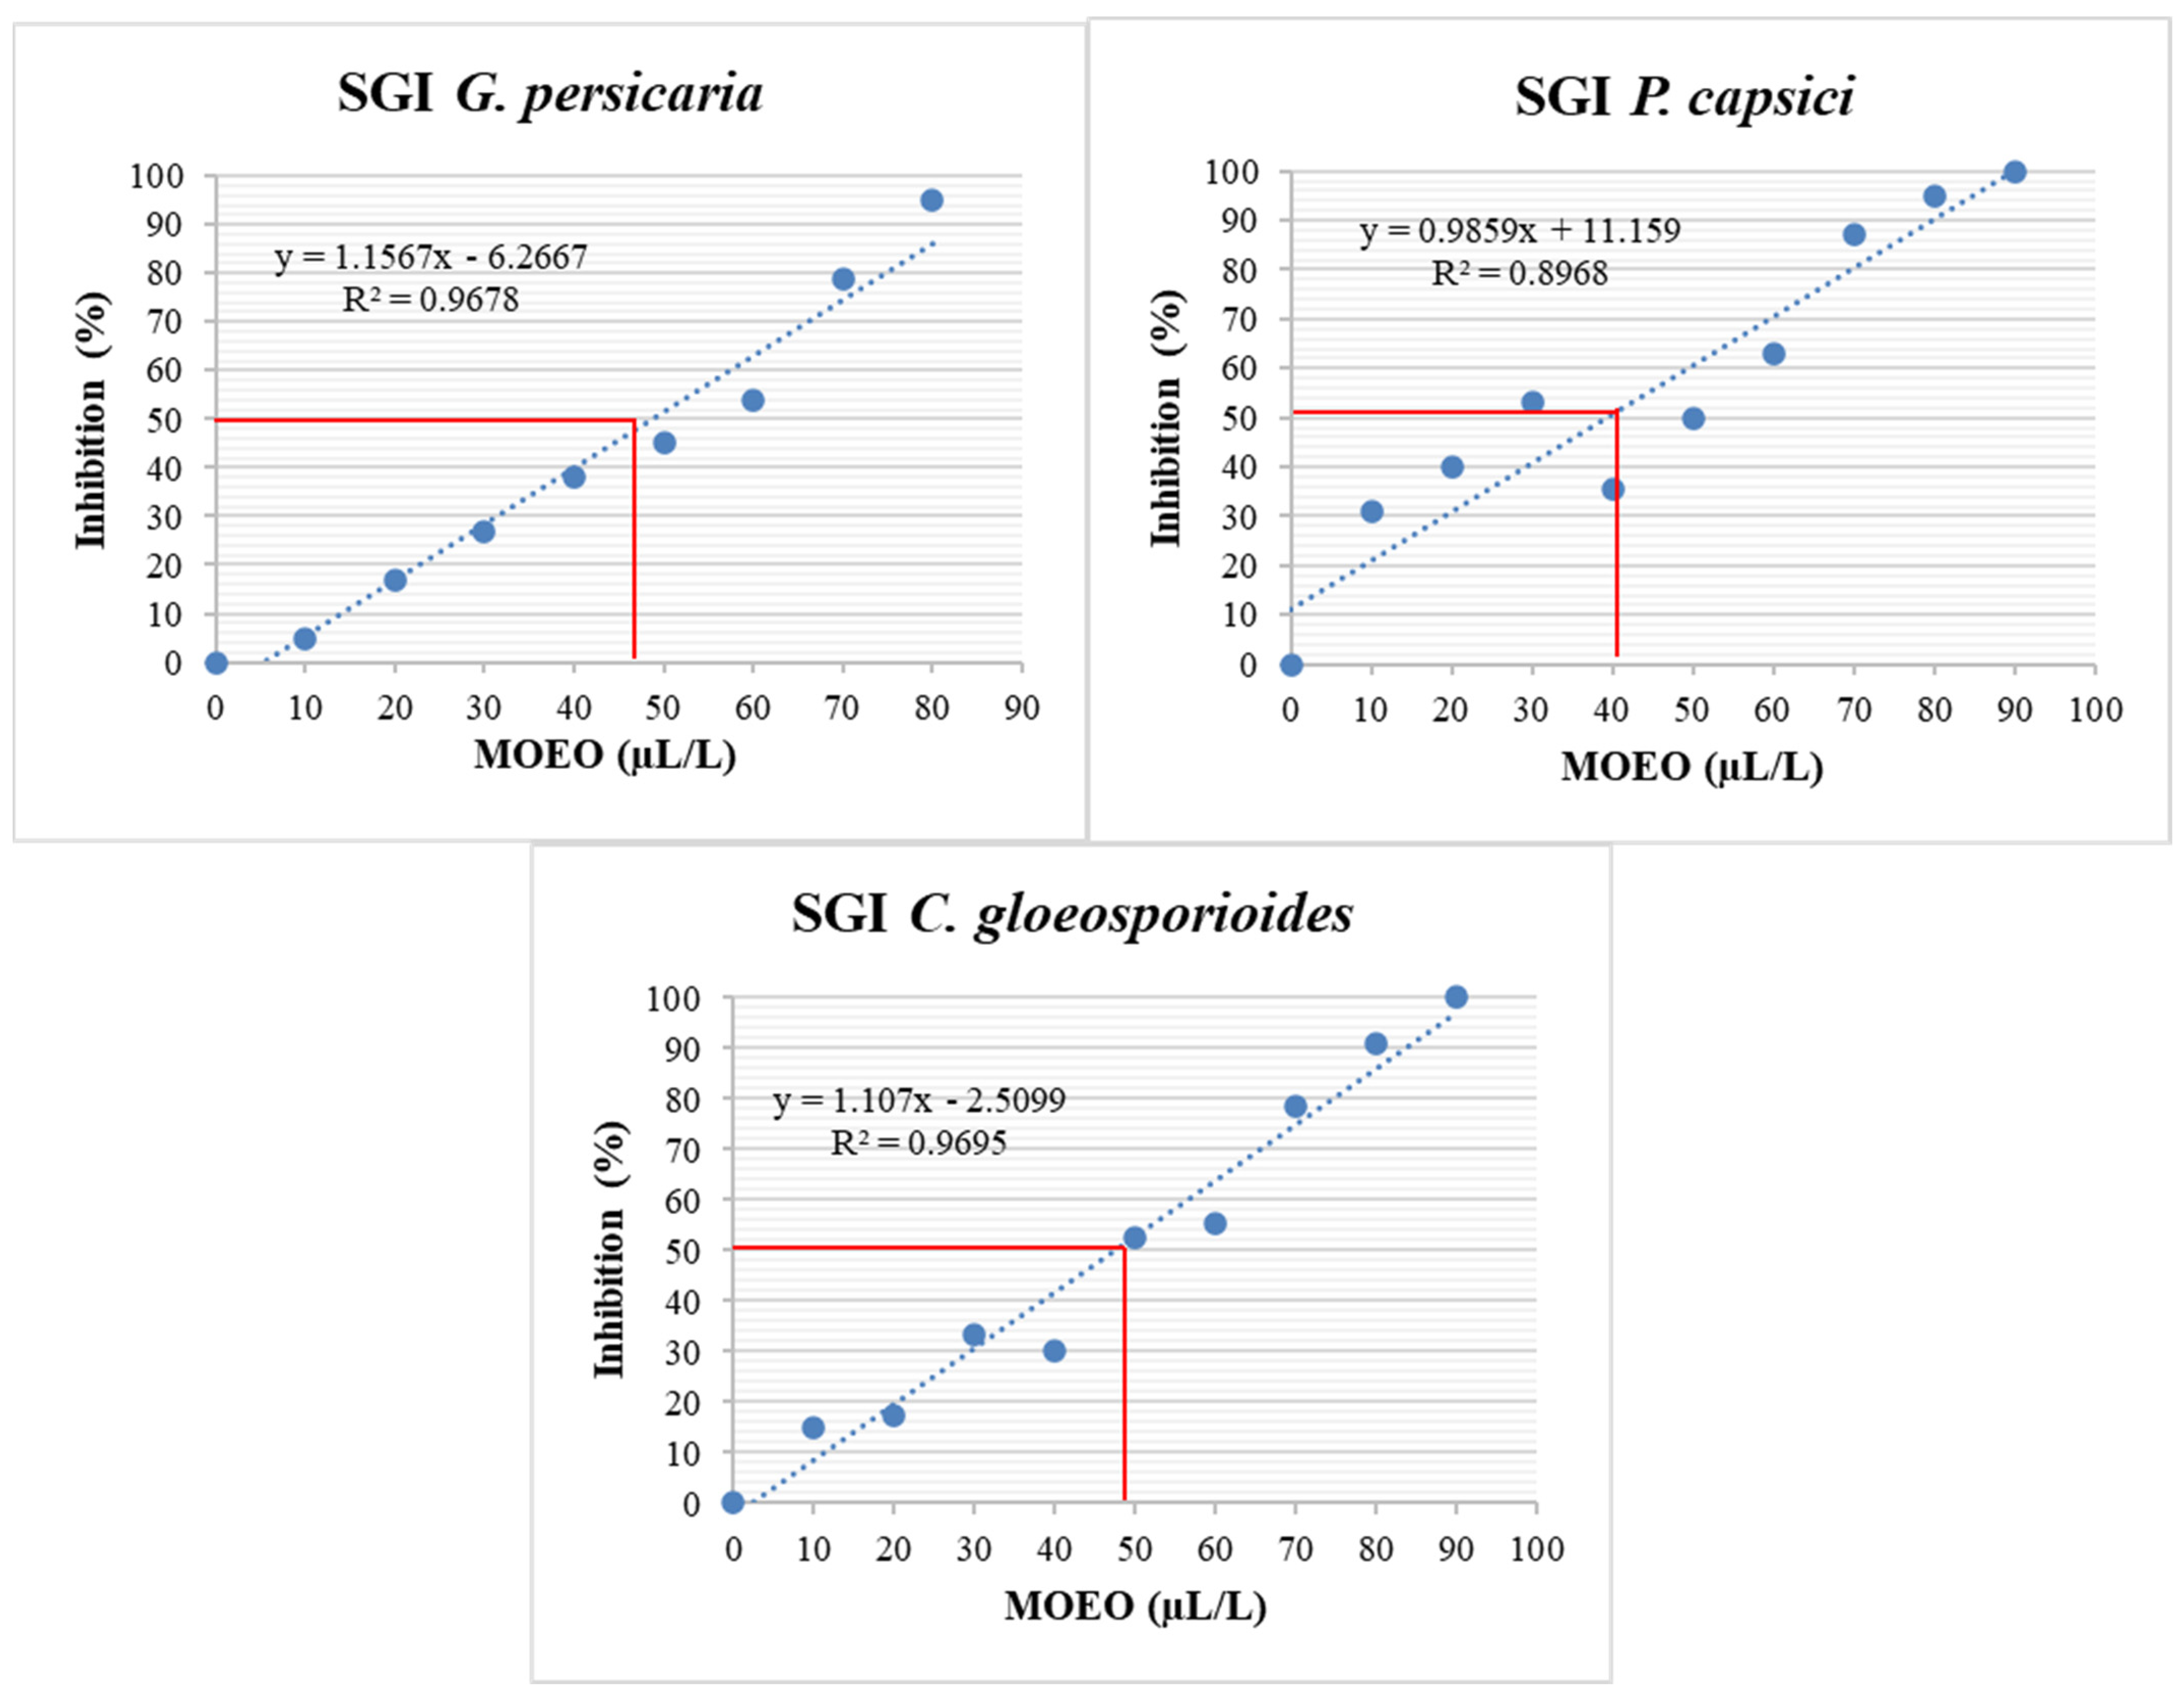
3.4.2. SGI (%)
3.4.3. MIC
3.4.4. MFC
4. Conclusions
Supplementary Materials
Author Contributions
Funding
Data Availability Statement
Acknowledgments
Conflicts of Interest
References
- Savary, S.; Willocquet, L.; Pethybridge, S.J.; Esker, P.; McRoberts, N.; Nelson, A. The global burden of pathogens and pests on major food crops. Nat. Ecol. Evol. 2019, 3, 430–439. [Google Scholar] [CrossRef] [PubMed]
- Agrios, G.N. Plant Pathology; Elsevier: Amsterdam, The Netherlands, 2005. [Google Scholar]
- Carmona, M.; Sautua, F. La problemática de la resistencia de hongos a fungicidas. Causas y efectos en cultivos extensivos. Agron. Ambiente 2017, 37, 1. [Google Scholar]
- Ortiz, G.; Pacheco-Moises, F.; Macías-Islas, M.; Jiménez-Gil, F.; Miranda, A.; Flores-Alvarado, L.; Cruz-Ramos, J.; Morales-Sánchez, E.; Ramírez-Ramírez, V.; Alatorre-Jiménez, M.; et al. Toxicidad de plaguicidas y su asociación con la enfermedad de Parkinson. Arch. Neurocienc. 2011, 16, 33. [Google Scholar]
- Belhi, Z.; Boulenouar, N.; Abdelkrim, C. The use of natural products against Fusarium oxysporum: A review. Nat. Prod. J. 2022, 12, 27–37. [Google Scholar] [CrossRef]
- Cespedes, C.L.; Alarcon, J.; Aqueveque, P.M.; Lobo, T.; Becerra, J.; Balbontin, C.; Avila, J.G.; Kubo, I.; Seigler, D.S. New environmentally-friendly antimicrobials and biocides from Andean and Mexican biodiversity. Environ. Res. 2015, 142, 549–562. [Google Scholar] [CrossRef] [PubMed]
- Chemat, S.; Cherfouh, R.; Meklati, B.Y.; Belanteur, K. Composition and microbial activity of thyme (Thymus algeriensis genuinus) essential oil. J. Essent. Oil Res. 2012, 24, 5–11. [Google Scholar] [CrossRef]
- Do, T.C.V.; Vu, T.C. Optimization of essential oil production from Cymbopogon citratus in Vietnam by hydro-distillation. Indones. J. Chem. 2024, 24, 459–469. [Google Scholar] [CrossRef]
- Garzoli, S.; Pirolli, A.; Vavala, E.; Di Sotto, A.; Sartorelli, G.; Božović, M.; Angiolella, L.; Mazzanti, G.; Pepi, F.; Rngno, R. Multidisciplinary approach to determine the optimal time and period for extracting the essential oil from Mentha suaveolens Ehrh. Molecules 2015, 20, 9640–9655. [Google Scholar] [CrossRef]
- Stankovic, M.; Cakic, M.; Nikolic, N.; Nikolić, G. The effect of the hydrodistillation technique on the yield and composition of the essential oil from the leaves of Mentha verticillata L. Hem. Ind. 2001, 55, 389–393. [Google Scholar]
- Sharma, N.; Tripathi, A. Fungitoxicity of the essential oil of Citrus sinensis on post-harvest pathogens. World J. Microb. Biot. 2006, 22, 587–593. [Google Scholar] [CrossRef]
- Stupar, M.; Grbić, M.L.; Džamić, A.; Unković, N.; Ristić, M.; Jelikić, A.; Vukojević, J. Antifungal activity of selected essential oils and biocide benzalkonium chloride against the fungi isolated from cultural heritage objects. S. Afr. J. Bot. 2014, 93, 118–124. [Google Scholar] [CrossRef]
- Hänel, H.; Raether, W. A more sophisticated method of determining the fungicidal effect of water-insoluble preparations with a cell harvester, using miconazole as an example./eine verbesserte methode zur bestimmung der fungizidie von wasserunlöslichen präparaten mit hilfe eines zellerntegerätes am beispiel von miconazol. Mycoses 1988, 31, 148–154. [Google Scholar] [PubMed]
- Wei, C.; Wan, C.; Huang, F.; Guo, T. Extraction of Cinnamomum longepaniculatum deciduous leaves essential oil using solvent-free microwave extraction: Process optimization and quality evaluation. Oil Crop Sci. 2023, 8, 7–15. [Google Scholar] [CrossRef]
- Zhao, T.; Gao, F.; Zhou, L.; Song, T. Essential oil from Inula britannica extraction with SF-CO2 and its antifungal activity. J. Integr. Agric. 2013, 12, 1791–1798. [Google Scholar] [CrossRef]
- Chen, C.; Wan, C.; Peng, X.; Chen, Y.; Chen, M.; Chen, J. Optimization of antifungal extracts from Ficus hirta fruits using response surface methodology and antifungal activity tests. Molecules 2015, 20, 19647–19659. [Google Scholar] [CrossRef]
- Soto-Armenta, L.C.; Sacramento-Rivero, J.C.; Acereto-Escoffié, P.O.; Peraza-González, E.E.; Reyes-Sosa, C.F.; Rocha-Uribe, J.A. Extraction yield of essential oil from Lippia graveolens leaves by steam distillation at laboratory and pilot scales. J. Essent. Oil Bear. Plants 2017, 20, 610–621. [Google Scholar] [CrossRef]
- Bueno-Durán, A.Y.; Cervantes-Martínez, J.; Obledo-Vázquez, E.N. Composition of essential oil from Lippia graveolens. Relationship between spectral light quality and thymol and carvacrol content. J. Essent. Oil Res. 2014, 26, 153–160. [Google Scholar] [CrossRef]
- Souza, L.M.; da Fonseca, F.S.A.; Silva, J.C.R.L.; Martins, E.R. Seasonal variation of essential oil of germplasm of Lippia origanoides Kunth (Verbenaceae). Boletín Latinoam. Y Del Caribe De Plantas Med. Y Aromáticas 2022, 21, 716–724. [Google Scholar] [CrossRef]
- Araújo, E.R.; Costa-Carvalho, R.R.; Fontes, M.G.; Laranjeira, D.; Blank, A.F.; Alves, P.B. Antifungal activity of essential oils of Lippia species of Colletotrichum sp. in vitro. Acta Hortic. 2012, 1198, 9–15. [Google Scholar] [CrossRef]
- Zhou, L.; Zhang, Z.; Wei, M.; Xie, Y.; He, S.; Shi, H.; Lin, Z. Evaluation of the antifungal activity of individual and combined monoterpenes against Rhizopus stolonifer and Absidia coerulea. Environ. Sci. Pollut. Res. 2019, 26, 7804–7809. [Google Scholar] [CrossRef] [PubMed]
- Leal, L.E.; Alarcón, A.A.; Ortega-Baes, P.; Cayo, F.; Alarcón, R. Effects of essential oils from two Lippia species on growth of phytopathogenic fungi. Bol. latinoam. Caribe Plantas Med. Aromát. 2018, 17, 30–35. [Google Scholar]
- Oliveira, T.N.S.; Silva, C.M.S.; Malveira, E.A.; Aguiar, T.K.B.; Santos, H.S.; Albuquerque, C.C.; Morais, M.B.; Teixeira, E.H.; Vasconcelos, M.A. Antifungal and antibiofilm activities of the essential oil of leaves from Lippia gracilis Schauer against phytopathogenic fungi. J. Appl. Microbiol. 2021, 130, 1117–1129. [Google Scholar] [CrossRef] [PubMed]
- Regnier, T.; Combrinck, S.; Du, W. Improvement of postharvest quality of subtropical fruits using Lippia Scaberrima essential oil. Acta Hortic. 2009, 877, 1567–1573. [Google Scholar] [CrossRef]
- Antonia, B.D.; Oliveira, J.; da Silva, P.P.M.; Biazotto, A.D.; de Toledo, N.M.V.; da Glória, E.M.; Spoto, M.H.F. Positive effect of Lippia sidoides essential oil associated with carboxymethylcellulose in the control of anthracnose in avocado. Food Prod. Process. Nutr. 2024, 6, 39. [Google Scholar] [CrossRef]
- Gow Neil, A.R.; Latge, J.P.; Munro Carol, A. The fungal cell wall: Structure, biosynthesis, and function. Microbiol. Spectr. 2017, 5, 10–1128. [Google Scholar]
- Hernández, T.; Canales, M.; García, A.M.; Duran, A.; Meráz, S.; Dávila, P.; Ávila, J.G. Antifungal activity of the essential oils of two Verbenaceae: Lantana achyranthifolia and Lippia graveolens of Zapotitlan de las Salinas, Puebla (Mexico). Bol. Latinoam. Caribe Plantas Med. Aromát. 2008, 7, 203–207. [Google Scholar]
- Linde, J.H.; Combrinck, S.; Regnier, T.J.C.; Virijevic, S. Chemical composition and antifungal activity of the essential oils of Lippia rehmannii from South Africa. S. Afr. J. Bot. 2010, 76, 37–42. [Google Scholar] [CrossRef]
- Roberson, R.W. Subcellular structure and behaviour in fungal hyphae. J. Microsc. 2020, 280, 75–85. [Google Scholar] [CrossRef]
- Feofilova, E.P. The kingdom fungi: Heterogeneity of physiological and biochemical properties and relationships with plants, animals, and prokaryotes (Review). Appl. Biochem. Microbiol. 2001, 37, 124–137. [Google Scholar] [CrossRef]
- Hurdeal, V.G.; Gentekaki, E.; Hyde, K.D.; Jeewon, R. Where are the basal fungi? Current status on diversity, ecology, evolution, and taxonomy. Biologia 2021, 76, 421–440. [Google Scholar] [CrossRef]
- Ruiz-Herrera, J.; Ortiz-Castellanos, L. Analysis of the phylogenetic relationships and evolution of the cell walls from yeasts and fungi. FEMS Yeast Res. 2010, 10, 225–243. [Google Scholar] [CrossRef]


| N | Process Variables | Response Variables | |||||||||||||||
|---|---|---|---|---|---|---|---|---|---|---|---|---|---|---|---|---|---|
| Time (min) | Temperature of the Heating Source (°C) | S/L (g/L) | Yield (%) | Carvacrol (%) | Thymol (%) | Thymol + Carvacrol (%) | % MGI (G. persicaria) | % MGI (A. rolfsii) | % MGI (P. capsici) | % MGI (C. gloeosporioides) | % SGI (C. gloeosporioides) | % SGI (G. persicaria) | MIC (G. persicaria) | MIC (C. gloeosporioides) | MFC (G. persicaria) | MFC (C. gloeosporioides) | |
| 1 | 20 | 270 | 40 | 2.03 | 5 | 54.8 | 59.8 | 38.89 | 40.00 | 44.44 | 34.44 | 22.22 | 26.92 | 120 | 120 | 950 | 185 |
| 2 | 70 | 270 | 40 | 2.46 | 5.5 | 60.3 | 65.8 | 32.22 | 46.67 | 52.22 | 33.33 | 13.47 | 11.59 | 85 | 120 | 900 | 200 |
| 3 | 20 | 370 | 40 | 2.4 | 6.7 | 67.3 | 74 | 42.22 | 33.33 | 27.78 | 33.33 | 7.80 | 16.61 | 90 | 150 | 750 | 200 |
| 4 | 70 | 370 | 40 | 2.5 | 4 | 43.6 | 47.6 | 20.00 | 28.89 | 6.67 | 21.11 | 16.80 | 26.31 | 170 | 350 | 1200 | 800 |
| 5 | 20 | 270 | 110 | 1.75 | 5.1 | 61.9 | 67 | 30.00 | 32.22 | 34.44 | 28.89 | 12.46 | 19.28 | 90 | 150 | 1000 | 200 |
| 6 | 70 | 270 | 110 | 2.36 | 3.8 | 46.3 | 50.1 | 25.56 | 52.22 | 13.33 | 30.00 | 19.84 | 25.97 | 135 | 205 | 1050 | 400 |
| 7 | 20 | 370 | 110 | 2.36 | 5.8 | 67.7 | 73.6 | 18.89 | 30.00 | 60.00 | 35.56 | 62.08 | 52.48 | 85 | 150 | 800 | 200 |
| 8 | 70 | 370 | 110 | 2.61 | 7.3 | 70.6 | 77.9 | 48.89 | 54.44 | 78.89 | 61.11 | 18.21 | 38.07 | 105 | 200 | 850 | 335 |
| 9 | 2.96 | 320 | 75 | 1.53 | 5.6 | 62.6 | 68.1 | 33.33 | 31.11 | 30.00 | 34.44 | 24.14 | 24.03 | 105 | 185 | 900 | 350 |
| 10 | 87.04 | 320 | 75 | 2.8 | 6.5 | 61.8 | 68.3 | 43.33 | 46.67 | 54.44 | 55.56 | 16.10 | 21.51 | 90 | 135 | 1000 | 205 |
| 11 | 45 | 235.91 | 75 | 2 | 6.1 | 66.6 | 73 | 32.22 | 78.89 | 53.33 | 37.78 | 4.83 | 17.32 | 95 | 135 | 1000 | 250 |
| 12 | 45 | 404.09 | 75 | 3.3 | 6.6 | 64.5 | 71.1 | 40.00 | 42.22 | 31.11 | 35.56 | 22.72 | 29.03 | 90 | 150 | 850 | 205 |
| 13 | 45 | 320 | 16.14 | 2 | 6.7 | 70.2 | 76.9 | 33.33 | 35.56 | 32.22 | 34.44 | 16.67 | 34.00 | 115 | 150 | 950 | 250 |
| 14 | 45 | 320 | 133.86 | 2.4 | 6.5 | 72.3 | 78.8 | 26.67 | 30.00 | 35.56 | 31.11 | 43.87 | 30.00 | 100 | 150 | 900 | 255 |
| 15 | 45 | 320 | 75 | 3.25 | 7 | 69.5 | 76.6 | 75.56 | 78.11 | 84.89 | 70.22 | 43.30 | 45.99 | 85 | 125 | 900 | 185 |
| 16 | 45 | 320 | 75 | 3.11 | 6.8 | 65.9 | 72.7 | 78.89 | 80.00 | 92.22 | 71.11 | 46.61 | 42.22 | 90 | 120 | 800 | 200 |
| 17 | 45 | 320 | 75 | 3.11 | 7.6 | 70.9 | 78.5 | 61.11 | 66.67 | 81.11 | 56.67 | 59.27 | 39.81 | 85 | 140 | 800 | 185 |
| 18 | 45 | 320 | 75 | 3.02 | 7.3 | 72.6 | 79.9 | 71.11 | 83.33 | 87.78 | 68.89 | 52.63 | 53.63 | 90 | 120 | 800 | 200 |
| 19 | 45 | 320 | 75 | 2.9 | 6.7 | 68 | 74.7 | 85.00 | 78.89 | 92.22 | 81.11 | 50.94 | 45.73 | 90 | 120 | 850 | 155 |
| 20 | 45 | 320 | 75 | 3.12 | 6.9 | 70.2 | 77.1 | 81.67 | 81.67 | 71.11 | 73.33 | 48.37 | 45.48 | 90 | 120 | 750 | 155 |
| N | Process Variables | Response Variables | |||||||||
|---|---|---|---|---|---|---|---|---|---|---|---|
| Time (min) | Temperature of the Heating Source (°C) | S/L (g/L) | Yield (%) | % MGI (G. persicaria) | % MGI (A. rolfsii) | % MGI (P. capsici) | % MGI (C. gloeosporioides) | % SGI (C. gloeosporioides) | % SGI (G. persicaria) | MFC (G. persicaria) | |
| 1 | 20 | 270 | 40 | 2.03 | 38.89 | 40.00 | 44.44 | 34.44 | 22.22 | 26.92 | 950 |
| 2 | 70 | 270 | 40 | 2.46 | 32.22 | 46.67 | 52.22 | 33.33 | 13.47 | 11.59 | 900 |
| 3 | 20 | 370 | 40 | 2.4 | 42.22 | 33.33 | 27.78 | 33.33 | 7.80 | 16.61 | 750 |
| 4 | 70 | 370 | 40 | 2.5 | 20.00 | 28.89 | 6.67 | 21.11 | 16.80 | 26.31 | 1200 |
| 5 | 20 | 270 | 110 | 1.75 | 30.00 | 32.22 | 34.44 | 28.89 | 12.46 | 19.28 | 1000 |
| 6 | 70 | 270 | 110 | 2.36 | 25.56 | 52.22 | 13.33 | 30.00 | 19.84 | 25.97 | 1050 |
| 7 | 20 | 370 | 110 | 2.36 | 18.89 | 30.00 | 60.00 | 35.56 | 62.08 | 52.48 | 800 |
| 8 | 70 | 370 | 110 | 2.61 | 48.89 | 54.44 | 78.89 | 61.11 | 18.21 | 38.07 | 850 |
| 9 | 2.96 | 320 | 75 | 1.53 | 33.33 | 31.11 | 30.00 | 34.44 | 24.14 | 24.03 | 900 |
| 10 | 87.04 | 320 | 75 | 2.8 | 43.33 | 46.67 | 54.44 | 55.56 | 16.10 | 21.51 | 1000 |
| 11 | 45 | 235.91 | 75 | 2 | 32.22 | 78.89 | 53.33 | 37.78 | 4.83 | 17.32 | 1000 |
| 12 | 45 | 404.09 | 75 | 3.3 | 40.00 | 42.22 | 31.11 | 35.56 | 22.72 | 29.03 | 850 |
| 13 | 45 | 320 | 16.14 | 2 | 33.33 | 35.56 | 32.22 | 34.44 | 16.67 | 34.00 | 950 |
| 14 | 45 | 320 | 133.86 | 2.4 | 26.67 | 30.00 | 35.56 | 31.11 | 43.87 | 30.00 | 900 |
| 15 | 45 | 320 | 75 | 3.25 | 75.56 | 78.11 | 84.89 | 70.22 | 43.30 | 45.99 | 900 |
| 16 | 45 | 320 | 75 | 3.11 | 78.89 | 80.00 | 92.22 | 71.11 | 46.61 | 42.22 | 800 |
| 17 | 45 | 320 | 75 | 3.11 | 61.11 | 66.67 | 81.11 | 56.67 | 59.27 | 39.81 | 800 |
| 18 | 45 | 320 | 75 | 3.02 | 71.11 | 83.33 | 87.78 | 68.89 | 52.63 | 53.63 | 800 |
| 19 | 45 | 320 | 75 | 2.9 | 85.00 | 78.89 | 92.22 | 81.11 | 50.94 | 45.73 | 850 |
| 20 | 45 | 320 | 75 | 3.12 | 81.67 | 81.67 | 71.11 | 73.33 | 48.37 | 45.48 | 750 |
| Factor | Optimal Level | Low Level | High Level | Composite Desirability |
| Time (min) | 46.27 | 20 | 70 | 0.86 |
| Temperature (°C) | 329.34 | 270 | 370 | |
| Solid/liquid ratio (g/L) | 80.35 | 40 | 110 | |
| Response Variable | Fit | SE of Fit | 95% CI | 95% PI |
| Yield (%) | 3.14 | 0.0796 | (2.97–3.31) | (2.68–3.60) |
| % MGI (G. persicaria) | 74.75 | 3.37 | (67.41–82.10) | (55.19–94.31) |
| % MGI (A. rolfsii) | 76.78 | 2.79 | (70.71–82.85) | (60.61–92.96) |
| % MGI (P. capsici) | 85.05 | 4.85 | (74.49–95.62) | (56.93–113.18) |
| % MGI (C. gloeosporioides) | 70.46 | 3.52 | (62.79–78.13) | (50.03–90.89) |
| % SGI (G. perisicaria) | 46.59 | 2.95 | (40.17–53) | (29.49–63.68) |
| % SGI (C. gloeosporioides) | 51.47 | 3.59 | (43.47–59.47) | (30.17–72.77) |
| MFC (G. persicaria) | 810.8 | 29.8 | (745.1–876.4) | (636–985.6) |
| Response Variable | Predicted Value ± SE | 95% CI for Prediction Fit | Experimental Values ± SE | 95% CI for Experimental Values | T-Value | p-Value |
|---|---|---|---|---|---|---|
| Yield (%) | 3.14 ± 0.0796 | (2.97–3.31) | 3.11 ± 0.0386 | (3.01–3.22) | −0.77 | 0.482 |
| % MGI (G. persicaria) | 74.75 ± 3.37 | (67.41–82.10) | 78.11 ± 3.82 | (67.50–88.73) | 0.88 | 0.429 |
| % MGI (A. rolfsii) | 76.78 ± 2.79 | (70.71–82.85) | 75.56 ± 1.57 | (71.19–79.92) | −0.78 | 0.479 |
| % MGI (P. capsici) | 85.05 ± 4.85 | (74.49–95.62) | 82.44 ± 2.49 | (75.52–89.37) | −1.04 | 0.355 |
| % MGI (C. gloeosporioides) | 70.46 ± 3.52 | (62.79–78.13) | 66.44 ± 1.74 | (61.63–71.26) | −2.31 | 0.082 |
| % SGI (G. perisicaria) | 46.59 ± 2.95 | (40.17–53) | 48.08 ± 0.75 | (45.99–50.16) | 1.98 | 0.119 |
| % SGI (C. gloeosporioides) | 51.47 ± 3.59 | (43.47–59.47) | 50.86 ± 0.9 | (48.37–53.35) | −0.68 | 0.534 |
| MFC (G. persicaria) | 810.8 ± 29.8 | (745.1–876.4) | 803 ± 12 | (769.7–836.3) | −0.65 | 0.551 |
| Phytopathogen | MGI EC50 (µL/L) | SGI EC50 (µL/L) | MIC (µL/L) | MFC (µL/L) |
|---|---|---|---|---|
| G. persicaria | 43.55 ± 3.12 a | 48.97 ± 0.66 a | 86.67 ± 2.89 b | 805 ± 10 a |
| A. rolfsii | 27.29 ± 1.61 c | nd | 81.67 ± 7.64 b | 141.67 ± 2.89 c |
| P. capsici | 35.15 ± 1.28 b | 41.74 ± 4 b | 98.33 ± 7.64 b | 148.33 ± 2.89 c |
| C. gloeosporioides | 43.67 ± 2.22 a | 49.67 ± 2.14 a | 128.33 ± 10.41 a | 185 ± 5 b |
Disclaimer/Publisher’s Note: The statements, opinions and data contained in all publications are solely those of the individual author(s) and contributor(s) and not of MDPI and/or the editor(s). MDPI and/or the editor(s) disclaim responsibility for any injury to people or property resulting from any ideas, methods, instructions or products referred to in the content. |
© 2025 by the authors. Licensee MDPI, Basel, Switzerland. This article is an open access article distributed under the terms and conditions of the Creative Commons Attribution (CC BY) license (https://creativecommons.org/licenses/by/4.0/).
Share and Cite
Valdez-Baro, O.; Cruz-Lachica, I.; Tovar-Pedraza, J.M.; Heredia, J.B.; Bastidas-Bastidas, P.d.J.; Manjarrez-Quintero, J.P.; García-Estrada, R.S. Optimization of Mexican Oregano Essential Oil (Lippia Graveolens) Extraction with Fungicidal and Oomyceticidal Effects Against Plant Pathogens. Processes 2025, 13, 490. https://doi.org/10.3390/pr13020490
Valdez-Baro O, Cruz-Lachica I, Tovar-Pedraza JM, Heredia JB, Bastidas-Bastidas PdJ, Manjarrez-Quintero JP, García-Estrada RS. Optimization of Mexican Oregano Essential Oil (Lippia Graveolens) Extraction with Fungicidal and Oomyceticidal Effects Against Plant Pathogens. Processes. 2025; 13(2):490. https://doi.org/10.3390/pr13020490
Chicago/Turabian StyleValdez-Baro, Octavio, Isabel Cruz-Lachica, Juan Manuel Tovar-Pedraza, José Basilio Heredia, Pedro de Jesús Bastidas-Bastidas, Juan Pablo Manjarrez-Quintero, and Raymundo Saúl García-Estrada. 2025. "Optimization of Mexican Oregano Essential Oil (Lippia Graveolens) Extraction with Fungicidal and Oomyceticidal Effects Against Plant Pathogens" Processes 13, no. 2: 490. https://doi.org/10.3390/pr13020490
APA StyleValdez-Baro, O., Cruz-Lachica, I., Tovar-Pedraza, J. M., Heredia, J. B., Bastidas-Bastidas, P. d. J., Manjarrez-Quintero, J. P., & García-Estrada, R. S. (2025). Optimization of Mexican Oregano Essential Oil (Lippia Graveolens) Extraction with Fungicidal and Oomyceticidal Effects Against Plant Pathogens. Processes, 13(2), 490. https://doi.org/10.3390/pr13020490