Abstract
The Sulige Gas Field is a typical low-permeability, low-pressure tight gas field, where pneumatic jetting is crucial for production. However, existing gas jet pumps have low efficiency, limiting field production and overall development. This paper explores the effect of adding water, at specific volume fractions, to the driving gas on pneumatic jet pump performance. Using Volume of Fluid (VOF) and Computational Fluid Dynamics (CFD) simulations, a three-dimensional fluid domain model was developed to analyze the flow field, turbulent kinetic energy, and energy conversion in the pump. Results show that the water volume fraction significantly impacts pump efficiency, with performance improving over natural gas as the driving medium. The optimal performance occurs at a 0.5 water volume fraction, with efficiency exceeding 40% and a dimensionless mass flow ratio of approximately 2.0. As the volumetric fraction of water increases, the optimal working point of the jet pump (the dimensionless mass flow ratio corresponding to the peak pump efficiency) gradually decreases. It drops from 2.0 at water volumetric fractions of 0.1 and 0.5, to 1.8 at 0.8, and further to 1.5 at 1.0. These findings provide valuable insights for optimizing pneumatic jet performance in the Sulige Gas Field.
1. Introduction
Jet pumps operate based on Bernoulli’s principle, transferring the energy of high-pressure, low-velocity fluid from the surface to the bottom of the well via the wellbore. At the jet pump nozzle, this energy is converted into low-pressure, high-velocity fluid, facilitating fluid discharge and gas extraction [1]. A key advantage of jet pumps is their lack of moving parts. The components—such as the nozzle, throat, and diffuser—are simple in design and form an integrated unit with excellent sealing properties. This configuration enhances their durability, ease of maintenance, and suitability for a wide range of well types [2]. By leveraging the fluid’s inherent energy transfer capabilities, jet pumps effectively capitalize on the unique properties of fluids, making them highly adaptable for gas field development [3]. However, the jet pump efficiency observed in the Sulige gas field remains relatively low, and improving its performance has become a critical issue that requires urgent attention.
As an essential fluid transport device, jet pumps are widely used in applications such as liquid and gas mixing, pressurization, and transportation, particularly within the petroleum, chemical engineering, and environmental engineering sectors [4]. Enhancing the efficiency of jet pumps, especially under complex fluid flow conditions, remains a significant research challenge. In recent years, numerous studies have proposed various methods for improving pump efficiency, with a particular focus on optimizing structural parameters, especially the geometric relationship between the nozzle and the throat, leading to notable advancements. Mallela R. et al. (2004) [5] conducted numerical studies and identified that the primary energy loss in jet pumps results from poor mixing between the primary and secondary flows, which causes recirculation at the throat entrance. Based on these findings, they recommended that the standard length of the mixing pipe should be 7 to 9 times the nozzle diameter to enhance the mixing effect. Girgidov A.D. (2005) [6] performed experimental research on liquid-transport jet pumps and established the optimal range of structural parameters, offering valuable insights for jet pump design. Banasiak K. et al. (2006) [7] demonstrated that jet pump efficiency is closely linked to throat length, diameter, and the diffusion angle of the diffuser, revealing that optimizing these parameters could improve pump performance by up to 8%. O.B. Kwon (2002) [8] used two-dimensional numerical simulations to study the effects of jet velocity and suction chamber geometry on jet pump efficiency, revealing the significant impact of suction chamber design on performance. Long Xinping (2003) [9] aimed to maximize pump efficiency by analyzing the influence of varying throat lengths through numerical simulations. His findings indicated that as the area ratio between the nozzle outlet and throat inlet increases, the optimal throat length also increases. Zhu (2005) [10] focused on the effects of nozzle shape and throat design, noting that reducing the friction coefficient in the throat could improve pump performance under constant conditions. Wang Changbin (2006) [11] employed FLUENT software (v.10.0) to analyze the internal flow field of jet pumps, finding that pump efficiency is closely related to throat structure, particularly the mixing effect between gas and liquid phases in the flow field. Wu Jun (2007) [12] investigated the motion mechanisms within the internal flow field through both numerical simulations and experimental studies, revealing that the maximum turbulent kinetic energy occurs at the throat entrance, where fluid flow exhibits strong turbulence, which is closely linked to jet pump efficiency. Kumar et al. (2007) [13] conducted experiments on liquid-gas jet pumps in clean seawater, determining that pump efficiency was optimal when the nozzle-to-throat distance was 33 mm. R.L. Yadav (2008) [14] performed computational fluid dynamics (CFD) simulations using ANSYS (v.11.0) to analyze the injector flow field, revealing that the suction chamber shape significantly affects injector suction performance. He proposed optimization suggestions for the nozzle-to-throat distance and suction chamber diameter. A. Shah (2011) [15] simulated the operation of steam jet pumps, investigating variations in static pressure, temperature, and liquid flow along the length of the pump, which provided valuable insights into the working characteristics of steam jet pumps. Ge Yanjun (2011) [16] noted that, while maintaining a constant nozzle-to-throat distance, the pressure ratio of the jet pump decreases as the flow ratio increases. Additionally, when the flow ratio is constant, the pump efficiency follows a proportional-then-inversely proportional relationship with the nozzle-to-throat distance. The jet pump achieves optimal performance when the nozzle-to-throat distance is approximately 1.5 times the nozzle outlet diameter, with this range remaining valid within ±5%. Liu Xu (2011) [17] designed and numerically simulated a sand-discharge jet pump, finding that the area ratio directly influences energy conversion efficiency, with optimal performance occurring when the area ratio is 0.719. Wang Linghua (2011) [18] quantitatively analyzed the optimal operating parameters of pulse liquid jet pumps, suggesting that optimizing the injector structure could significantly improve pump efficiency. Chen Yan (2012) [19] conducted finite element analysis to determine the optimal nozzle-to-throat length for a liquid-gas jet pump, concluding that the optimal length occurs when the nozzle-to-throat distance is three times the nozzle outlet radius, which results in the highest pump efficiency. Wu Yanlan (2013) [20] explored the effects of flow ratio, working water pressure, and area ratio on the gas-liquid phase flow mixing efficiency in liquid-gas jet pumps through experimental studies, suggesting that a reasonable design of the diffuser length and expansion angle could enhance pump performance. K. Aldas (2014) [21] analyzed the impact of surface roughness on jet pump performance using CFD, finding that the SST k-ω model improved simulation accuracy. It was also observed that when the area ratio was 5.92 and the roughness was 0.05, the relative pump rate decreased by approximately 60%. Wang Yingliang (2015) [22] studied the influence of suction chamber length and inlet position on jet pump efficiency, concluding that these factors had minimal impact on suction performance, while optimizing the throat structure could significantly enhance efficiency. Chen Wenhui (2016) [23] performed an in-depth analysis of jet pump flow field simulations, suggesting that large eddy simulation (LES) is more accurate than Reynolds-averaged Navier-Stokes (RANS) models in capturing the internal flow field details, providing new insights for pump design optimization. Ran Lugang (2018) [24] analyzed the effects of streamlined and conical nozzles on jet pump performance, finding that the streamlined nozzle provided a higher pressure ratio under the same flow ratio conditions. Tan Jie (2019) [25] used simulations to analyze the influence of nozzle length-to-diameter ratio on jet pump performance, concluding that pump efficiency improves significantly when the length-to-diameter ratio is between 0.25 and 1. Wang et al. (2019) [26] studied the effect of suction chamber contour on the flow field of annular jet pumps, suggesting that a streamlined suction chamber could enhance efficiency at low flow ratios. Gao Guijun (2020) [27] investigated the effects of the converging half-angle at the nozzle-throat junction on the flow field through finite element simulations, finding that variations in the converging half-angle influenced both pressure ratio and pump efficiency. Morrall et al. (2020) [28] emphasized the impact of nozzle diameter and vortices on pump performance through CFD sensitivity analysis, offering new guidance for pump design optimization. Chen et al. [29] used a CFD-based optimization loop and an enhanced Sparrow Search Algorithm (LTC-SSA) to improve the nozzle structure, leading to significant performance gains. Liu et al. [30] used BP neural network and numerical simulation methods to improve the efficiency of a new jet pump by 9.45% by optimizing the nozzle distance and pipe diameter. Abdelsalam et al. [31] added drag-reducing polymer (DRP) to the ejector fluid to reduce the resistance within the jet pump and increased the liquid jet pump efficiency from 13.8% to 26.7%. Yang et al. [32] analyzed the results of numerical simulation and orthogonal tests and found that the nozzle diameter, throat diameter and jet pump performance are correlated. The optimal combination identified for the ejector’s structural parameters in this study is a nozzle outlet diameter of 8.2 mm and a throat diameter of 18 mm. Wang et al. [33] optimized the structure of the jet pump parameters through numerical simulation and Taguchi orthogonal experimental method, and found that when the flow ratio is 0.3156, the throat-nozzle distance is 2.62 mm, the throat length is 46 mm, the throat diameter is 6.8 mm, and the diffusion angle is 7.5°, the new jet pump has the highest efficiency (31.26%). Compared with before optimization, the efficiency is significantly improved by about 10%.
In summary, the research findings discussed above provide a solid theoretical foundation and practical guidance for optimizing the efficiency of jet pumps, particularly through the optimization of structural parameters. This has led to significant advancements in improving jet pump performance. However, most studies have focused on optimizing parameters such as nozzle outlet shape, jet pump area ratio, nozzle-to-throat distance, throat length-to-diameter ratio, and diffuser angle to enhance pump efficiency. Despite these efforts, inconsistencies in experimental conditions and numerical simulations across different studies have resulted in uncertainties regarding the optimal structural parameters (e.g., nozzle outlet shape, jet pump area ratio, nozzle-throat distance, etc.), and no clear optimization ranges (e.g., optimal range of area ratio, nozzle-throat distance, etc.) have been established. This lack of standardization complicates the task of improving jet pump efficiency in practical applications. This paper focuses on the working medium of the jet pump, introducing different volumetric fractions of water into the pneumatic jet pump’s working medium. The Eulerian model is primarily used to simulate gas-solid particle flow, while the Mixture model is mainly employed to simulate multiphase flow with different velocities for each phase. However, the Mixture model has limitations in accurately capturing interfacial characteristics and addressing diffusion phenomena. Applications of the VOF model include stratified flows, free surface flows, filling, sloshing, the motion of large bubbles in liquids, the motion of liquids after a dam break, prediction of jet breakup, and steady or transient tracking of any liquid-gas interface. Using the VOF-CFD numerical simulation method, the fluid jet process of the jet pump is simulated under various dimensionless mass flow ratios and varying volumetric fractions of water. The pump efficiency is calculated using the jet pump pressure ratio and efficiency formula, and key flow field parameters inside the jet pump are analyzed. The aim of this study is to determine whether incorporating different volumetric fractions of water into the working gas improves pump efficiency.
2. Numerical Simulation
2.1. Jet Pump Parameters
The performance of a jet pump is typically assessed by its efficiency. Jet pumps with varying structural parameters exhibit different operating characteristics, which makes the calculation of pump efficiency non-standardized. As a result, non-dimensional parameters are commonly employed to describe the performance of jet pumps when analyzing their operating characteristics [34].
In the formula, E represents the jet pump efficiency; M is the dimensionless flow rate ratio; H is the dimensionless pressure ratio; q3 is the volume flow rate of the injected fluid, m3/d; q1 is the volume flow rate of the driving fluid, m3/d; P1 is the nozzle inlet pressure, Pa; P2 is the diffuser outlet pressure, Pa; P3 is the suction inlet pressure, Pa.
2.2. Modeling and Meshing
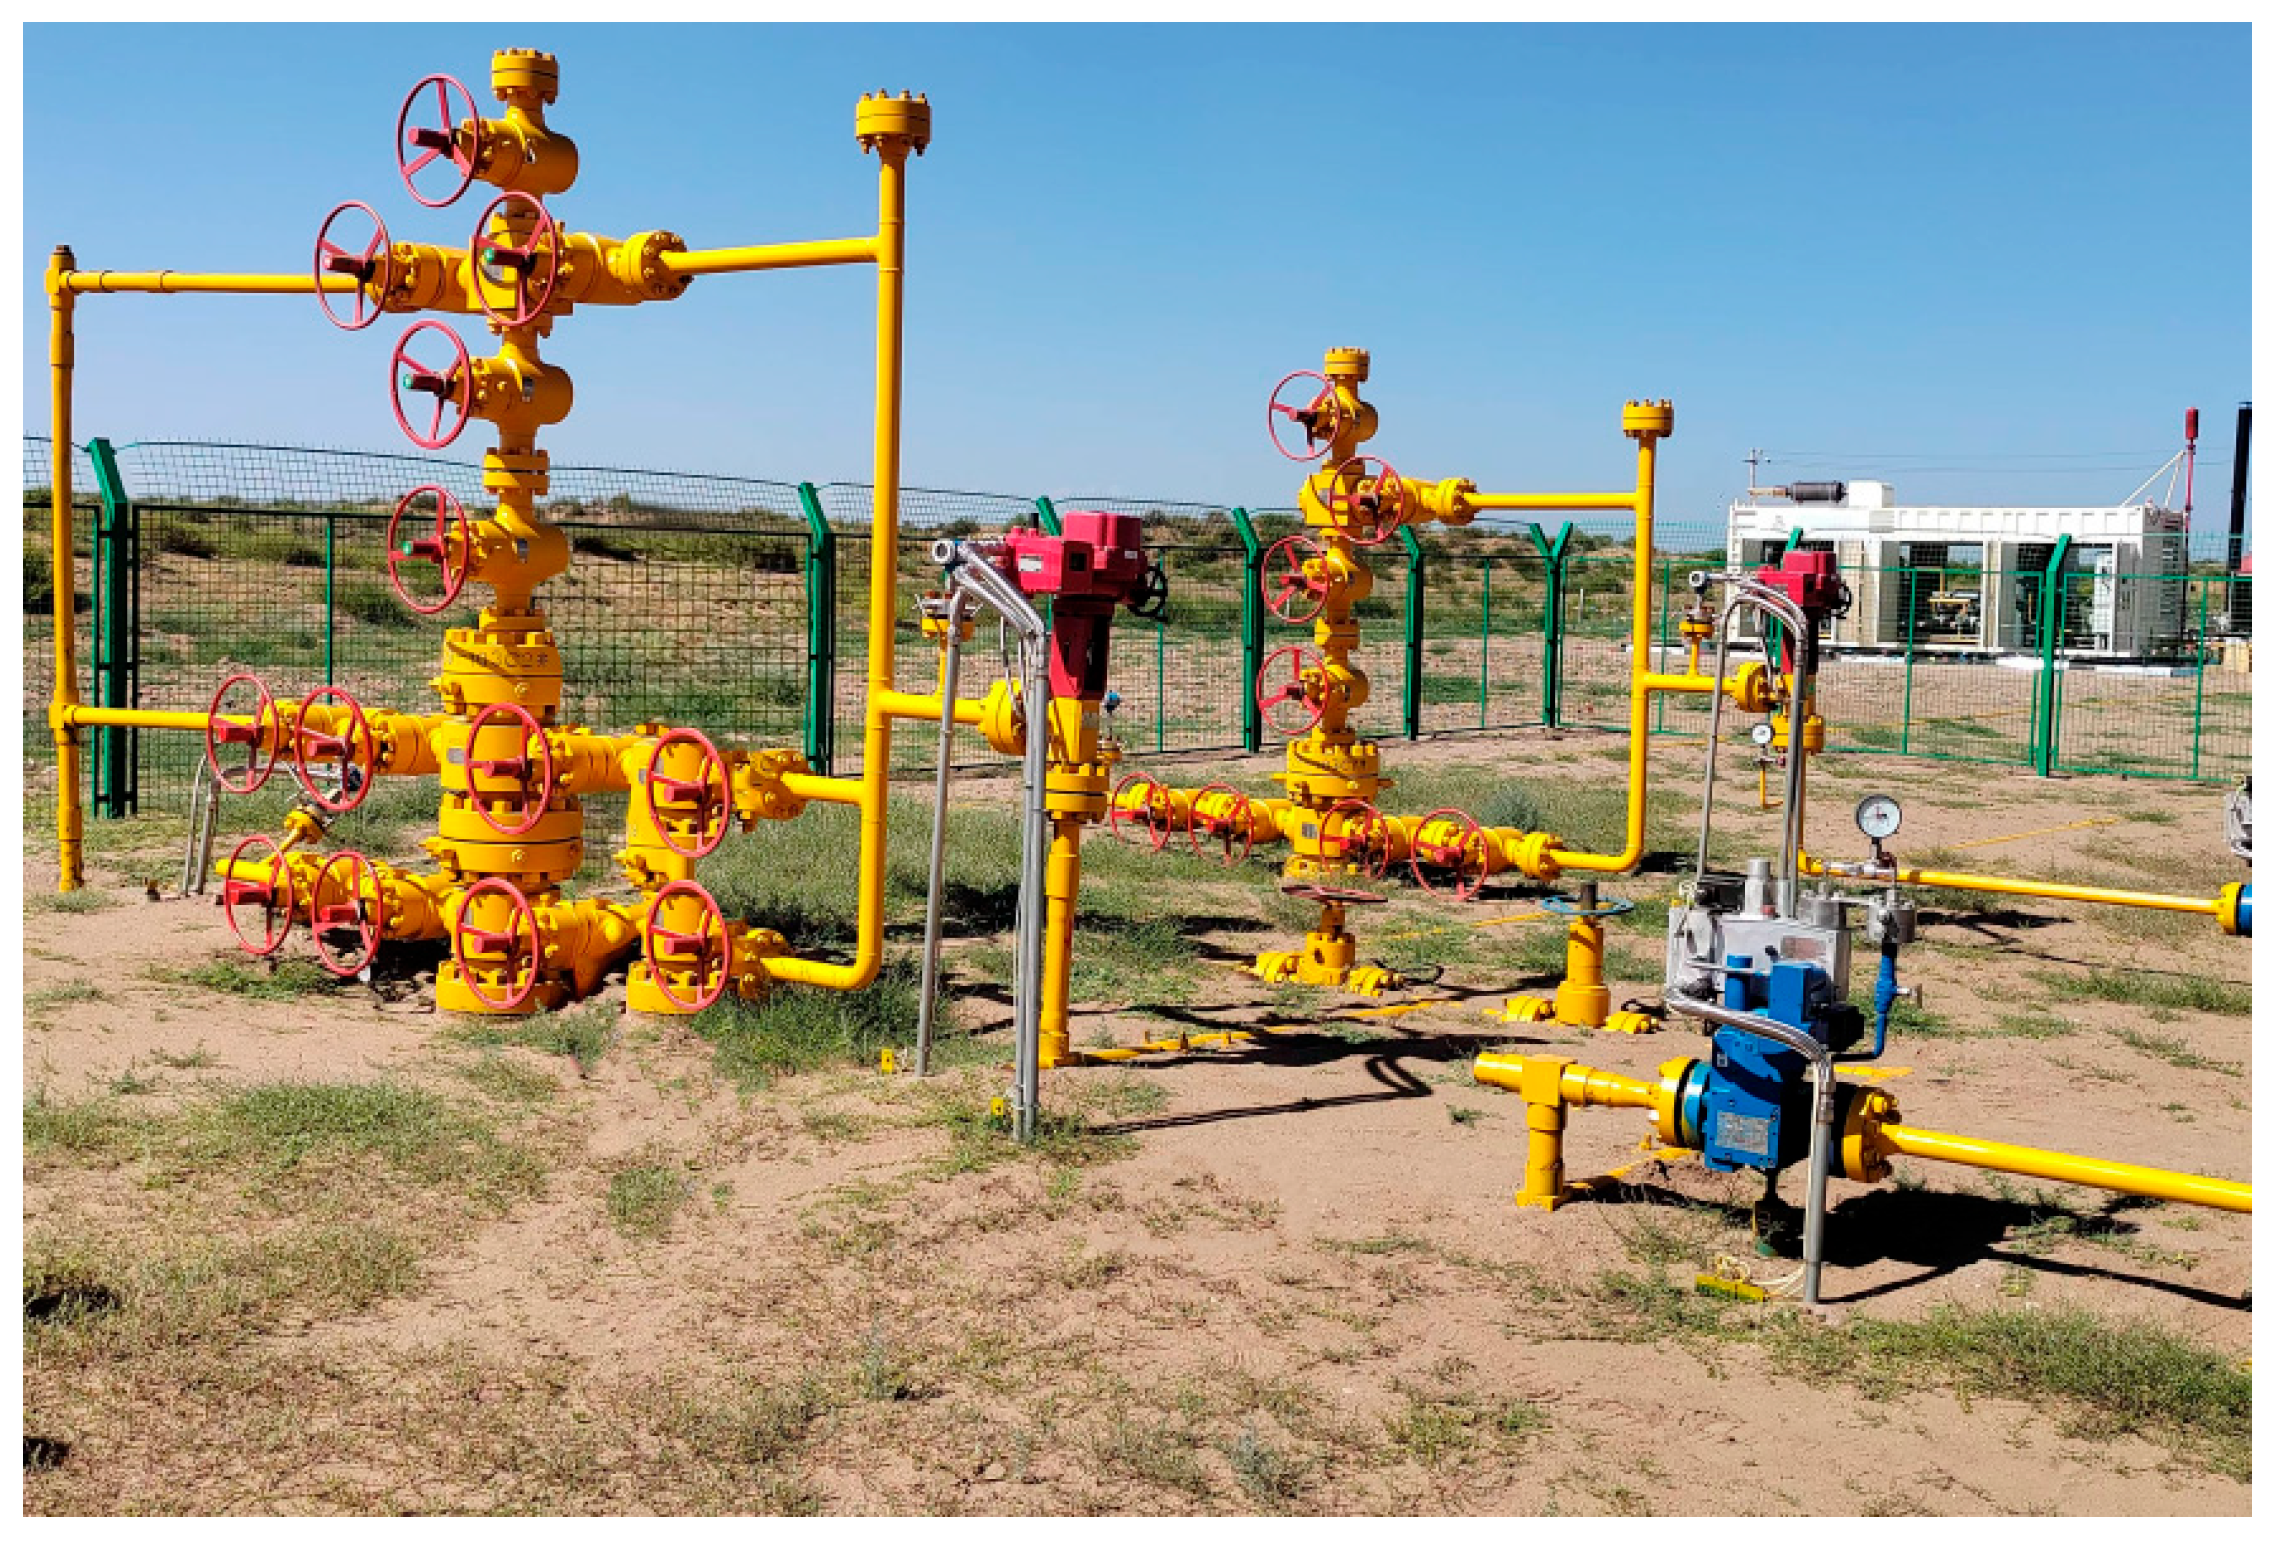
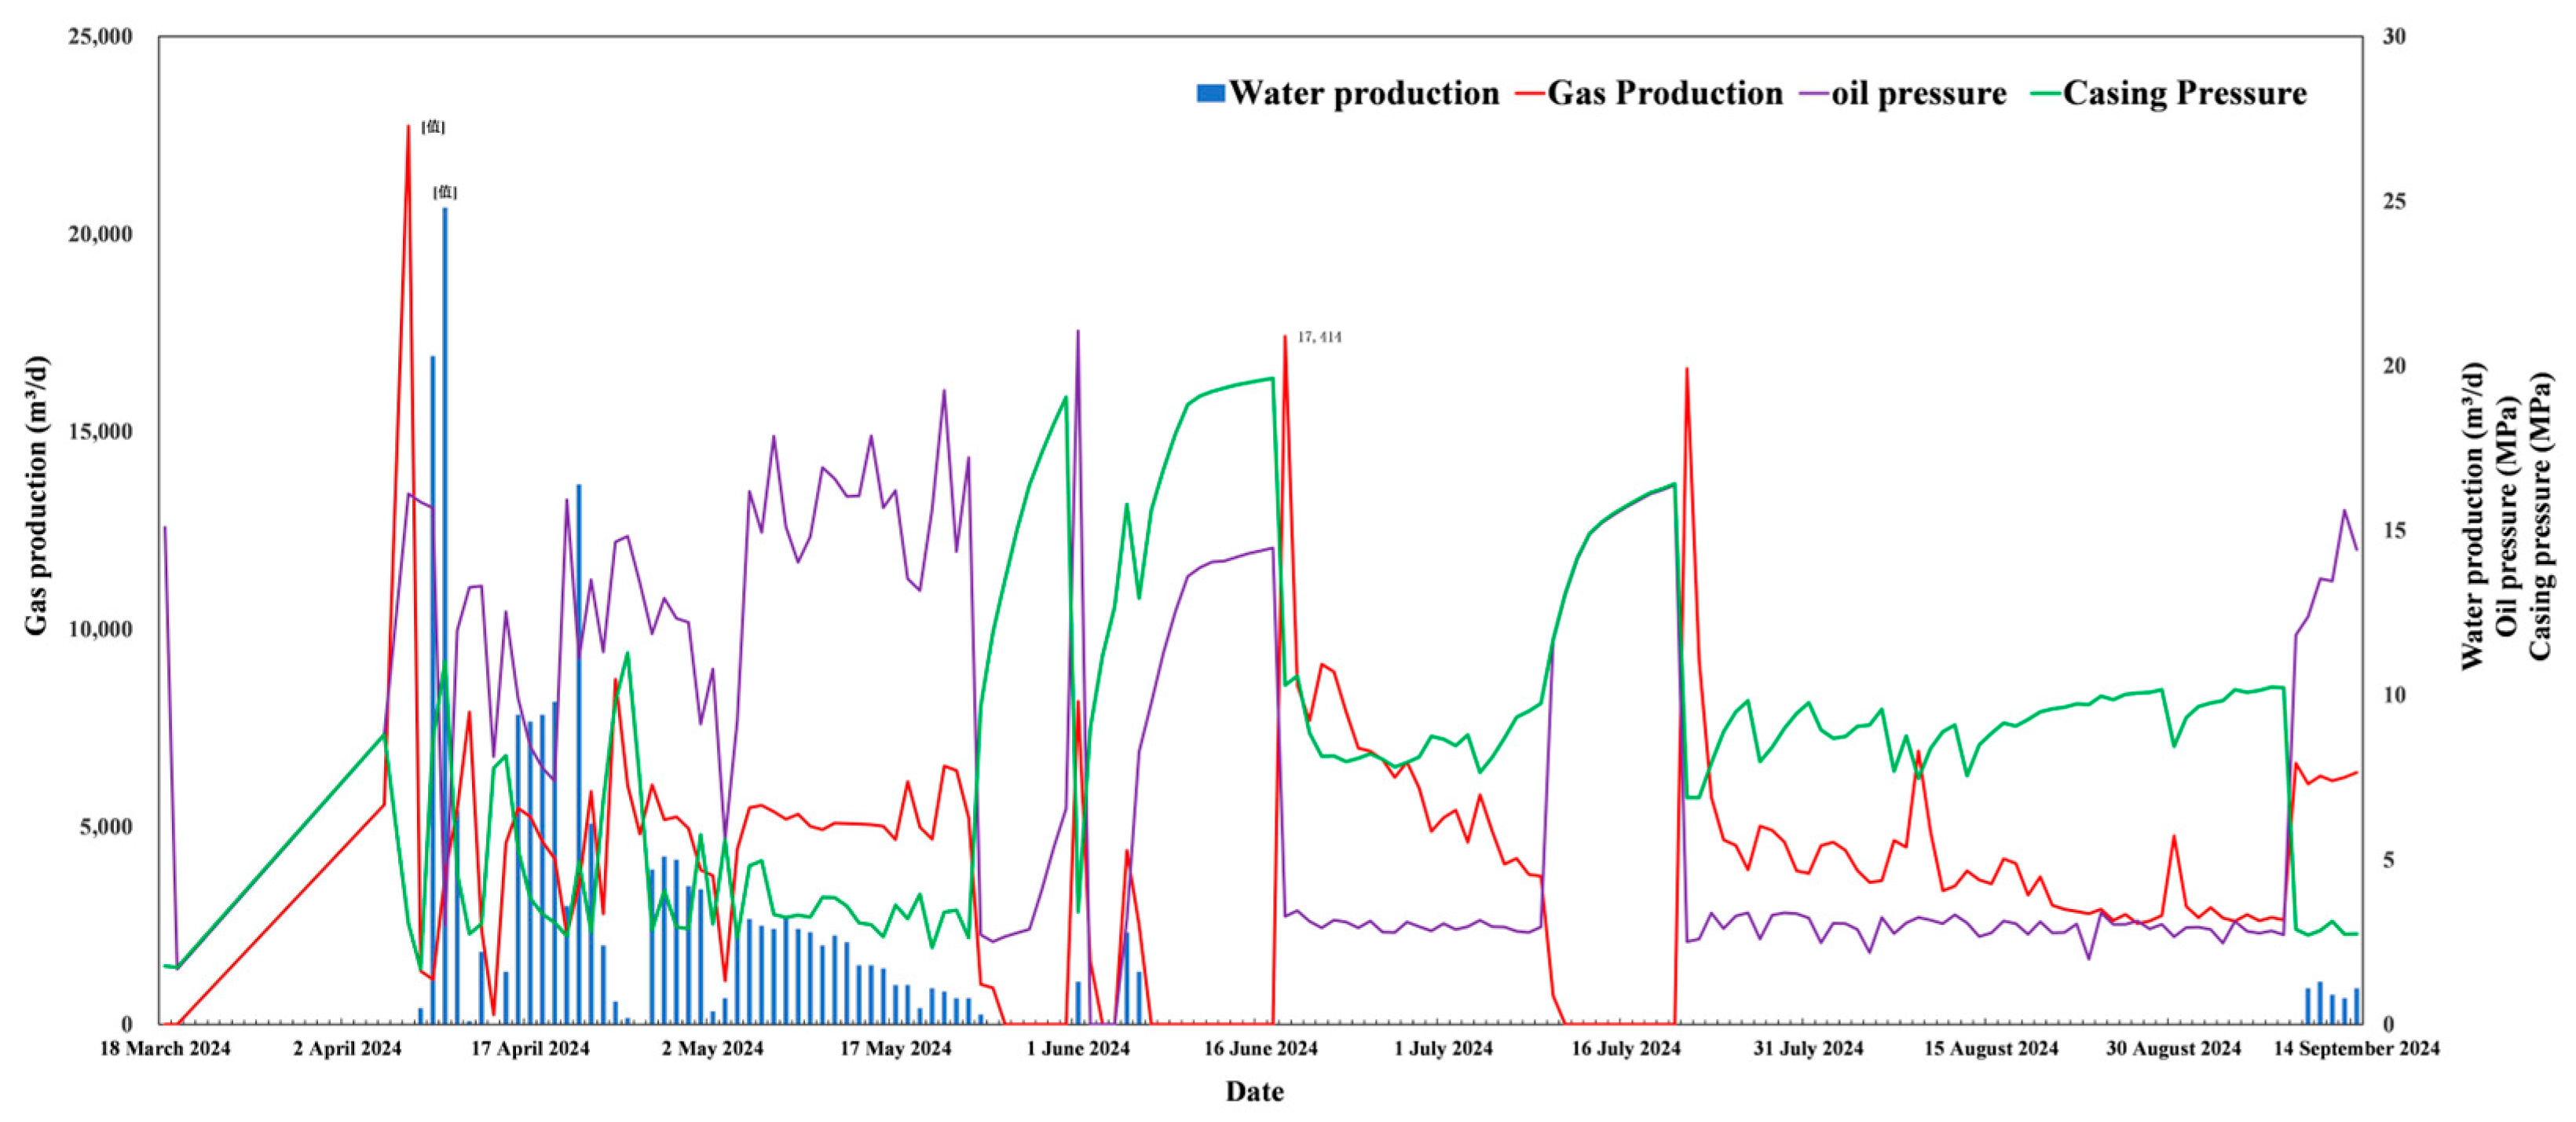
Figure 1 shows the Sulige gas field, while Figure 2 presents the pneumatic jet pump used in the pneumatic jet flow test well of the Sulige Gas Field. This study primarily focuses on the movement of the fluid within the internal flow field of the jet pump. The three-dimensional fluid domain model is extracted based on the structural dimensions of the pneumatic jet pump used in the gas field, as shown in Figure 3. The detailed structural parameters of the jet pump are provided in Table 1. Table 2 displays the production data before and after the use of the gas well pneumatic jet pump, while Figure 4 presents the corresponding production data curve.
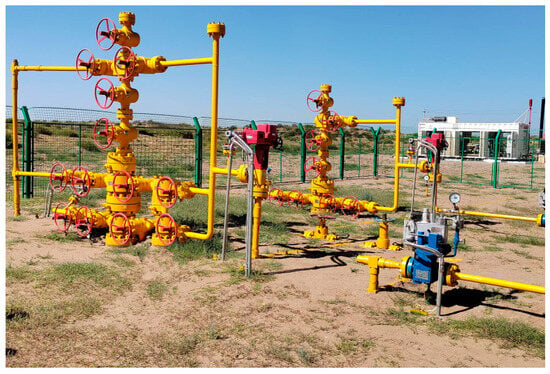
Figure 1.
Sulige Gas Field Jet Drainage Test Area.

Figure 2.
Pneumatic jet pump.

Figure 3.
Fluid domain model of jet pump.

Table 1.
Structural parameters of jet pump model.

Table 2.
Production data.
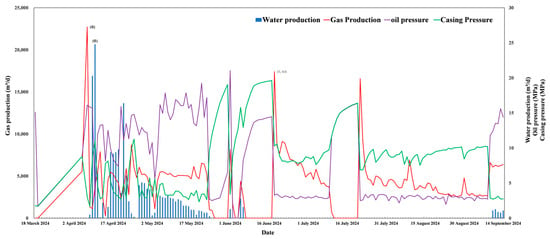
Figure 4.
Production data curve.
Due to the complex fluid flow within the internal flow field of the jet pump, accurately describing the fluid region using only structured or unstructured meshes is challenging. The Poly-Hexcore body-fitted mesh generation method, based on Mosaic grid technology, facilitates the connection of hexahedral and polyhedral meshes at shared nodes. This method supports boundary layer mesh division, enabling the use of layered Poly meshes for wall-adjacent layers, pure Poly meshes for the transition region, and hexahedral meshes for the core region, thereby enhancing the overall mesh quality. It also effectively reduces the total number of cells and solving time. As a result, Mosaic meshes are employed to discretize the fluid regions between the plunger and the pipe wall, as well as other sections of the tubing. Figure 5 illustrates the mesh division of the fluid domain.

Figure 5.
Mesh division.
2.3. Mesh Independence Verification
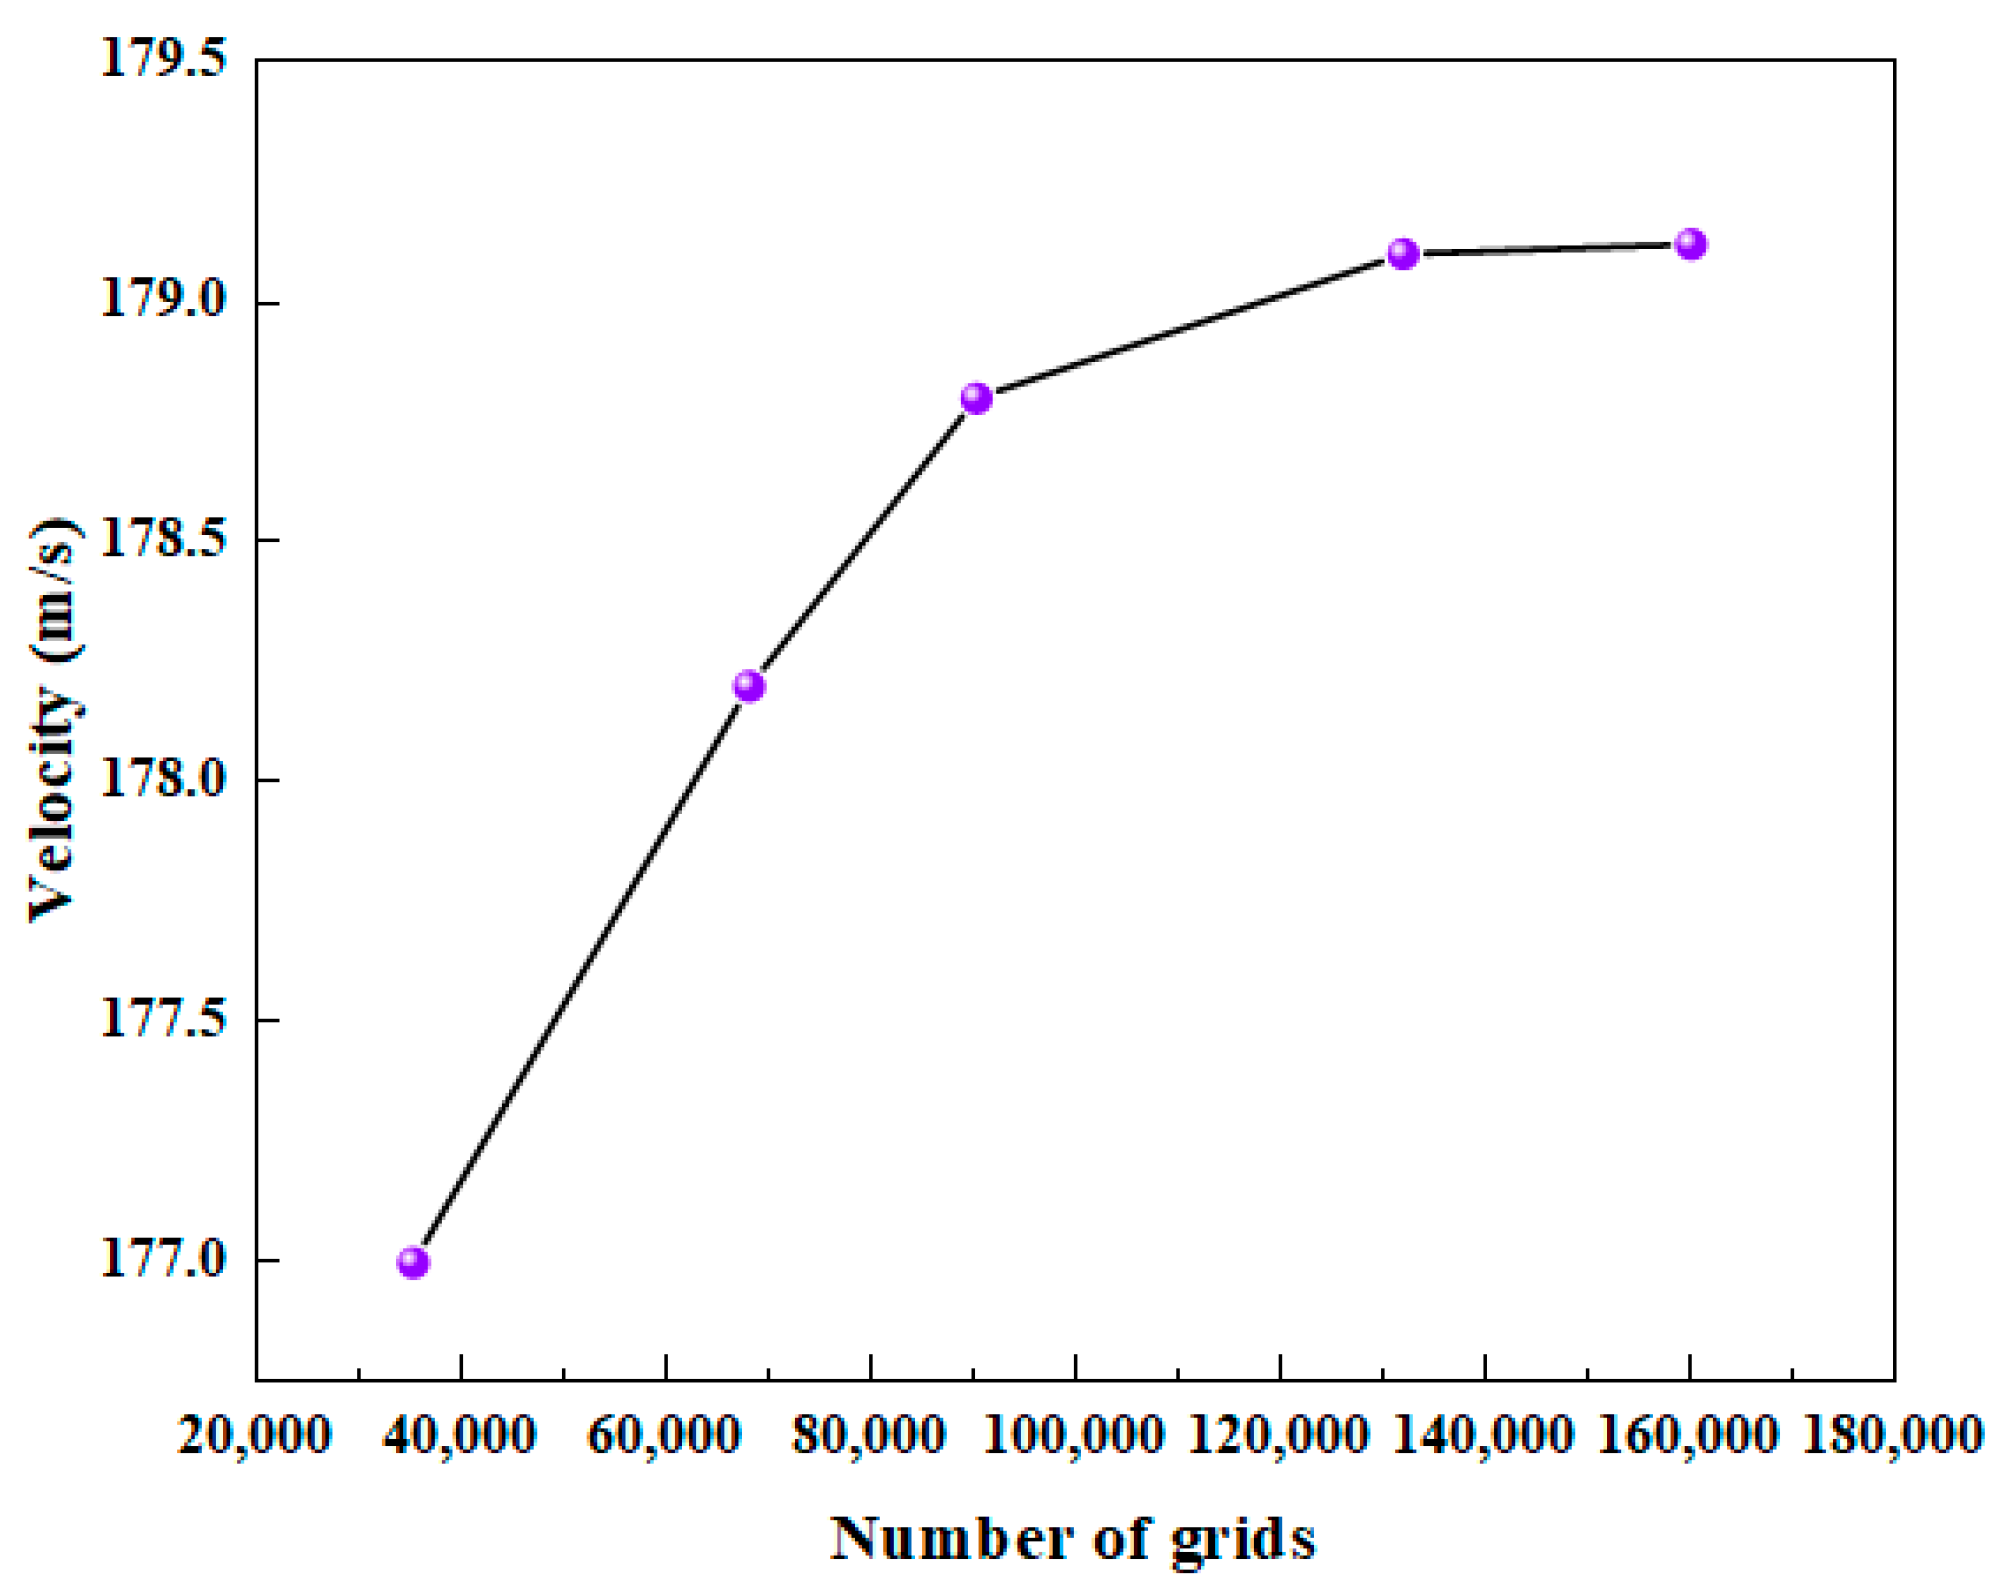
During the CFD numerical simulation process, mesh independence verification was conducted to ensure the accuracy of the simulation results while minimizing iteration computation time. Numerical simulations were performed for five models with mesh sizes of 35,358, 68,143, 90,330, 131,982, and 160,108 elements, respectively, for the internal fluid domain of the jet pump. Under the same convergence conditions, the fluid velocity at the nozzle outlet space coordinate (34, 0, 0) was extracted for lateral comparison. The simulation results are shown in Figure 6. As depicted in Figure 6, when the number of grids is 131,982, the nozzle outlet flow rate is 179.1 m/s. As the number of grids continues to increase, the nozzle outlet flow rate basically tends to remain unchanged at 179.1 m/s. Considering the computational cost, it can be concluded that with a mesh size of 131,982 elements, the model meets the mesh independence requirement.
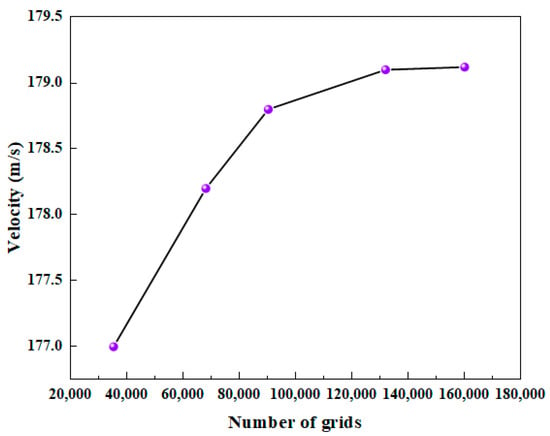
Figure 6.
Verification of mesh independence of fluid flow velocity at jet pump nozzle outlet.
2.4. Governing Equations and Turbulence Models
The fluid movement around the plunger is governed by the continuity equation, the momentum conservation equation, and the energy equation. Since this study primarily examines the sealing characteristics of the plunger, it assumes no heat transfer during the flow process, allowing the energy equation to be omitted. The continuity equation is expressed as follows:
In the equation, ρ represents the fluid density, kg/m3; t denotes time, s; and ux, uy, uz are the velocity components of the fluid element in the x, y and z axes, m/s, respectively.
The momentum equation [35] (Batchelor, 1967):
The momentum conservation equation is also known as the Navier-Stokes equation. In the equation, P0 represents the static pressure, Pa, and τij (where i, j take the values x, y and z) represents the stress tensor, Pa, which accounts for the viscous stresses within the fluid. The term fk, where the components fx, fy, fz represent the volumetric forces due to gravity, is included to model the influence of gravitational forces on the fluid, N/m3.
The Volume of Fluid (VOF) model, which tracks the interface between phases in multiphase flows, operates by solving the volume fraction of each phase. This approach was initially developed by Hirt et al. [36] (1981) and has been further discussed by researchers such as Yokoi et al. (2007) [37]. The model equation for the mth phase in a multiphase system is given by:
In the equation, ρm represents the density of mth phase, vm represents the velocity of phase m, αm is the volume fraction of mth phase, which indicates the proportion of the computational cell occupied by the phase.
αm = 0: The mth phase fluid is empty in the cell.
αm = 1: The mth phase fluid is full in the cell.
0 < αm < 1: The cell contains the interface between the mth phase and other phases.
The volume fraction of the main phase is calculated by the following formula:
The momentum equation depends on the volume fractions of all phases:
In the equation, Fvol represents the body force, and g is the acceleration due to gravity.
The Realizable k-ε model includes a swirl correction, which provides accurate simulation results for rotational flows, flow separations, flat plate and cylindrical jets, and complex secondary flows (Launder et al., 1972) [38]. The Realizable k-ε equation:
In the equation, ,,,.
In the equation, Sij represents the mean strain rate, s−1; S is the magnitude of the mean strain rate tensor.
The computational model is the VOF model, and the turbulence model is the Realizable k-ε model. The inlet boundary condition is specified as a velocity inlet, and the outlet boundary condition is specified as a pressure outlet, with the pressure set to atmospheric pressure. The fluid medium consists of two phases: air and water. Specific working conditions are shown in Table 3. The fluid physical parameters of numerical simulation are shown in Table 4.

Table 3.
Working conditions in numerical simulation.

Table 4.
Physical properties parameters of fluid for numerical simulation.
2.5. Accurate Validation of the Simulation Results
To verify the accuracy of the simulation results, the simulated pressure values of the power medium inlet, a suction liquid inlet and a discharge port were extracted, and then the simulation results were compared with the theoretical calculation data one by one [39]. As can be seen from Table 5, the numerical relative error between the simulated pressure value of the power fluid inlet and the theoretical pressure value is only 2.1%. The simulated pressure value of the suction liquid inlet is also very close to the theoretical pressure value, with an average relative error of only 4.3%. the numerical relative error between the simulated pressure value of the mixture fluid outlet and the theoretical pressure value is 6.7%. The relative errors are all less than 10%, which not only shows the correctness of the numerical simulation, but also further proves the accuracy of the simulation results.

Table 5.
Accurate validation of the simulation results.
3. Results and Discussion
3.1. Flow Field Analysis of the Jet Pump
3.1.1. Phase Distribution
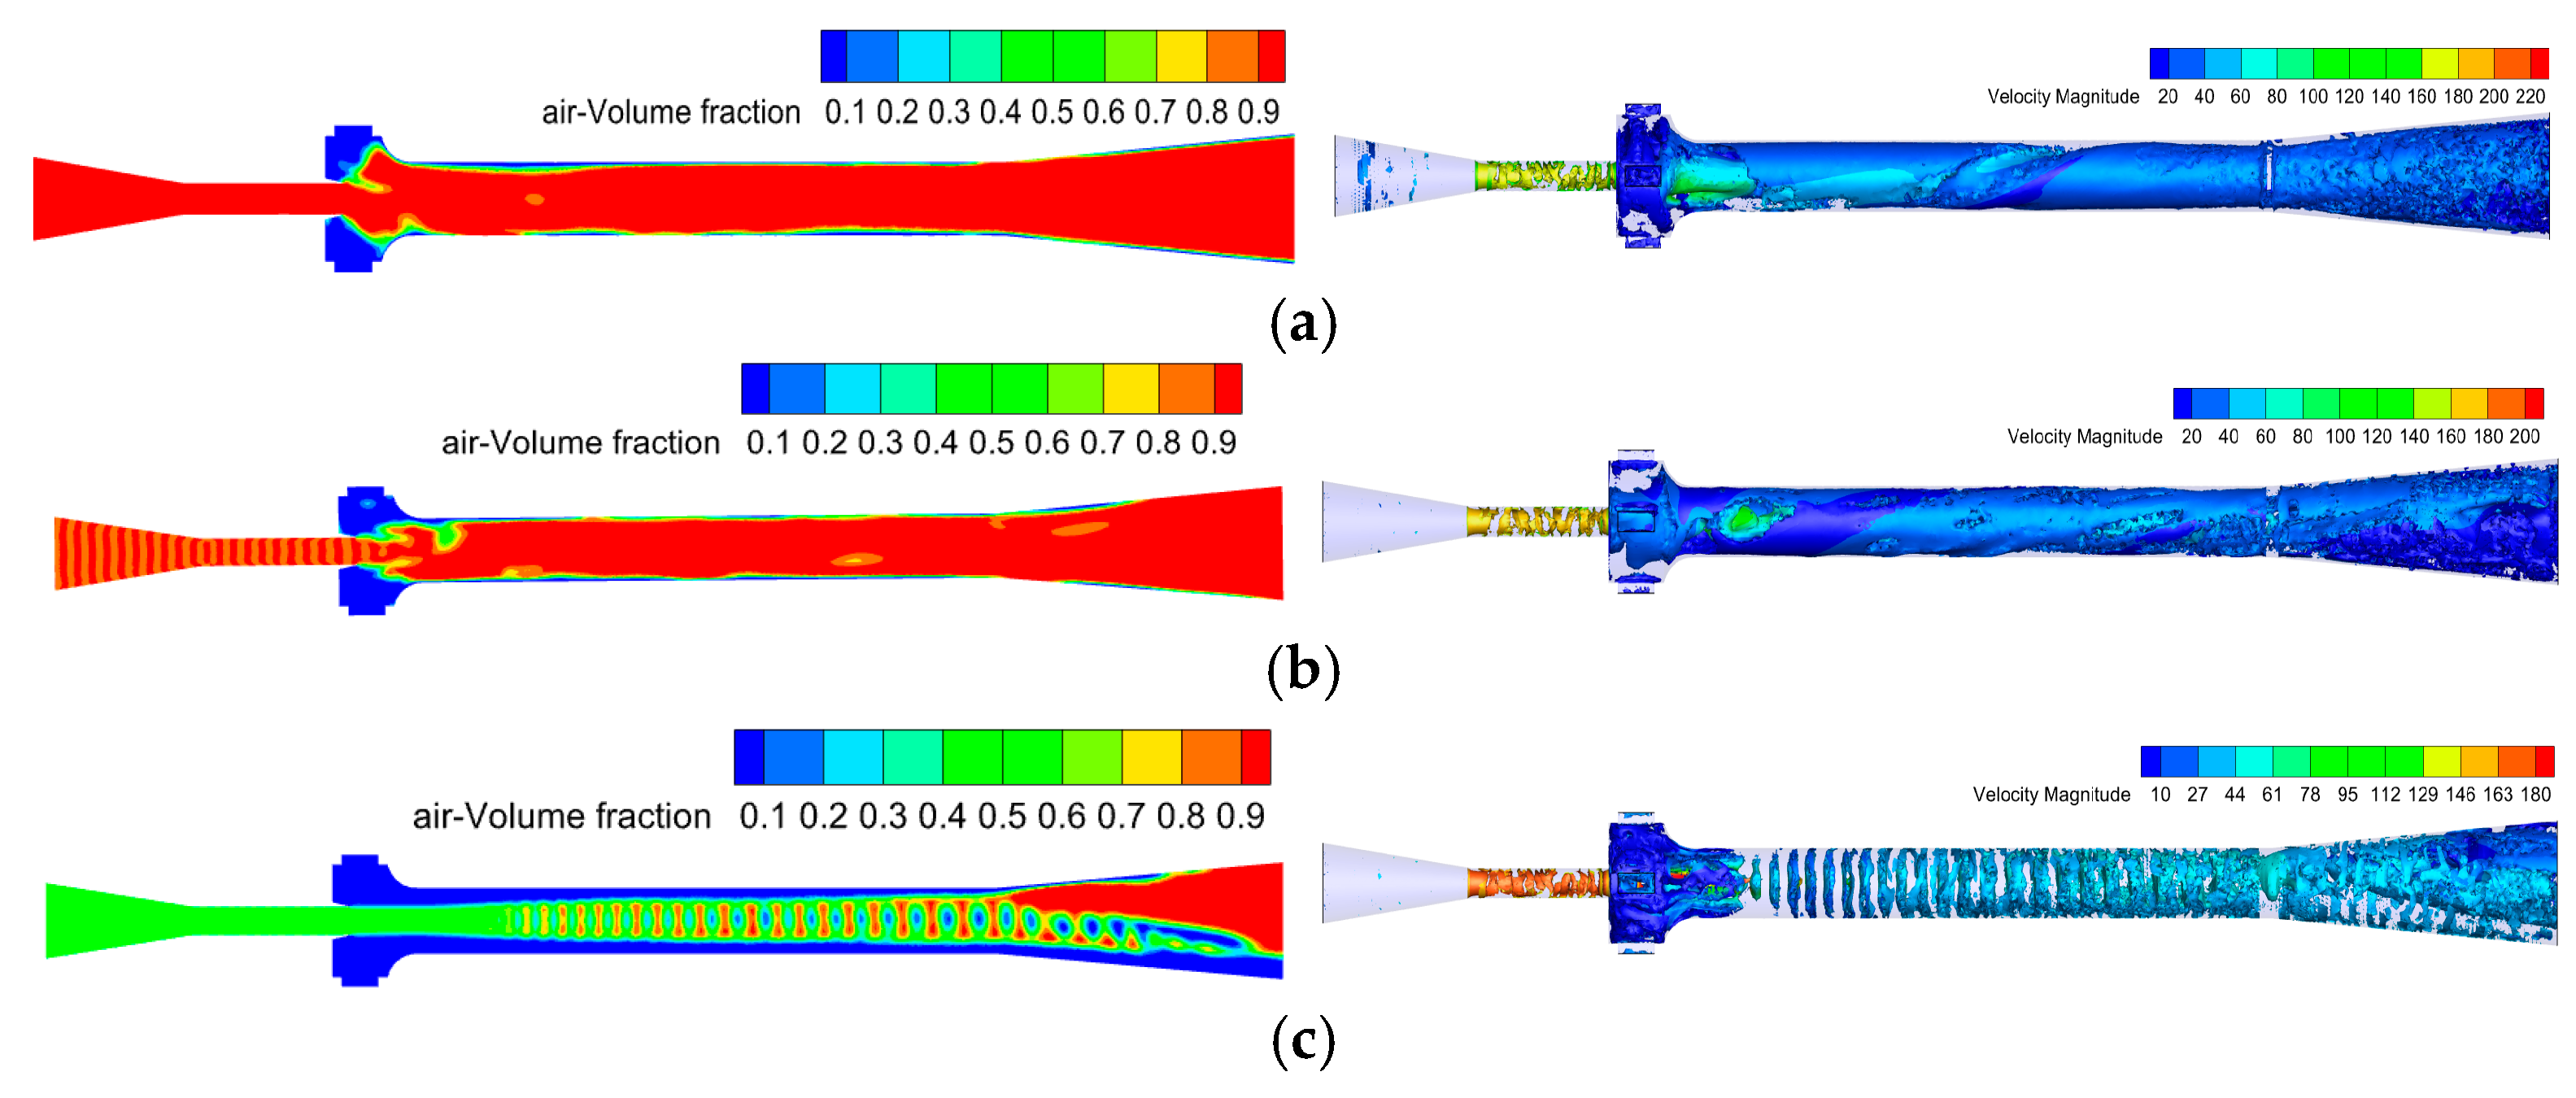
In Figure 7, as the volumetric fraction of water in the power medium increases, the medium transitions from a continuous gas phase to a dispersed phase, forming a gas-liquid mixture. As shown in Figure 7b, when the volumetric fraction of water is low (0.1), the gas phase is primarily concentrated in the central part of the mixing and diffusion sections, as indicated by the red areas with a high gas phase volume fraction. The gas-liquid mixture is well defined, with the mixing region evenly distributed, and the gas diffuses rapidly into the diffusion section. As the volumetric fraction of water increases to 0.5 in Figure 7c, the gas-liquid mixing region inside the jet pump becomes more pronounced, particularly within the mixing section, where a strong periodic bubble structure forms, represented by alternating red and green regions. This distribution suggests more thorough mixing, although some areas show a decrease in gas concentration. As the volumetric fraction of water further increases to 0.8 in Figure 7d, significant changes in the gas-liquid mixing structure inside the jet pump become evident. At this point, the gas phase distribution area shrinks, with the maximum gas volume fraction only reaching 0.5 (as shown in the legend). The bubbles in the mixing section exhibit a regular periodic distribution, with limited gas diffusion and reduced mixing intensity. The volumetric fraction of water thus plays a significant role in the distribution and mixing of gas-liquid phases inside the jet pump.
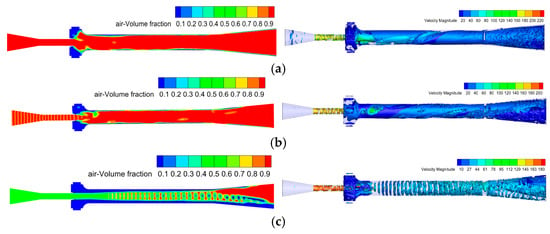

Figure 7.
Phase distribution of water content at different volume fractions in the power medium. The left column is the phase distribution, and the right column is the gas content isosurface. (a) The volume fraction of water in the power medium is 0; (b) The volume fraction of water in the power medium is 0.1; (c) The volume fraction of water in the power medium is 0.5; (d) The volume fraction of water in the power medium is 0.8; (e) The volume fraction of water in the power medium is 1.0.
3.1.2. Velocity Distribution
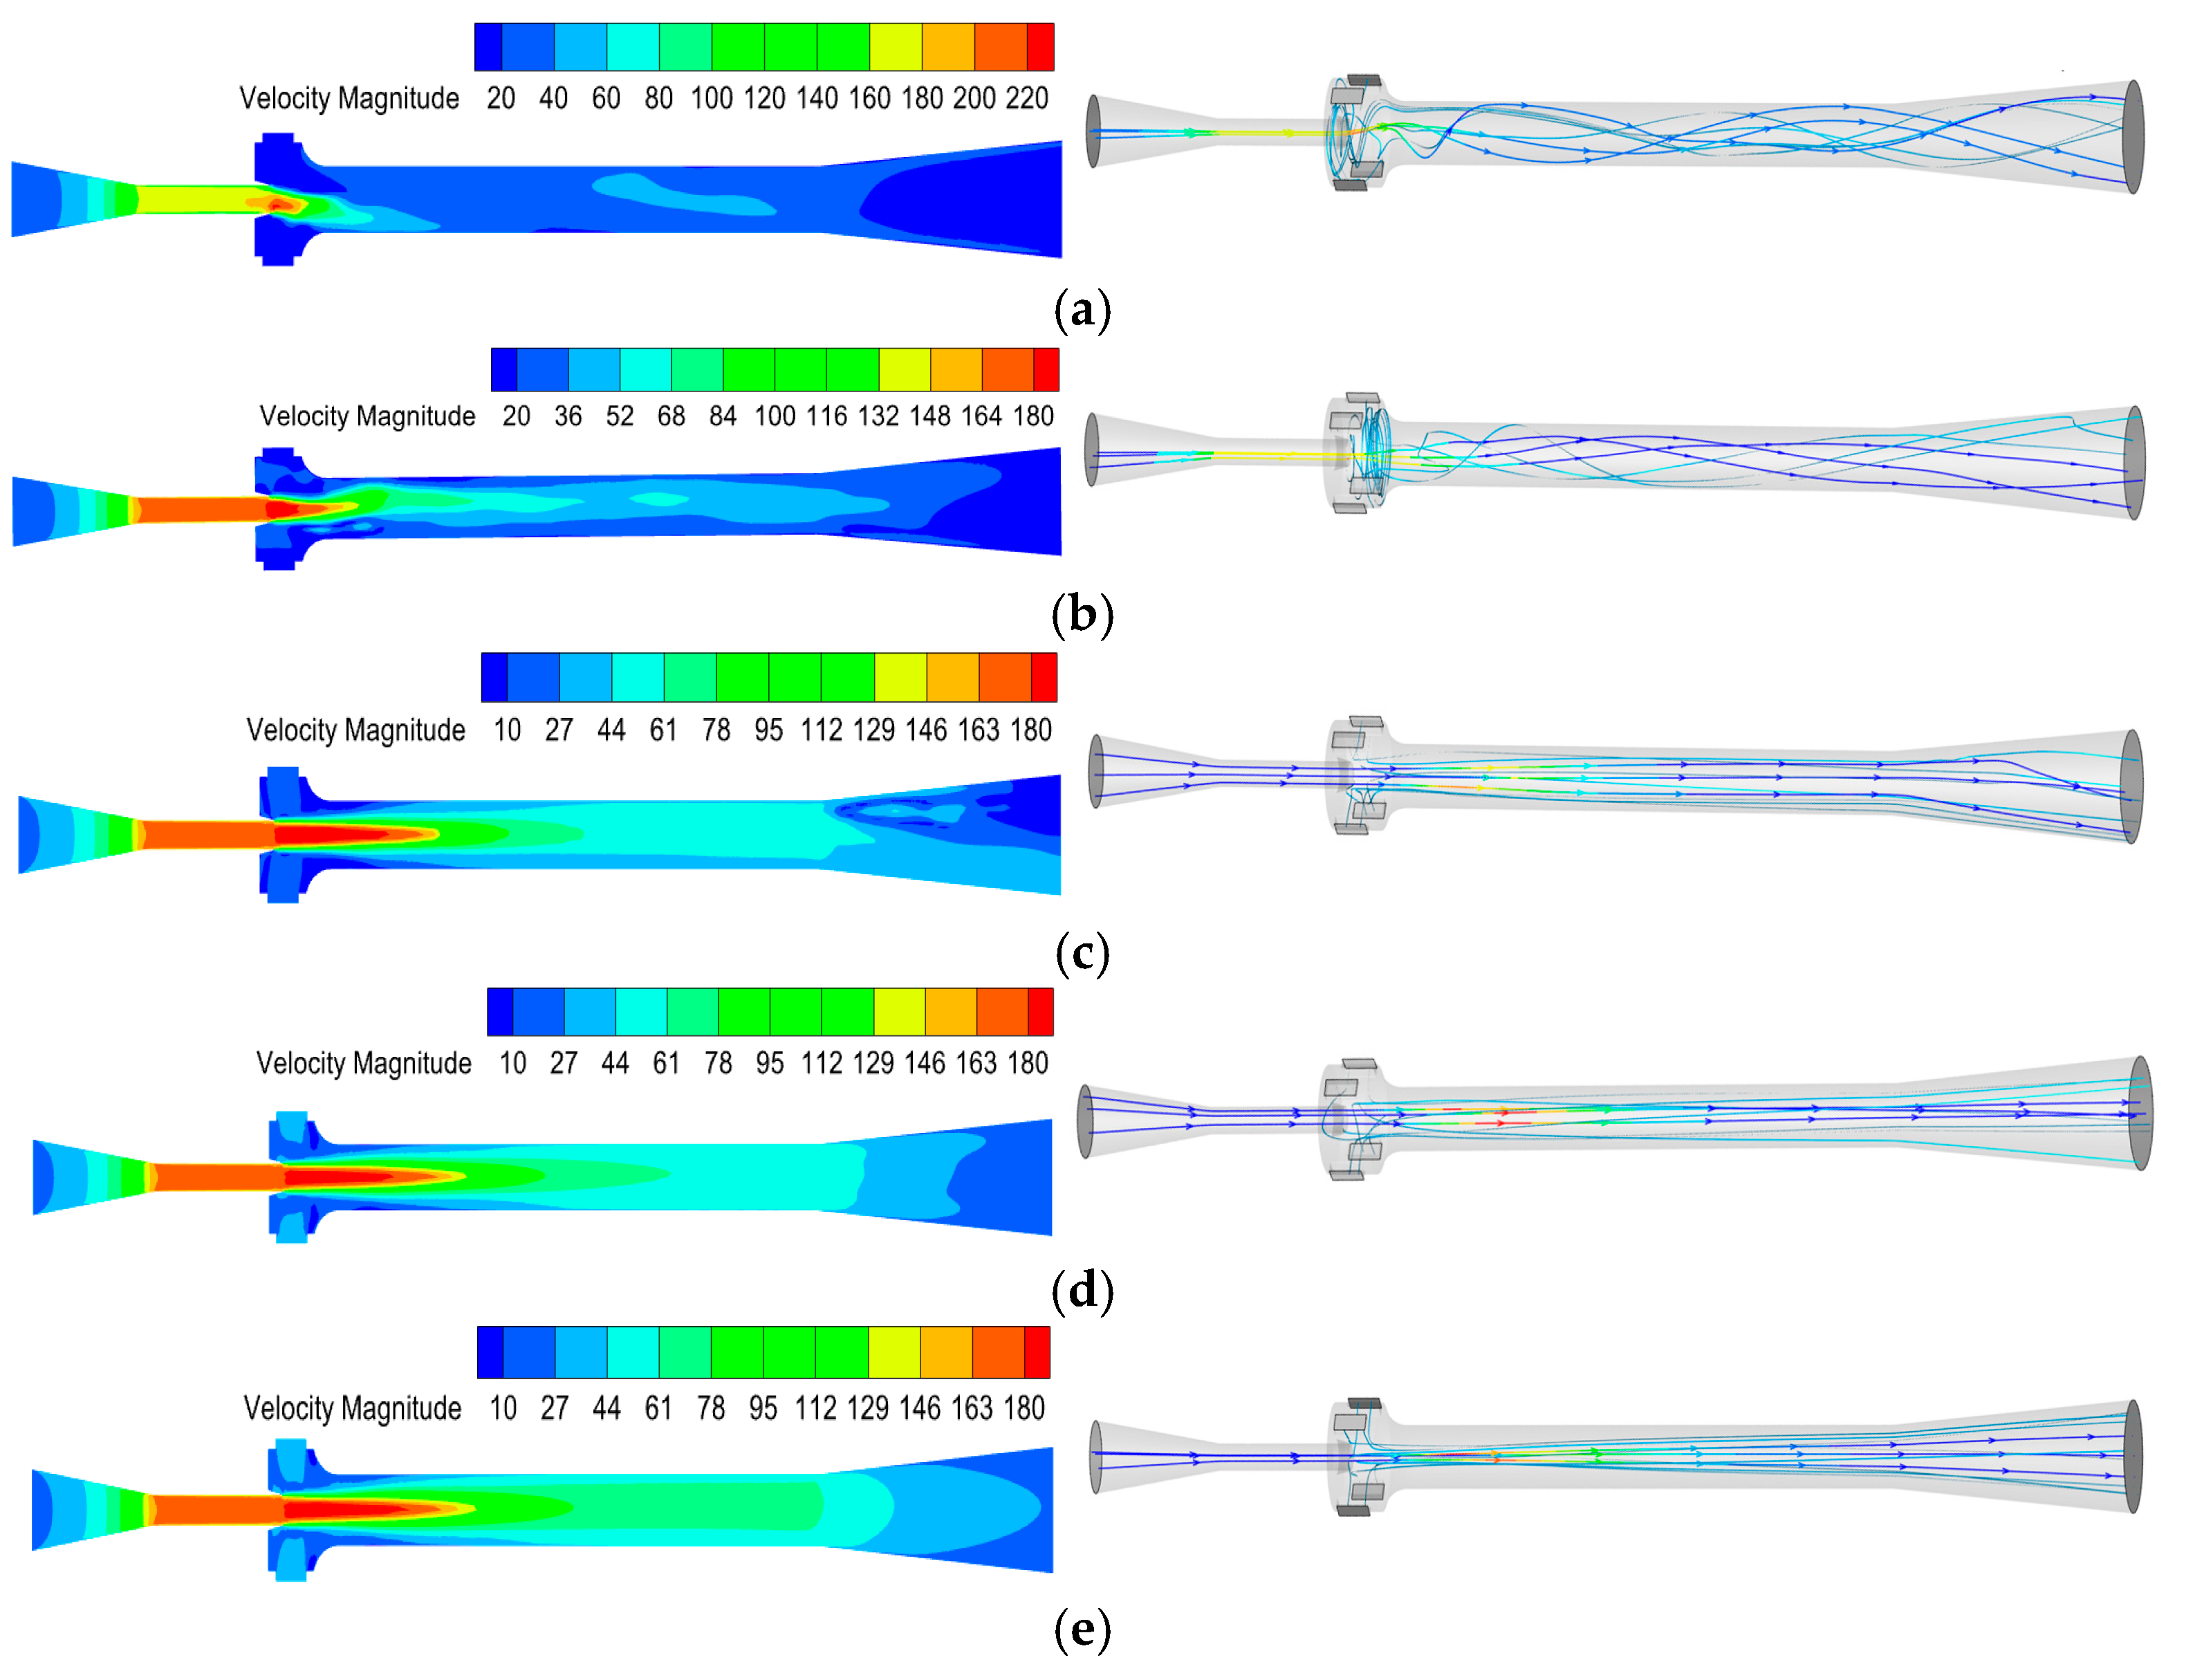
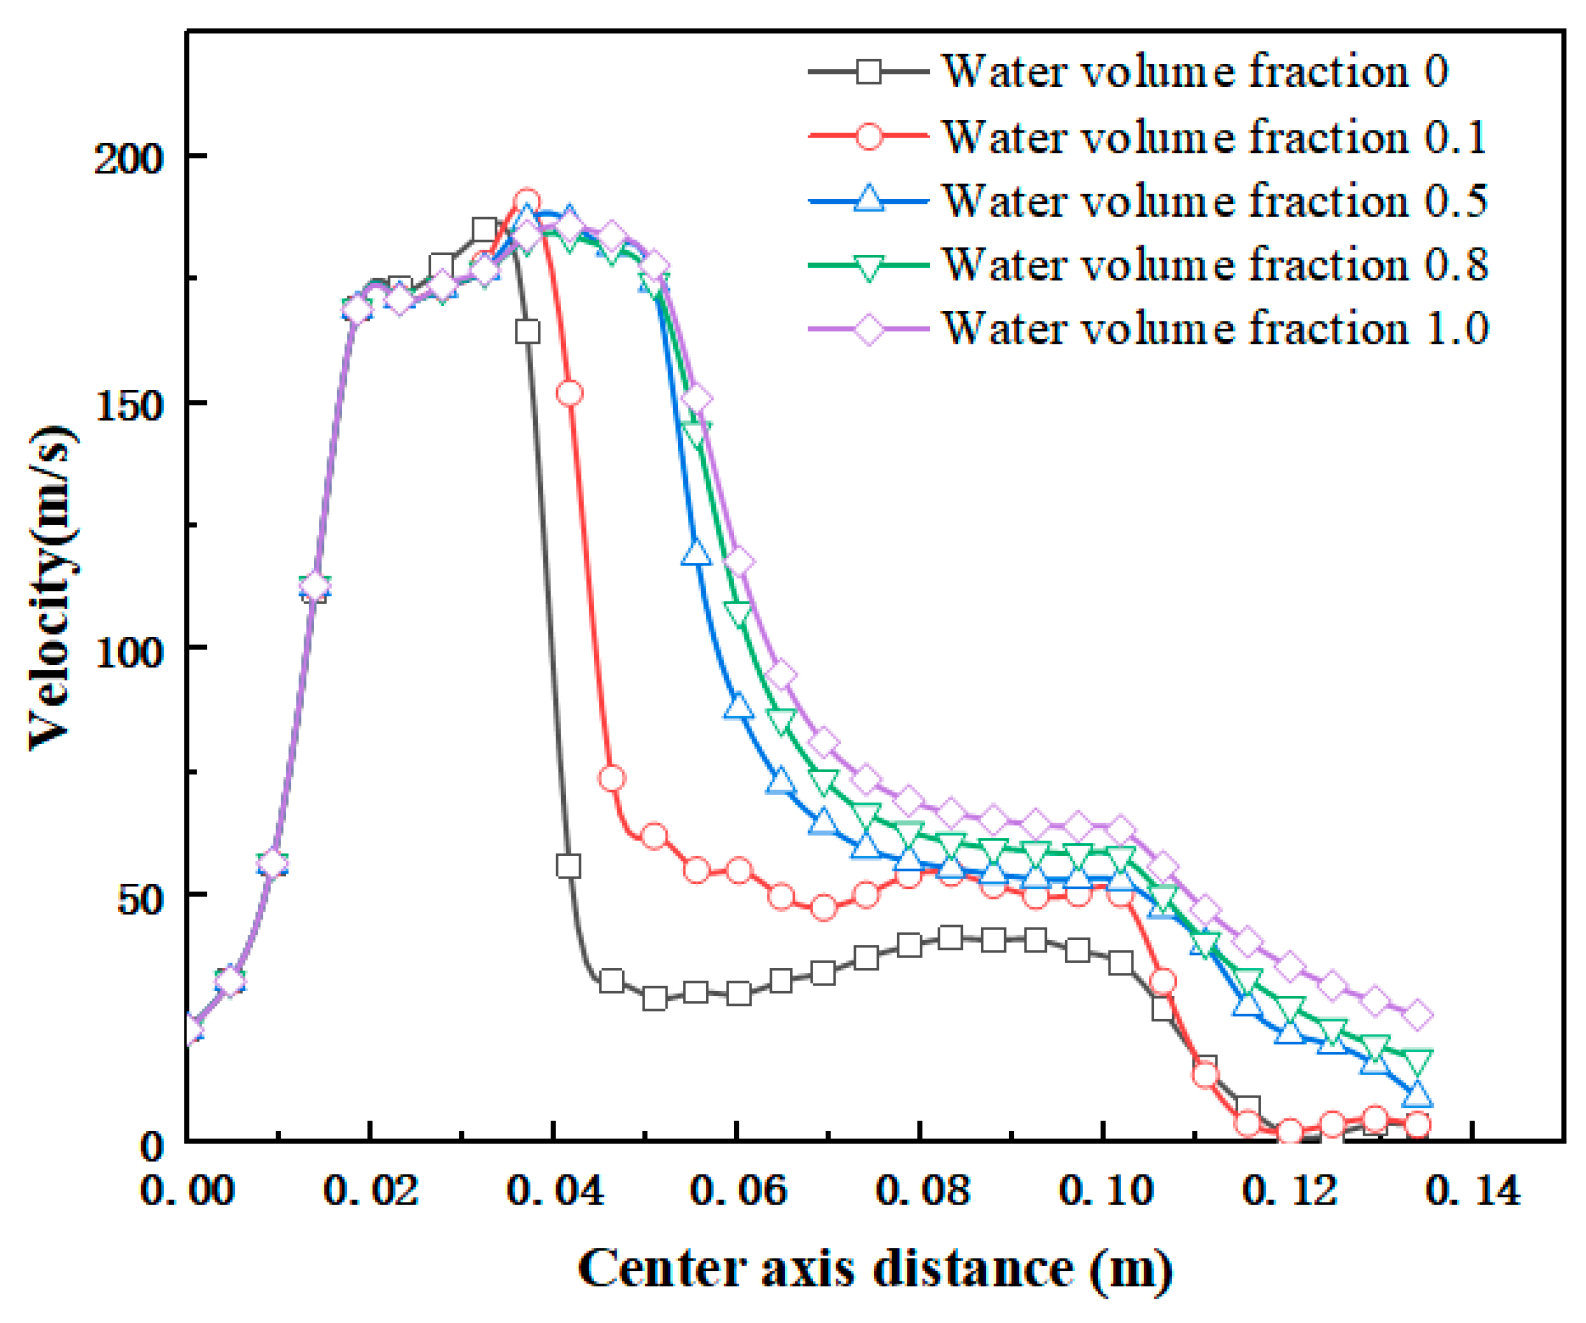
In Figure 8, as the volumetric fraction of water in the power medium increases, the density of the medium also increases, leading to a rise in flow velocity. When the volumetric fraction of water is 0.1 in Figure 8b, the velocity distribution inside the jet pump shows that the highest velocity occurs at the nozzle outlet, with the fluid being ejected at high speed. Upon entering the mixing section, the velocity gradually decreases, and it continues to drop in the diffusion section. The overall velocity distribution is relatively uniform, indicating that the high-speed fluid is well mixed with the suction medium. As the volumetric fraction of water increases to 0.5 in Figure 8c, the high-speed region at the nozzle outlet remains stable. However, the velocity distribution in the mixing section exhibits periodic fluctuations, suggesting that the flow of the gas-liquid phases within the mixing section becomes more complex. The velocity in the diffusion section shows a gradient distribution, indicating that part of the kinetic energy is being converted into pressure energy. When the volumetric fraction of water increases further to 0.8 in Figure 8d, the high-speed region inside the jet pump remains concentrated at the nozzle outlet, but the diffusion range of the high-speed fluid expands. The velocity distribution in the mixing section becomes more uniform, suggesting a reduction in turbulence. In the diffusion section, the velocity continues to decrease, and the conversion from kinetic to pressure energy becomes more pronounced. At a volumetric fraction of water equal to 1 in Figure 8e (completely liquid phase), the velocity distribution reveals that the high-speed region at the nozzle outlet is more concentrated, with clearer boundaries. The velocity in the mixing section gradually decreases, and the velocity distribution in the diffusion section presents a smoother gradient decline. With no gas-phase medium present to interfere, the overall flow becomes smoother and more stable. Figure 9 shows the velocity distribution on the central axis of the pneumatic jet pump. When the water volume fraction in the pneumatic jet pump power medium is 0, the nozzle outlet velocity rapidly decreases from approximately 180 m/s to 50 m/s, that is, the natural gas at the nozzle outlet expands rapidly, the pressure energy increases, and the pumping pressure decreases, which also reflects the reason for the low pump efficiency of the pneumatic jet pump. When the water volume fraction in the pneumatic jet pump power medium is 0.1, the phenomenon is similar. When the water volume fraction in the pneumatic jet pump power medium is 0.5, 0.8, and 1.0, the conversion of kinetic energy to pressure energy is relatively stable.
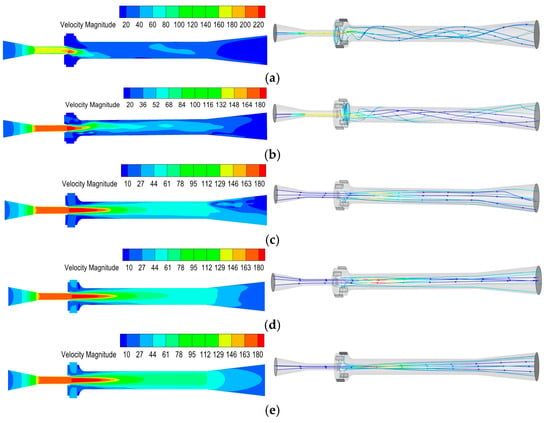
Figure 8.
Velocity distribution of water content at different volume fractions in the power medium. The left column is the velocity distribution, and the right column is the streamline. (a) The volume fraction of water in the power medium is 0; (b) The volume fraction of water in the power medium is 0.1; (c) The volume fraction of water in the power medium is 0.5; (d) The volume fraction of water in the power medium is 0.8; (e) The volume fraction of water in the power medium is 1.0.
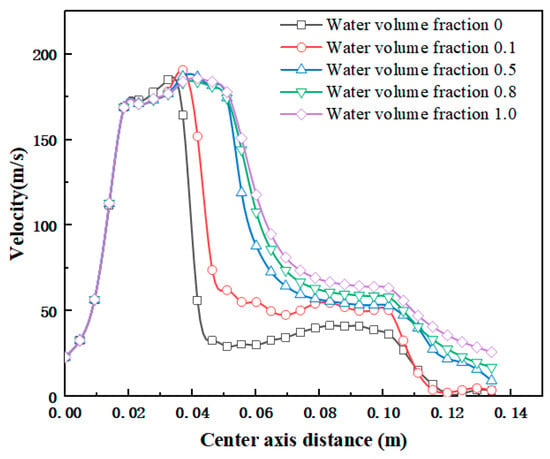
Figure 9.
Velocity distribution of the central axis of the jet pump.
3.1.3. Pressure Distribution
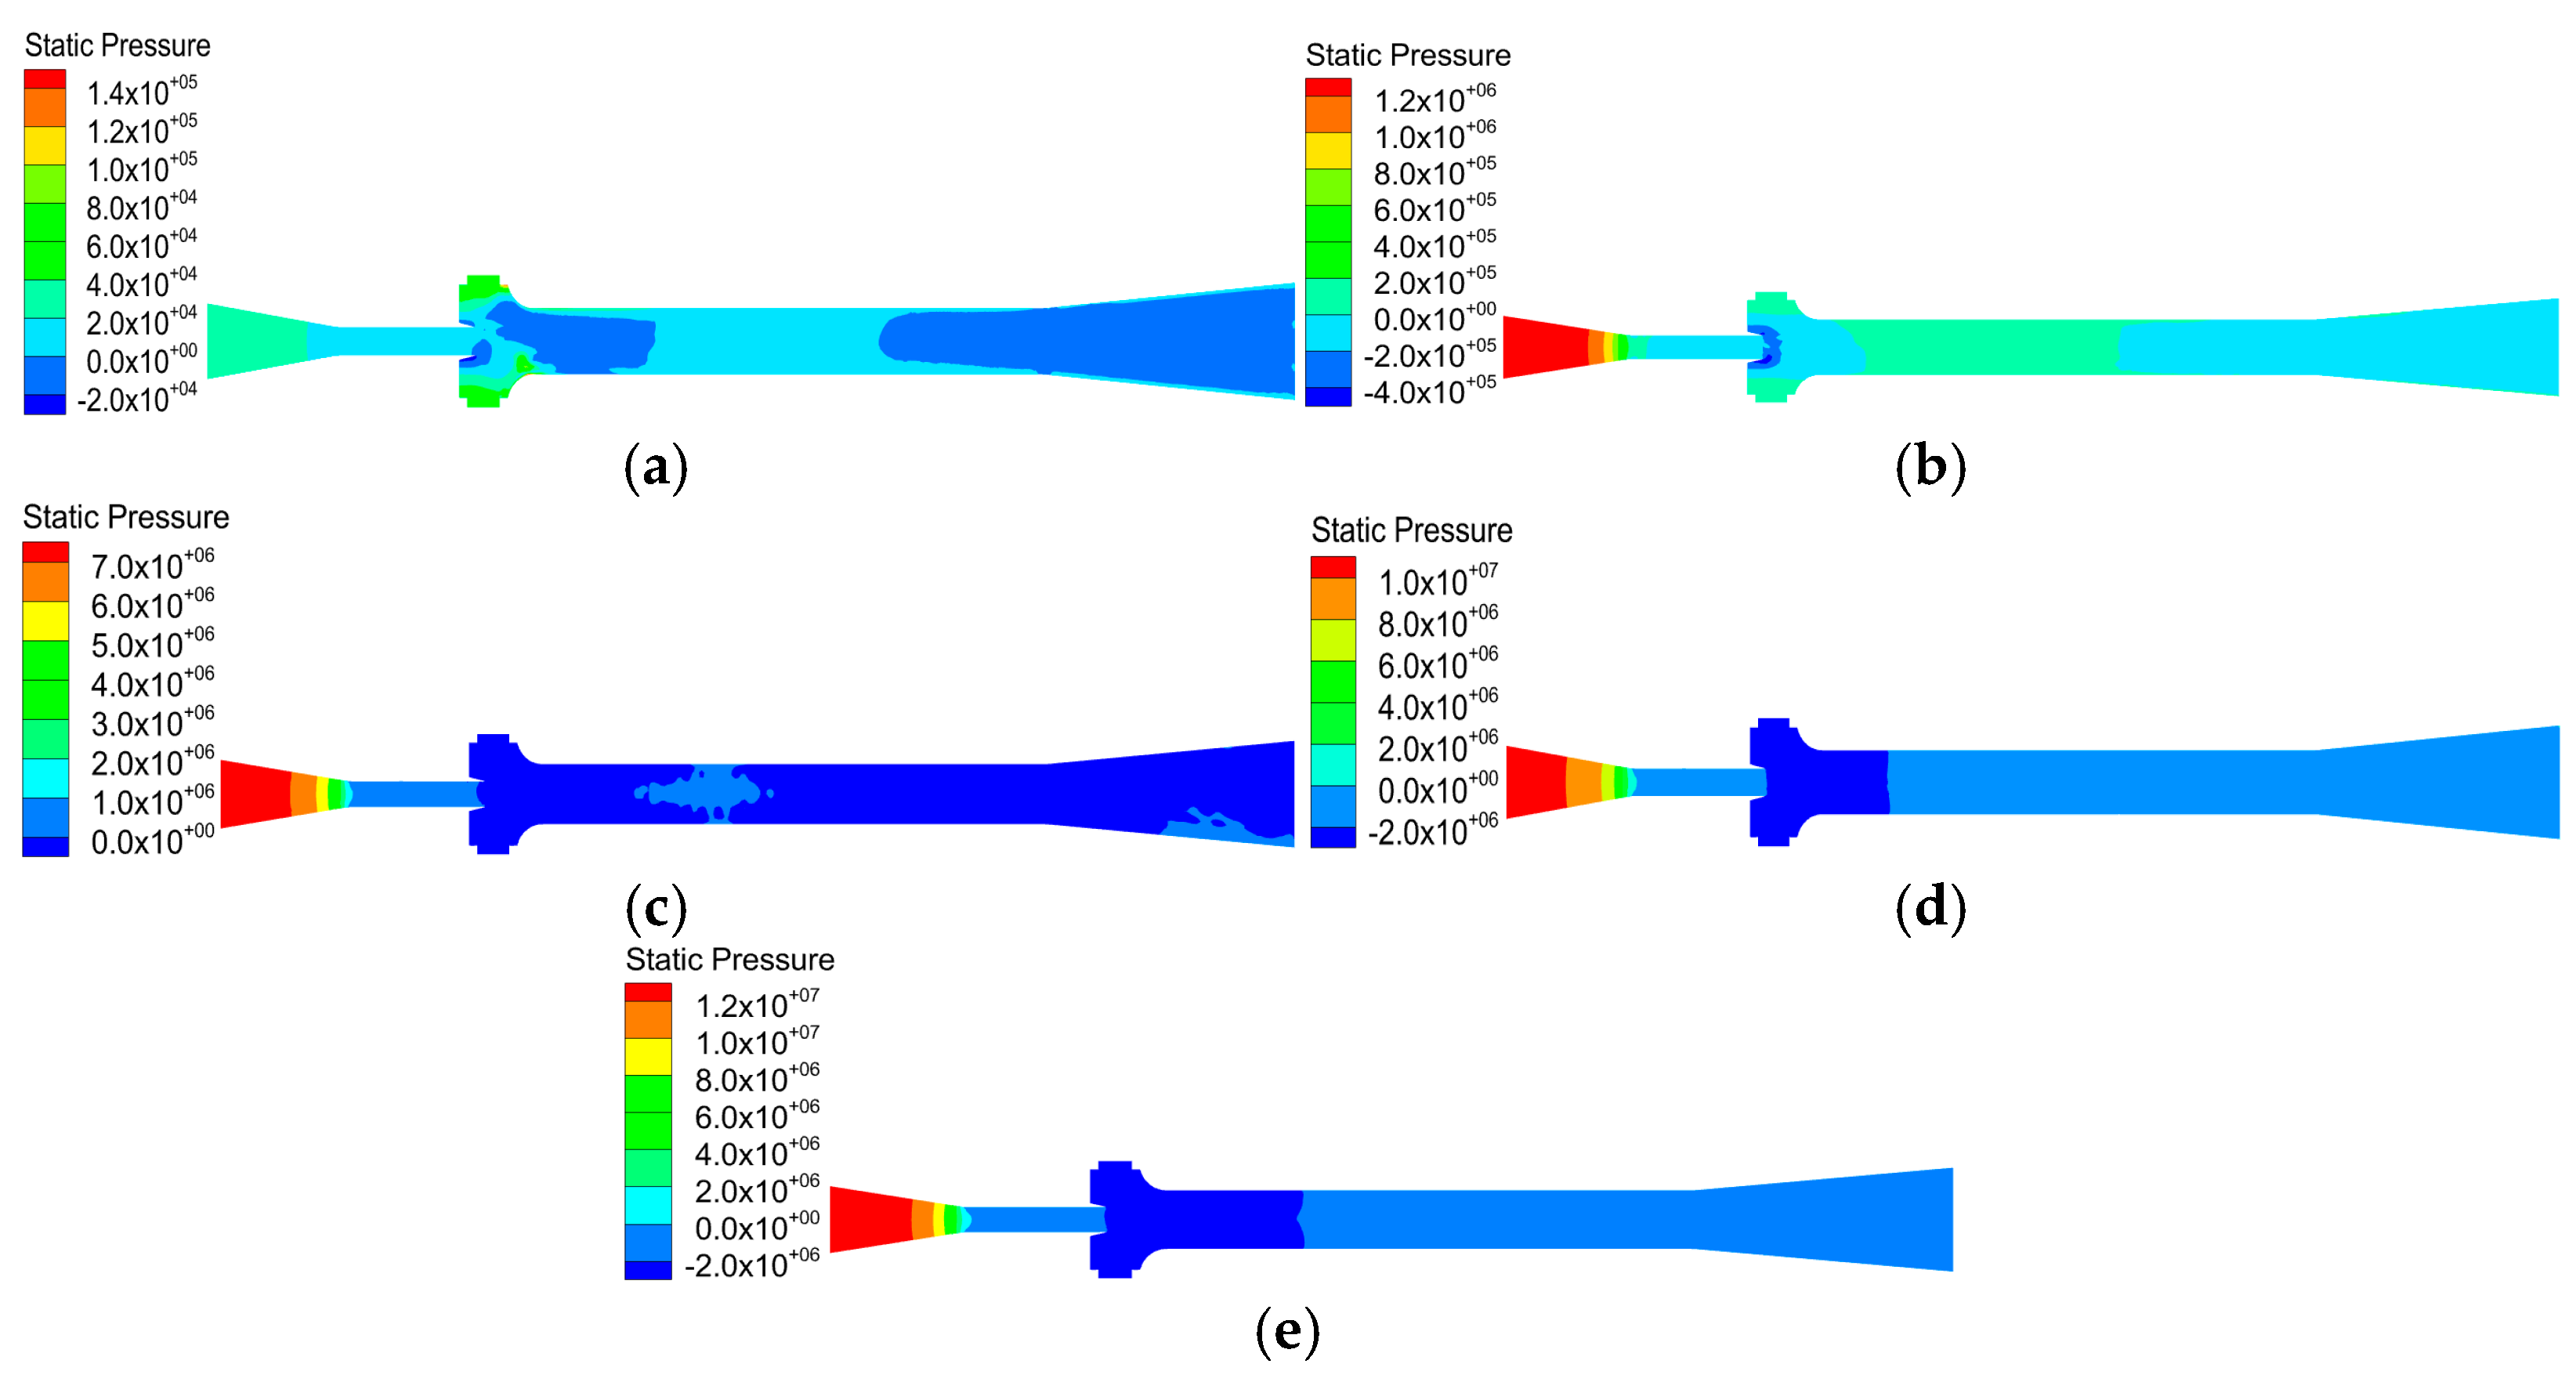
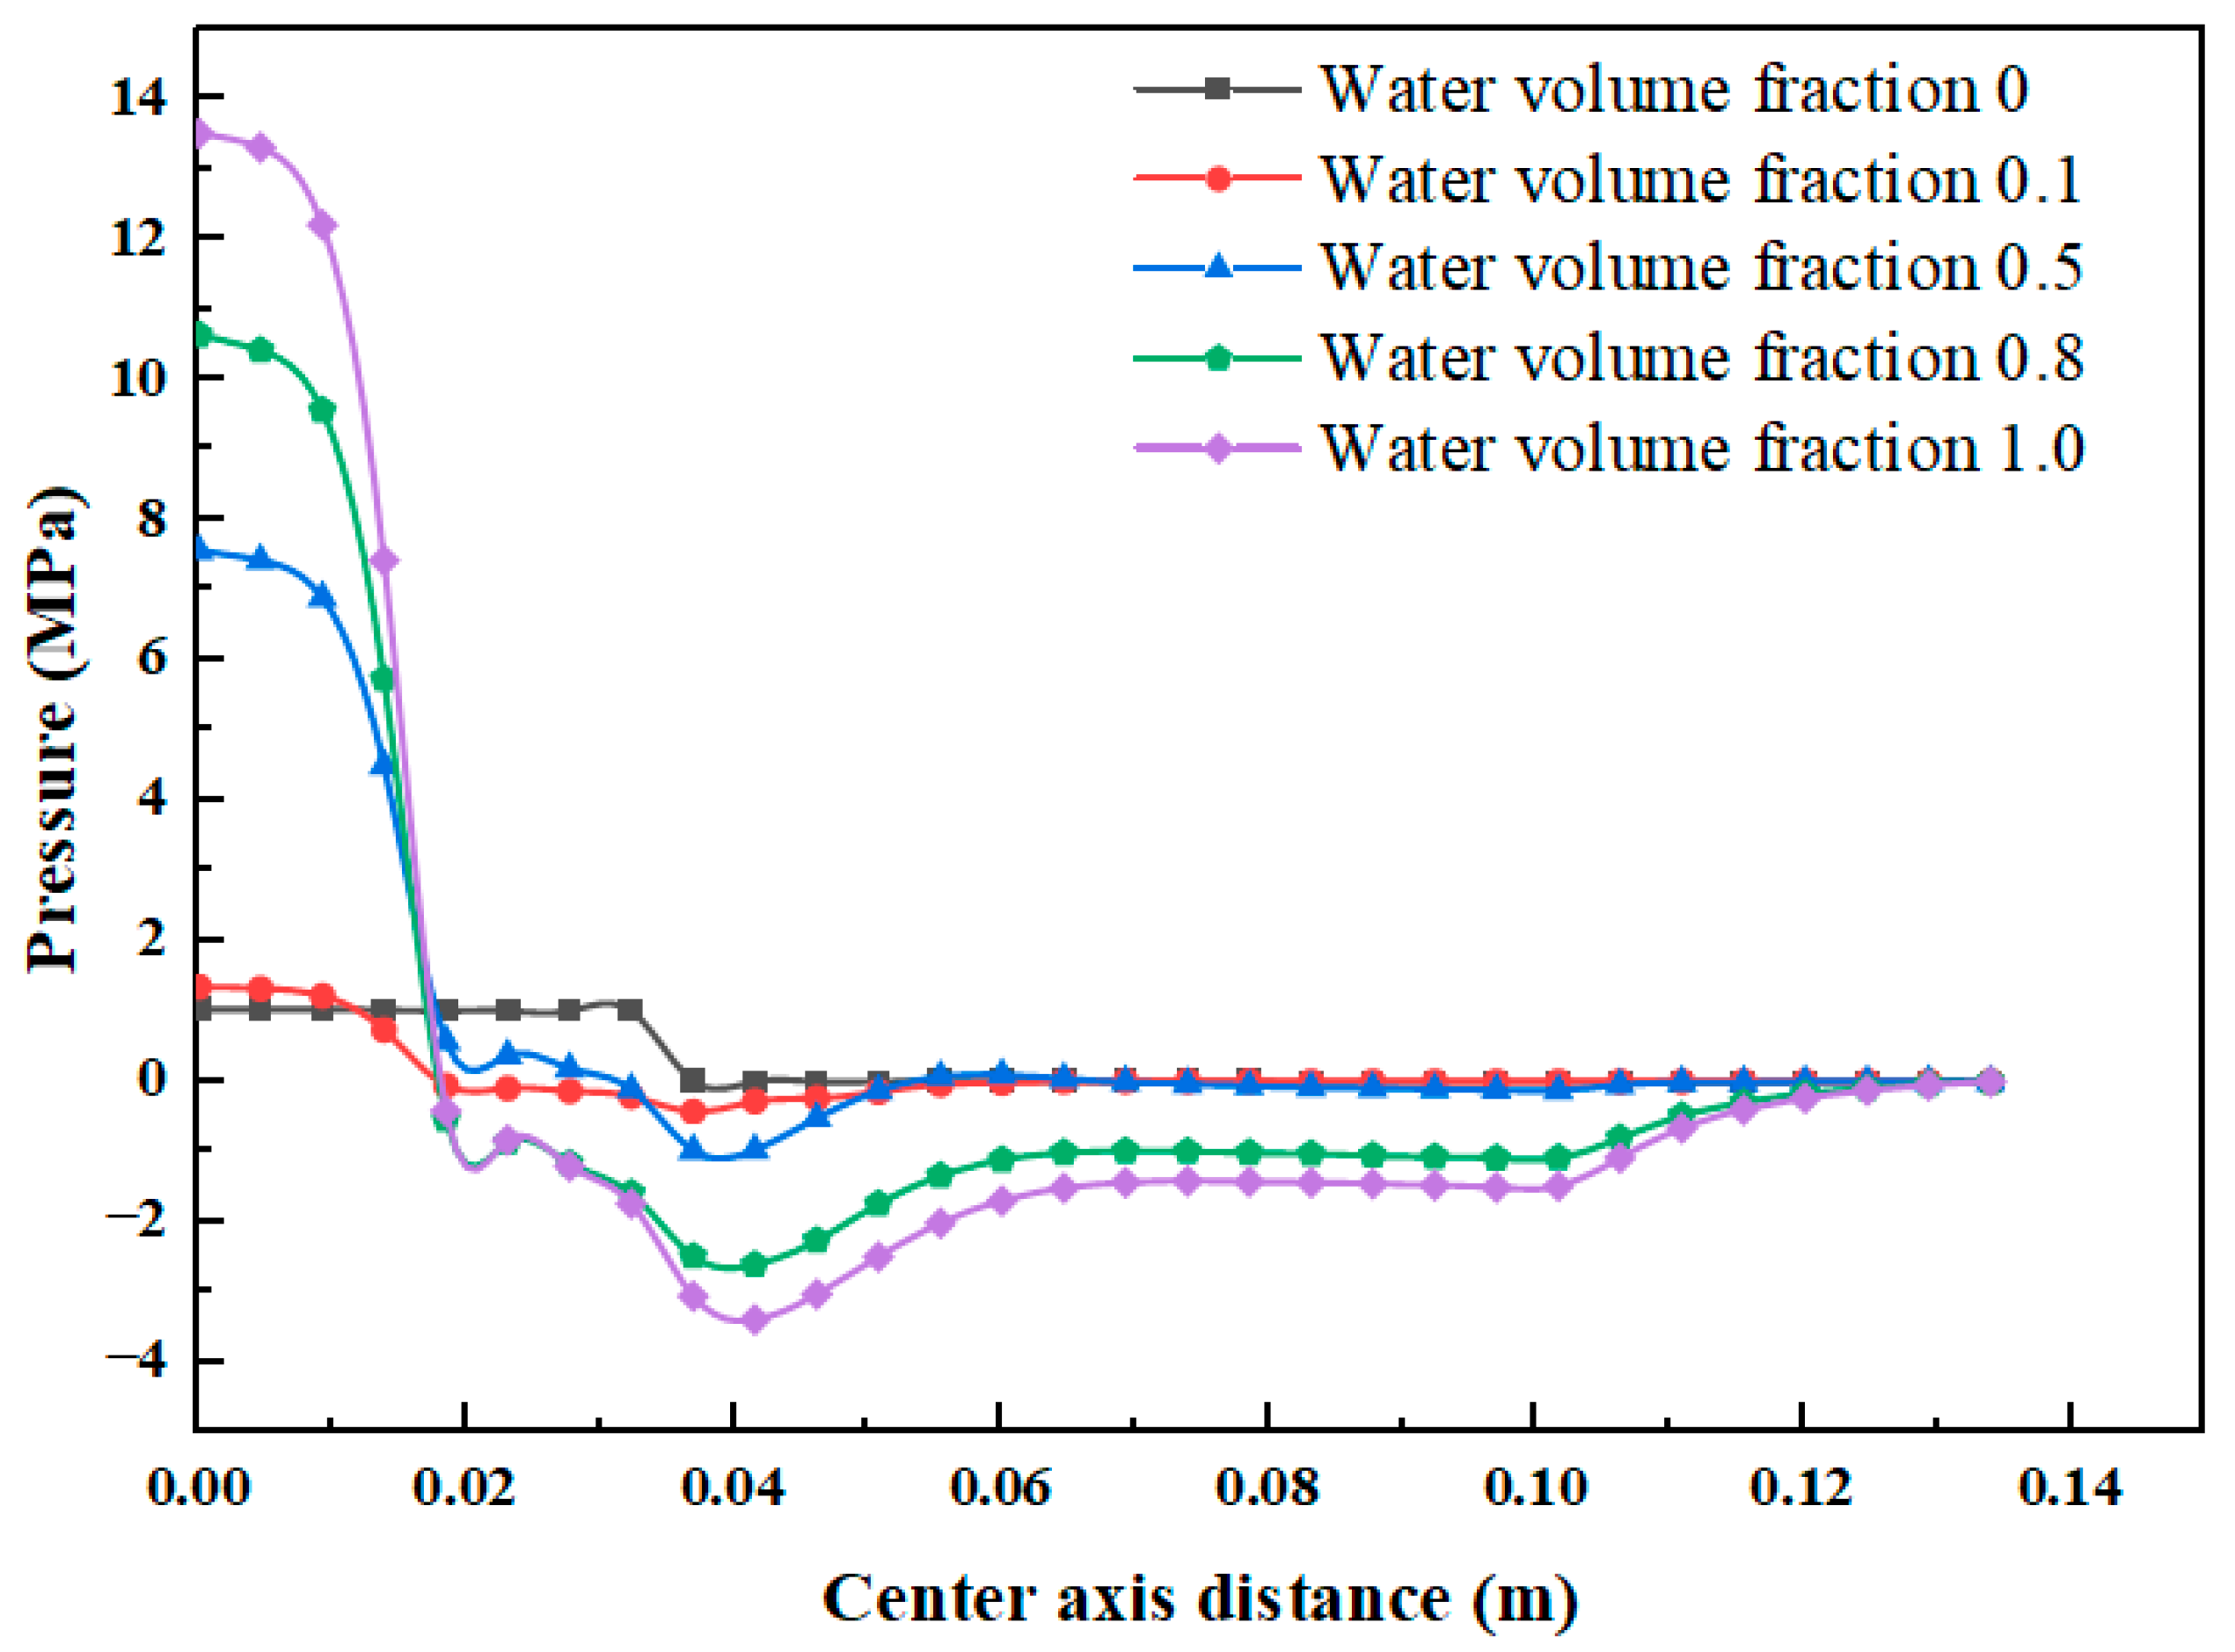
When the volumetric fraction of water is low (0.1) in Figure 10b, the pressure is highest in the nozzle region, and rapidly decreases as the fluid enters the mixing section and diffusion pipe. The static pressure in the mixing section is relatively uniform, while the pressure distribution in the diffusion section exhibits a gradient decrease, indicating efficient conversion of pressure energy into kinetic energy. As the volumetric fraction of water increases to 0.5 in Figure 10c, significant changes occur in the pressure distribution inside the jet pump. The pressure peak remains concentrated in the nozzle region, but after entering the mixing section, the pressure gradient increases. The pressure variations in the mixing section become more pronounced, showing periodic fluctuations. This suggests that gas-liquid mixing intensity has increased, although some areas may experience energy loss due to turbulent effects. When the volumetric fraction of water further increases to 0.8 in Figure 10d, the pressure distribution inside the jet pump shows a higher pressure peak at the nozzle. The pressure in both the mixing and diffusion sections decreases gradually, but the rate of pressure drop in the diffusion section accelerates, indicating a greater conversion of fluid kinetic energy. Meanwhile, the static pressure in the mixing section shows a highly periodic distribution, signaling enhanced turbulence and more complex flow field characteristics in this area. When the volumetric fraction of water reaches 1 in Figure 10e (complete liquid-phase flow), the pressure distribution inside the jet pump exhibits typical single-phase liquid flow characteristics. The pressure peak at the nozzle reaches its maximum, the pressure in the mixing section drops rapidly and stabilizes, and the pressure in the diffusion section decreases linearly. With no gas-phase interaction, the fluid flow exhibits a more stable conversion process between pressure and kinetic energy. Figure 11 shows the pressure distribution on the central axis of the pneumatic jet pump. When the water volume fraction in the pneumatic jet pump power medium is 0 and 0.1, the nozzle outlet area pressure is 0.1MPa, the negative pressure area is small, and the pressurization effect in the throat and diffuser is poor, reflecting the poor pumping efficiency of the pneumatic jet pump. When the water volume fraction in the pneumatic jet pump power medium is 0.5, 0.8, and 1.0, the nozzle outlet pressure gradually decreases to 4MPa, and the pumping pressure increases.
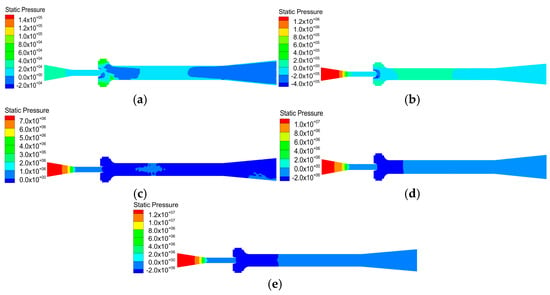
Figure 10.
Pressure distribution of water content at different volume fractions in the power medium. (a) The volume fraction of water in the power medium is 0; (b) The volume fraction of water in the power medium is 0.1; (c) The volume fraction of water in the power medium is 0.5; (d) The volume fraction of water in the power medium is 0.8; (e) The volume fraction of water in the power medium is 1.0.
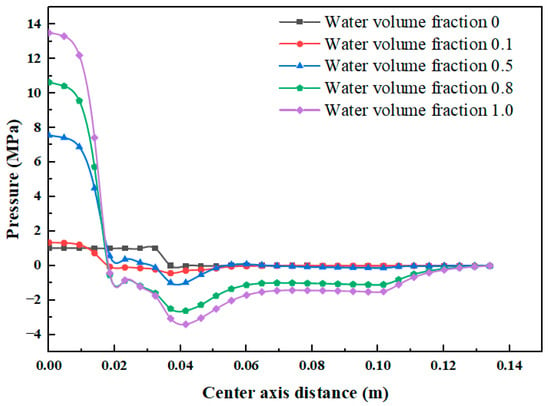
Figure 11.
Pressure distribution of the central axis of the jet pump.
3.1.4. Turbulent Kinetic Energy Distribution
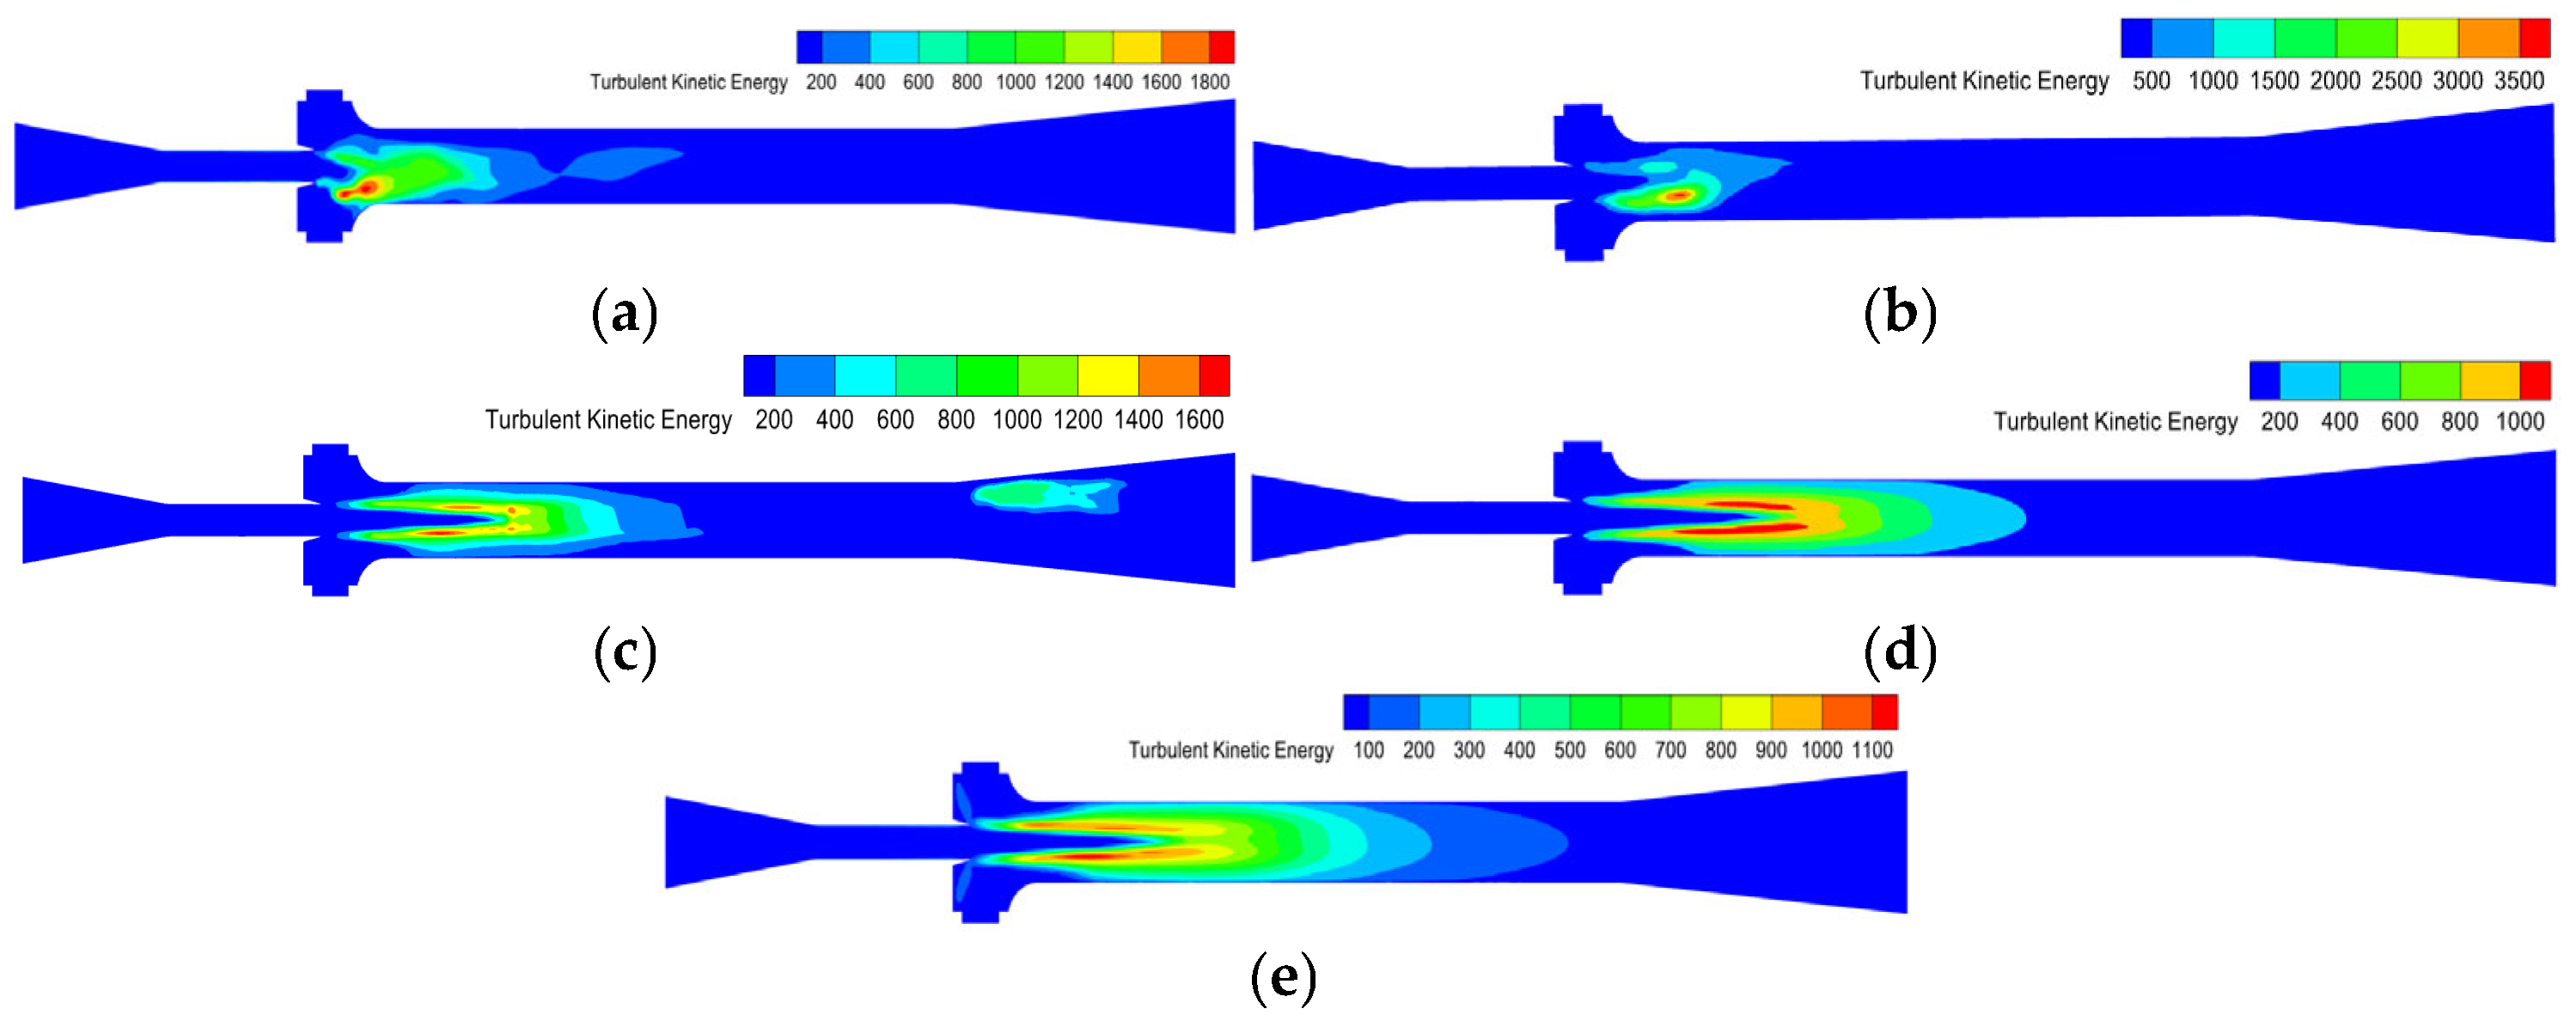
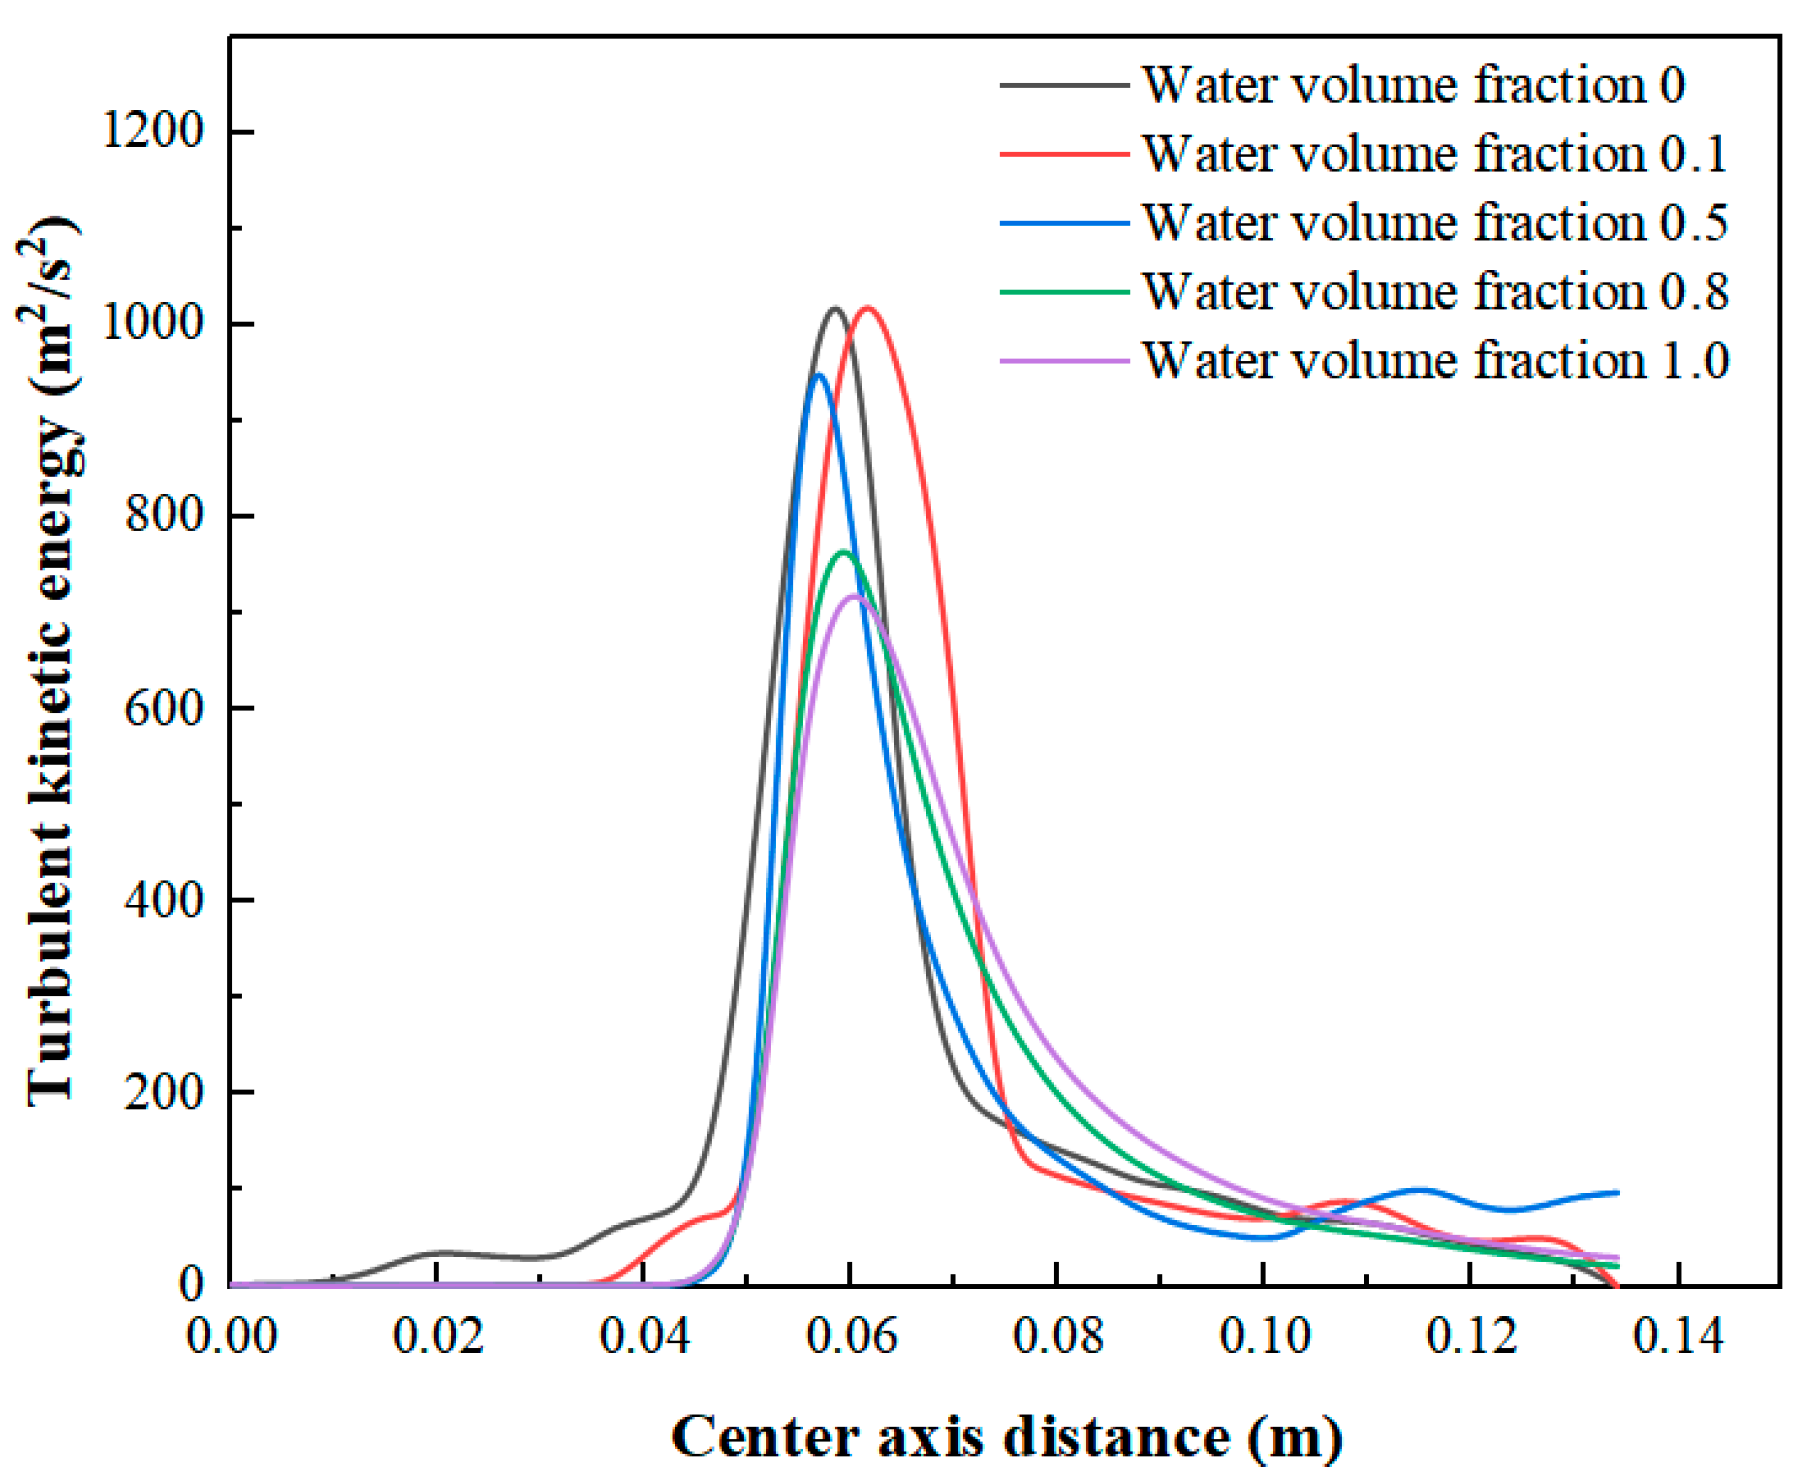
In Figure 12 and Figure 13, when the volumetric fraction of water is 0 in Figure 12a (completely gas phase), the turbulent kinetic energy in the jet pump is mainly concentrated near the nozzle outlet and the initial region of the mixing section. At this point, the distribution of turbulent kinetic energy is relatively confined, and the mixing effect is limited, with turbulent kinetic energy rapidly diminishing in the diffusion section. When the volumetric fraction of water is 0.1 in Figure 12b, the distribution range of turbulent kinetic energy significantly expands, and the peak of the kinetic energy increases. The turbulent region extends from the nozzle outlet to the middle of the mixing section, indicating a more pronounced gas-liquid mixing process. In the diffusion section, the turbulent kinetic energy gradually weakens, but some fluctuation still exists. When the volumetric fraction of water increases to 0.5 in Figure 12c, the distribution range of turbulent kinetic energy further expands, and the high-energy region extends downstream into the mixing section. The peak of the kinetic energy decreases, but the distribution becomes more uniform, indicating that the mixing process is stabilizing and the interaction between gas and liquid phases is more complete. When the volumetric fraction of water is 0.8 in Figure 12d, the distribution range of turbulent kinetic energy contracts, and the turbulent kinetic energy in the mixing section significantly weakens. There is almost no high-energy region in the diffusion section, indicating that the mixing intensity has weakened and the flow field is gradually stabilizing. Under completely liquid-phase conditions in Figure 12e (volumetric fraction of water is 1.0), the turbulent kinetic energy distribution further weakens, with high-turbulence regions primarily concentrated in the initial part of the mixing section, and turbulent kinetic energy significantly decreases in the diffusion section. The fluid motion exhibits stable laminar flow characteristics.
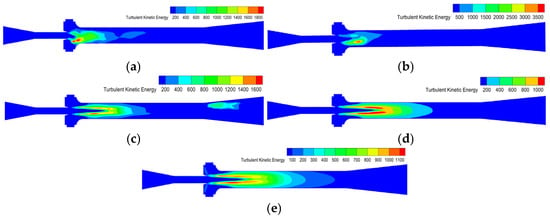
Figure 12.
Turbulent kinetic energy distribution of water content at different volume fractions in the power medium. (a) The volume fraction of water in the power medium is 0; (b) The volume fraction of water in the power medium is 0.1; (c) The volume fraction of water in the power medium is 0.5; (d) The volume fraction of water in the power medium is 0.8; (e) The volume fraction of water in the power medium is 1.0.
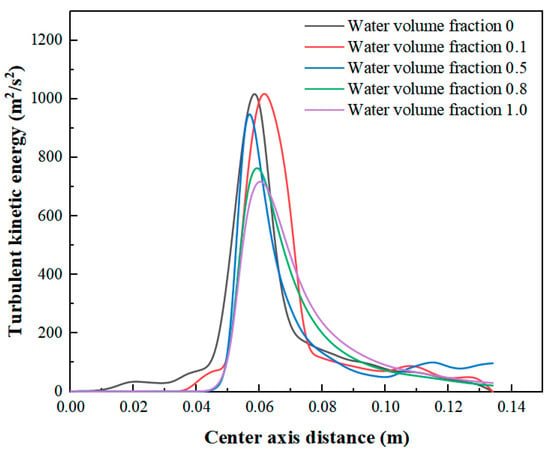
Figure 13.
Turbulent kinetic energy distribution of the central axis of the jet pump.
3.2. Performance of Jet Pump
3.2.1. Pressure Ratio
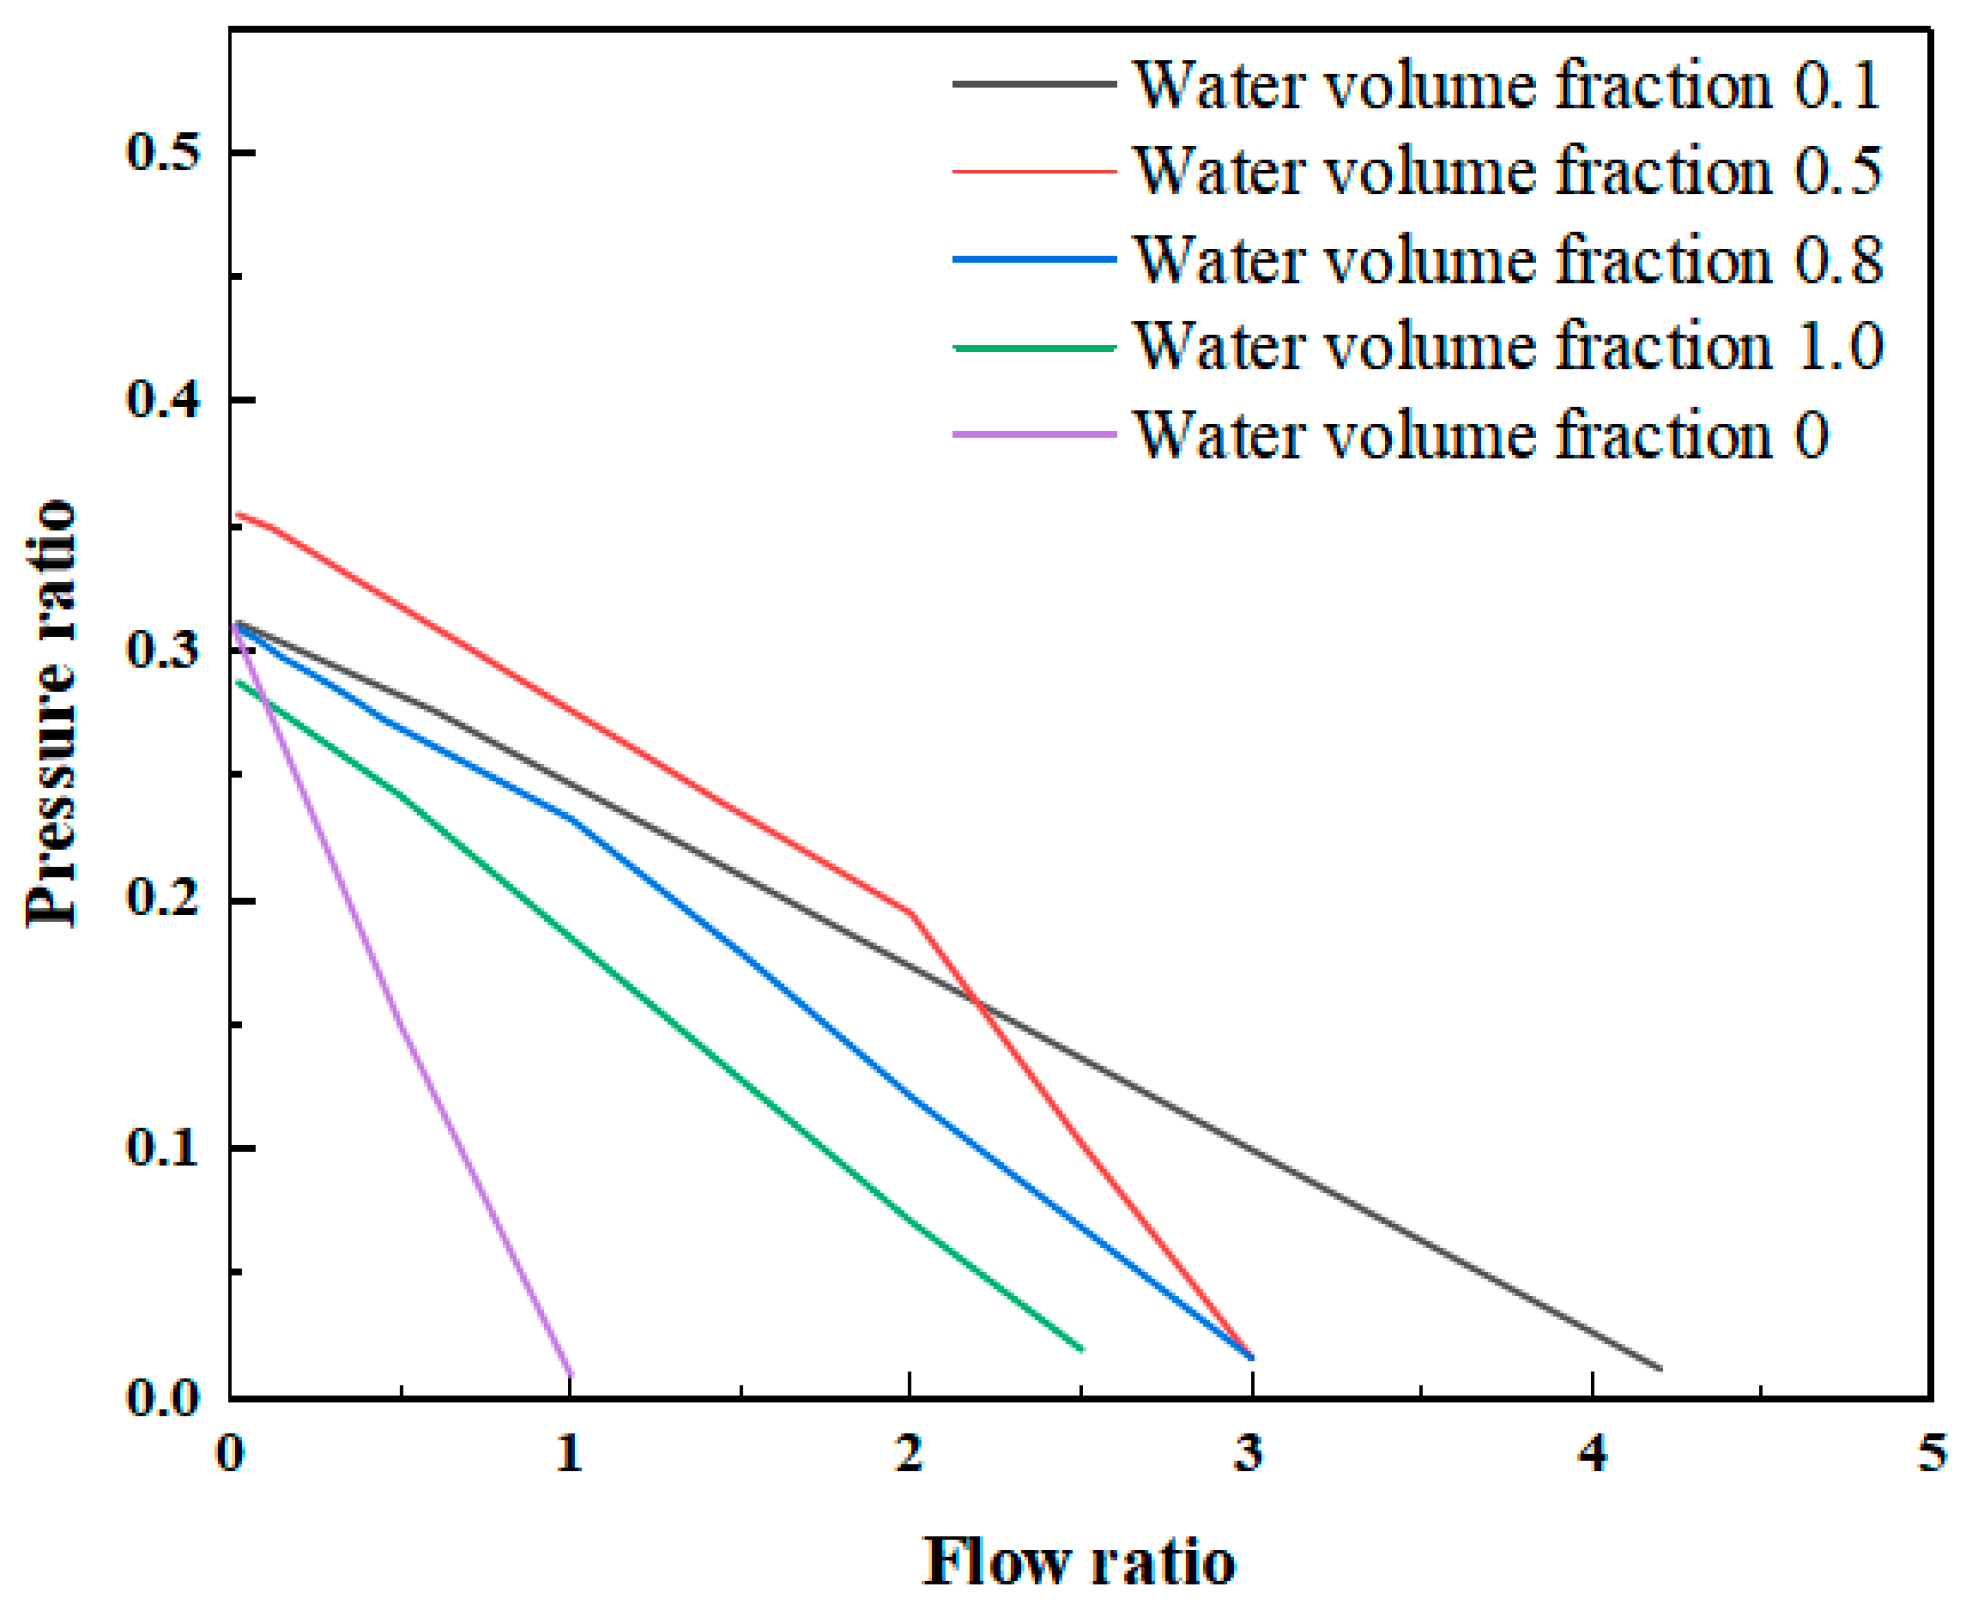
The Figure 14 shows the pressure ratio curve under different volumetric fractions of water in the driving medium. As the dimensionless mass flow rate increases, the pressure ratio of the jet pump consistently decreases. When the volumetric fraction of water is 0, the pressure ratio decreases rapidly with an increase in the dimensionless mass flow rate, indicating low kinetic energy conversion efficiency and significant energy loss. When the volumetric fraction of water is 0.1, the rate of decrease in the pressure ratio with increasing dimensionless mass flow rate is relatively smaller. This suggests that the introduction of a small amount of liquid phase can significantly improve pressure energy conversion efficiency. With a 0.5 volumetric fraction of water, the jet pump demonstrates optimal performance. The initial pressure ratio is slightly higher than that at 0.1 volumetric fraction, indicating a more efficient energy conversion. However, as the volumetric fraction of water increases further, the rate of pressure ratio decrease accelerates with an increase in the dimensionless mass flow rate. This suggests that the mixing effect weakens, and the efficiency of pressure energy utilization significantly decreases.
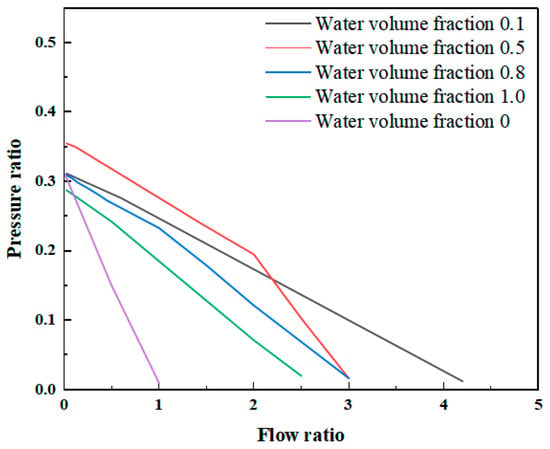
Figure 14.
Pressure ratio of water content at different volume fractions in the power medium.
3.2.2. Pump Efficiency
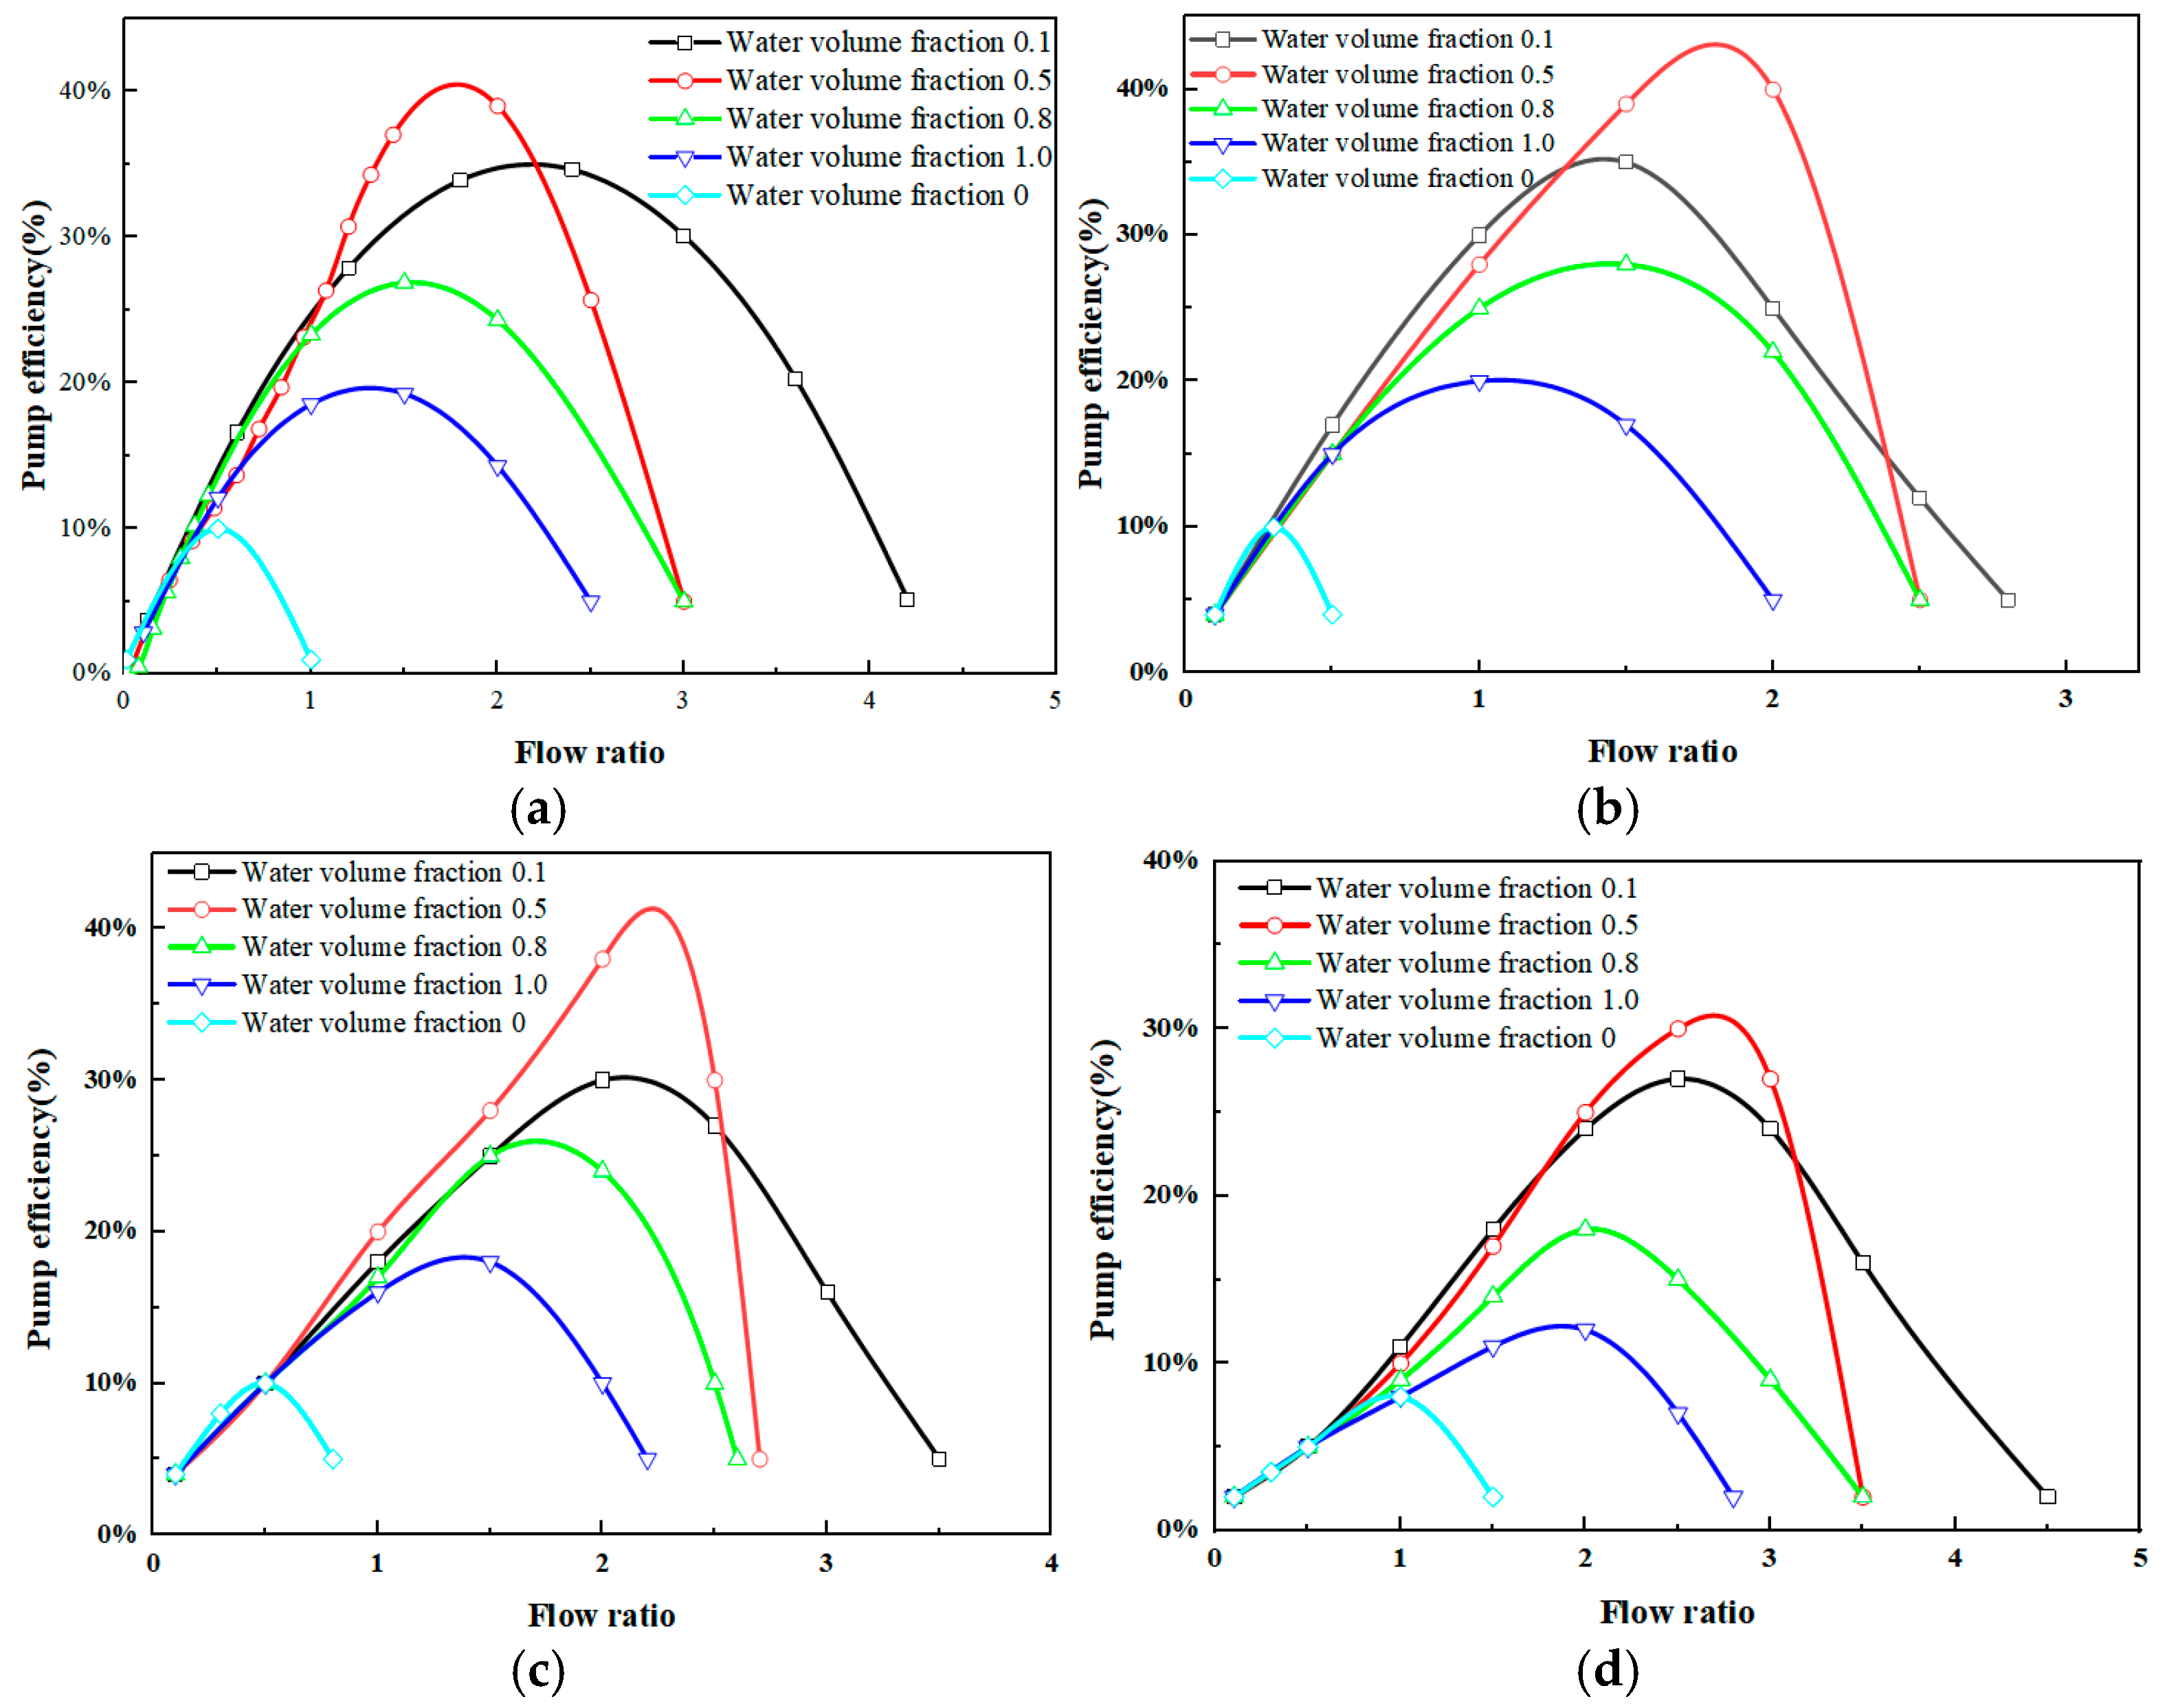
The pump efficiency first increases and then decreases with the increase in dimensionless mass flow rate, displaying a typical peak distribution. Under different volumetric fractions of water, both the maximum pump efficiency and the corresponding dimensionless mass flow rate vary. In Figure 15a, when the volumetric fraction of water is moderate (0.5), the pump efficiency reaches its maximum, exceeding 40%, with the corresponding dimensionless mass flow rate approximately 2.0. This indicates that under low water volumetric fraction conditions, the jet pump achieves optimal mixing, resulting in the highest energy conversion efficiency. At a volumetric fraction of water of 0.1, the maximum pump efficiency is slightly lower than at 0.5, but remains high, with a peak efficiency near 35%, and the corresponding dimensionless mass flow rate still around 2.0. As the volumetric fraction of water increases to 0.8, the maximum pump efficiency decreases further, with the peak efficiency around 25% and the corresponding dimensionless mass flow rate approximately 1.8. At this point, the rate of decline in pump efficiency accelerates, indicating that higher water volumetric fractions increase mixing resistance and reduce energy utilization efficiency. In fully liquid-phase conditions (water volumetric fraction of 1.0), the maximum pump efficiency significantly drops to below 20%, with the peak occurring at a dimensionless mass flow rate of approximately 1.5. In these conditions, the absence of turbulent effects from gas-liquid mixing results in poor overall pump performance.
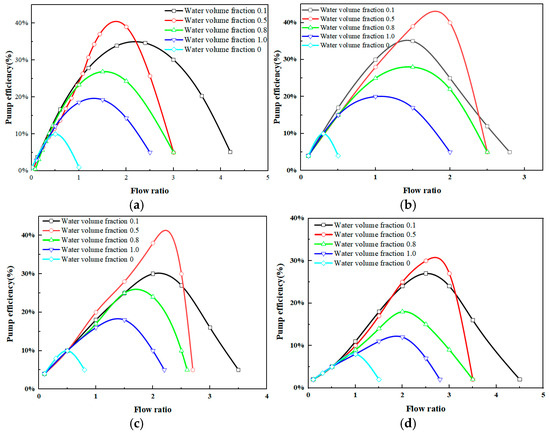
Figure 15.
Pump efficiency of water content at different volume fractions in the power medium. (a) Pneumatic jet pump structure #1; (b) Pneumatic jet pump structure #2; (c) Pneumatic jet pump structure #3; (d) Pneumatic jet pump structure #4.
To eliminate the influence of the jet pump’s structural parameters on its efficiency, pump efficiency analyses were conducted for three different jet pump structures in Table 6. The results showed consistent efficiency distributions with those of the original structure in Figure 15b–d.

Table 6.
Structural parameters of jet pump model.
4. Conclusions
- Exploration of pneumatic jet drainage and gas production in the Sulige Gas Field revealed that adding a certain volumetric fraction of water as the driving medium significantly improves drainage and gas production efficiency.
- The volumetric fraction of water has a significant impact on jet pump performance. Simulation results show that the volumetric fraction of water can significantly enhance jet pump efficiency. When the water volumetric fraction is 0.5, the jet pump efficiency reaches its maximum value (exceeding 40%), and the corresponding dimensionless mass flow rate is approximately 2.0, which represents the highest energy utilization efficiency of the jet pump.
- As the volumetric fraction of water increases, the optimal working point of the jet pump (i.e., the dimensionless mass flow rate corresponding to the peak pump efficiency) gradually decreases. It drops from 2.0 at water volumetric fractions of 0.1 and 0.5, to 1.8 at 0.8, and then to 1.5 at 1.0. This indicates that higher water volumetric fractions affect the flow characteristics of the jet pump, shifting the optimal working point to lower dimensionless mass flow rates.
- The simulation results provide valuable data support for optimizing jet pump performance. Future research can further consider factors such as fluid properties and nozzle-throat spacing in combination with mixed gas-liquid driving media to comprehensively improve jet pump efficiency.
Author Contributions
Conceptualization, S.S.; methodology, S.S. and X.W.; software, Z.Z. and X.W.; validation, Z.Z. and J.C.; formal analysis, J.C. and Y.Z.; investigation, S.L. and J.M.; data curation, S.L.; writing—original draft preparation, Y.Z.; writing—review and editing, S.S. and Y.Z.; visualization, J.M.; supervision, J.M. All authors have read and agreed to the published version of the manuscript.
Funding
This research received no external funding.
Data Availability Statement
The data supporting the research findings of this study are available from the corresponding author on request.
Conflicts of Interest
Authors: Xiongxiong Wang, Zhengyan Zhao and Jiaming Cai are employed by the PetroChina Changqing Oilfield Oil & Gas Technology Research Institute. The remaining authors declare that the research was conducted in the absence of any commercial or financial relationships that could be construed as a potential conflict of interest.
References
- Li, H.; Bai, J.; Jiang, Z.; Yu, F.; Hou, X.; Yu, X. Optimal design of pump selection for jet pump lift in offshore heavy oil thermal recovery. China Pet. Chem. Stand. Qual. 2023, 43, 154–157. [Google Scholar] [CrossRef]
- Wang, Z.; Zhou, D.; Chu, H.; Yao, J.; Zhang, M.; Liao, R. Simulation analysis of flow field of jet pump for co-production of high and low pressure reservoirs. Mach. Tools Hydraul. 2023, 51, 127–134. [Google Scholar] [CrossRef]
- Wang, X. Progress in the test of new drainage gas recovery technology in Qingshimao water-bearing gas reservoir. Petrochem. Appl. 2024, 43, 51–55. [Google Scholar]
- Ge, L.; Han, M.; Liu, X. Application of hydraulic jet pump in oil and gas wells. Equip. Manag. Maint. 2023, 17, 41–43. [Google Scholar]
- Mallela, R.; Chatterjee, D. Numerical investigation of the effect of geometry on the performance of a jet pump. Proc. Inst. Mech. Eng. Part C: J. Mech. Eng. Sci. 2011, 225, 1614–1625. [Google Scholar] [CrossRef]
- Girgidov, A.D. Efficiencies of jet pumps. Power Technol. Eng. 2015, 48, 366–370. [Google Scholar] [CrossRef]
- Banasiak, K.; Hafner, A.; Andresen, T. Experimental and numerical investigation of the influence of the two-phase ejector geometry on the performance of the R744 heat pump. Int. J. Refrig. 2012, 35, 1617–1625. [Google Scholar] [CrossRef]
- Kwon, O.B.; Kim, M.K.; Kwon, H.C.; Bae, D.S. Two-dimensional numerical simulations on the performance of an annular jet pump. J. Vis. 2002, 5, 21–28. [Google Scholar] [CrossRef]
- Long, X. Numerical simulation of internal flow in jet pump. J. Wuhan Univ. Hydraul. Electr. Eng. 2002, 6, 125054705. [Google Scholar]
- Zhu, X.; Wang, D.; Xu, C.; Zhu, Y.; Zhou, W.; He, F. Structure influence on jet pump operating limits. Chem. Eng. Sci. 2018, 192, 143–160. [Google Scholar] [CrossRef]
- Wang, C.; Lin, J.Z.; Shi, X. Numerical simulation and experimental study of turbulent flow in jet pump. J. Chem. Eng. Univ. 2006, 2, 175–179. [Google Scholar]
- Wu, J. Current Status and Prospects of Jet Pump Development. Irrig. Drain. Mach. 2007, 2, 65–68. [Google Scholar]
- Kumar, R.S.; Kumaraswamy, S.; Mani, A. Experimental investigations on a two-phase jet pump used in desalination systems. Desalination 2007, 204, 437–447. [Google Scholar] [CrossRef]
- Yadav, R.L.; Patwardhan, A.W. Design aspects of ejectors: Effects of suction chamber geometry. Chem. Eng. Sci. 2008, 63, 3886–3897. [Google Scholar] [CrossRef]
- Shah, A.; Chughtai, I.R.; Inayat, M.H. Experimental and numerical analysis of steam jet pump. Int. J. Multiph. Flow 2011, 37, 1305–1314. [Google Scholar] [CrossRef]
- Ge, Y. Modeling and simulation of steam jet refrigeration system. Cryog. Supercond. 2011, 39, 48–52. [Google Scholar]
- Liu, X. Numerical Analysis of Solid-Liquid Two-Phase Flow Field of Oil Well Jet Sand Pump. Master’s Thesis, Jilin University, Changchun, China, 2011. [Google Scholar]
- Wang, L.H.; Gao, C.C.; Wang, W.S.; Qin, H.X. Experimental study on the effect of pulse frequency on the performance of liquid jet pump. J. Hydraul. Eng. 2008, 03, 318–324. [Google Scholar]
- Chen, Y.; Danye, C.; Qizhi, Y. Calculation and analysis of ejector flow field based on FLUENT. Coal Mine Mach. 2012, 33, 108–109. [Google Scholar]
- Wu, Y.; Xiang, Q.; Li, H.; Chen, S. Experimental study on bubble size in the diffuser of liquid-gas jet pump. Fluid Mach. 2012, 40, 1–5. [Google Scholar]
- Aldaş, K.; Yapıcı, R. Investigation of Effects of Scale and Surface Roughness on Efficiency of Water Jet Pumps Using CFD. Eng. Appl. Comput. Fluid Mech. 2014, 8, 14–25. [Google Scholar] [CrossRef]
- Wang, Y. Research on Fluid Characteristics of Liquid-Gas Jet Pump. Master’s Thesis, Taiyuan University of Technology, Taiyuan, China, 2015. [Google Scholar]
- Chen, W. A brief discussion on the current status of numerical simulation of internal flow field of jet pumps. Chem. Eng. Des. Commun. 2016, 42, 88–110. [Google Scholar]
- Ran, L. Numerical simulation of flow field of jet pump with streamline nozzle. Hydropower Energy Sci. 2018, 36, 150–153. [Google Scholar]
- Tan, J. Numerical Analysis of Basic Performance and Cavitation Performance of Adjustable Jet Pump. Master’s Thesis, Wuhan University, Wuhan, China, 2019. [Google Scholar]
- Wang, W. Structure and working principle of venturi jet device. J. Southwest Univ. Sci. Technol. 2004, 2, 41–44. [Google Scholar] [CrossRef]
- Gao, G.; Yadong, X.; Yingliang, W. Numerical study on the effect of throat-mouth contraction half angle on flow characteristics of liquid-gas jet pump. J. Vac. Sci. Technol. 2020, 40, 174–179. [Google Scholar]
- Morrall, A.; Quayle, S.; Campobasso, M.S. Turbulence modelling for RANS CFD analyses of multi-nozzle annular jet pump swirling flows. Int. J. Heat Fluid Flow. 2020, 85, 108652. [Google Scholar] [CrossRef]
- Chen, Y.-J.; Zhou, T. Computational fluid dynamics-based structure optimization of ultra-high-pressure water-jet nozzle using approximation method. arXiv 2025, arXiv:2501.01137. [Google Scholar]
- Liu, B. Structural Optimization of Jet Pump Based on Bp Neural Network. Quimica Nova 2024, 47, e-20230127. [Google Scholar] [CrossRef]
- AlSarkhi, A.; Kassar, A.; Sahu, Q.; Gajbhiye, R. Optimizing jet pump efficiency via drag reducing polymers and enhanced efficiency definitions. Sci. Rep. 2024, 14, 1–17. [Google Scholar] [CrossRef]
- Yang, Y.; Chen, X.; Wang, H.; Wu, S.; Jiao, W.; Ji, L.; Shi, W.; He, Z.; Agarwal, R.K.; Wang, C. Multifactor response-based optimization for enhancing cavitation performance of short injection self-priming pumps. Phys. Fluids 2024, 36, 045116. [Google Scholar] [CrossRef]
- Wang, Z.; Lei, Y.; Wu, Z.; Wu, J.; Zhang, M.; Liao, R. Structure Size Optimization and Internal Flow Field Analysis of a New Jet Pump Based on the Taguchi Method and Numerical Simulation. Processes 2023, 11, 341. [Google Scholar] [CrossRef]
- Wang, D. Experimental study on needle valve regulated liquid jet pump. Trans. Chin. Soc. Agric. Mach. 1993, 4, 37–41. [Google Scholar]
- Batchelor, G.K. An Introduction to Fluid Dynamics; Cambridge University Press: Cambridge, UK, 1967. [Google Scholar]
- Hirt, C.W.; Nichols, B.D. Volume of fluid (VOF) method for the dynamics of free boundaries. J. Comput. Phys. 1981, 39, 201–225. [Google Scholar] [CrossRef]
- Yokoi, K. Efficient implementation of THINC scheme: A simple and practical smoothed VOF algorithm. J. Comput. Phys. 2007, 226, 1985–2002. [Google Scholar] [CrossRef]
- Launder, B.E.; Spalding, D.B. Lectures in Mathematical Models of Turbulence; Academic Press: London, UK, 1972. [Google Scholar]
- ESDU 93022. Ejectors and Jet Pumps: Computer Program for Design and Performance for Liquid Flow. 2011. Available online: https://www.esdu.com/cgi-bin/ps.pl?t=doc&p=esdu_93022b-r1 (accessed on 19 January 2024).
Disclaimer/Publisher’s Note: The statements, opinions and data contained in all publications are solely those of the individual author(s) and contributor(s) and not of MDPI and/or the editor(s). MDPI and/or the editor(s) disclaim responsibility for any injury to people or property resulting from any ideas, methods, instructions or products referred to in the content. |
© 2025 by the authors. Licensee MDPI, Basel, Switzerland. This article is an open access article distributed under the terms and conditions of the Creative Commons Attribution (CC BY) license (https://creativecommons.org/licenses/by/4.0/).

