Abstract
In this paper, the Efficient Channel Attention (ECA) mechanism is incorporated at the terminal layer of the YOLOv10 backbone network to enhance the feature expression capability. In addition, Transformer is introduced into the C3 module in the feature extraction process to construct the C3TR module to replace the original C2F module as the deepening network extraction module. In this study, both the ECA mechanism and the self-attention mechanism of Transformer are thoroughly analyzed and integrated into YOLOv10. The C3TR module is used as an important part to deepen the effect of network extraction in backbone network feature extraction. The self-attention mechanism is used to model the long-distance dependency relationship, capture the global contextual information, make up for the limitation of the local sensory field, and enhance the feature expression capability. The ECA module is added to the end of the backbone to globally model the channels of the feature map, distribute channel weights more equitably, and enhance feature expression capability. Extensive experiments on the electrical equipment dataset have demonstrated the high accuracy of the method, with a mAP of 89.4% compared to the original model, representing an improvement of 3.2%. Additionally, the mAP@[0.5, 0.95] reaches 61.8%, which is 5.2% higher than that of the original model.
1. Introduction
In the context of the ubiquitous power Internet of Things (IoT) presented by the national power grid, the collection and analysis of the massive data involved in grid operation offer excellent application scenarios for artificial intelligence (AI) technology, such as the recognition of electrical equipment in images [1,2,3]. The inspection and maintenance of electrical equipment and facilities in the power grid involve significant complexity and demand extensive human and material resources. Traditional inspection methods are often inefficient and wasteful of human resources [4,5]. Therefore, AI technology has also been applied in the electric power industry for intelligent inspection and other operations, yielding significant results [6,7]. Various intelligent inspection devices produce a large number of images, which are difficult to process in a timely manner by manual labor alone. As computer vision advances, more researchers are using object detection and instance segmentation techniques for preprocessing infrared images [8]. Deep learning-based object detection enables researchers to quickly identify substation equipment categories from images, significantly enhancing their efficiency in classifying electrical equipment [9,10]. However, infrared images have some drawbacks, including low resolution, noise, and issues with blurred or missing edge information [11]. Additionally, similar visual traits can be observed across various infrared images of electrical equipment. Because the criteria for assessing temperature anomalies vary among electrical devices, incorrect predictions can result in misjudgments regarding these devices. As a result, enhancing the reliability of deep learning models and reducing the need for manual intervention in the intelligent operation of substations has emerged as a key area of research in power inspection.
Compared to traditional methods, convolutional neural networks (CNNs) automatically learn and extract a greater number of features from images, resulting in improved image recognition, reduced processing time, lower human resource consumption, and enhanced accuracy [12,13]. However, in many scenarios, images are dominated by background elements like forests, rivers, fields, and mountains, which often contain little useful information. Therefore, target detection algorithms that can effectively identify objects in such images are crucial [14]. Among these algorithms, commonly utilized approaches include two-stage methods like Region-based CNN (R-CNN) [15], Fast R-CNN, and Faster R-CNN [16], along with single-stage techniques such as the Single Shot MultiBox Detector (SSD) [17] and You Only Look Once (YOLO) [18]. The YOLO family of algorithms stands out for its speed and light weight, and is gradually being more widely used because it maintains a high level of accuracy while reasoning efficiently. However, YOLO tends to perform poorly when dealing with small targets because its network structure relies on lower-resolution feature maps, which results in details of small objects possibly not being adequately captured. Despite YOLO’s speed, there is still a significant degradation in accuracy for small object detection. The YOLO convolutional network structure excels at capturing local features but struggles to represent long-range dependencies across various regions in an image. YOLO performance may be limited in tasks that require global contextual information. The YOLO network uses a fixed convolutional kernel size, which limits the extent of its receptive field. When dealing with large-scale changing targets, a fixed receptive field may not be effective in capturing global information about the target, resulting in lower detection accuracy for large or distant objects.
To address these issues, the C3TR module replaces the original C2F module in the feature extraction network, deepening the network and incorporating Transformer’s self-attention mechanism to model the features. The ECA attention mechanism is applied to the backbone network to globally model the features and further enhance the feature expression capability. In recent years, attention mechanisms have been increasingly applied in computer vision to improve the performance of deep learning models by enabling them to focus on key features [19,20]. This is achieved by assigning different weights to different input segments, thereby suppressing irrelevant information and enhancing generalization and representation. The Convolutional Block Attention Module (CBAM) combines spatial and channel attention to capture multi-scale feature information by adjusting channel and pixel weights [19]. However, CBAM is computationally intensive, whereas the ECA attention mechanism uses global pooling to perform one-dimensional convolution of global information, which reduces computational effort while enhancing global feature representation [20]. Transformer is modelled with its own self-attention mechanism to better utilize contextual information to leverage both shallow and high-level semantic information, enabling simultaneous detection of large and small target objects [21].
While our proposed model incorporates the C3TR module and ECA attention mechanism to enhance feature extraction, it does not explicitly address the issue of uncertainty in input data, such as low resolution, noise, and blur. Addressing systematic errors and quantifying prediction confidence are essential for enhancing model reliability in real-world applications. One potential approach to tackling this challenge is the integration of fuzzy logic techniques, which have been widely used to model uncertainty in various domains. Studies such as [22,23] have demonstrated the effectiveness of fuzzy logic in detection tasks, providing a simple yet adaptable framework for handling uncertain data. For instance, in the context of detecting and classifying defects in carbon fiber resin epoxy (CFRP) materials [22], fuzzy similarity measures were employed to quantify uncertainty in ultrasonic signals, enabling accurate localization and classification of defects. Similarly, in the localization of holes in conducting plates using noninvasive eddy current measurements [23], a fuzzy neural approach was shown to effectively handle the inherent uncertainties and noise in the measurements. Although these methods were originally applied in different contexts, their generalizability suggests that they could be beneficial for improving the robustness of object detection models. Future research could explore integrating fuzzy logic-based uncertainty modeling to further improve the robustness of our approach. This could involve developing hybrid architectures that combine the strengths of deep learning models with the uncertainty-handling capabilities of fuzzy logic systems, potentially leading to more accurate and reliable predictions in challenging real-world scenarios.
In conclusion, this paper constructs an improved YOLOv10 target detection network for electrical equipment object detection. The C3TR module is used in the feature extraction process to deepen feature extraction, and the ECA attention mechanism is applied at the final stage of the backbone network to improve feature map representation. This paper makes the following contributions:
- (1)
- The C3TR module is constructed with Transformer for feature extraction. By dynamically weighting input features using the self-attention mechanism, the C3TR module enhances global feature extraction and strengthens the network’s feature-learning capabilities.
- (2)
- The ECA attention mechanism is applied to the YOLOv10 backbone network. The global pooling and redistribution of channel weights in the ECA attention mechanism improve the global representation of the feature map.
- (3)
- Comprehensive experiments are conducted on the proposed model using the electrical equipment dataset, and the results show that the proposed model significantly improves accuracy and robustness compared to other methods.
The paper is organized as follows. Section 2 provides a review of recent research on object detection and attention mechanisms. Section 3 describes the improvements made to YOLOv10, including the proposed C3TR and ECA modules. Section 4 compares the contrasting experiments of different networks on the dataset. Finally, Section 5 gives conclusions.
2. Related Work
Electrical equipment recognition is a crucial area of computer vision research, primarily because of its numerous industrial applications, including automated grid inspection and fault detection [24]. As the complexity and size of grid systems continue to grow, the need for efficient and accurate recognition algorithms has increased dramatically [25]. Advances in object detection technologies, particularly those driven by deep learning, have been crucial for enhancing the precision and automation of recognition tasks. State-of-the-art algorithms, such as Faster R-CNN [15] and YOLO [17], have been effectively utilized in recognizing electrical equipment, providing new opportunities to boost operational efficiency and safety in the power industry [26]. This research investigates the application of deep learning in detecting electrical equipment, emphasizing target detection and the development of attention mechanisms. Strategies have been proposed to tackle the challenges arising from the varying sizes and complexities of electrical equipment in real-world environments.
2.1. Object Detection
With the vigorous construction of the national power grid, there has been a gradual increase in electrical equipment. The identification and detection of this equipment have become indispensable for operation and maintenance. Recently, various methods have been proposed for object detection; for example, Tao et al. [27] introduced a data enhancement method to segment the insulator region and blend it with the rest of the background. Nevertheless, the images produced by this method feature only a limited representation of insulator defects. Zhang et al. [28] introduced an effective synthetic fog algorithm that regulates foggy weather scenes by adjusting various brightness and fog levels, offering a novel approach to fog simulation. Lei and Sui [29] proposed a faster R-CNN method for accurately detecting bad insulators and bird’s nests, including their specific locations. The Faster R-CNN employs a region proposal network to identify a region within the image features that serves as a suggested area. Subsequently, it continues to train these regions to obtain the relevant classes and locations of specific components in the image. Sadykova et al. [30] applied the real-time detection network YOLO-v2 for insulator detection, followed by using a CNN to assess the condition of the insulators and classify any faults. The two-stage approach refines the search for faults, enhancing the overall accuracy of the diagnosis. Nevertheless, the diagnostic model needs to be executed repeatedly in images of multiple insulators, which is computationally expensive.
2.2. Attention Mechanisms
Improving network accuracy and efficiency in deep learning for detecting electrical equipment has become a research hotspot, with various attention mechanisms, such as channel attention [31], spatial attention [19], and self-attention [32] being widely utilized. Liu et al. [33] presented a hierarchical fusion module designed for attention perception that utilizes positional attention to integrate features from two distinct domains. Ganapathi et al. [34] employed CA to extract multi-resolution features for attention perception in both spatial and frequency domains, enhancing the generalization for previously unseen operations. Wang et al. [35] employed the self-attention mechanism in the transformer model to generate a fine-grained global representation for IMDL. To facilitate the integration of features from different domains, Vaswani [21] proposed the Transformer architecture to process sequences with better performance using the self-attention mechanism and multi-head perception capability. Inspired by the above studies, this paper integrates the Transformer architecture in the feature extraction part to propose the C3TR module, and applies the ECA attention mechanism to ensure full extraction and utilization of feature information.
3. Methodology
3.1. Improved YOLOv10
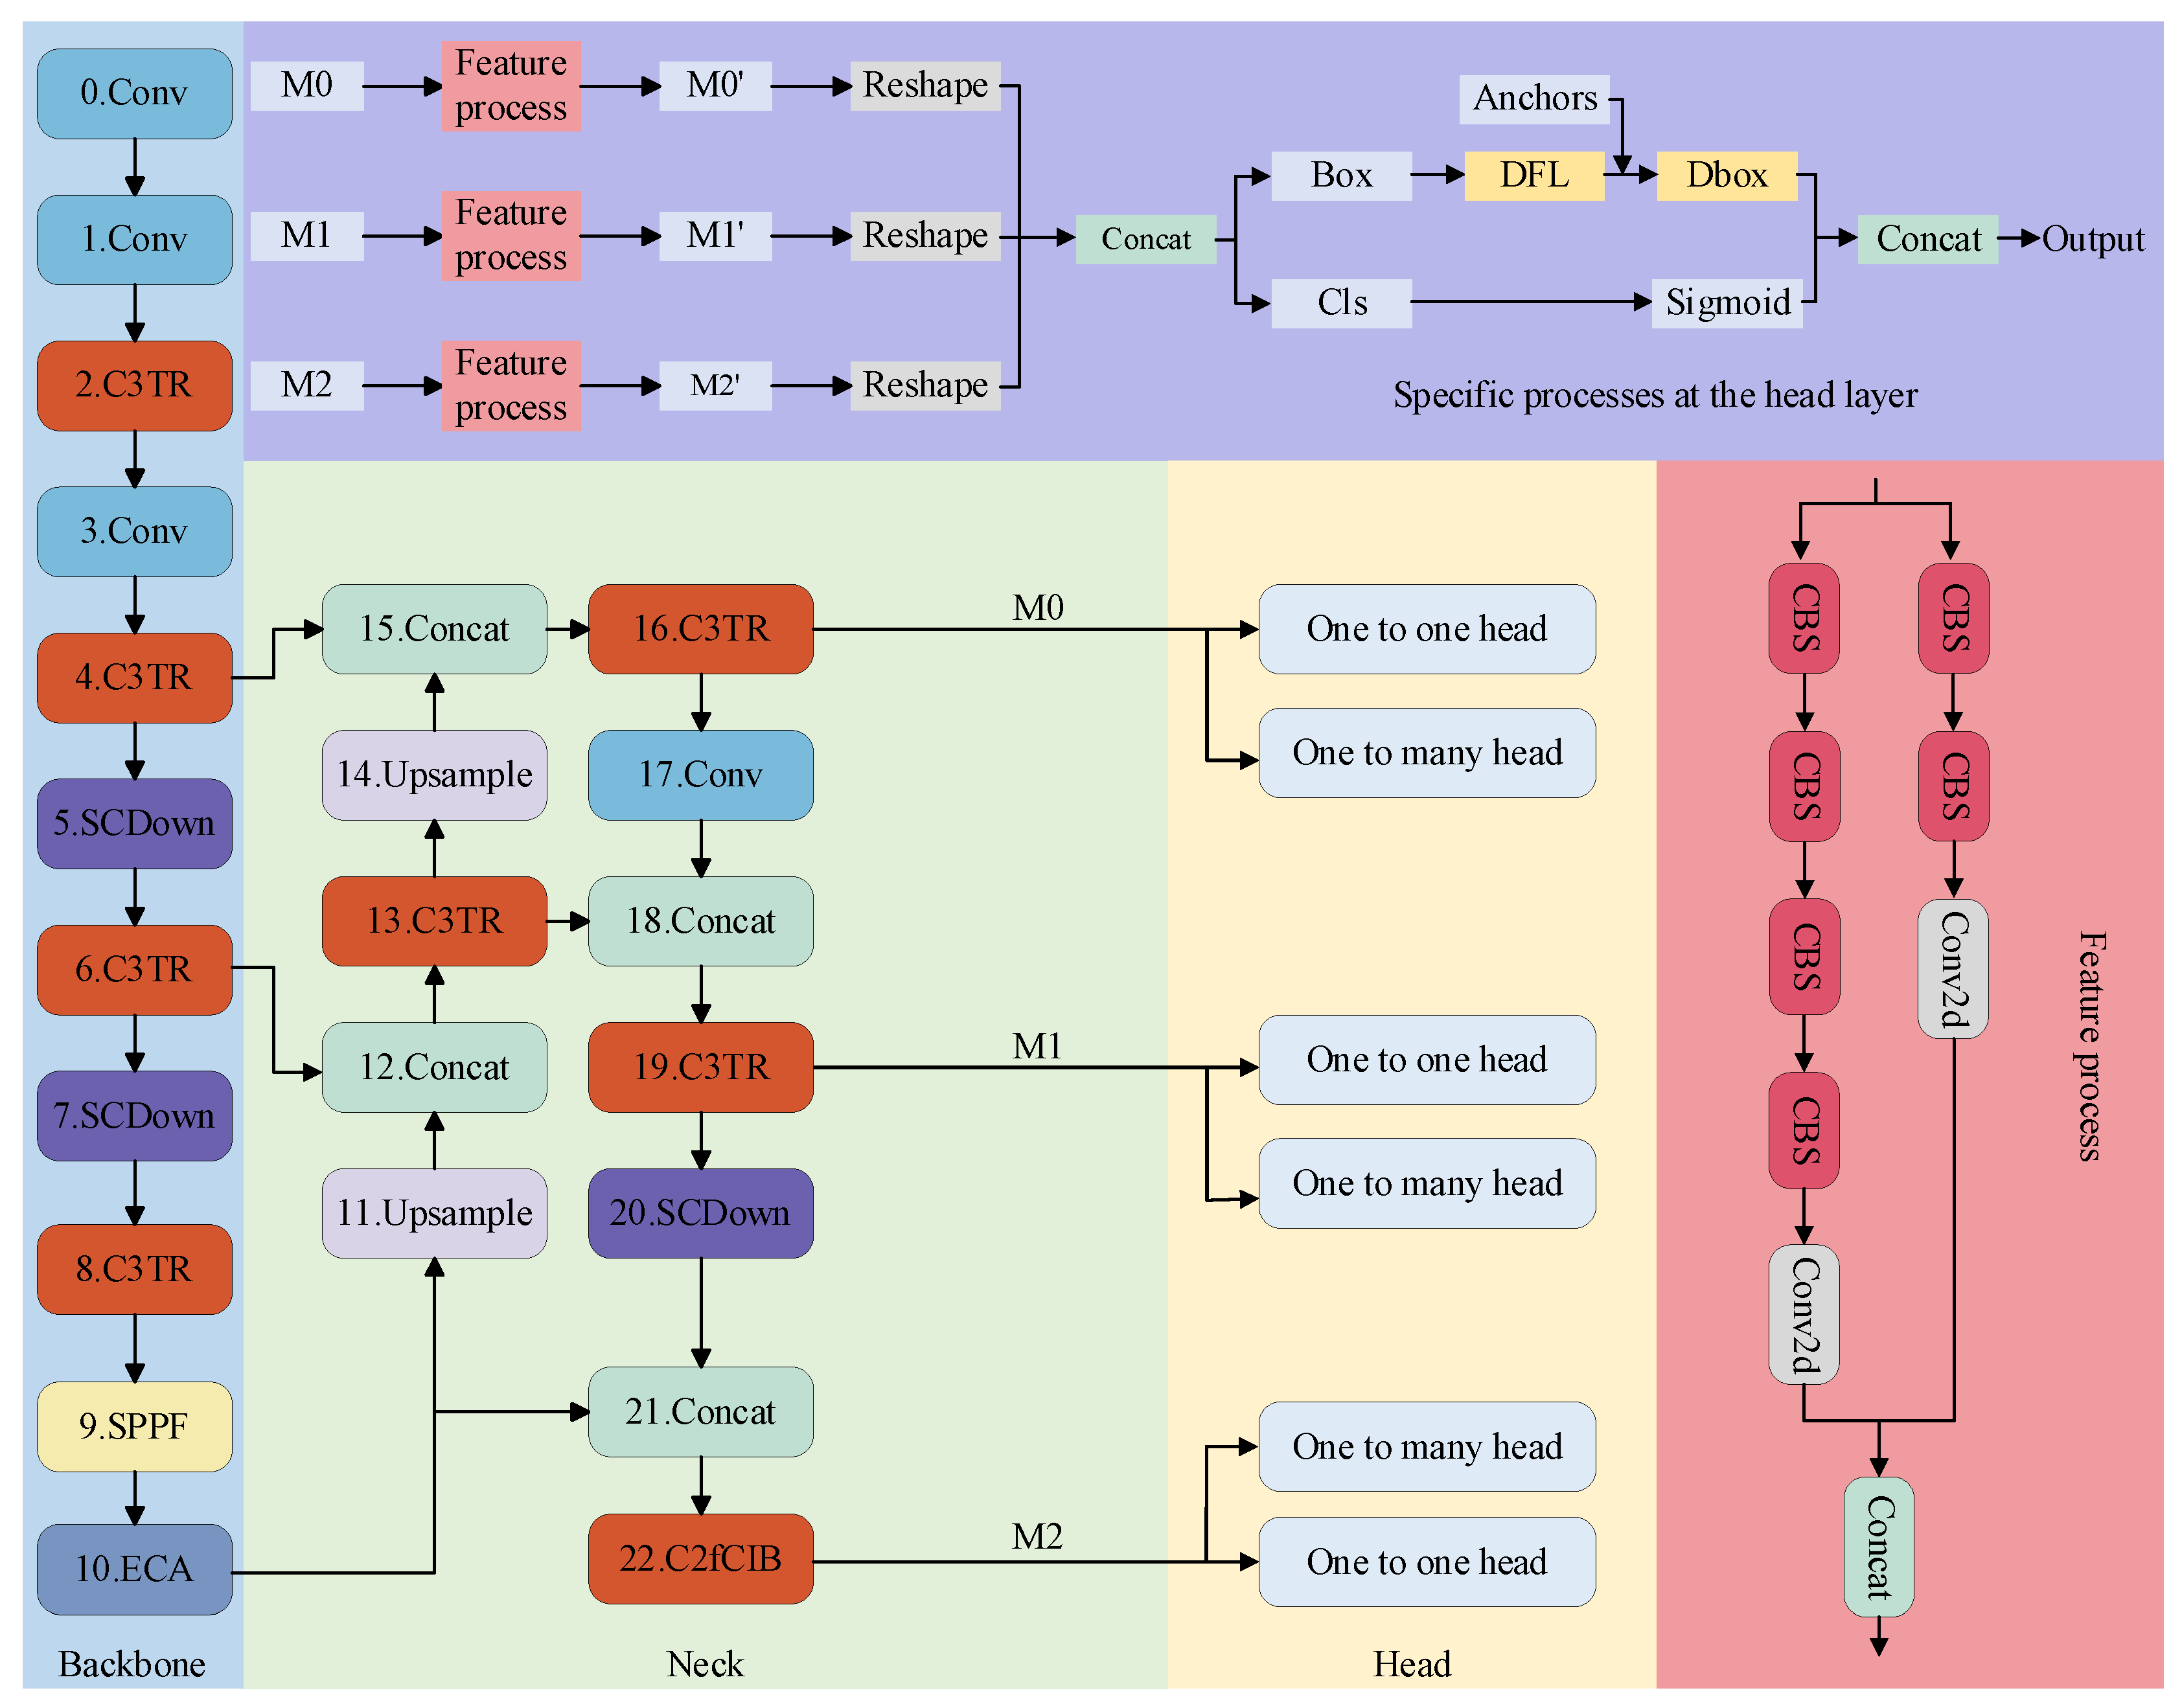
As shown in Figure 1, the improved YOLOv10 object detection network for electrical equipment object detection is used in this paper. The YOLOv10 network mainly consists of three components: the backbone, the neck, and the head. The backbone acts as the core network for feature extraction, where input images are preprocessed and entered into the network. Firstly, the base features are extracted through the convolutional layer. The C3TR module then performs further feature extraction. The extracted features are processed through another convolutional layer, followed by the C3TR module again to enhance feature extraction capability. The SCDown module is used for down-sampling to expand the number of channels. After that, the C3TR module is applied again for further feature extraction. The SCDown module performs another down-sampling step, followed by the application of the C3TR module to continue feature extraction. Finally, the SPPF module pools the features to capture multi-scale information, and the ECA channel attention module integrates and analyzes these features. It is worth noting that the traditional C2F module is replaced by the C3TR module for feature extraction. The C3TR module integrates the concept of transformers, introducing the self-attention mechanism for feature processing and enabling multi-head parallel processing to diversify the features. Additionally, the ECA channel attention module is incorporated to further enhance the focus on critical features.

Figure 1.
Improved YOLOv10 object detection system model.
The neck section processes the backbone output further for multi-scale feature fusion. It performs up-sampling on the backbone output and concatenates the resulting feature map with the one obtained in step 6 of the feature extraction process. The obtained feature map undergoes further extraction using the C3TR module. Next, up-sampling is performed, followed by splicing with the feature map from step 4. After fusion by the C3TR module, the result is output to the head layer. Convolution is then applied to integrate the feature map, which is spliced with the intermediate feature map obtained in step 13. The C3TR module performs additional feature extraction, and the results are passed to the head for object detection. To maintain consistency with the feature map in step 10, down-sampling is applied for feature splicing, followed by further processing with the C3TR module before outputting to the head layer for target detection. The head layer receives feature maps from different network depths, which have been processed by the feature pyramid. These feature maps undergo further processing through convolutional layers and are then stitched together to produce the final feature map. The final detection result is achieved through classification and candidate box branching. In the detection layer, two detection heads are used during the training process, but only one detection head is used during inference. In the head detection process, the anchor scores are first sorted, and the top 300 anchors are selected. For each class, the candidate boxes are further sorted to retain those with the highest scores. During training, this process replaces the original NMS (Non-Maximum Suppression). The classification loss function during training is Binary Cross-Entropy Loss, which can be expressed mathematically as
where denotes the loss of the nth sample, denotes the true label of the nth sample, and denotes the model’s probability of predicting the nth sample, i.e., , is the original model prediction.
The DFL module is used in bounding box detection to calculate the loss function, as shown in the following equation:
where samples are usually determined by the target score, i.e., , represents the maximum value of IoU among all positive samples, and represents the align_metric of that positive sample. is the distribution focus loss, and are the predicted values of the bounding box, and are the predicted losses for the bounding box.
3.2. ECA Attention Mechanism
As shown in Figure 2, the model diagram of the ECA channel attention mechanism, the ECA module proposes a parameter-free and efficient method to achieve more efficient inter-channel information interaction by using local one-dimensional convolution instead of fully connected layers. In this paper, the ECA module is applied at the end of the backbone for further feature processing. The ECA module captures the important relationships between different channels in the convolutional feature map. This enables the network to focus on critical channel information, enhancing the feature representation. Specifically, the feature map after feature extraction is input into the ECA module to obtain the global representation of each channel through a global pooling operation. The activation function is then used to generate attention weights. Finally, these weights are multiplied with the features to achieve further enhancement. The ECA module eliminates the need for complex dimensionality adjustments, achieving both efficiency and lightweight properties. Notably, the ECA module can dynamically adapt the kernel size of the 1D convolution according to the channel count, enabling it to flexibly capture various channel dependency ranges. The adaptive mechanism allows the ECA module to work effectively in networks of different sizes and at different depths of hierarchy.
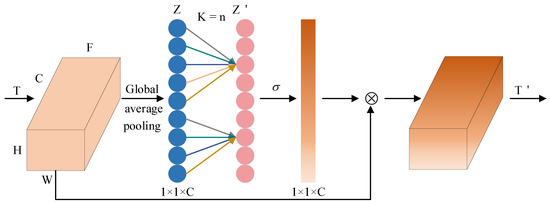
Figure 2.
Efficient channel attention (ECA) mechanism model diagram.
ECA begins with global average pooling applied to the feature map, calculated as follows:
where is the global feature of the cth channel.
ECA adaptively determines the one-dimensional convolutional kernel size based on the number of channels, expressed as follows:
where is the convolution kernel. is the number of channels. and are hyperparameters. The process ensures the kernel size remains an odd number by taking the absolute value and rounding it down to the nearest odd integer.
The feature vector after one-dimensional convolution can be expressed as
The final feature map after the ECA module can be represented as
where denotes the activation function. denotes the final output feature map.
3.3. C3TR Module
As shown in Figure 3, the C3TR module integrates the transformer into the C3 module, substituting the original C2F module to perform deep-level feature extraction. By incorporating the Transformer, the C3TR module integrates the self-attention mechanism into feature modeling, effectively capturing long-distance dependencies and global context. The C3TR module utilizes the global interaction feature of Transformer in its structure, combined with the local feature of convolution, which can more effectively integrate multi-scale information and improve the processing capability of small targets and complex scenes. Transformer’s multi-head self-attention mechanism can dynamically adjust the attention area of the input features, which makes the C3TR module more adaptable and ubiquitous under different scenes and data distributions. Transformer’s multi-head self-attention mechanism can dynamically adjust the attention area of input features, which makes C3TR module have better adaptability and generalization ability in different scenes and data distribution. With Transformer’s weight adaptive mechanism, more attention is paid to important features, which improves the efficiency of feature utilization and the accuracy of information extraction.
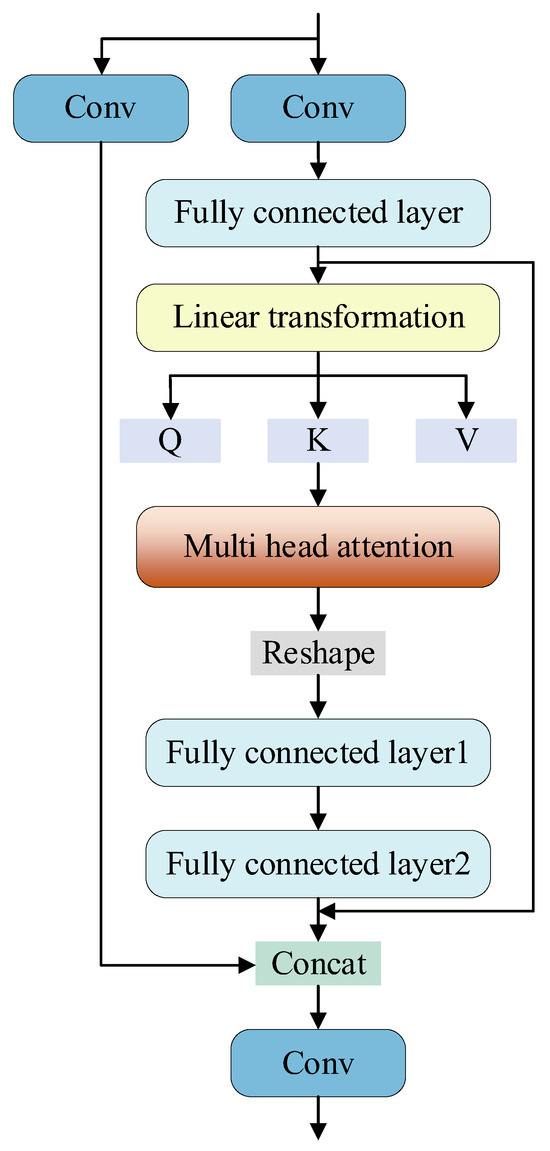
Figure 3.
C3TR module construction diagram incorporating transformer ideas.
The input features are convolved by conv and subsequently processed by the constructed transformer module, the fusion sequence is positionally encoded by one-dimensional unfolding through the spreading layer, and the key values Q, K, V are obtained through linear transformation, and the feature representations are generated by capturing the elemental relationships through weighted computation. A multi-head mechanism is introduced in self-attention, and a 4-head attention mechanism is set up in the paper, which divides the input sequence into 4 heads through segmentation to enhance the computational efficiency and the fusion ability of different features, and finally, the output is adjusted to enhance the expression ability through the feedforward composed of two fully-connected layers, which performs a nonlinear transformation on each position, and finally introduces the residual connection to ensure that the underlying feature expression ability is enhanced, which then carries out the subsequent operations.
4. Experiments
- (1)
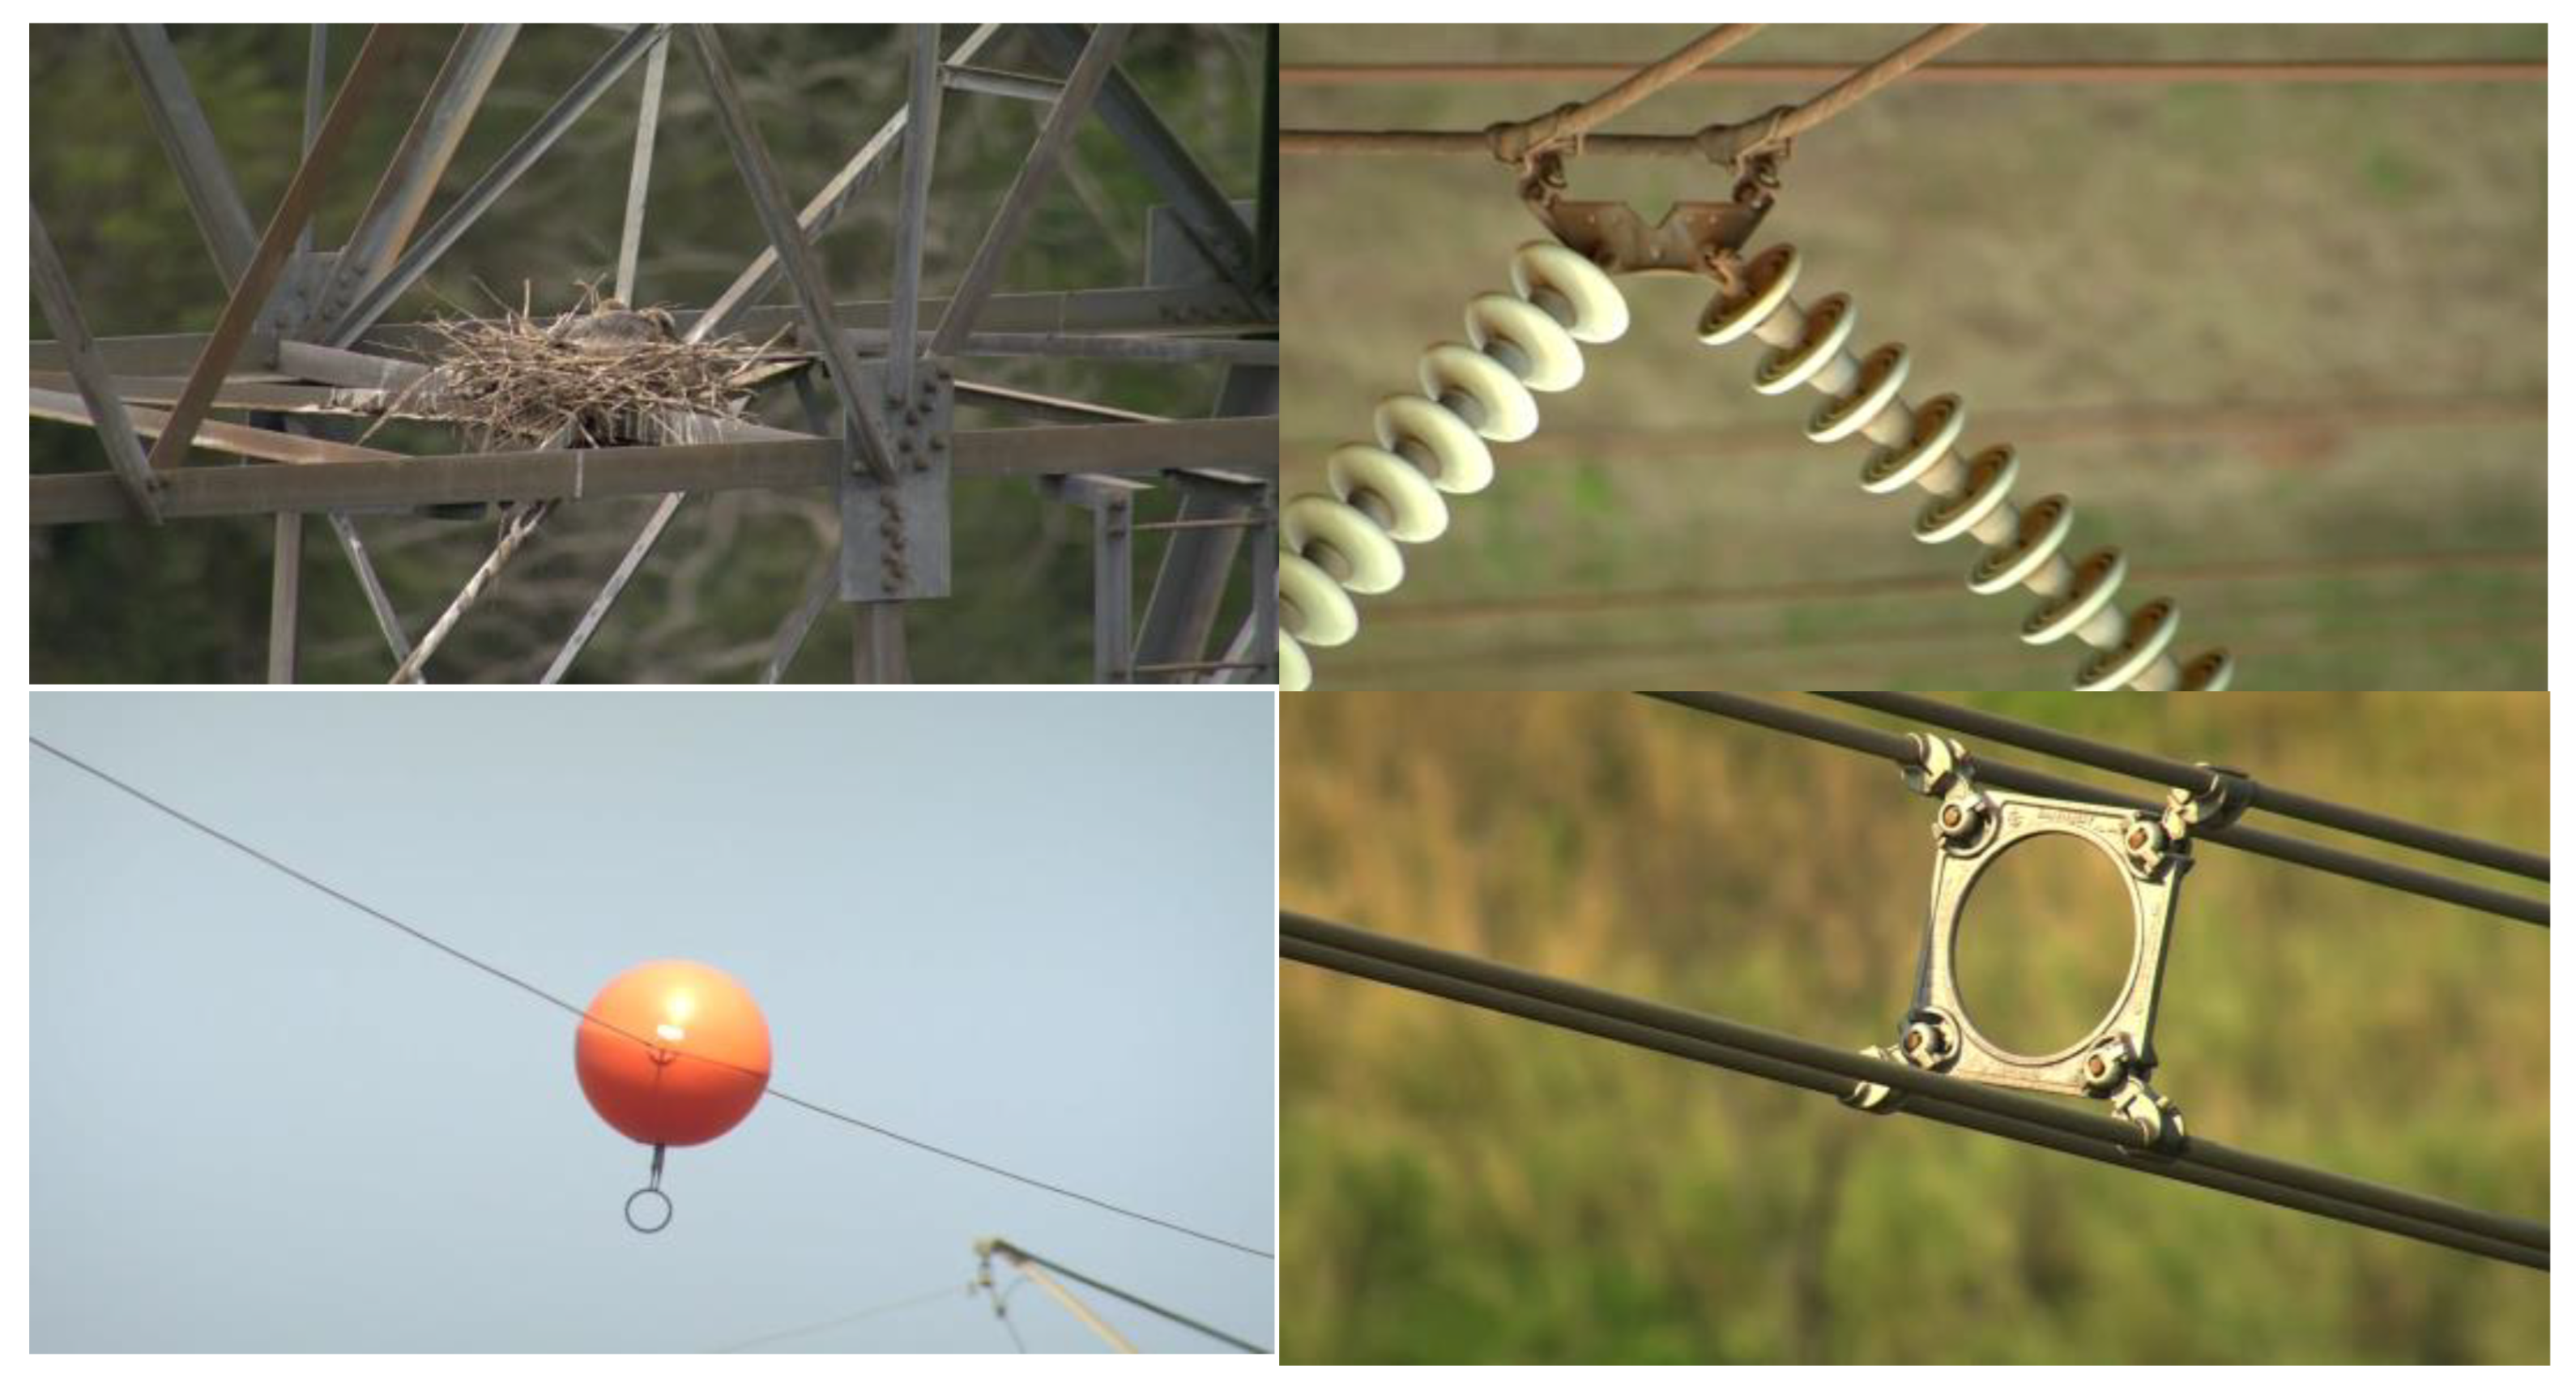
- PTL-AI Furnas Dataset: Aerial photography-based datasets. The PTL-AI Furnas Dataset consists of a drone performing image acquisition of electrical equipment in different weather conditions, against different backgrounds. The dataset contains 6295 images of Baliser, Bird nest, Insulator, Spacer, and Stockbridge. These images are courtesy of Furnas, a Brazilian home-generation transmission company. For a detailed description of the dataset see Appendix A. Figure 4 shows some sample images from the dataset [36].
 Figure 4. Picture samples in the PTL-AI Furnas Dataset.
- (2)
- Experimental equipment and result analysis: This experiment was conducted on the Linux system. The processor is the Intel(R) Core (TM) i5-11400F @ 2.60GHz. The GPU uses the NVIDIA GeForce RTX 3080 Ti, CUDA11.3. This deep learning network framework leverages PyTorch, and Python3.8. Training outcomes may vary depending on the equipment used.
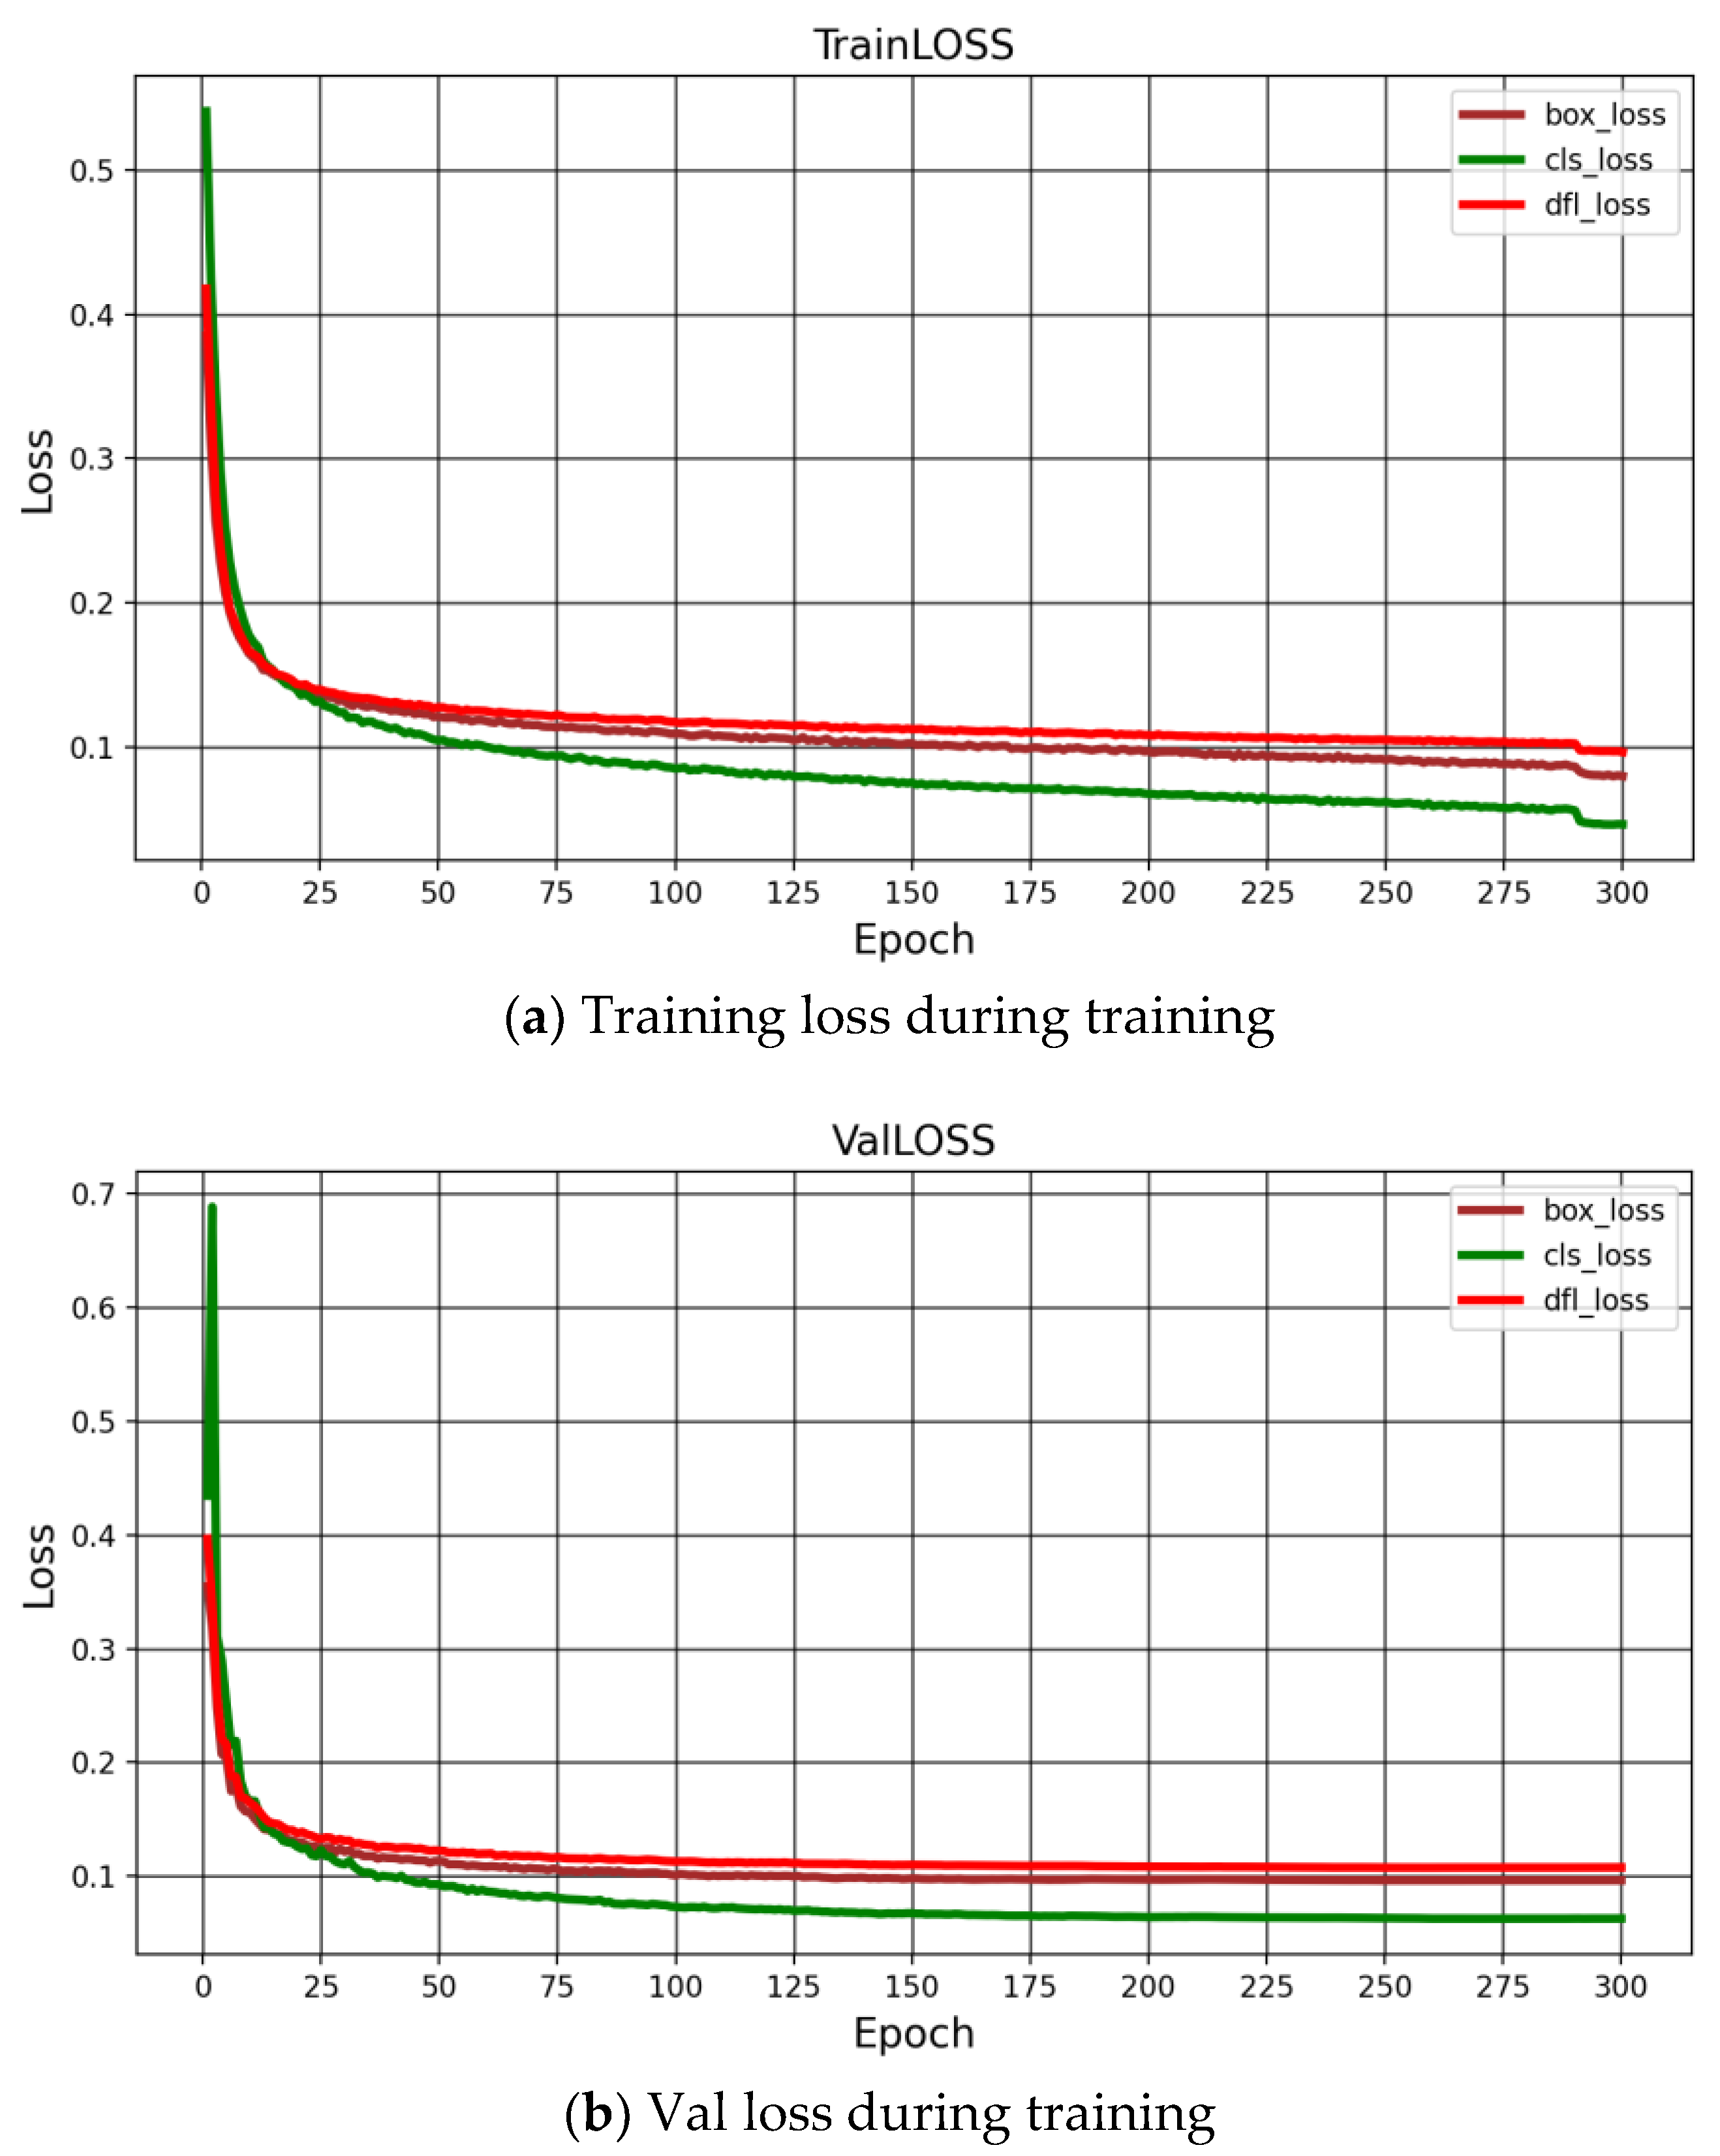
In the training process, the parameters are set as follows: the batch size is 12; the training period is 300 epochs; the training image size is 640 × 640; training is done using hybrid training precision fp32; the IoU is 0.7; the momentum is 0.937; the initial learning rate is 0.01; the GPU training graphics card model is the NVIDIA GeForce RTX 3080 Ti, with 8-threaded operation. The CUDA version is 11.3, and the optimizer is selected as Adam. Figure 5a shows the graph of the improved YOLOv10 as the training set loss function of the training network, from which it can be seen that the loss decreases significantly during 25 training sessions and stabilizes after 25 training sessions. Figure 5b shows the improved YOLOv10 as training network validation set loss curve. It can be seen that the loss curve of the training set has a similar trend of decreasing significantly before 25 times and slowly after 25 times, which shows that the network is well trained and has good model generalization ability. In training, we split the dataset in the ratio of 7:3:1, and we initialized the model with random weights starting from zero. As a result, the loss values are higher in the first few training sessions.
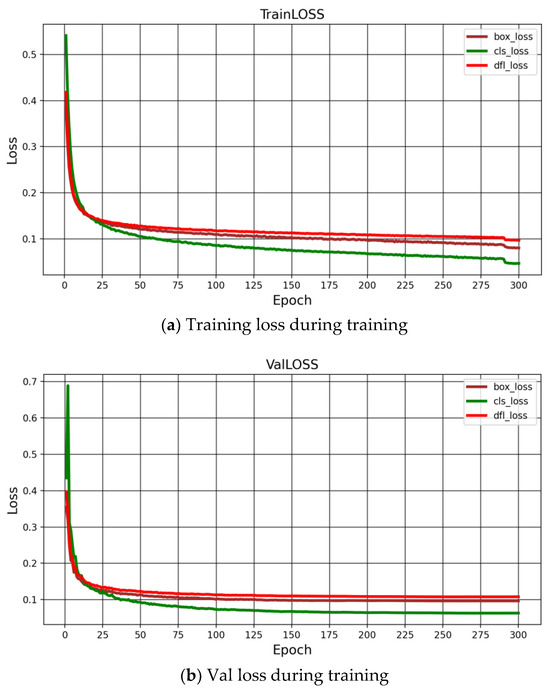
Figure 5.
Loss function plot for 300 training sessions.
The Intersection over Union (IoU) serves as an important metric in target detection, measuring the overlap between a predicted bounding box and the corresponding ground truth box. It represents the ratio of the overlap area between the predicted and actual frames to the total area covered by both. IoU can be expressed as
where denotes the image predicted after the network and denotes the ground truth. The threshold is set to 0.7 and when the prediction result of the model is greater than 0.7, it is considered as a positive sample. The confidence frame scores are filtered within the local region, the highest scoring candidate frame is retained, and the retained and remaining candidate frames are subjected to an IoU calculation using Equation (9). The confidence in the header network is sorted, and one candidate frame with high confidence in the one-to-one detection header and ten candidate frames with high confidence in the one-to-many detection header are retained.
This paper uses Average Precision (AP) and mean Average Precision (mAP) for evaluation. The formulas for recall and precision at various recall values are defined as follows:
where denotes the recall, refers to the number of true positives, and is the total number of samples detected in a category (including false positives). denotes the precision of predicted samples at a given recall rate, and denotes the total number of samples in a given category (including samples that were not correctly predicted).
Taking 0.1 as the interval between 0 and 1, the accuracy is averaged to get AP, which is calculated as follows:
Table 1 shows the values of the two metrics mAP@0.5 and mAP@[0.5, 0.95] on the VOC dataset. The VOC dataset contains a total of 20 categories of real-world scenarios. The data in Table 1 are derived by validating a test set of 4952 images after training on 16,551 images. As can be seen from Table 1, our method outperforms the other three methods in terms of mAP@0.5 metrics; our method improves by 0.2%, 2.9%, and 3.9%, respectively, compared to the other three methods. The improvements in the mAP@[0.5, 0.95] metric are 1.2%, 4.9%, and 18.2%, respectively.

Table 1.
Comparison of the mAP@0.5 and mAP@[0.5, 0.95] of the four methods on VOC2007+2012 [37].
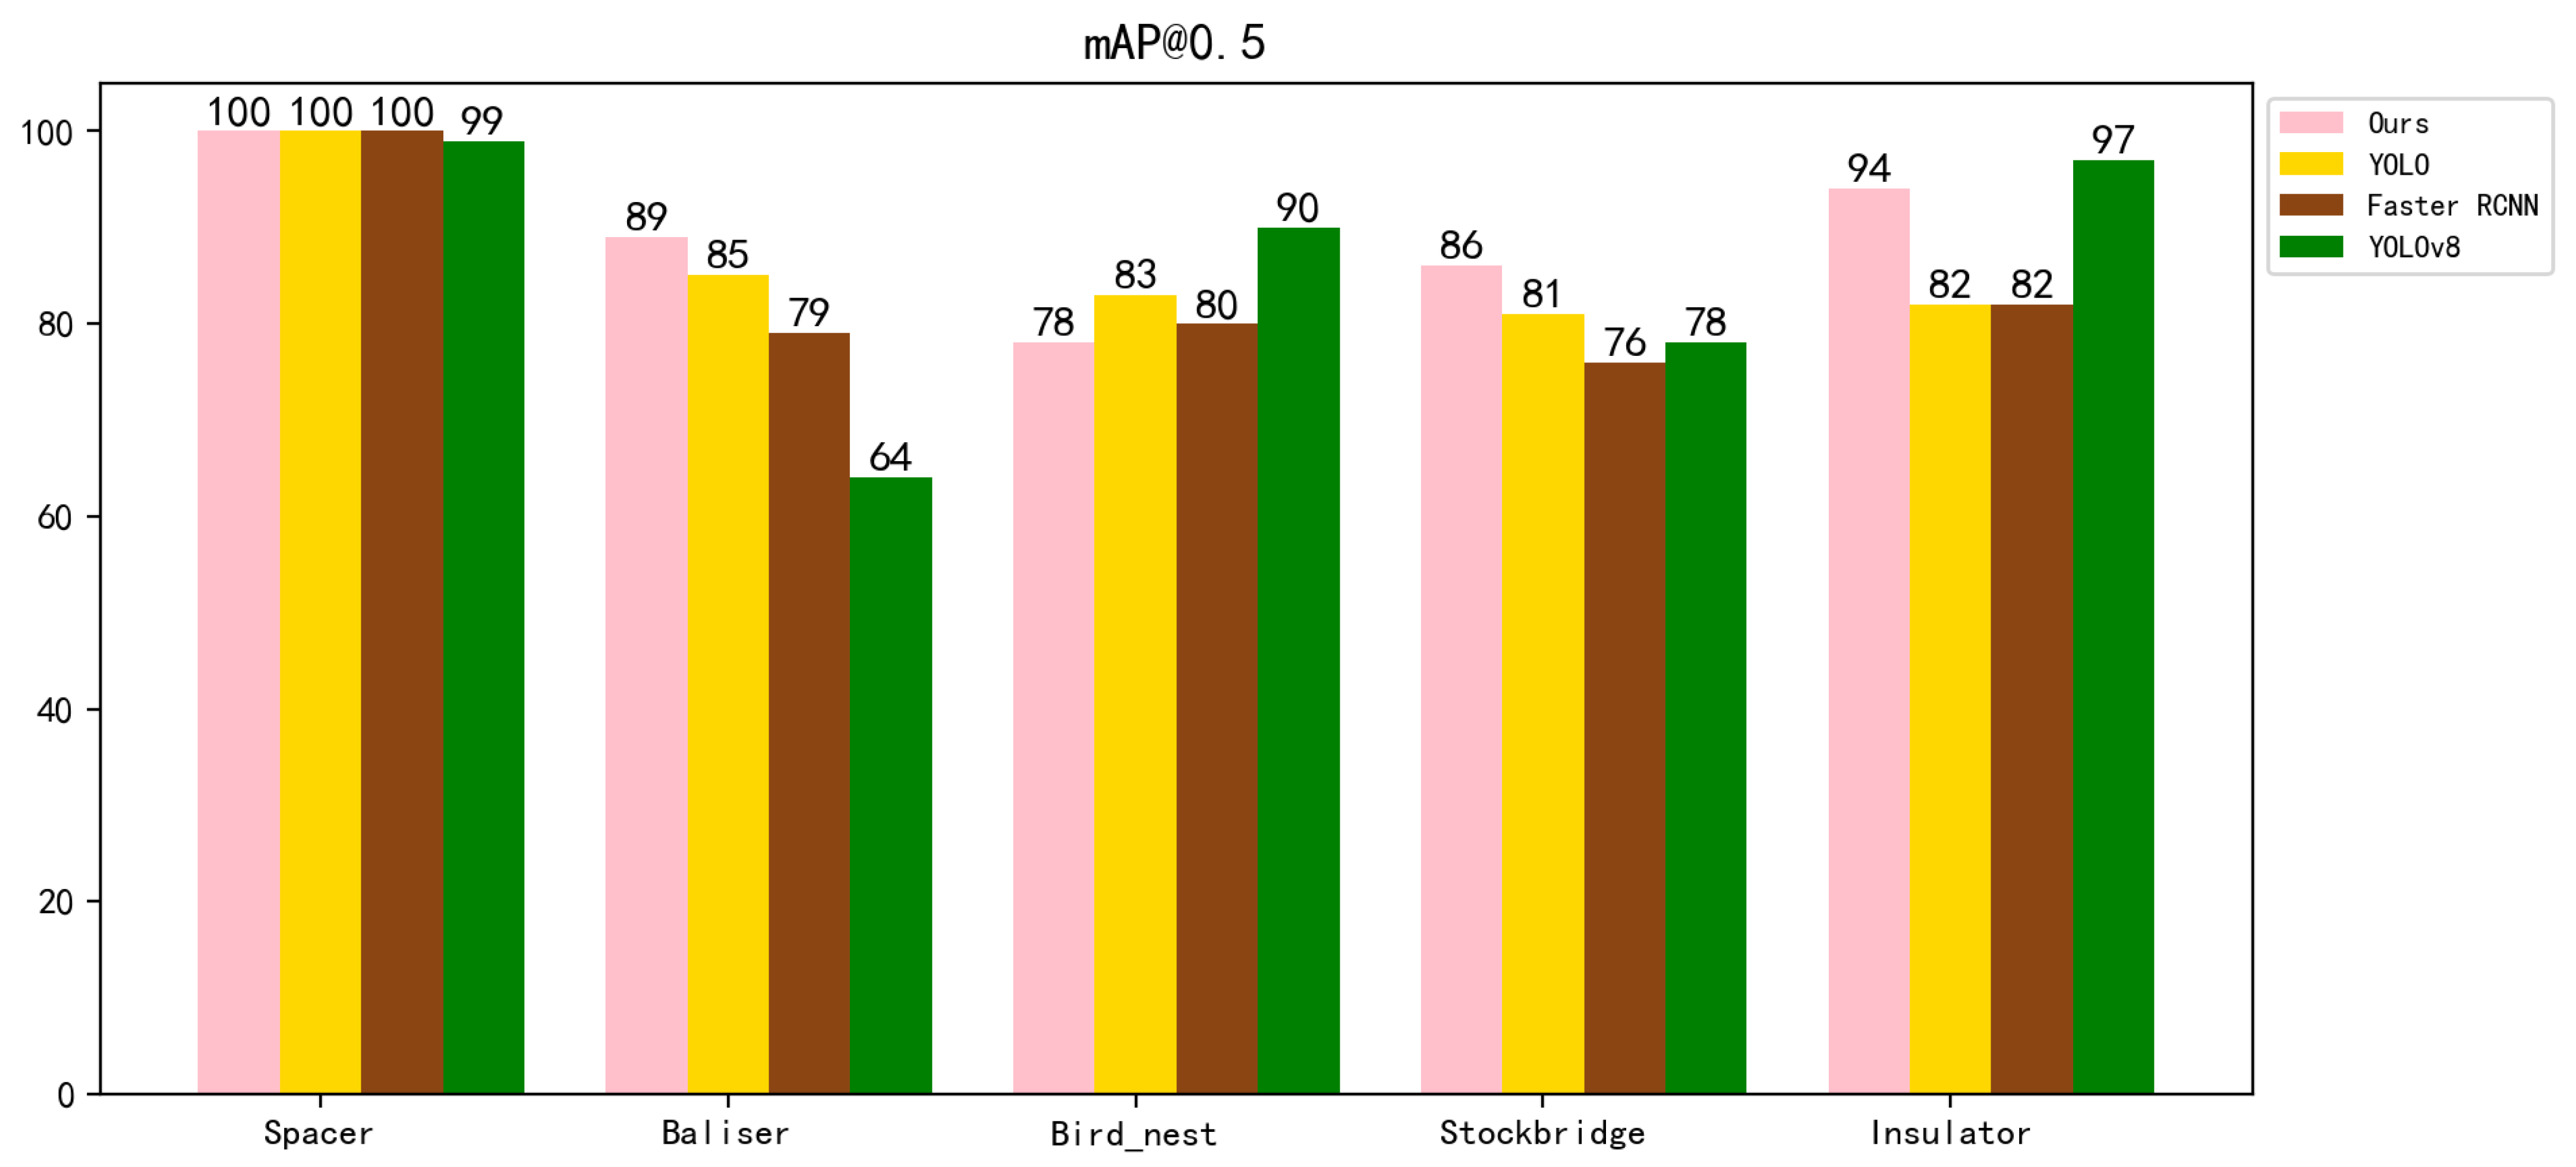
The AP and mAP for different categories are shown in Table 2. These values are obtained through validation on a test set of 1132 images after training on 3962 images. Table 2 shows that our method outperforms the other three methods in all five categories. Specifically, in the Spacer category, all three networks achieve a high accuracy of 100%, with YOLOv8 reaching 99%. In the Baliser category, our method improves over the other three methods by 4%, 25% and 10% respectively. In the Bird_nest category, our proposed method is inferior to the other three networks, while in the Stockbridge category, our method improves over the other three methods by 5%, 8%, and 10%, respectively. In the Insulator category, our method improves by 8% compared to the other methods and performs less well than YOLOv8. The mAP@0.5 value improves by 3.2% compared to YOLOv10, 3.8% compared to YOLOv8, and 6% compared to Faster R-CNN. The mAP@[0.5,0.95] values were improved by 5.2%, 2.8%, and 5.9%, respectively, compared to the other three methods. It is worth noting that the combined level of the improved network in this paper is better than those of the other three networks. The experimental data show that our improved network can further focus the feature information and improve the recognition accuracy.
Table 2.
Comparison of the AP and mAP of the four methods on electrical datasets.
As shown in Figure 6, it visualizes the effect of our method compared to YOLOv10 [17], YOLOv8, and Faster RCNN. In the literature [15], VGG-16 serves as a feature extraction network, but the issue of gradient vanishing can arise with an increase in network depth. To solve this problem, the literature [39] adopts ResNet50 for feature extraction and adds jump connections to alleviate the gradient vanishing problem, and at the same time, effectively utilizes the low-level feature information so as to achieve deeper feature learning. To further study the recognition effect of small target objects using the YOLO algorithm, the literature [17] uses YOLOv10 as the target detection network to achieve a lightweight design. This paper, based on the literature [39], introduces the transformer to further deepen the feature network and the self-attention mechanism to enhance feature focus. At the same time, the ECA attention mechanism module is introduced at the end of the backbone network to further distribute feature weights, enhancing the feature expression capability.
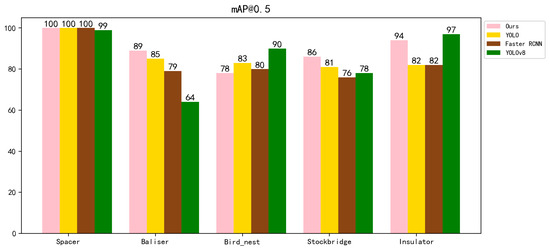
Figure 6.
Visual comparison of AP and mAP for four different methods.
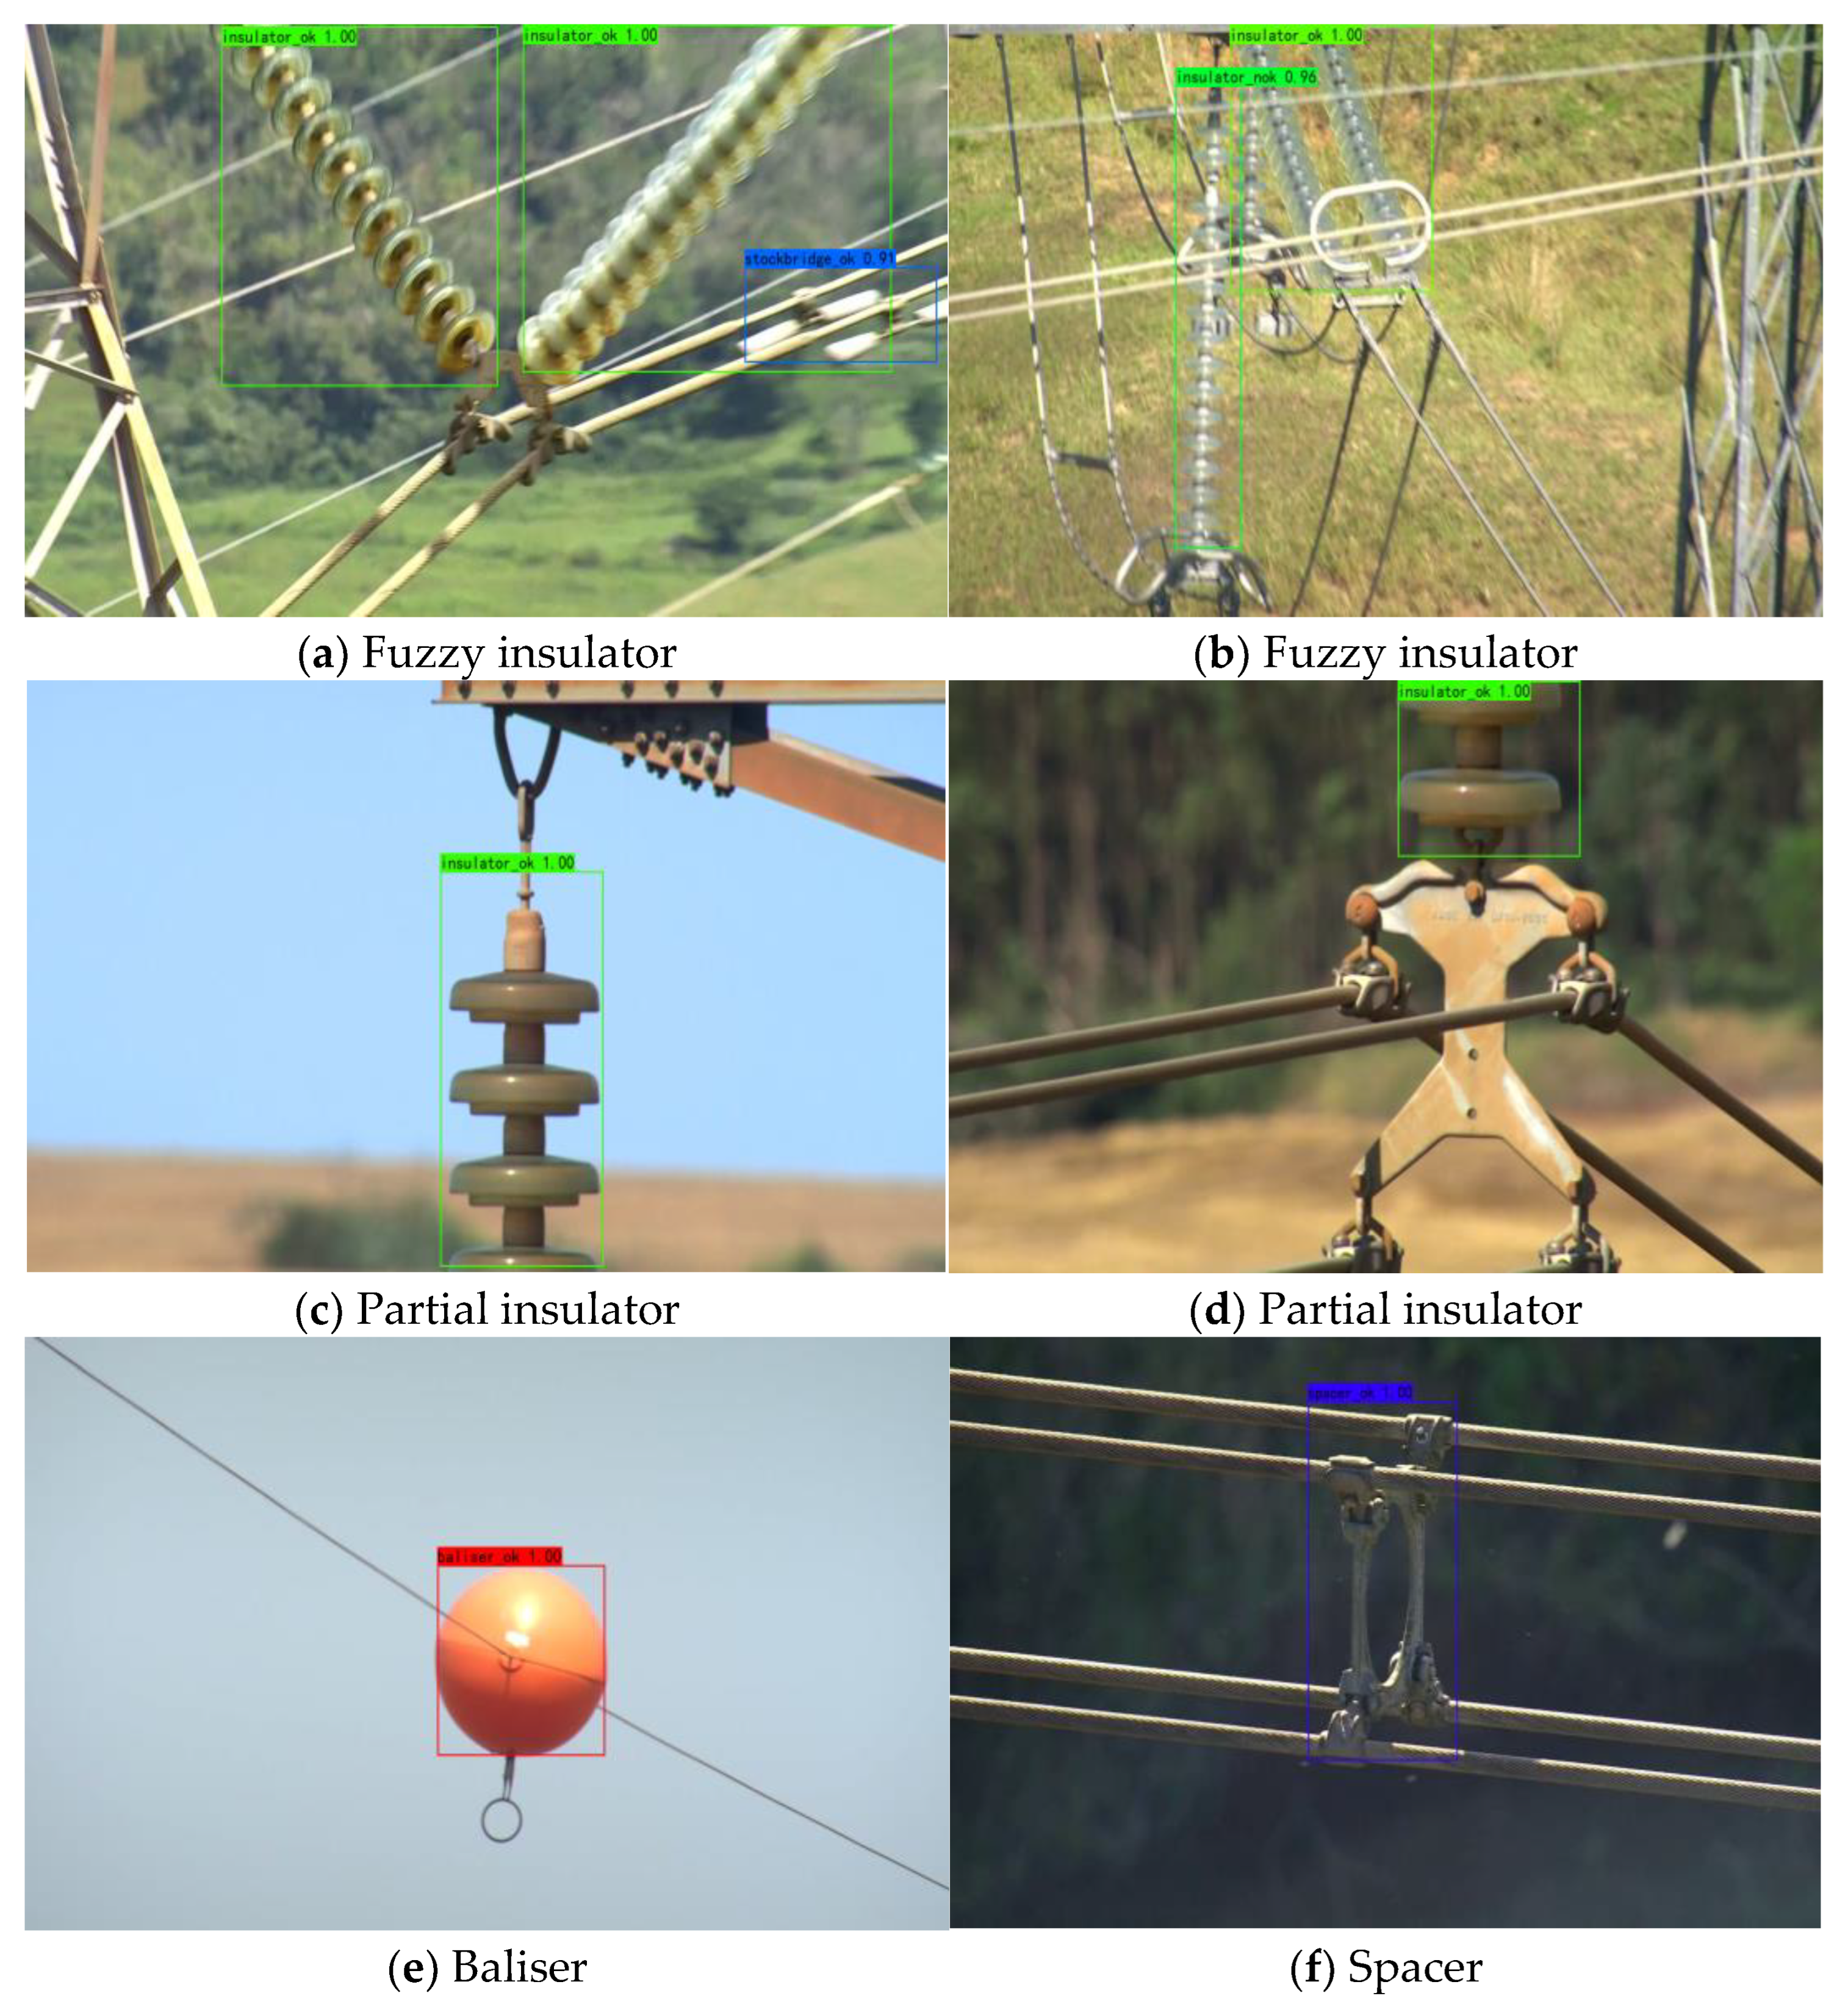
As shown in Figure 7, our method detects the results of electrical equipment images after training. Figure 7a displays the detection results for insulator images. It is evident that the recognition accuracy remains high even for fuzzy insulators. Notably, the small fuzzy Stockbridge object in the lower right part of the image is also recognized accurately. The ability to accurately identify the insulator image despite the presence of an object occlusion can be seen in Figure 7b, which demonstrates the ability of our network to accurately correspond to the features based on some of the objects to identify to the object. Some of the insulator images are shown in Figure 7c,d. Our network can accurately and efficiently identify the corresponding object from its part, as shown in the figure with the recognized insulator image. Figure 7e shows the recognition baliser, which can accurately identify small target objects. Figure 7f illustrates the accurate recognition results for spacer images, and it is worth mentioning that the recognition accuracy is up to 100% for the spacer class among 1132 mixed-category images during the network validation test in Table 2.
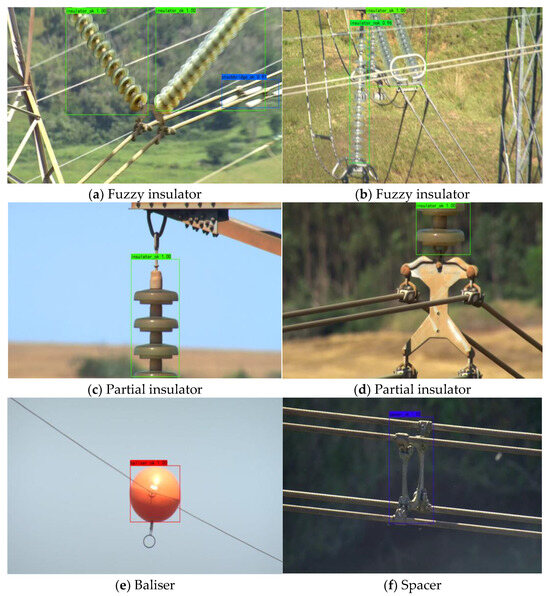
Figure 7.
Results of the various types of images in the dataset recognized by our model after training.
Figure 8 shows the effects of multiple targets and complex backgrounds on target recognition. As shown in Figure 8a, the image contains a partial insulator and three stockbridge target objects, all of which can be accurately recognized, further verifying the ability of our network to accurately determine the object class based on part of the object, as well as its effectiveness in recognizing objects with small targets and achieving a high accuracy rate for small targets as well. One occluded insulator and one un-occluded insulator are shown in Figure 8b, showing accurate identification of the un-occluded insulator. Our network can still accurately detect the occluded insulator based on the exposed part, regardless of the occluding tower. In Figure 8c, the image shows three insulators and a bird’s nest, where two insulators are only partially visible, and one is obscured by a pole tower, also only partially exposed. It is noteworthy to accurately detect the obscured insulators and only partially exposed. Figure 8d shows two insulators and three small target objects, specifically stockbridge devices, one of which is partially exposed. The ability to efficiently and accurately detect the categories to which the various objects in the figure belong demonstrates the detection capability of our network.
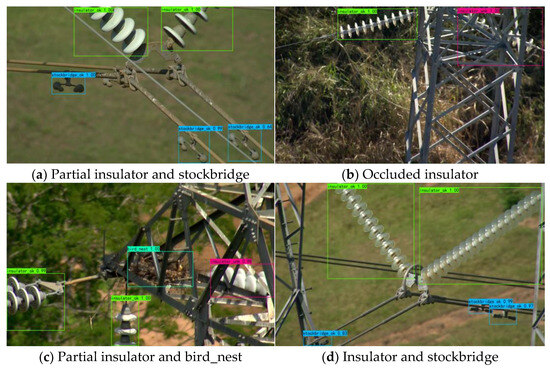
Figure 8.
Complex background or multi-target object detection effects.
5. Conclusions
Due to the continuous increase in power equipment in recent years and the high demand for inspections, traditional manual classification methods, which are inefficient, can no longer meet current needs. Therefore, applying deep learning to classify electrical equipment provides essential support for tasks such as inspection. In this paper, several optimization measures were proposed to improve the YOLOv10 model, including constructing the ECA attention mechanism, constructing the C3TR module, and fusing it into the feature extraction network to enhance detection accuracy. The ECA attention mechanism was introduced at the end of the backbone network to globally pool the feature map, enhance the global expression capability, and further assign channel weights to enhance the feature expression capability. In addition, the C3TR module was introduced into the feature extraction network. It combined the Transformer’s self-attention mechanism for modeling to deepen the network and better extract contextual information, thereby improving the feature expression ability. Furthermore, the multi-head attention mechanism was introduced to parallelize feature segmentation, which improved computational efficiency and fully extracted features. The experimental results showed that the detection accuracy of electrical equipment was significantly improved. The mAP of the improved network reached 89.4%, which was 3.2% higher than that of the traditional network. Notably, 100% accuracy was achieved for individual categories. Future work will focus on exploring more advanced methods and expanding the dataset to enhance network generalization.
Author Contributions
Original draft preparation and editing, J.D.; supervision and polishing, X.G. and X.L.; Validation, D.J. and J.W. All authors have read and agreed to the published version of the manuscript.
Funding
This research was supported by the Natural Science Basic Research Program of Shaanxi (No. 2024JC-YBQN-0495).
Data Availability Statement
Data are contained within the article.
Conflicts of Interest
The authors declare no conflicts of interest.
Appendix A
Descriptive Statistics of the PTL-AI Furnas Dataset
- Dataset Name: PTL-AI Furnas Dataset
- Total Number of Images: 6295
- Image Resolution: 1280 × 720
- Number of Annotated Components: 17,808
- Classes: Insulator, Baliser, Bird Nest, Spacer, Stockbridge
These images in the dataset were taken in a variety of backgrounds and climatic conditions and reflect the actual conditions encountered during aerial inspections of transmission lines. The resolution of all images was 1280 × 720 pixels, and the image format was JPEG.
In order to enhance the robustness of the model and to simulate different conditions, data enhancement techniques were used in the production of this dataset, including scaling, translation, rotation, shearing, and other transformations. In our experiments, all input images were uniformly resized to 640 × 640 pixels for processing. The dataset was partitioned into 7:3:1 for training, validation, and testing, respectively.
The PTL-AI Furnas dataset provides a rich and diverse set of images for transmission line fault detection. The descriptive statistics highlight its comprehensiveness, with a large number of annotated components across different classes. The inclusion of data augmentation techniques further enhances its usefulness for training robust object detection models. We hope these descriptive statistics offer a clear and detailed understanding of the dataset used in our study. The dataset is publicly available on the PTL-AI Furnas dataset GitHub (https://github.com/freds0/PTL-AI_Furnas_Dataset (accessed on 9 February 2025)), allowing further reference and use by the research community.
This appendix provides a comprehensive overview of the PTL-AI Furnas dataset, addressing the reviewer’s request for descriptive statistics. It includes detailed dataset information, ensuring the transparency and reproducibility of our study.
References
- Jiang, Q.; Liu, Y.; Yan, Y.; Deng, J.; Fang, J.; Li, X.; Jiang, X. A Contour Angle Orientation for Power Equipment Infrared and Visible Image Registration. IEEE Trans. Power Deliv. 2021, 36, 2559–2569. [Google Scholar] [CrossRef]
- Li, F.; Xin, J.; Chen, T.; Xin, L.; Wei, Z.; Li, Y.; Zhang, Y.; Jin, H.; Tu, Y.; Zhou, X.; et al. An Automatic Detection Method of Bird’s Nest on Transmission Line Tower Based on Faster_RCNN. IEEE Access 2020, 8, 164214–164221. [Google Scholar] [CrossRef]
- Saleem, Y.; Crespi, N.; Rehmani, M.H.; Copeland, R. Internet of Things-Aided Smart Grid: Technologies, Architectures, Applications, Prototypes, and Future Research Directions. IEEE Access 2019, 7, 62962–63003. [Google Scholar] [CrossRef]
- Yang, L.; Fan, J.; Liu, Y.; Li, E.; Peng, J.; Liang, Z. A Review on State-of-the-Art Power Line Inspection Techniques. IEEE Trans. Instrum. Meas. 2020, 69, 9350–9365. [Google Scholar] [CrossRef]
- Nguyen, V.N.; Jenssen, R.; Roverso, D. Intelligent Monitoring and Inspection of Power Line Components Powered by UAVs and Deep Learning. IEEE Power Energy Technol. Syst. J. 2019, 6, 11–21. [Google Scholar] [CrossRef]
- Ebrahimi, M.; Rastegar, M. Towards An Interpretable Data-driven Switch Placement Model in Electric Power Distribution Systems: An Explainable Artificial Intelligence-based Approach. Eng. Appl. Artif. Intell. 2024, 129, 107637. [Google Scholar] [CrossRef]
- Yan, Y.; Han, Y.; Qi, D.; Lin, J.; Yang, Z.; Jin, L. Multi-label Image Recognition for Electric Power Equipment Inspection Based on Multi-scale Dynamic Graph Convolution Network. Energy Rep. 2023, 9, 1928–1937. [Google Scholar] [CrossRef]
- Zhan, H.; Zhang, J.; Lan, Y.; Zhang, F.; Huang, Q.; Zhou, K.; Wan, C. Adaptive Enhancement of Thermal Infrared Images for High-Voltage Cable Buffer Layer Ablation. Processes 2024, 12, 2543. [Google Scholar] [CrossRef]
- Gong, X.; Yao, Q.; Wang, M.; Lin, Y. A Deep Learning Approach for Oriented Electrical Equipment Detection in Thermal Images. IEEE Access 2018, 6, 41590–41597. [Google Scholar] [CrossRef]
- Zhang, N.; Su, J.; Zhao, Y.; Chen, H. Insulator-YOLO: Transmission Line Insulator Risk Identification Based on Improved YOLOv5. Processes 2024, 12, 2552. [Google Scholar] [CrossRef]
- Gao, C.; Meng, D.; Yang, Y.; Wang, Y.; Zhou, X.; Hauptmann, A.G. Infrared Patch-Image Model for Small Target Detection in a Single Image. IEEE Trans. Image Process. 2013, 22, 4996–5009. [Google Scholar] [CrossRef] [PubMed]
- Fan, C.; Wang, W.; Cui, T.; Liu, Y.; Qiao, M. Research on Impact Prediction Model for Corn Ears by Integrating Motion Features Using Machine Learning Algorithms. Processes 2024, 12, 2362. [Google Scholar] [CrossRef]
- He, K.; Zhang, X.; Ren, S.; Sun, J. Deep Residual Learning for Image Recognition. In Proceedings of the IEEE Conference on Computer Vision and Pattern Recognition, Las Vegas, NV, USA, 27–30 June 2016; pp. 770–778. [Google Scholar]
- Kong, Y.; Shang, X.; Jia, S. Drone-DETR: Efficient Small Object Detection for Remote Sensing Image Using Enhanced RT-DETR Model. Sensors 2024, 24, 5496. [Google Scholar] [CrossRef]
- Girshick, R.; Donahue, J.; Darrell, T.; Malik, J. Rich Feature Hierarchies for Accurate Object Detection And Semantic Segmentation. In Proceedings of the IEEE Conference on Computer Vision and Pattern Recognition, Columbus, OH, USA, 23–28 June 2014; pp. 580–587. [Google Scholar]
- Ren, S.; He, K.; Girshick, R.; Sun, J. Faster R-CNN: Towards Real-time Object Detection with Region Proposal Networks. IEEE Trans. Pattern Anal. Mach. Intell. 2016, 39, 1137–1149. [Google Scholar] [CrossRef] [PubMed]
- Chen, Z.; Guo, H.; Yang, J.; Jiao, H.; Feng, Z.; Chen, L.; Gao, T. Fast Vehicle Detection Algorithm in Traffic Scene Based on Improved SSD. Measurement 2022, 201, 111655. [Google Scholar] [CrossRef]
- Wang, A.; Chen, H.; Liu, L. Yolov10: Real-time end-to-end object detection. arXiv 2024, arXiv:2405.14458. [Google Scholar]
- Woo, S.; Park, J.; Lee, J.Y.; Kweon, I.S. Cbam: Convolutional Block Attention Module. In Proceedings of the European Conference on Computer Vision (ECCV), Munich, Germany, 8–14 September 2018; pp. 3–19. [Google Scholar]
- Wang, Q.; Wu, B.; Zhu, P.; Li, P.; Zuo, W.; Hu, Q. ECA-Net: Efficient Channel Attention for Deep Convolutional Neural Networks. In Proceedings of the IEEE/CVF Conference on Computer Vision and Pattern Recognition (CVPR), Seattle, WA, USA, 13–19 June 2020; pp. 11531–11539. [Google Scholar]
- Vaswani, A. Attention is all you need. Adv. Neural Inf. Process. Syst. 2017. [Google Scholar]
- Pellicanó, D.; Palamara, I.; Cacciola, M.; Calcagno, S.; Versaci, M.; Morabito, F.C. Fuzzy Similarity Measures for Detection and Classification of Defects in CFRP. IEEE Trans. Ultrason. Ferroelectr. Freq. Control 2013, 60, 1917–1927. [Google Scholar] [CrossRef]
- Morabito, E.C.; Versaci, M. A Fuzzy Neural Approach to Localizing Holes in Conducting Plates. IEEE Trans. Magn. 2001, 37, 3534–3537. [Google Scholar] [CrossRef]
- Sayed, A.; Alshathri, S.; Hemdan, E.E.-D. Conditional Generative Adversarial Networks with Optimized Machine Learning for Fault Detection of Triplex Pump in Industrial Digital Twin. Processes 2024, 12, 2357. [Google Scholar] [CrossRef]
- Fahim, F.; Hasan, M.S. Enhancing The Reliability of Power Grids: A YOLO Based Approach for Insulator Defect Detection. E-Prime—Adv. Electr. Eng. Electron. Energy 2024, 9, 100663. [Google Scholar] [CrossRef]
- Li, S.; Wang, Z.; Lv, Y.; Liu, X. Improved YOLOv5s-based Algorithm for Foreign Object Intrusion Detection on Overhead Transmission Lines. Energy Rep. 2024, 11, 6083–6093. [Google Scholar] [CrossRef]
- Tao, X.; Zhang, D.; Wang, Z.; Liu, X.; Zhang, H.; Xu, D. Detection of Power Line Insulator Defects Using Aerial Images Analyzed With Convolutional Neural Networks. IEEE Trans. Syst. Man Cybern. Syst. 2020, 50, 1486–1498. [Google Scholar] [CrossRef]
- Zhang, Z.D.; Zhang, B.; Lan, Z.C.; Liu, H.C.; Li, D.Y.; Pei, L.; Yu, W.X. FINet: An Insulator Dataset and Detection Benchmark Based on Synthetic Fog and Improved YOLOv5. IEEE Trans. Instrum. Meas. 2022, 71, 1–8. [Google Scholar] [CrossRef]
- Lei, X.; Sui, Z. Intelligent Fault Detection of High Voltage Line Based on The Faster R-CNN. Measurement 2019, 138, 379–385. [Google Scholar] [CrossRef]
- Sadykova, D.; Pernebayeva, D.; Bagheri, M.; James, A. IN-YOLO: Real-Time Detection of Outdoor High Voltage Insulators Using UAV Imaging. IEEE Trans. Power Deliv. 2020, 35, 1599–1601. [Google Scholar] [CrossRef]
- Hu, J.; Shen, L.; Sun, G. Squeeze-and-Excitation Networks. In Proceedings of the IEEE Conference on Computer Vision and Pattern Recognition, Salt Lake City, UT, USA, 18–23 June 2018; pp. 7132–7141. [Google Scholar]
- Li, W.; Qi, F.; Tang, M.; Yu, Z. Bidirectional LSTM with Self-attention Mechanism and Multi-channel Features for Sentiment Classification. Neurocomputing 2020, 387, 63–77. [Google Scholar] [CrossRef]
- Liu, Y.; Lv, B.; Jin, X.; Chen, X.; Zhang, X. TBFormer: Two-Branch Transformer for Image Forgery Localization. IEEE Signal Process. Lett. 2023, 30, 623–627. [Google Scholar] [CrossRef]
- Ganapathi, I.; Javed, S.; Ali, S.; Mahmood, A.; Vu, N.; Werghi, N. Learning to Localize Image Forgery Using End-to-End Attention Network. Neurocomputing 2022, 512, 25–39. [Google Scholar] [CrossRef]
- Wang, J.; Wu, Z.; Chen, J.; Han, X.; Shrivastava, A.; Lim, S.N.; Jiang, Y.G. Object Former for Image Manipulation Detection and Localization. In Proceedings of the IEEE/CVF Conference on Computer Vision and Pattern Recognition (CVPR), Seattle, WA, USA, 13–19 June 2022; pp. 2354–2363. [Google Scholar]
- De Oliveira, F.S.; De Carvalho, M.; Campos, P.H.T.; Soares, A.D.S.; Júnior, A.C.; Quirino, A.C.R.D.S. PTL-AI Furnas Dataset: A Public Dataset for Fault Detection in Power Transmission Lines Using Aerial Images. In Proceedings of the 2022 35th SIBGRAPI Conference on Graphics, Patterns and Images (SIBGRAPI), Natal, Brazil, 24–27 October 2022; Volume 1, pp. 7–12. [Google Scholar]
- Everingham, M.; Van Gool, L.; Williams, C.K.I.; Winn, J.; Zisserman, A. The Pascal Visual Object Classes (voc) challenge. Int. J. Comput. Vis. 2010, 88, 303–338. [Google Scholar] [CrossRef]
- Wang, H.; Liu, C.; Cai, Y.; Chen, L.; Li, Y. YOLOv8-QSD: An Improved Small Object Detection Algorithm for Autonomous Vehicles Based on YOLOv8. IEEE Trans. Instrum. Meas. 2024, 73, 1–16. [Google Scholar] [CrossRef]
- Liu, X.; Du, J.; Gao, X.; Xue, H.; Wu, H.; Ha, R. Electrical Equipment Classification via Improved Faster Region-based Convolutional Neural Network. In Proceedings of the 2024 36th Chinese Control and Decision Conference (CCDC), Xi’an, China, 25–27 May 2024; pp. 5956–5961. [Google Scholar]


Disclaimer/Publisher’s Note: The statements, opinions and data contained in all publications are solely those of the individual author(s) and contributor(s) and not of MDPI and/or the editor(s). MDPI and/or the editor(s) disclaim responsibility for any injury to people or property resulting from any ideas, methods, instructions or products referred to in the content. |
© 2025 by the authors. Licensee MDPI, Basel, Switzerland. This article is an open access article distributed under the terms and conditions of the Creative Commons Attribution (CC BY) license (https://creativecommons.org/licenses/by/4.0/).