Article

Study on the Influence of Crystal Plugging on the Mechanical Behavior of Karst Tunnel Lining Structure

1
Chongqing Yuxiang Double Line Expressway Co., Ltd., Chongqing 408515, China
2
College of Civil Engineering, Chongqing Jiaotong University, Chongqing 400074, China
3
The Third Engineering Co., Ltd. of China Railway 12th Bureau Group, Taiyuan 030024, China
4
China Merchants Chongqing Communications Technology Research & Design Institute Co., Ltd., Chongqing 400067, China
*
Author to whom correspondence should be addressed.
Processes 2025, 13(2), 568; https://doi.org/10.3390/pr13020568
Submission received: 11 January 2025 / Revised: 11 February 2025 / Accepted: 13 February 2025 / Published: 17 February 2025
(This article belongs to the Section Materials Processes)

Abstract

:
The blockage of a tunnel drainage system has a significant impact on the stability and operation safety of a tunnel lining structure. In this paper, changes in the pore water pressure, stress and displacement of a tunnel lining under different blocking conditions are studied by means of indoor test and numerical simulation. The results show that the calcium carbonate crystallization phenomenon in the tunnel’s initial support concrete gradually appears with the passage of time, which leads to a decline in concrete quality and has a negative impact on its compressive strength and elastic modulus. The pore water pressure, stress and displacement increase with the precipitation of calcium carbonate crystals and the intensification of drainage system blockage. However, the influence of calcium carbonate crystallization on pore water pressure, stress and displacement is relatively limited within 40 days. The study provides a reference for tunnel construction in complex geological environments.

1. Introduction

In the context of the development of underground construction science, the engineering quality and safety of tunnels and their associated facilities have become important research areas. With the acceleration of urbanization and the increasing demand for underground space development [1,2], the construction and maintenance of tunnel engineering face more complex challenges [3,4,5]. The crystallization blockage problem in tunnel drainage pipes, a common yet under-researched issue, gradually affects the stability and safety of tunnel structures due to changes in the groundwater environment, as well as material aging and corrosion during long-term use [6,7,8,9,10]. Therefore, in this context, in-depth research into the causes, mechanisms, and impacts of crystallization blockage in tunnel drainage pipes on the mechanical properties of tunnel linings is of great significance for ensuring the safe operation of tunnels, extending their service life, and improving the scientific level of underground construction.
Many scholars have analyzed the reasons for the leakage of tunnel lining from different point of view. Liu et al. [11] stated that the reasons for the leakage of tunnel lining include the following: uneven settlement of foundation, three-joint design and construction problems, collapse, over-excavation, under-excavation, backfill not being dense, the improper timing of waterproofing, drainage and support, concrete pouring quality, etc. Li et al. [12] believe that the causes of lining leakage include concrete cracking, the improper treatment of construction joints, the improper construction of tunnel lining waterproof boards, improper mix proportions of lining concrete, etc. Shi Jianxun [13] believe that construction design, poor environment, waterproof and drainage design, the surrounding rock and groundwater are the causes of lining leakage. To sum up, the causes of tunnel lining can be summarized under the following two points: one is the environmental and geological factors of the area where the tunnel is located, and the other is the deficiencies in the process of tunnel construction and maintenance. According to relevant statistics [14], most tunnel lining leakage is caused by a blockage of the drainage pipe. Such a blockage of the drainage pipe [15,16,17] is mainly due to the accumulation of calcium carbonate crystals under the influence of many factors, such as CO2 concentration, pipe shape, the permeability coefficient of the surrounding rock, tunnel geometry, flow velocity, the groundwater pH value and the content of calcium and magnesium ions in groundwater. With the continuous accumulation of calcium carbonate crystals, the calcium carbonate crystals continue to deposit in the tunnel drainage system after the tunnel drainage system is blocked, resulting in a decline in the tunnel drainage function, whereby the groundwater behind the lining cannot be discharged smoothly, and the bearing pressure increases. Under the action of water, the mechanical properties of surrounding rock around the tunnel gradually deteriorate. At the same time, due to the reaction between karst groundwater and the tunnel’s initial support concrete, the bearing capacity of the initial support decreases, and the surrounding rock pressure of the lining will also increase, thus causing the tunnel lining leakage [18,19,20]. Regarding the research methods for addressing tunnel lining water leakage, domestic and international scholars have proposed methods such as the “rod element method” [21], “pipe-instead-of-hole method” [22], “seam-instead-of-parallel method” [23], and “magnetic treatment” [24,25,26].
With the rapid development of underground construction science, related technological methods and theoretical models have been continuously improved. By employing numerical simulation methods to study changes in tunnel lining stress, displacement, and other parameters under different blockage conditions, predictive and evaluative tools can be provided for tunnel engineering. This paper uses numerical simulations to examine the variations in pore water pressure, stress, and displacement experienced by tunnel linings under different blockage scenarios, identifying the most detrimental crystallization blockage conditions. This research not only helps to elucidate the specific effects of crystallization blockage on the mechanical properties of tunnel linings, but also contributes to the technological advancement of underground engineering, and provides a theoretical foundation for the formulation of more scientific and effective prevention and control measures.

2. Experimental Study on the Influence of CaCO3 Crystallization on the Mechanical Properties of Initial Support Concrete for Karst Tunnel

2.1. Solution Preparation and Specimen Preparation

The test solution is here added along with excessive anhydrous calcium chloride and sodium bicarbonate to deionized water at a mass ratio of anhydrous calcium chloride and sodium bicarbonate of 1:2, so as to ensure that the HCO3 content in the solution is dominant. At the same time, the anhydrous calcium chloride and sodium bicarbonate will react with each other to form calcium carbonate. In order to eliminate the influence of this part of the calcium carbonate and ensure that the CO32−, HCO3 and Ca2+ in the solution exist in the form of ions, we place the solution aside for a period of time after adding the reagent, and take the upper clear solution as the test solution after the reaction is completed.
This test mainly studies the change of mechanical properties of tunnel initial support concrete after calcium carbonate crystallization. The strength grade of the initial support concrete prepared in the test was C25, and the materials used were mainly water, cement, gravel, fine sand and accelerator. The test sample size was 100 mm × 100 mm × 100 mm. A total of 5 groups of concrete samples were here prepared. In order to ensure the accuracy of the test, 4 samples were set for each group, and a total of 20 samples were prepared. According to the study by Tong et al. [27], a curing period of 28 days was selected. Specifically, the samples were demolded after 24 h and then placed in a standard curing room with a temperature of 25 °C ± 2 °C and a humidity of 95% ± 5%, where they were cured for 27 days. Regarding the preparation materials, the cement was the southwest brand Portland cement produced by China Building Materials Corporation, the accelerator was the accelerator produced by Baixingxing company, the particle size of the gravel was 5–20 mm, and the fine sand was fine sand purchased in Chongqing market.

2.2. Test Steps

We referred to the experimental methods of Liu et al. [28,29] and, based on the main research content of this paper, developed the following detailed testing procedures:
(1)
The prepared concrete sample was immersed in the test solution to produce crystallization. The test was divided into five groups, and each group was soaked for 0 d (blank control group), 10 d, 20 d, 30 d and 40 d, respectively. After the test time of each group of concrete samples was completed, the corresponding samples were taken out and dried for 24 h to carry out the follow-up test;
(2)
After the crystallization test, we took out the static dry sample for appearance inspection, and observed the crystallization precipitation and surface changes of the sample. After observation and recording, we cleaned the crystal on the surface of the sample, weighed the sample with an electronic scale with an accuracy of 0.1 g and recorded it, and calculated the average mass and mass damage rate of each group of samples;
(3)
Uniaxial compression tests with a stress loading rate of 0.5 mpa/s were carried out on different groups of samples. The changes of compressive strength and elastic modulus after crystallization were measured to evaluate the mechanical properties of concrete.

2.3. Indoor Test Results and Analysis

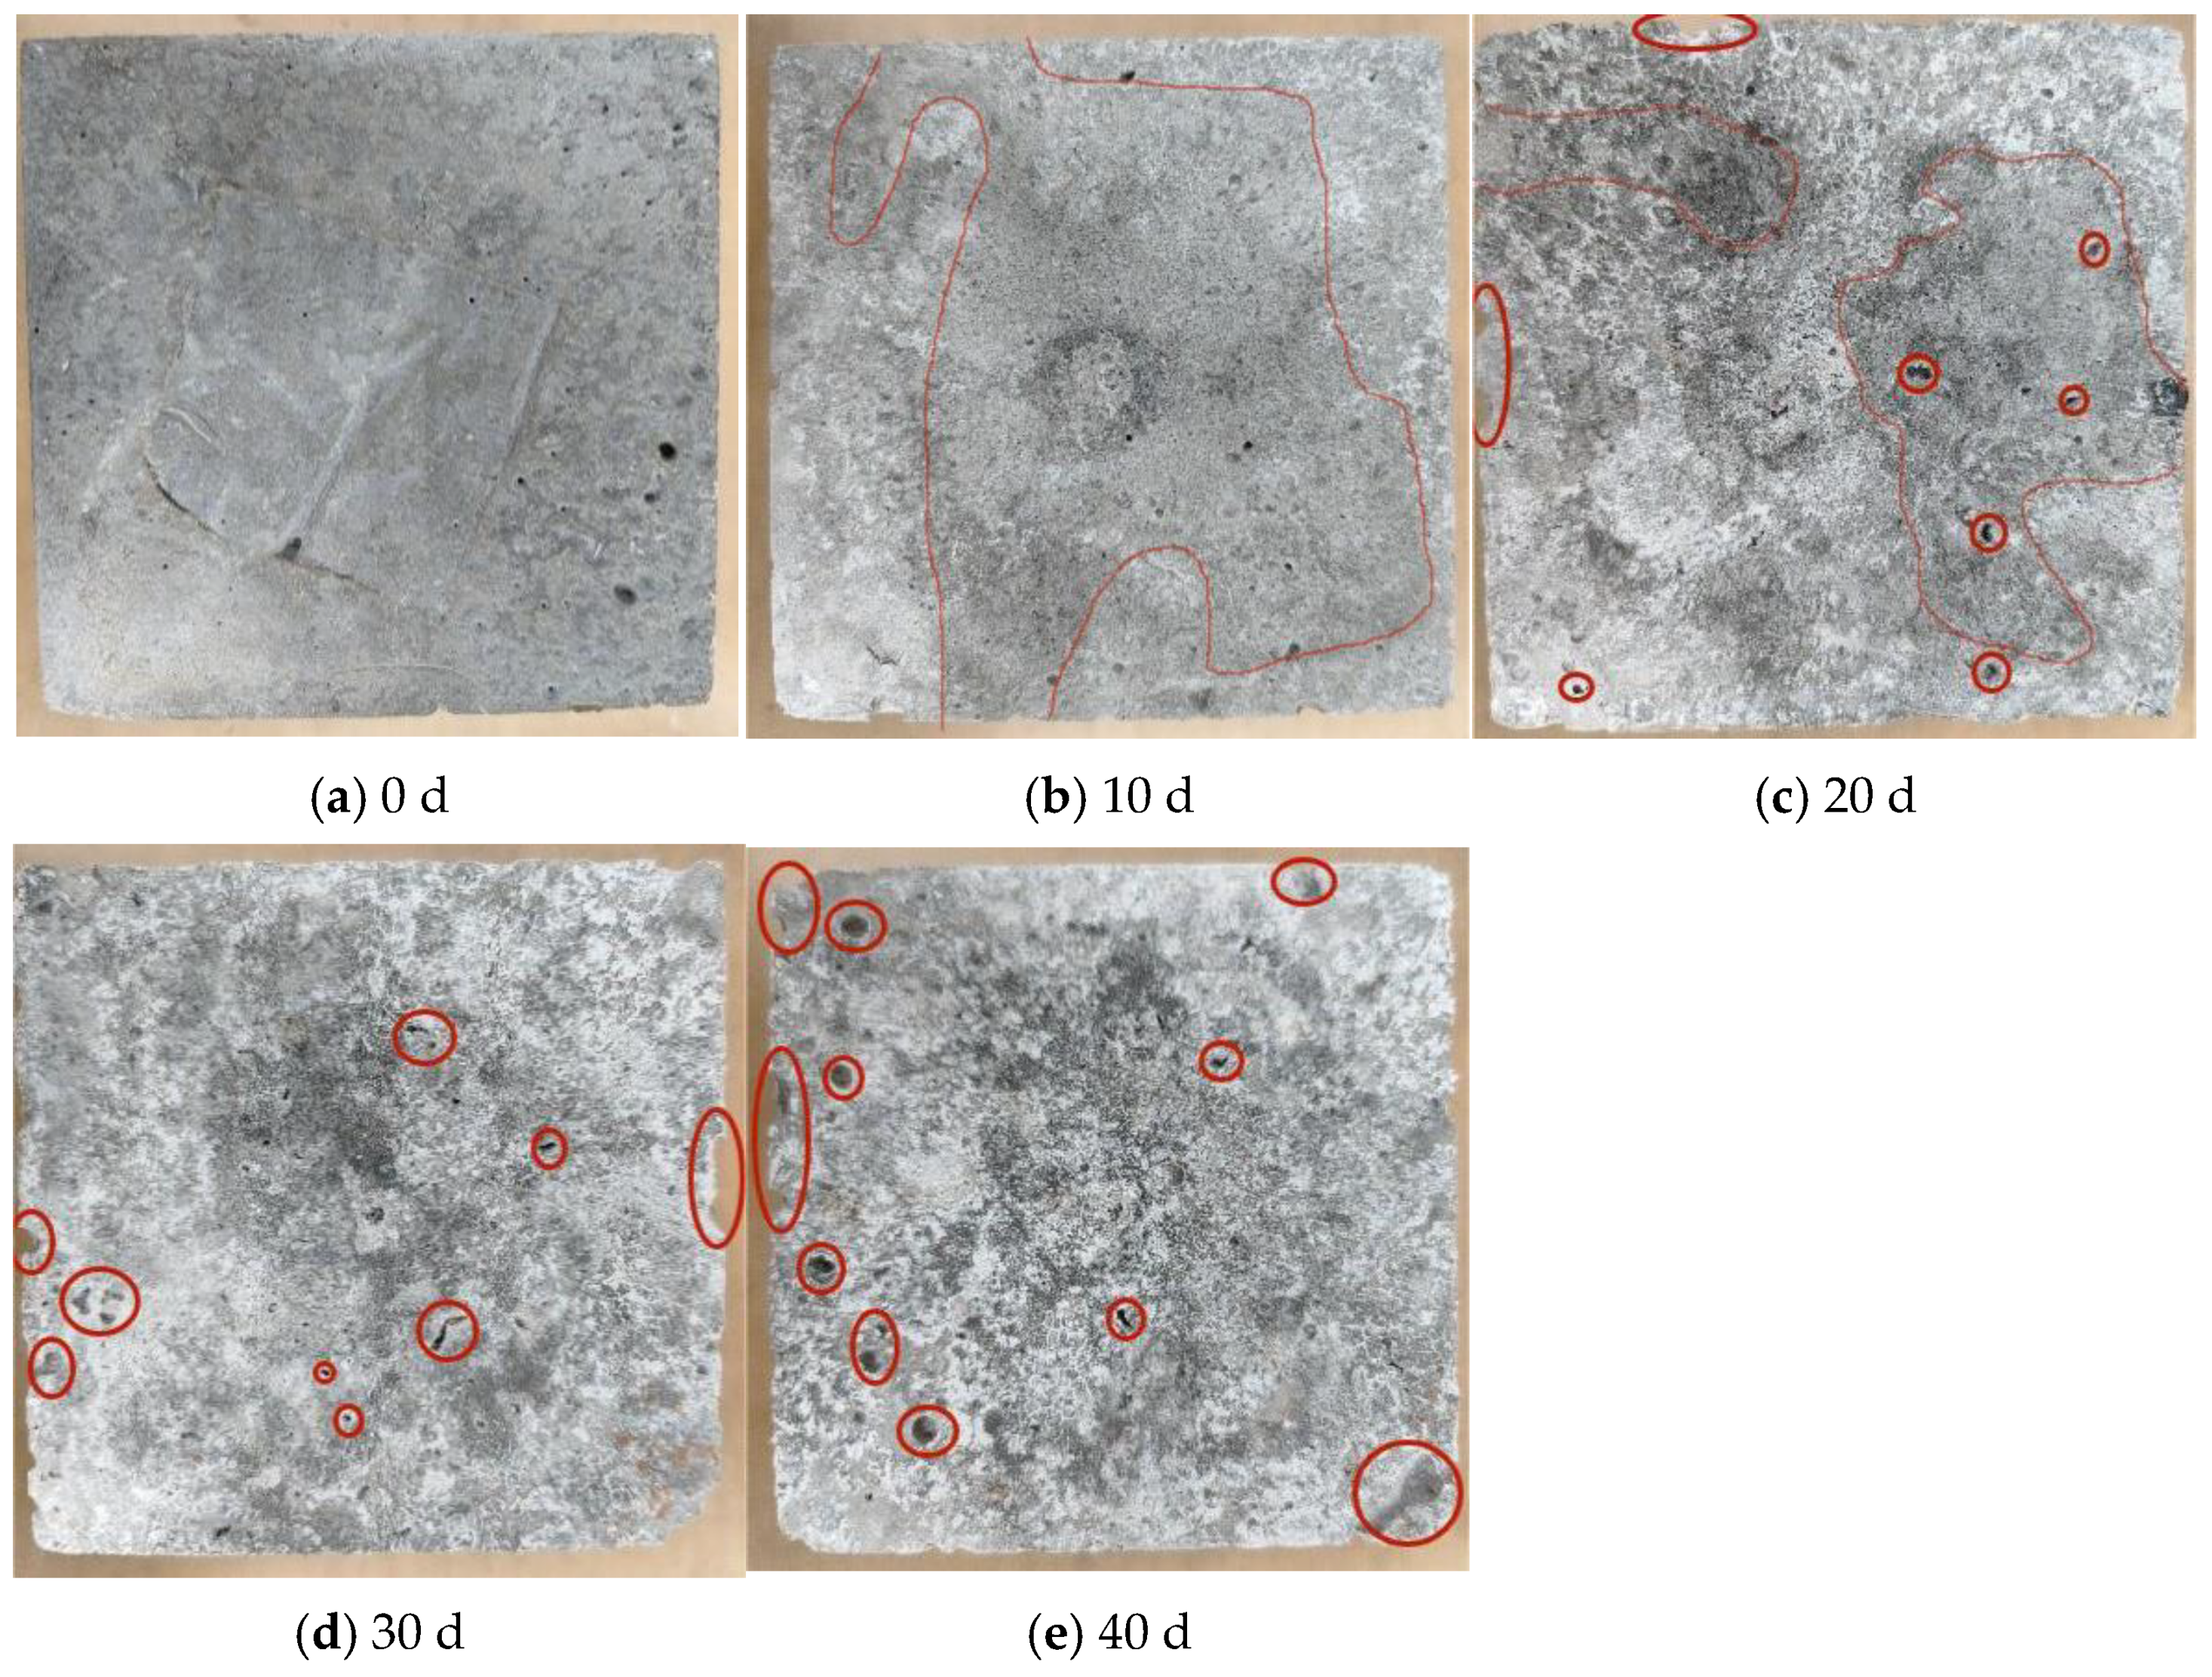
2.3.1. Analysis of Concrete Appearance Changes in Different Crystallization Days

The surface changes at 0 d, 10 d, 20 d, 30 d and 40 d are shown in Figure 1a.
By observing the surface crystallization of the samples for different days, it was found that the calcium carbonate crystallization and the surface holes of the samples gradually increased with the test time. However, there were some differences in the precipitations of calcium carbonate crystals, with the obvious appearance of holes and the edge falling off. When the test had been conducted for 10 days, calcium carbonate began to precipitate, with the crystallization area being small and mainly present on the surface edge of the sample. At 20 days after the test, tiny holes began to appear on the surface of the specimen, and the edge of the specimen fell off.

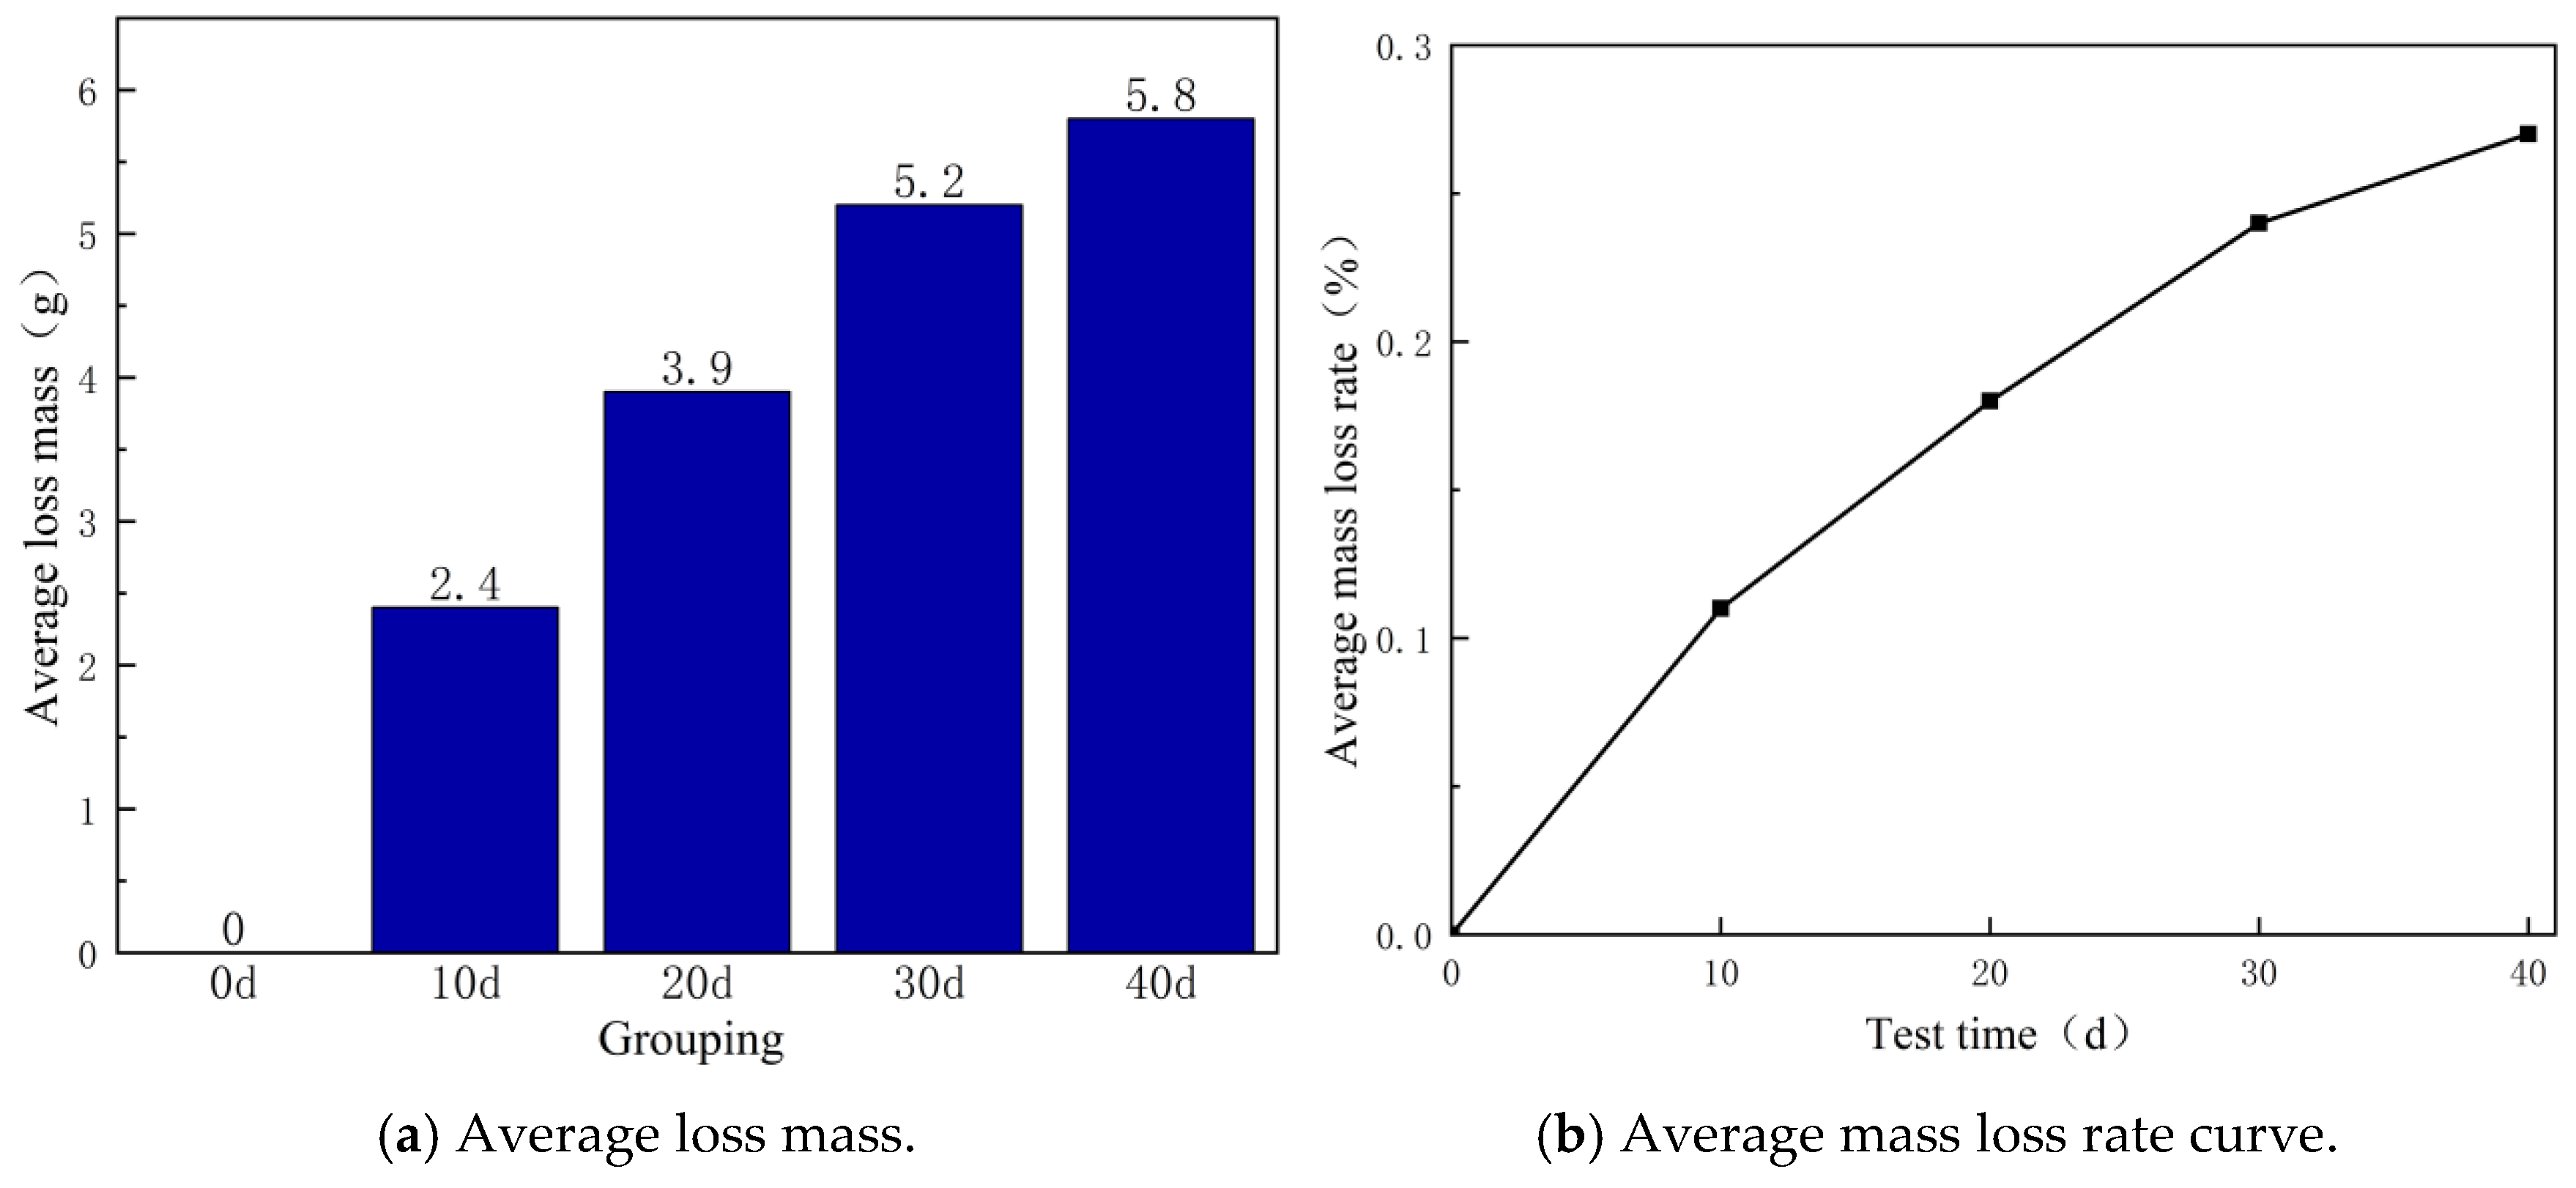
2.3.2. Analysis of Concrete Quality Change in Different Crystallization Days

The mass loss rate reflects the severity of the sample’s mass loss with different crystallization days. The greater the mass loss rate, the more the sample mass was lost. The mass loss rate is defined as in Equation (1):
P m = m 0 m m 0
where:
Pm—Mass loss rate, %;
m0—initial mass of sample, g;
m—mass of sample after test, g.
As shown in Figure 2a, with the increase in crystallization time, the average mass loss (Equation (1)) of the sample showed an upward trend, indicating that the precipitation of calcium ions produced by the cement hydration of concrete samples increased. As shown in Figure 2b, with the increase in test days, the mass of the sample continued to decrease, and the average mass loss rate of the sample gradually increased, but the increase rate of the average mass loss rate gradually slowed down. This shows that the mass loss in the same time period (every 10 days) gradually decreased with the passage of time.

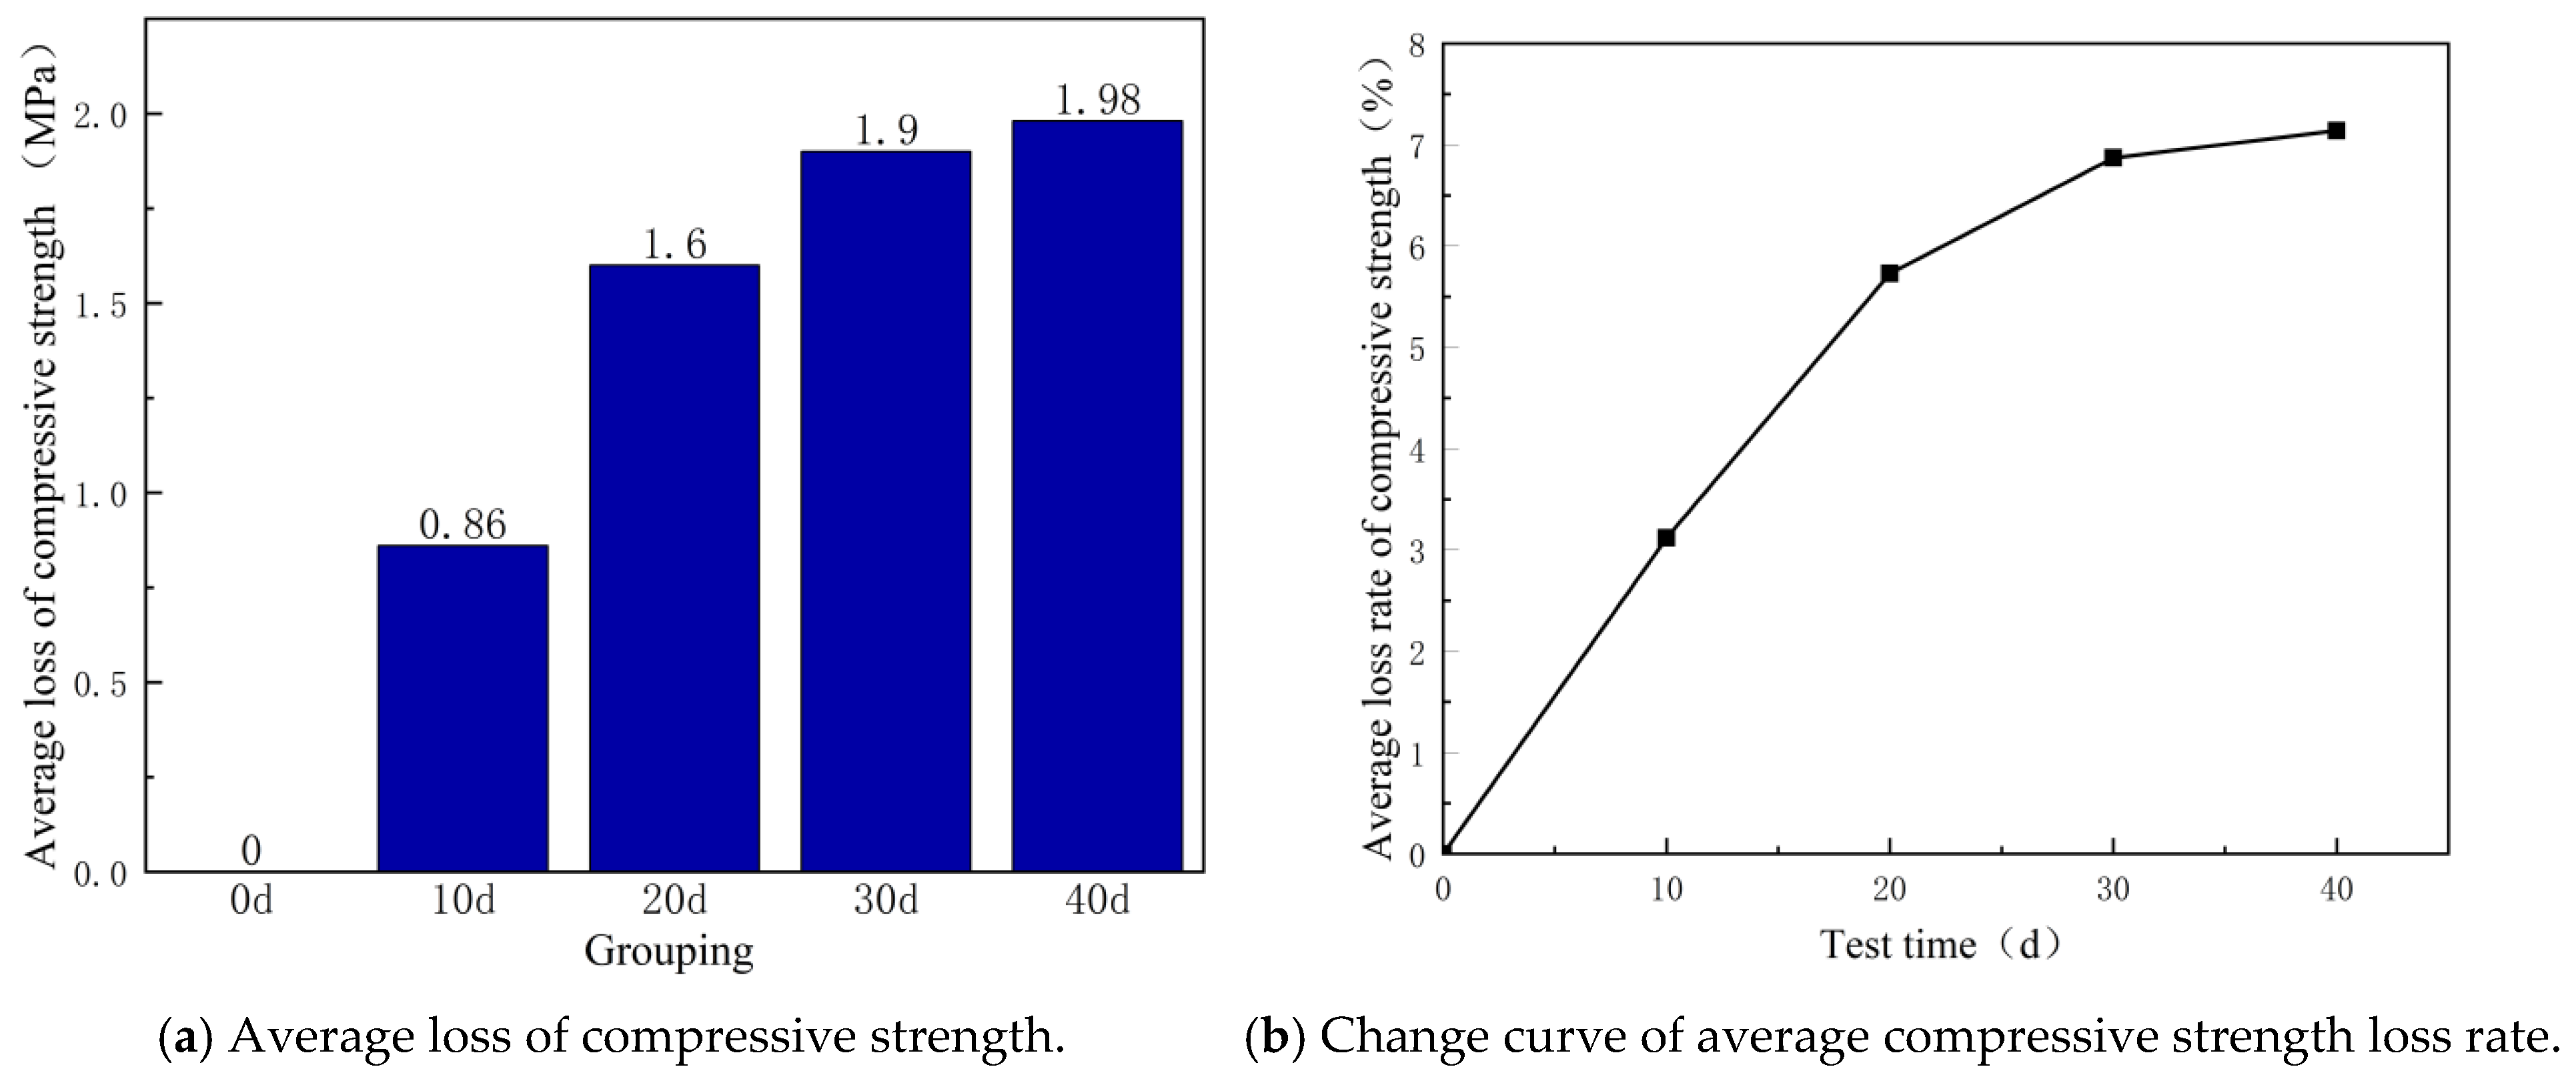
2.3.3. Analysis of Compressive Strength Changes of Concrete with Different Crystallization Days

The loss rate of compressive strength reflects the severity of the loss of compressive strength in the sample with different crystallization days. The greater the rate of loss of compressive strength, the greater the loss in compressive strength of the sample. The compressive strength loss rate is defined as in Equation (2),
P f = f 0 f f 0
where:
Pf—Loss rate of compressive strength, %;
f0—Initial compressive strength of the specimen, MPa;
f—Compressive strength of specimen after test, MPa.
As shown in Figure 3a, with the increase in crystallization time, the average loss of compressive strength of the sample showed an upward trend. This shows that when calcium carbonate crystals are continuously precipitated from the tunnel initial support concrete, its compressive strength decreases. As shown in Figure 3b, with the increase in test days, the compressive strength of the sample continued to decline, and its average rate of loss of compressive strength continued to rise. However, the rising rate of loss rate gradually slowed down.

2.3.4. Analysis of Elastic Modulus Change of Concrete with Different Crystallization Days

The rate of loss of elastic modulus reflects the severity of the loss of elastic modulus of the sample at different crystallization days. The greater the rate of loss of elastic modulus, the greater the loss of elastic modulus in the sample. The elastic modulus loss rate is defined as in Equation (3),
P E = E 0 E E 0
where:
PE—Loss rate of elastic modulus, %;
E0—Initial elastic modulus of specimen, GPa;
E—Elastic modulus of the specimen after test, GPa.
As shown in Figure 4a, with the increase in crystallization time, the average loss value of the elastic modulus of the sample showed an upward trend. The results show that the continuous precipitation of calcium carbonate crystals in the tunnel initial support concrete will lead to a decrease of its elastic modulus, which will lead to a decrease in concrete stiffness. As shown in Figure 4b, with the increase in test days, the elastic modulus of the sample continues to decline, while its average elastic modulus loss rate continues to rise, but the rising speed gradually slows down.

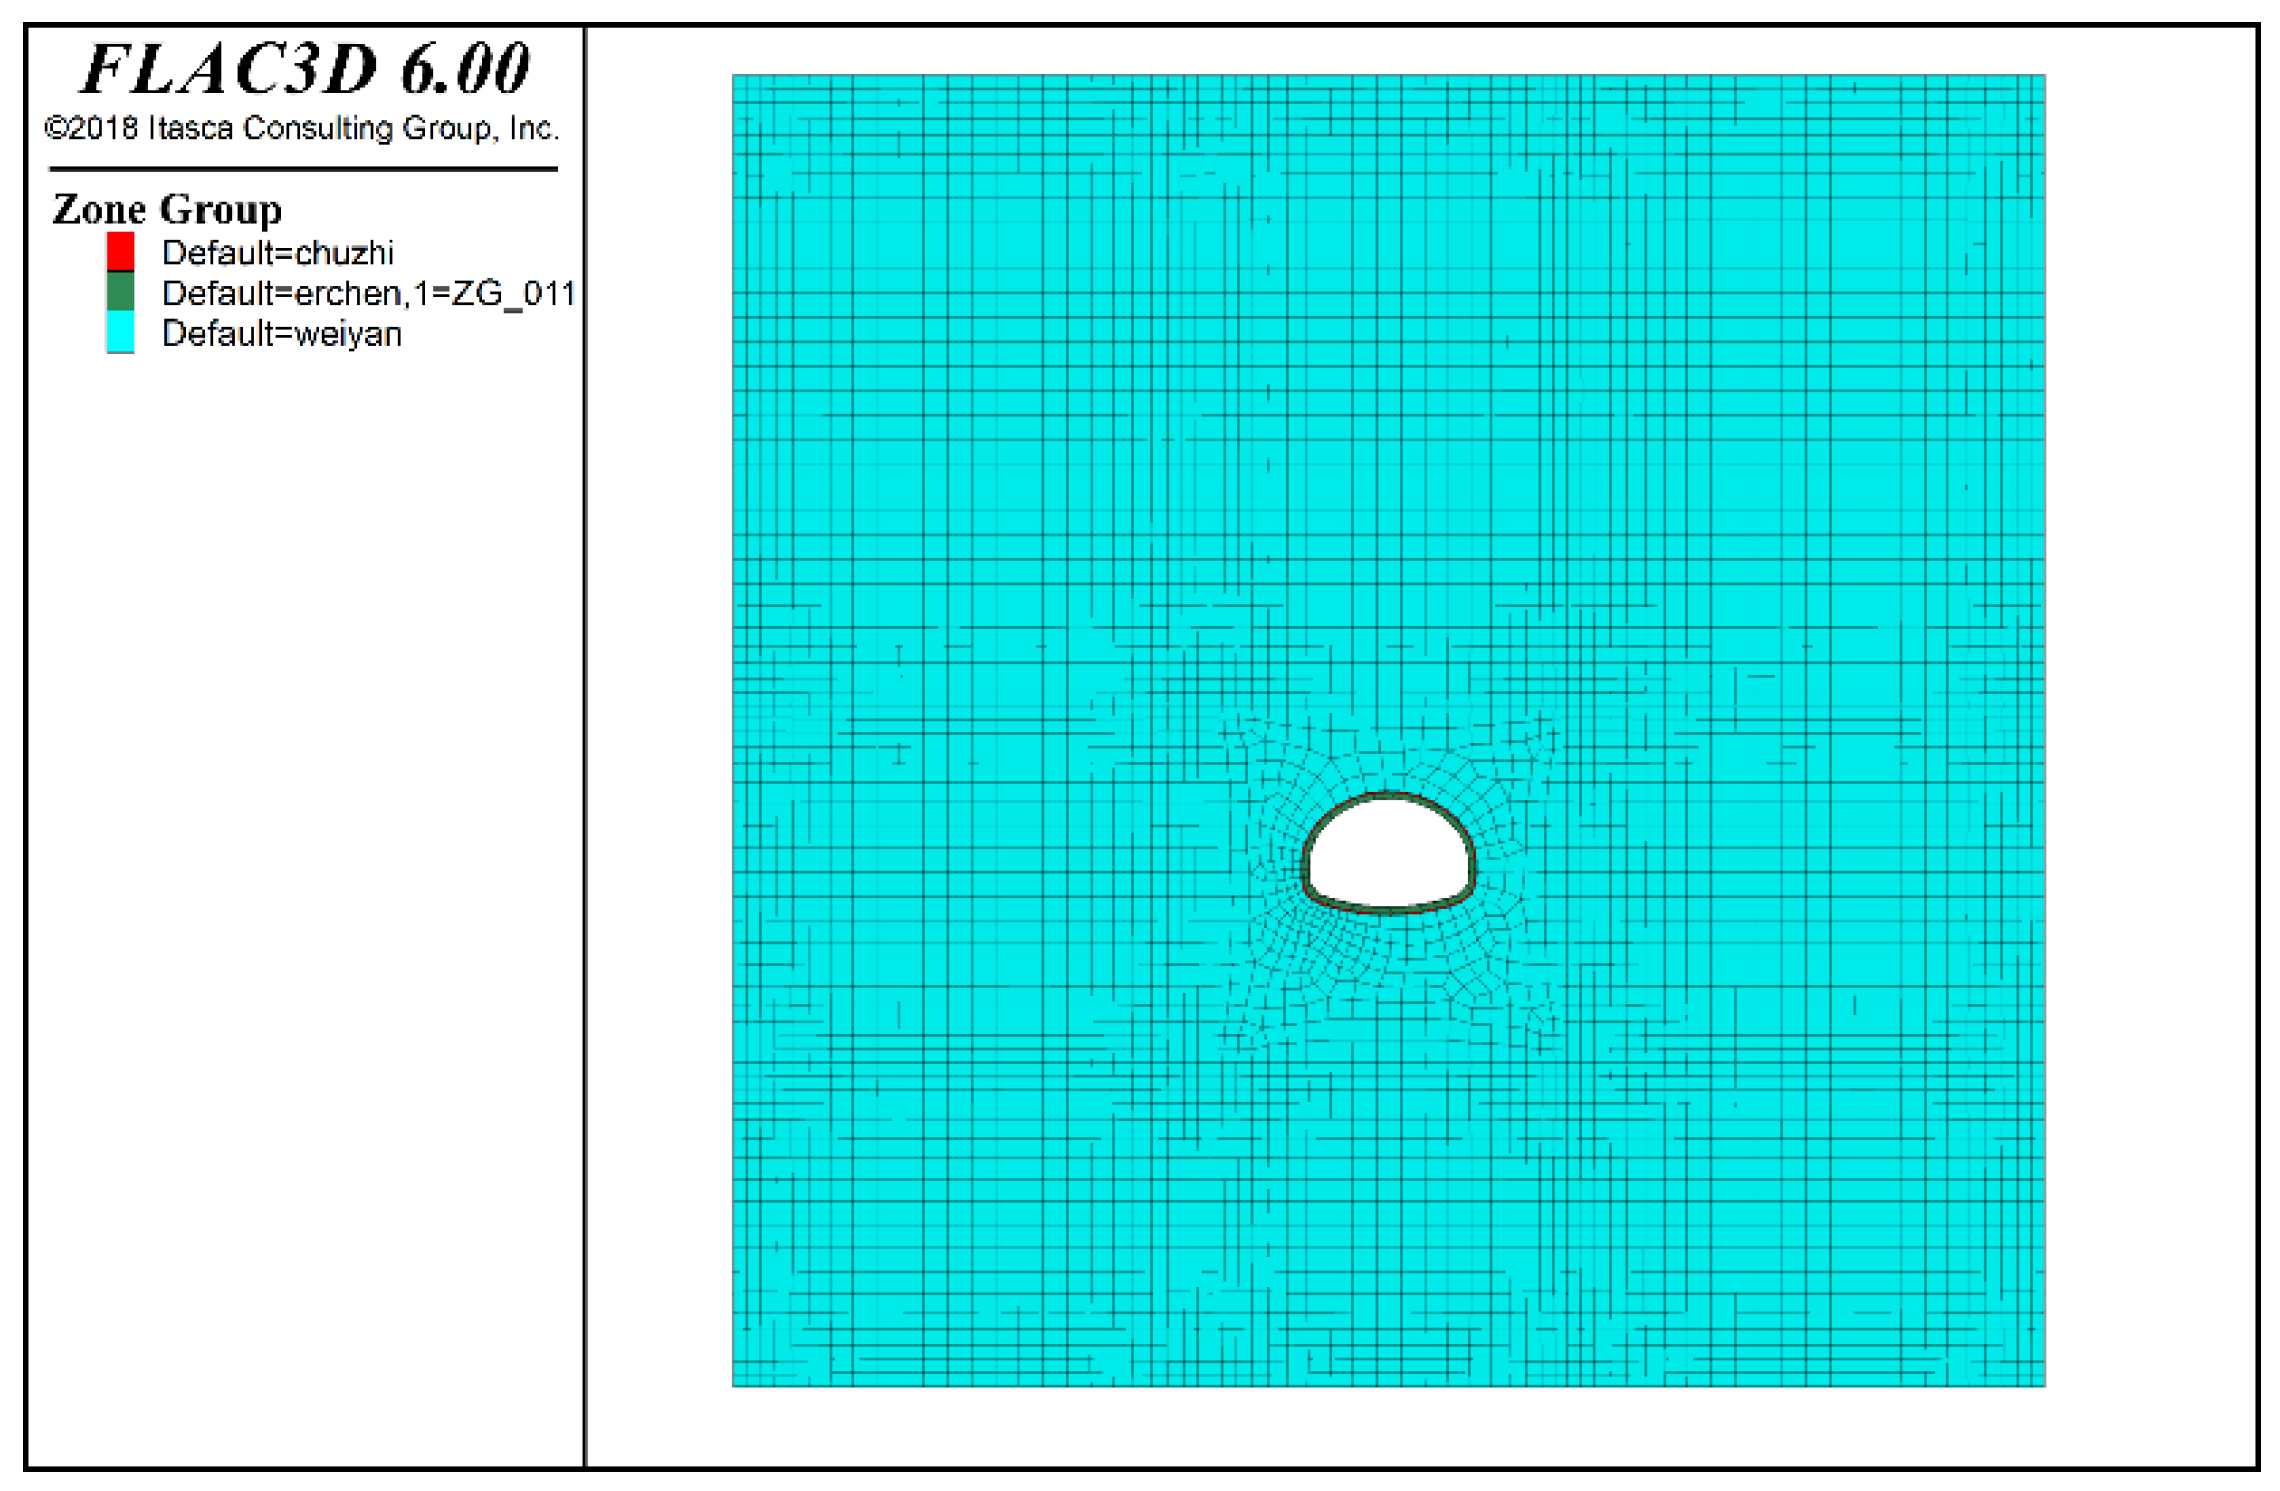
3. Numerical Simulation Method and Scheme

3.1. Determination of Mechanical Properties of Primary Support Concrete

The mechanical properties of the tunnel initial support concrete will decrease after the crystallization of calcium carbonate. With the passage of crystallization days, the quality, compressive strength and elastic modulus of the initial support concrete show a downward trend. Therefore, in this calculation, the elastic modulus of the initial support concrete is reduced to simulate the effect of calcium carbonate crystallization on the tunnel lining structure. Based on the laboratory test results, the mass of the early-stage support concrete after crystallization is defined as in Equation (4),
m = 1 P m m 0
where:
Pm—Concrete mass loss rate under corresponding crystallization days, %;
m0—Initial mass, kg;
m′—Mass under corresponding to crystallization days, kg.
E = 1 P E E 0
where:
PE—loss rate of elastic modulus of concrete under corresponding crystallization days, %;
E0—initial elastic modulus, GPa;
E—elastic modulus of concrete under corresponding crystallization days, GPa.
Similarly, the compressive strength of the primary support concrete after crystallization is defined as:
f = 1 P f f 0
where:
Pf—loss rate of concrete elastic modulus under corresponding crystallization days,%;
f0—initial elastic modulus, MPa;
f′—elastic modulus of concrete under corresponding crystallization days, MPa.

3.2. Determination of Drainage Capacity of Tunnel Drainage System

The tunnel was intended to feature composite lining, which is a common form of tunnel engineering at present. During the construction of the composite lining, a waterproof layer will be set between the primary support and secondary lining of the tunnel. The waterproof layer is mainly composed of a circumferential drainage pipe, geotextiles and a waterproof board. At the same time, the composite lining will feature drainage holes at the bottom of the lining side wall, so its drainage structure is more complex. Due to the isolating effects of the geotextile and waterproof board on the water outside the lining, the secondary lining itself has a strong waterproof capacity, and its water permeability is generally not considered in the calculation. It is considered that the secondary lining is an impermeable material, and the permeability coefficient is taken as 0. However, due to the existence of the tunnel drainage system, the drainage pipe set in the secondary lining will guide the water flow in the circumferential drainage pipe to discharge through the drainage ditch; this means that the secondary lining is a permeable structure from a macro perspective, so the drainage capacity can be shown by giving a permeability coefficient to the secondary lining in order to simplify the calculation, as shown in Figure 5.
After the secondary lining is given the equivalent permeability coefficient, the process of the decline in the tunnel’s drainage capacity after the crystallization blockage of the drainage system can be reflected by changing the equivalent permeability coefficient. With the increase in the degree of crystalline blockage in the drainage system, the secondary lining is given a smaller equivalent permeability coefficient, so that the flow of water through the lining is reduced, thus achieving the simulation effect.

3.3. Selection of Groundwater Level

Before tunnel excavation, the groundwater and surface water form a dynamic balance. After the tunnel’s construction, the groundwater is continuously discharged through the tunnel’s drainage system. The long-term drainage leads to the formation of a low water level drainage channel in the longitudinal direction and a groundwater depression funnel centered on the tunnel in the transverse direction. With the extension of drainage time, the drawdown rate of the water level becomes slower and slower, and the expansion speed of the drawdown funnel becomes slower and slower. The drawdown of water level will tend to slow down with the extension of time, and will finally approach the steady flow state. The Chubuyi formula is the most widely used in the process of groundwater stabilization [30], and the shrinkage formula for the pressurized full water level is given in Equation (7),
s = Q 2 π K M l n R r w
where:
s—drawdown of water level, m;
Q—tunnel drainage, m3/d;
M—aquifer thickness, m;
K—permeability coefficient of aquifer, taking 28 m/d;
R—influence radius, according to the empirical formula r = 215.5 + 510.5 k;
rw—equivalent radius of tunnel, calculated as 4.7 m.
It can be seen from Equation (7) that the drawdown of the groundwater level is directly proportional to the tunnel drainage Q. The greater the tunnel drainage, the more the groundwater level will fall. However, when the tunnel drainage system is blocked by crystallization, the drainage capacity of the tunnel will be affected, which will reduce the drainage volume of the tunnel, and the drawdown s of the groundwater level will also become smaller. Therefore, when the tunnel drainage system is blocked by crystallization, the water level after the groundwater level has stabilized will be higher than the normal situation, resulting in an increase in the water pressure on the lining. Therefore, the corresponding height of the groundwater level can be calculated according to the different drainage volumes under different degrees of crystal blockage in the tunnel drainage system.
The tunnel drainage volume used in this calculation is calculated based on the field test results. Through the field drainage system flow rate test, the drainage volume of the measured points can be calculated using Equation (7). Each test is repeated 5 times, and finally the average value of the test results is taken. The statistical results are shown in Table 1.
It can be seen from Table 1 that the daily drainage of the whole tunnel is 18011 m3/d, so q is taken as 18,011 m3/d in this calculation. When the tunnel drainage system is blocked by crystallization, the tunnel drainage also decreases. In this calculation, the tunnel drainage system is blocked by 0%, 40% and 80%. At this time, the drainage capacity of the tunnel is 100%, 60% and 20% of the original. Therefore, the corresponding drainage volumes are 18,011 m3/d, 10,807 m3/d, and 3602 m3/d. The distance between the initial groundwater level and the top of the tunnel is set as 60 m, and four different drainage quantities are brought into Equation (7) to calculate the drawdown of the groundwater level under stable conditions, so as to determine the groundwater level under corresponding conditions, as shown in Table 2.

3.4. Numerical Simulation Scheme

The fluid structure coupling model of FLAC3D 6.0 software is used for this calculation, and the solid element is used to model each part. The model is 120 m long, 120 m high and 1 m thick. The buried depth of the tunnel is 60 m, wherein the thickness of the initial support is 15 cm and the thickness of the secondary lining is 50 cm, as shown in Figure 6. The initial in situ stress field of the rock and soil mass takes into account the self-weight stress, and the pore water pressure is hydrostatic pressure. The initial support and secondary lining of the tunnel are simulated as a solid element, and the surrounding rock of the tunnel is modeled by use of the Mohr Coulomb elastic–plastic model. Among the material parameters used in the numerical calculation, the initial support parameters after crystallization are calculated according to the data of indoor test crystallization time of 20 d and 40 d, and according to Equations (4)–(6). At the same time, the drainage capacity of the tunnel is considered in the calculation. References [31,32] give an equivalent permeability coefficient to the lining, and reduce it according to the degree of blockage. The selection of the remaining material parameters is based on the relevant specifications for highway tunnel design. The detailed material parameters and calculation conditions are shown in Table 3 and Table 4.
Aside from the top surface of the model, which is a free boundary, the other five surfaces constrain the normal displacement. The rock and soil are assumed to be saturated with water, and the corresponding static pore water pressure is proportional to the buried depth of the location. The top of the model and the tunnel free face are permeable boundaries, and the corresponding pore water pressure is zero. Other surfaces are impermeable boundaries.

4. Result Analysis and Discussion

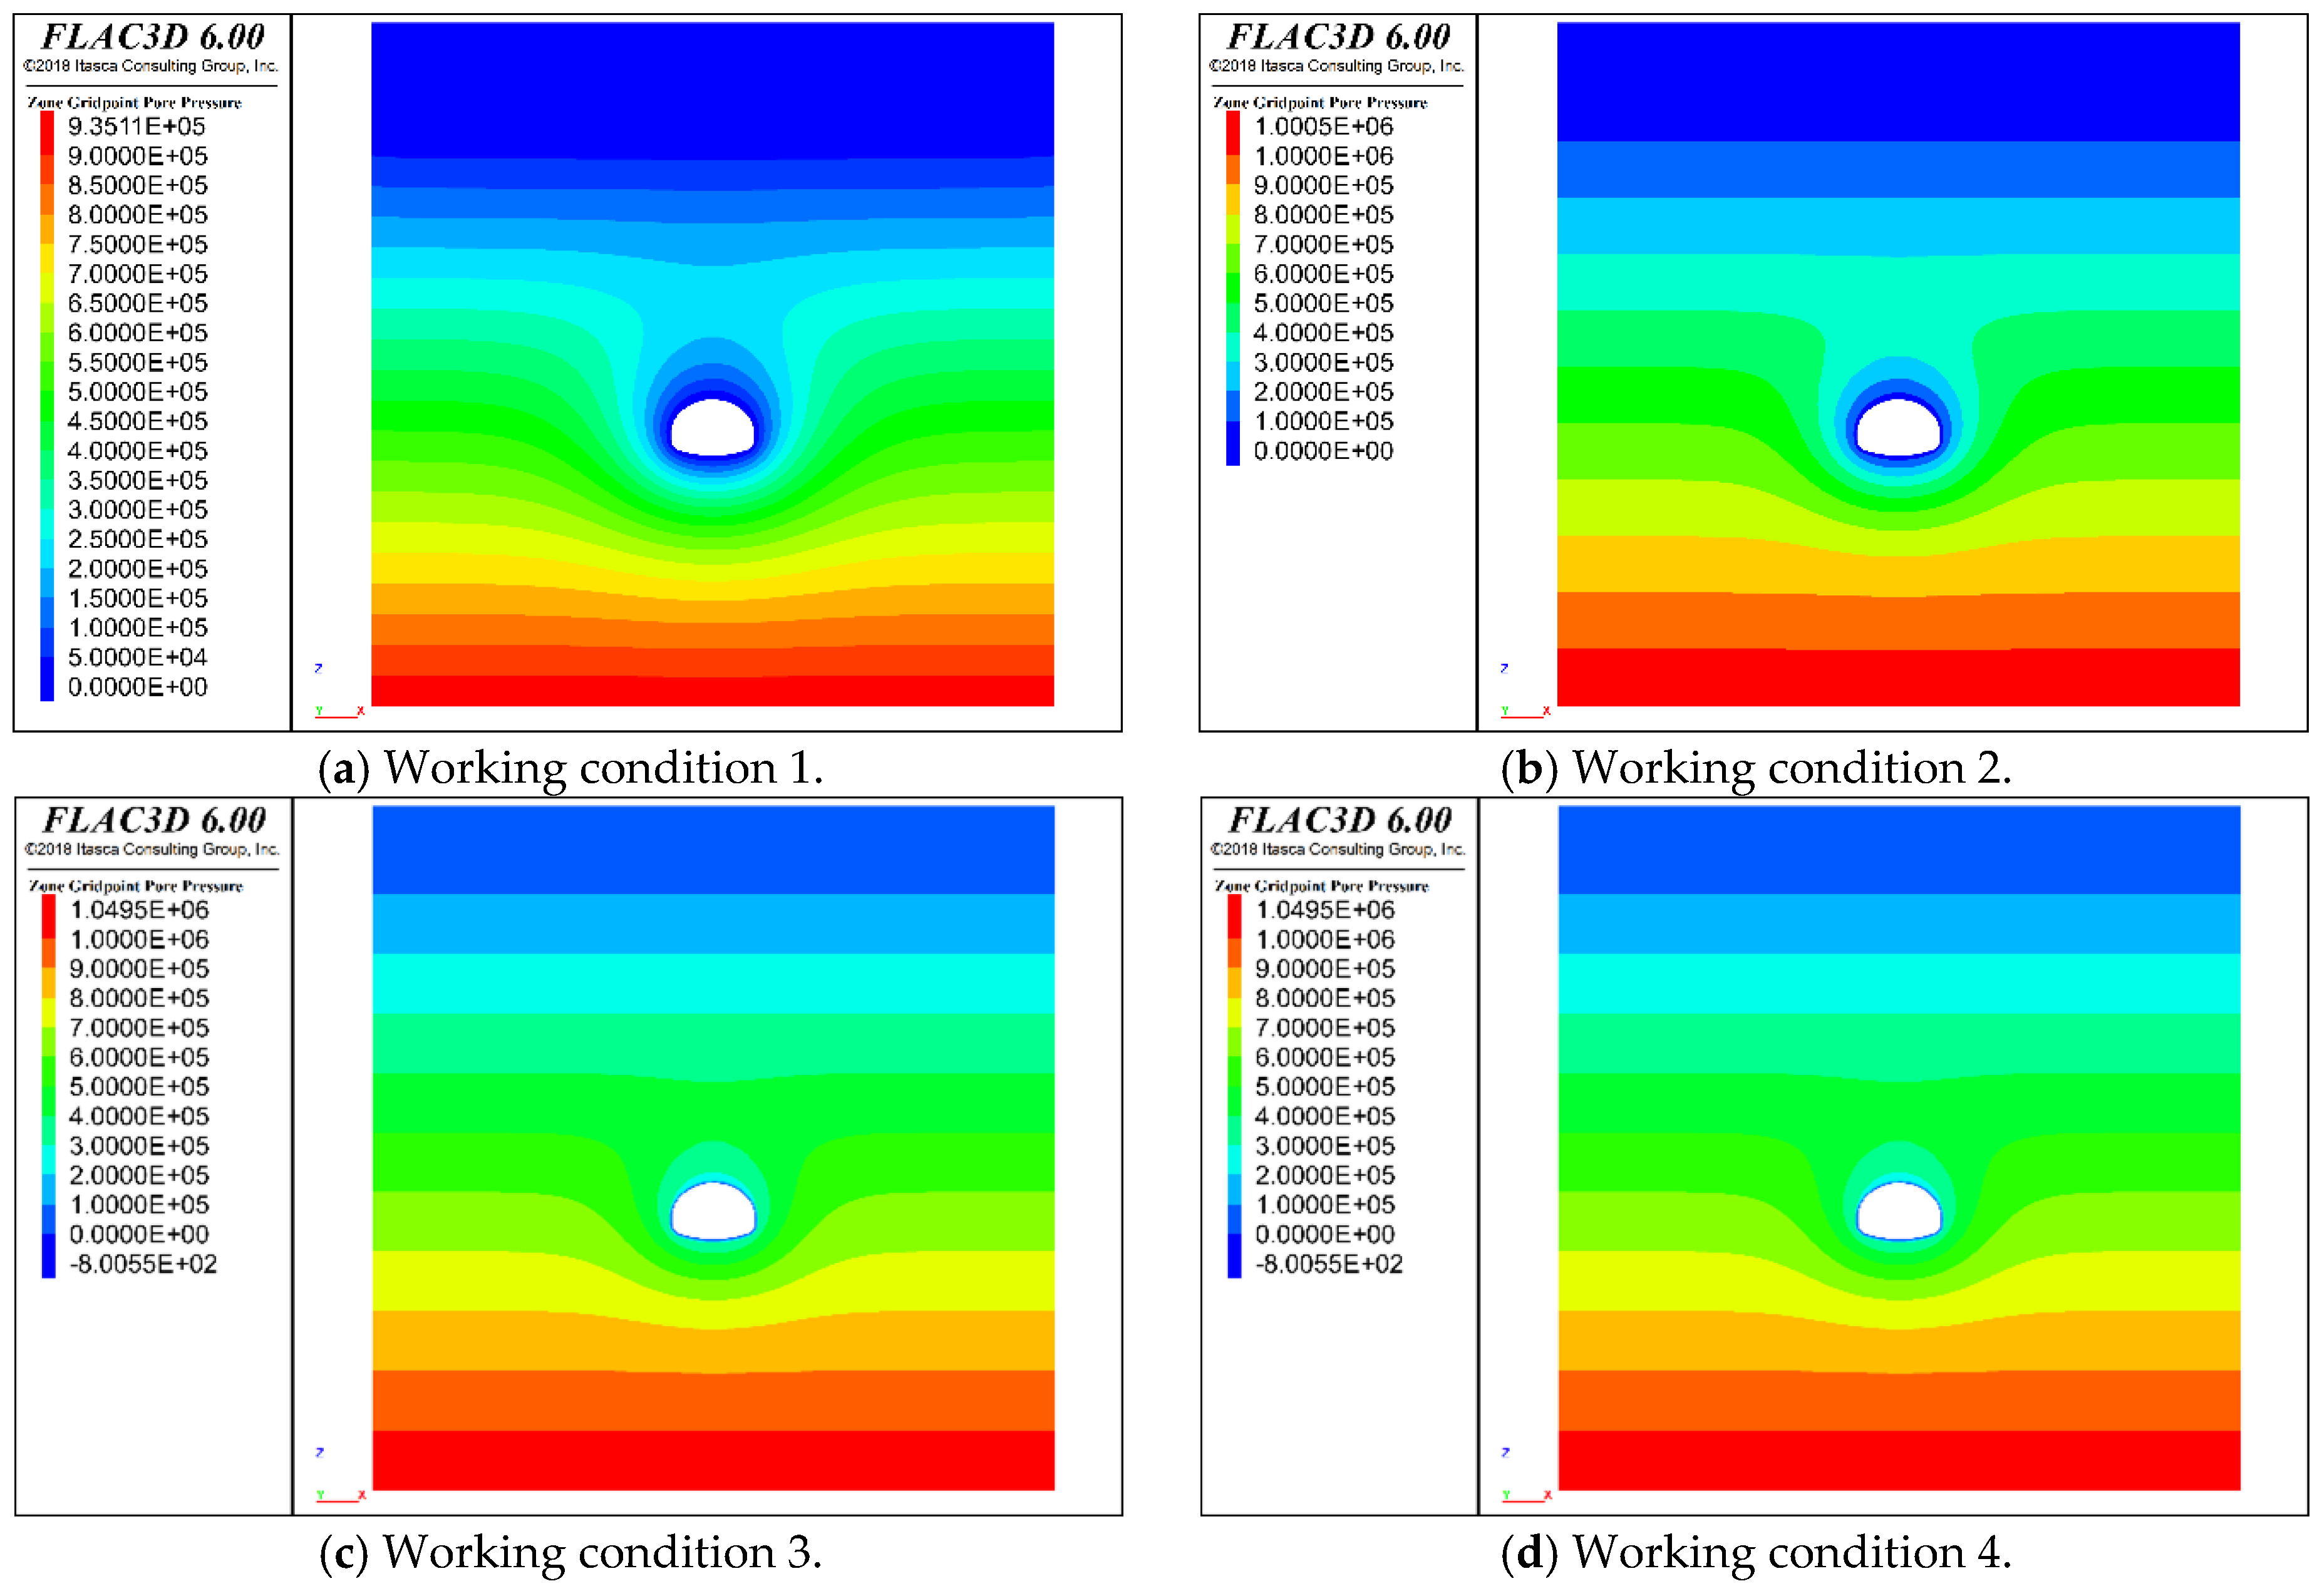
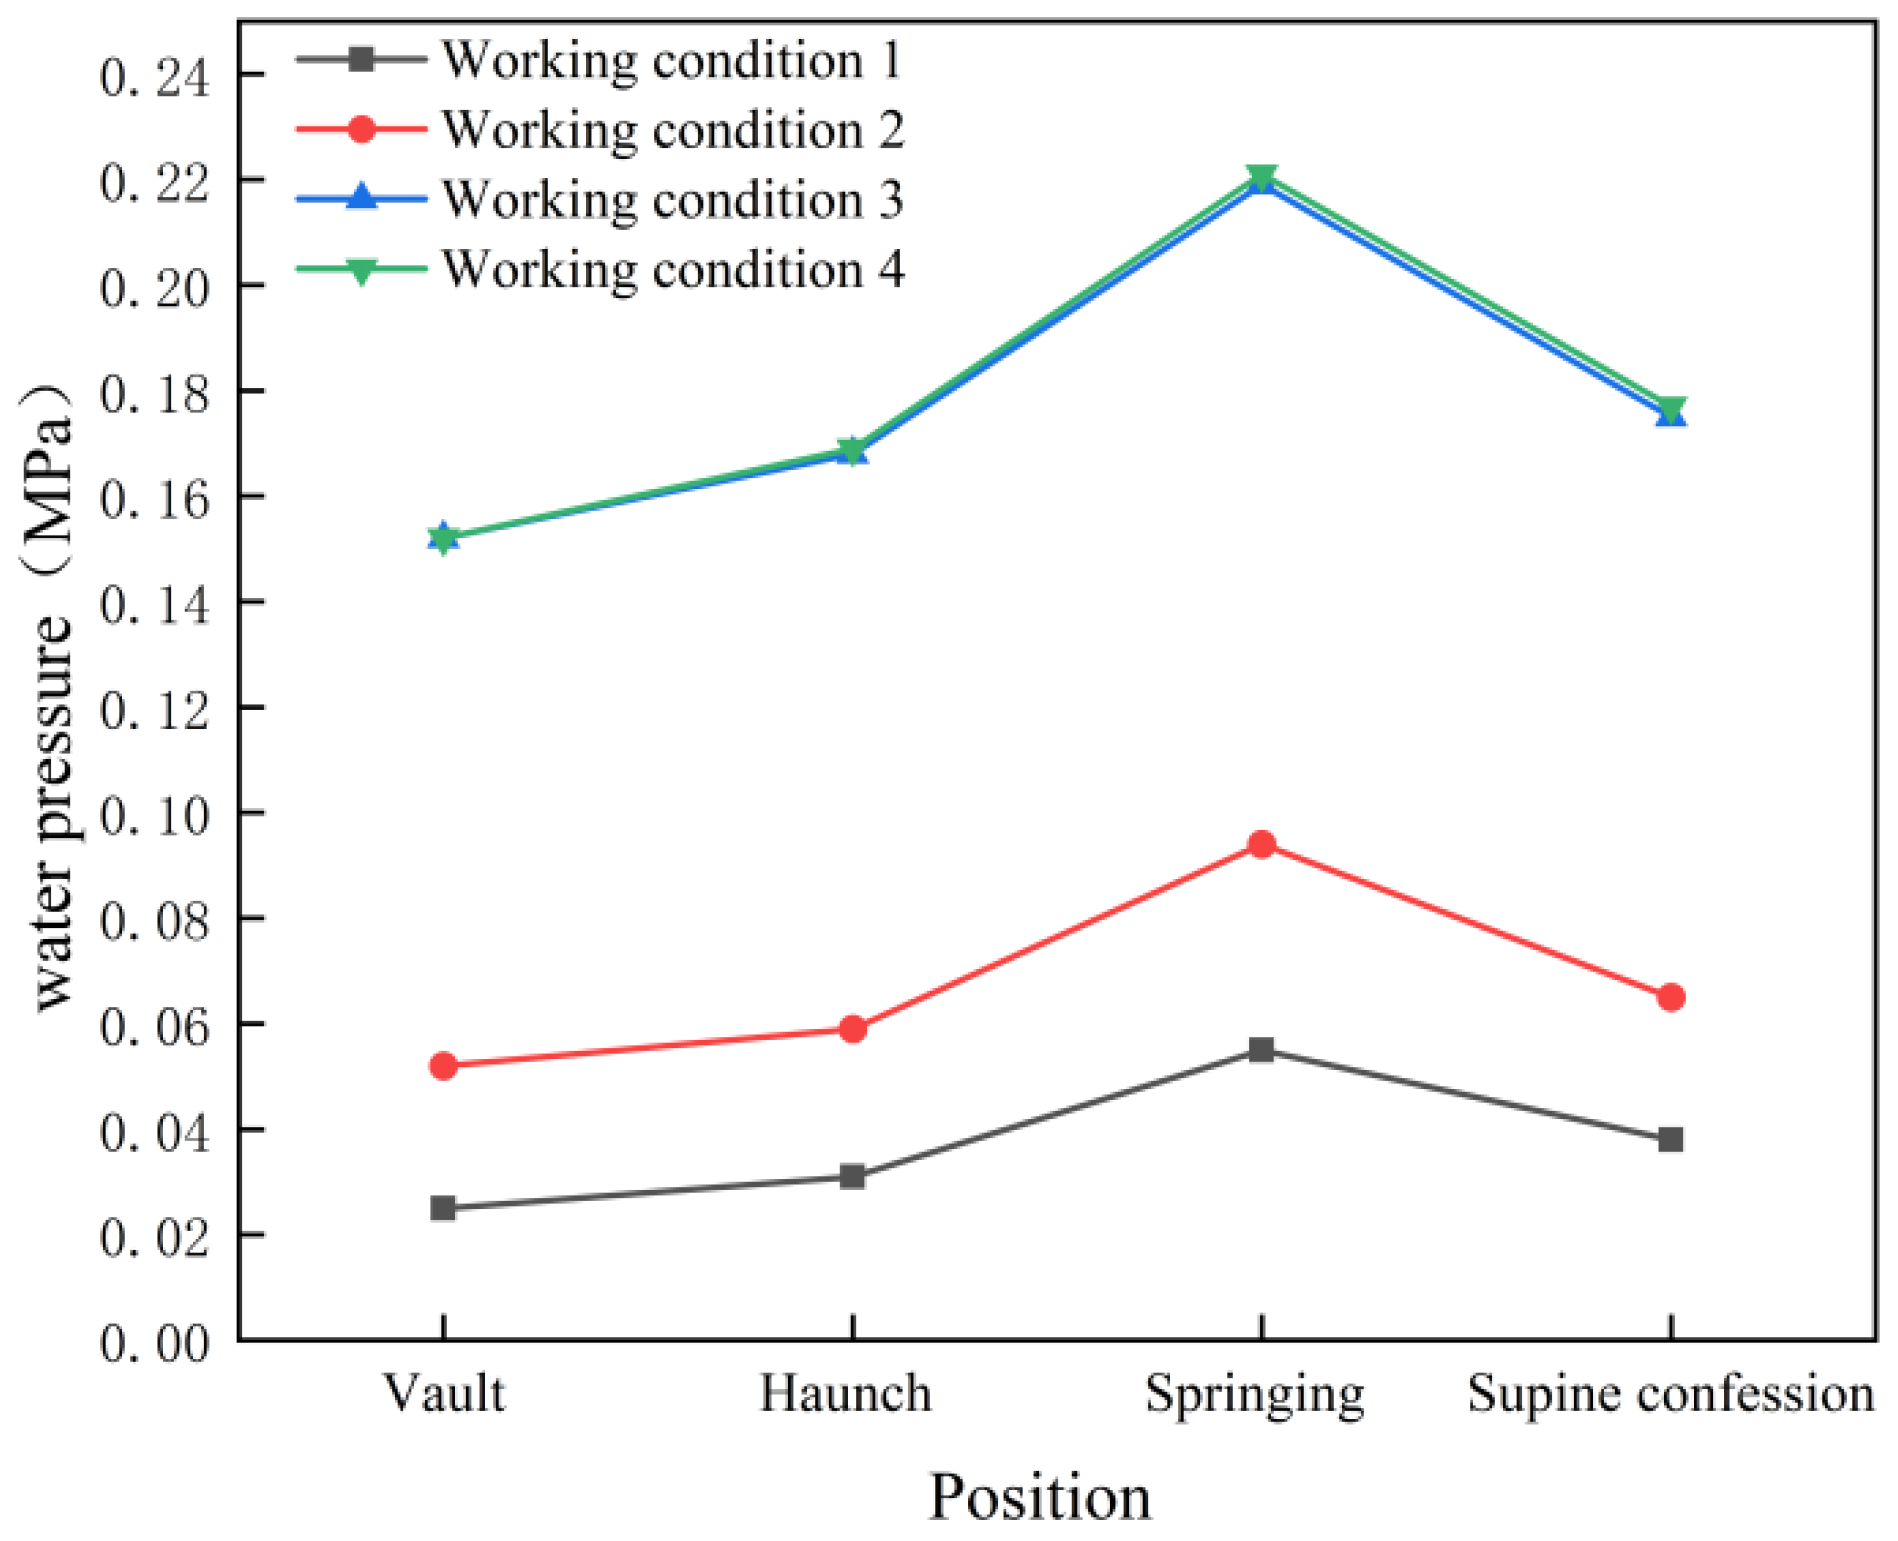
4.1. Pore Water Pressure Analysis

As shown in Figure 7, the water pressure equipotential line around the tunnel in condition 1 (normal condition) is relatively dense, indicating that the pore water pressure around the tunnel changes rapidly, and the groundwater is discharged through the tunnel through seepage movement. With the rapid blockage of the tunnel drainage system, the water pressure equipotential line around the tunnel changes from dense to sparse, and the change range of pore water pressure around the tunnel in condition 3 and condition 4 (blockage degree 80%) is small, indicating that the drainage function of the tunnel is seriously reduced. The pore water pressure of each part of the tunnel lining is as follows: arch foot > inverted arch > arch waist > arch crown.
As shown in Figure 8, the pore water pressure of the arch crown, arch waist, arch foot and inverted arch under condition 2 (blockage degree of 40%) is 0.052 mpa, 0.059 mpa, 0.094 mpa and 0.065 mpa, respectively, which values are 108%, 90.32%, 70.91% and 71.05% higher than that under normal conditions. The pore water pressure of the arch crown, arch waist, arch foot and inverted arch under condition 4 (blockage degree 80%) is 0.152 mpa, 0.168 mpa, 0.219 mpa and 0.175 Mpa, respectively, which values are 508%, 441.93%, 298.18% and 360.52% higher than under normal conditions. Compared with working conditions 1, 2 and 4, it can be seen that with the increase in the blockage degree of the drainage system and the height of the groundwater level, the pore water pressure of each part of the tunnel shows an upward trend, and this trend is not linear. With the increase in the blockage degree of the drainage system, the pore water pressure of the tunnel increases faster and faster. Under the same blockage degree, the pore water pressure of each part of the tunnel is not different when the initial support concrete crystallization time is 20 d and 40 d.

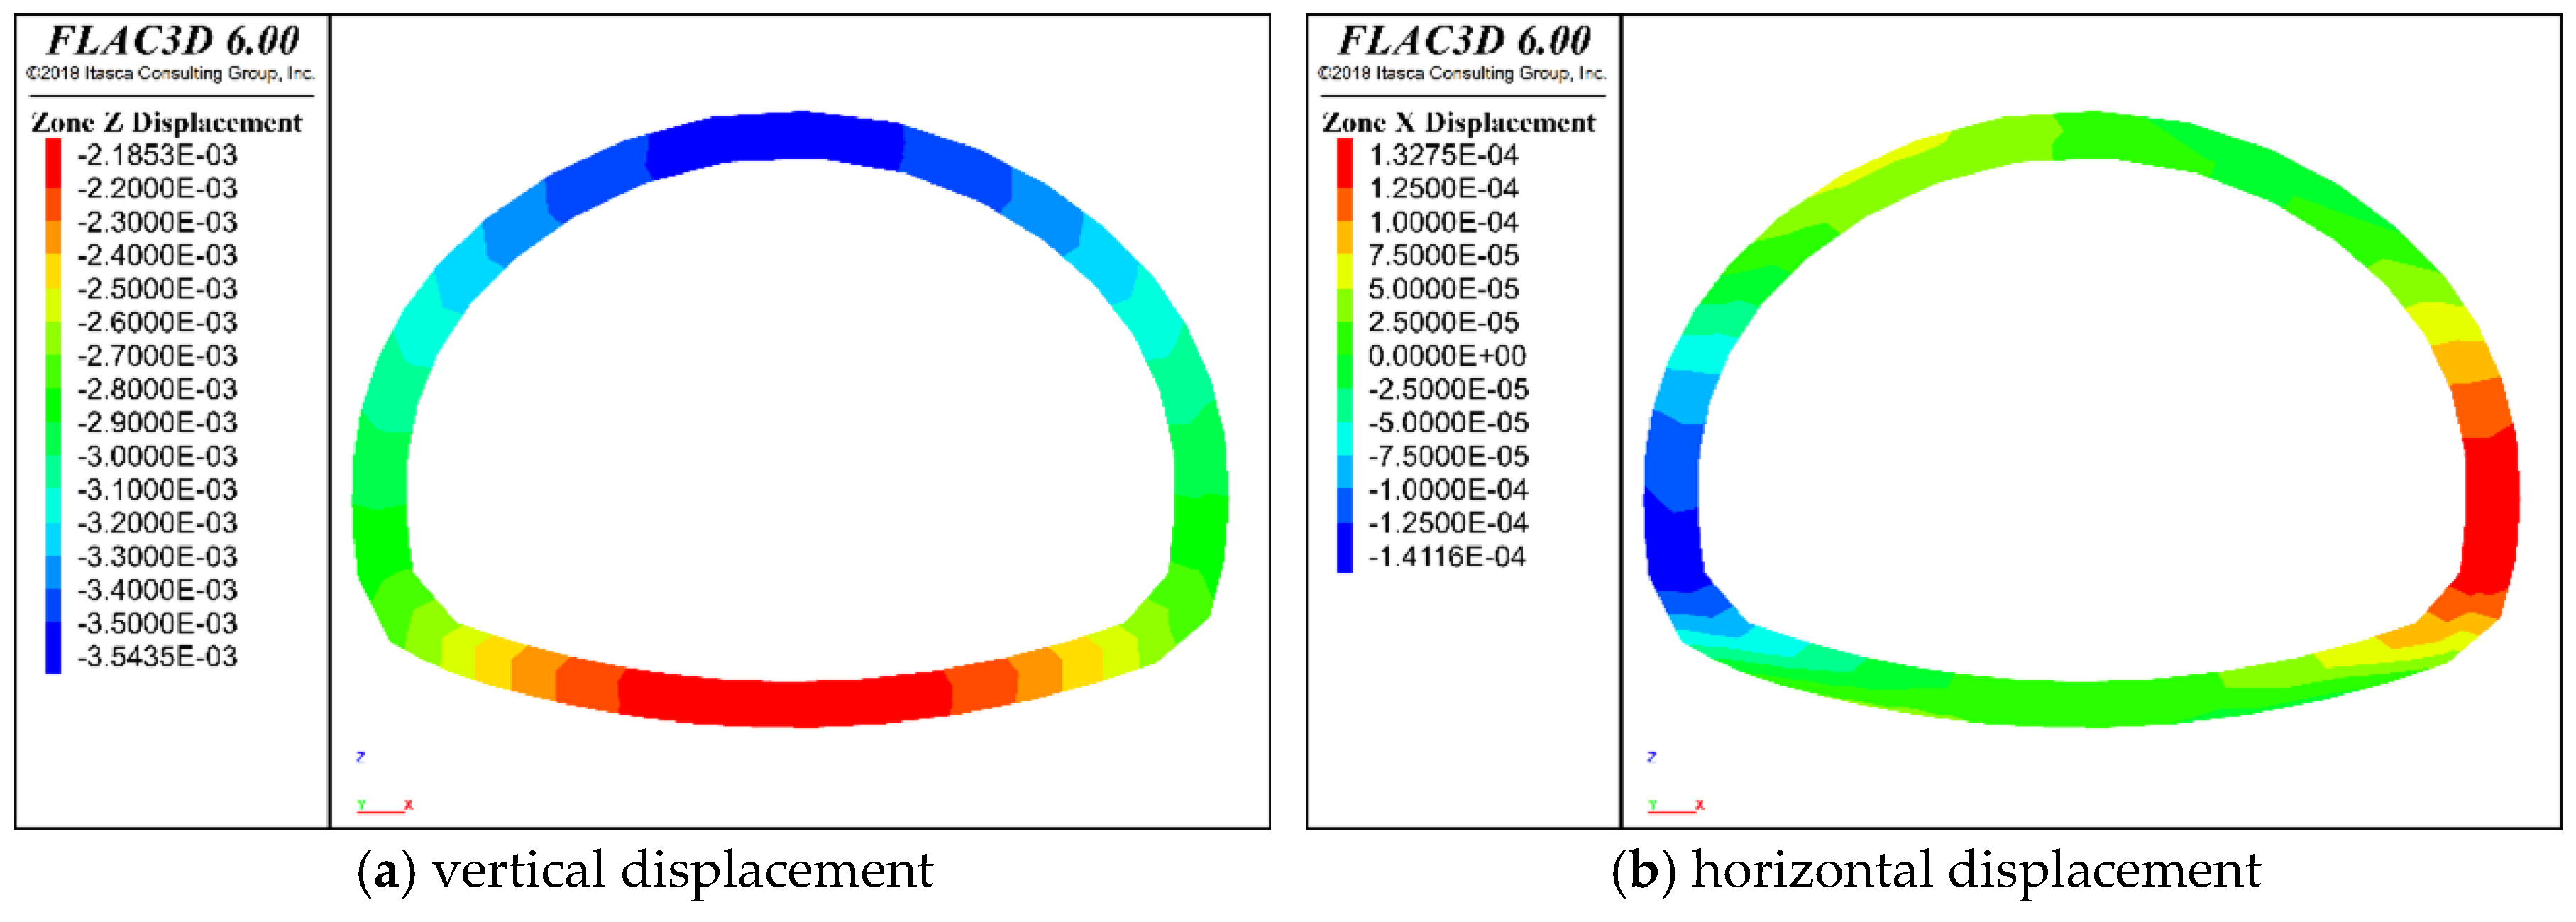
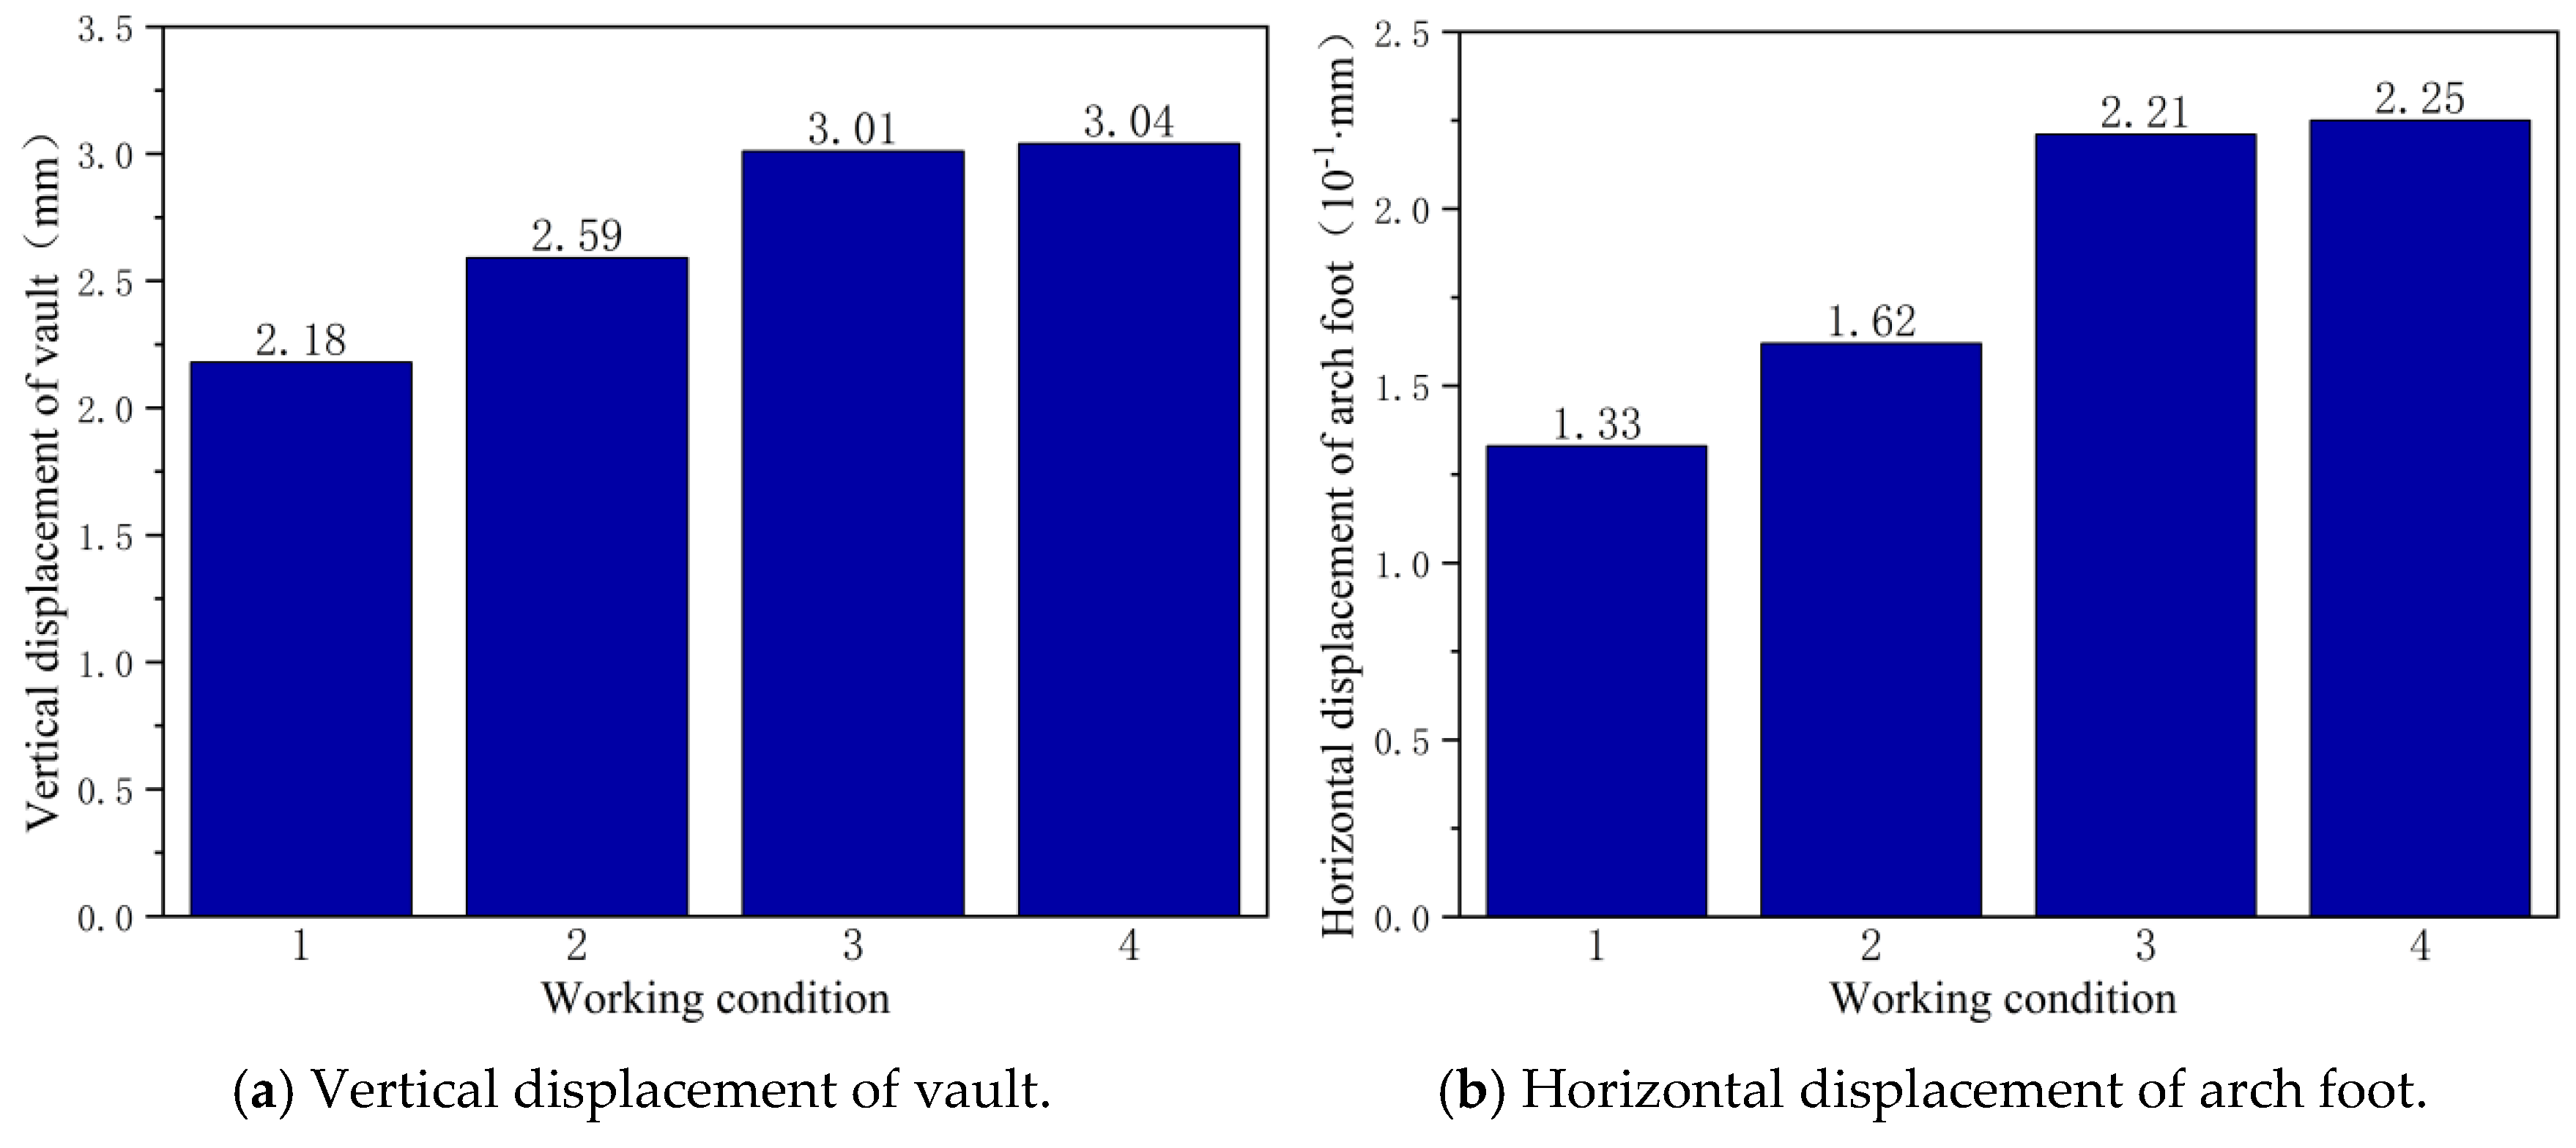
4.2. Displacement Analysis

As shown in Figure 9, when the whole tunnel is below the groundwater level, the water pressure from all directions will squeeze the tunnel lining, causing the lining to displace. Because the groundwater level is above the whole tunnel, the water pressure on the tunnel mainly comes from the vertical direction, so the lining will have outward horizontal displacement (x-axis direction) and inward vertical displacement (Z-axis direction). The maximum horizontal displacement occurs at the arch foot of the tunnel lining, while the maximum vertical displacement occurs at the arch crown of the tunnel lining.
As shown in Figure 10, compared with condition 1, the vertical displacement of arch crown under condition 2 increased by 18.81%, while the horizontal displacement of the arch foot increased by 21.80%. Under condition 4, the vertical displacement of the arch crown increased by 39.45%, while the horizontal displacement of the arch foot increased by 69.17%. Through the comparative analysis of condition 1, condition 2 and condition 4, it can be seen that with the increasing blockage of the drainage system, the vertical displacement of the arch crown and the horizontal displacement of the arch foot of each part of the tunnel showed an increasing trend, and the increase in the horizontal displacement of the arch foot was greater than the vertical displacement of the arch crown. In addition, this trend was not nonlinear. With the increase in the blockage degree of the drainage system, the increase in the lining displacement also became more significant. The comparison between condition 3 and condition 4 shows that under the same blockage degree, the vertical displacement of condition 4 increased by only 1%, and the horizontal displacement of arch foot increased by 1.81% compared with condition 3. This is because the mechanical properties of the primary support concrete were reduced due to the crystallization of calcium carbonate. The results show that the displacement of the lining increased with the extension of the crystallization time of calcium carbonate in the initial support concrete. The increase degree of conditions 3 and 4 is small, which indicates that the influence of the initial support concrete crystallization on lining displacement is limited to within 0–40 d.

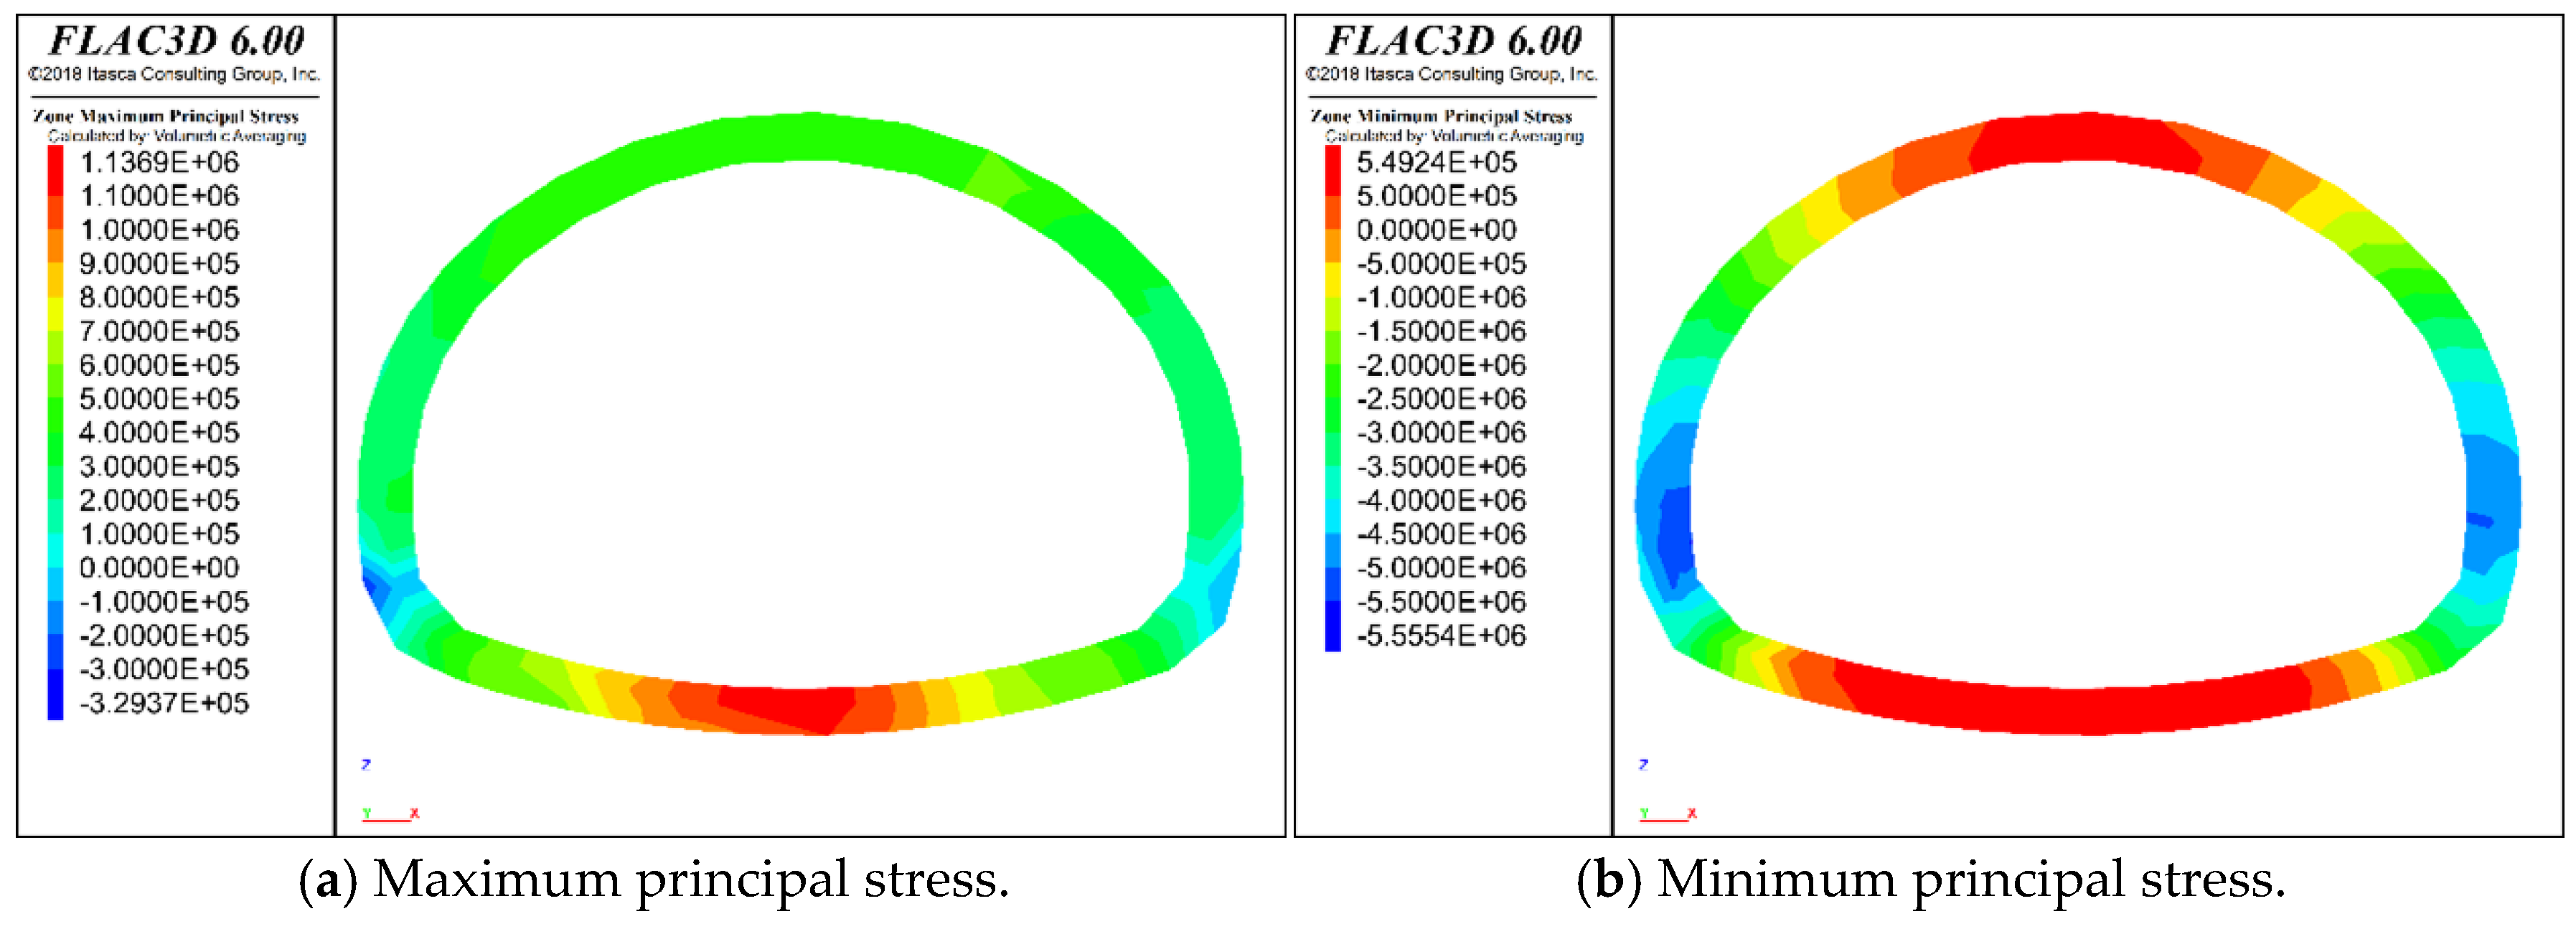
4.3. Stress Analysis

As shown in Figure 11, when the whole tunnel is below the groundwater level, the distribution law of the maximum principal stress and the minimum principal stress of the tunnel lining is consistent. The maximum principal stress of the tunnel lining appears at the position of the lining overhead supply, and the maximum principal stress is positive, indicating that the overhead supply part is under tension. The minimum principal stress of the lining appears at the arch foot, and the minimum principal stress is negative, indicating that the arch foot is under pressure. In addition, the absolute value of the minimum principal stress is greater than that of the maximum principal stress.
As shown in Figure 12, compared with condition 1, the maximum principal stress under condition 2 increased by 3.86%, while the minimum principal stress increased by 4.65%. Under condition 4, the maximum principal stress increased by 10.68%, and the minimum principal stress increased by 7.88%. The comparison of condition 1, condition 2 and condition 4 shows that the maximum and minimum principal stresses of the tunnel lining showed an upward trend with the increase in the blockage degree of the drainage system, which indicates that the stress of the tunnel lining was increasing. By comparing condition 3 and condition 4, it can be observed that under the same blockage degree, compared with condition 3, the maximum principal stress of condition 4 increased by only 0.3%, and the minimum principal stress increased by 0.2%. This is because the crystallization of calcium carbonate in the primary support concrete leads to a decline in its mechanical properties. The results show that the maximum principal stress and the minimum principal stress of the lining show an upward trend with the extension of the crystallization time of calcium carbonate in the initial support concrete. The increase degrees of conditions 3 and 4 are small, which indicates that the effect of initial support concrete crystallization on the stress of the lining structure is limited within 0–40 days.

5. Conclusions

In this paper, aiming at the problems of tunnel lining structure cracking, water leakage and other diseases caused by the precipitation of karst tunnel concrete crystallization, the mechanical properties of concrete specimens in karst water environment erosion and the influence of drainage system crystallization plugging on tunnel lining are studied by using the method of indoor tests and numerical simulation. The main conclusions are as follows:
(1)
The phenomenon of calcium carbonate crystallization in the tunnel initial support concrete gradually appears with the passage of time. The area of the crystalline region diffuses from the edge to the center, accompanied by the formation of holes;
(2)
With the passage of time, the precipitation of calcium ions generated by the cement hydration reaction in concrete gradually increases, leading to the crystallization of calcium carbonate and the increase in pores on the surface of concrete, resulting in the decline of concrete quality, compressive strength and elastic modulus. However, the change range of concrete quality, compressive strength and elastic modulus shows a gradually decreasing trend;
(3)
The change of pore water pressure is mainly caused by the rise of groundwater level caused by the blockage of drainage system. The pore water pressure distribution of each part of tunnel lining shows the rule of arch foot > inverted arch > arch waist > arch crown;
(4)
The stress and displacement of the tunnel lining are affected by the crystallization of the primary support concrete and the blockage degree of the drainage system. With the increase in concrete crystallization and drainage system blockage, the stress and displacement increase accordingly. However, within 0–40 d, the effect of concrete crystallization on lining stress and displacement is relatively small.
This study mainly investigates the erosion effect of karst water on concrete through laboratory experiments, and then conducts finite element simulations to analyze the changes in the mechanical parameters of tunnel lining structures after karst water erosion. The research provides theoretical foundations and practical references for understanding the long-term performance of underground structures affected by karst water, and has significant academic and engineering implications. In future research, we plan to incorporate the simulation of concrete cracks, considering the weakening effect on the cross-section caused by cracks, and conduct further studies using an improved numerical model. This will enhance the accuracy of predicting the behavior of lining structures during karst water erosion, and provide more reliable guidance for the design and maintenance of underground engineering.

Author Contributions

Conceptualization, Y.W. and Z.L.; data curation, Z.L. and L.C.; formal analysis, L.Z. and L.C.; funding acquisition, S.L.; investigation, Y.W.; methodology, S.L. and S.G.; project administration, S.L.; resources, Y.W.; software, S.L.; validation, Z.L.; writing—review and editing, L.Z., L.C., J.L. and J.C. All authors have read and agreed to the published version of the manuscript.

Funding

This research was financially supported by the Chongqing Transportation Technology Project (CQJT2022ZC13), the Science and Technology Research Program of Chongqing Municipal Education Commission (Grant No. KJQN202400748), the Cooperation between Chongqing University and the Institute of Chinese Academy of Sciences (No. HZ2021009), and the Chongqing Talent Innovation and Entrepreneurship Leading Talent Project (CQYC202203091118).

Data Availability Statement

The original contributions presented in this study are included in the article. Further inquiries can be directed to the corresponding author.

Conflicts of Interest

Authors Chao Yehao Wang, Li Zhang and Jie Liu were employed by Chongqing Yuxiang Double Line Expressway Co., Ltd. Authors Zongzhi Li and Jie Chen were employed by The Third Engineering Co., Ltd. Author Liang Cheng was employed by China Merchants Chongqing Communications Technology Research & Design Institute Co., Ltd. The remaining authors declare that the research was conducted in the absence of any commercial or financial relationships that could be construed as a potential conflict of interest.

References

  1. Tian, S.; Wang, W.; Gong, J. Development and Prospects of Railway Tunnels in China (including statistical data of railway tunnels in China as of the end of 2020). Tunn. Constr. (Chin. Engl.) 2021, 41, 308–325. [Google Scholar]
  2. Jiang, S. China highway tunnel data statistics. Tunn. Constr. 2017, 37, 643–644. [Google Scholar]
  3. Wu, M.; Zhang, Y.; Liu, X. Research on disease treatment technology of highway tunnel. J. Undergr. Space Eng. 2007, 3, 967–971. [Google Scholar]
  4. Dai, G.; Zhu, H.; Xia, C. Cause analysis and treatment of a highway tunnel disease. Chin. J. Saf. Sci. 2005, 89–92+139. [Google Scholar]
  5. Miao, X. Analysis of disease causes of JIUYANSHAN tunnel and suggestions on treatment measures. J. Railw. Eng. 2003, 2, 70–72. [Google Scholar]
  6. Li, Z.; Zhang, Y. Stability analysis and treatment technology of lining cracking tunnel. Mod. Tunn. Technol. 2004, 41, 26–31+40. [Google Scholar]
  7. Pan, H.; Yang, L.; Huang, K. Research on bias effect and lining crack of highway tunnel. J. Rock Mech. Eng. 2005, 3311–3315. [Google Scholar]
  8. Wang, J.; Zhu, H.; Tang, Y.; Zhou, N.; Ye, C.; Lu, Y. Monitoring and analysis of crack movement in multi arch tunnel. J. Civ. Eng. 2007, 40, 69–73. [Google Scholar]
  9. Li, H.; Ye, F.; Yang, Y.; Xie, X.; Sheng, J. Cause analysis and control technology of water leakage in power tunnel. East China Power 2011, 39, 1311–1313. [Google Scholar]
  10. Lin, C. Research on the Mechanism of Water Leakage and Grouting Treatment of Operating Tunnel Lining. Ph.D. Thesis, Shandong University, Jinan, China, 2017. [Google Scholar]
  11. Liu, T.; Zhu, H.; Xia, C.; Li, Z.; Li, G. Investigation results and analysis of lining cracking and leakage of multi arch tunnels in Yunnan Province. Chin. J. Highw. 2004, 65–68. [Google Scholar]
  12. Li, G.; Guo, J. Causes, prevention and treatment of tunnel lining cracks and leakage. Railw. Constr. 2003, 23–25. [Google Scholar]
  13. Shi, J. Research on the Mechanism and Prevention Technology of Water Leakage in Multi Arch Tunnel. Ph.D. Thesis, Chongqing University, Chongqing, China, 2012. [Google Scholar]
  14. Fu, J. Research on the Causes of Water Leakage in Highway Tunnels and Its Impact on Lining Structures. Master’s Thesis, Southwest Jiaotong University, Chengdu, China, 2012. [Google Scholar]
  15. Zhai, M. Study on the Law of Crystal Blockage in Tunnel Drainage System in Limestone Area. Master’s Thesis, Chongqing Jiaotong University, Chongqing, China, 2016. [Google Scholar]
  16. Ye, F.; Tian, C.; He, B.; Zhao, M.; Wang, J.; Han, X.; Song, G. Crystallization blockage test of under construction tunnel drainage system. Chin. J. Highw. 2021, 34, 159–170. [Google Scholar]
  17. Zhou, Z. Mechanism Research and Treatment Suggestions on Tunnel Drainage Pipe Blockage by Groundwater Seepage Crystallization in Karst Area. Master’s Thesis, Chang’an University, Xi’an, China, 2015. [Google Scholar]
  18. Jian, B.; Lu, T.; Li, S.; Yin, K. Influence of groundwater buoyancy on the safety of underground building structures. Civ. Archit. Environ. Eng. 2010, 32, 56–60. [Google Scholar]
  19. Li, P.; Zhang, D.; Fang, Q.; Liu, Y.; Li, B. Mechanical characteristics of subsea tunnel support structure based on continuum model. J. Beijing Jiaotong Univ. 2009, 33, 7–12. [Google Scholar]
  20. Fang, Q.; Zhang, D.; Huang, M. Analysis of seepage in subsea tunnel based on continuum model. J. Rock Mech. Eng. 2007, 26 (Suppl. S2), 3776–3784. [Google Scholar]
  21. Jiang, H. Comprehensive Study on Drainage Hole Simulation Method in Seepage Calculation. Master’s Thesis, Hohai University, Nanjing, China, 2007. [Google Scholar]
  22. Wang, E.; Wang, H.; Sun, Y. Study on numerical model of three-dimensional fracture network seepage. In The Professional Committee of Structural Engineering of the Chinese Society of Mechanics, the Editorial Board of Engineering Mechanics of the Chinese Society of Mechanics, the Science and Technology Association of Guangxi Autonomous Region, Guangxi University, and the Department of Civil Engineering of Tsinghua University Proceedings of the Sixth National Conference on Structural Engineering (Volume II); Department of water conservancy and Hydropower Engineering, Tsinghua University: Beijing, China, 1997. [Google Scholar]
  23. Wang, E.; Wang, H.; Wang, H. Discussion on the Simulation Method of Drainage Hole Curtain “Replacing Wells with Cracks”. J. Rock Mech. Eng. 2002, 21, 98–101. [Google Scholar]
  24. Negi, A.S.; Kumar, B.; Kumar, A.; Rawat, S.K.; Yaseen, M. Investigation of heat flux and heat source/sink effect on heat transfer ferrofluid (CoFe2O4-H2O) flow in an induced magnetic field with porous medium within the horizontal channel. Int. J. Ambient. Energy 2025, 46, 2447939. [Google Scholar] [CrossRef]
  25. Negi, A.S.; Kumar, B. Nano-ferrofluid (Mn–Zn, CoFe2O4, Fe3O4) flow in a permeable channel with induced magnetic field. Waves Random Complex Media 2023, 1–28. [Google Scholar] [CrossRef]
  26. Saini, A.; Negi, A.S.; Kumar, A.; Chamkha, A.J. Radiative convective heat transfer and magneto-hydrodynamic flow in a viscous fluid-saturated porous channel with variable thermal conductivity. Int. J. Ambient. Energy 2024, 45, 2406908. [Google Scholar] [CrossRef]
  27. Tong, Y.; Ye, F.; Tian, C.; Zhang, J.; Jiang, Y.; Han, X.; Li, Y. Optimizing the development and field application of calcium stabilizing agents for preventing calcium leaching in tunnels. J. Clean. Prod. 2024, 449, 141757. [Google Scholar] [CrossRef]
  28. Liu, L.; Xie, M.; He, Y.; Li, Y.; Huang, X.; Cui, X.; Shi, C. Expansion behavior and microstructure change of alkali-activated slag grouting material in sulfate environment. Constr. Build. Mater. 2020, 260, 119909. [Google Scholar] [CrossRef]
  29. Liu, L.; Liu, H.; Xu, Y.; Xiang, J.; He, Y.; Zheng, G. Mechanical Properties and Microstructure of Alkali-Activated Slag Grouting Materials Exposed to Flowing NaHCO3 Solution. J. Mater. Civ. Eng. 2022, 34, 04022332. [Google Scholar] [CrossRef]
  30. Cang, L.; Qiu, B. Qiu Buyi Hypothesis, and Qiu Buyi Formula. Hydrogeol. Eng. Geol. 1983, 54–55. [Google Scholar]
  31. Zheng, B.; Wang, J.; Wu, J. Study on calculation method of lining water pressure based on equivalent permeability coefficient. Mod. Tunn. Technol. 2011, 48, 43–46+57. [Google Scholar]
  32. Zheng, B. Study on Practical Calculation of Water Pressure Load on Tunnel Lining. Ph.D. Thesis, China Academy of Railway Sciences, Beijing, China, 2010. [Google Scholar]
Figure 1. Surface crystallization of concrete at different crystallization days.
Processes 13 00568 g001
Figure 2. Analysis of concrete quality change.
Processes 13 00568 g002
Figure 3. Change analysis of concrete compressive strength.
Processes 13 00568 g003
Figure 4. Change analysis of concrete elastic modulus.
Processes 13 00568 g004
Figure 5. Schematic diagram of equivalent permeability coefficient of lining.
Processes 13 00568 g005
Figure 6. Calculation model.
Processes 13 00568 g006
Figure 7. Cloud chart of pore water pressure under different working conditions.
Processes 13 00568 g007
Figure 8. Pore water pressure values at various parts of the tunnel.
Processes 13 00568 g008
Figure 9. Cloud chart of tunnel lining displacement (taking condition 1 as an example).
Processes 13 00568 g009
Figure 10. Maximum displacement of tunnel lining.
Processes 13 00568 g010
Figure 11. Cloud chart of tunnel lining stress (taking condition 1 as an example).
Processes 13 00568 g011
Figure 12. Maximum principal stress of tunnel lining under different working conditions.
Processes 13 00568 g012
Table 1. Statistics of tunnel drainage volume.
Test PointWater Depth (cm)Ditch Width (cm)Average Velocity (m/s)Drainage (m3/d)
125300.805203
233300.514362
314300.612210
410300.34876
54300.20207
626300.251678
715300.321224
8///2251
Total discharge 18,011 m3/d
Table 2. Groundwater level under different degrees of crystal blockage.
Degree of Crystalline Blockage of Drainage System (%)Initial Groundwater Level Height (m)Groundwater Level Drawdown (m)Height of Groundwater Level After Stabilization (m)
06016.3543.65
40609.8150.19
80604.9155.09
Table 3. Material parameters.
MaterialElastic Modulus E (GPa)Poisson’s RatioμBulk Density
γ (kN/m3)
Internal Friction Angle
φ (°)
Cohesion c (MPa)Permeability Coefficient
K (m3/Pa-sec)
Porosity
n
Class IV surrounding rock3.900.3022371.603.3 × 10−80.32
Primary support280.2524//5.0 × 10−130.14
Initial branch of crystallization for 20 d27.440.2523.96//5.0 × 10−130.14
40 d primary crystallization27.300.2523.93//5.0 × 10−130.14
Secondary lining320.2026//5.0 × 10−140.09
40% clogged secondary lining320.2026//3.0 × 10−140.09
80% secondary lining blocked320.2026//1.0 × 10−140.09
Table 4. Calculation conditions.
Working ConditionCrystallization Days (d)Blockage Degree of Drainage System (%)Height of Underground Water Level from Tunnel Top (m)
10043.65
2404050.19
3208055.09
4408055.09
Disclaimer/Publisher’s Note: The statements, opinions and data contained in all publications are solely those of the individual author(s) and contributor(s) and not of MDPI and/or the editor(s). MDPI and/or the editor(s) disclaim responsibility for any injury to people or property resulting from any ideas, methods, instructions or products referred to in the content.

