Article

Development of an LC-MS Method for the Quantitative Determination of Six Organic Acids Produced by Bacterial Fermentation In Vitro and In Vivo

1
Guangdong Provincial Key Laboratory of Silviculture, Protection and Utilization, Guangdong Academy of Forestry, Guangzhou 510520, China
2
Key Laboratory for Biobased Materials and Energy of Ministry of Education, College of Materials and Energy, South China Agricultural University, Guangzhou 510642, China
3
College of Light Industry and Food Engineering, Nanjing Forestry University, Nanjing 210037, China
4
Institute of Veterinary Medicine, Jiangsu Academy of Agricultural Sciences, Key Laboratory of Veterinary Biological Engineering and Technology, Ministry of Agriculture and Rural Affairs, Nanjing 210014, China
*
Authors to whom correspondence should be addressed.
Processes 2025, 13(3), 697; https://doi.org/10.3390/pr13030697
Submission received: 19 January 2025 / Revised: 24 February 2025 / Accepted: 25 February 2025 / Published: 28 February 2025
(This article belongs to the Section Chemical Processes and Systems)

Abstract

:
Due to the strong polarity and volatility of organic acids, there is often a lack of effective quantitative methods for organic acids in vivo or in vitro. This study introduced a robust and scientifically validated LC-MS methodology for quantitatively analyzing six organic acids, encompassing five short-chain fatty acids and lactate, observed in in vitro fermentation and human fecal samples. This method was able to achieve precise quantification through the monitoring of mass-to-charge (m/z) ratios of the deprotonated negative ions. After optimization, a 2:1 (v/v) dichloromethane/acetonitrile mixture was utilized to extract the crude acid mix from fermentation or fecal samples. Subsequently, the organic acids were isolated using 3 mL of 3.5 M ammonium hydroxide solution from mixtures. The calibration curves for six organic acids demonstrated linearity with R2 > 0.991 across the concentration ranges of 0.01–5.0 or 0.01–20 mM. The coefficient of variation and accuracy were 2–13% and 95–128%, respectively, which exhibited good precision and sensitivity. Accurate quantification of organic acids would aid in metabolic analysis in bacterial culture supernatants and human fecal matter.

1. Introduction

In recent years, the significance of intestinal health has been increasingly recognized due to its association with various chronic and infectious diseases in both humans and animals [1]. The gastrointestinal tract harbors a diverse array of bacterial species, whose activities and compositions are profoundly influenced by diet-derived substrates that resist digestion in the small intestine. The intestinal breakdown of these substrates, including indigestible carbohydrates, proteins, and other prebiotics, leads to the generation of significant quantities of organic acids, including short-chain fatty acids (SCFA) and lactic acid. These acids are predominantly absorbed throughout the digestive tract and play pivotal roles in host-microbiota interactions [2].
The production of organic acids is crucial for the energy acquisition of microbiota in the large intestine and for the host’s physiological functions, such as maintaining gut pH balance and supplying energy to colonic cells [3]. Specific acids like acetate are known to stimulate lipogenesis [4], while propionate is known to inhibit hepatic cholesterol synthesis [5] and modulate the metabolic functions of enterocytes, thereby influencing intestinal fat transport [6]. Butyrate, a preferred energy source for colonocytes, possesses anti-proliferative properties, influences gene expression, and modulates immune responses [7]. The content and regional differences of total SCFA in the intestinal tract generally affect the health state of the colon and are important factors in cancer development and gastrointestinal disorders, which often occur under low SCFA concentrations. In addition, the levels of lactic acid might influence the modulation of diarrhea in individuals with ulcerative colitis [8]. The concentrations of organic acids in feces are associated with various conditions, including diarrhea, cancer, inflammatory bowel disease, irritable bowel syndrome, and cardiovascular diseases [9,10,11]. Human studies of plasma acid levels also indicate that intestinal organic acids released from the gut can be taken up by the normal and cirrhotic liver [12]. There is mounting evidence suggesting that a majority of organic acids are crucial for sustaining the health of humans and animals.
Various methodologies, such as centrifugation [13,14] with filtration [15,16,17], lipid extraction [18], and solid-phase extraction [19], have been employed to isolate organic acids from intricate matrices. These straightforward and rapid techniques are often paired with chromatography. Typically, the quantification of organic acids in intestinal or fecal cultures is performed using gas chromatography (GC) with either flame-ionization detection [20,21,22] or mass spectrometric detection [23,24,25], after steam distillation, vacuum distillation, or ultrafiltration. However, the GC derivatization process is intricate and time-intensive, usually resulting in inadequate separation of smaller compounds from the solvent peak and poor recovery rates [26], which limits the number of acids quantifiable. High-performance liquid chromatography (HPLC) has been widely utilized for decades to analyze organic acids in diverse matrices, including beverages, food products, and biological fluids [18,19,20,21,27]. Although the analysis by GC, HPLC, or capillary electrophoresis seems straightforward [26], the extreme complexity and variability in concentration and composition of extracts from bacterial fermentation cultures or feces present significant challenges in detecting all components. Mass spectrometry (MS) has the great advantage of enhancing the selectivity and sensitivity of detection for unresolved components and concurrently providing structural information. The sensitivity is notably amplified in LC-MS studies through the use of atmospheric pressure chemical ionization, particularly in analyzing fatty acids [28]. The LC-MS technique surpasses LC-UV in sensitivity, especially for LC-MS/MS methodology employing selected ion monitoring with greater sensitivity [29]. Porous graphitic carbon is a versatile stationary phase [30,31], known for its sensitivity and structure discernment in LC-MS, which can be applied to the analysis of carbohydrates [32,33,34,35], peptides [36], nucleosides [37], drugs [38,39,40,41], and pesticides [42].
This study aims to refine the LC-MS methodology using a graphite column for the sensitive, precise, and rapid quantification of six targeted organic acids in bacterial fermentation cultures and human fecal samples. It emphasizes a straightforward, cost-effective sample preparation procedure with a less time-consuming analysis (≤5 min), laying a foundation for efficient quantification of organic acids.

2. Materials and Methods

2.1. Reagents

Ammonium hydroxide, dichloromethane (HPLC grade), and standards of acetic acid, propionic acid, butyric acid, valeric acid, hexanoic acid, and lactic acid were obtained from Sigma-Aldrich (St. Louis, MO, USA). Hydrochloric acid was purchased from EM Science/MERCK (Darmstadt, Germany). Acetonitrile (Optima) was obtained from Fisher Scientific (Fair Lawn, NJ, USA). Peptone, yeast extract, NaCl, K2HPO4, KH2PO4, MgSO4·7H2O, CaCl2·6H2O, NaHCO3, L-cysteine, bile salts, Tween 80, and glucose were offered by Macklin Biochemical Technology Co., Ltd. (Shanghai, China). Resazurin solution was from Thermo Fisher Scientific (Oxoid Ltd., Waltham, MA, USA). Milli-Q deionized water was used in this study.

2.2. Organic Acid Extraction

All procedures were conducted at 4 °C. Acid standards were added to 5 mL aliquots of medium in glass tubes, mixed, and equilibrated for 5 min. A total of 100 µL concentrated HCl was added into the tubes and mixed for 15 s (pH 1–2). A total of 1.25 mL specific solvent of dichloromethane/methanol, dichloromethane/acetonitrile, or dichloromethane/hexane was added and vigorously mixed using a vortex for 20 min. After the phases spontaneously separated for 20–30 min, the extraction solvent that would be optimized for acid extraction was decanted using a Teflon plunger syringe (Hamilton, Reno, NV, USA) into another glass tube. The acid solution was washed 3 times with an additional 1.25 mL aliquots of solvent, resulting in a 5 mL total extract. A 3.5 mol/L solution of NH4OH was added to the 5 mL extract and agitated by using a vortex for 10 min. After the phases spontaneously separated for 20–30 min, the aqueous solution containing the acid standards was decanted using a syringe. The 5 mL extraction solution was re-extracted with NH4OH three times. The resultant ammonical solution was transferred and collected in an autosampler vial.
After extraction, the sample was subjected to LC-MS analysis without further sample cleanup. The stability of the six acids at different concentrations was also evaluated in the resultant solution on both the first day and the second day at 4 °C.

2.3. LC-MS

An Agilent HPLC 1100 series system in tandem with a single-quadrupole Agilent MSD mass spectrometer equipped with an electrospray ion source was controlled by ChemStation (Agilent Technologies, Santa Clara, CA, USA). Chromatographic resolution was achieved on a stationary phase consisting of a 3 µm porous graphitic carbon column (100 × 2.1 mm i.d., Thermo Fisher Scientific) at ambient temperature with a mobile phase of 10% acetonitrile in 0.01% (v/v) NaOH at a 0.5 mL/min flow rate and a 5 min run time.

2.4. Standard Curves

An internal standard method was used in our study to determine the standard curves of six organic acids. Different concentrations of standards were added to the media containing bacterial fermentation products. Then, the samples underwent the extraction procedure. The acid concentration in products was subtracted from the total measured amount to give the incremental increase that could be attributed to the added standard. The peak area (Y) for each organic acid was regressed against the nominal concentration of the test acid (X, mmol/L) with a weighting of the reciprocal concentration (1/X) to create each standard curve. Its closeness of fit was calculated as the regression coefficient R2.

2.5. Accuracy and Precision

To determine the accuracy of this method, standard mixtures of acetic acid, propionic acid, butyric acid, valeric acid, hexanoic acid, and lactic acid were analyzed five times individually at 0.1, 0.5, 1.0, and 2.5 mmol/L concentrations, respectively. The peak area of each standard acid dissolved in diluted NH4OH was expressed as A1. The primary stock solution of the six standard acids was mixed in a blank culture medium and subjected to the same extraction protocol, in which the area of peaks was shown as A2. Recoverya = A1/A2 × 100%.
Moreover, 0.5, 1.0, and 2.5 mmol/L of six mixed acids were added into bacterial fermentation medium, respectively, to measure the efficiency of recoveryb for the extraction protocol. The increase in acid concentration after extraction from the fermentation medium was divided by the value of the added standards and multiplied by 100, which was the percentage recoveryb. These experiments were repeated three times.
The precision, expressed as CV, was also calculated in both blank culture medium and bacterial fermentation cultures.

2.6. Fermentation Medium

The culture medium (per liter) contained 5 g peptone, 5 g yeast extract, 0.4 g NaCl, 0.04 g K2HPO4, 0.04 g KH2PO4, 0.0192 g MgSO4·7H2O, 0.008 g CaCl2·6H2O, 0.4 g NaHCO3, 1.0 g L-cysteine, 1.0 g bile salts, 0.2 mL Tween 80, and 0.8 mL 0.025% resazurin solution.
The strain used in this study was Lactobacillus acidophilus, which was incubated in the culture medium with 10 g/L glucose for 36 h at 37 °C. Then, the bacterial cells were isolated, washed, and re-suspended in the culture medium with 2 g/L xylo-oligosaccharides [43] as the carbohydrate source and incubated at 37 °C for 48 h. The fermentation medium, after centrifugation and filtration, was stored in sealed glass tubes at 4 °C until analysis.

2.7. Measuring Individual Variation

Four cultured bacteria for measuring individual variation were Bifidobacteria longum, Lactobacillus acidophilus, Campylobacter jejuni, and Escherichia coli, which were incubated at 37 °C in an anaerobic chamber, respectively. The culture media were fermented for 48 h with 2 g/L final xylo-oligosaccharides (XOS) as the sole carbon source. The fermentation samples were centrifuged at 10,000× g for 10 min at 4 °C. The supernatant was passed through a 0.22-μm syringe filter, and the filter was sealed and immediately placed into a 4 °C autosampler for organic acids analysis. Each group consisted of five replicates, and each experiment was repeated three times.
Fresh fecal samples were collected from four healthy persons who had not received antibiotics or pre/probiotics and had no recent history of gastrointestinal disorders. Each sample was prepared as a 22.5 mg/mL slurry of feces in pre-reduced phosphate-buffered saline (PBS; pH 7.2; Oxoid Ltd., Basingstoke, UK). An aliquot of the slurry was centrifuged at 10,000× g for 10 min at 4 °C, weighted in 6 parallels, and analyzed for organic acid content. Analysis was initiated within 2 h of initial sample collection to ensure that the organic acids were representative of fresh stools, which were taken to represent the colonic microbiota.

2.8. Statistical Analysis

Data and charts were processed using GraphPad Prism 8.0 (GraphPad Software, San Diego, CA, USA) and Microsoft Office 2010. The statistical significance of differences was assessed by a two-way analysis of variance that incorporates a posttest Bonferroni correction for multiple comparisons. Differences with p-values equal to or lower than 0.05 were considered significant.

3. Results and Discussion

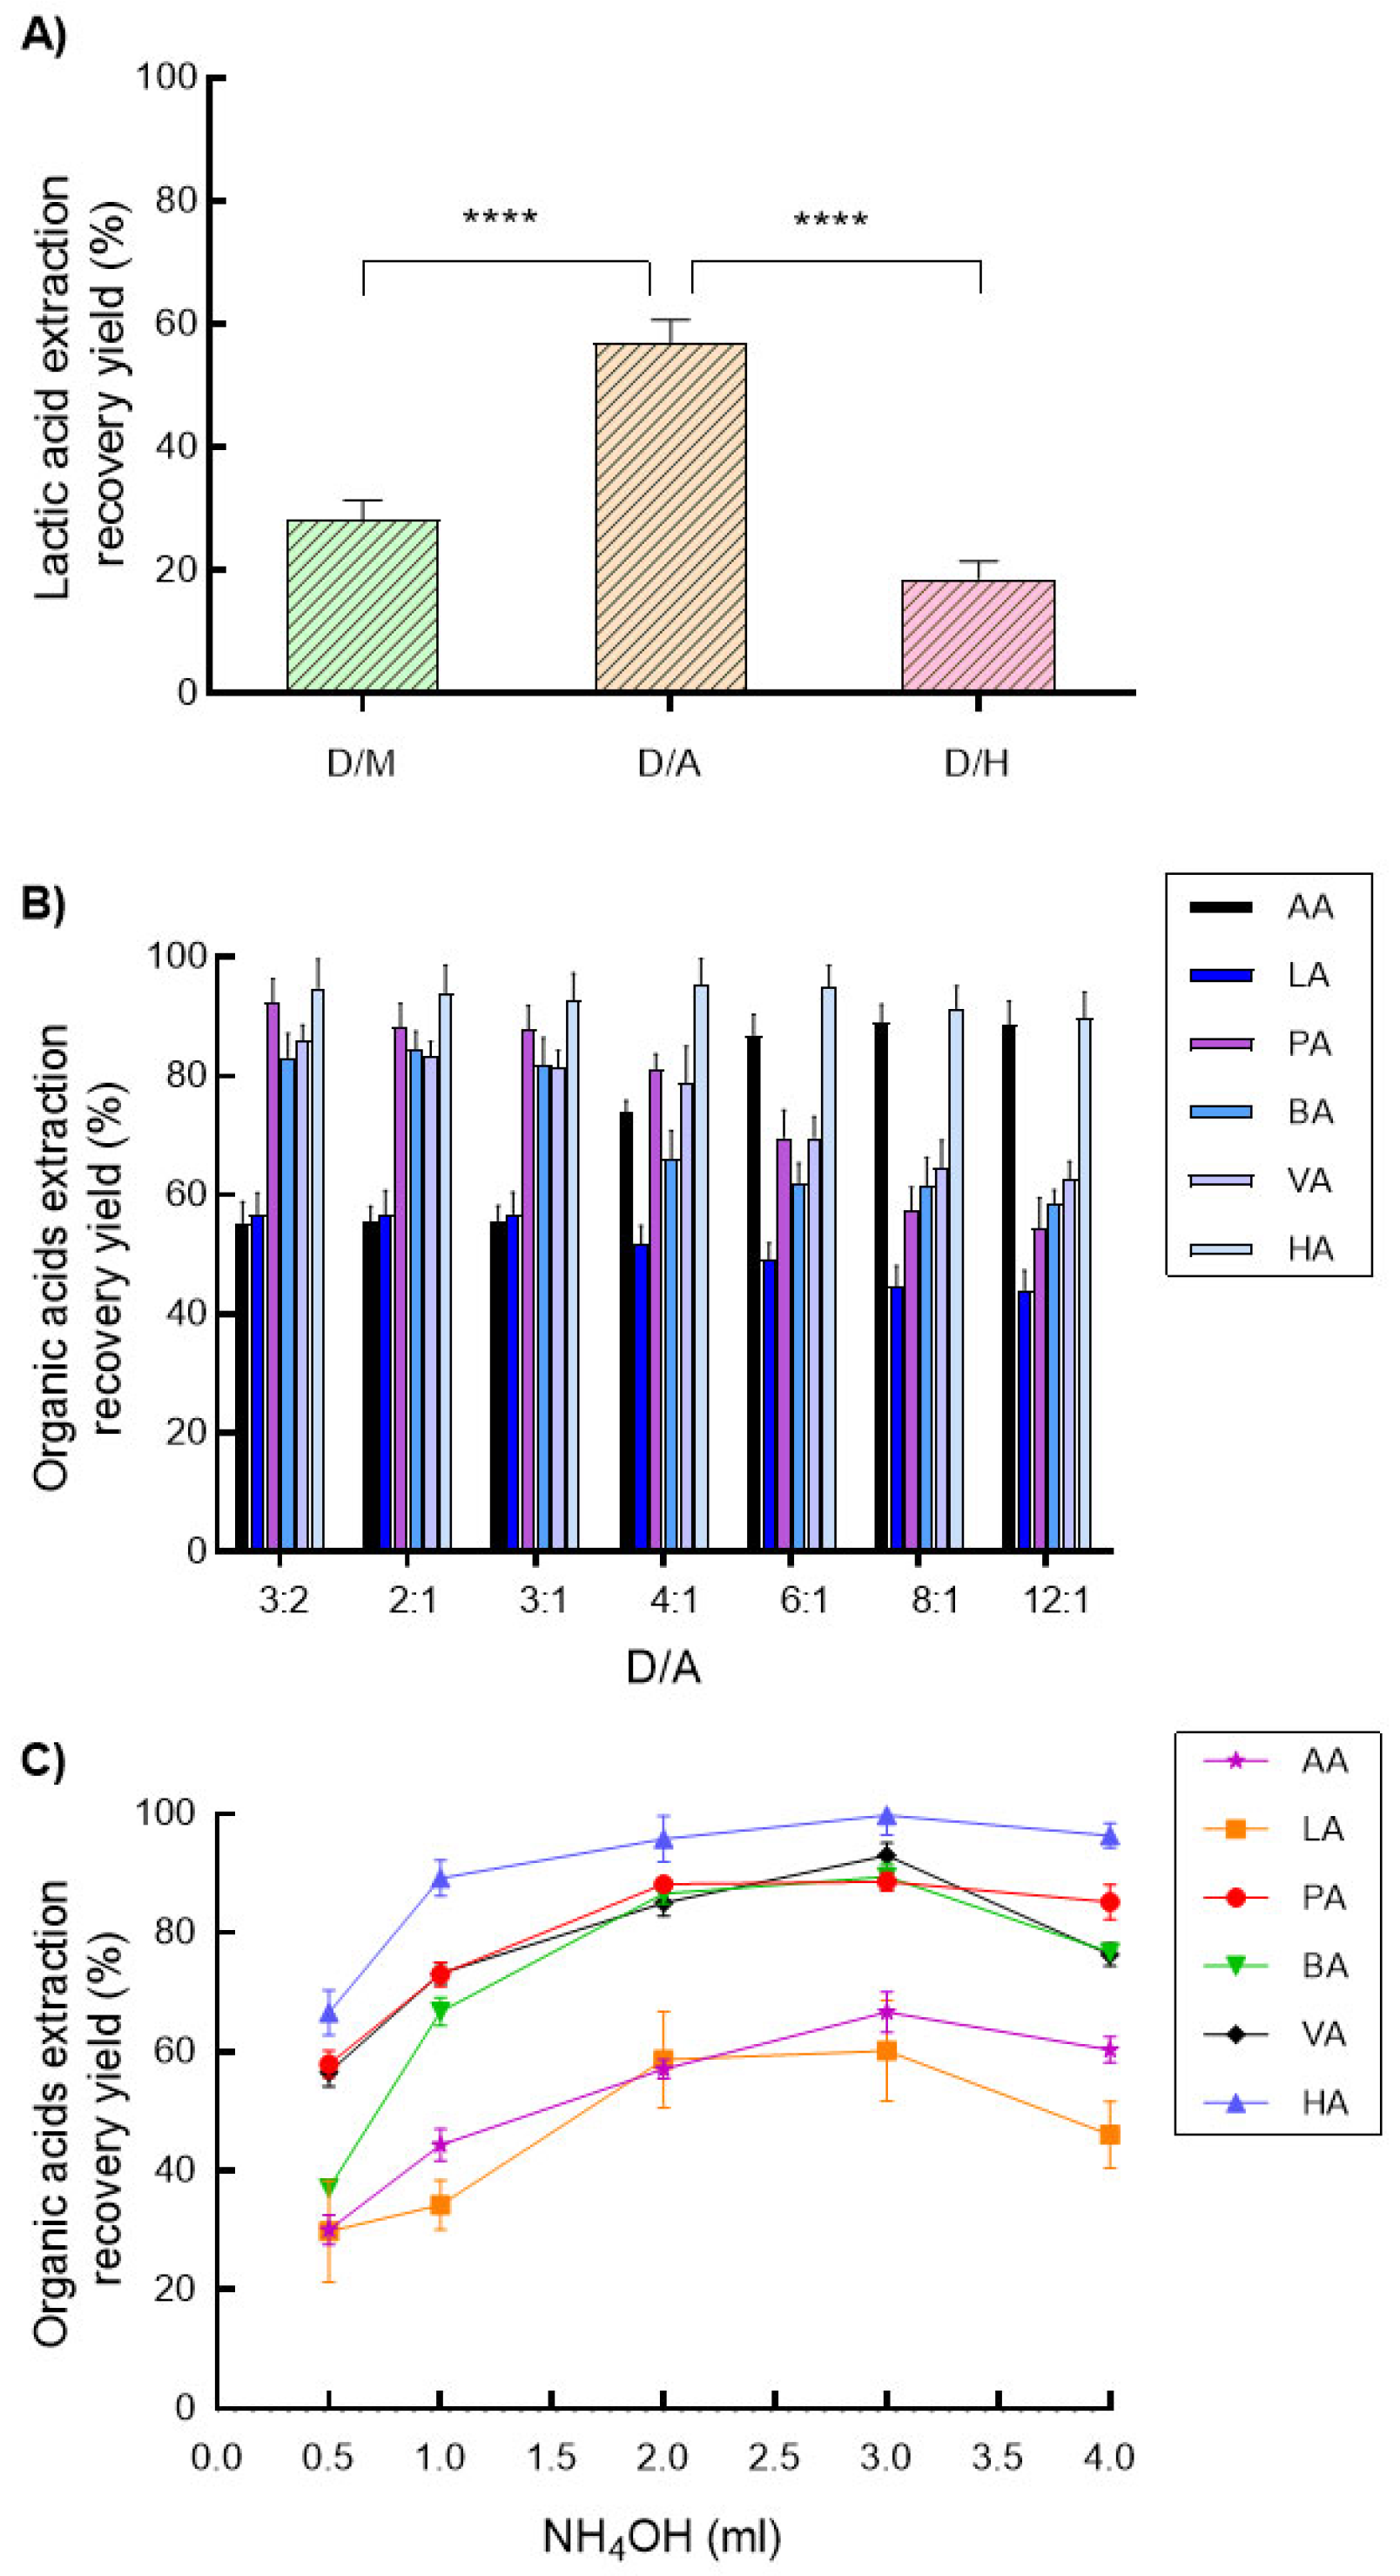
3.1. Optimization of Organic Acid Extraction

The test of organic acids from cultures containing salts and other fermentation byproducts is obstructed in LC-MS due to their polarity and volatility. If the inorganic salt from the injection solution builds up in the instrument, it can deteriorate the performance of a mass spectrometer. Moreover, the determination of organic acids in cultures requires minimal extraction steps to allow high-throughput routine analysis of large numbers of samples. To balance these opposing considerations, reaction conditions were optimized first for rapid and complete extraction with minimal reagent usage in this study.
Recovery yields of lactic acid (LA) extraction in a blank culture medium by a 2:1 (v:v) ratio of dichloromethane/methanol (D/M) partition, dichloromethane/acetonitrile (D/A), and dichloromethane/hexane (D/H) as extraction solvent, respectively, were compared with 2 mL of 3.5 mol/L NH4OH for further extraction (Figure 1A). The highest recovery yield of LA was 57 ± 4% by the D/A partition, while it was 28 ± 3% by D/M (p < 0.0001) and 19 ± 3% by D/H (p < 0.0001).
To optimize the extraction effect of D/A, recovery yields of six organic acids by seven relative ratios of D/A (3:2, 2:1, 3:1, 4:1, 6:1, 8:1, and 12:1; v:v) were compared (Figure 1B). First, different acids showed their own trends in recovery yields. The recovery yields of LA, propionic acid (PA), butyric acid (BA), and valeric acid (VA) decreased with increasing D/A ratios, while acetic acid (AA) showed the opposite trend; meanwhile, no significant effect was observed for hexanoic acid (HA) at different D/A ratios. Second, different acids had the different highest extraction recovery yields. At a 3:2 (v:v) relative ratio of D/A, LA, PA, BA, and VA all got the highest recovery yields, which were 57 ± 4%, 92 ± 4%, 83 ± 4%, and 86 ± 3%, respectively. Recovery yields of AA were similarly highest in 6:1, 8:1, and 12:1 ratios of D/A (87–89%), whereas HA recovery varied between 90% and 96% across the seven D/A ratios. Third, among the six tested acids, HA achieved the highest recovery yield of 96% at a 4:1 D/A ratio, while LA had the lowest recovery yield of 44% at 12:1 D/A. Considering the simplicity and operability of the extraction protocol for LC-MS quantitation and the stability of trend lines in Figure 1B, the final ratio of D/A for extracting AA, LA, PA, BA, VA, and HA in a single injected sample was chosen as 2:1, with recovery yields of 56 ± 3%, 57 ± 4%, 88 ± 4%, 84 ± 3%, 83 ± 3%, and 94 ± 5%, respectively.
In the last extraction step, the usage of NH4OH also impacted the extraction effect and organic acid quantification. Figure 1C showed the recovery yields of six acids when 0.5, 1.0, 2.0, 3.0, and 4.0 mL of 3.5 mol/L NH4OH were added into the 5 mL initial extract (pH = 9–10), respectively. Each acid achieved the highest recovery yield when the amount of 3.5 mol/L NH4OH was 3 mL, which also resulted in a relatively lower standard deviation (SD).
Accordingly, these extraction conditions of a 2:1 (v:v) ratio of D/A and a 3 mL volume of 3.5 mol/L NH4OH were adopted in this study. The final extraction recovery yields of AA, LA, PA, BA, VA, and HA were up to 67 ± 3%, 60 ± 8%, 89 ± 2%, 89 ± 2%, 93 ± 2%, and 99 ± 3%, respectively. Hence, the target organic acids exhibited different levels of derivation. The higher recovery yields under optimized conditions in this study facilitate quantitative analysis of organic acids produced by bacterial fermentation both in vitro and in vivo.

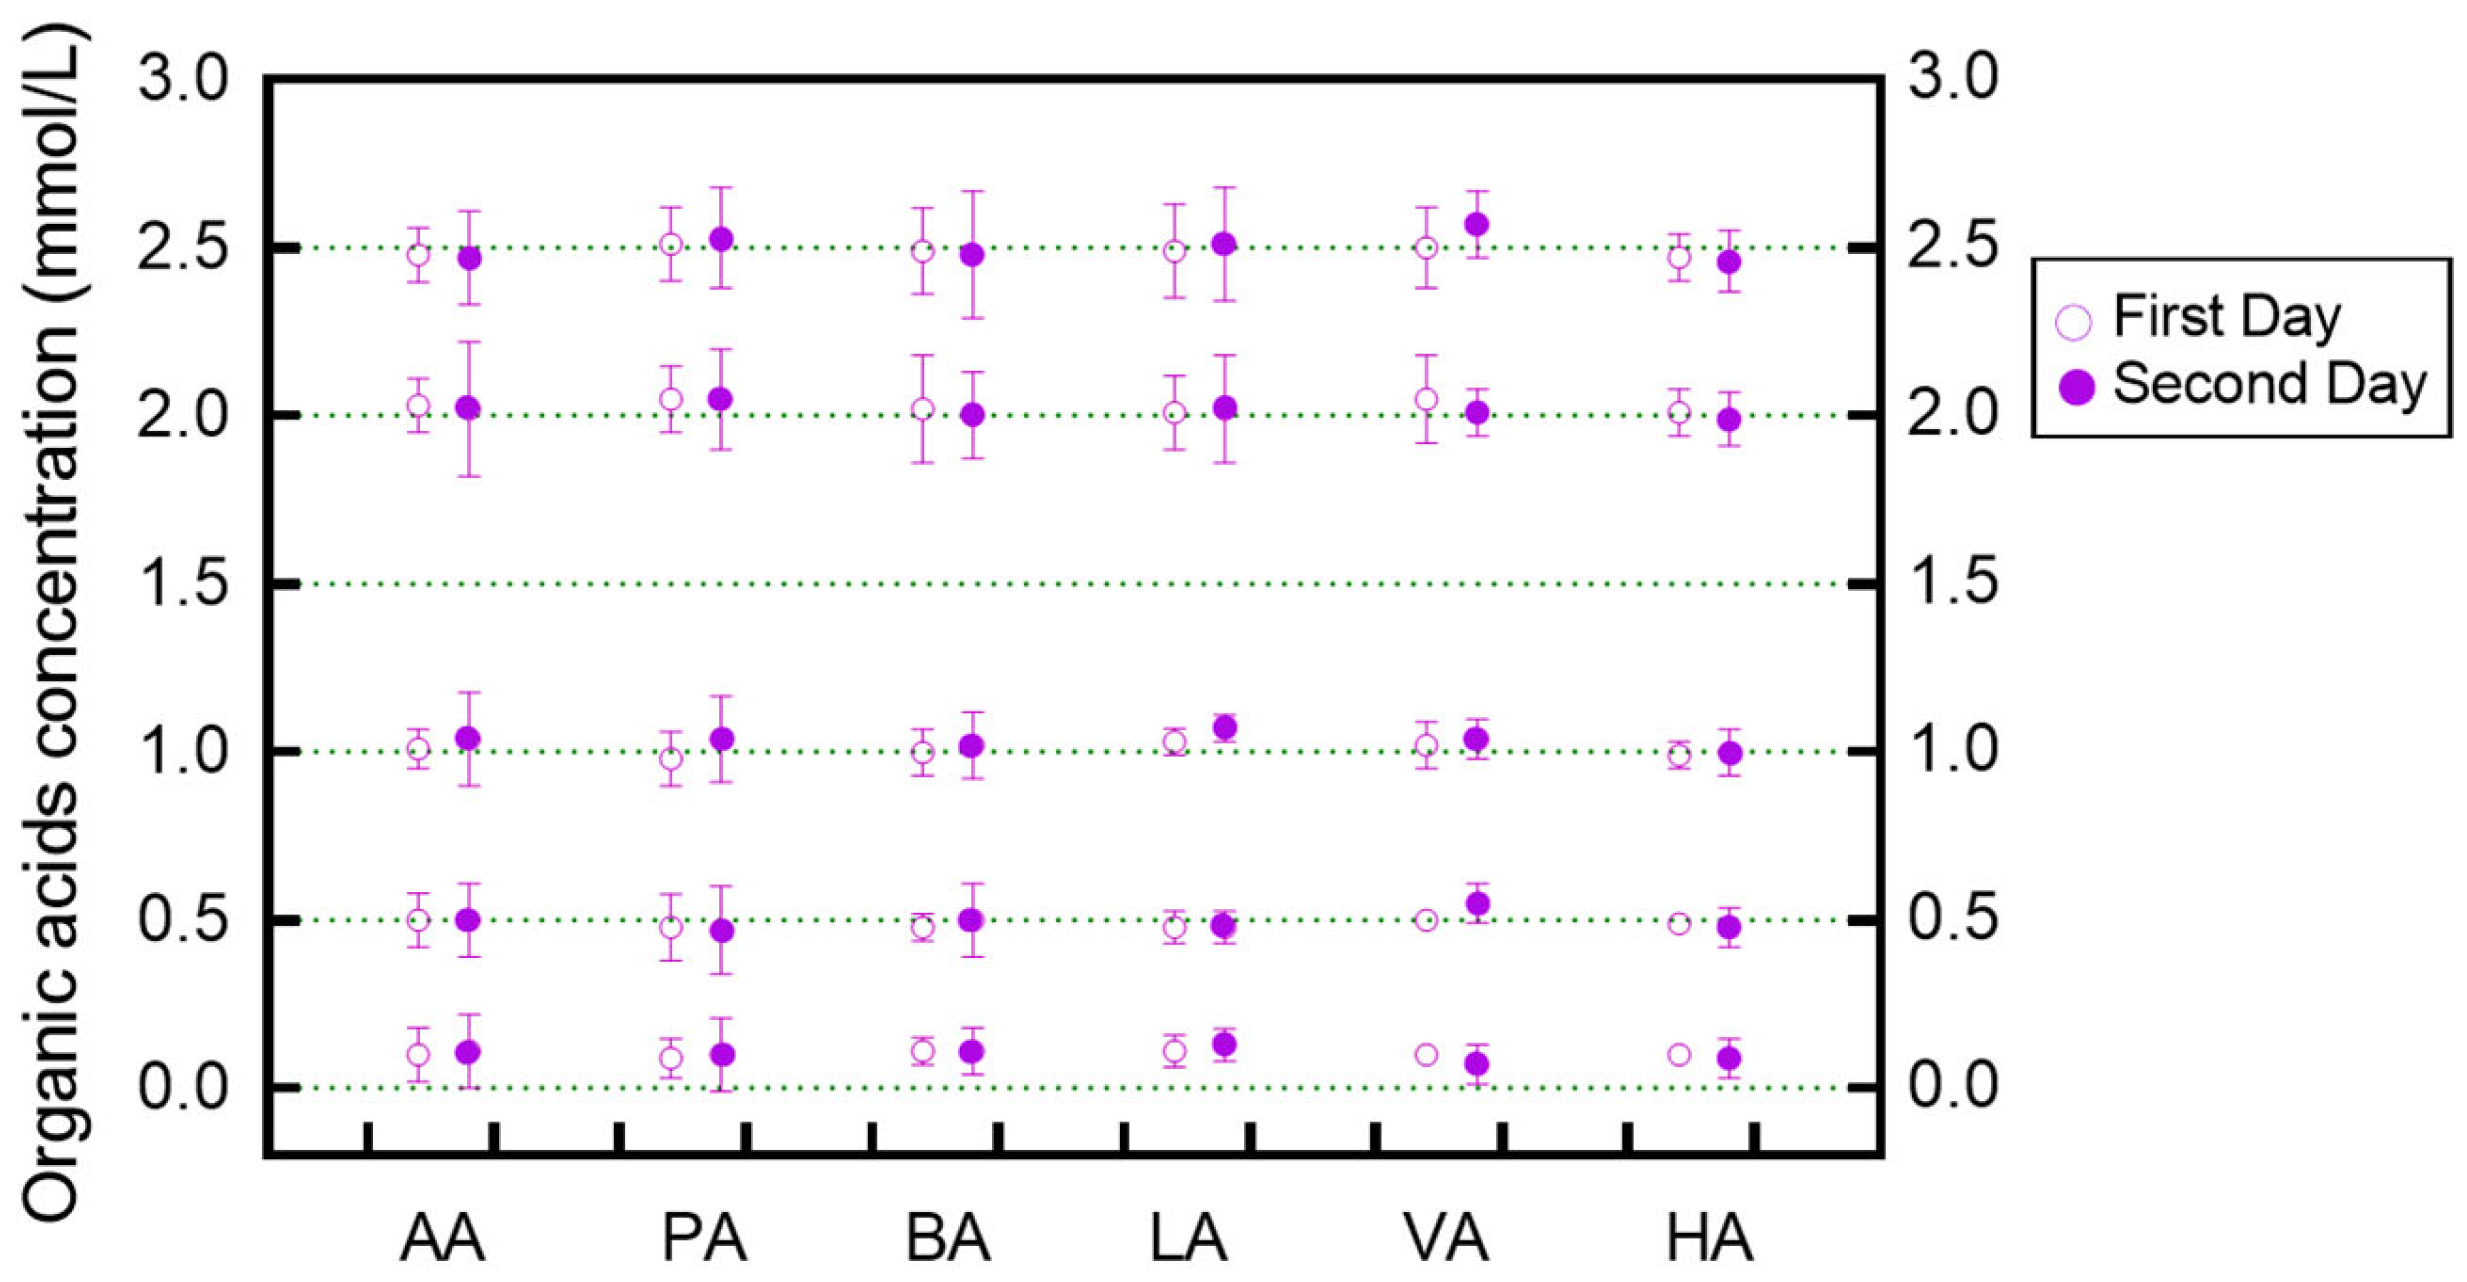
3.2. Stability of Organic Acid Extraction

In previous studies on organic acid detection methods, only LOD, LOQ, linearity of standards, recoveries, and reproducibility were considered [44,45], without a systematic investigation of the extraction rate and stability of short-chain fatty acids. Apart from lactic acids, the other five organic acids in our study are short-chain fatty acids that are volatile. After ammonium hydroxide extraction, it is necessary to evaluate the stability of the organic acids in LC-MS quantification. Concentrations of 0.1, 0.5, 1.0, 1.5, 2.0, and 2.5 mM organic acids were dissolved in the NH4OH solution, respectively, and detected on the first day and the second day at 4 °C (Figure 2). Six tested concentrations of the six organic acids were all closer to the theoretical concentrations on both days. The five short-chain fatty acids and lactic acid in different concentrations were relatively stable in the time to be measured, although the stability of the data slightly decreased over time. Overall, the standard deviation of the six acids on the second day was higher than on the first day. Loading acid samples into an autosampler or storing them at 4 °C between preparation and analysis in two days did not interfere with accurate quantification. Hence, it is recommended to complete the detection of the six organic acids within 24 h after extraction.

3.3. Method Validation

The dynamic range and linearity for the simultaneous quantification of the six organic acids were evaluated through the use of a series of different fold dilutions as standard curves (Table 1). The relationship between concentration and response for each standard was linear within a certain concentration range. The lowest limit of quantification (signal-to-noise ratio ≥ 1000) was 0.01 mM for each acid, which was more sensitive than other methods [43]. The maximal detection concentrations of acetic acid, propionic acid, butyric acid, lactic acid, valeric acid, and hexanoic acid were 10, 5, 10, 20, 5, and 5 mM, respectively. The excellent linearity of the curve over the entire dynamic range was evident from the coefficient of determination (R2) being more than 0.991 for all tested standards.
The precision and accuracy of this method were also tested at 0.1, 0.5, 1.0, and 2.5 mM concentrations for each standard, as shown in Table 2. A known amount of each standard was added individually into a blank culture medium, which was then extracted with 1.25 mL D/A (2:1) four times using 3 mL 3.5 mol/L NH4OH. The precision was expressed as CV, and the accuracy was shown as recovery. The range of CVs for all standards was 2–11%. The recovery, showing the comparison between the actual and measured values, ranged from 92% to 112% in this study. This extraction and detection method showed good precision and accuracy.
To measure the effects of the acid matrix on the response factor (regression curve), precision, and accuracy of acid extraction from medium, six acid standards at 0.5, 1.0, and 2.5 mM authentic concentrations were added to aliquots of bacterial fermentation medium (Table 3). The recovery range of six acids was from 95% to 105%, indicating that this sample pretreatment method could efficiently extract these organic acids. The CVs were all less than 16%, verifying the higher ability of this extraction method to test organic acids in bacterial fermentation products. Due to the limitation of the LC-MS detector, the precision and accuracy of the data for 0.1 mM standard organic acids added to bacterial fermentation medium were relatively low; hence, they were not shown in this table.
Based on the results in Table 1, Table 2 and Table 3, the quantification of AA, PA, BA, LA, VA, and HA from bacterial fermentation medium was scientifically feasible with an optimized extraction process using the LC-MS method.

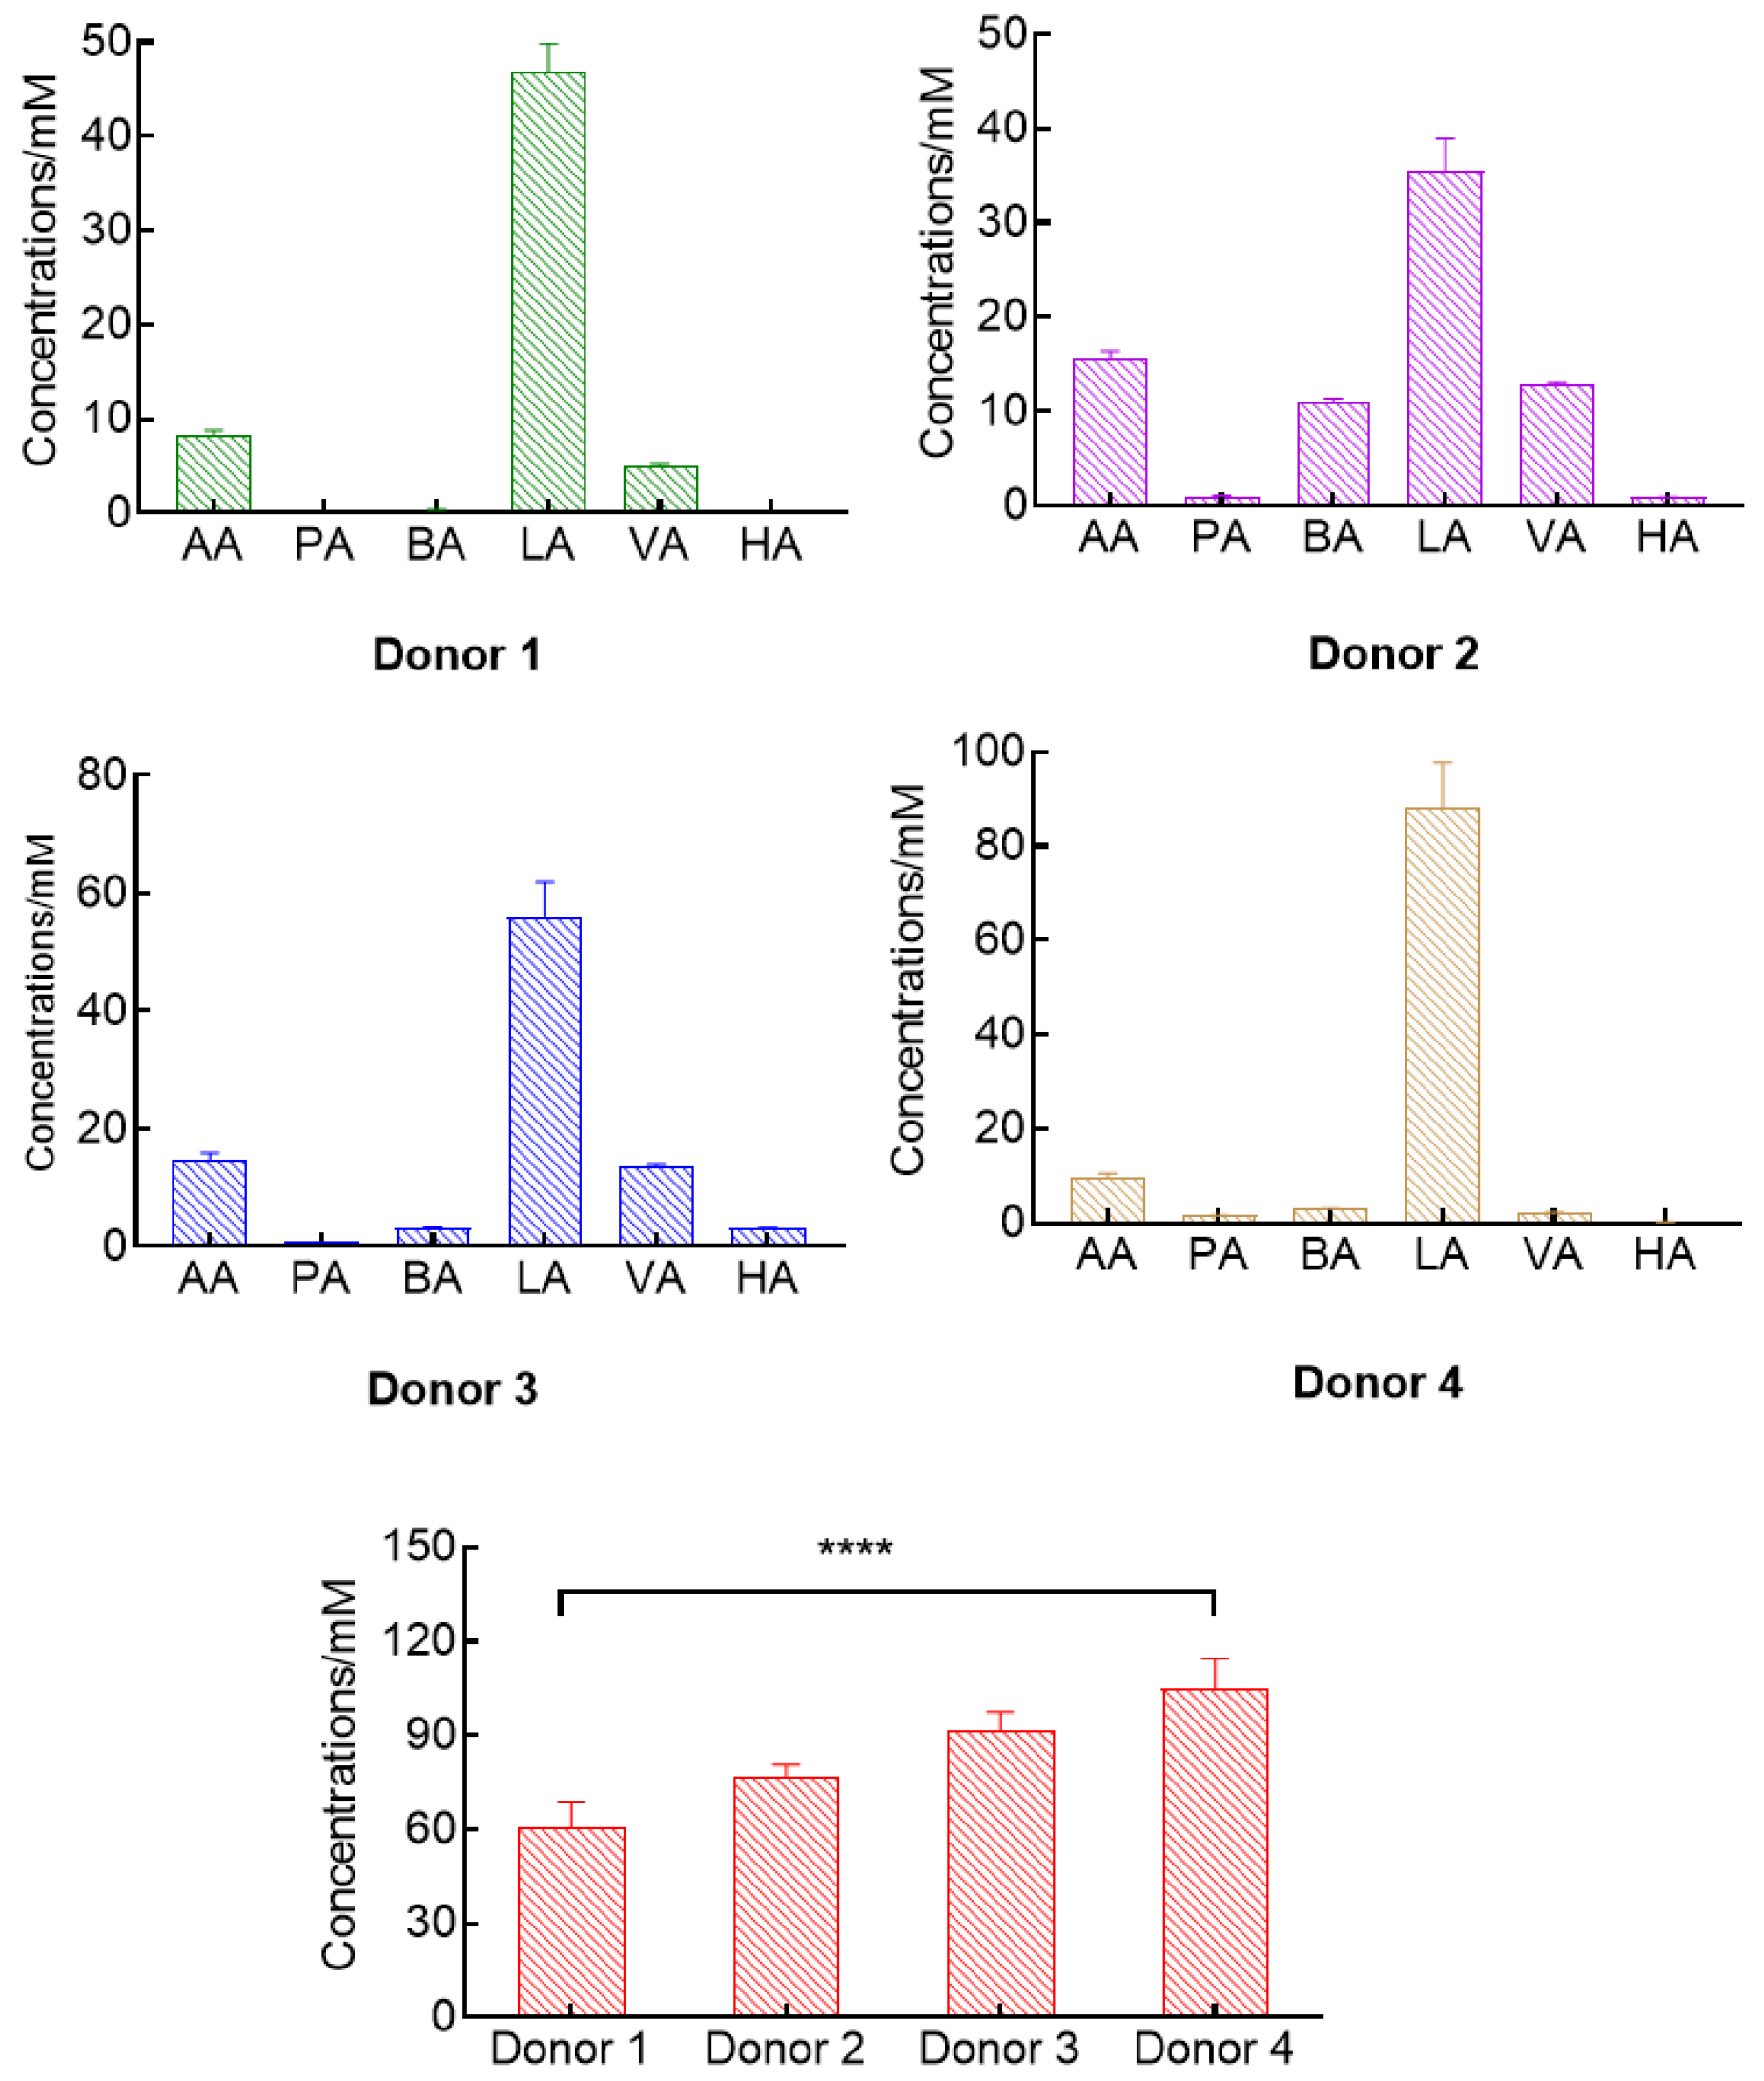
3.4. Ability to Determinate Natural Organic Acids

The fermentation concentrations of the target metabolites in vivo or in vitro vary considerably, making appropriate quantification challenging. After optimization of methods and experimental conditions, extraction using D/A (2:1, v/v) and NH4OH (3 mL, 3.5 mol/L), resolution by porous graphitic carbon HPLC with a sodium hydroxide/acetonitrile gradient, and detection by mass spectrometric specific ion monitoring, the organic acid mixture could be quantified in this study. The recovery yields of acetic acid, propionic acid, butyric acid, lactic acid, valeric acid, and hexanoic acid were 67%, 60%, 89%, 89%, 93%, and 99%, respectively, and were further used to calculate the natural organic acids. The natural organic acids in bacterial fermentation cultures and human feces were analyzed as shown in Figure 3 and Figure 4, respectively.
Probiotics and pathogenic bacteria play a role in inflammation, metabolites of intestinal flora, kidney function, and quality of life [46]. In our study, two representative probiotics, Bifidobacteria longum and Lactobacillus acidophilus, and two pathogenic bacteria, Campylobacter jejuni and Escherichia coli, were selected for the verification experiment on fatty acid extraction efficiency. The results are shown in Figure 3. The concentration of acetic acid was (0.015 ± 0.002) mM in B. longum fermentation, while the other three strains hardly fermented to produce AA. Except for E. coli, the propionic acid could be produced in B. longum, L. acidophilus, and C. jejuni fermentation at nearly the same concentration of 0.33 mM. The butyric acid contents produced by B. longum, L. acidophilus, C. jejuni, and E. coli fermentation decreased sequentially, as well as lactic acid levels. The concentrations of BA and LA were the highest, reaching (17.42 ± 1.69) and (51.68 ± 2.02) mM in Bifidobacteria longum fermentation, respectively. L. acidophilus, also a predominant mutualist of the human microbiota, produced the highest content of valeric acid and hexanoic acid, measuring (0.32 ± 0.01) and (2.32 ± 0.10) mM, respectively. The concentrations of the six tested organic acids were (70.29 ± 1.60), (30.17 ± 4.30), (13.09 ± 1.10), and (4.06 ± 1.00) mM by B. longum, L. acidophilus, C. jejuni, and E. coli, respectively.
There is a high distinctness in concentrations of organic acids from the mammalian gut microbiota anaerobic fermentation. The levels of short-chain fatty acids in feces are closely related to personal dietary habits [47]. In our study, we also tested the differences in natural organic acids among individual feces using this method. The results of organic acid production from individuals of different genders and ages with varying eating habits are shown in Figure 4. For four donors, they had obviously different AA, PA, BA, LA, VA, and HA concentrations, which were (8.21–15.67), (0.23–1.50), (0.35–3.26), (35.51–88.31), (2.04–13.66), and (0.11–3.23) mM, respectively. Total organic acid contents ranged from (60.92 ± 8.00) to (104.87 ± 9.63) mM, showing remarkable variation among individuals. This extraction method and LC-MS analytical technique can be successfully used to determine individual differences in organic acids in vitro and in vivo and to further analyze their biological correlates.
In recent years, LC-MS with different derivatization methods has been used to quantify organic acids. In plasma or serum, both Jaochico et al. [48] and Zeng et al. [49] used O-benzylhydroxylamine as the derivatization reagent, and Wang et al. [45] selected 3-nitrophenylhydrazine derivatization with LC-MS to quantify organic acids. Neither of these methods was suitable for human feces analysis. In human feces, Zhou et al. [50] applied derivatization with 2-nirophenylhydrazine for determining organic acids, and Wang et al. [51] validated derivatization with 3-nirophenylhydrazine and solid-phase extraction.

4. Conclusions

For the quantitative or qualitative analysis of organic compounds in natural products, the first step should be to address the issue of extraction efficiency for organic compounds. Then, on the basis of appropriate extraction methods, the detection methods for specific substances should be considered. It is worth paying attention to the optimization of the sample preparation procedure and LC-MS conditions for organic acid detection. In this study, a general LC-MS method for the simultaneous quantification of short-chain fatty acids (acetic acid, propionic acid, butyric acid, valeric acid, and hexanoic acid) and lactic acid was developed and validated. After extraction by dichloromethane/acetonitrile and ammonium hydroxide, respectively, the adsorption effect of six organic acids was good on a porous graphitic carbon column that could be detected by MS. The conditions of LC-MS with 90% of 0.01 (v/v) NaOH and 10% acetonitrile as the mobile phases A and B, respectively, as described herein, were used to determine the organic acids. This technique allowed high throughput and was suitable for routine analysis of large numbers of bacterial fermentation cultures and fecal samples in a short runtime. The prebiotic effects of each organic acid and the inherent complexity of the culture media matrix were also accurately compared. This method, combined with solvent extraction and LC-MS analysis, proved to be a simple, sensitive, and replicable diagnostic procedure for the quantification of organic acids in a native mixture from bacterial fermentation and human feces.

Author Contributions

Conceptualization, methodology, validation, writing—original draft preparation, J.W.; software, X.T. and H.W.; formal analysis, Q.C.; writing—review and editing, H.W. and Q.C.; project administration, C.Q. and Y.Z.; funding acquisition, C.Z. and C.Q. All authors have read and agreed to the published version of the manuscript.

Funding

This research was funded by the Forestry Science and Technology Innovation Project of Guangdong Province (No. 2023KJCX003) and the Science and Technology Planning Project of Guangdong Province (No. 2025WDZC-LKY02).

Data Availability Statement

The original contributions presented in this study are included in the article. Further inquiries can be directed to the corresponding author.

Conflicts of Interest

The authors declare that they have no known competing financial interests or personal relationships that could influence the study described in this article.

References

  1. Li, S.; Ma, X.; Mei, H.; Chang, X.; He, P.; Sun, L.; Xiao, H.; Wang, S.; Li, R. Association between gut microbiota and short-chain fatty acids in children with obesity. Sci. Rep. 2025, 15, 483. [Google Scholar] [CrossRef] [PubMed]
  2. Liu, M.; Lu, Y.; Xue, G.; Han, L.; Jia, H.; Wang, Z.; Zhang, J.; Liu, P.; Yang, C.; Zhou, Y. Role of short-chain fatty acids in host physiology. Anim. Models Exp. Med. 2024, 7, 641–652. [Google Scholar] [CrossRef]
  3. Fang, S.; Qin, T.; Yu, T.; Zhang, G. Improvement of the gut microbiota in vivo by a short-chain fatty acids-producing strain Lactococcus garvieae CF11. Processes 2022, 10, 604. [Google Scholar] [CrossRef]
  4. Lindström, C.; Holst, O.; Hellstrand, P.; Öste, R.; Andersson, K.E. Evaluation of commercial microbial hydrocolloids concerning their effects on plasma lipids and caecal formation of SCFA in mice. Food Hydrocoll. 2012, 28, 367–372. [Google Scholar] [CrossRef]
  5. Beylot, M. Effects of inulin-type fructans on lipid metabolism in man and in animal models. Br. J. Nutr. 2005, 93, 163–168. [Google Scholar] [CrossRef]
  6. Valérie, M.; Carole, G.; Emile, L.; Edgard, D. Research Communication: Butyrate impairs lipid transport by inhibiting microsomal triglyceride transfer protein in Caco-2 cells. J. Nutr. 2003, 133, 2180–2183. [Google Scholar] [CrossRef]
  7. Hamer, H.M.; Jonkers, D.; Venema, K.; Vanhoutvin, S.; Troost, F.J.; Brummer, R.J. Review article: The role of butyrate on conolic function. Aliment. Pharmacol. Ther. 2008, 27, 327–347. [Google Scholar] [CrossRef]
  8. Vernia, P.; Latella, G.; Magliocca, F.M.; Caprilli, R. Fecal organic anions in diarrhoea1 diseases. Scand. J. Gastroenterol. 1987, 22, 105–109. [Google Scholar] [CrossRef] [PubMed]
  9. Carlsen, H.; Pajari, A.M. Dietary fiber-a scoping review for Nordic Nutrition Recommendations 2023. Food Nutr. Res. 2023, 67, 9979. [Google Scholar] [CrossRef] [PubMed]
  10. Floch, M.H.; Hong-Curtiss, J. Probiotics and functional foods in gastrointestinal disorders. Curr. Treat Options Gastroenterol. 2002, 5, 311–321. [Google Scholar] [CrossRef]
  11. Huda-Faujan, N.; Abdulamir, A.S.; Fatimah, A.B.; Anas, O.M.; Shuhaimi, M.; Yazid, A.M.; Loong, Y.Y. The impact of the level of the intestinal short chain fatty acids in inflammatory bowel disease patients versus healthy subjects. Open Biochem. J. 2010, 4, 53–58. [Google Scholar] [CrossRef]
  12. Bloemen, J.G.; Venema, K.; Poll, M.C.; Damink, S.W.M.O.; Buurman, W.A.; Dejong, C.H. Short chain fatty acids exchange across the gut and the liver in humans measured at survey. Clin. Nutr. 2009, 28, 657–661. [Google Scholar] [CrossRef]
  13. Czauderna, M.; Kowalczyk, J. Lactic acid can be easily and precisely determined by reversed-phase high performance liquid chromatography with pre-column derivatization. J. Anim. Feed Sci. 2008, 17, 117–121. [Google Scholar] [CrossRef]
  14. Manderson, K.; Pinart, M.; Tuohy, K.M.; Grace, W.E.; Hotchkiss, A.T.; Widmer, W.; Yadhav, M.P.; Gibson, G.R.; Rastall, R.A. In vitro determination of prebiotic properties of oligosaccharides derived from an orange juice manufacturing by-product stream. Appl. Environ. Microb. 2005, 71, 8383–8389. [Google Scholar] [CrossRef]
  15. Kotani, A.; Miyaguchi, Y.; Kohama, M.; Ohtsuka, T.; Shiratori, T.; Kusu, F. Determination of short-chain fatty acids in rat and human feces by high-performance liquid chromatography with electrochemical detection. Anal. Sci. 2009, 25, 1007–1011. [Google Scholar] [CrossRef]
  16. Gomez, E.; Tuohy, K.M.; Gibson, G.R.; Klinder, A.; Costabile, A. In vitro evaluation of the fermentation properties and potential prebiotic activity of Agave fructans. J. Appl. Microbiol. 2010, 108, 2114–2121. [Google Scholar] [CrossRef] [PubMed]
  17. Fernandes, J.; Rao, A.V.; Wolever, T.M. Different substrates and methane producing status affect short-chain fatty acid profiles produced by in vitro fermentation of human faeces. J. Nutr. 2000, 130, 1932–1936. [Google Scholar] [CrossRef] [PubMed]
  18. Torii, T.; Kanemitsu, K.; Wada, T.; Itoh, S.; Kinugawa, K.; Hagiwara, A. Measurement of short-chain fatty acids in human faeces using high-performance liquid chromatography: Specimen stability. Ann. Clin. Biochem. 2010, 47, 447–452. [Google Scholar] [CrossRef]
  19. Horspool, L.J.I.; McKellar, Q.A. Determination of short-chain fatty acids in equine caecal liquor by ion exchange high performance liquid chromatography after solid phase extraction. Biomed. Chromatogr. 1991, 5, 202–206. [Google Scholar] [CrossRef]
  20. Richardson, A.J.; Galder, A.G.; Stewart, C.S.; Smith, A. Simultaneous determination of volatile and non-volatile acidic fermentation products of anaerobes by capillary gas-chromatography. Lett. Appl. Microbiol. 1989, 9, 5–8. [Google Scholar] [CrossRef]
  21. Pompei, A.; Cordisco, L.; Raimondi, S.; Amaretti, A.; Pagnoni, U.M.; Matteuzzi, D.; Rossi, M. In vitro comparison of the prebiotic effects of two inulin-type fructans. Anaerobe 2008, 14, 280–286. [Google Scholar] [CrossRef]
  22. Metzler-Zebeli, B.U.; Zijlstra, R.T.; Mosenthin, R.; Gänzle, M.G. Dietary calcium phosphate content and oat β-glucan influence gastrointestinal microbiota, butyrate-producing bacteria and butyrate fermentation in weaned pigs. Microbiol. Ecol. 2011, 75, 402–413. [Google Scholar] [CrossRef] [PubMed]
  23. Bianchi, F.; Asta, M.D.; Rio, D.D.; Mangia, A.; Musci, M.; Scazzina, F. Development of a headspace solid-phase microextraction gas chromatography-mass spectrometric method for the determination of shot-chain fatty acids from intestinal fermentation. Food Chem. 2011, 129, 200–205. [Google Scholar] [CrossRef]
  24. Mills, G.A.; Walker, V.; Mughal, H. Headspace solid-phase microextraction with 1-pyrenyldiazomethane in-fibre derivatisation for analysis of faecal short-chain fatty acids. J. Chromatogr. B 1999, 730, 113–122. [Google Scholar] [CrossRef]
  25. Preter, V.D.; Staeyen, G.V.; Esser, D.; Rutgeers, P.; Verbeke, K. Development of a screening method to determine the pattern of fermentation metabolites in faecal samples using on-line purge-and-trap gas chromatographic-mass spectrometric analysis. J. Chromatogr. A 2009, 1216, 1476–1483. [Google Scholar] [CrossRef]
  26. Garcia, A.; Olmo, B.; Lopez-Gonzalvez, A.; Cornejo, L.; Rupérez, F.J.; Barbas, C. Capillary electrophoresis for short chain organic acids in faeces. J. Pharmaceut. Biomed. Anal. 2007, 46, 356–361. [Google Scholar] [CrossRef]
  27. Sánchez-Machado, D.I.; López-Cervantes, J.; Martínez-Cruz, O. Quantification of organic acids in fermented shrimp waste by HPLC. Food Technol. Biotechnol. 2008, 46, 456–460. [Google Scholar] [CrossRef]
  28. Pettinella, C.; Lee, S.H.; Cipollone, F.; Blair, I.A. Targed quantitative analysis of fatty acids in atherosclerotic plaques by high sensitivity liquid chromatography/tandem mass spectrometry. J. Chromatogr. B 2007, 850, 168–176. [Google Scholar] [CrossRef] [PubMed]
  29. Nichols, D.S.; Davies, N.W. Improved detection of polyunsaturated fatty acids as phenacyl esters using liquid chromatography-ion trap mass spectrometry. J. Microbiol. Methods 2002, 50, 103–113. [Google Scholar] [CrossRef]
  30. Karlsson, A.; Karlsson, O. Enantiomeric separation of amino alcohols using Z-L-Glu-L-Pro or Z-L-Glu-D-Pro as chiral counter ions and Hypercarb as the solid phase. Chirality 1997, 9, 650–655. [Google Scholar] [CrossRef]
  31. Bao, Y.; Chen, C.; Newburg, D.S. Quantification of neutral human milk oligosaccharides by graphitic carbon high-performance liquid chromatography with tandem mass spectrometry. Ana. Biochem. 2013, 433, 28–35. [Google Scholar] [CrossRef] [PubMed]
  32. Barroso, B.; Dijkstra, R.; Geerts, M.; Lagerwerf, F.; Veelen, P.; Ru, A. On-line high-performance liquid chromatography/mass spectrometric characterization of native oligosaccharides from glycoproteins. Rapid Commun. Mass Spectrom. 2002, 16, 1320–1329. [Google Scholar] [CrossRef] [PubMed]
  33. Ninonuevo, M.R.; Park, Y.; Yin, H.; Zhang, J.; Ward, R.E.; Clowers, B.H.; German, J.B.; Freeman, S.L.; Killeen, K.; Grimm, R.; et al. A strategy for annotating the human milk glycome. J. Agric. Food Chem. 2006, 54, 7471–7480. [Google Scholar] [CrossRef] [PubMed]
  34. Pabst, M.; Bondili, J.S.; Stadlmann, J.; Mach, L.; Altman, F. Mass + retention time = structure: A strategy for the analysis of N-glycans by carbon LC-ESI-MS and its application to fibrin N-glycans. Anal. Chem. 2007, 79, 5051–5057. [Google Scholar] [CrossRef]
  35. Robinson, S.; Bergström, E.; Seymour, M.; Thomas-Oates, J. Screening of underivatized oligosaccharides extracted from the stems of Triticumaestivum using porous graphitized carbon liquid chromatography-mass spectrometry. Anal. Chem. 2007, 79, 2437–2445. [Google Scholar] [CrossRef] [PubMed]
  36. Chin, E.T.; Papac, D.I. The use of a porous graphitic carbon column for desalting hydrophilic peptides prior to matrix-assisted laser desorption/ionization time-of-flight mass spectrometry. Anal. Biochem. 1999, 273, 179–185. [Google Scholar] [CrossRef]
  37. Xing, J.; Apedo, A.; Tymiak, A.; Zhao, N. Liquid chromatographic analysis of nucleosides and their mono-, di-, and triphosphates using porous graphitic carbon stationary phase coupled with electrospray mass spectrometry. Rapid Commun. Mass Spectrom. 2004, 18, 1599–1606. [Google Scholar] [CrossRef]
  38. Helali, N.; Monser, L. Stability indicating method for famotidine in pharmaceuticals using porous graphic carbon coulumn. J. Sep. Sci. 2008, 31, 276–282. [Google Scholar] [CrossRef] [PubMed]
  39. Hsieh, Y.; Duncan, C.J.; Brisson, J.M. Porous graphic carbon chromatography/tandem mass spectrometric determination of cytarabine in mouse plasma. Rapid Commun. Mass Spectrom. 2007, 21, 629–634. [Google Scholar] [CrossRef]
  40. Liem, L.K.; Choong, L.H.; Woo, K.T. Porous graphitic carbon shows promise for the rapid screening partial DPD deficiency in lymphocyte dihydropyrimidine dehydrogenase in Chinese, Indian, and Malay in Singapore by using semi-automated HPLC-radioassay. Clin. Biochem. 2002, 35, 181–187. [Google Scholar] [CrossRef] [PubMed]
  41. Hauwe, O.V.D.; Perez, J.C.; Claereboudt, J.; Peteghem, C.V. Simultaneous determination of betamethasone and dexamethasone residues in bovine liver by liquid chromatography/tandem mass spectrometry. Rapid Commun. Mass Spectrom. 2001, 15, 857–861. [Google Scholar] [CrossRef]
  42. Vial, J.; Hennion, M.C.; Fernandez-Alba, A.; Agüera, A. Use of porous graphic carbon coupled with mass detection for the analysis of polar phenolic compounds by liquid chromatography. J. Chromatogr. A 2001, 937, 21–29. [Google Scholar] [CrossRef] [PubMed]
  43. Wang, J.; Chen, C.; Yu, Z.; He, Y.; Yong, Q.; Newburg, D.S. Relative fermentation of oligosaccharides from human milk and plants by gut microbes. Eur. Food Res. Technol. 2017, 243, 133–146. [Google Scholar] [CrossRef]
  44. Zheng, X.; Chen, T.; Li, W.; Wang, K.; Xue, X.; Naumovski, N.; Peng, W. Rapid purification and quantification of intestinal and fecal short-chain fatty acids by solid-phase extraction using Bond Elut Plexa. Separations 2024, 11, 270. [Google Scholar] [CrossRef]
  45. Wang, S.; Feng, R.; Kong, L.; Zhou, R.; Hu, F.; Sun, S.; Chen, G.; Tao, F.; Liu, K. An UHPLC-QE-Orbitrap-MS method for accurate quantification of short-chain fatty acids in serum from an older Chinese population. Chromatographia 2024, 87, 125–136. [Google Scholar] [CrossRef]
  46. Li, P.K.T.; Tian, N.; Zhou, S. #695 Modulation of probiotics on intestinal flora and related short-chain fatty acids in patients with peritoneal dialysis. Nephrol. Dial. Transpl. 2025, 39 (Suppl. S1), gfae069-0909-695. [Google Scholar] [CrossRef]
  47. Jensen, C.; Sommersten, C.H.; Laupsa-Borge, J.; Storås, I.; Valeur, J.; Mellgren, G.; Dierkes, J.; Dankel, S.N.; Lied, G.A. Quality and quantity of carbohydrates, faecal short-chain fatty acids and gastrointestinal symptoms—Results from a randomised, controlled trial (CARBFUNC). Clin. Nutr. 2025, 44, 54–64. [Google Scholar] [CrossRef]
  48. Jaochico, A.; Sangaraju, D.; Shahidi-Latham, S.K. A rapid derivatization based LC–MS/MS method for quantitation of short chain fatty acids in human plasma and urine. Bioanalysis 2019, 11, 741–753. [Google Scholar] [CrossRef] [PubMed]
  49. Zeng, M.; Cao, H. Fast quantification of short chain fatty acids and ketone bodies by liquid chromatography-tandem mass spectrometry after facile derivatization coupled with liquid-liquid extraction. J. Chromatogr. B 2018, 1083, 137–145. [Google Scholar] [CrossRef]
  50. Zhou, J.; Tang, L.; Wang, J.; Wang, J.S. Afatoxin B1 disrupts gut-microbial metabolisms of short-chain fatty acids, longchain fatty acids, and bile acids in male F344 rats. Toxicol. Sci. 2018, 164, 453–464. [Google Scholar] [CrossRef] [PubMed]
  51. Wang, H.Y.; Wang, C.; Guo, L.X.; Zheng, Y.F.; Hu, W.H.; Dong, T.T.X.; Wang, T.J.; Tsim, K.W.K. Simultaneous determination of short-chain fatty acids in human feces by HPLC with ultraviolet detection following chemical derivatization and solid-phase extraction segmental elution. J. Sep. Sci. 2019, 42, 2500–2509. [Google Scholar] [CrossRef] [PubMed]
Figure 1. Optimization of the extraction protocol for organic acids at an initial concentration of 2.5 mM. Mean ± SD, n = 5. D/M, dichloromethane/methanol; D/A, dichloromethane/acetonitrile; D/H, dichloromethane/hexane. (A) Optimization of three sets of extraction solvents. **** p < 0.0001, one-way analysis of variance (ANOVA). (B) Optimization of the relative ratios of dichloromethane and acetonitrile. (C) Optimization of the volume usage of 3.5 mol/L NH4OH.
Processes 13 00697 g001
Figure 2. Stability of six organic acids at different theoretical concentrations in NH4OH solution, tested on the first day and the second day. n = 3, Mean ± SD. AA, acetic acid; PA, propionic acid; BA, butyric acid; LA, lactic acid; VA, valeric acid; HA, hexanoic acid.
Processes 13 00697 g002
Figure 3. Comparative concentrations of organic acids from representative beneficial and harmful bacterial fermentation in vitro.
Processes 13 00697 g003
Figure 4. Fresh fecal organic acid concentrations from healthy persons. 22.5 mg/mL fresh feces, Mean ± SD, n = 6, **** p < 0.0001, one-way analysis of variance (ANOVA). Donor 1, male, 25 years old; Donor 2, male, 67 years old; Donor 3, female, 29 years old; Donor 4, female, 28 years old.
Processes 13 00697 g004
Table 1. Linearity of peak areas obtained for six organic acids in blank culture medium after extraction.
Organic AcidsRegression Equations *Coefficient of Determinations (R2)Dynamic Ranges (mM)
Acetic acidY = 15,093X + 11,3480.99930.01–10.0
Propionic acidY = 288,086X + 60,1790.99800.01–5.0
Butyric acidY = 145,822X + 45,8330.99930.01–10.0
Lactic acidY = 3688X + 28,4660.99130.01–20.0
Valeric acidY = 62,334X + 17,0180.99700.01–5.0
Hexanoic acidY = 130,755X + 11,1940.99930.01–5.0
* Y represents peak area, and X represents standard concentration (mM).
Table 2. Precision (CV) and accuracy (recoverya) of organic acids added to blank culture medium.
Organic Acids0.1 mM0.5 mM1.0 mM2.5 mM
Measured 1 (mM)CV 2 (%)Rec 3 (%)Measured (mM)CV (%)Rec (%)Measured (mM)CV (%)Rec (%)Measured (mM)CV (%)Rec (%)
Acetic acid0.10 ± 0.0110990.55 ± 0.0471091.01 ± 0.0981012.66 ± 0.093106
Propionic acid0.09 ± 0.016940.51 ± 0.0361020.97 ± 0.066972.63 ± 0.145105
Butyric acid0.10 ± 0.0111970.54 ± 0.05101081.00 ± 0.0551002.52 ± 0.124100
Lactic acid0.09 ± 0.016920.51 ± 0.0481021.02 ± 0.0881022.47 ± 0.13599
Valeric acid0.11 ± 0.0151070.50 ± 0.0371011.04 ± 0.0541042.57 ± 0.052103
Hexanoic acid0.10 ± 0.0181010.55 ± 0.0251111.06 ± 0.11101062.58 ± 0.083103
1 Measured concentration was derived from peak area (mM). 2 CV (%) = SD/mean × 100%. 3 Rec (recoverya) is accuracy (% of added standard). n = 3.
Table 3. Precision (CV) and accuracy (recoveryb) of organic acids added to bacterial fermentation production.
Organic AcidsNative Organic Acid in Bacterial Fermentation Medium (Dilution, CV%)Standard Organic Acid at Three Levels [Native + Standards (CV%, Recoveryb%)] *Recovery Average (%)
0.5 mM1.0 mM2.5 mM
Acetic acid0.3 ± 0.1 (1-fold, 15)0.7 ± 0.2 (18, 90)1.4 ± 0.3 (11, 108)2.7 ± 0.4 (14, 96)98
Propionic acid1.1 ± 0.2 (1-fold, 13)1.5 ± 0.1 (7, 94)1.8 ± 0.2 (11, 87)3.7 ± 0.5 (14, 104)95
Butyric acid9.0 ± 0.7 (10-fold, 8)9.5 ± 0.4 (4, 100)10.8 ± 0.6 (6, 108)12.3 ± 0.8 (7,107)105
Lactic acid13.4 ± 0.9 (10-fold, 7)14.1 ± 0.5 (4, 101)15.0 ± 0.6 (4, 104)15.5 ± 0.5 (3, 98)101
Valeric acid2.0 ± 0.1 (1-fold, 2)2.4 ± 0.2 (8, 96)3.1 ± 0.4 (12, 103)3.9 ± 0.7 (18, 87)95
Hexanoic acid1.7 ± 0.2 (1-fold, 9)2.4 ± 0.2 (8, 110)2.6 ± 0.2 (8, 96)3.8 ± 0.7 (18, 90)99
* Recoveryb/% = (concentration in diluted bacterial fermentation medium with spiked organic acids − concentration in diluted bacterial fermentation medium)/concentration of spiked organic acids × 100%. n = 3.
Disclaimer/Publisher’s Note: The statements, opinions and data contained in all publications are solely those of the individual author(s) and contributor(s) and not of MDPI and/or the editor(s). MDPI and/or the editor(s) disclaim responsibility for any injury to people or property resulting from any ideas, methods, instructions or products referred to in the content.

