Abstract
This paper presents a variable step-size efficient learning modified P&O (LMPO) MPPT algorithm and adaptive proportional–integral (API)-based control techniques for a two-stage three-phase grid-integrated photovoltaic (TS-GIPV) system using an LCL filter. The proposed novel controlled technique introduces two-stage systems under different meteorological conditions and load deviations. The two-stage system with the presented control technique includes maximum power point tracking (MPPT) techniques, intermediate DC-link voltage, and grid current synchronization with a voltage source converter (VSC), respectively. This technique is implemented to improve the extract MPP of the solar PV generator system. An innovative grid-side VSC control technique addresses DC link regulation. Furthermore, this method regulates DC link voltage with an outer voltage loop and an inner current loop controller. Distinctively, the proposed technique regulates the inner loop while avoiding the outer loop. A control mechanism uses an API controller to regulate DC link voltage, distribute power, and synchronize grid current in the face of different scenarios. The fluctuating voltage of the DC link will be kept stable through power balancing. Hence, this technique improves the system stability, dynamic response, and component longevity by effectively reducing oscillations in the fluctuating DC link voltage at twice the grid frequency. The total harmonic distortion (THD%) of the grid currents of the PV power generated in the grid is maintained within the recommended limits. The proposed technique is simulated and verified through MATLAB/Simulink 2019b under different scenarios.
1. Introduction
In recent years, the escalating demand for electricity worldwide, both domestically and industrially, has posed significant challenges for many countries. Among these challenges, the quest for sustainable energy alternatives stands out as paramount [1]. Renewable energy sources (RESs) are the best existing reasonable option for meeting electricity demands. This is why environmental groups have been supporting renewable energy sources. The various types of RES include power generators such as solar power, wind power, fuel cells, energy storage, biogas, geothermal, microturbines, etc., respectively. However, the concept of solar energy will be one of the most important energy sources in the future. Recently, large-scale implementation in power electronic equipment by research and development organizations has made wind power and solar generation more viable for domestic and industrial applications around the world. This has enhanced the performance of grid-integrated photovoltaic systems through innovative material and design strategies, as presented in [2]. This RES has advantageous features like cleanliness, availability, reliability, and eco-friendliness, as addressed in [3]. The rising popularity and expansion of renewable energy have driven research and development across diverse fields and directions. Grid-integrated photovoltaic systems have experienced a significant increase in popularity in recent years.
These devices are responsible for transferring the generated energy into the grid and tracking the MPP of solar PV generators. Researchers focus on extracting MPP via the MPPT technique of solar PV systems to increase the maximum power conversion efficiency. However, electricity generation and distribution based on RES systems have displayed a continuous increase with a growth rate of 75% over the past three decades [4]. The solar PV industry has attracted the attention of numerous researchers as an alternative form of renewable energy generation in recent years [5]. Recently, photovoltaic system topologies, such as stand-alone, grid-connected, and hybrid modes of operation, have been used to meet electricity demands in the public sector [6,7,8]. In these configurations, standalone and hybrid systems are large and often used in rural and remote areas. Therefore, a GIPV system without battery storage is always preferred in terms of grid access. Ongoing research efforts worldwide are dedicated to advancing MPPT techniques for solar PV array systems. In this research, a comparative study is conducted to address the shortcomings of existing MPPT techniques used in a two-stage three-phase grid-integrated photovoltaic system with a VSI converter connected to the main grid using LCL filters. The traditional perturb and observe (PO) method is the most widely used due to its simplicity, powerful performance, and low-cost implementation with a microprocessor. However, this method has three main disadvantages: large oscillations, a slow tracking response, low efficiency, and step size dependence, making it unsuitable for rapid climate changes [9,10]. Attempts to overcome these limitations by improving or modifying the existing PO MPPT technique have been discussed in [11,12,13], which increases complexity. There are two main configurations for connecting PV and grid systems: single-stage and two-stage configurations, as discussed in [14]. The single-stage configuration of GIPV systems includes components such as a photovoltaic array, DC link capacitor, grid-side converter (GSC), inverter-side filter, and grid, which reduce the weight and size of the framework [15]. On the other hand, the two-stage system configuration depends on the power output level of the TS-GIPV system and includes components such as a PV array, input filter, optional boost converter, DC-link capacitor, grid-side converter, output filter, low-frequency transformer, and main grid [16]. In the two-stage system, the complexity increases because the GSC handles various tasks such as MPPT, DC voltage regulation, current management, and grid synchronization. To reduce this complexity, a DC-DC boost converter is employed in the two-stage system. The use of an intermediate boost converter between the PV source and the DC/AC converter makes frequency regulation more challenging when the DC-link capacitor voltage of the boost converter is detached from the generated voltage of the PV array, as addressed in [13,14,15]. Reference [16] presents an intermediate converter that raises the input-side voltage, reducing the number of photovoltaic panels in a two-stage GIPV system. Mathematical modeling of the two-stage GIPV system is implemented, and its performance is improved using an MPPT controller, DC link voltage controller, and DC/AC converter with true and reactive power-controlling strategies and suitable duty cycles [17]. This framework is categorized into three main steps: renewable energy sources, power conditioning, and the utility grid. Additionally, the boost converter with MPPT techniques extracts the maximum power from the PV module.
The performance analysis of the proposed control technique is compared with traditional control techniques. Table 1 highlights the superior performance of the PI-based P&O MPPT compared to other MPPT techniques. As a result, the proposed novel variable step size PI-based LMPO MPPT is implemented on a 2.56 kW PV module connected to the main grid. This technique also enhances the system operation under realistic variations in meteorological conditions and sudden load deviations. Moreover, the proposed MPPT technique improves the tracking dynamic efficiency of the framework from 99.55% to 99.96%. The main outcomes and contributions of this research work can be summarized as follows:

Table 1.
System parameters of solar PV module and array [Kyocera-solar KD320GX-LPB PV].
- The proposed new LMPO MPPT technique is based on the solar PV generating source model. This technique develops a new formulation for quickly tracking the MPP’s location. Furthermore, the performance analysis of a two-stage three-phase GIPV system and the development of a new variable step-size efficient LMPO MPPT technique while considering the effect of the LCL filter and intermittency of the solar PV generation system are discussed.
- A new adaptive DC link controller is presented as a solution to the DC offset issues from the dynamic fluctuations in solar PV generating power. The recommended controller is considered to be a useful remedy for the poor behavior of traditional PI controllers. Furthermore, it improves the transient of the injected grid currents.
- The computational response time of the proposed technique is compared with conventional P&O- [9] and MPO [12]-based controllers, which found that the proposed technique has the least oscillations, higher efficiency, maximum power extraction, and faster tracking response.
- The recommended limitations of IEEE are met by grid currents. The suggested strategy reduces the total harmonic distortion (THD) for the grid and load currents by 1.26%, according to a statistical analysis of the existing and proposed methodologies.
- The validation of the proposed control techniques is simulated in MATLAB/SIMULINK, and the environment results are presented.
Overall, these findings underscore the potential of advanced MPPT and control techniques to enhance the efficiency, stability, and reliability of grid-integrated PV systems, paving the way for a more sustainable and resilient energy future.
The aim of this paper is the systematic configuration of a two-stage three-phase grid-integrated PV system organized as follows: in Section 2, a brief explanation of the overall system configuration and its modeling (such as PV array, PV characteristics, dc-dc boost converter, TS-GIPV inverter control, and LCL filter) are detailed. In Section 3, the proposed controller design for the two-stage PV system is presented. In Section 4, the performance improvement of the proposed control technique is verified through simulated results, and comparative studies are discussed. Finally, a summary of the overall work, along with the conclusion and the future scope of research, is given in Section 5.
2. Mathematical Modeling of Proposed Overall System Configuration
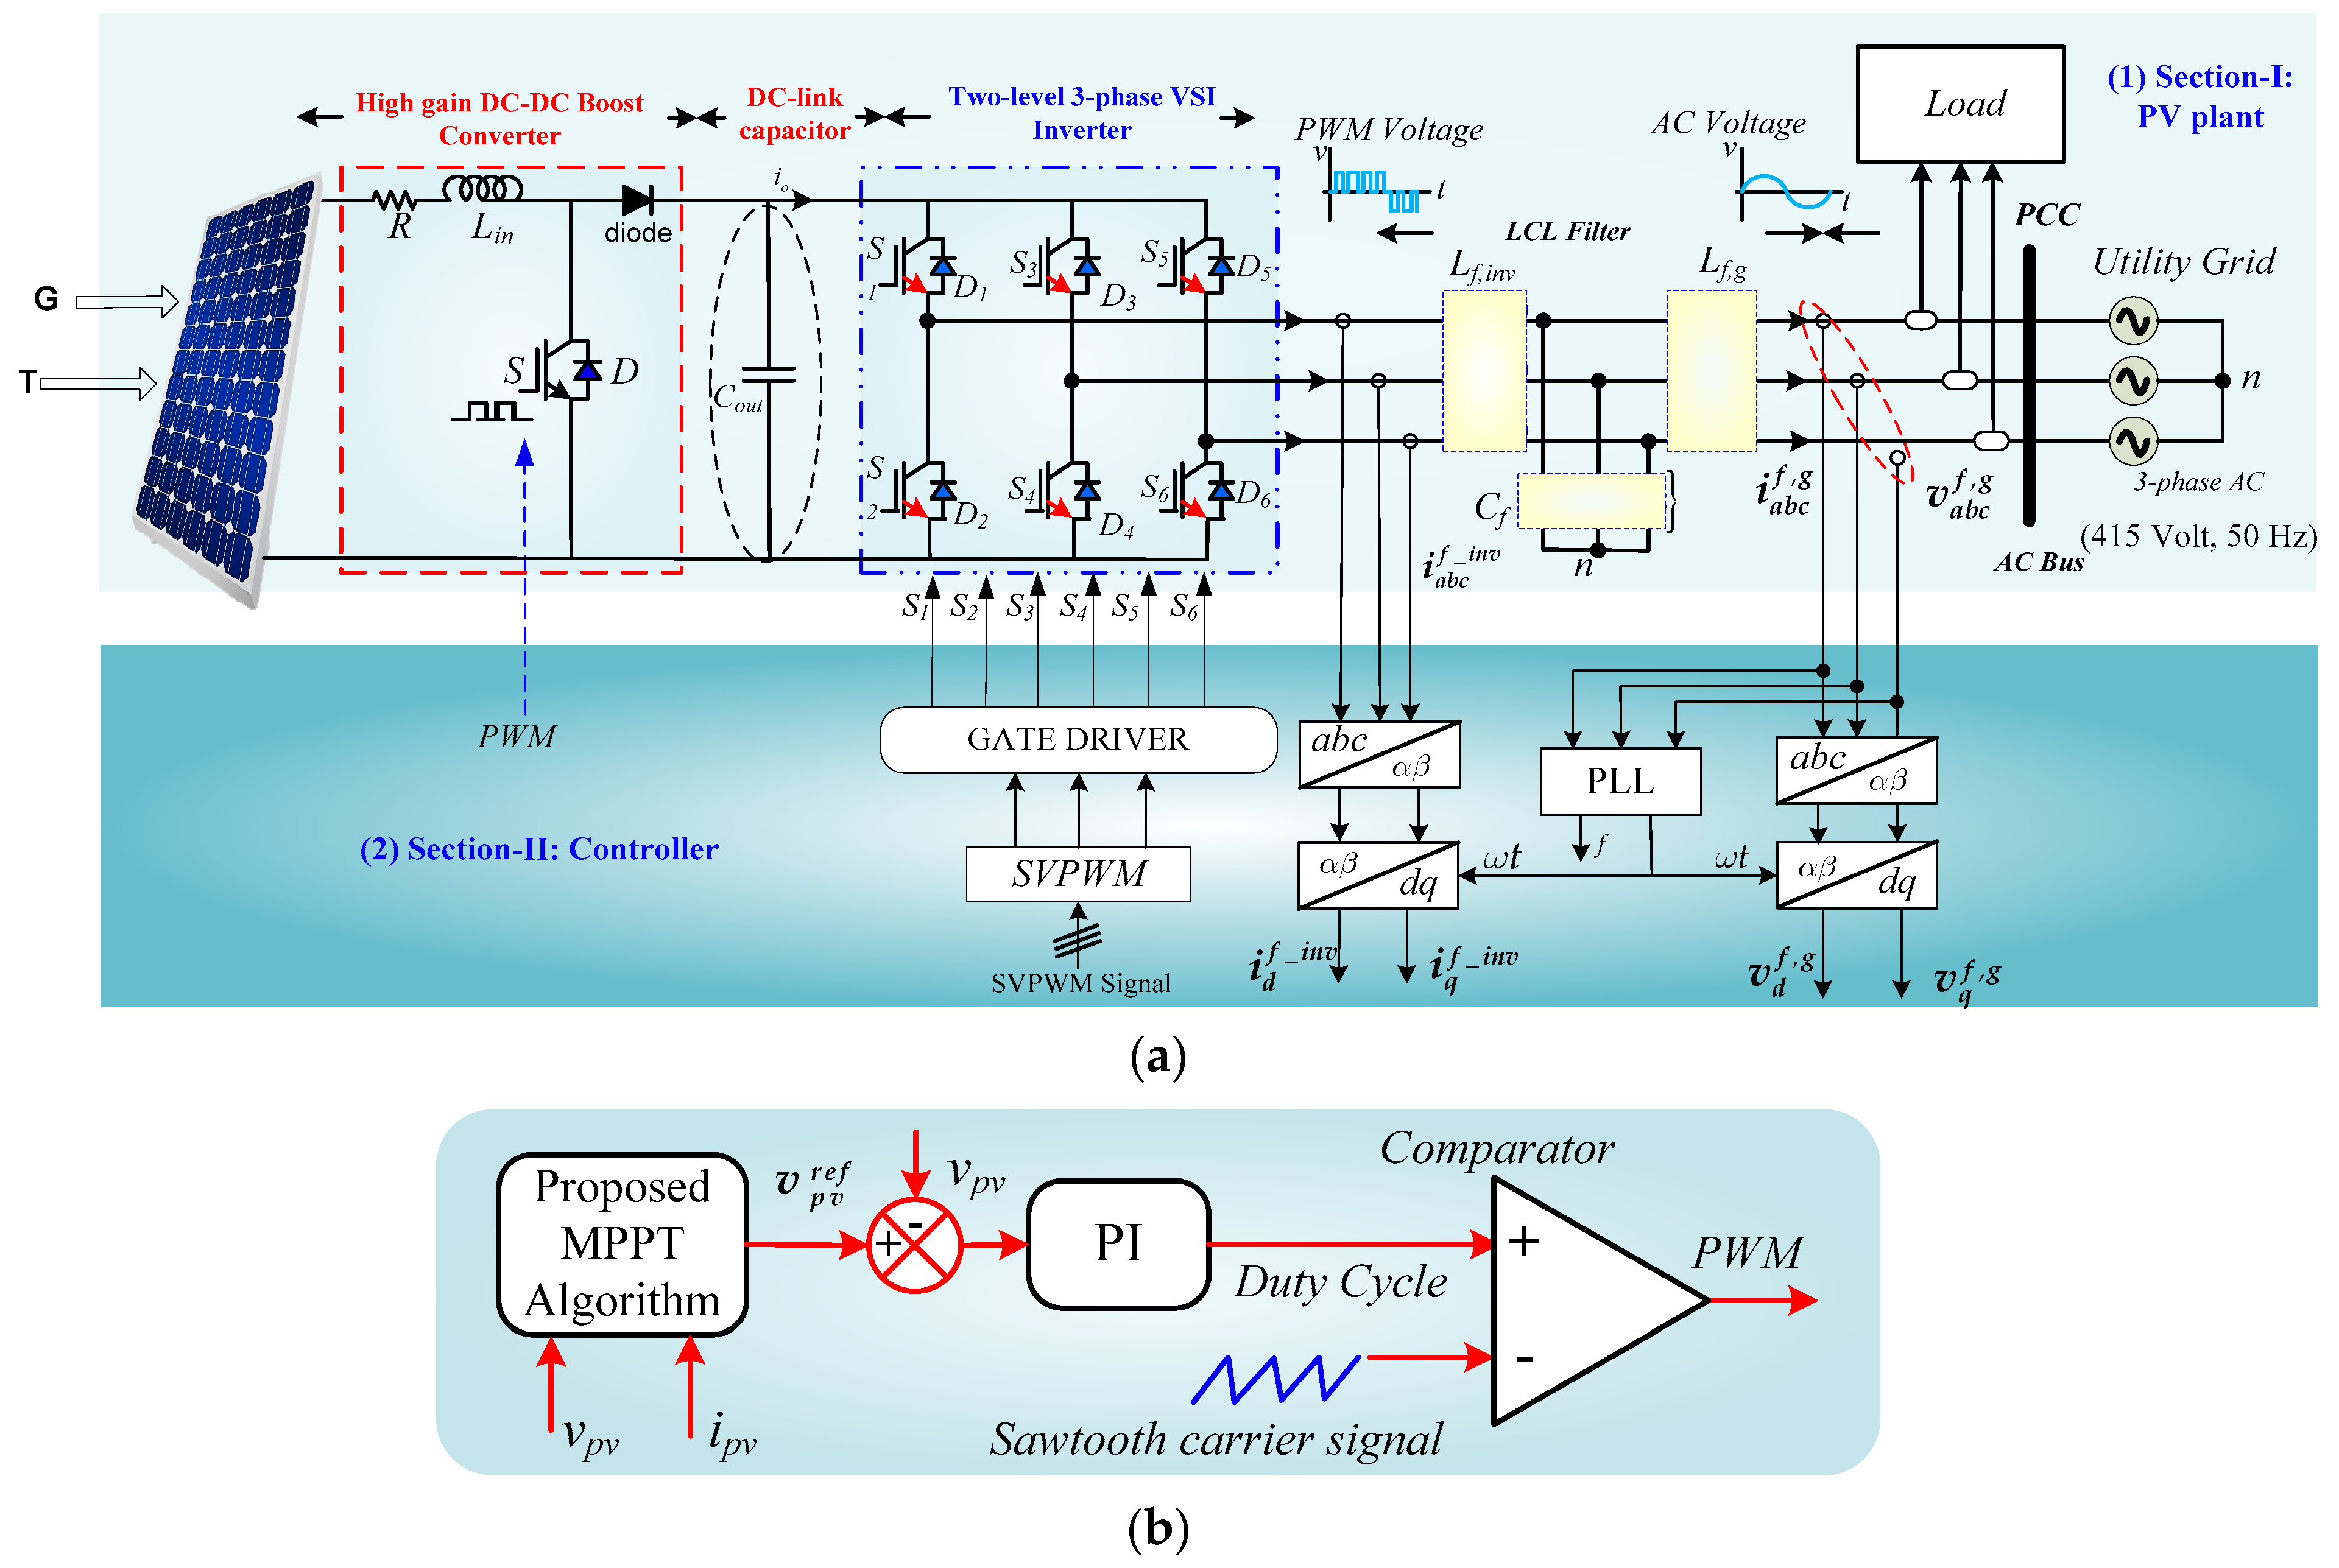
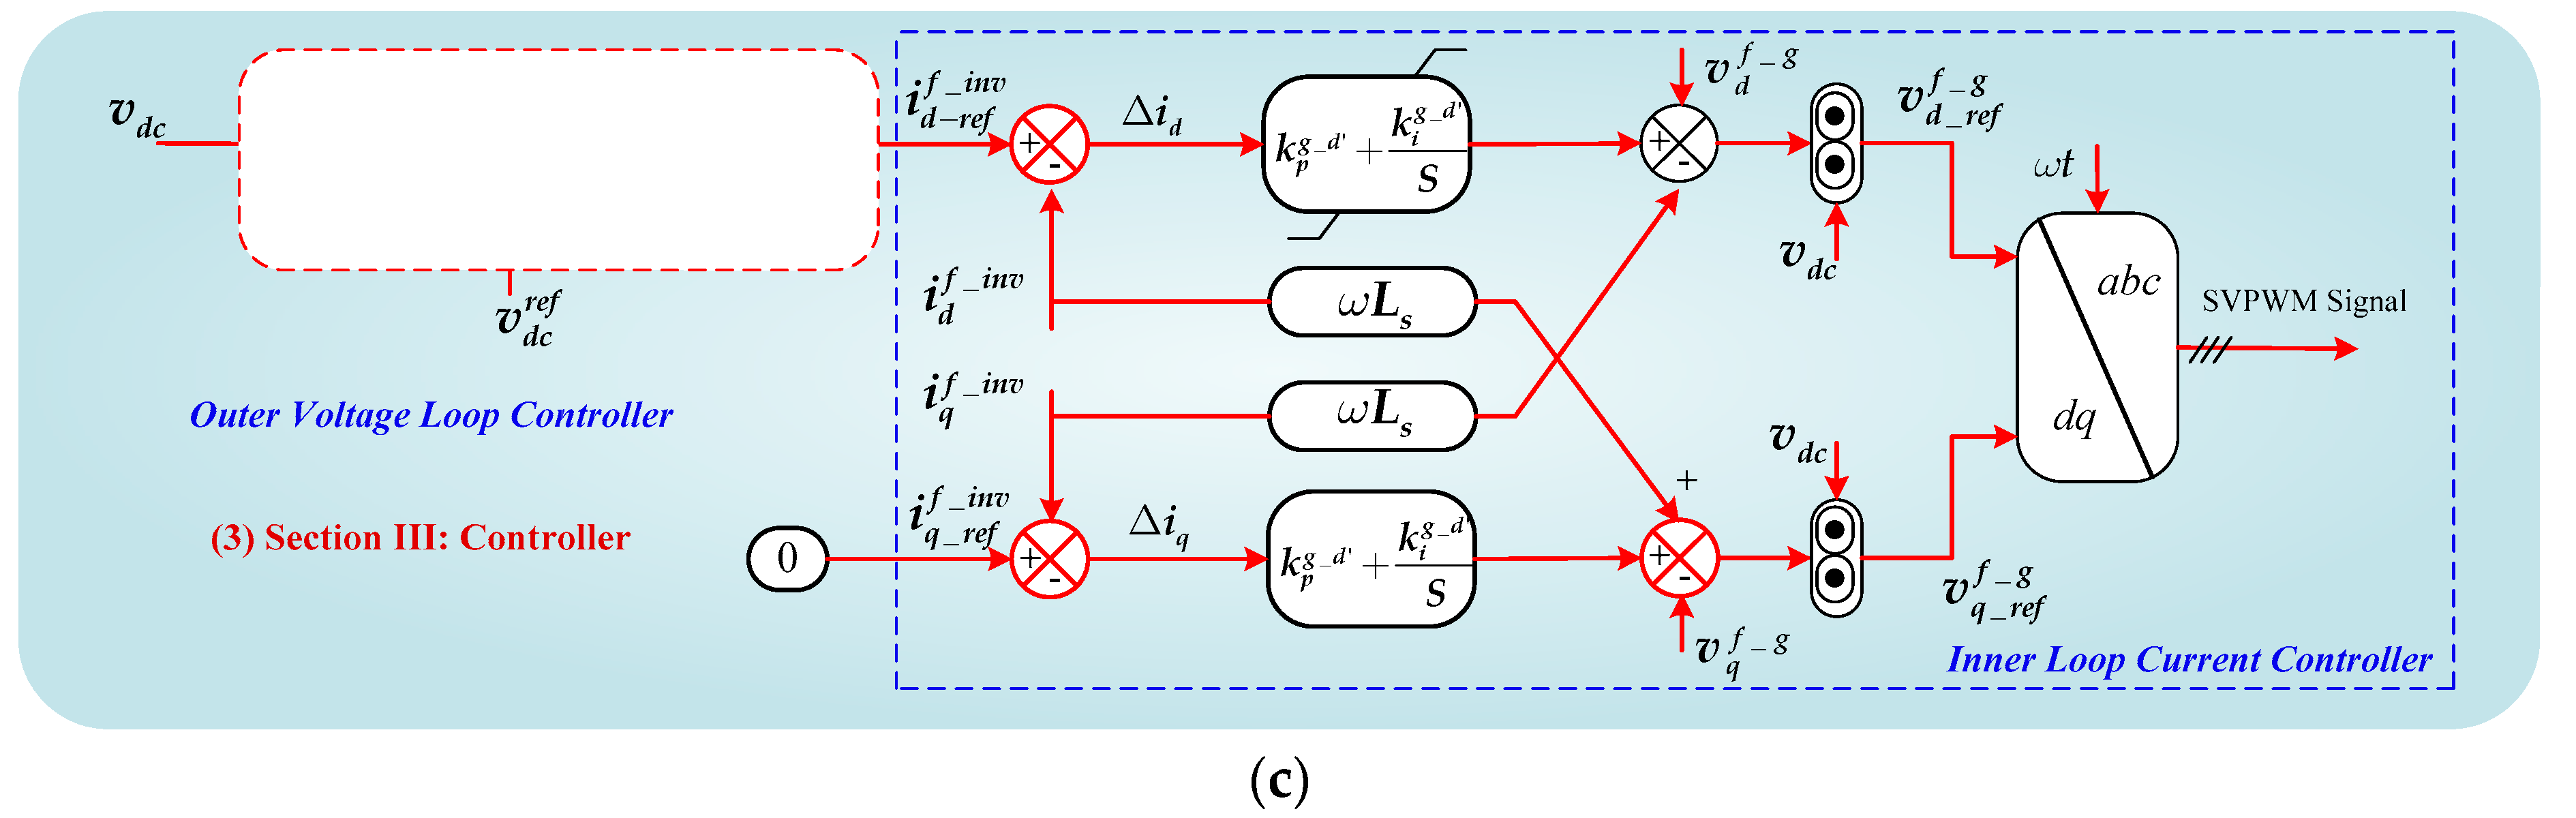
The overall system configuration block diagram of the 3-phase two-stage grid-integrated PV system is shown in Figure 1. The selected 3.2 KVA inverter capacity is larger than the maximum PV capacity of 2.5 kW and operates at a maximum PF of 0.8. The PV module consists of eight strings, each used in parallel. However, this system is widely used in the residential, commercial, and industrial sectors with a rated power of 1–30 kW [18]. In this paper, the proposed TS-GIPV system configuration, which consists of a PV module, a boost converter based on MPPT, a DC link capacitor, and a GSC-based SPWM, is connected to the main grid with an LCL filter, respectively. Further, these components are classified into two stages. Table 1 illustrates the system parameters of the solar PV module and array [Kyocera-solar KD320GX-LPB PV], manufactured in North America [19]. In addition, proper power sharing is achieved by injecting output reactive and active power into the main grid through a power electronic converter (PEC) while maintaining the DC link voltage through a boost converter in case of voltage fluctuations. The mathematical modeling of the proposed LMPO MPPT and adaptive proportional integrated (API) control scheme is validated through extensive simulations (MATLAB-2019R). The inverter filter parameters include inductance , capacitance , and grid-side inductance , respectively. In this system, the performance of power quality is improved in a real PV plant through a robust control mechanism. This mechanism effectively manages unknown disturbances and maintains fluctuating DC link voltage ().
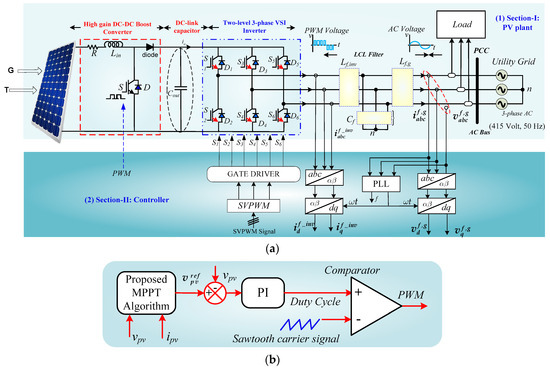
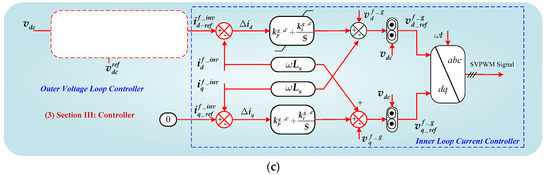
Figure 1.
Configuration of proposed two-stage GIPV system with LCL filter: (a) module-1: circuit diagram, (b) control loop of DC-DC converter with MPPT, and (c) proposed outer/inner control loop structure.
2.1. Mathematical Design of Photovoltaic Cell
A single-diode circuit module of a solar PV cell is illustrated in Figure 2. The photovoltaic cell performance and characteristics to track the maximum power in extensive simulation studies under erratic climatic conditions have been presented.
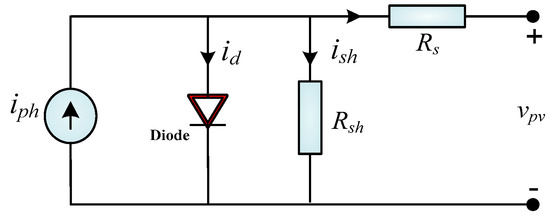
Figure 2.
Equivalent-circuit of the cell using one—diode model.
The mathematical expression of the solar PV cell output current () is as follows. By using KCL,
where ipv is the PV current, iph is the photocurrent, id is the diode current, and ish is the shunt-resistant current. The diode current id in the solar PV cell can be expressed by Equation (2):
where d is the leakage current of the diode, is the actual cell temperature, q is the electronic charge, A is the diode quality factor constant, and is the Boltzmann constant, respectively. According to Equation (1), the output current ipv generated by the PV cell can be represented as Equation (3):
The luminous current ph is linearly dependent on PV irradiance affected by the standard test conditions of temperature, which can be described by Equation (4):
where is the short-circuit current, ki is the parameter of PV solar cell current, G is the solar radiation, and ref is the reference value of temperature. The saturation current changes in the PV cell temperature can be expressed in Equations (5) and (6):
and
where rs is the saturation reverse current and Eq is the semiconductor energy band-gap in meteorological conditions. If pervasively used, PV cells are connected in series and parallel modes to form the PV array module interpolated to the availability of electricity. Here, the modified output photovoltaic current is given by Equation (7):
where p and s are a series array and parallel PV array, respectively.
2.2. The Effect of P-V and I-V Curve on PV Module at STC
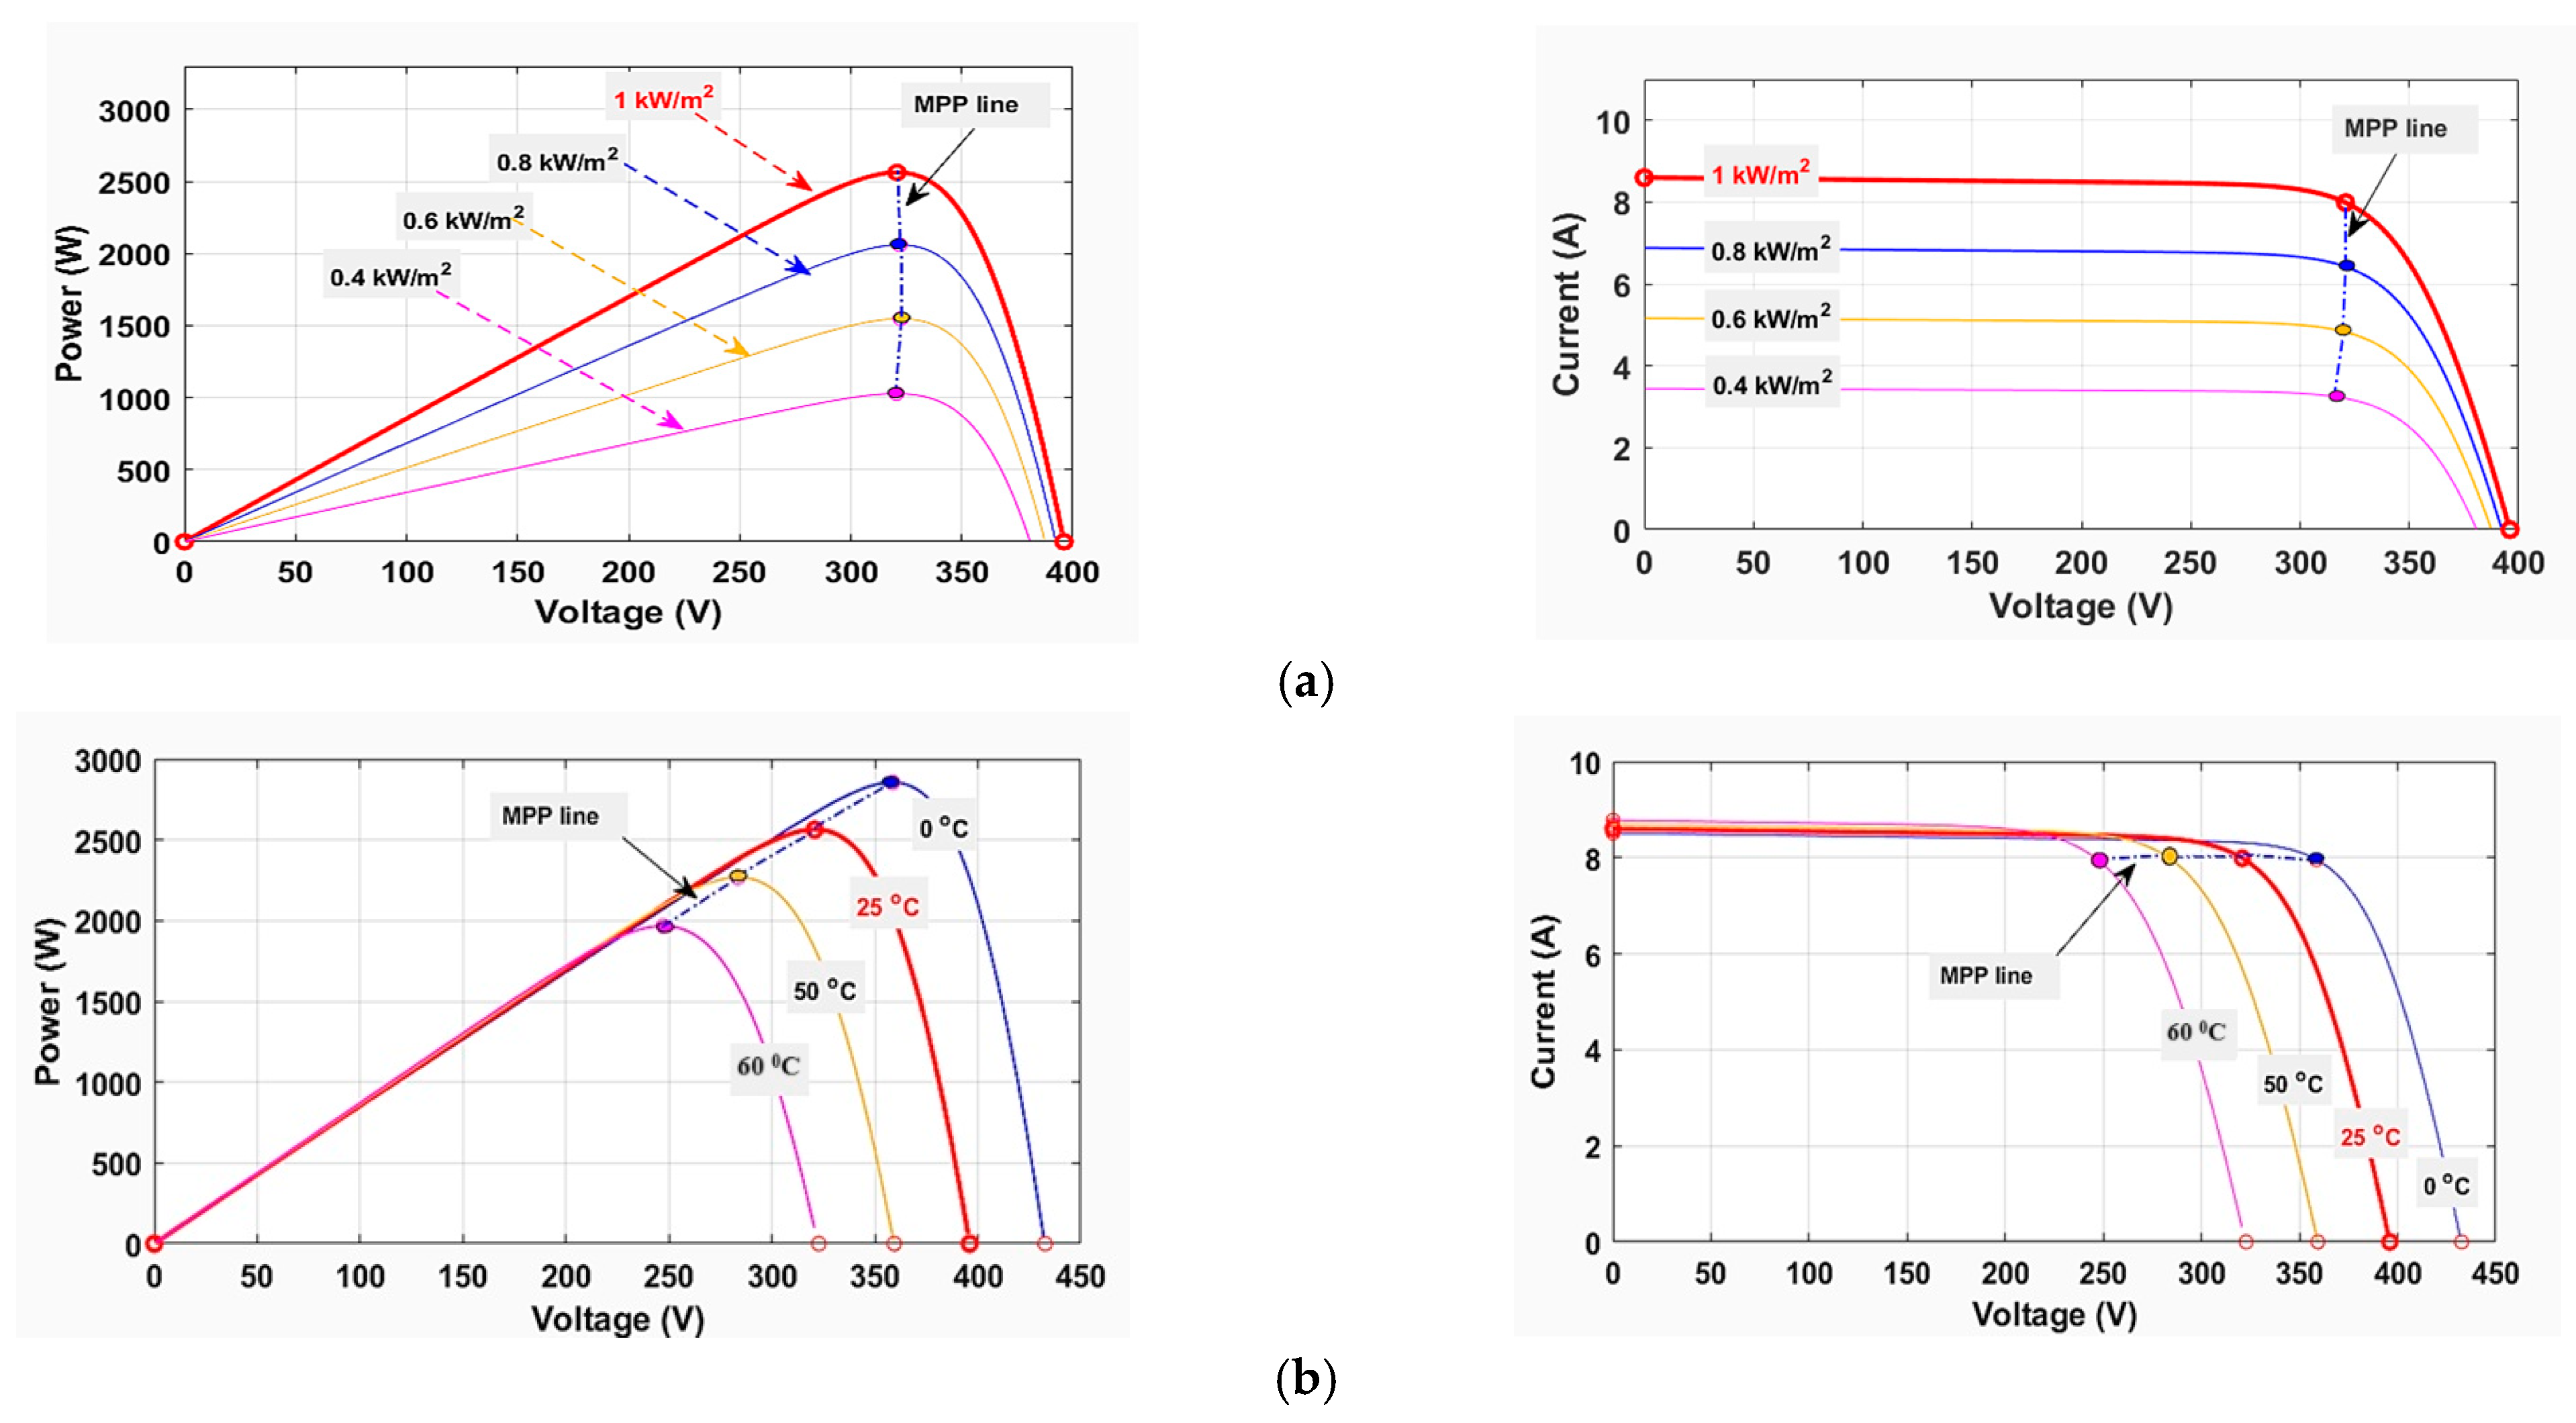
As stated, the general routine of the standard radiation and temperature in research are 1000 W/m2 and 25 °C. The characteristics of the solar PV module are based on the occupationally available Kyocera solar KD320GX-LPB chosen to be used in the MATLAB Simulink model and have been presented [20]. The electric parameters of the PV array are given in detail in Table 1. The P-V and I-V characteristics of the PV module depend on various meteorological conditions, such as a temperature (STC = 0 °C to 60 °C) and irradiance ( = 400 W/m2 to 1000 W/m2), as shown in Figure 3a,b.
Figure 3.
Influence of P-V and I-V characteristics for PV module Kyocera solar KD320GX-LPB under (a) varying irradiance (W/m2) and (b) varying temperature (°C).
2.3. Mathematical Design of Boost-Converter Control Strategy
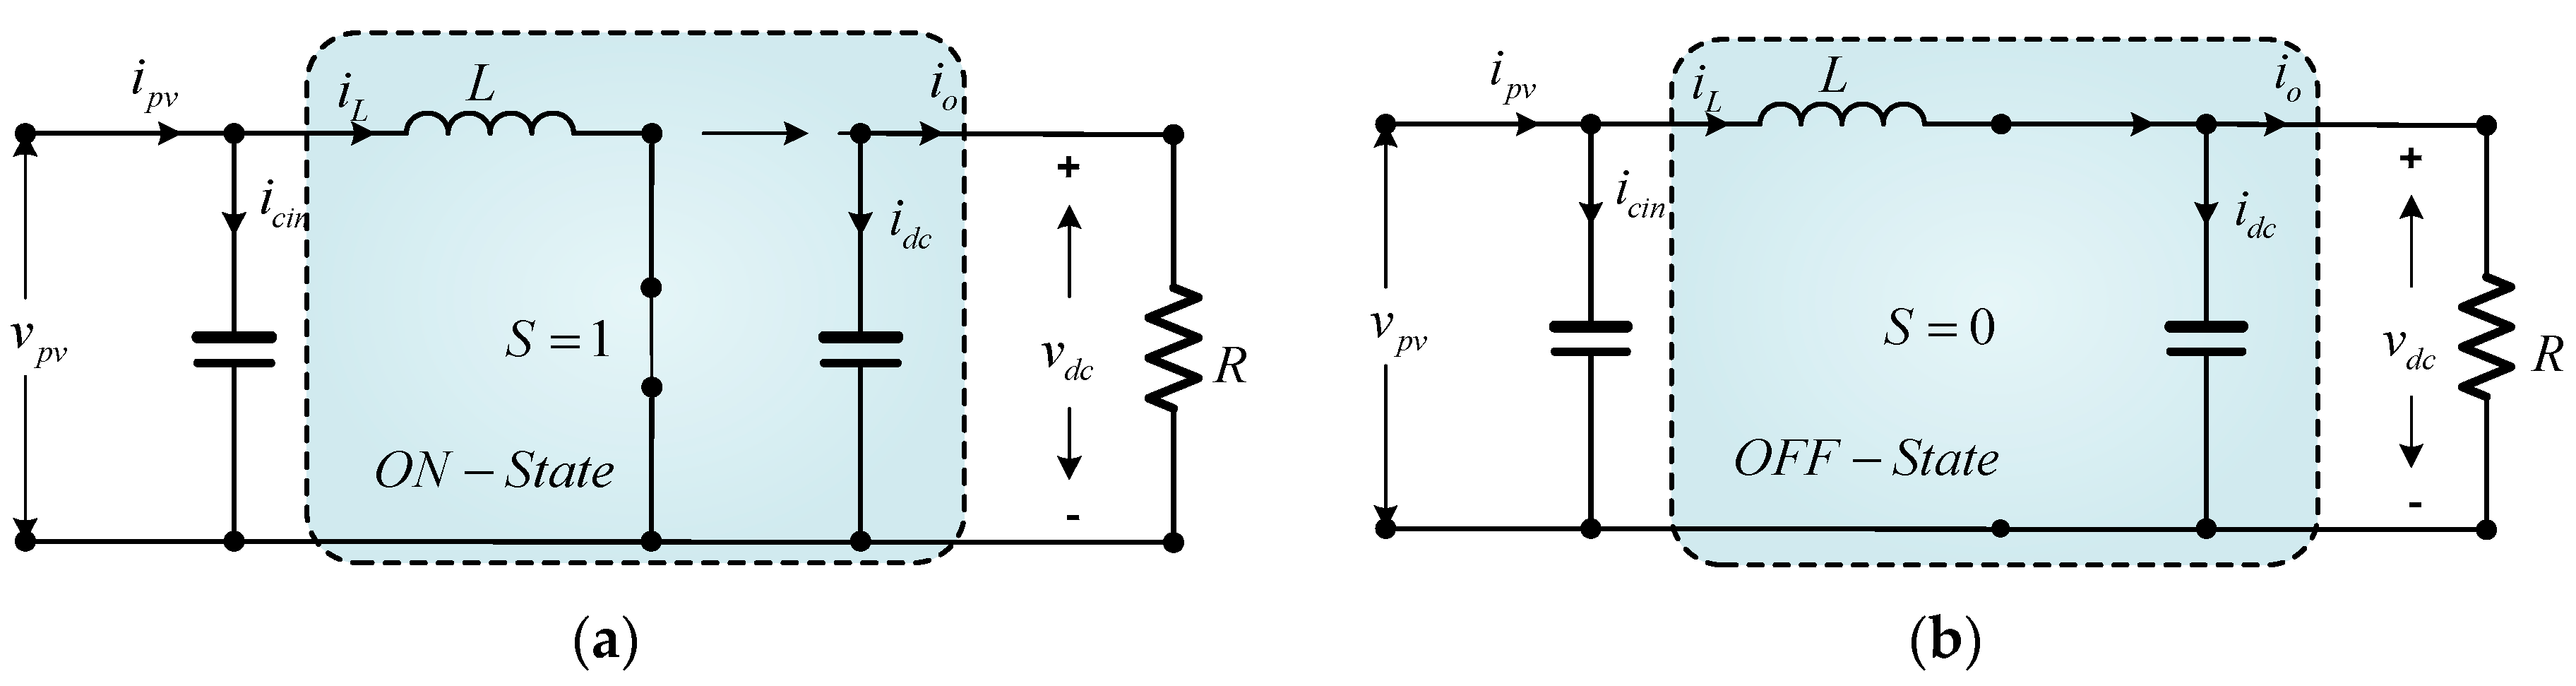
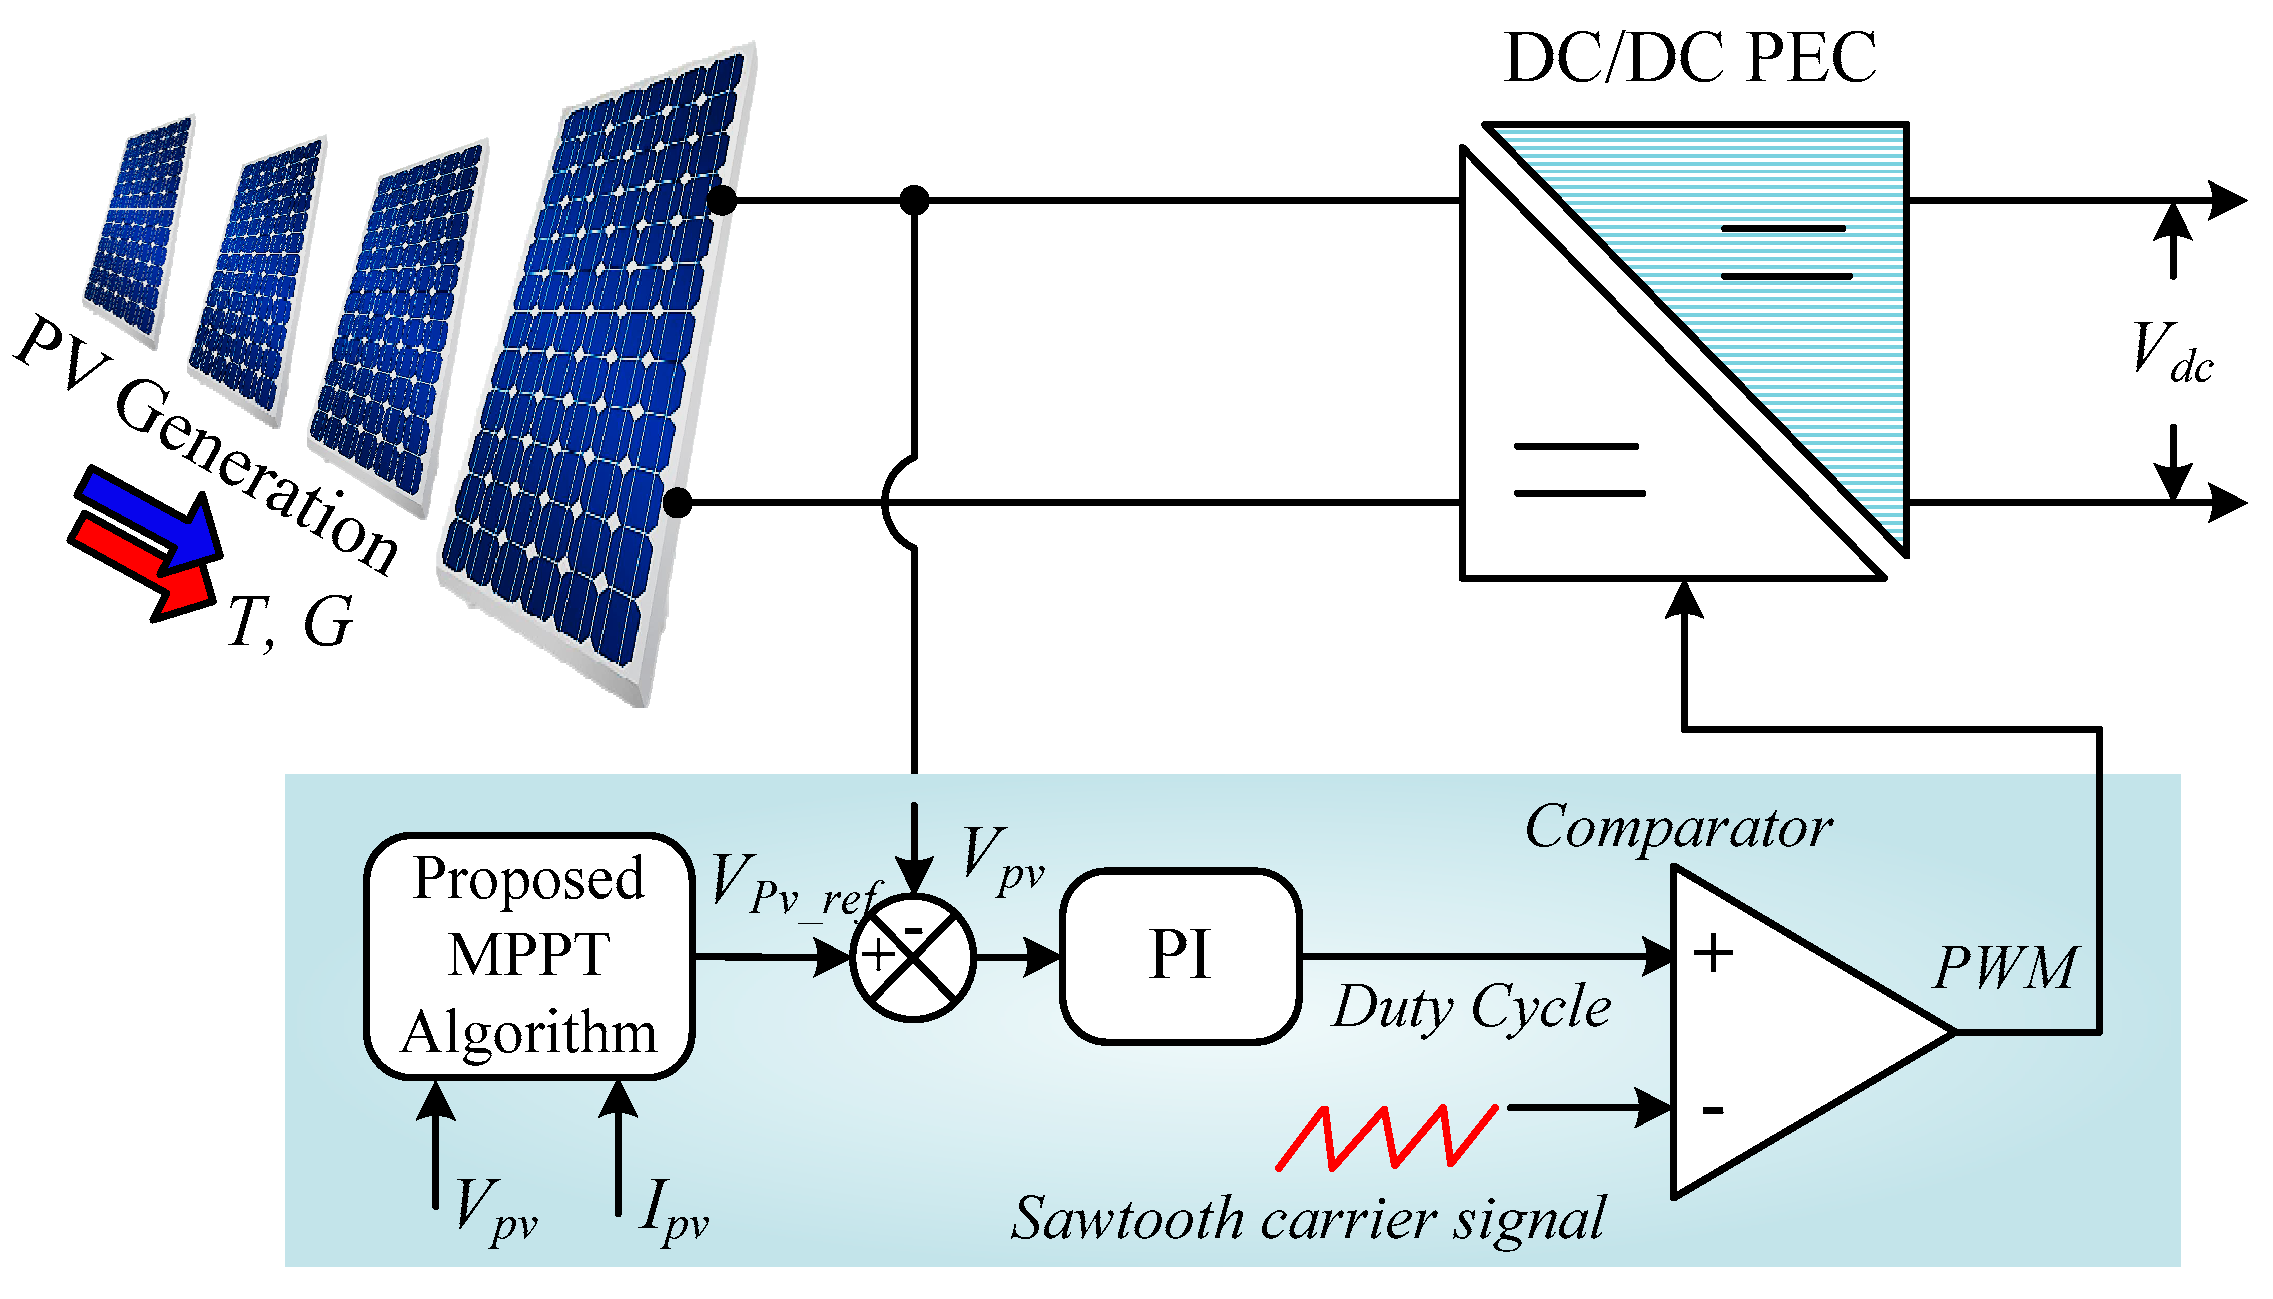
A boost converter is a power electronics device that converts the value of the average voltage and current from a controlled low input to a high output by changing the duty cycle “D” at a higher switching, which has been discussed in [21,22,23,24]. This converter is one of the most crucial non-isolated step-up converters and is often used in linearized photovoltaic systems for tracking the MPP generated by a PV array. In this work, the MPP is tracked through the LMPO algorithm, which computes the MPPT reference voltage that is controlled by a PI controller scheme [25]. Figure 1 depicts the overall configuration of the DC-DC converter interconnected into a PV array. An equivalent circuit diagram of the power boost converter for both turn-on and turn-off switching mode operations in continuous conditions is shown in Figure 4. All components used in the proposed system are ideal since there is no internal resistance in the circuit and no energy is required by the components of the circuit.
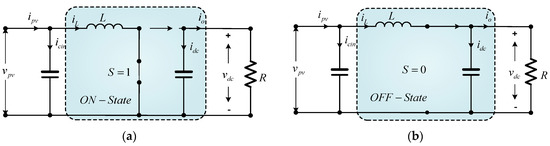
Figure 4.
The DC-DC boost converter topology for two working conditions: (a) state of turn-on, S = 1, and (b) state of turn-off, S = 0.
The mathematical design of the power boost converter under continuous operation can be calculated by Equation (8). For the state of the turn-on time, the state–space equations are:
where vcin = input capacitor of voltage, or = inductor current, and vc = capacitor voltage. Let the variable states be x1 = () and x2 = vc (v0), respectively. We can rewrite the steady-state–space equations as:
At the state turn-off time, when s = 0, the explained circuit in the state equations is obtained as:
In the state–space:
The matrices of the state–space can be expressed in Equations (9)–(11); The transfer function of the above state–space model is V0(s)/d(s):
and
where At = state matrix for Ton time, AT = state matrix for Toff period, and Vo is the output voltage. Afterwords, the switch position will be established by tracking the aforesaid optimization issues and the control system diagram of the power boost converter, as shown in Figure 5.
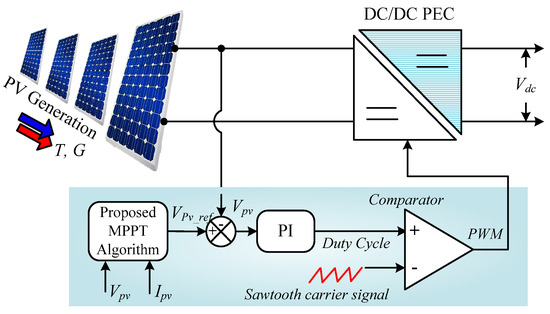
Figure 5.
The proposed M-PO MPPT for boost converter.
2.4. Mathematical Modeling of TS-GIPV Inverter
The power equivalent circuit of the three-phase TS-GIPV system consists of six bidirectional switches (), which convert DC/AC power to connect the main grid through passive LCL filters (, and ), as shown in Figure 6. However, the bidirectional switching device is also known as a power electronics converter (PEC), which is made up of each power switching device IGBT containing an antiparallel parallel diode. The main purpose of the three-lag voltage source inverter (VSI) integrated into the utility grid is to perform a high-quality power load. The selection of the size inverter capacity from 3 to 5 kVA is greater than the maximum PV capacity of 2.56 kW, which operates the maximum power factor of 0.8 at the capacity of the max PV generation. The structure of the solar PV inverter is dynamic under the d-axis and q-axis of synchronous rotating-frame transformation into electrical quantities, as shown in Figure 6. The three-phase electrical parameter is transformed into two-axis quantities (direct and quadrature) and can be obtained by Clark’s/Park’s transformation [26,27,28]. The mathematical explanation of the dynamic output voltage of the grid-integrated PV inverter is presented by Equation (14) [5,29]:
where , and represent the converter side voltages; is DC link voltage; and , and are the switching signals of the SPWM inverter. Thus, the differential equation of the DC/AC converter to grid can be explained in terms of the voltage and current of an LCL filter, as given by Equations (15)–(17), as follows.
where - and values are the first–second inductor and capacitor of the LCL filter; , , and represent the grid side voltages; , and are grid side flows of currents; and , and are the drop voltages across the filter capacitors, respectively.
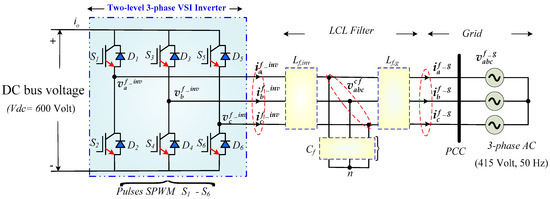
Figure 6.
Three-phase grid-integrated VSI with LCL filter.
Equations (15)–(17) are further transformed into a static d-q reference frame, which is expressed through true and reactive power that is decoupled, allowing the controller to be controlled individually. Applying the Park transformation, our system can be expressed by the means of two mathematical expressions, as given in Equations (18)–(20):
where −, −, −, and − represent the d-q axis components of the inverter side voltages, currents, and grid side voltage flows of currents; and , and are drop voltages across the filter capacitors, respectively. The instantaneous active and reactive powers sharing rated values with the utility grid are specified in Equations (21) and (22), respectively.
In the d-q reference frame, and represent d-axis quantities, and and are the q-axis quantities of the grid side voltage and current, respectively. To maintain grid power efficiency [30], is set to be zero for a balanced system. The active and reactive power, with appropriate assumptions, are as follows:
2.5. Steady-State–Space Modeling of LCL Filter
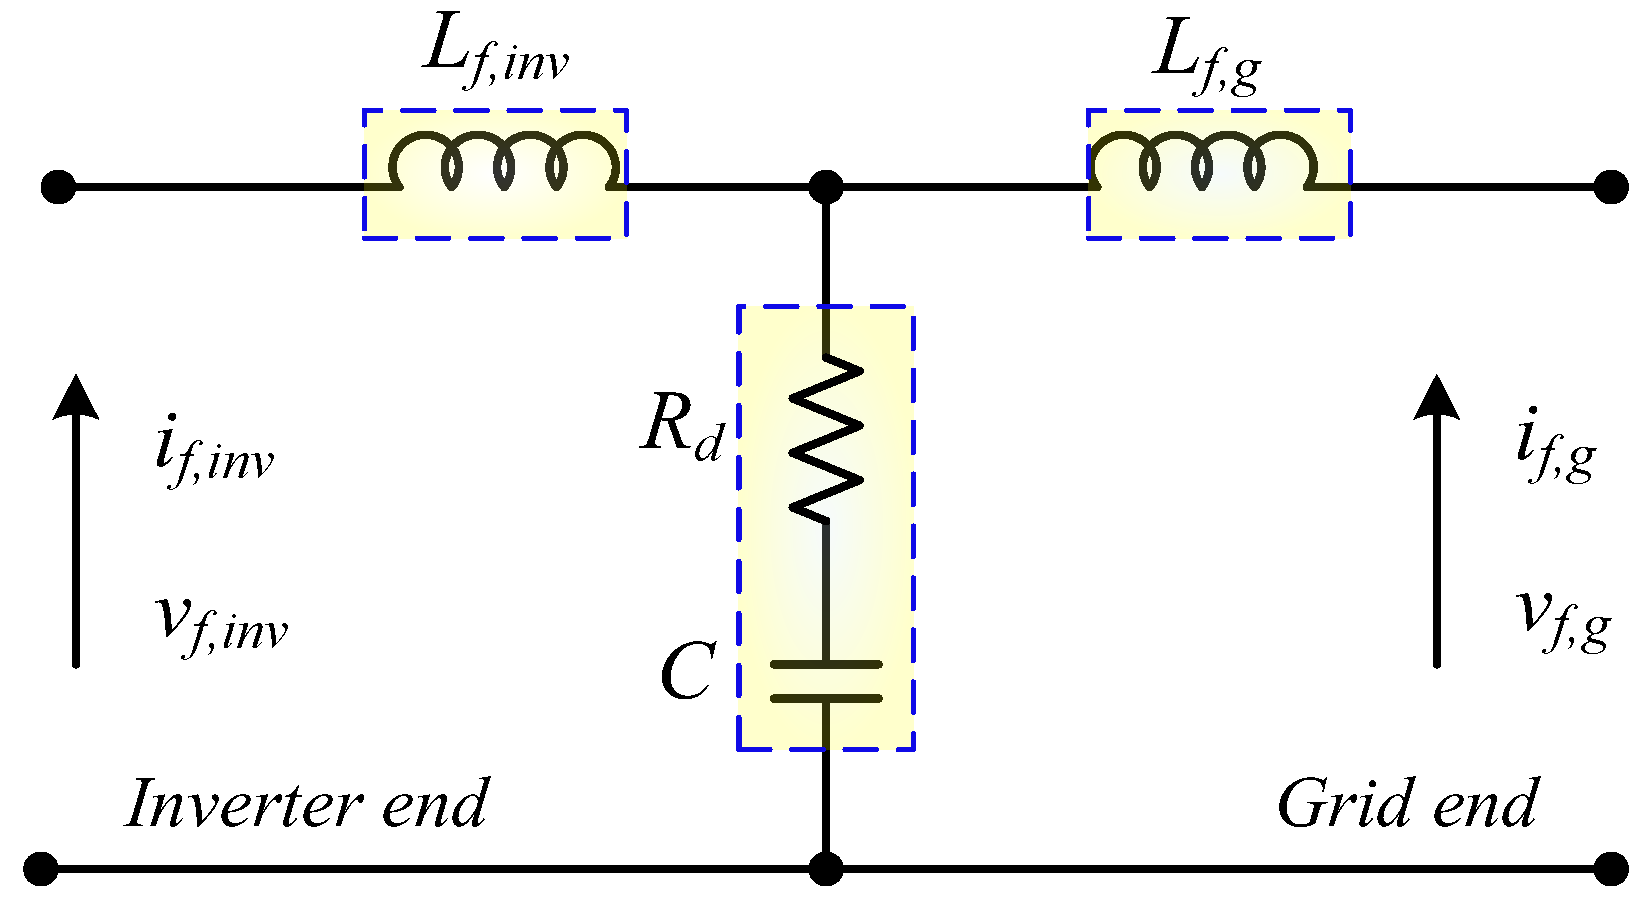
The significant purpose of a passive LCL filter is to convert the voltages from the switch device into current. This filter is commonly used to interface among the PV inverter and main grid to reduce the switching harmonics generated for injection into the grid, as shown in Figure 7. However, the THD level of the currents according to the IEEE 519 standard 2022 edition in a three-phase system is about 5% [30]. The induction of this filter is smaller than that of the filter, which reduces harmonics at the switching frequency. Therefore, the appropriate size of this filter ensures a better-quality grid current. An electrical equivalent circuit configuration of a passive LCL filter (single-phase system) is depicted in Figure 7.
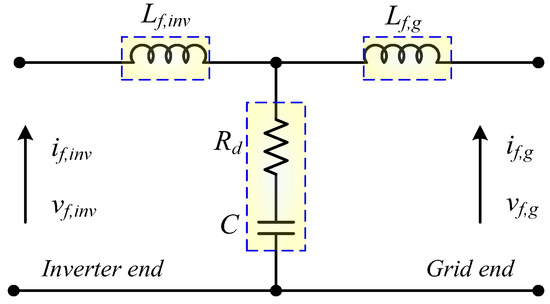
Figure 7.
Electrical equivalent circuit configuration of LCL filter.
The LCL filter parameters are the inverter and grid side inductances and (in henry), the capacitance (in farad), and series resistances , , and (in ohm), respectively. The selected parameters are based on the state–space mathematical expression, expressed by the following Equations (25)–(27):
here are the three-phase inverter and grid voltages (in volts), are the inverter and grid currents, and is the three-phase filter capacitor voltage (in volts), which will be an actuated variable of the filter, generated through PWM, respectively. According to Equations (25)–(27), the application of Park transformation into the rotating d-axis and q-axis reference frame (based on Park/Clarke conversion) results in , , and . These expressions can be represented by Equations (28)–(30), respectively.
where are three-phase inverter and grid voltages in the stationary d-axis and q-axis reference frame, are the inverter and grid currents in the d-q reference frame, and is the three-phase filter capacitor voltage, respectively. According to Equations (28)–(30), the transfer functions can be represented by Equations (31) and (32), expressed as follows [31].
where and are the T.F. of the converter and grid voltage current concerning the three-phase system, respectively. To design and calculate the LCL filter parameters for both the converter and grid sides, the inverter-side inductance can be constrained by the output ripple current. This ripple current is typically limited to around 10% of the nominal amplitude, as specified in Equation (33). Moreover, the LCL filter data are collected, as depicted in Table 2.
where is the highest ripple current at VSI, is the switching frequency of the system, and is the DC link voltage. The base capacitor Cbase and impedance Zbase of the filter can be derived by Equations (34) and (35):
where Pn is the rated nominal power (in watts), Cbase is the rated capacitance (in F), is the line rms voltage of the main grid (in volt), and is the supply frequency in (Hz). From Equation (36), the ripple current of 10% of the rated nominal current is:
The design of a grid-side filter inductor () is described in Equation (37) as follows.
where r is the relation factor ( between and .
Table 2.
Specification parameters of the TS-GIPV system.
According to the LCL filter, the damping resistance (Rd) expected to avoid resonance is acquired concerning the resonant frequency (in Hz) and is given in Equations (38) and (39).
Resonance frequency:
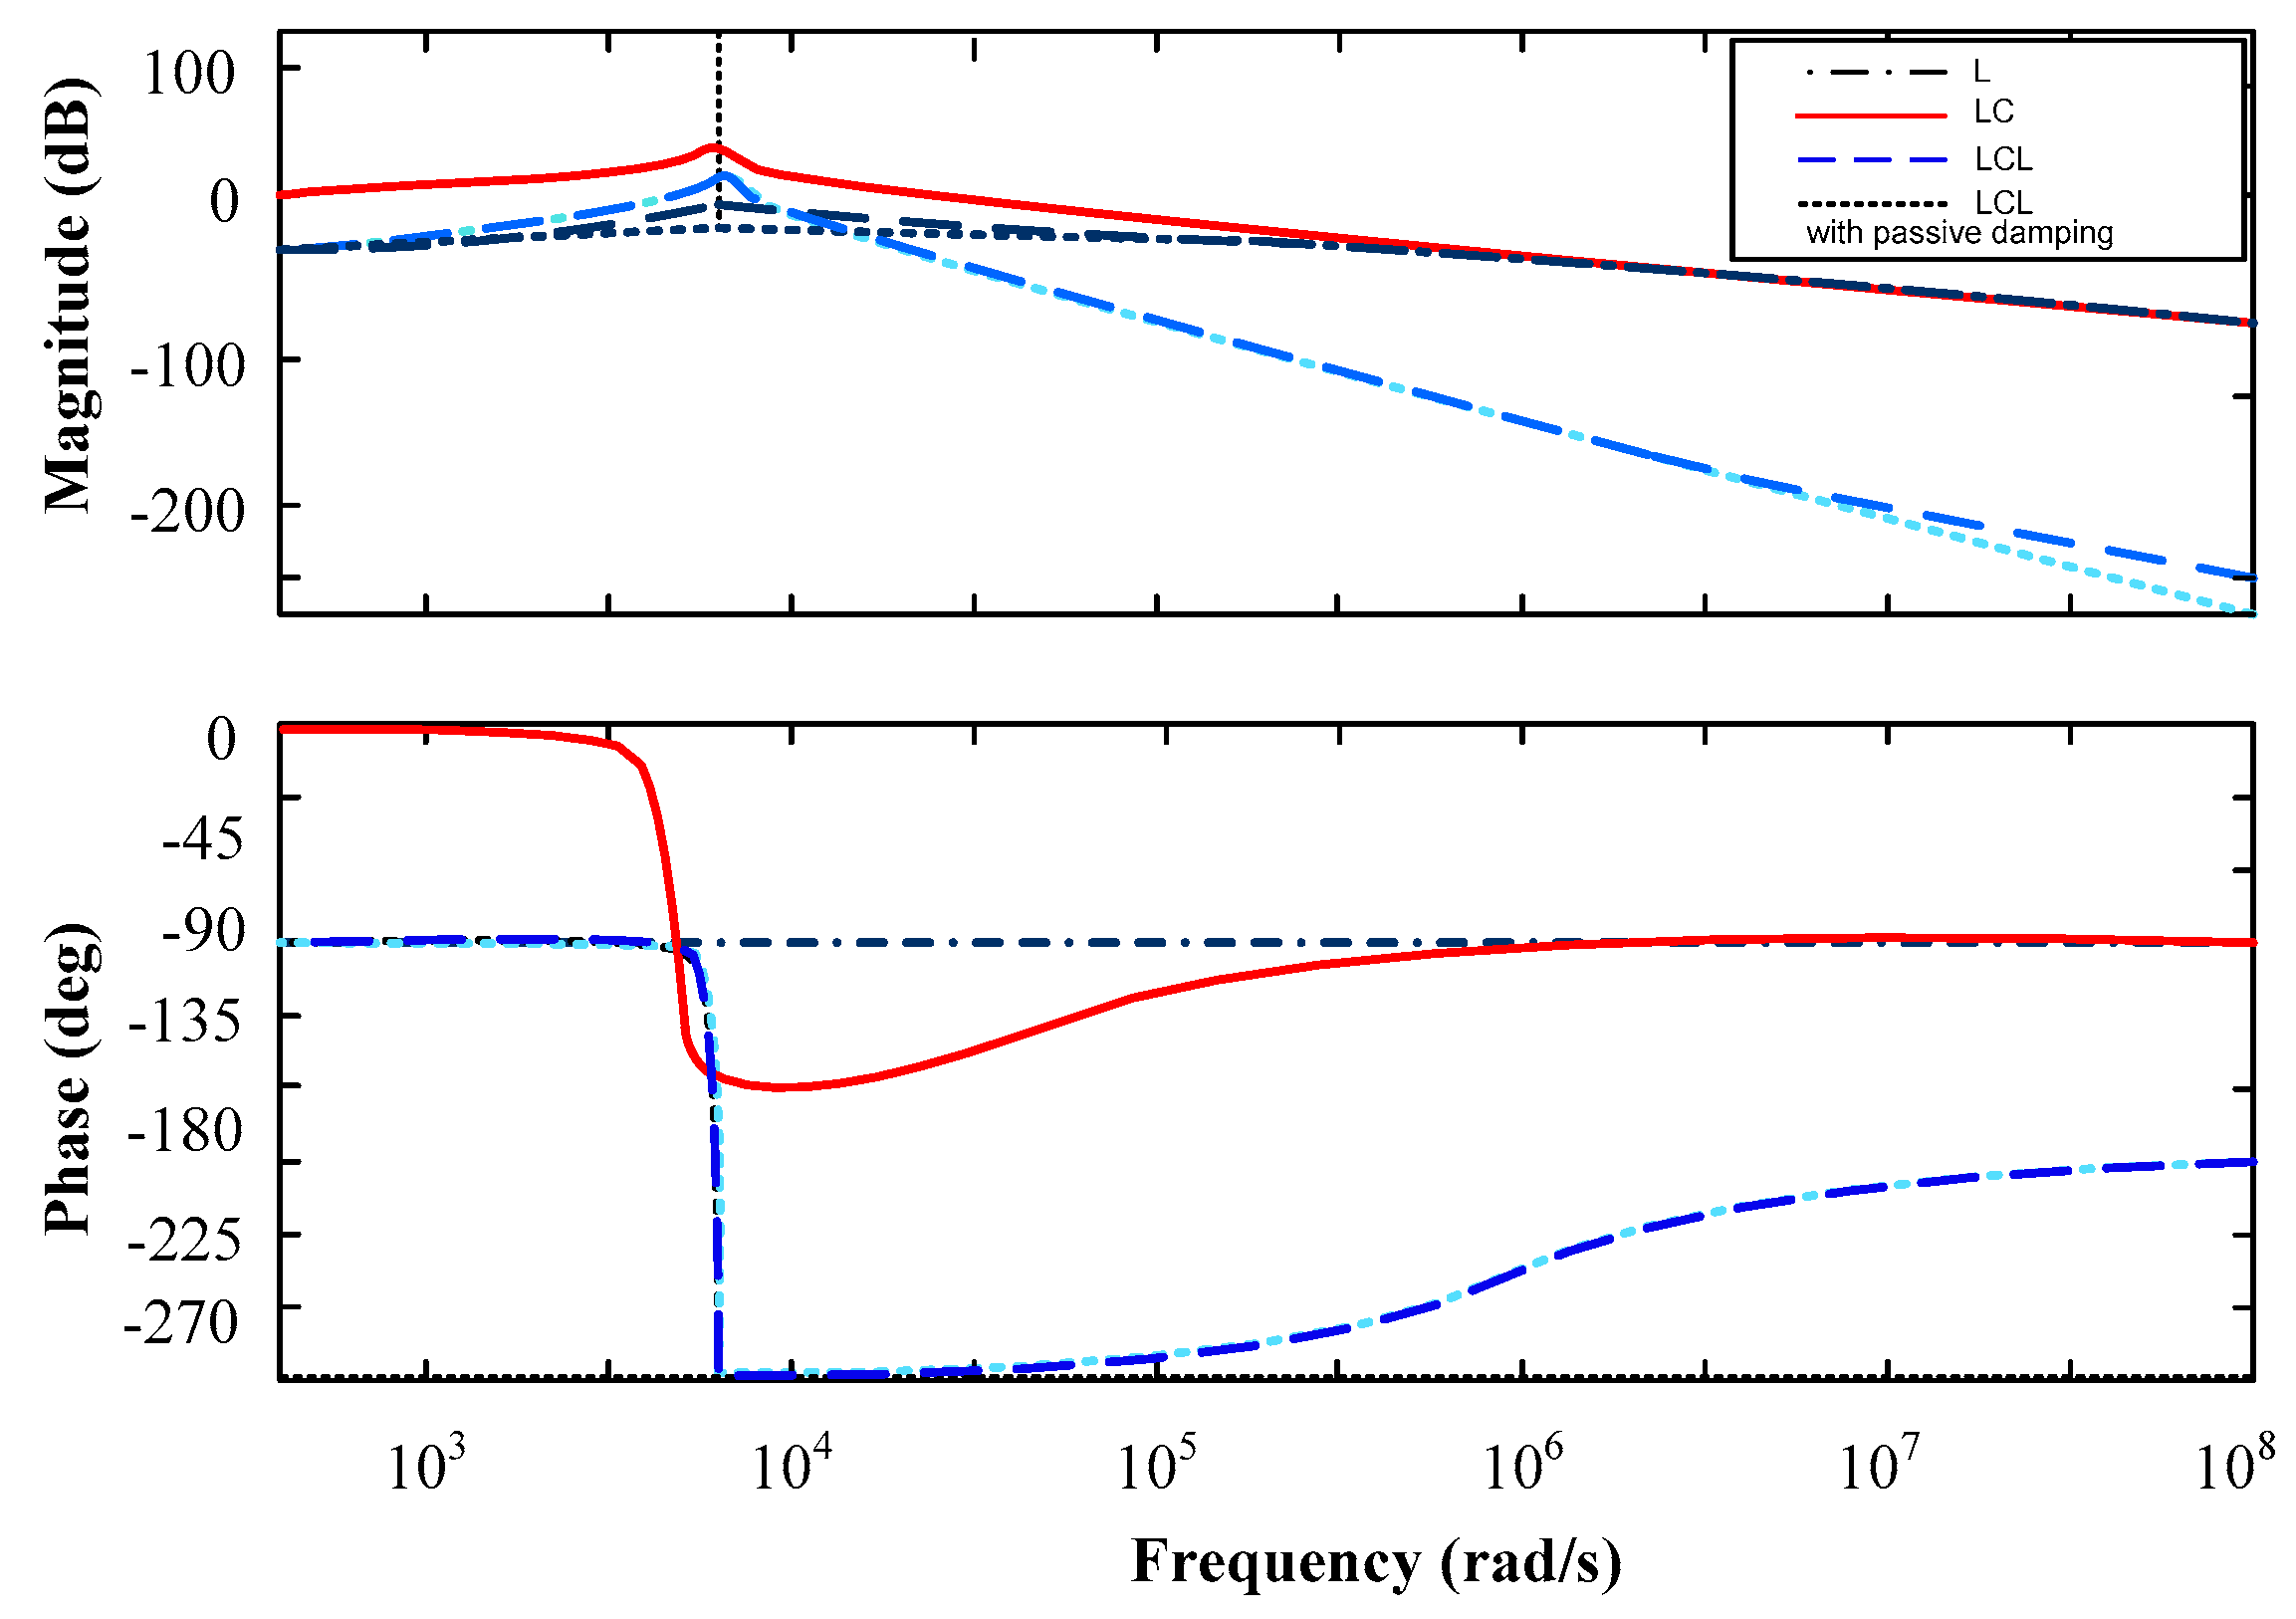
As described above, a bode plot diagram of the LCL filter of two T.F.s (H1 and H2) with and without passive damping is depicted in Figure 8. However, the LCL filter achieves a higher attenuation power than the L and LC filters at higher frequencies, while the L, LC, and LCL filters are almost equal in the lower-frequency range.
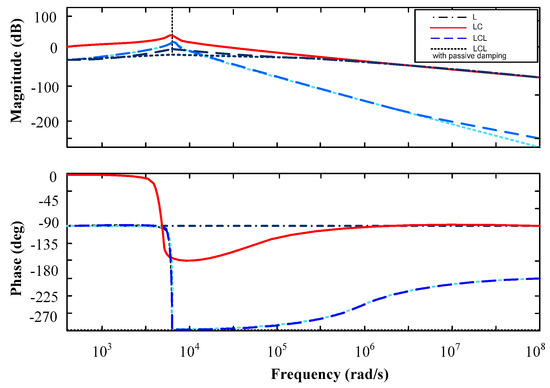
Figure 8.
Bode plot diagram of T.F. H1, with values of L, LC, and LCL filters.
3. Proposed Control Technique and Its Comparison with Other Techniques
In this section, the proposed system with control approaches consists of MPPT, intermediate DC link voltage regulation, and grid current synchronization, as shown in Figure 1. Firstly, the new efficient variable step-size LMPO MPPT control technique, designed for an improved MPP response of the PV array, is tested under four different scenarios. Furthermore, the second-level controller proposes a new VSC control technique related to the DC link outer voltage loop and inner current loop controller to achieve better regulation of the DC link voltage compared to the existing control scheme. As mentioned above, the generated solar photovoltaic power is injected into the main grid with a higher power quality. A voltage regulation controller based on an adaptive PI (API) controller is developed to maintain the fluctuating output voltage of the DC link. This ensures proper power sharing and grid current synchronization at the desired values. The proposed MPPT control technique eliminates the drawbacks of conventional techniques, such as large oscillations, slow tracking speed, and low efficiency.
3.1. Conventional MPPT Technique
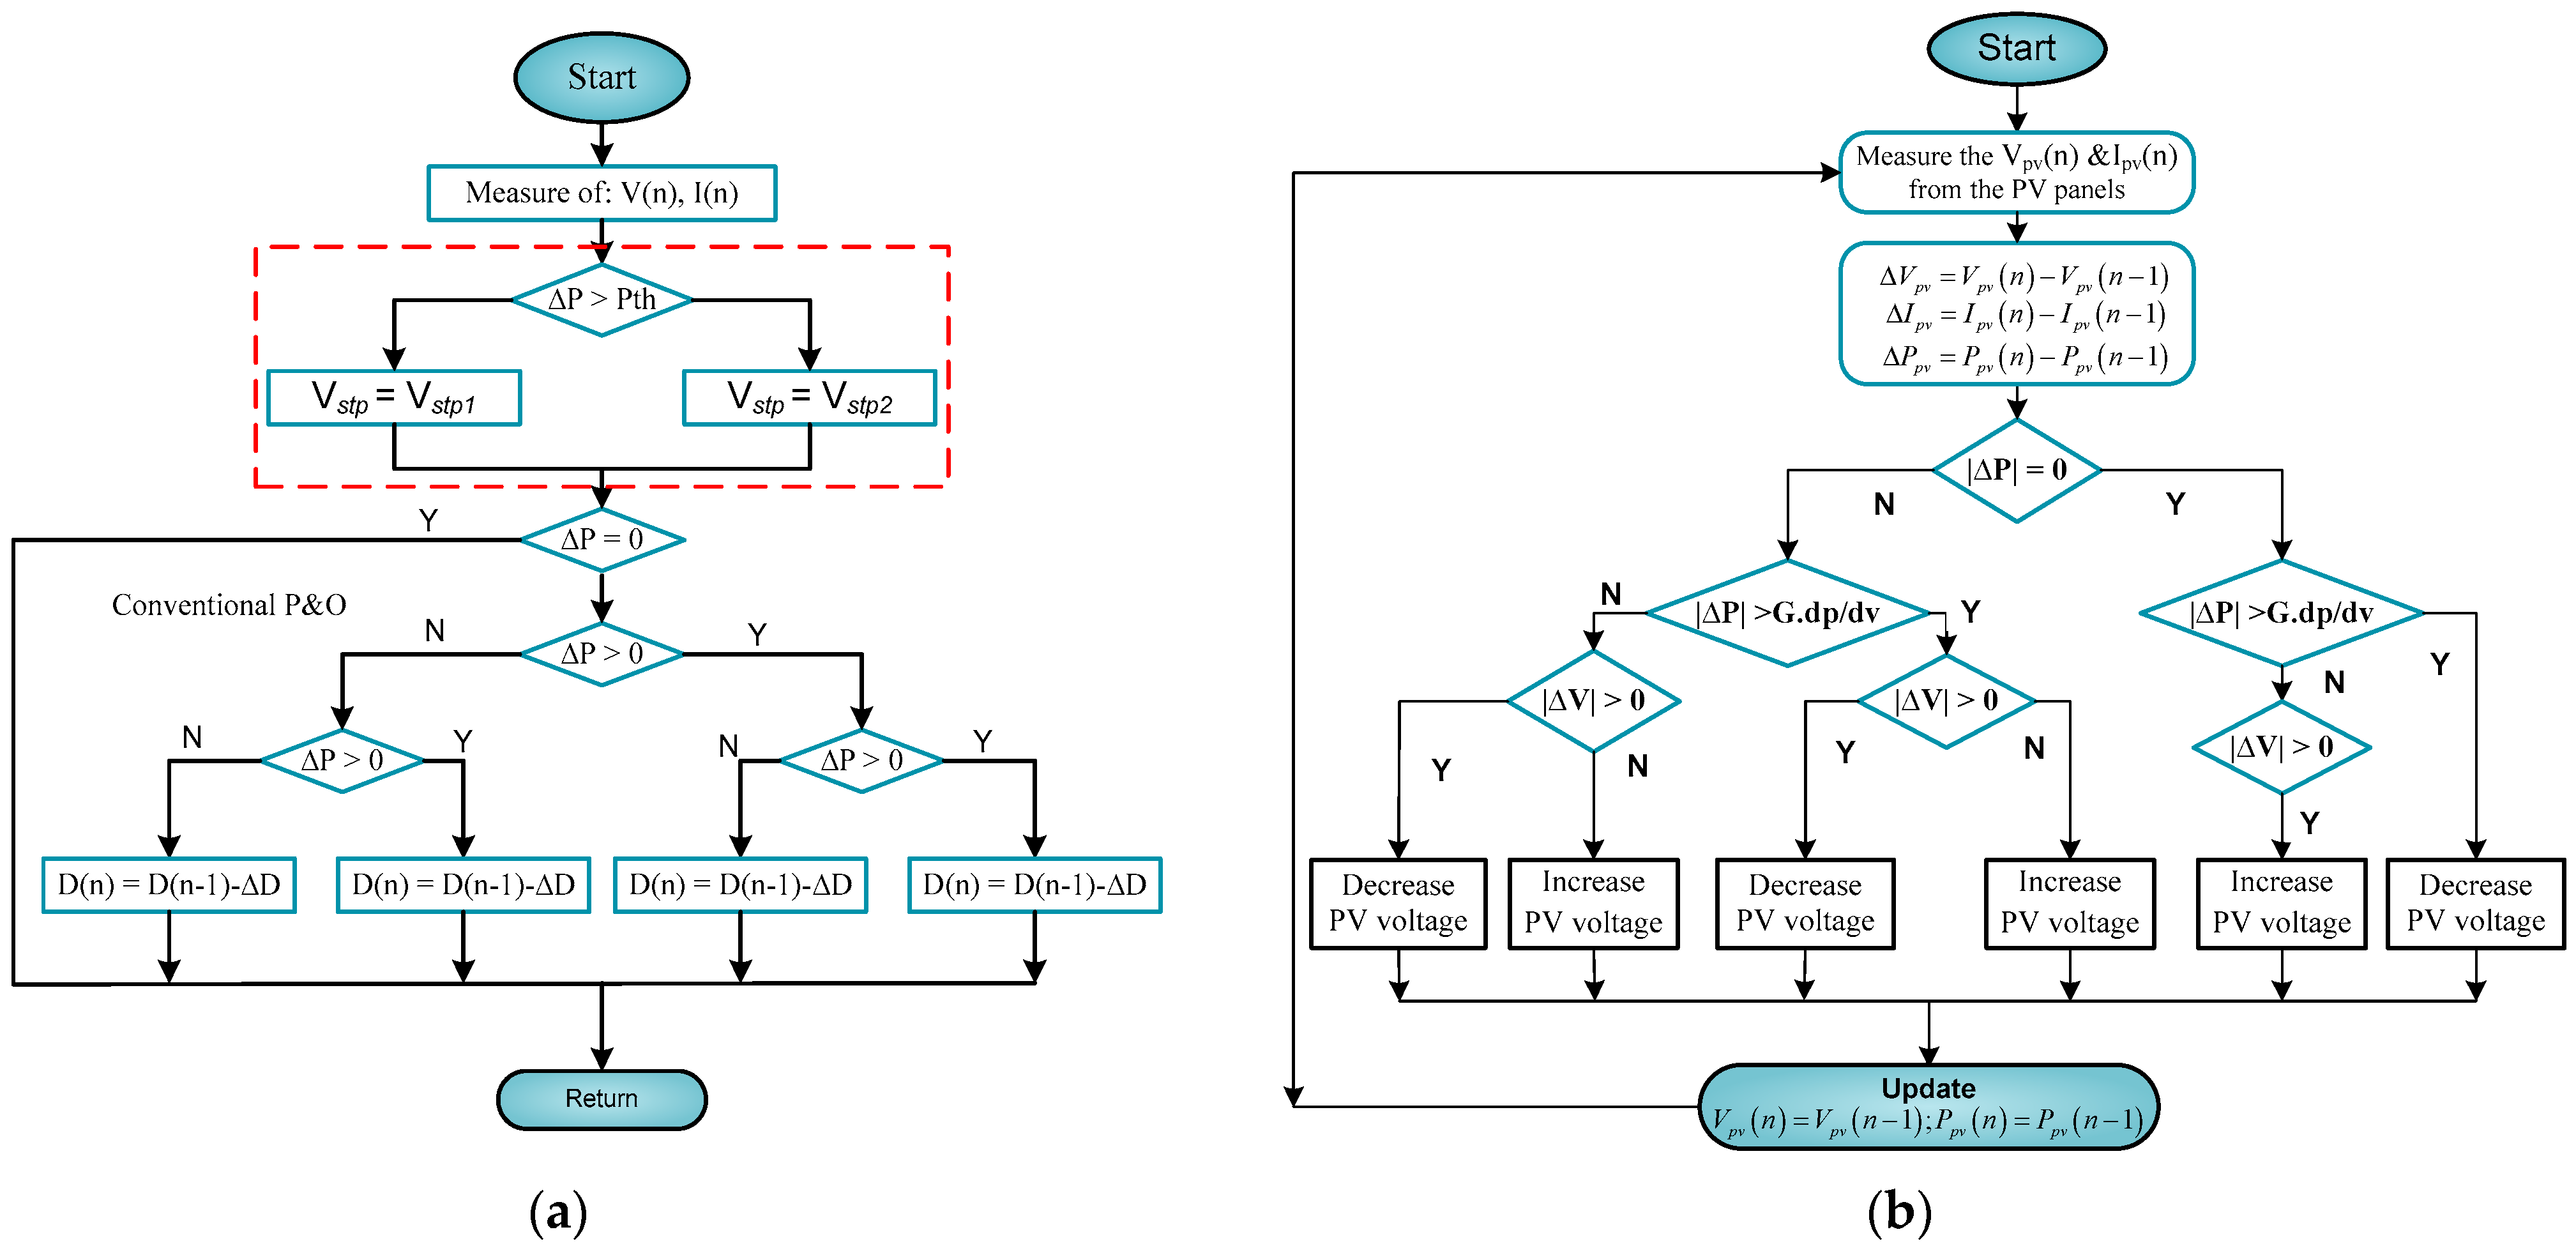
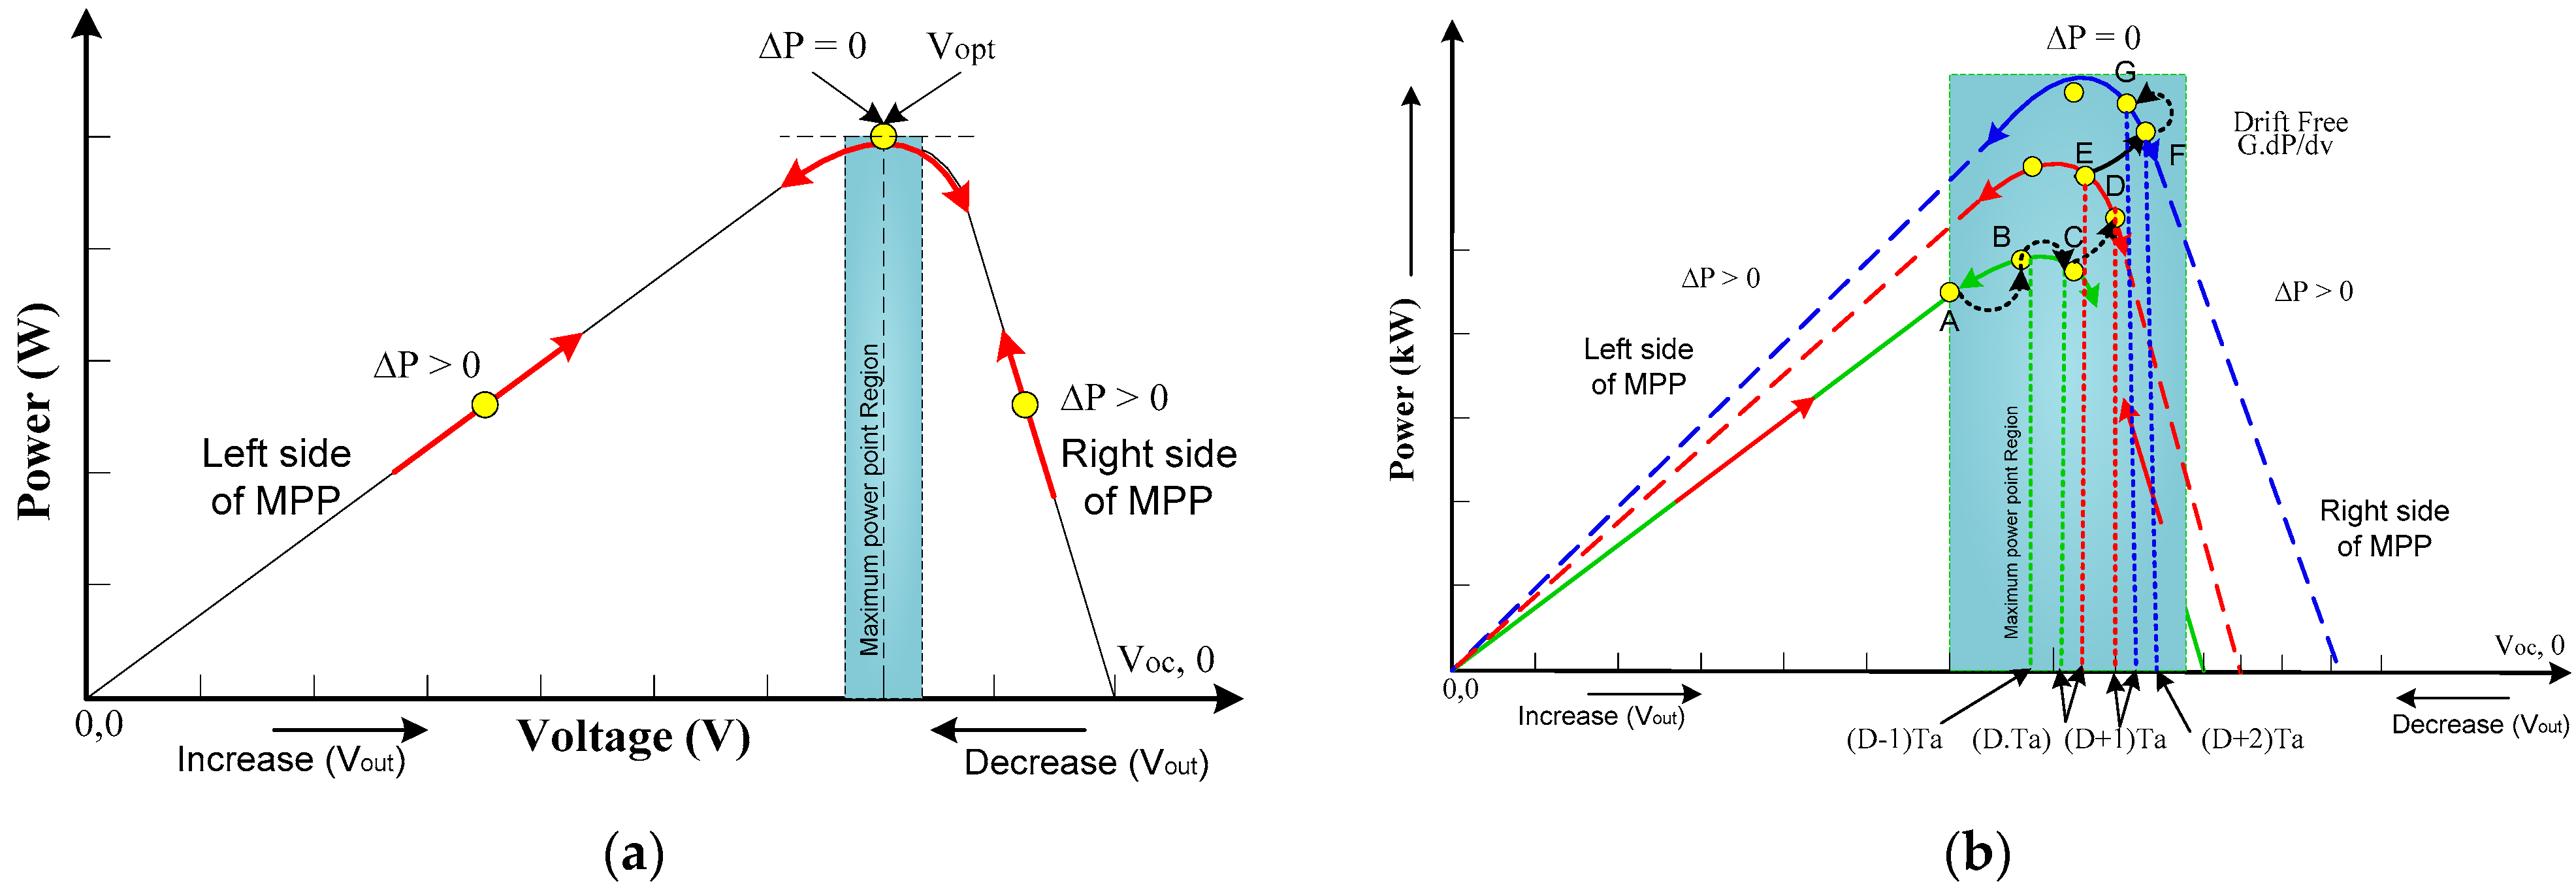
A flowchart of the conventional PO and modified PO MPPT tracking algorithms is shown in Figure 9. This is the most popular technique for the industrial sector because it is simple, low-cost, requires minimal sensors, and operates directly [9]. The simple operation of the conventional controller changes the PV voltages in a similar direction at . Otherwise, the MPPT control technique inverts the PV voltage efficient variable step size in the direction of the maximum power point, which is represented in Figure 10a. However, conventional PO MPPT changes the location of the system operating point by varying the PV array’s operating voltage by a voltage increment (), which changes the PV array’s output power by a voltage increment (). The oscillations’ amplitude around the MPP depends on the variable step size used. A performance analysis of the P&O and MPO control techniques of MPP with efficient small and large voltage step sizes can be conducted [10,11,12,13,14,15,16,17]. The conventional MPPTs offer advantages but suffer from several drawbacks. In the modified PO, the perturbation cycle takes into account the variable step size rather than the fixed step size as shown in in Figure 10b. The expansive oscillations around the MPP will cause a loss of productive power if the step size is kept large to accomplish a fast dynamic response. Therefore, a modified PO technique to overcome these drawbacks is presented [18]. However, the main issues of this MPPT method include steady-state oscillations, a large step size, and a slow tracking response at the maximum power point. This makes it less suitable for changing climatic conditions when employing the largest perturbation step size. Therefore, the MPP is quickly achieved but power losses are caused by increased steady-state oscillations. Although the power loss caused by the steady-state perturbation can be reduced by a smaller perturbation step, the tracking speed will be slower.
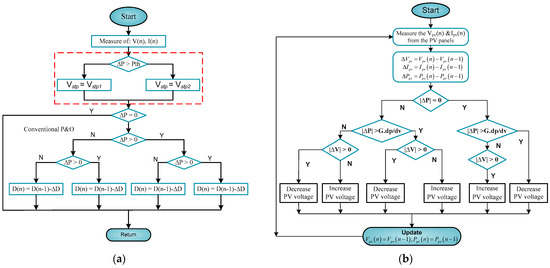
Figure 9.
Flowcharts of existing MPPT techniques (a) P&O [5,9,14] and (b) existing modified P&O MPPT [12,15,18].
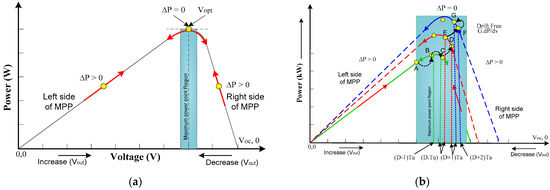
Figure 10.
(a) P-V curve of existing MPPT control technique and (b) proposed adaptive variable step-size LMPO MPPT with solar PV irradiance enhancement.
3.2. Proposed LMPO MPPT Technique
As mentioned above in Section 3.1, the conventional MPPT techniques are unable to deliver quick and precise tracking responses around the MPP. This perturbation is set to a fixed step, and if the step size is maintained as large to accomplish the rapid tracking response, more oscillations will increase around the MPP, causing a loss of power output. However, to mitigate these drawbacks, the proposed efficient variable step-size LMPO MPPT technique has been used. To address research gaps, this work proposes a novel MPPT control approach. Its operation can be summarized as follows: if the power fluctuation is greater than the threshold power value , the perturbing step size is ; if the power fluctuation is less than the small value , the perturbing step size is , where assumes that the maximum power is a small meteorological condition. A flowchart showing the proposed LMPO MPPT method is illustrated in Figure 11. The varying step size is determined by Equation (39):
where is the real duty cycle, = the earlier value of the real duty cycle at the sampling time, and = the variable power steps and stepping factor in refs. [17,18,19]. The variable step size can be expressed as a function of the varying voltage and power, as given in Equations (40)–(42):
where is the automatically adjusted power for a varying irradiance and is the variable step voltage determined by the irradiance and cell temperature at the sth sampling time, respectively. Several output steps of the proposed MPO-MPPT technique are illustrated as follows:
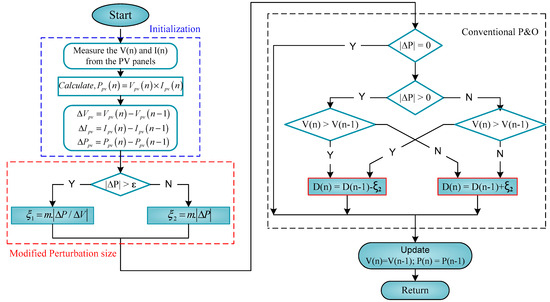
Figure 11.
Flowchart of the proposed efficient variable step-size LMPO MPPT technique.
Here, = a scaling factor automatically adjusted at the step size, and and are automated step changes of the solar PV module under variable changes, respectively. The scaling factors’ numerical equation is as follows:
where is a predefined value that represents a higher limit for the virtual duty cycle. The effective power of the perturb and observe technique is:
and
3.3. Several Steps of Proposed Control Strategy
Performance analysis of the proposed novel efficient modified PO MPPT control technique employed with PO and INC can be built using the following steps:
- Step I: The PV side input voltage and current are determined via sampling while determining the initial nth values. Then, the nth power value of (s) is calculated using the product of the current and voltage , respectively.
- Step II: Measuring the values of and , respectively.
- Step III: If the power is a variable higher than the minimum small value , then . The is defined by Equation (44) and refers to a pulse generator that drives the switching of the power boost converter topology.
- Step IV: If the varying power is lower than the diminutive value , then = perturbing step size. The is defined by Equation (45) and refers to the same as above, indicating that the weather conditions, such as temperature and irradiance, have changed rapidly.
- Step V: The final step is updating the optimum individual solution predicted for each , and their duty cycles at MPP based on each of the above.
3.4. Performance of Dynamic Efficiency
For applications of PV energy conversion systems, such as small- and large-scale PV plants, satellites, electric vehicles, space aircraft, etc., the mathematical calculation of instantaneous efficiency can be expressed in Equation (48), as [26]:
The average MPPT efficiency is calculated in Equation (34) as:
where, is theoretical generated power and is the generated output power at the stipulated time from the PV array by MPPT. It is calculated by multiplying the genuine value of PV voltage and current. A lot has been reviewed in the area of controller-based PV systems [31].
3.5. Controller Design of the Adaptive DC-Link Voltage Fluctuations Control
As mentioned previously, an adaptive PI-based link voltage fluctuations control strategy is proposed for the TS-GIPV system, as shown in Figure 1c. The main link regulation is necessary to maintain the DC-link voltage between the boost converter and inverter, which tracks any reference voltage values and voltage regulation across the -link capacitor. Therefore, to maintain a higher potential than the grid, any reference voltage should be selected such that it is higher than the grid peak voltage by 10% to sustain a higher one-sided potential than the grid [32,33]. However, in the proposed control technique, several key aspects of the results are validated through simulation. These include the DC-link voltage (dc), the active power (P) injected into the main grid, reactive power, d-q axis current, and three-phase RMS current (abc), respectively. The generated PV reference value is combined with the measured solar PV input voltage (pv) and current value (pv) to manage the duty ratio of the DC-DC converter, which results in the desired output voltage being obtained. After this scenario, the boost converter output is employed as a DC input source for the VSC, further involving grid integration control.
3.6. Controller Design for GIPV Inverter Inner Current and Outer Voltage Loop Control
In this section, a modified inner and outer current-voltage controller based on the PI control method for the TS-GIPV system is presented and detailed. The main aim of this control system is to inject solar photovoltaic energy into the grid with high grid current. A cross-coupling method and feedforward controller are used to achieve a safe operating current from the VSC, as shown in Figure 1c. A list of rated specification parameters and ranges of controllers is shown in Table 3. The feedforward controller stays connected with varying meteorological conditions. Therefore, a double-loop feed-forward control system based on an adaptive proportional integration (API) controller was created to maintain the grid-side inverter current functioning within acceptable limits. However, the overall control techniques are typical multiple-loop controls that include internal current loops, external voltage loops, power loops, and phase-locked loops (PLL), as addressed in [33]. The inner current loop control strategy is also a proportional-integral controller used to achieve high power factor integration. The output voltage loop control technique is based on the PI control technique, which can enhance the accuracy and fast-tracking response of the reference link voltage at MPPT output. The generated PV power loop realized by the MPPT technique ensures that the system is operating at MPP under realistic variations of meteorological conditions and load variations. The phase-locked loop (PLL) controls an estimated angle (θ) for the grid phase angle, as presented in [32,34]. However, Park’s transformation also requires a PWM generator, which creates gate pulses for the inverter. The use of space vector pulse width modulation for PWM generation results in lower switching stress, lower dv/dt stress, higher power factor, and lower line current harmonics, which are crucial for any GIPV system. The purpose of this section is to discuss the control technique of each converter used in a GIPV system. The dynamics of the proposed control technique used in this system in different scenarios are analyzed by varying the input source parameters.
Table 3.
Specification of control parameters and ranges of the controllers.
4. Results and Discussion
In this paper, a three-phase two-stage grid-integrated PV solar (2.5 kW) system is considered, as shown in Figure 1. This system’s simulated results are validated through the MATLAB/Simulink 2019a platform. The proposed system is subjected to various dynamic operations on both the PV side as well as the GSC side. Lists of the rated specification parameters used in this system are shown in Table 2 and Table 3, respectively. The robustness of the proposed technique is simulated and verified under four different test scenarios, namely, Scenario I: varying irradiance at a fixed temperature, Scenario II: varying temperature at a fixed irradiance, Scenario III: a one-day real-time irradiance profile, and Scenario IV: the overall performance under dynamic load deviations. In addition, we highlight the benefits and enhanced system performance of the proposed technique, such as minimized steady-state oscillation, extraction of optimum power, improved efficiency, and fast-tracking response, as compared to conventional methods.
4.1. Scenario I: Performance of Proposed Control System Under Varying Irradiance at Fixed Temperature
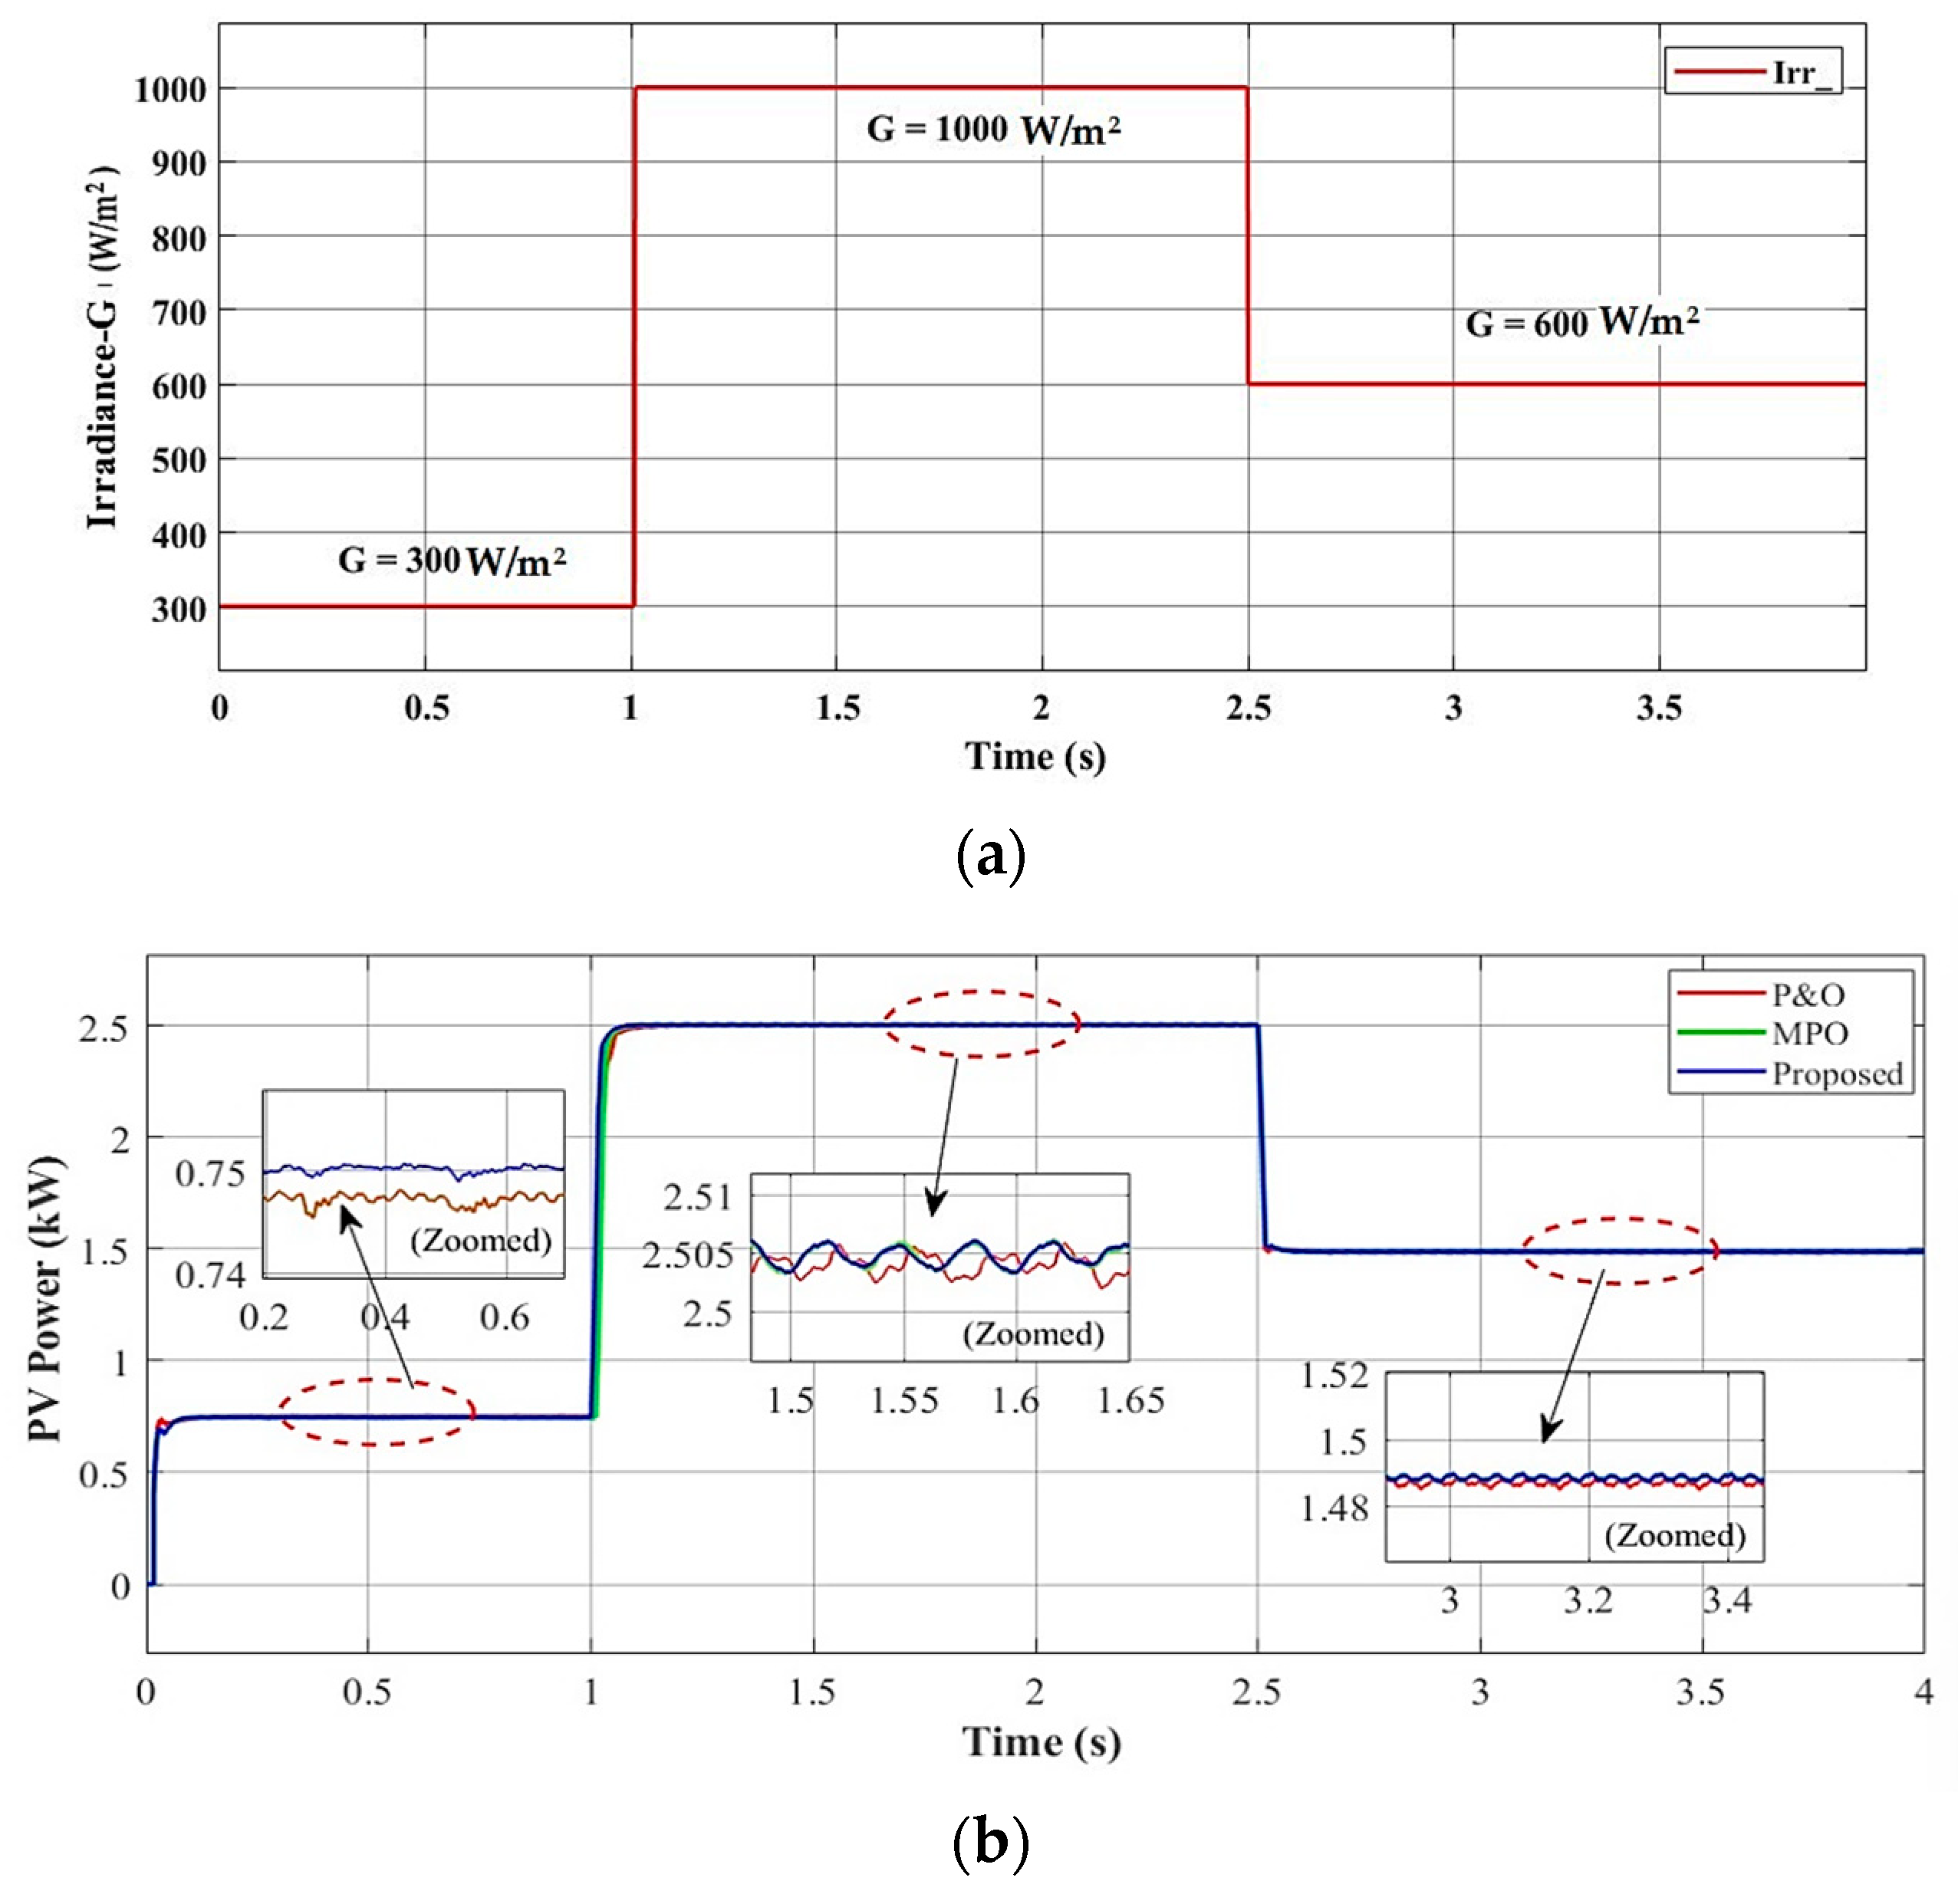
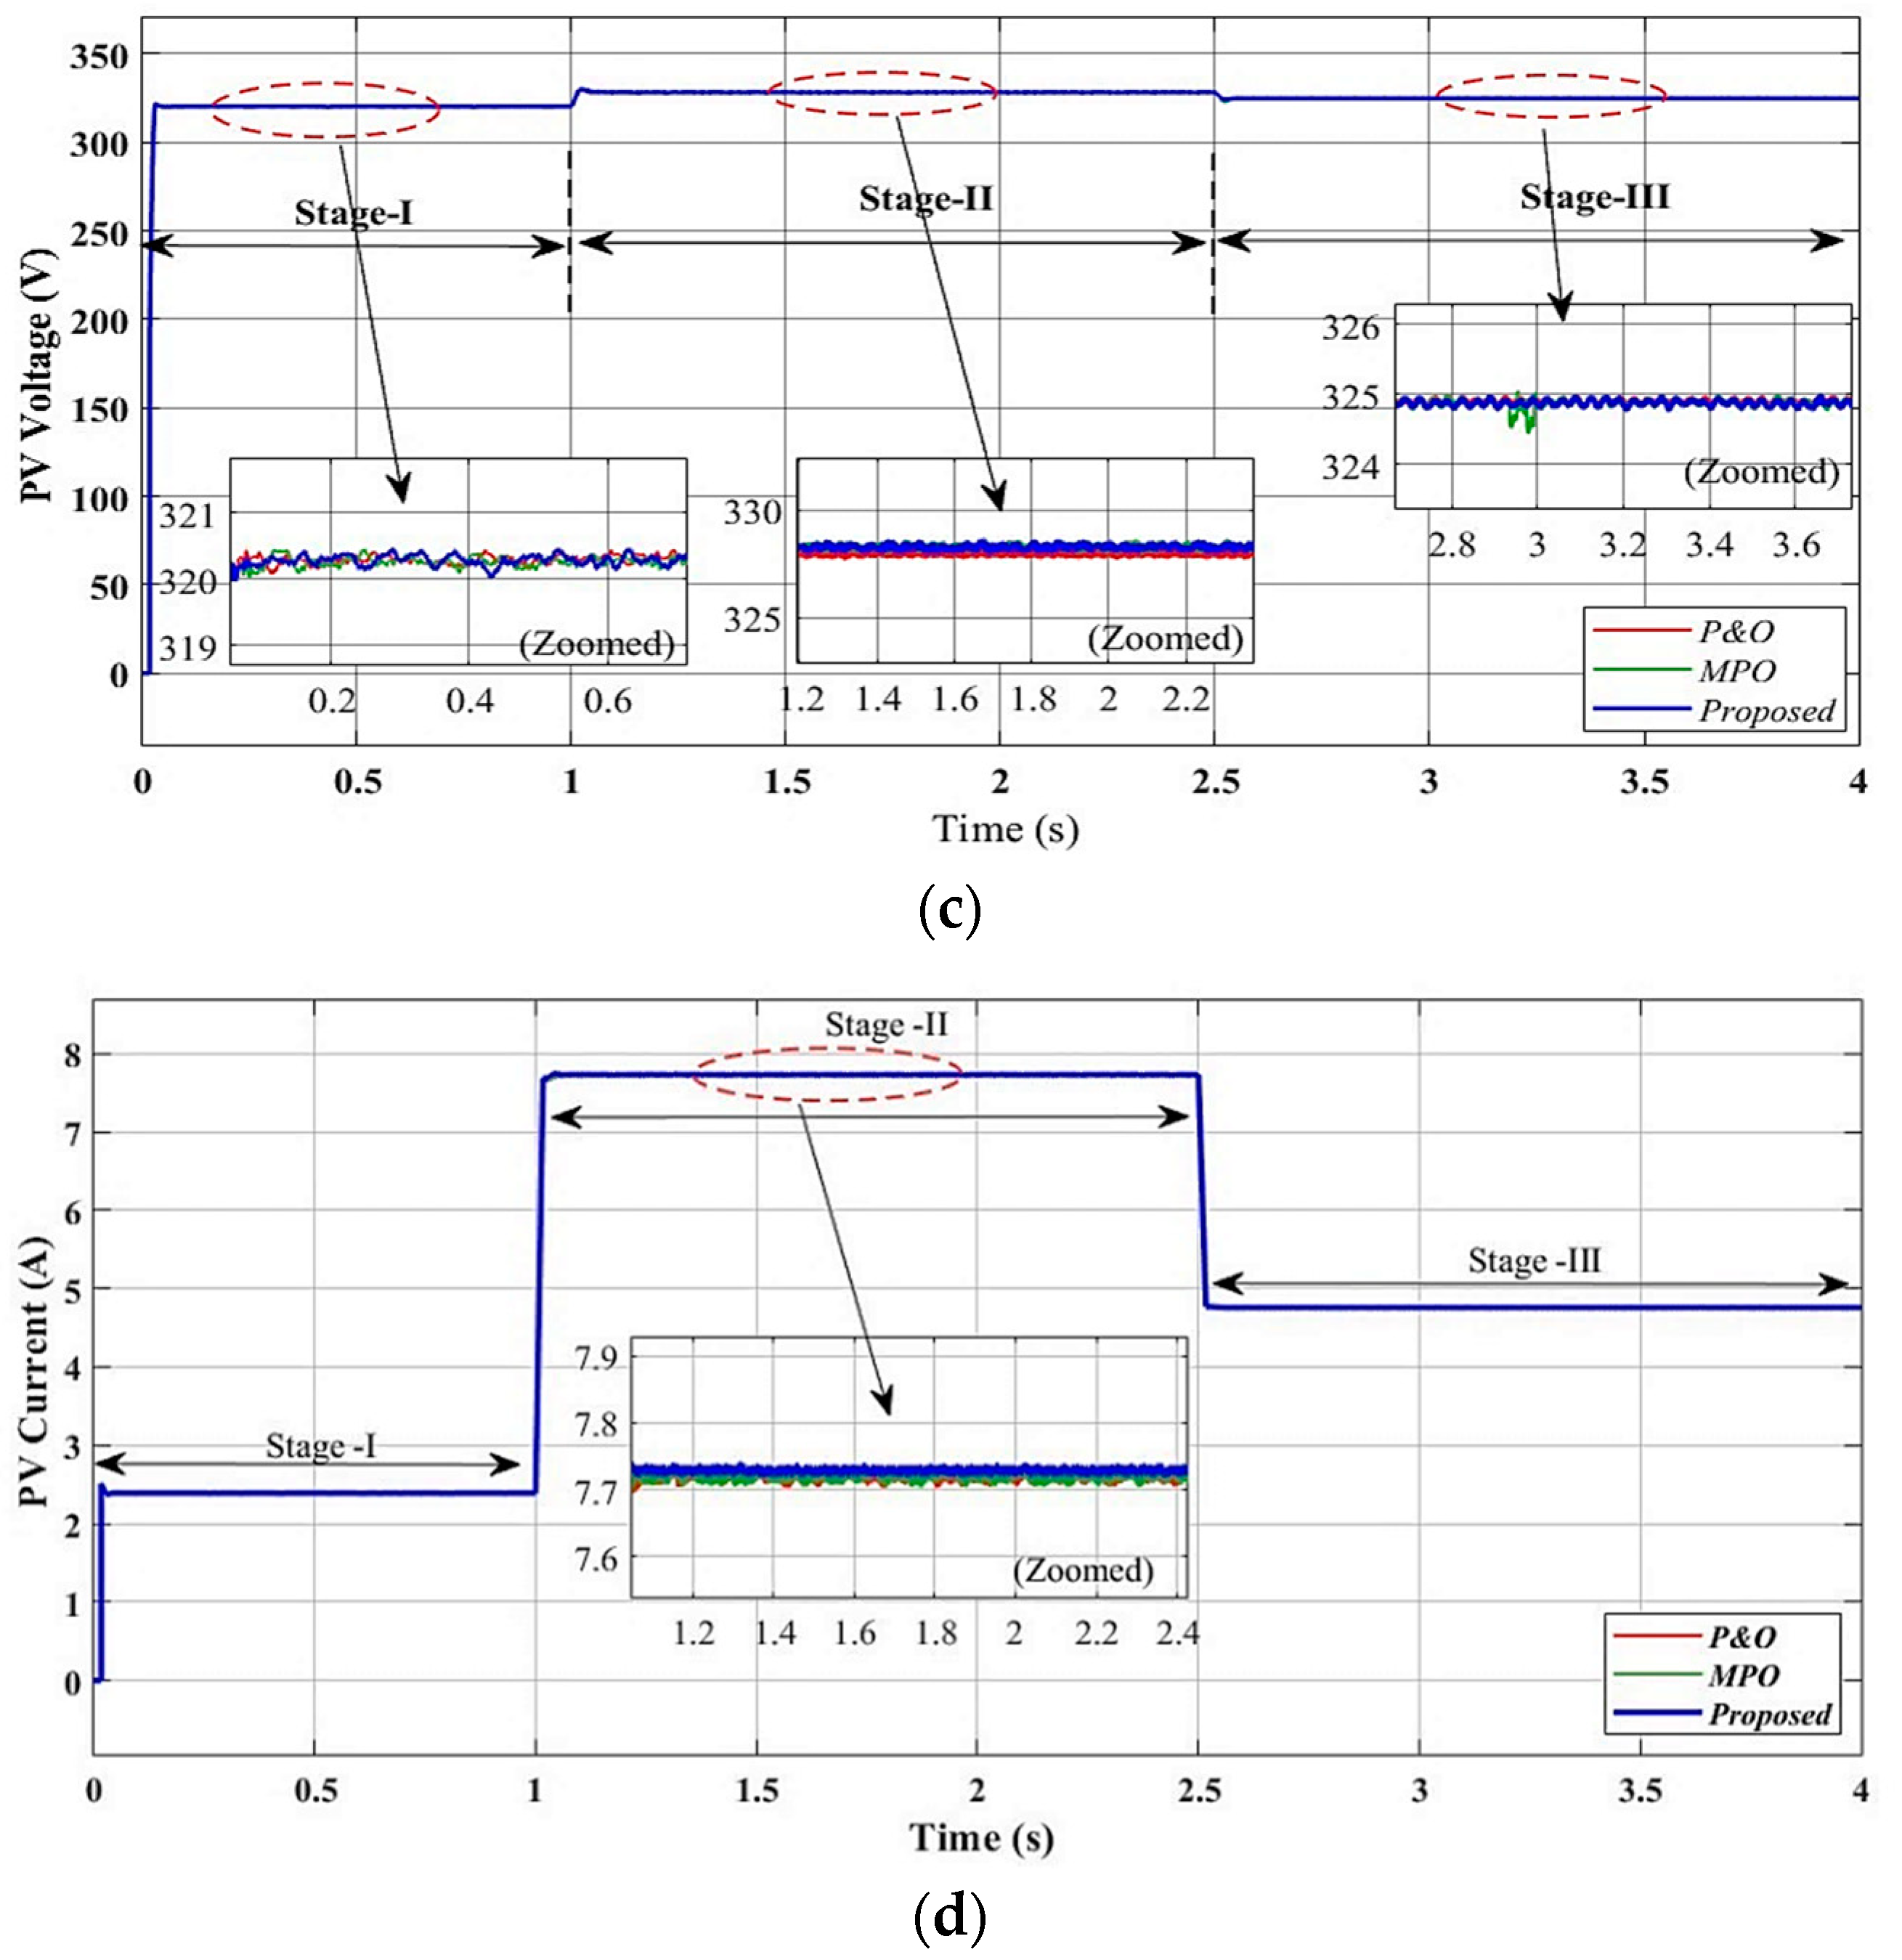
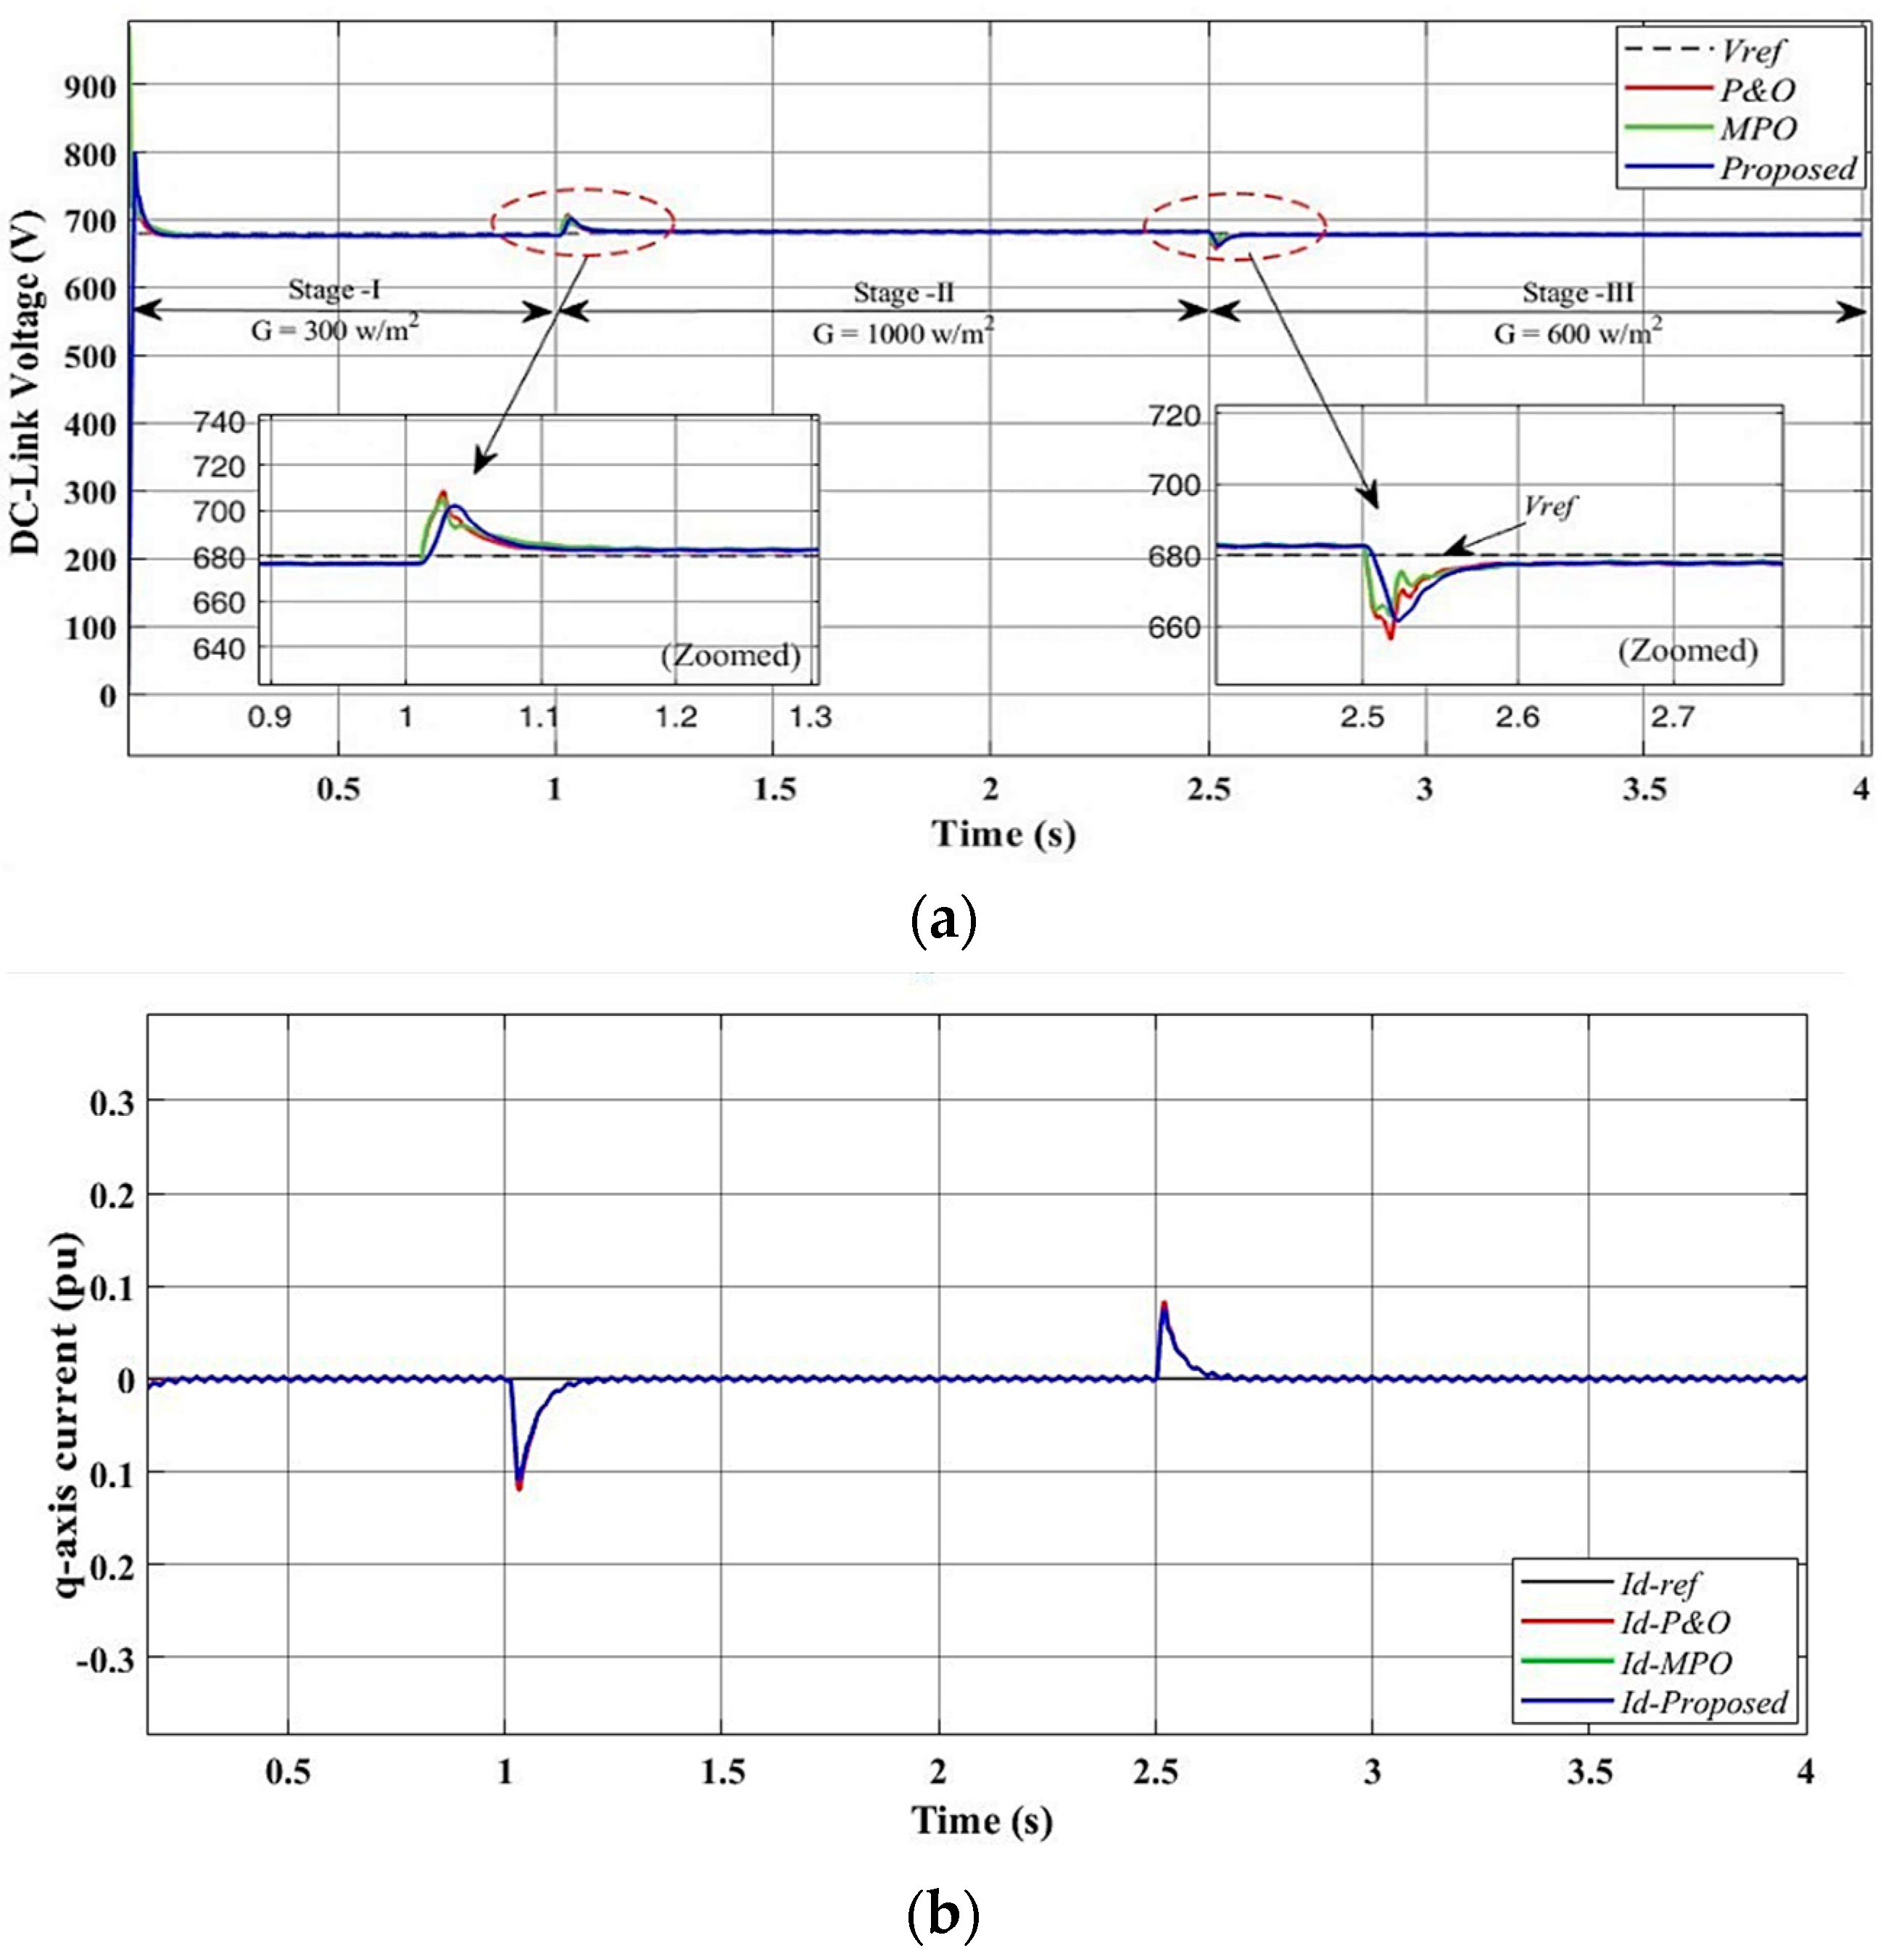
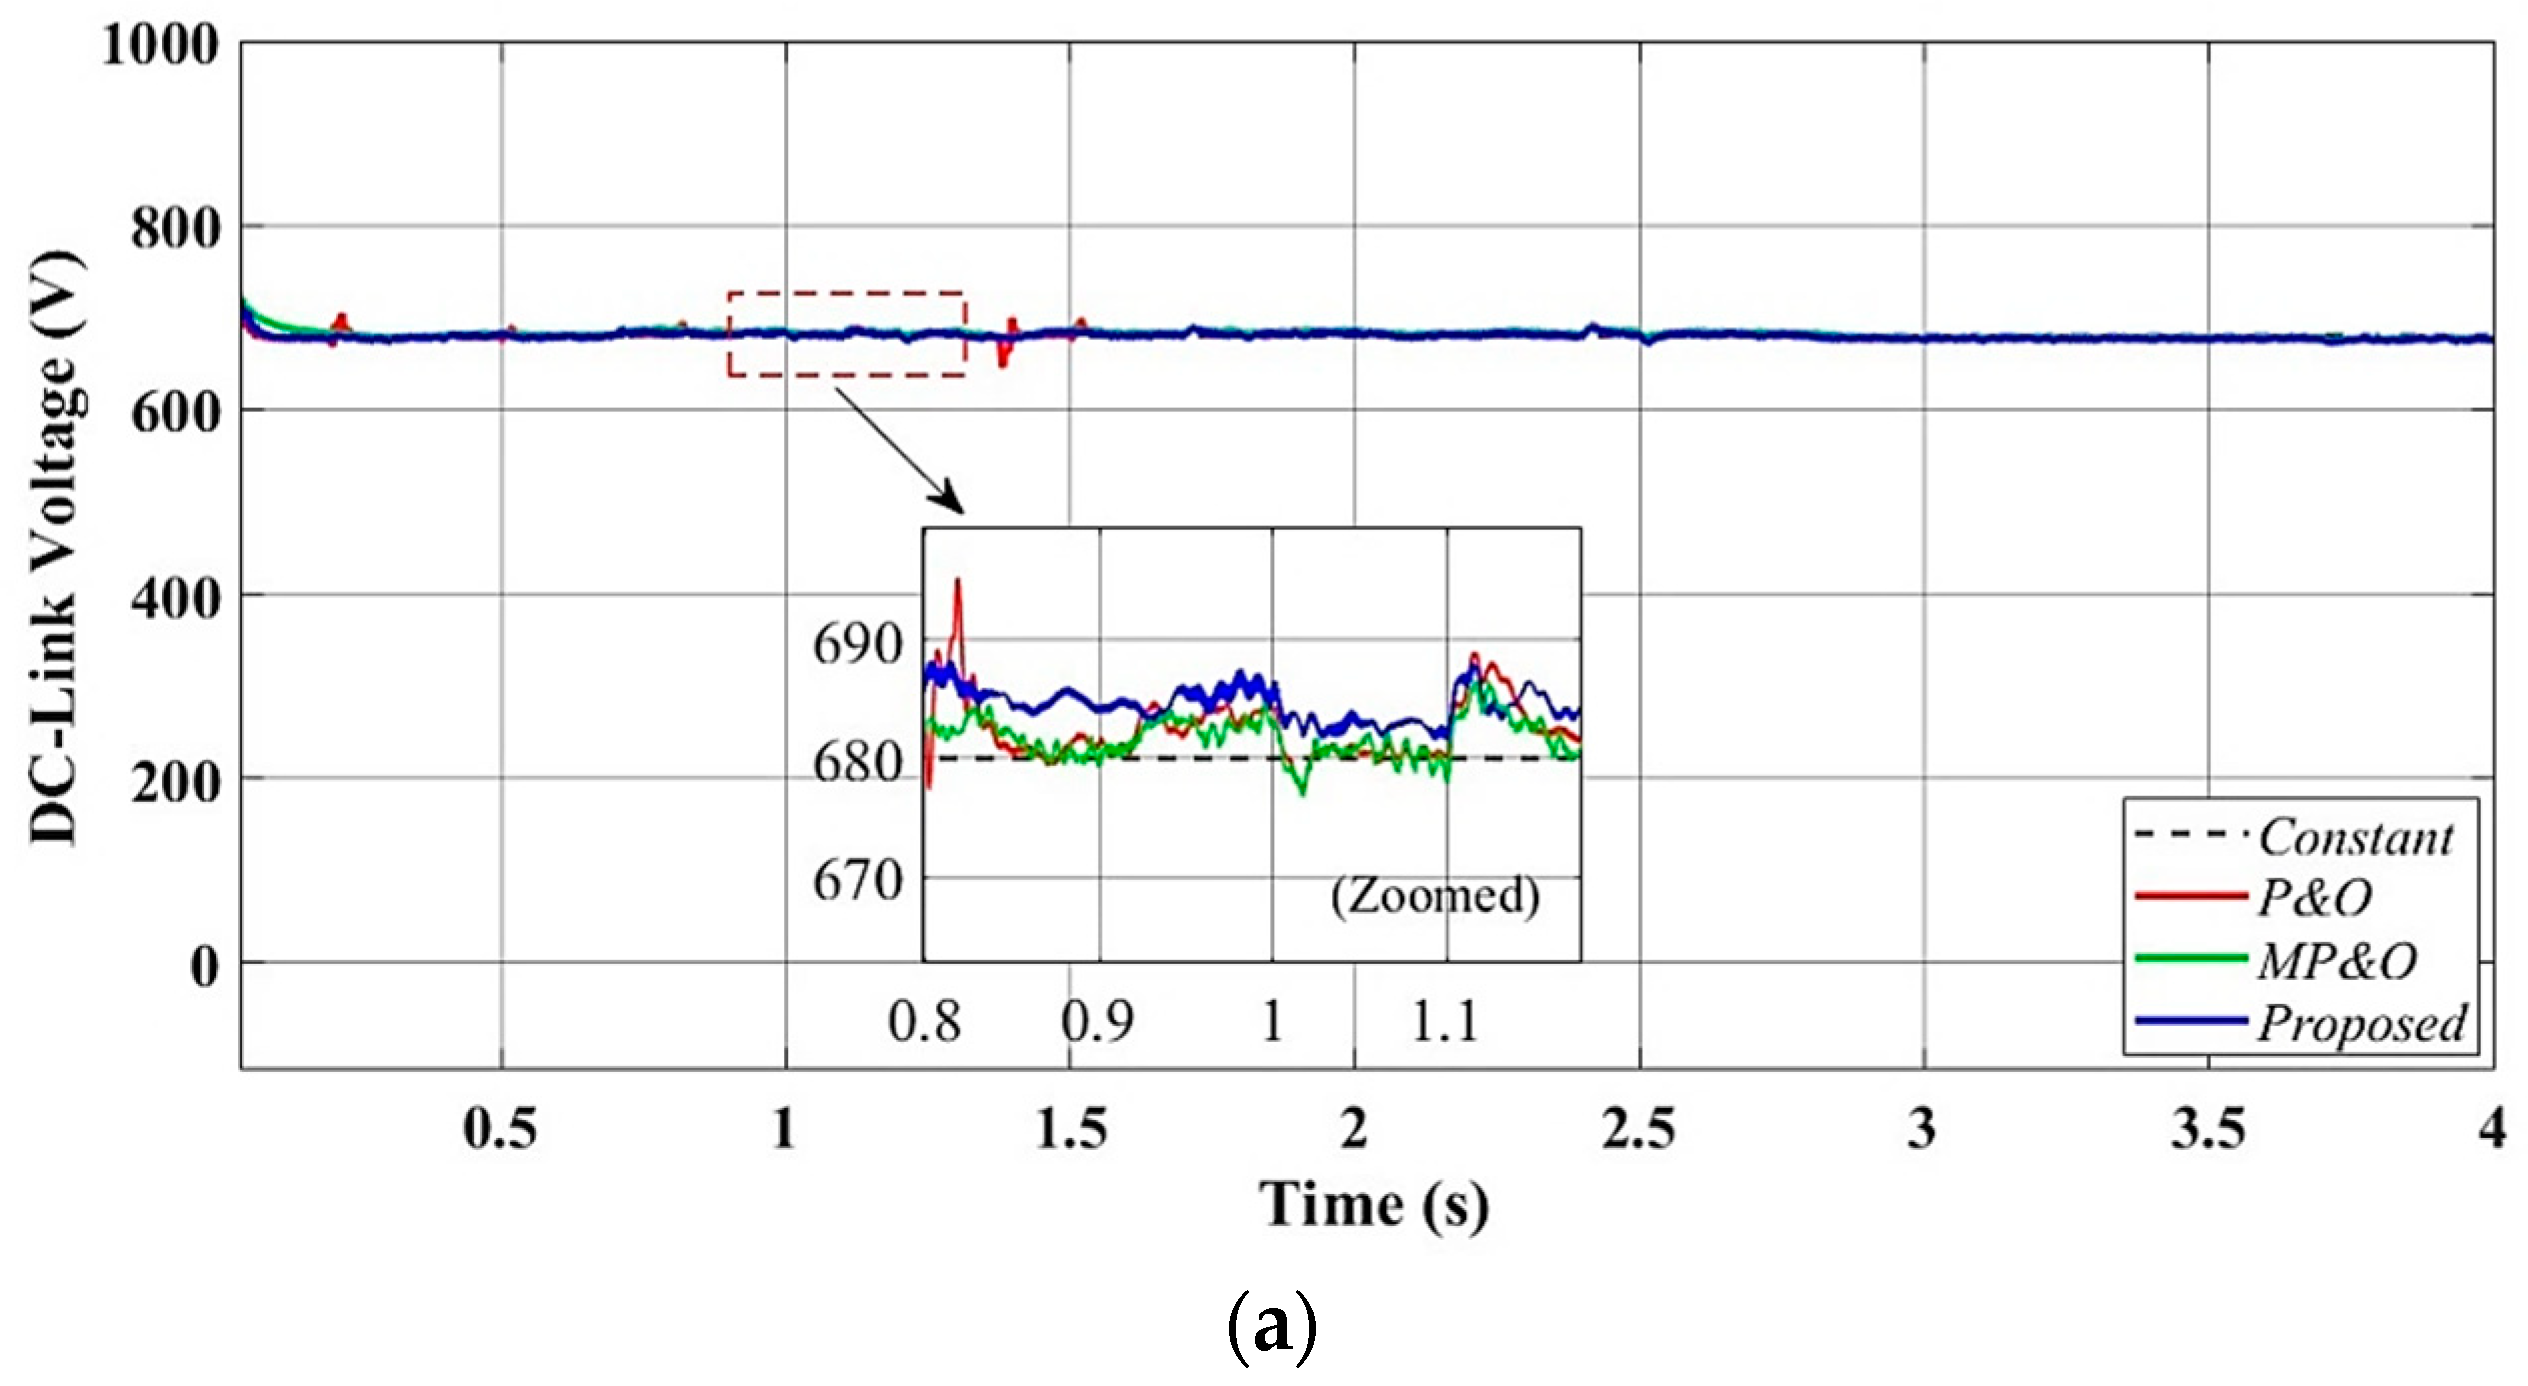
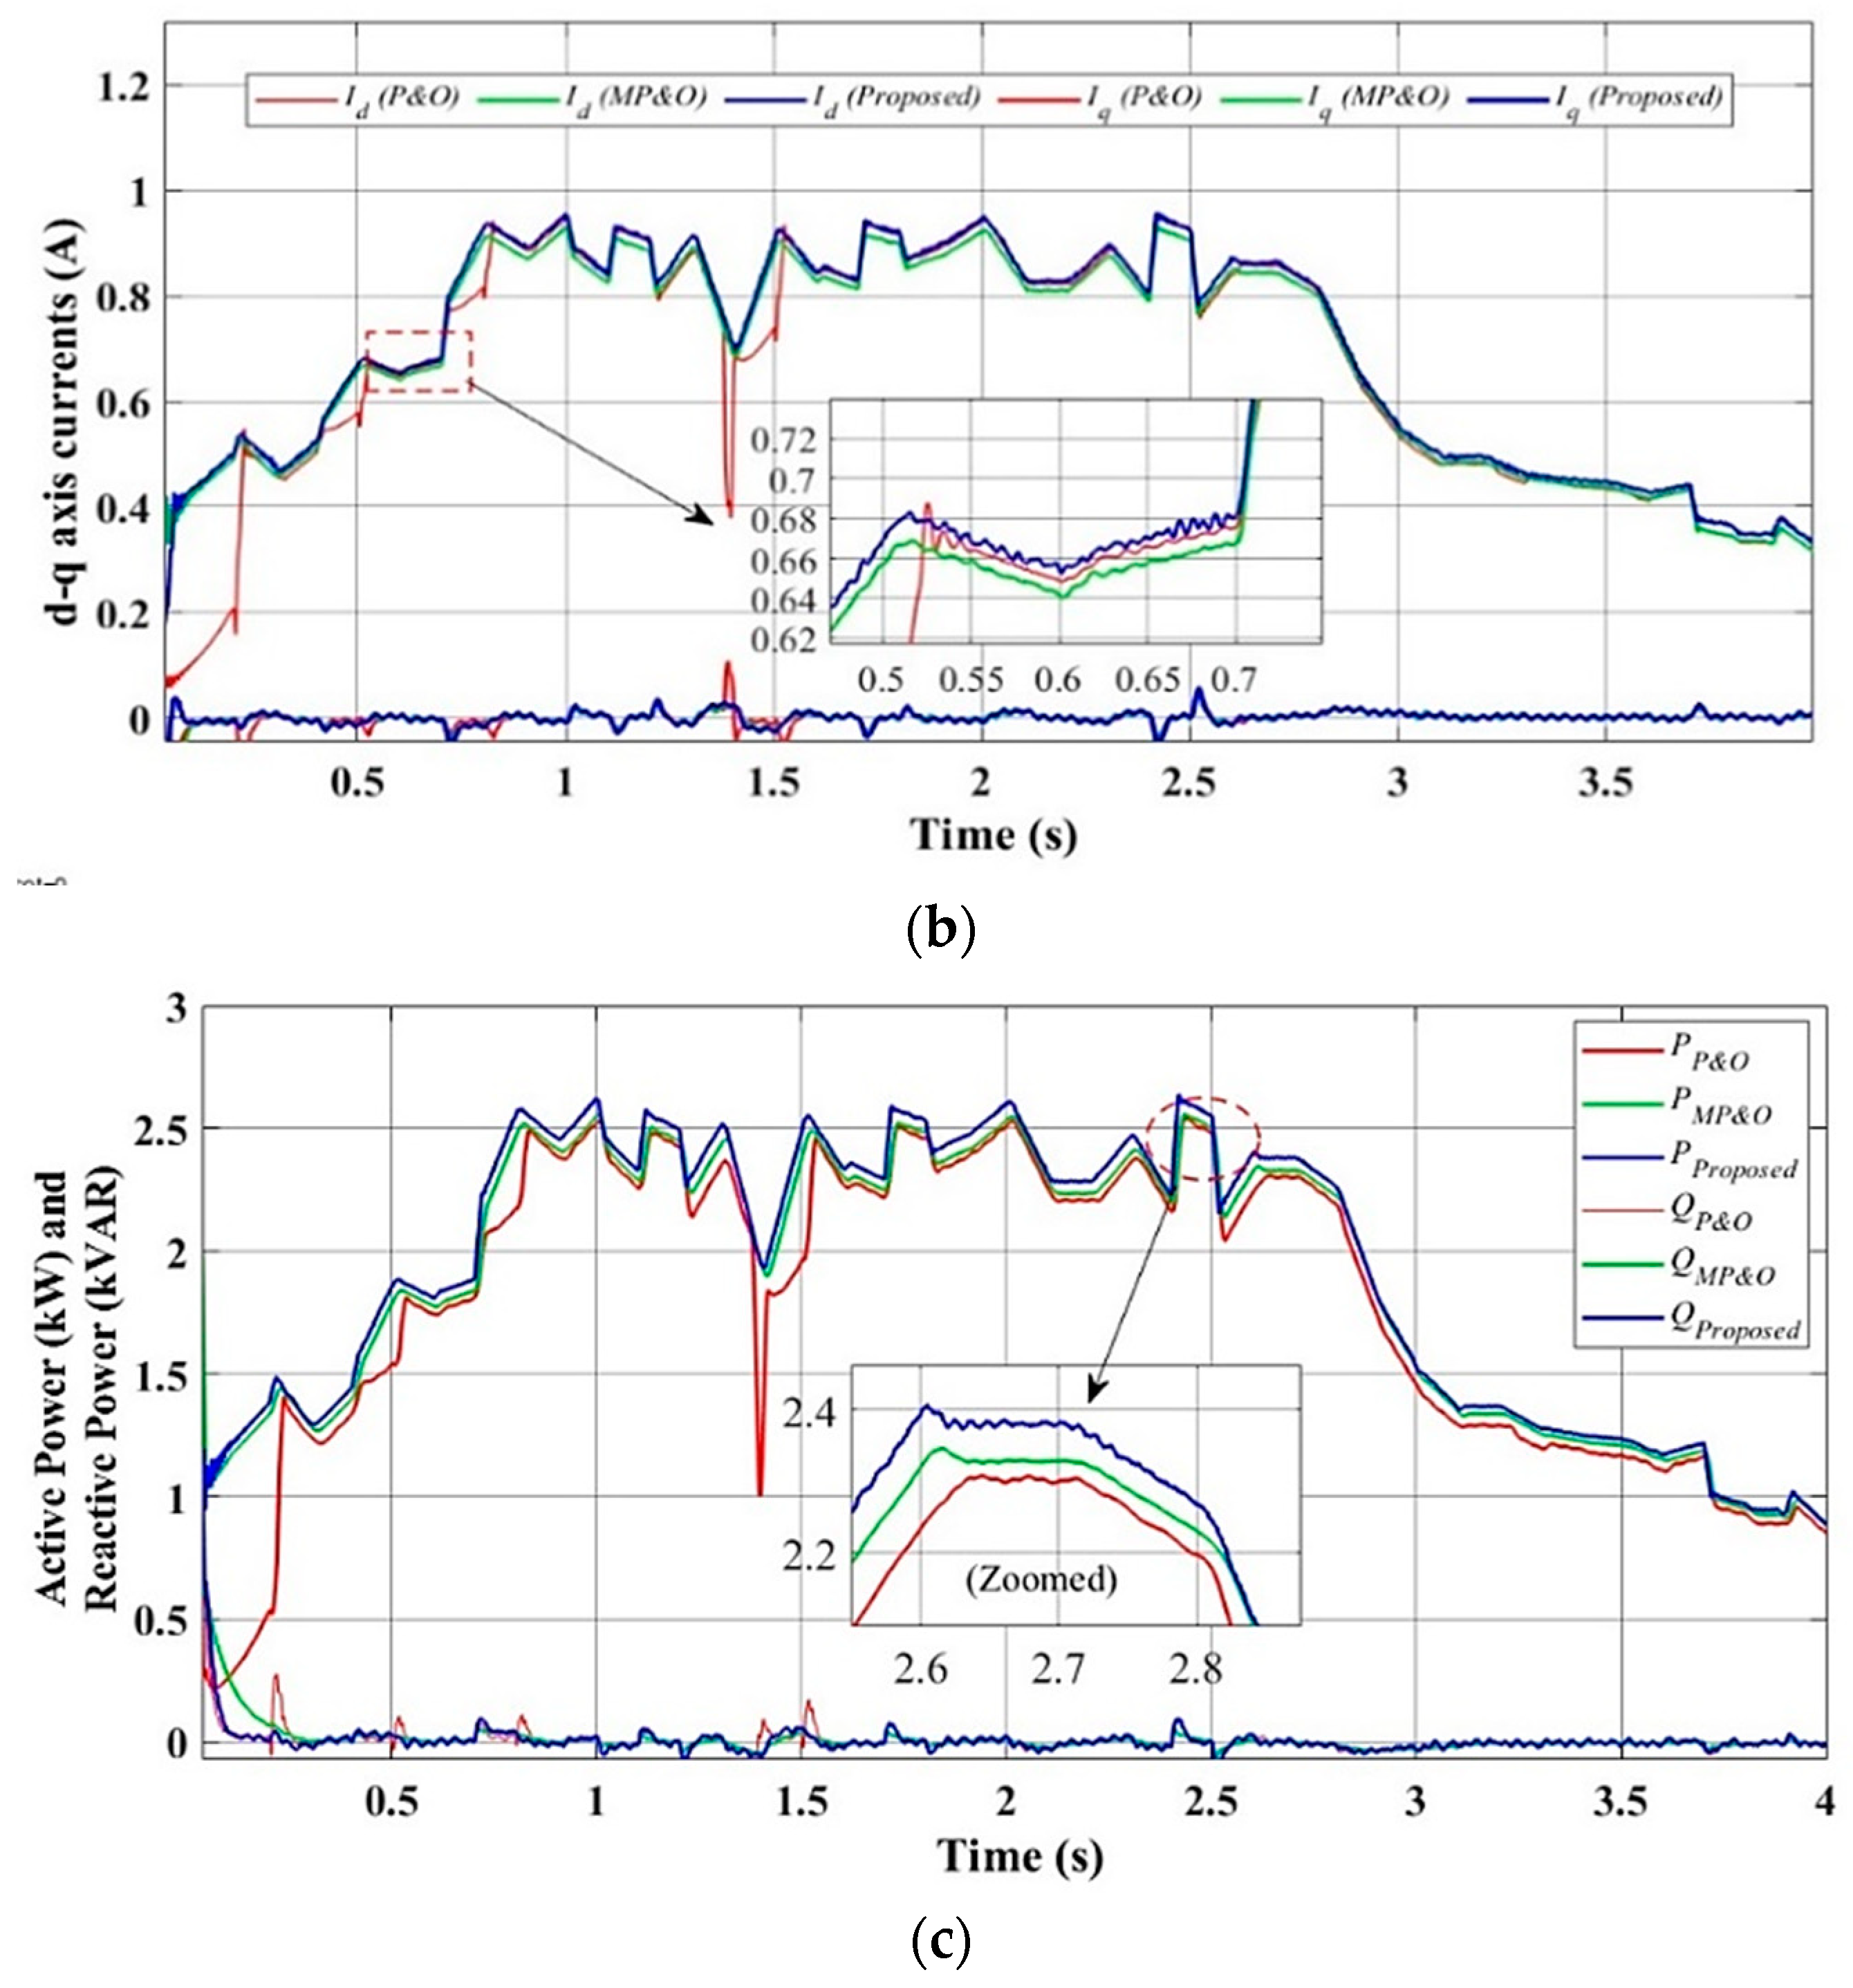
In this section, the performance improvement of the proposed LMPO MPPT technique while subjected to dynamic behavior under varying irradiance is applied to the TW-GIPV system with a fixed ambient temperature (TSTC = 25 °C) condition. The extensive simulation results are verified on the PV side and grid side in Scenario I, as shown in Figure 12 and Figure 13, respectively. The simulated results are validated on the PV side in three stages S11, S12, and S13, respectively. Figure 12a shows that the pattern of irradiance variation with rapid changes in levels for S11 is from 300 W/m2 to 1000 W/m2 from trs11 = 0 s to 1.0 s; S12 is from 1000 W/m2 to 600 W/m2 from trs12 = 1.0 s to 2.5 s, and S13 is reported at level 1000 W/m2 from trs13 = 2.5 s to 4.0 s, respectively. The theoretical values of maximum power obtained for S11, S12, and S13 are 2.56 kW, 1.94 kW, 1.28 kW, and 2.56 kW, respectively. During this scenario, the PV-side simulated results of the proposed technique are compared with the conventional technique. For the tracking response of the proposed technique, traditional PO [9] and MPO [12] algorithms are compared regarding the PV power output, efficiency, voltage, and current, as shown in Figure 12a–d. The proposed MPPT technique, in contrast to the traditional techniques, offers low-power steady-state oscillations and a short settling period. From the validated results of the PV side, it is clear that the proposed control technique gives the smallest oscillation around the MPP with the fast-tracking response, fewer power ripples, and enhanced efficiency, which is better than other conventional MPPT techniques. The output voltage and current are illustrated in Figure 12c,d, respectively. The performance evaluation of the proposed tracking technique, compared with the other two traditional techniques in terms of the voltage ripple, settling time, and tracking efficiency, is presented in Table 4. A comparative specification summary of the proposed and conventional DC-link controller of the GIPV System is shown in Table 5. The comparative analysis of the proposed LMPO MPPT technique offers enhanced operating efficiency (99.68%) and rise time (15 ms) compared with the other traditional techniques. In addition, the proposed technique mitigates the requirement for voltage and current sensors, which increases the system footprint and cost. Furthermore, Figure 13a–e presents the validated results obtained for the GSC under the proposed and conventional control techniques in Scenario I, respectively. The DC link reference voltage is successfully regulated at 680 V, as shown in Figure 13a, with less oscillation and tolerable dynamic stability under sudden step changes in the PV output power, demonstrating the resilience and operational reliability of the developed controller. In addition, the grid current components on the d-axis and q-axis also follow their reference values, as presented in Figure 13b,c. To achieve the unity power factor operation, the q-axis current is regulated to zero (injecting only the true power). In Figure 13d, it is apparent that no reactive power is being added to the grid while the active power varies in response to the PV array’s output, as shown in the zoomed-in view. The three-phase voltage and current on the grid-side converter are shown in Figure 13d,e (illustrated in the zoomed-in views). The overall performance of the controller and the GIPV system parameters are summarized in Table 6.
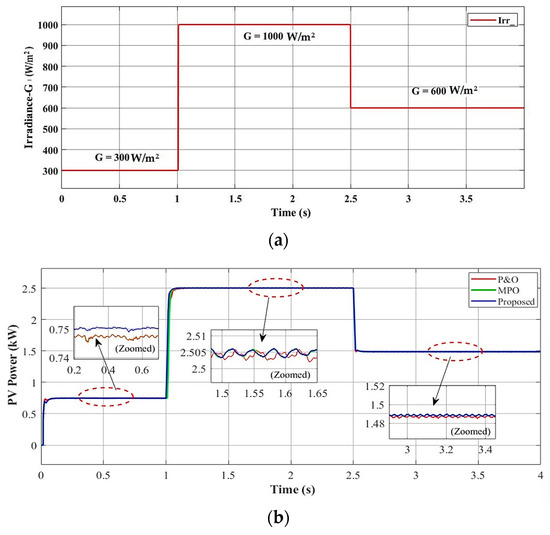
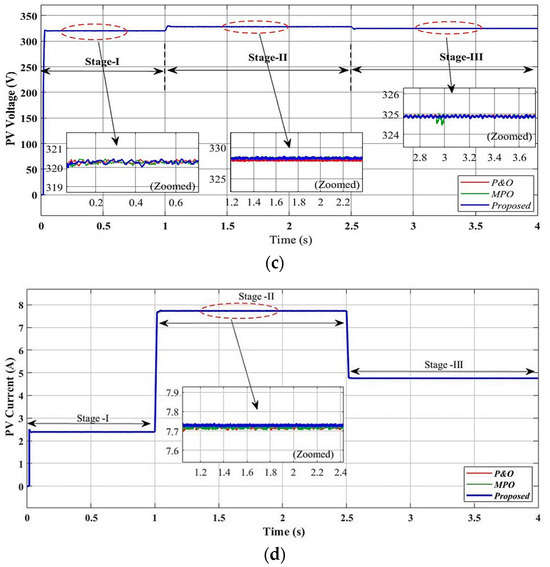
Figure 12.
PV-side simulated results performance of proposed control technique in Scenario I: (a) varying irradiance at a fixed temperature, (b) PV output power, (c) PV output voltage, and (d) PV output current, .
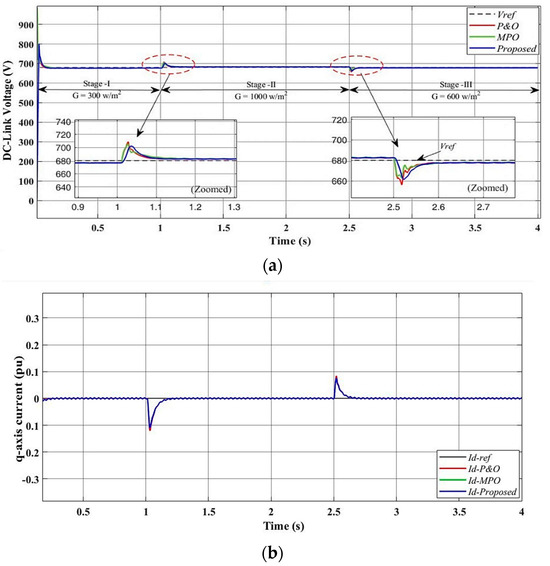
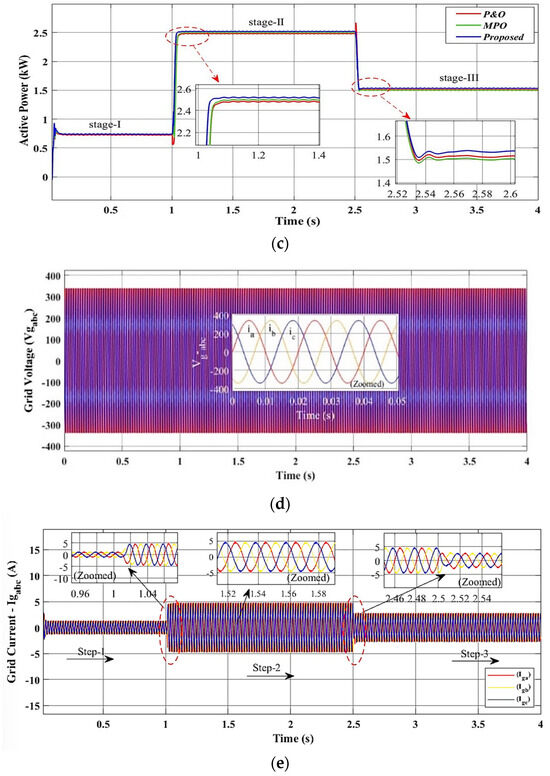
Figure 13.
Grid-side simulated results performance analysis of proposed control technique in Scenario I: (a) DC link voltage, (b) q-axis current, (c) output active power, (kW), (d) three-phase grid voltage, and (e) I three-phase grid current ().
Table 4.
Performance matrices of tracking responses, efficiency, error%, and THD% of GIPV system in different scenarios.
Table 5.
Comparative summary between proposed and conventional DC-link controller of GIPV System.
Table 6.
Overall performance summary of controller and TS-GIPV system.
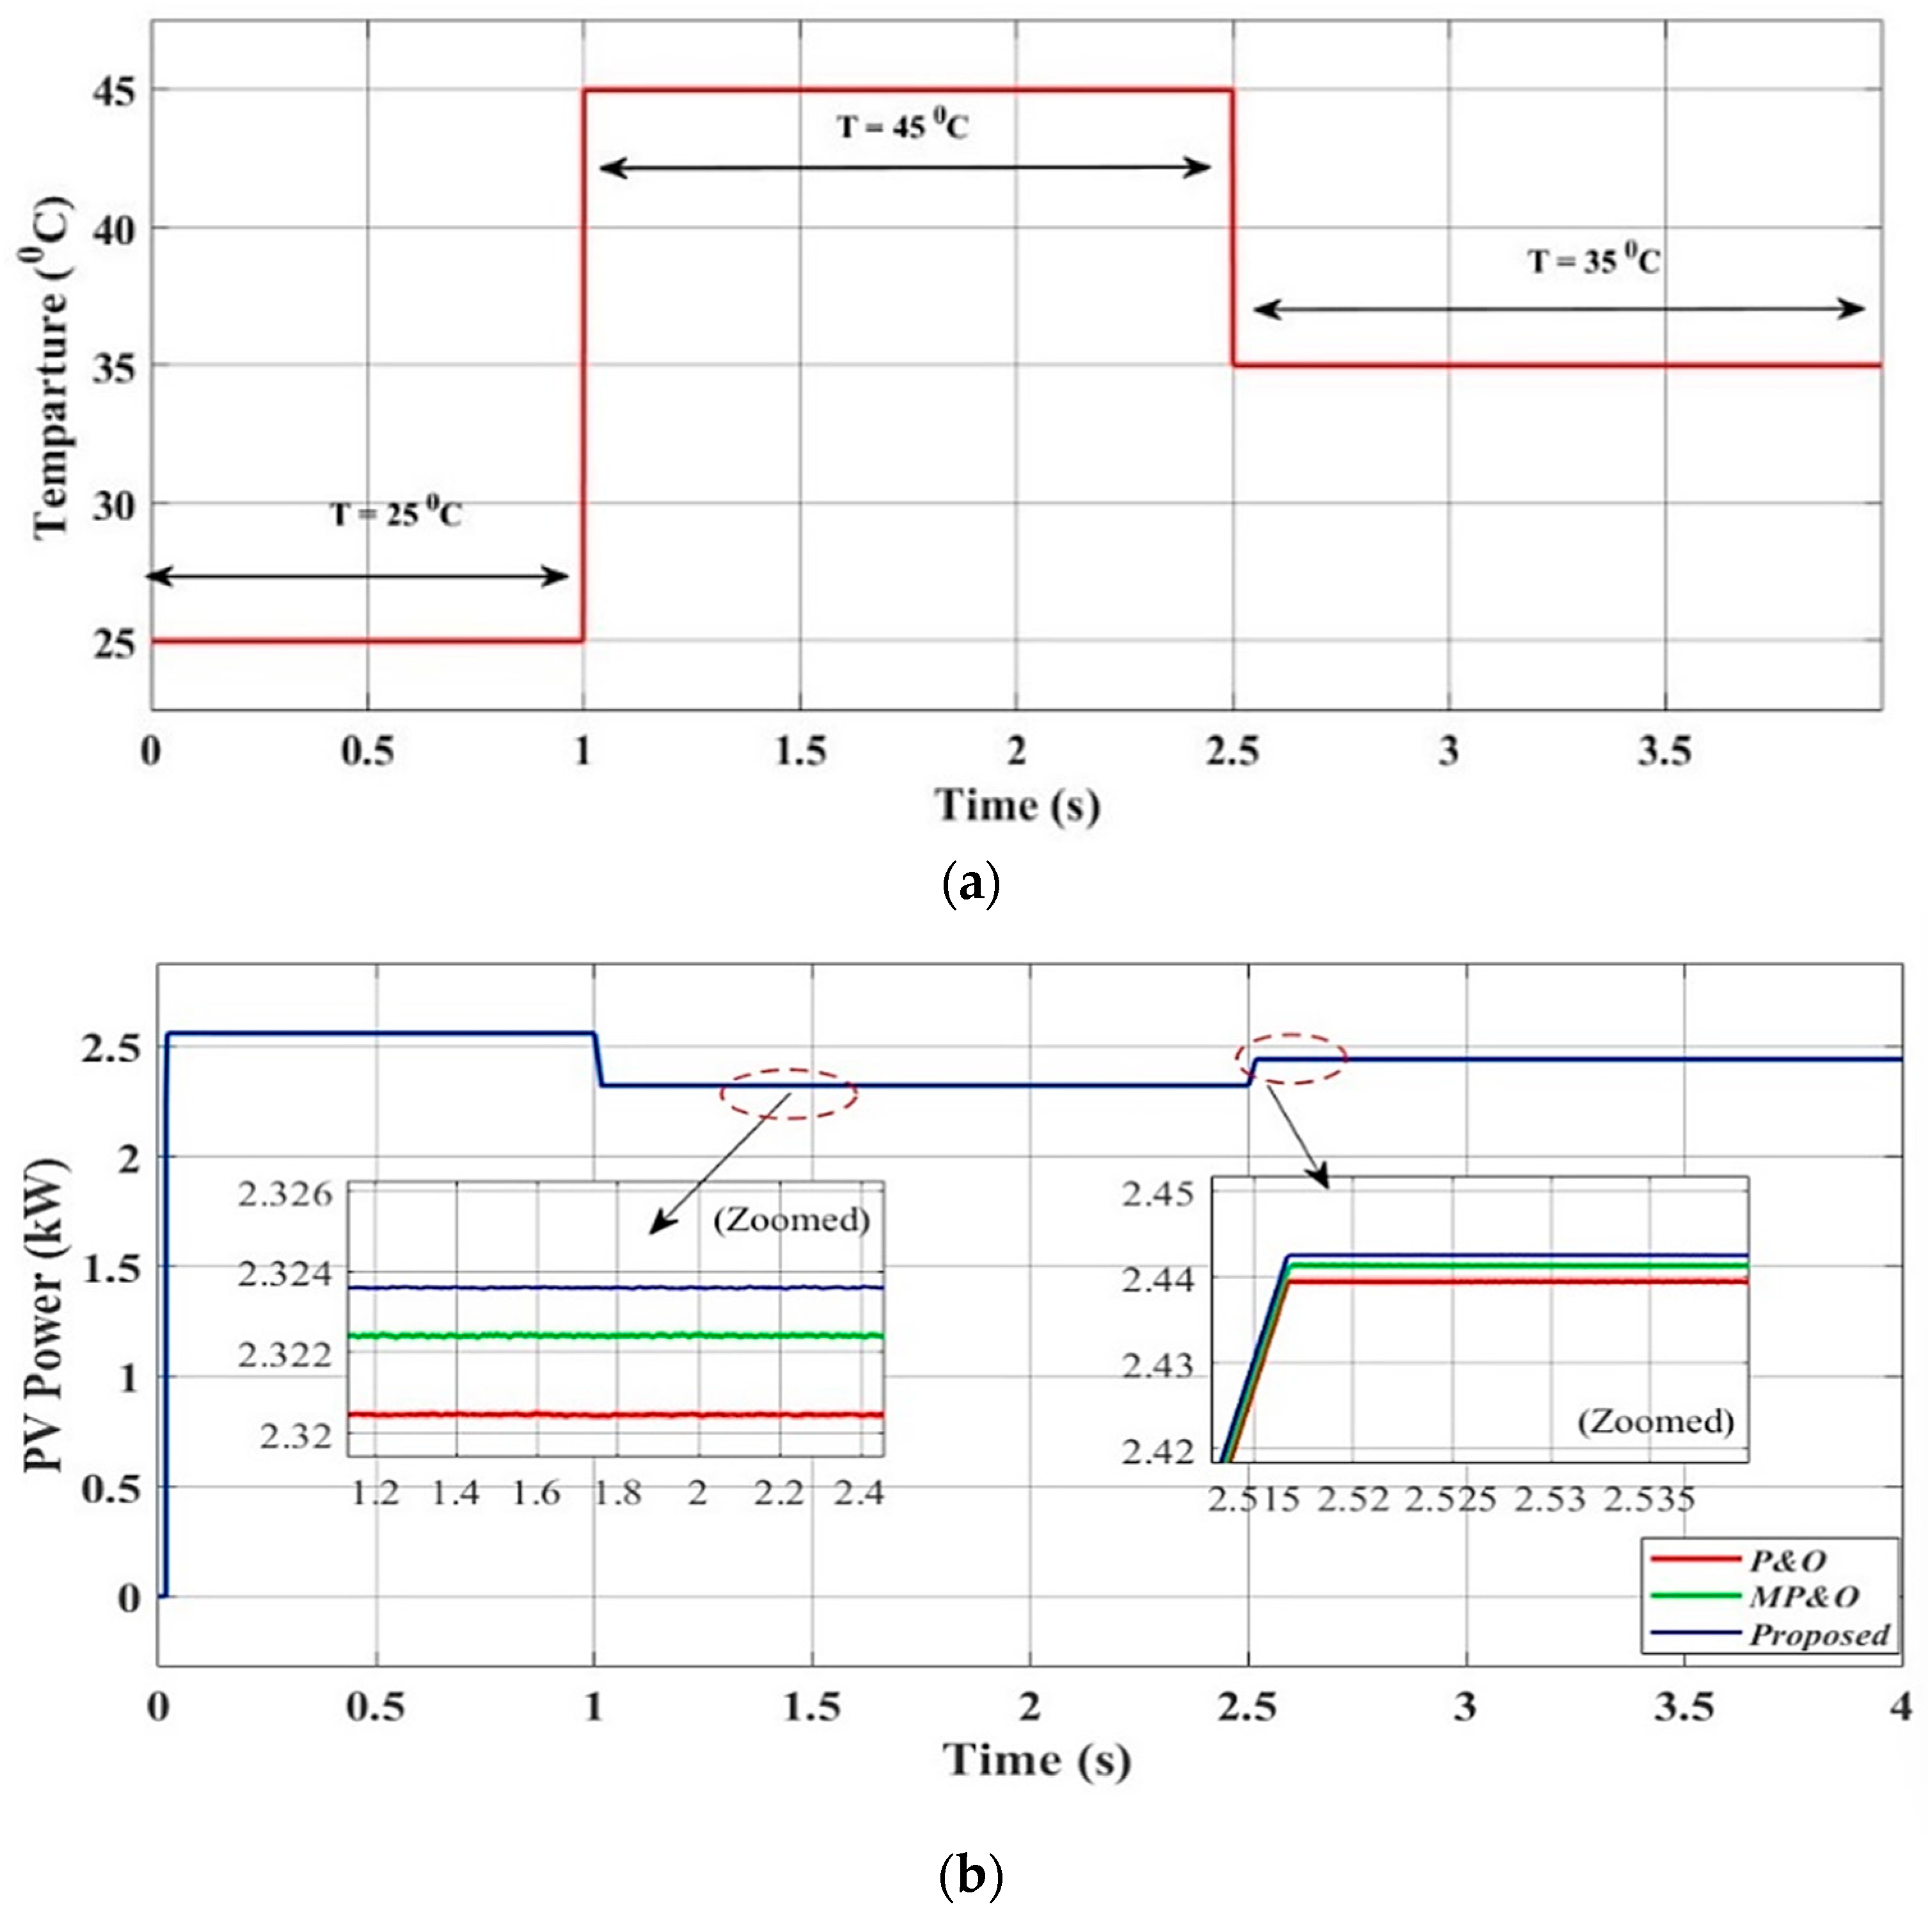
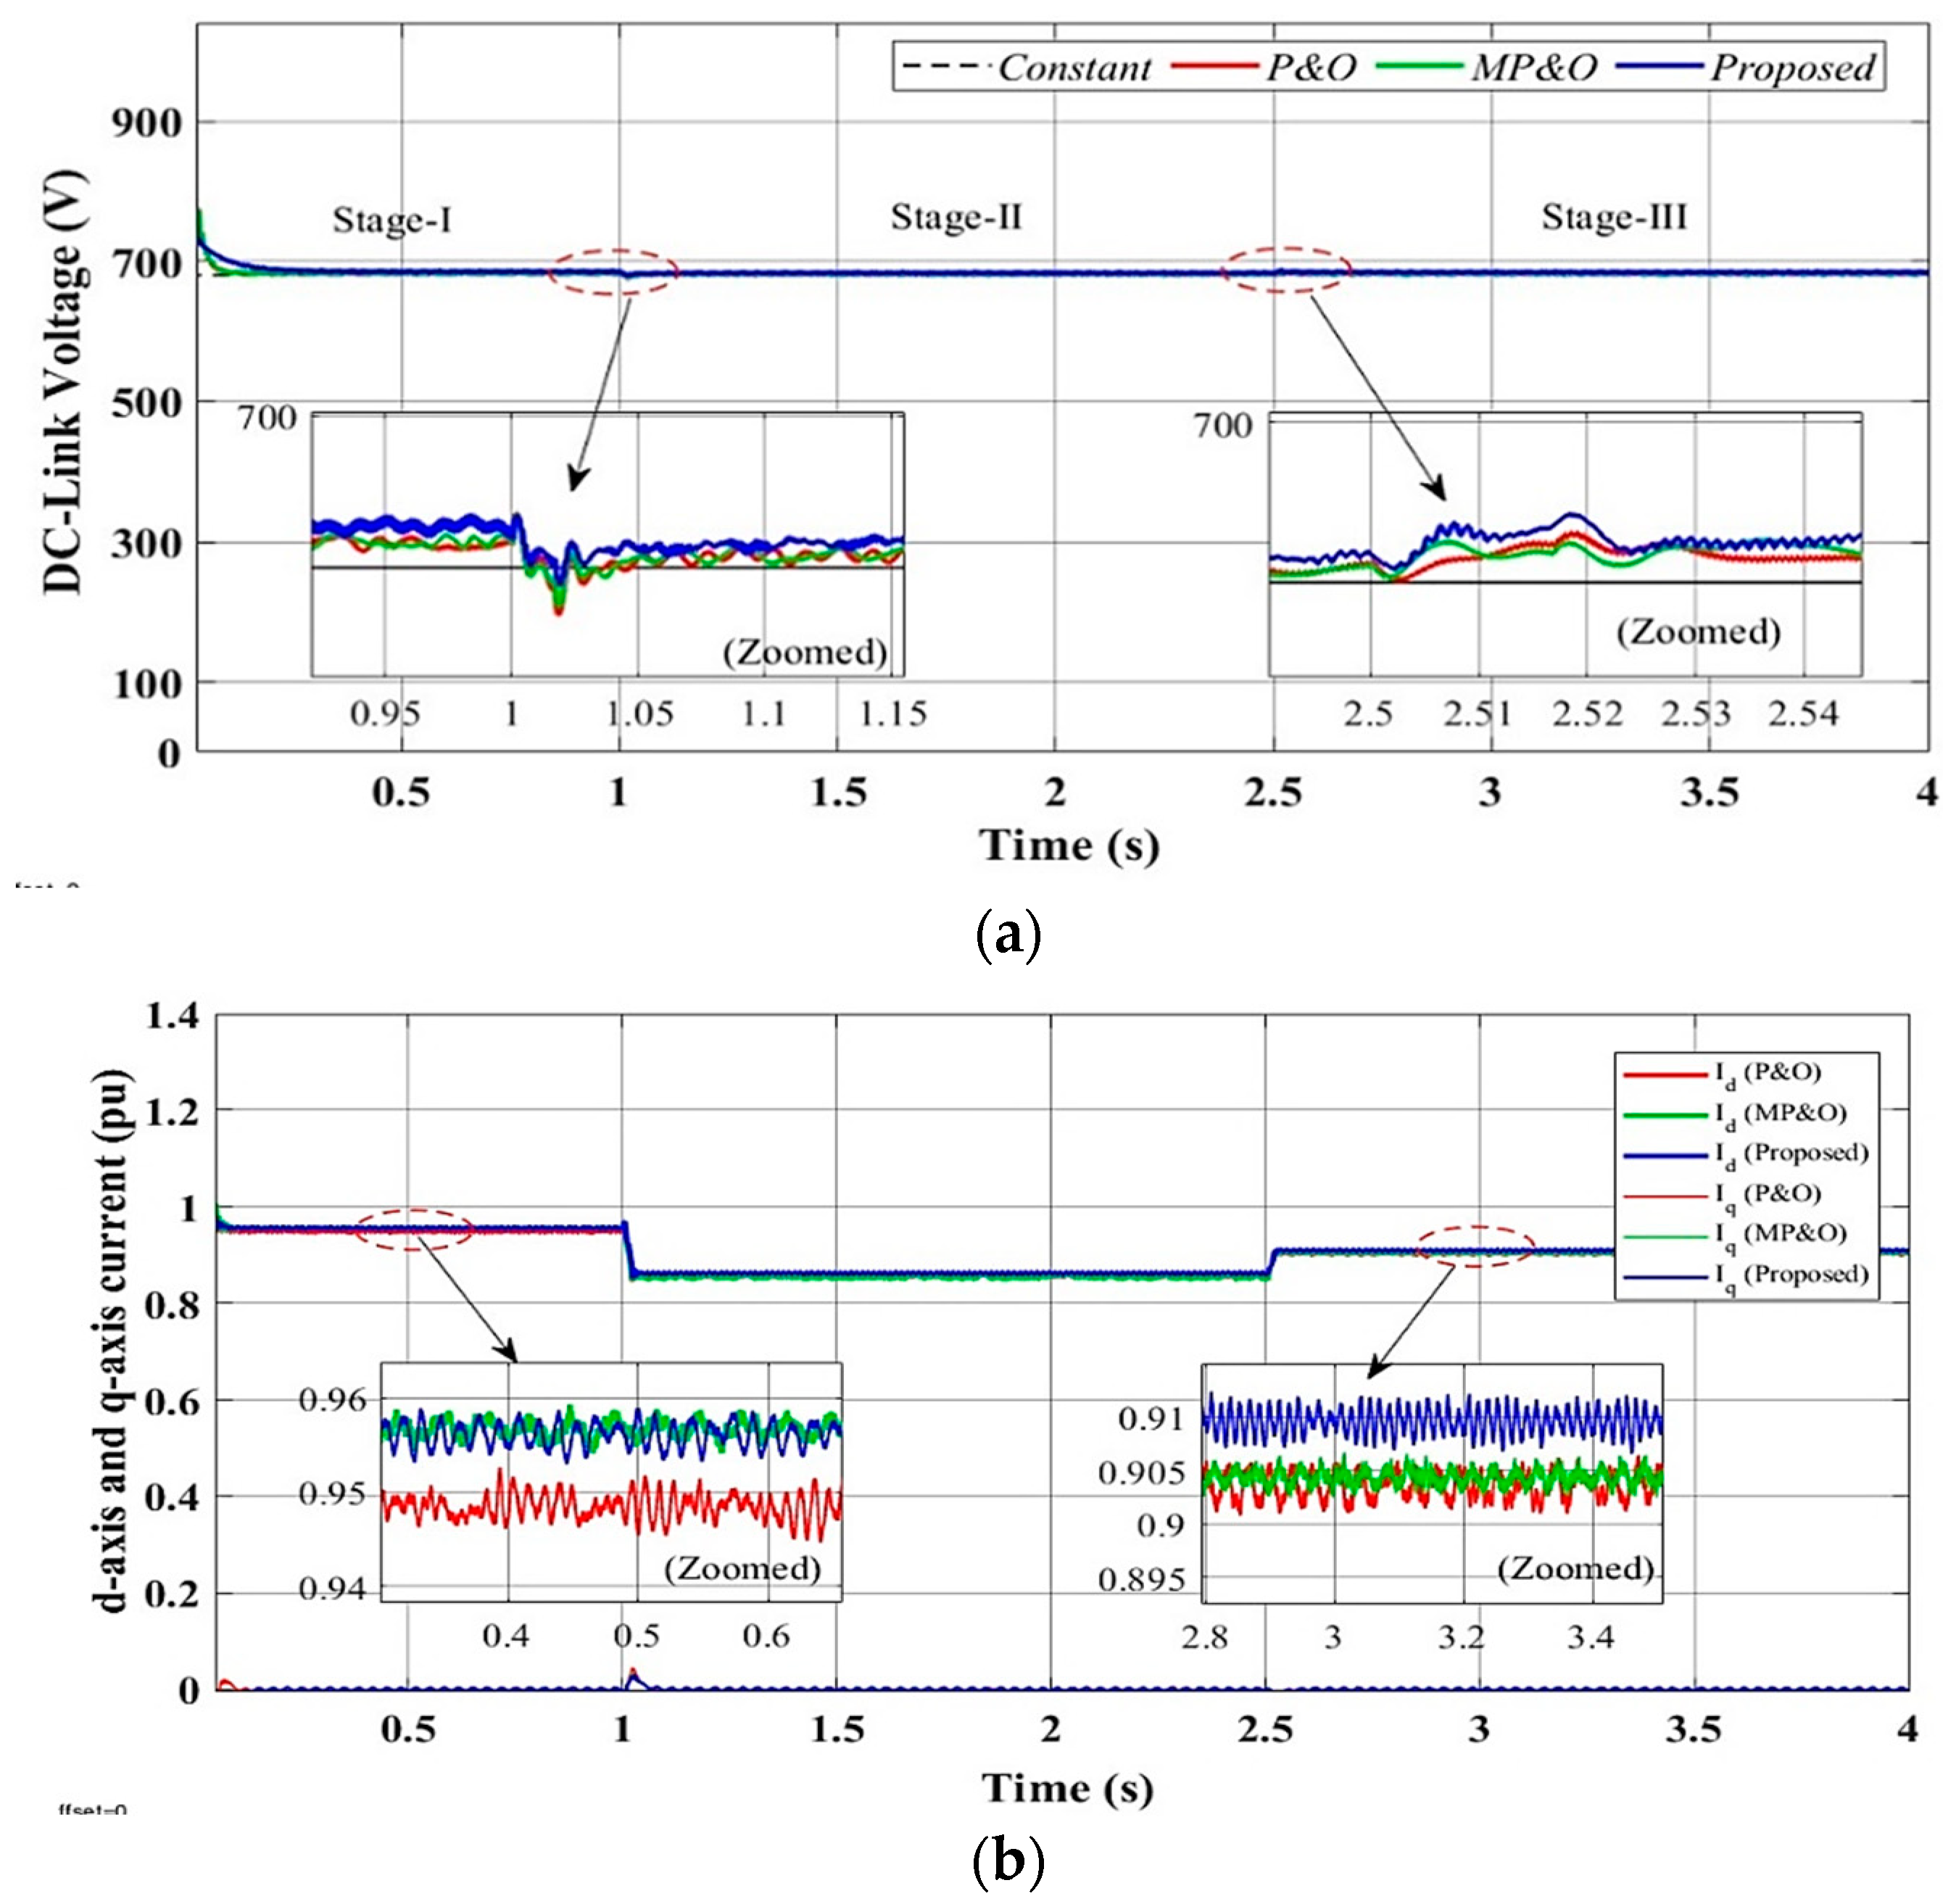
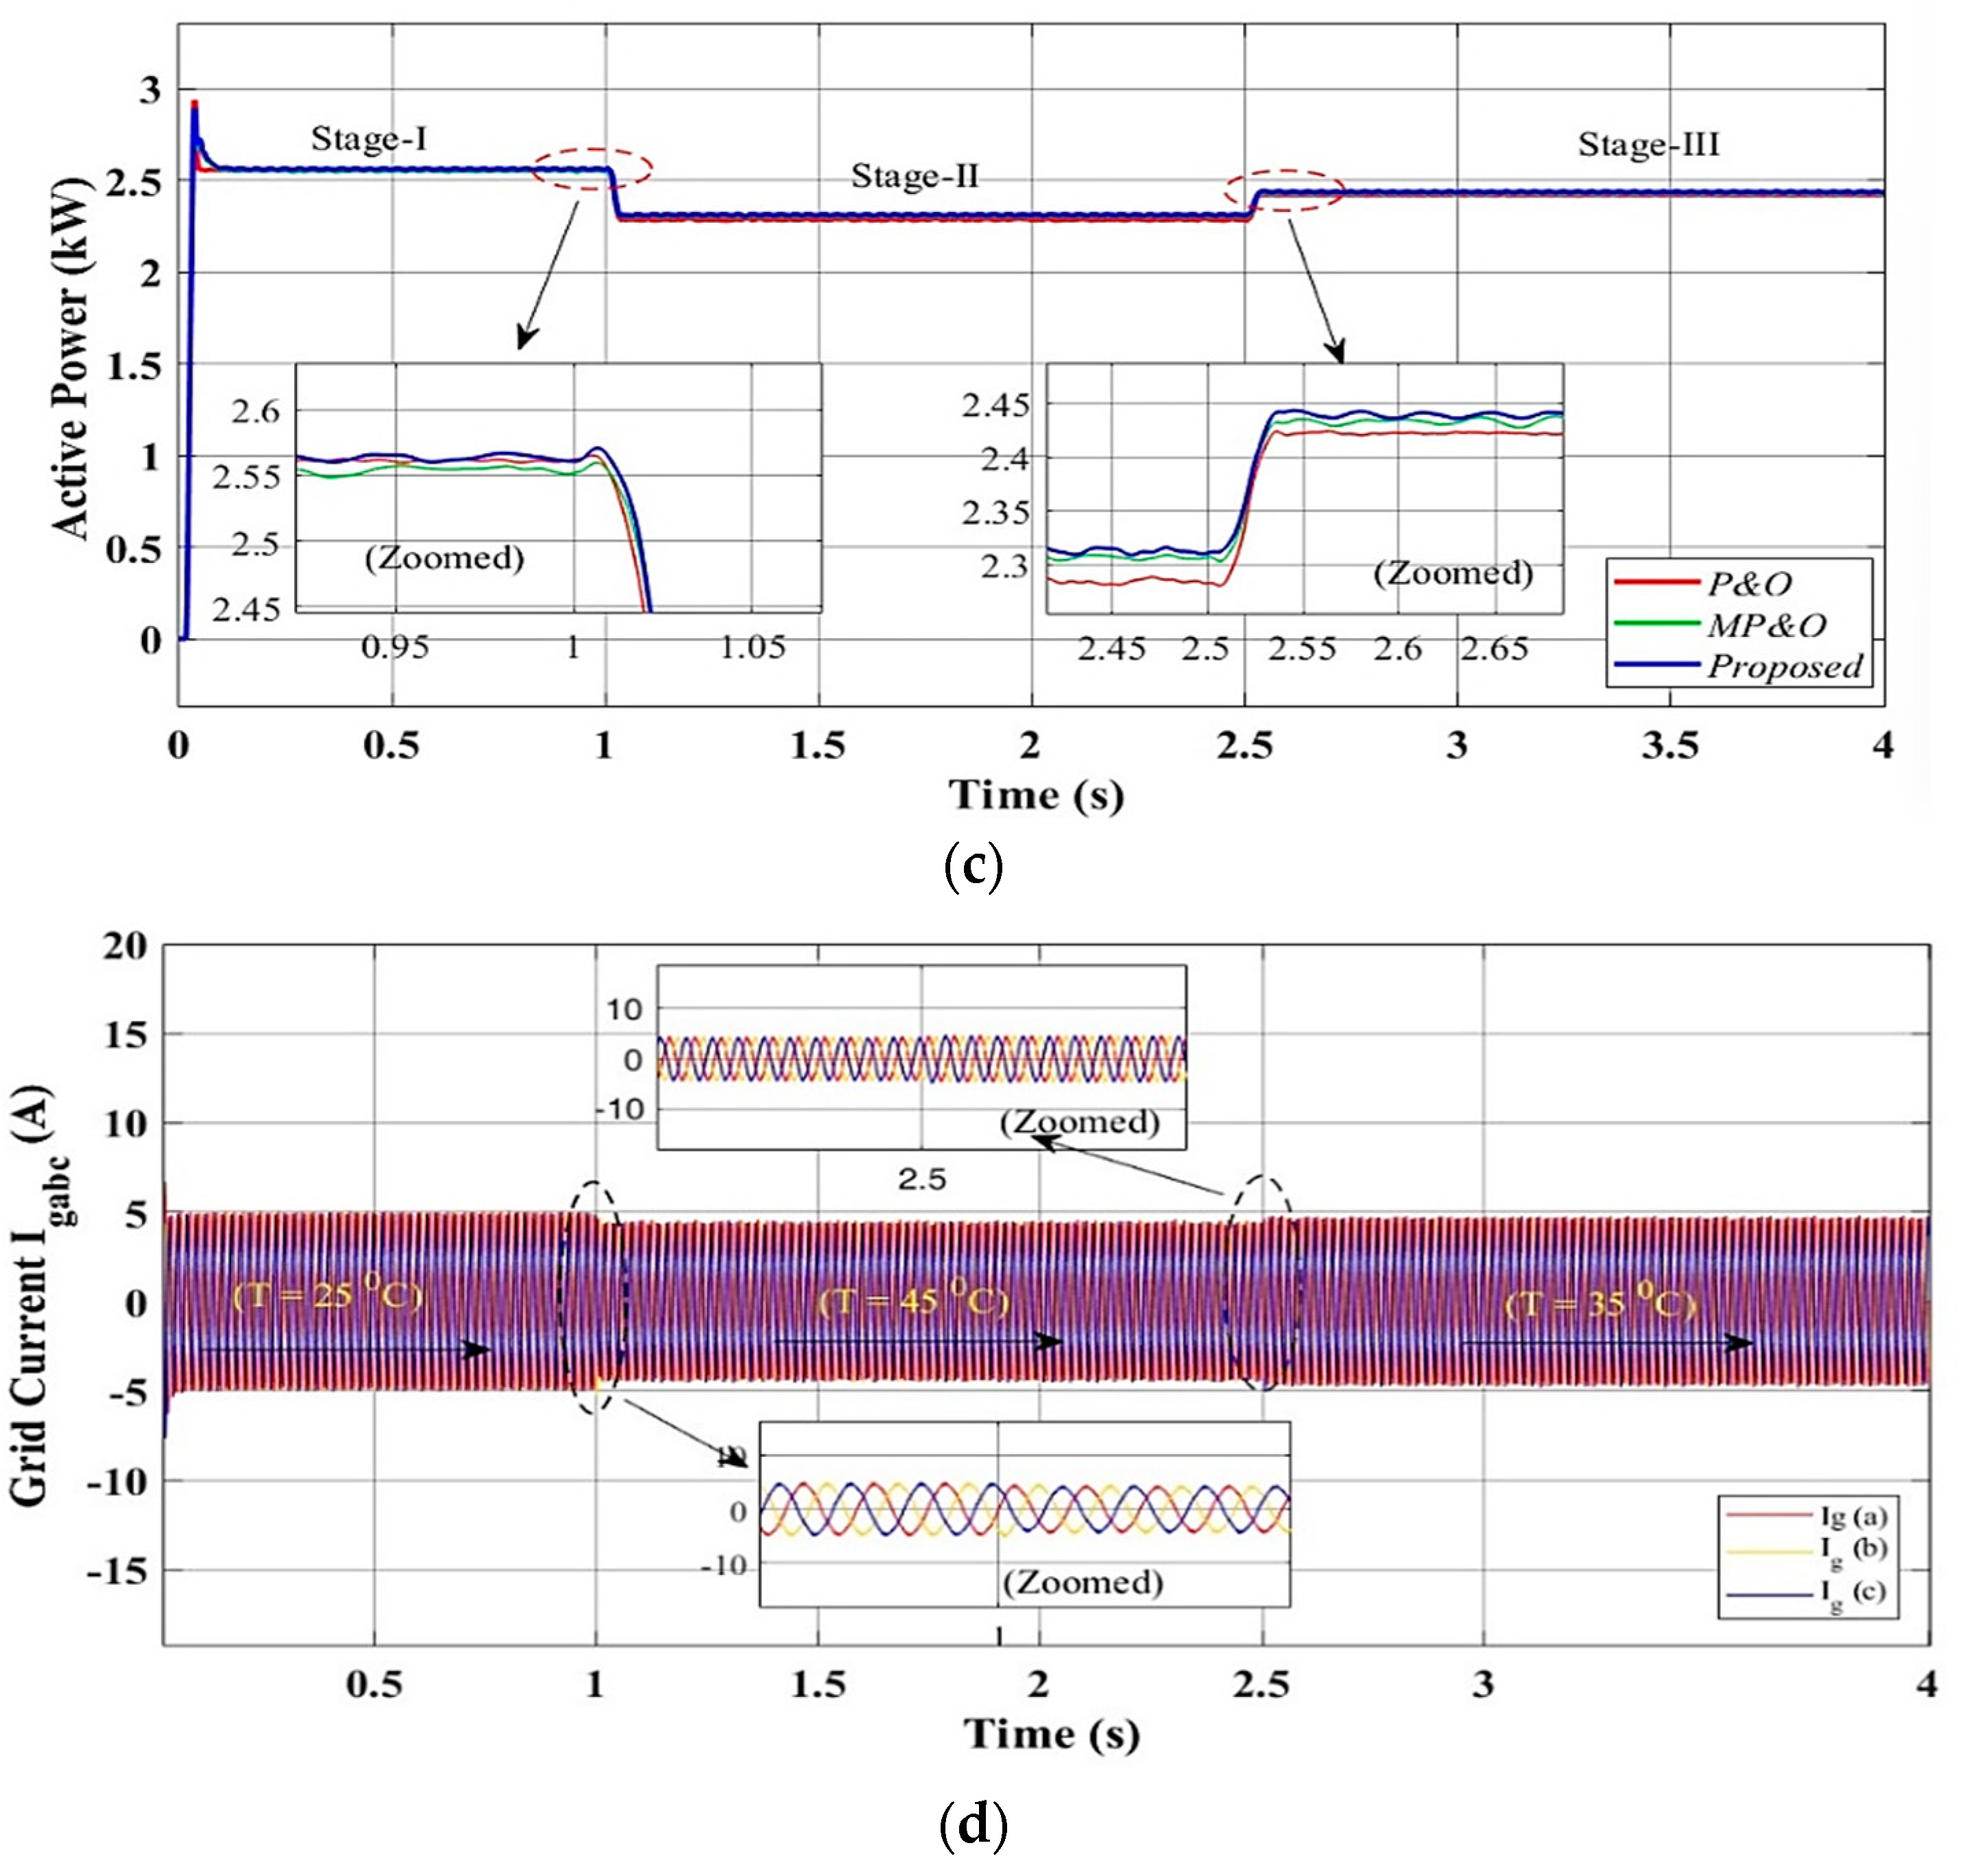
4.2. Scenario II: Performance of Proposed Control System Under Varying Temperature at Fixed Irradiance
The sudden changing temperature and fixed irradiance (GSTC = 1000 W/m2) condition is applied to the same system. The extensive simulation results are validated on the PV side and grid-side converter (GSC), as shown in Figure 14 and Figure 15, respectively. Figure 14a shows the pattern of temperature variation with sudden changes in levels for S21 from 25 °C to 45 °C from trs11 = 0 s to 1.0 s; S22 from 45 °C to 35 °C from trs22 = 1.0 s to 2.5 s, and S23 reported at a level of 35 °C from trs23 = 2.5 s to 4.0 s, respectively. The irradiance slope shows step signals, which do not always accurately reflect the actual environmental circumstances, despite the dynamic characteristics of the sudden step-changing temperature profile. The system’s output power shows that the step size offered by the proposed method does not significantly increase the system’s ability to track time. Nevertheless, the proposed algorithm is capable of reducing the ripple generation power during steady-state conditions. The improvement in the extracted PV output power using the proposed MPPT technique compared to the other two traditional techniques is shown in Figure 14b. The proposed MPPT technique, in contrast to the traditional techniques, offers low-power steady-state oscillations and a short settling period. The power oscillations are almost similar to those of the traditional MPO [5] strategy and the settling time is comparable to the traditional P&O technique. Therefore, the proposed approach combines the benefits of both the P&O [3] and MPO traditional tracking algorithms. The PV-side results are validated and the proposed MPPT technique provides the fewest steady-state oscillations around MPP with a fast-tracking response, less power ripples, and an effectively improved efficiency, which is better than conventional MPPT techniques. The output voltage and current are illustrated in Figure 13c and Figure 14d, respectively. A performance evaluation of the proposed tracking technique compared with the other two traditional techniques in terms of the voltage ripple, settling time, and tracking efficiency is shown in Table 4. Furthermore, Figure 15a–d represents the performance analysis of the grid-side validated results obtained for the proposed and conventional control techniques at varying temperatures and a fixed irradiance (GSTC = 1000 W/m2), respectively. The DC link reference voltage is successfully regulated at as shown in Figure 15a, with less oscillation and tolerable dynamic stability under sudden step changes in the PV output power, demonstrating the resilience and operational reliability of the developed controller. In addition, the grid current components on the d-axis and q-axis also follow their reference values, as presented in Figure 15b. To achieve the unity power factor operation, the q-axis current is regulated to zero (injecting only the true power). In Figure 15c, it is apparent that no reactive power is being added to the grid while the active power varies in response to the PV array’s output, as shown in the zoomed-in view. The three-phase current on the grid-side converter is shown in Figure 15d (illustrated in the zoomed-in view). The overall performance of the controller and GIPV system parameters are summarized in Table 6.
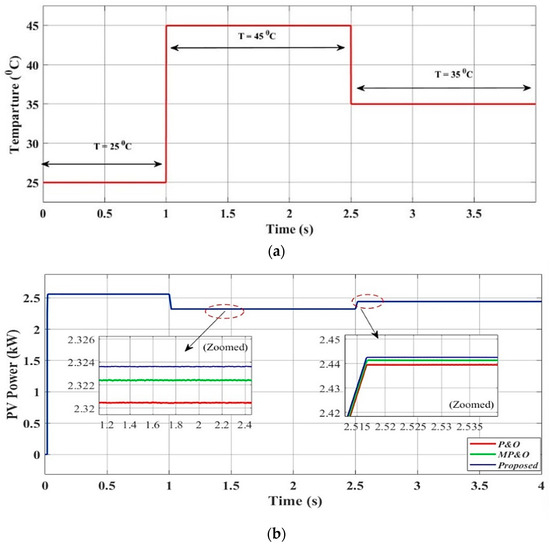
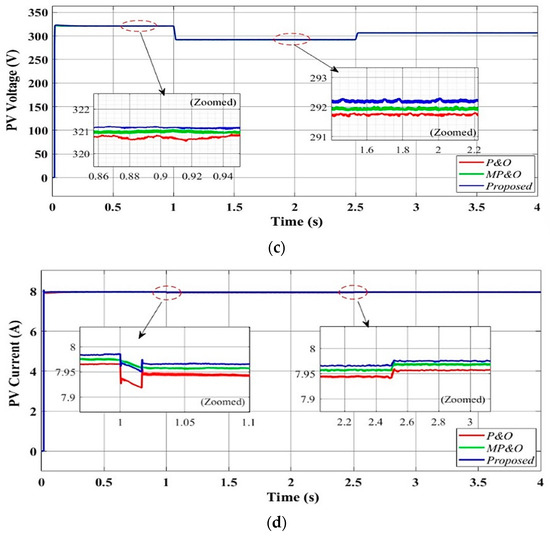
Figure 14.
PV-side simulated results performance of proposed control technique in Scenario II: (a) varying temperature at fixed irradiance, (b) PV output power, (c) PV output voltage, and (d) PV output current, .
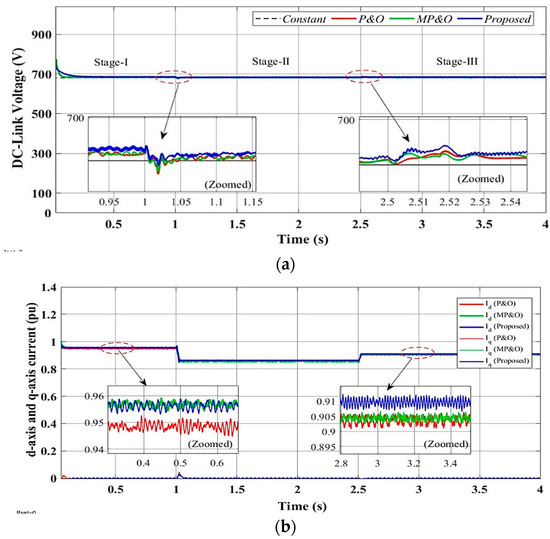
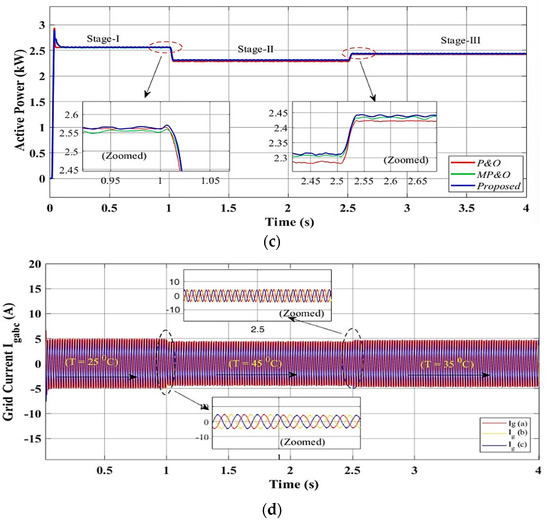
Figure 15.
Grid-side simulated results performance analysis of proposed control technique in Scenario II: (a) DC link voltage, (b) d-q-axis current, (c) Active power, and (d) three-phase grid current ().
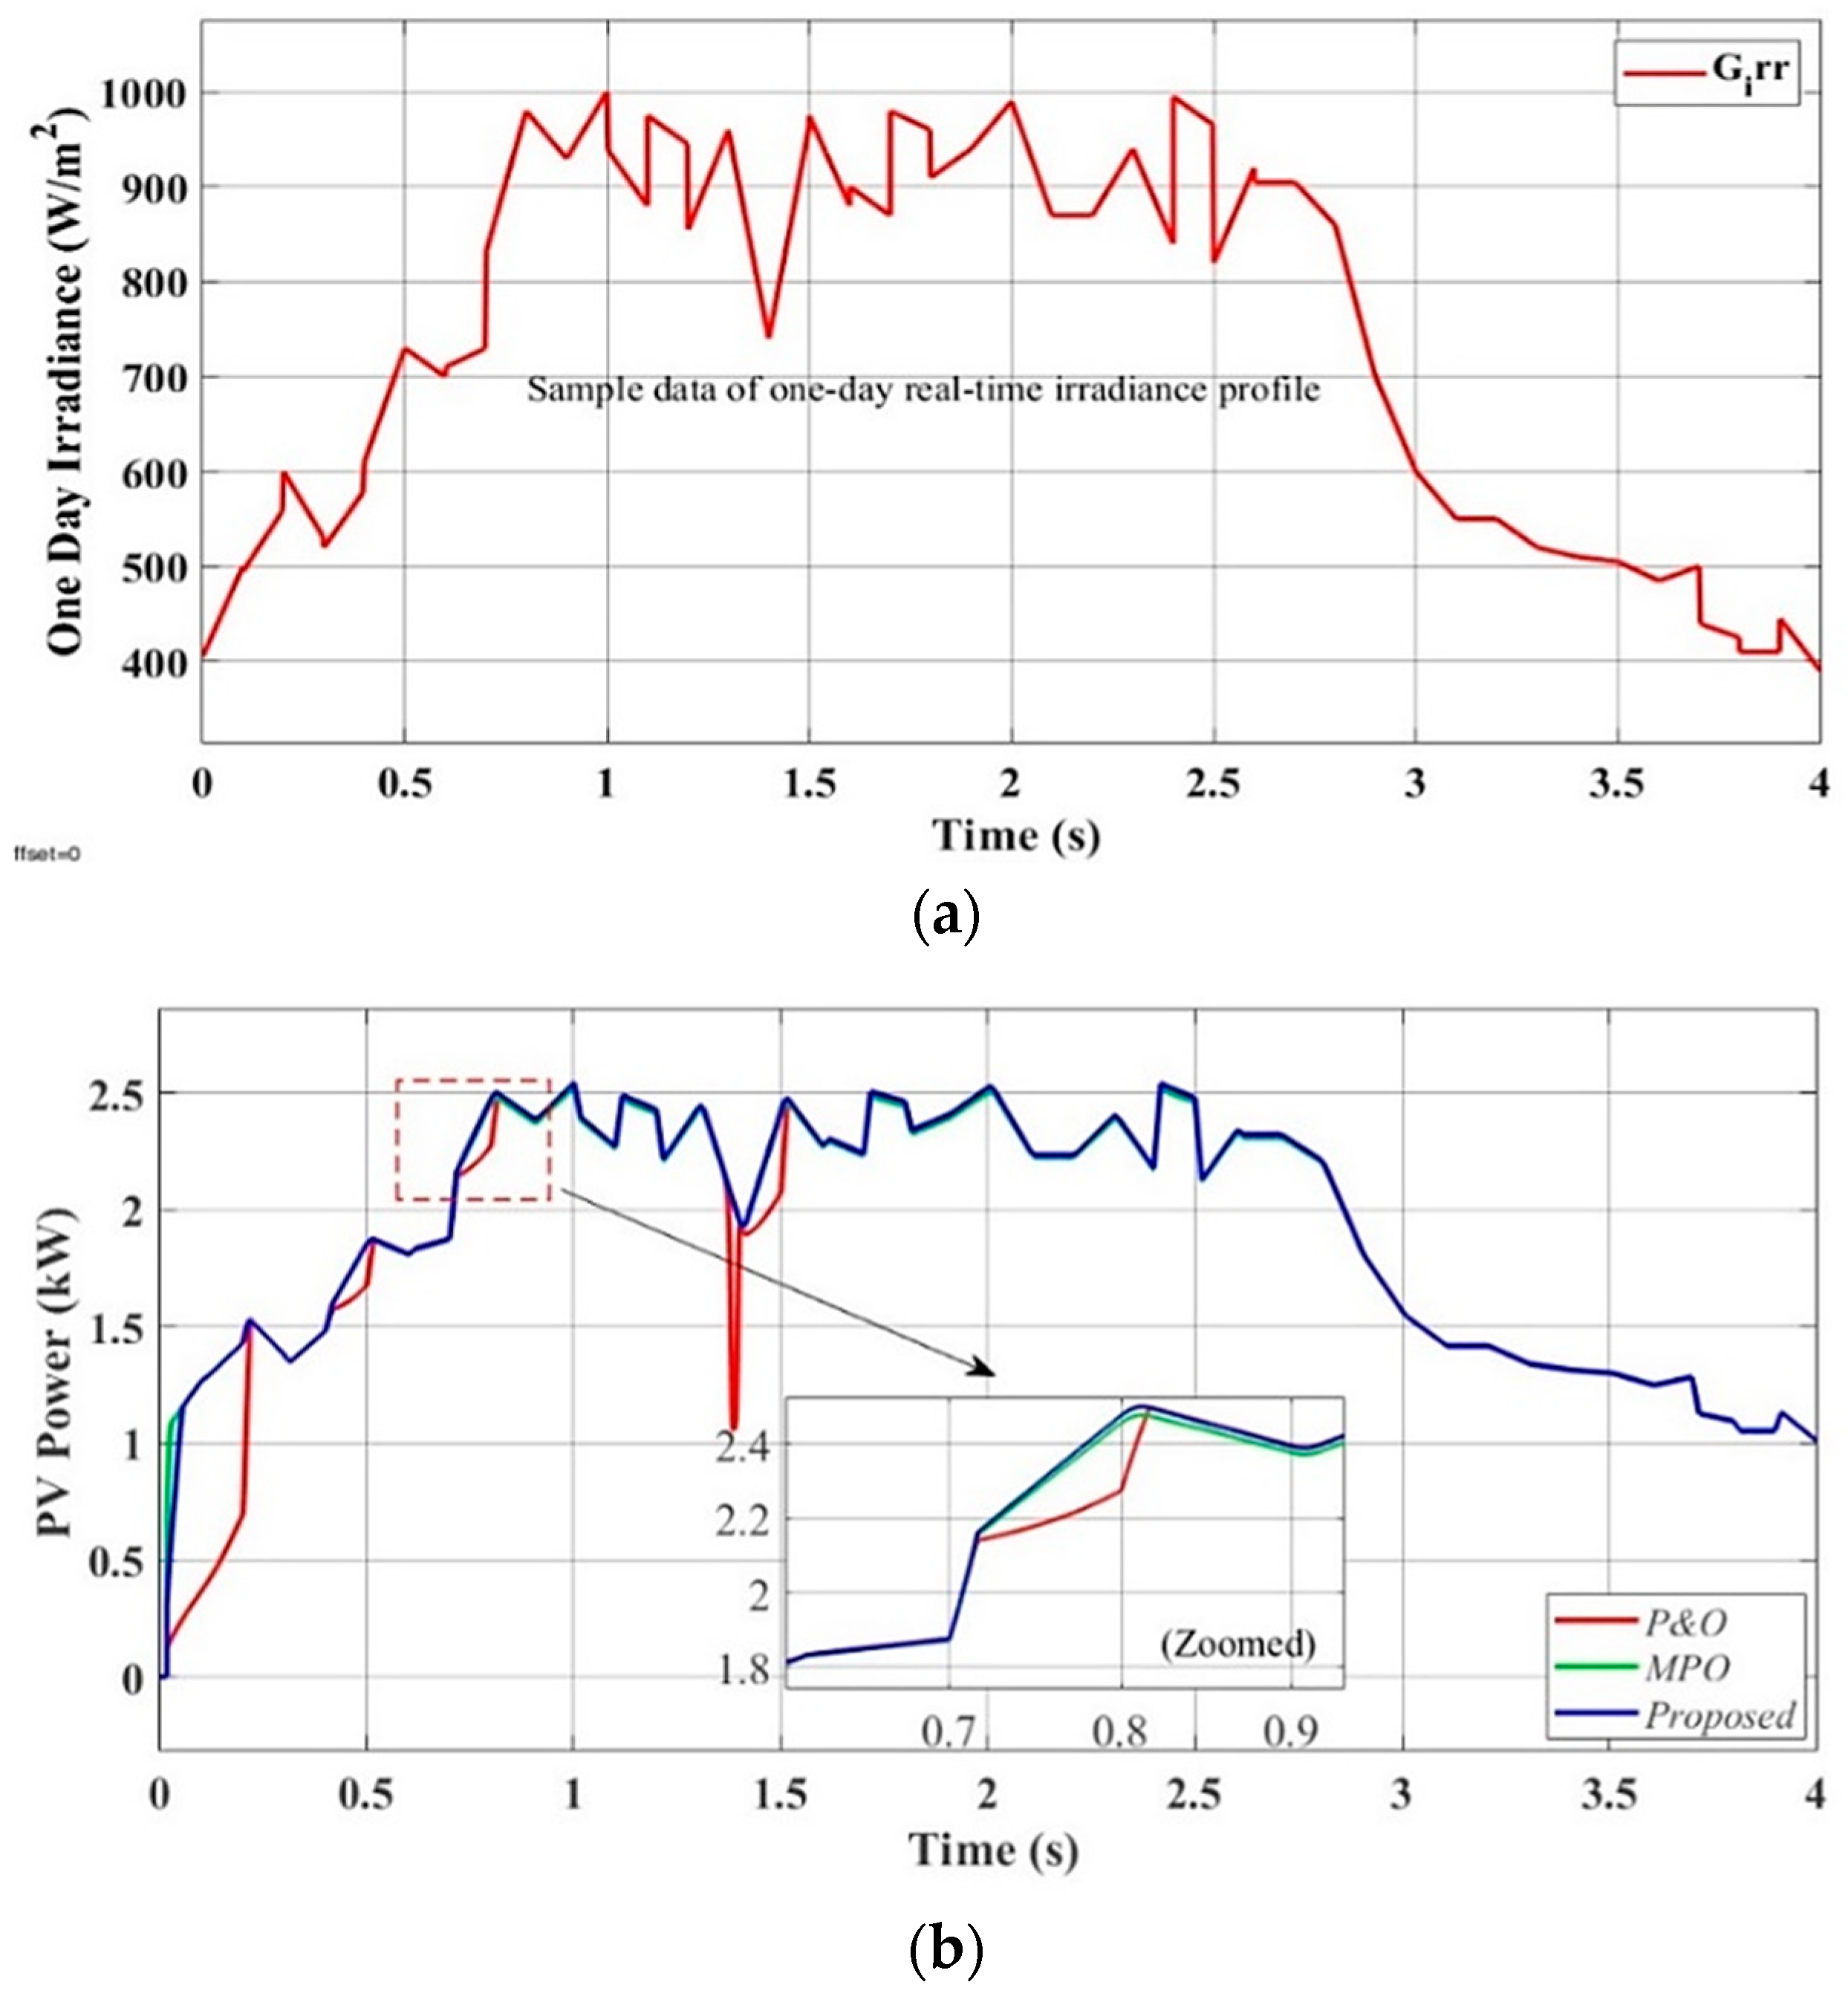
4.3. Scenario III: Performance Evaluation of Proposed Control System Under One-Day Real-Time Irradiance Profile
The dynamic behavior of the proposed MPPT control technique is evaluated under sudden changing irradiance and a fixed temperature (25 °C) using one-day real-time irradiance data samples. The one-day real-time values were collected from the weather station, which were collected using the sensor at a sample rate of 60 s and stored in the database at intervals of 60 s. In Figure 16a, sudden changes in irradiance on a special day at the beginning of June 2023 are illustrated. To simulate the sudden shift in irradiance, 40 irradiance data samples are gathered at regular intervals between 11:30 a.m. and 12:30 p.m. Therefore, the collected data are presented as a step input, with changes occurring every 0.1 s. A comparison of the solar PV-side output power harvested results, validated by employing the conventional and proposed tracking control techniques, is shown in Figure 16b. It can be observed that the proposed LMPO-MPPT technique accurately tracks the MPP under varying meteorological conditions and provides a fast-tracking response with a lower ripple output power as compared to the conventional techniques. Furthermore, the GSC under the proposed and conventional control techniques in Scenario III are shown in Figure 17a–c, respectively. It is expected that the findings will be collected once the system is synchronized with the utility grid. The DC link reference voltage is successfully regulated at approximately Vdc = 680 V, as shown in Figure 17a. In addition, the grid current components on the d-axis and q-axis also follow their reference values, as presented in Figure 17b. To achieve the unity power factor operation, the q-axis current is regulated to zero (injecting only the true power). The parameters of the tracking responses, efficiency, error, and THD% of the GIPV system in different scenarios are shown in Table 4. In Figure 17c, it is apparent that no reactive power is being added to the grid while the active power varies in response to the PV array’s output, as shown in the zoomed view. Using the proposed control technique improves both the grid-side and PV-side results in terms of their ripple output power, fast tracking, improved efficiency, and response settling time, respectively.
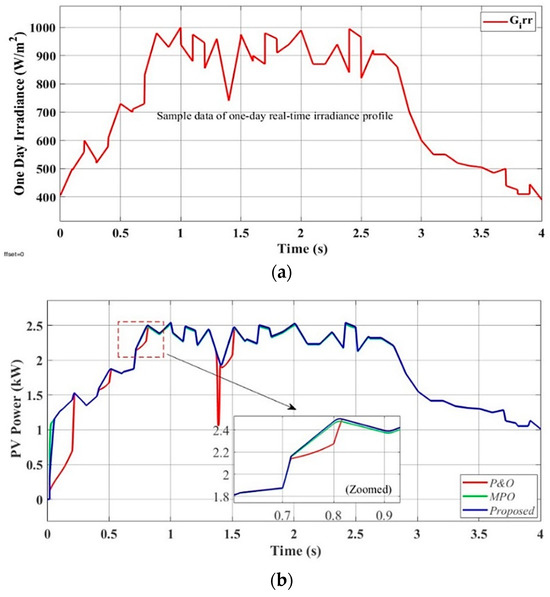
Figure 16.
PV-side simulated results performance of proposed control technique in Scenario III: (a) one-day real-time irradiance profile and (b) PV output power, .
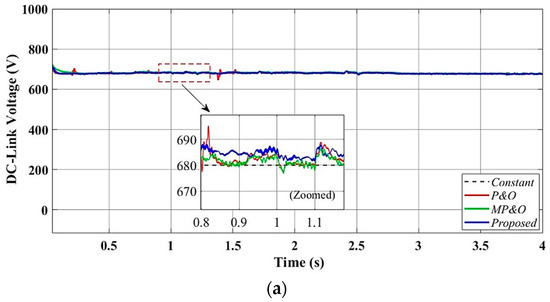
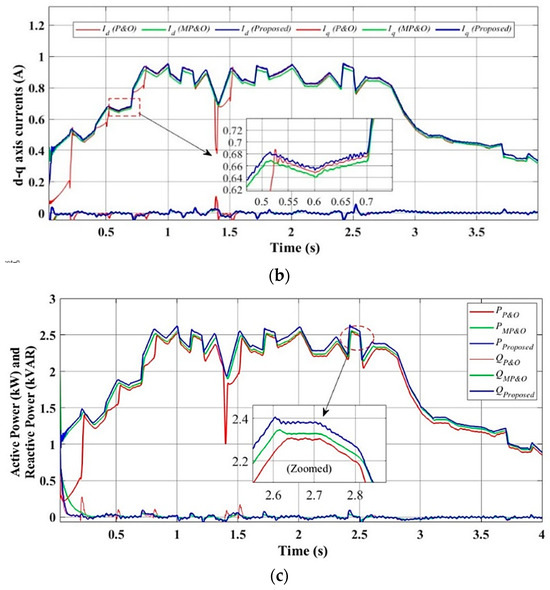
Figure 17.
Grid-side simulated results performance analysis of proposed control technique in Scenario III: (a) DC link voltage, (b) d-q-axis current (), and (c) active power, (kW) and reactive power (kVAR).
4.4. Performance Analysis of Dynamic Response and Harmonics
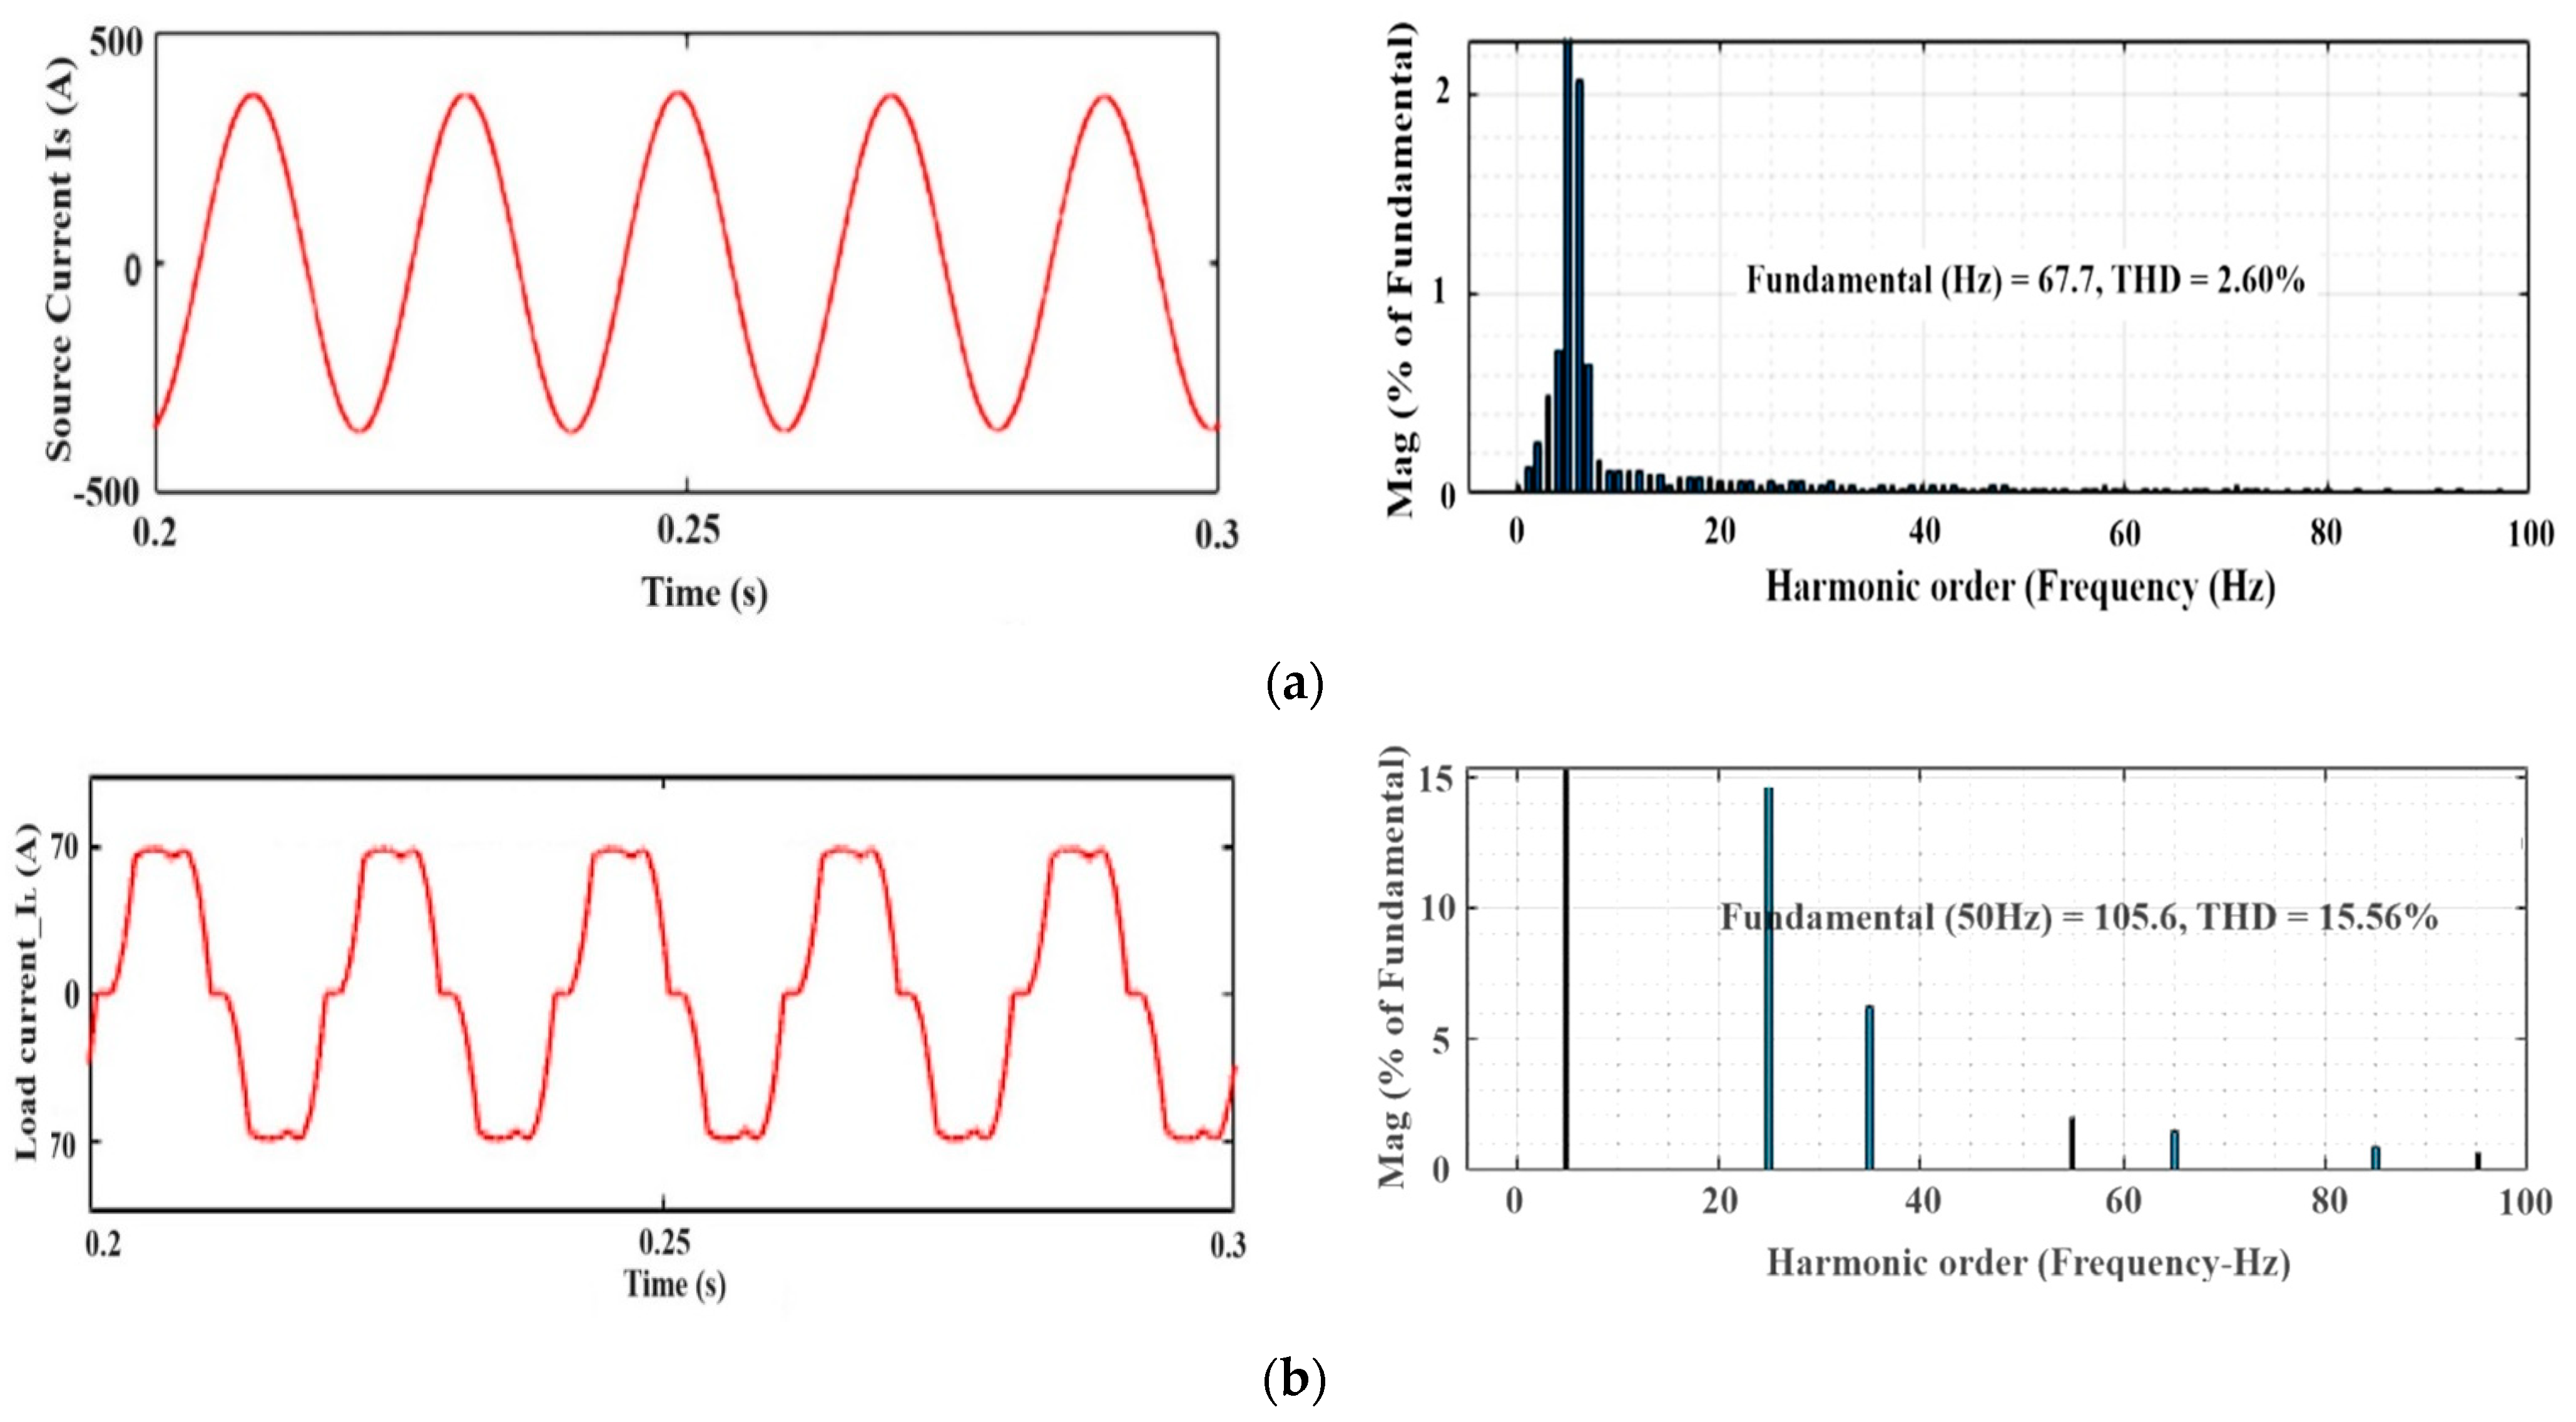
The proposed control technique has been examined for its transient response to DC link voltage regulation [4]. The influence of dynamic and transient voltage ripple response on the DC side has been investigated in terms of the total harmonic distortion [20,21,22] present in the output current at the grid side under different scenarios. Scenario I is discussed in Section 4.1, where the system starts with step changes (from 300 W/m2 to 1000 W/m2 and from 1000 W/m2 to 600 W/m2). The proposed control technique provides a DC link voltage of approximately 680 V under steady-state conditions, with an initial overshoot of 20.18% and a response settling time (trs) of 0.35 s for the simulated results of Vdc performance, as shown in Figure 12. The harmonic spectra of the supply current and load currents are displayed in Figure 18. The total harmonic distortion (THD) of the grid current is 2.60%, and the load current THD is 15.56%. The performance matrices of tracking responses, efficiency, %error, and THD% of the GIPV system were studied in different scenarios.
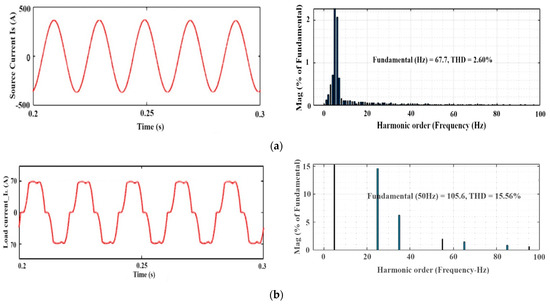
Figure 18.
Simulated results in steady state in Scenario I: (a) THD spectrum for grid current phase ‘a’ and (b) harmonic load current phase ‘a’.
5. Future Trends
The performance evaluation of new control techniques for a two-stage grid-integrated solar PV generation system is proposed. This work shows a comparative analysis of the proposed control technique for a two-stage GIPV generation system under various scenarios. The control strategies that are described include MPPT, an adaptive accomplishment of MPPT, reactive and active power regulation, and robustness evaluation and enhancement. However, some challenges must be discussed to improve the existing work and open up new avenues for future research. We summarize a few suggestions for future research work on the GIPV system, which are as follows:
- In the case of MPPT control strategies, maximizing power extraction in partial shading scenarios is a recent trend. However, the complexity of its execution impedes the practical application of these technologies.
- In addition to the MPPT function, a variety of power control algorithms are implemented. The photovoltaic system should be capable of supporting the grid. In this case, different functions must be incorporated into the MPPT procedure, such as continuous power generation, which is necessary to protect the grid against overloading under circumstances of peak power generation.
- A robust improvement of the LMPO-based MPPT and adaptive PI control was demonstrated. In this regard, analytical techniques and observers can be employed.
- Optimization techniques for estimating irradiance in terms of short-term forecasting for varying meteorological conditions can be incorporated for MPPT implementation.
- LMPO MPPT algorithms can be simplified and calculated more efficiently, particularly when multiple inverters are used.
- A sensorless control technique is recommended as an alternative technique in the case of sensor failure when the control target can be met with the least number of sensors. However, this could cause the controller’s quality to decline.
6. Conclusions
In this paper, the proposed control technique LMPO MPPT is employed for a 2.56 kW two-stage three-phase grid-integrated PV system with an LCL filter. The proposed technique is based on a variable step size by optimizing the main objective, i.e., the MPP of the photovoltaic system. The tracking accuracy of the proposed technique is validated and compared with conventional techniques. In the second stage of the GIPV system, a novel design DC link voltage regulation controller is employed in the outer-loop control to maintain the DC link voltage as constant at an appropriate value throughout solar photovoltaic intermittency. A detailed scenario study is carried out under varying meteorological conditions, such as Scenario I: varying irradiance and a fixed temperature; Scenario II: varying temperature and a fixed irradiance; and Scenario III: a one-day real-time irradiance profile. It was found that the proposed techniques enhanced the rapid tracking and dynamic response, high efficiency, and reduced oscillation in a steady state, with reduced sensitivity to unexpected disturbances and less fluctuation in the DC link voltage during transient conditions. Moreover, suitable inverter functioning and sinusoidal currents injected into the main grid with less THD% (within the IEEE-519 standard 2022 edition) were demonstrated. In future research, the proposed LMPO-MPPT will be hybridized with AI-based techniques to extract the global MPP under varied partial shading circumstances for GIPV systems. Overall, our contributions underscore the importance of continuous research and innovation in advancing renewable energy technologies for a sustainable future. Furthermore, practical and comprehensive experimental testing of the suggested control technique will be conducted, and sufficient preparation will be made for its real-time implementation.
Author Contributions
Conceptualization, J.S., S.P.S. and K.S.V.; methodology, J.S., S.P.S. and K.S.V.; software, J.S., S.P.S. and K.S.V.; validation and investigation, J.S., S.P.S. and K.S.V.; formal analysis, J.S., S.P.S. and K.S.V.; writing—original draft preparation, J.S. and S.P.S.; writing—review and editing, J.S., S.P.S. and K.S.V. All authors have read and agreed to the published version of the manuscript.
Funding
This research received no external funding.
Data Availability Statement
Data are contained within the article.
Acknowledgments
This work was supported by the researcher supporting the project.
Conflicts of Interest
The authors declare that there are no conflicts of interest.
List of Abbreviations and Symbols
| MPPT | Maximum power point tracking | STC | Standard test condition |
| DC | Direct current | AC | Alternative current |
| PO | Perturb and observed | VSC | Voltage source converter |
| MPO | Modified PO | API | Adaptive proportional integrated |
| LMPO | Learning-based modified PO | MPP | Maximum power point |
| PV | Photovoltaic | MPPT | Maximum power point tracking |
| G | Solar irradiance; | THD | Total harmonic distortion |
| T | Temperature | PLL | Phase lock loop |
| TS-GIPV | Two-stage grid integrated PV | RES | Renewable energy source |
| GSC | Grid side converter | PEC | Power electronic converter |
| KCL | Kirchhoff’s current law | PWM | Pulse width modulation |
| , | Passive LCL filters | , | DC-link voltage |
| Input PV current | mpp | Maximum rated power | |
| mpp | PV maximum rated voltage | Switching frequency | |
| 3-phase inverter side voltages | d-axis and q-axis | Direct and quadrature axis | |
| 3-phase grid side current | d-q axis inverter side voltages | ||
| d-q axis grid side voltages | d-q axis inverter side currents | ||
| d-q axis grid side currents | Grid active power | ||
| Drop voltage across the filter capacitors | Reactive power | ||
| 3-phase inverter and grid voltages | Inverter and grid currents | ||
| 3-phase filter capacitor voltages | DC-link voltage | ||
| 3-phase inverter and grid voltages in stationary d- q-axis reference | Switching frequency of the system | ||
| 3-phase filter capacitor voltages | Cbase and Zbase | Base capacitor and impedance of the filter | |
| Highest ripple current at VSI | Rd | Damping resistance | |
| d-q reference of inverter and grid currents | Resonant frequency | ||
| LCL filter inductance | System rated power | ||
| Grid voltage (RMS) | Maximum PV current | ||
| Real duty cycle | Variable power steps and stepping factor | ||
| Automatically adjusted power for varying irradiance | Variable step voltage | ||
| q-axis current: proportional and integral gain | Higher limit for the virtual duty cycle | ||
| Proportional and integral gain | Scaling factor | ||
| SRF Phase lock-loop: proportional and integral gain |
References
- Chatterjee, S.; Kumar, P.; Chatterjee, S. A techno commercial review on grid-connected photovoltaic system. Renew. Sustain. Energy Rev. 2018, 81, 2371–2397. [Google Scholar] [CrossRef]
- Dogan, Y.; Erdogan, İ.; Altuntepe, A. Design and fabrication of highly efficient antireflective coating in MWIR on germanium using ion-assisted e-beam deposition. Opt. Mater. 2024, 157, 116362. [Google Scholar] [CrossRef]
- Kolhe, M.L.; Rasul, M. 3-Phase grid-connected building integrated photovoltaic system with reactive power control capability. Renew. Energy 2020, 154, 1065–1075. [Google Scholar] [CrossRef]
- Mohamed, M.A.E.; Ahmed, S.N.; Metwally, M.E. Arithmetic optimization algorithm based maximum power point tracking for grid-connected photovoltaic system. Sci. Rep. 2023, 13, 5961. [Google Scholar] [CrossRef]
- Kjaer, S.; Pedersen, J.; Blaabjerg, F. A Review of Single-Phase Grid-Connected Inverters for Photovoltaic Modules. IEEE Trans. Ind. Appl. 2005, 41, 1292–1306. [Google Scholar] [CrossRef]
- Hota, A.; Bhuyan, S.K.; Hota, P.K. Modeling & Simulation of Photovoltaic System Connected to Grid using Matlab. In Proceedings of the 2020 International Conference on Renewable Energy Integration into Smart Grids: A Multidisciplinary Approach to Technology Modelling and Simulation (ICREISG), Bhubaneswar, India, 14–15 February 2020; pp. 16–21. [Google Scholar]
- Chukwuka, C.; Folly, K.A. Technical and economic modeling of the 2.5kW grid-Tie residential photovoltaic system. Int. J. Renew. Energy Res. 2013, 3, 412–419. [Google Scholar]
- Veena, P.; Indragandhi, V.; Jeyabharath, R.; Subramaniyaswamy, V. Review of grid integration schemes for renewable power generation system. Renew. Sustain. Energy Rev. 2014, 34, 628–641. [Google Scholar] [CrossRef]
- Esram, T.; Chapman, P.L. Comparison of Photovoltaic Array Maximum Power Point Tracking Techniques. IEEE Trans. Energy Convers. 2007, 22, 439–449. [Google Scholar] [CrossRef]
- Hariri, M.H.M.; Desa, M.K.M.; Masri, S.; Zainuri, M.A.A.M. Grid-connected PV generation system-components and challenges: A review. Energies 2020, 13, 4279. [Google Scholar] [CrossRef]
- Ahmed, J.; Salam, Z. An improved perturb and observe (P&O) maximum power point tracking (MPPT) algorithm for higher efficiency. Appl. Energy 2015, 150, 97–108. [Google Scholar] [CrossRef]
- Piegari, L.; Rizzo, R. Adaptive perturb and observe algorithm for photovoltaic maximum power point tracking. Renew. Power Gener. IET 2010, 4, 317–328. [Google Scholar] [CrossRef]
- Li, J.; Wang, H. A novel stand-alone PV generation system based on variable step size INC MPPT and SVPWM control. In Proceedings of the 2009 IEEE 6th International Power Electronics and Motion Control Conference, Wuhan, China, 17–20 May 2009; pp. 2155–2160. [Google Scholar]
- Abdelwahab, S.A.M.; Hamada, A.M.; Abdellatif, W.S. Comparative Analysis of the Modified Perturb & Observe with Different MPPT Techniques for PV Grid Connected Systems. Int. J. Renew. Energy Res. 2020, 10, 155–164. [Google Scholar] [CrossRef]
- Femia, N.; Petrone, G.; Spagnuolo, G.; Vitelli, M. Optimization of Perturb and Observe Maximum Power Point Tracking Method. IEEE Trans. Power Electron. 2005, 20, 963–973. [Google Scholar] [CrossRef]
- Safari, A.; Mekhilef, S. Simulation and Hardware Implementation of Incremental Conductance MPPT With Direct Control Method Using Cuk Converter. IEEE Trans. Ind. Electron. 2010, 58, 1154–1161. [Google Scholar] [CrossRef]
- Kottas, T.; Boutalis, Y.; Karlis, A. New Maximum Power Point Tracker for PV Arrays Using Fuzzy Controller in Close Cooperation with Fuzzy Cognitive Networks. IEEE Trans. Energy Convers. 2006, 21, 793–803. [Google Scholar] [CrossRef]
- Datta, M.; Senjyu, T.; Yona, A.; Funabashi, T. A fuzzy based method for leveling output power fluctuations of photovoltaic-diesel hybrid power system. Renew. Energy 2011, 36, 1693–1703. [Google Scholar] [CrossRef]
- KYOCERA North America. Available online: https://americas.kyocera.com/contact/index.html (accessed on 2 July 2024).
- Zarina, P.; Mishra, S.; Sekhar, P. Exploring frequency control capability of a PV system in a hybrid PV-rotating machine-without storage system. Int. J. Electron. Power Energy Syst. 2014, 60, 258–267. [Google Scholar] [CrossRef]
- Shao, B.; Miao, Z.; Wang, L.; Meng, X.; Chen, Z. Low-frequency oscillation analysis of two-stage photovoltaic grid-connected system. Energy Rep. 2022, 8, 241–248. [Google Scholar] [CrossRef]
- Chakir, A.; Tabaa, M.; Moutaouakkil, F.; Medromi, H.; Julien-Salame, M.; Dandache, A.; Alami, K. Optimal energy management for a grid connected PV-battery system. Energy Rep. 2019, 6, 218–231. [Google Scholar] [CrossRef]
- Chen, L.; Amirahmadi, A.; Zhang, Q.; Kutkut, N.; Batarseh, I. Design and Implementation of Three-Phase Two-Stage Grid-Connected Module Integrated Converter. IEEE Trans. Power Electron. 2013, 29, 3881–3892. [Google Scholar] [CrossRef]
- Choi, H.; Ciobotaru, M.; Agelidis, V.G. High gain DC/DC converter for the grid integration of large-scale PV systems. In Proceedings of the IEEE International Symposium on Industrial Electronics (ISIE), Hangzhou, China, 28–31 May 2012; pp. 1011–1016. [Google Scholar]
- Wang, Q.; Yu, Z.; Dai, J.; Yan, Q.; Fan, L.; Tang, Y. Two-stage voltage control strategy for PV plants based on variable droop control. Int. J. Electron. 2019, 107, 250–271. [Google Scholar] [CrossRef]
- Prasad, D.; Kumar, N.; Sharma, R.; Malik, H.; Márquez, F.P.G.; Pinar-Pérez, J.M. A novel ANROA based control approach for grid-tied multi-functional solar energy conversion system. Energy Rep. 2023, 9, 2044–2057. [Google Scholar] [CrossRef]
- Lalili, D.; Mellit, A.; Lourci, N.; Medjahed, B.; Berkouk, E. Input output feedback linearization control and variable step size MPPT algorithm of a grid-connected photovoltaic inverter. Renew. Energy 2011, 36, 3282–3291. [Google Scholar] [CrossRef]
- Tang, Y.; Loh, P.C.; Wang, P.; Choo, F.H.; Gao, F. Exploring inherent damping characteristic of LCL-flters for three-phase grid-connected voltage source inverters. IEEE Trans. Power Electron. 2012, 27, 1433–1443. [Google Scholar] [CrossRef]
- Ciobotaru, M.; Teodorescu, R.; Blaabjerg, F. A new single-phase PLL structure based on second order generalized integrator. In Proceedings of the 2006 37th IEEE power Electronics Specialists Conference, Jeju, Republic of Korea, 18–22 June 2006; pp. 1–6. [Google Scholar]
- Kumar, N.; Singh, B.; Panigrahi, B.K.; Chakraborty, C.; Suryawanshi, H.M.; Verma, V. Integration of solar PV with low-voltage weak grid system: Using normalized Laplacian kernel adaptive kalman flter and learning based InC algorithm. IEEE Trans. Power Electron. 2019, 34, 10746–10758. [Google Scholar] [CrossRef]
- Soliman, M.A.; Hasanien, H.M.; Azazi, H.Z.; El-Kholy, E.E.; Mahmoud, S.A. Linear-Quadratic Regulator Algorithm-Based Cascaded Control Scheme for Performance Enhancement of a Variable-Speed Wind Energy Conversion System. Arab. J. Sci. Eng. 2018, 44, 2281–2293. [Google Scholar] [CrossRef]
- Samani, L.; Mirzaei, R. Maximum power point tracking for photovoltaic systems under partial shading conditions via modified model predictive control. Electron. Eng. 2021, 103, 1923–1947. [Google Scholar] [CrossRef]
- Kermadi, M.; Salam, Z.; Eltamaly, A.M.; Ahmed, J.; Mekhilef, S.; Larbes, C.; Berkouk, E.M. Recent developments of MPPT techniques for PV systems under partial shading conditions: A critical review and performance evaluation. IET Renew. Power Gener. 2020, 14, 3401–3417. [Google Scholar] [CrossRef]
- Feshara, H.F.; Ibrahim, A.M.; El-Amary, N.H.; Sharaf, S.M. Performance Evaluation of Variable Structure Controller Based on Sliding Mode Technique for a Grid-Connected Solar Network. IEEE Access 2019, 7, 84349–84359. [Google Scholar] [CrossRef]


Disclaimer/Publisher’s Note: The statements, opinions and data contained in all publications are solely those of the individual author(s) and contributor(s) and not of MDPI and/or the editor(s). MDPI and/or the editor(s) disclaim responsibility for any injury to people or property resulting from any ideas, methods, instructions or products referred to in the content. |
© 2025 by the authors. Licensee MDPI, Basel, Switzerland. This article is an open access article distributed under the terms and conditions of the Creative Commons Attribution (CC BY) license (https://creativecommons.org/licenses/by/4.0/).