Article

Modeling the Tripartite Coupling Dynamics of Electricity–Carbon–Renewable Certificate Markets: A System Dynamics Approach

1
School of Nuclear Science and Engineering, North China Electric Power University, Beijing 102206, China
2
MOE Key Laboratory of Resources and Environmental Systems Optimization, Ministry of Education, North China Electric Power University, Beijing 102206, China
3
State Grid Energy Research Institute, Changping District, Beijing 102209, China
*
Author to whom correspondence should be addressed.
Processes 2025, 13(3), 868; https://doi.org/10.3390/pr13030868
Submission received: 10 February 2025 / Revised: 2 March 2025 / Accepted: 13 March 2025 / Published: 15 March 2025

Abstract

:
To ensure a smooth transition towards peak carbon emissions and carbon neutrality, one key strategy is to promote a low-carbon transition in the energy sector by facilitating the coordinated development of the electricity market, carbon market, and other markets. Currently, China’s national carbon market primarily focuses on the power generation industry. High-energy-consuming industries such as the steel industry not only participate in the electricity market but also play a significant role in China’s future carbon market. Despite existing research on market mechanisms, there remains a significant research gap in understanding how steel enterprises adjust their trading behaviors to optimize costs in multi-market coupling contexts. This study employs a system dynamics approach to model the trading interconnection between electricity trading (ET), carbon emission trading (CET), and tradable green certificates (TGC). Within this multi-market system, thermal power enterprises and renewable generators serve as suppliers of carbon allowances and green certificates, respectively, while steel companies must meet both carbon emission constraints and renewable energy consumption obligations. The results show that companies can reduce future market transaction costs by increasing the proportion of medium to long-term electricity contracts and the purchase ratio of green electricity. Additionally, a lower proportion of free quotas leads to increased costs in the carbon market transactions in later stages. Therefore, it is beneficial for steel companies to conduct cost analyses of their participation in multivariate market transactions in the long run and adapt to market changes in advance and formulate rational market trading strategies.

1. Introduction

As the impact of climate change intensifies, the global environmental crisis worsens, and energy constraints become more pressing, the development of a low-carbon economy, characterized by low energy consumption, minimal pollution, and reduced emissions, has emerged as a strategic choice for countries in pursuit of economic and environmental sustainability [1]. It is an inevitable trend in global economic development [2]. Climate change represents one of the most pressing challenges facing humanity today, with global greenhouse gas emissions continuing to rise despite international efforts [3]. According to the IPCC, limiting global warming to 1.5 °C requires rapid and far-reaching transitions in energy, land, urban infrastructure, and industrial systems [4]. Worldwide, countries are implementing various mechanisms to reduce carbon emissions, with market-based instruments becoming increasingly popular due to their economic efficiency. China, as the largest developing country, stands at a pivotal juncture where the development of a low-carbon economy presents both tremendous opportunities and significant challenges. On the one hand, despite gradual reductions in recent years, coal continues to hold a dominant position in China’s current energy structure, with its centrality likely to persist in the foreseeable future [5]. On the other hand, in order to actively respond to climate change, control greenhouse gas emissions, and enhance the ability to adapt to climate change, China needs to improve energy efficiency, optimize industrial structures, and transform the mode of economic development [6].
To address these challenges, both domestically and internationally, strategic goals for energy conservation, emissions reduction, and the encouragement of renewable energy development have been put forward [7]. Various market-based mechanisms have been implemented globally to promote carbon emission reduction. These primarily include carbon taxation and emission trading schemes (ETSs). Carbon taxes directly set a price on carbon, while ETSs establish a cap on emissions and allow participants to trade emission permits. The European Union Emissions Trading System (EU ETS), established in 2005, represents the world’s first major carbon market and remains the largest [8]. Studies have shown that the EU ETS has achieved emission reductions of approximately 35% between 2005 and 2019, though with varying impacts across different sectors and countries [9]. Other significant carbon markets have emerged in regions like North America (the Regional Greenhouse Gas Initiative and Western Climate Initiative), South Korea, and New Zealand, each with distinctive design features and varying carbon prices [10]. In 2011, China’s National Development and Reform Commission issued a notice to carry out domestic carbon market pilot programs, which were then successively launched in provinces such as Shanghai, Tianjin, Hubei, and Fujian [11]. Currently, nine carbon trading exchanges have been established in China, making it the world’s largest carbon market in terms of greenhouse gas emissions coverage. At present, the national carbon trading market in China targets only the power sector. Since its inception in 2021, the market covers approximately 4.5 billion tons of carbon dioxide emissions annually. In the context of pressing imperatives for emissions reduction and carbon mitigation, numerous enterprises and collectives are accelerating their efforts towards green development, transforming green resources into economic benefits with incentives from market mechanisms. Additionally, China has introduced the voluntary subscription of green certificates and built the tradable green certificates (TGCs) market to incentivize renewable energy enterprises and bolster renewable energy consumption [12]. Under the renewable energy quota system, there is a close coupling between the electricity market and the green certificate market. Renewable energy generation enterprises benefit from selling both electricity and green certificates, enhancing their competitiveness and market share. Additionally, the revenue from green certificates can effectively incentivize renewable energy generation enterprises to expand their installed capacity, increasing the supply of green electricity and promoting the green and low-carbon transformation of the power generation industry [13].
With the advancement of China’s “dual carbon” goals, the coupling of carbon and electricity markets has become one of the core mechanisms to promote low-carbon transformation and achieve carbon reduction targets [14]. The coupling of carbon and electricity markets forms a linkage mechanism for carbon prices, electricity prices, and green certificate prices through the interaction of carbon emission trading markets, electricity markets, and green certificate markets, facilitating the optimization of energy structure and the green transformation of various industries [15]. Particularly in the steel industry, which is a significant sector for energy consumption and carbon emissions, steel companies will face stricter carbon emission controls and quota management with the promotion of policies such as the “National Carbon Emission Trading Market Coverage Work Plan for the Cement, Steel, and Electrolytic Aluminum Industries (Draft for Comments)” [16]. Therefore, studying the impact of carbon and electricity market coupling on the steel industry, especially how steel companies adjust their trading strategies in this coupled market environment, is particularly important. Currently, research on the green and low-carbon transformation of steel companies under the dual carbon goals has made some progress. For example, Xu et al. [17] explored the impact mechanism and action path of China’s carbon emission trading pilot on the green total factor productivity of steel companies based on data from listed companies in the Chinese steel industry from 2007 to 2020 by constructing a multi-period difference-in-differences model. Zhang et al. [18] optimized the carbon quota allocation for steel companies using the Shapley model, based on the baseline value of the carbon emission responsibility accounting method for cooperative emission reduction models between steel companies and consumers. However, despite the existing research providing important insights into the low-carbon transition of the steel industry, most of these studies focus on the impact of single market mechanisms or local policies on steel enterprises, failing to explore in depth the effects of carbon and electricity market coupling on the specific trading behaviors and cost management of steel companies in a multi-market context. Several studies have examined the theoretical foundations of market coupling. For instance, Jiang [13] explores the coupling dynamics between electricity consumption and carbon emissions, emphasizing the importance of understanding these interactions for major industrial sectors, including steel. Zhu et al. [19] analyzes the carbon emission mechanism of the key metal industry chain from the perspective of systematic correlation. Although it mainly focuses on the metal industry, its analysis framework is also valuable for the steel industry.
Current research mainly concentrates on the carbon emission trading market and the electricity market, lacking discussions on how steel enterprises can make optimized decisions among the carbon, electricity, and green certificate markets. For example, Ewa et al. [20] provided valuable insights into comparative carbon pricing mechanisms globally but does not specifically address the steel industry context or multi-market coupling dynamics. While Yang et al. [21] analyzed the decision-making of steel enterprises in the market using a multi-agent game model, their study did not conduct an in-depth analysis in conjunction with the actual trading behaviors in a multi-market coupling context. Gu et al. [22] and Zhou et al. [23] focused more on the overall cost assessment of energy efficiency improvements and carbon reduction, neglecting how steel enterprises adjust their carbon emissions, electricity purchases, and green certificate buying behaviors to achieve cost optimization in a multi-market coupling scenario. Currently, research on multi-market coupling mostly employs system dynamics methods, primarily focusing on the synergistic effects at the market mechanism and policy levels. For instance, Xu et al. [24] explored the synergistic effects between renewable portfolio standards (RPSs) and the carbon emission trading market (CET) based on a system dynamics model, while Song et al. [25] constructed a multi-market coupling trading system model that includes electricity, carbon, and green certificate markets to analyze the system’s operational effects under different policy scenarios.
Therefore, this study will construct a tripartite market simulation model coupled with carbon, electricity, and green certificate markets, and analyze the price transmission mechanism under the multi-market coupling mechanism. Then, taking a steel company as a case study, this analysis examines the variations in trading costs when this company engages in the tripartite market under different scenarios, such as various transaction contract proportion, green electricity proportion, and free quota proportion. By evaluating these factors, this research aims to offer decision-making support for steel companies in formulating effective market trading strategies. Such insights can assist steel companies in navigating the complex landscape of carbon, electricity, and green certificate markets, ultimately enabling them to make informed and strategic decisions to optimize their market participation and minimize trading costs.

2. Methodology and Data

Here, we employed the system dynamics (SD) method to build the ET-GET-TGC tripartite market simulation model, which encompasses the electricity, carbon, and green certificate trading markets. The SD method delves into the feedback structures and behaviors of systems by tightly integrating systems science theory and computer simulation. At its core, the SD method emphasizes that the behavior patterns and characteristics of a system are primarily dependent on its internal structure. By homing in on this principle, the SD method can examine the functional characteristics of the system and conduct real-time tracking and simulation [26]. In system dynamics, fluid motion can be used to describe system behavior, and causal relationships and flow diagrams are utilized to articulate the system’s composition. Before building the system model, it is necessary to clarify causal relationships, system variables, and the main modeling steps. Meanwhile, system dynamics has a unique advantage in analyzing complex nonlinear systems, enabling both the qualitative and quantitative analysis of the past, present, and future states. Compared with other research methodologies, the SD model is particularly suited for intricate, time-varying systems with high orders, multiple variables, multiple loops, nonlinearity, and feedback structures. This allows for the quantitative analysis of the long-term characteristics of the system and the assessment of each element’s impact on the entire system [27]. Therefore, using the SD model not only allows for the study of the multi-system coupling effects of CET and TGC on the electricity market but also enables further exploration of user transaction strategy choices under the interaction of multiple systems.

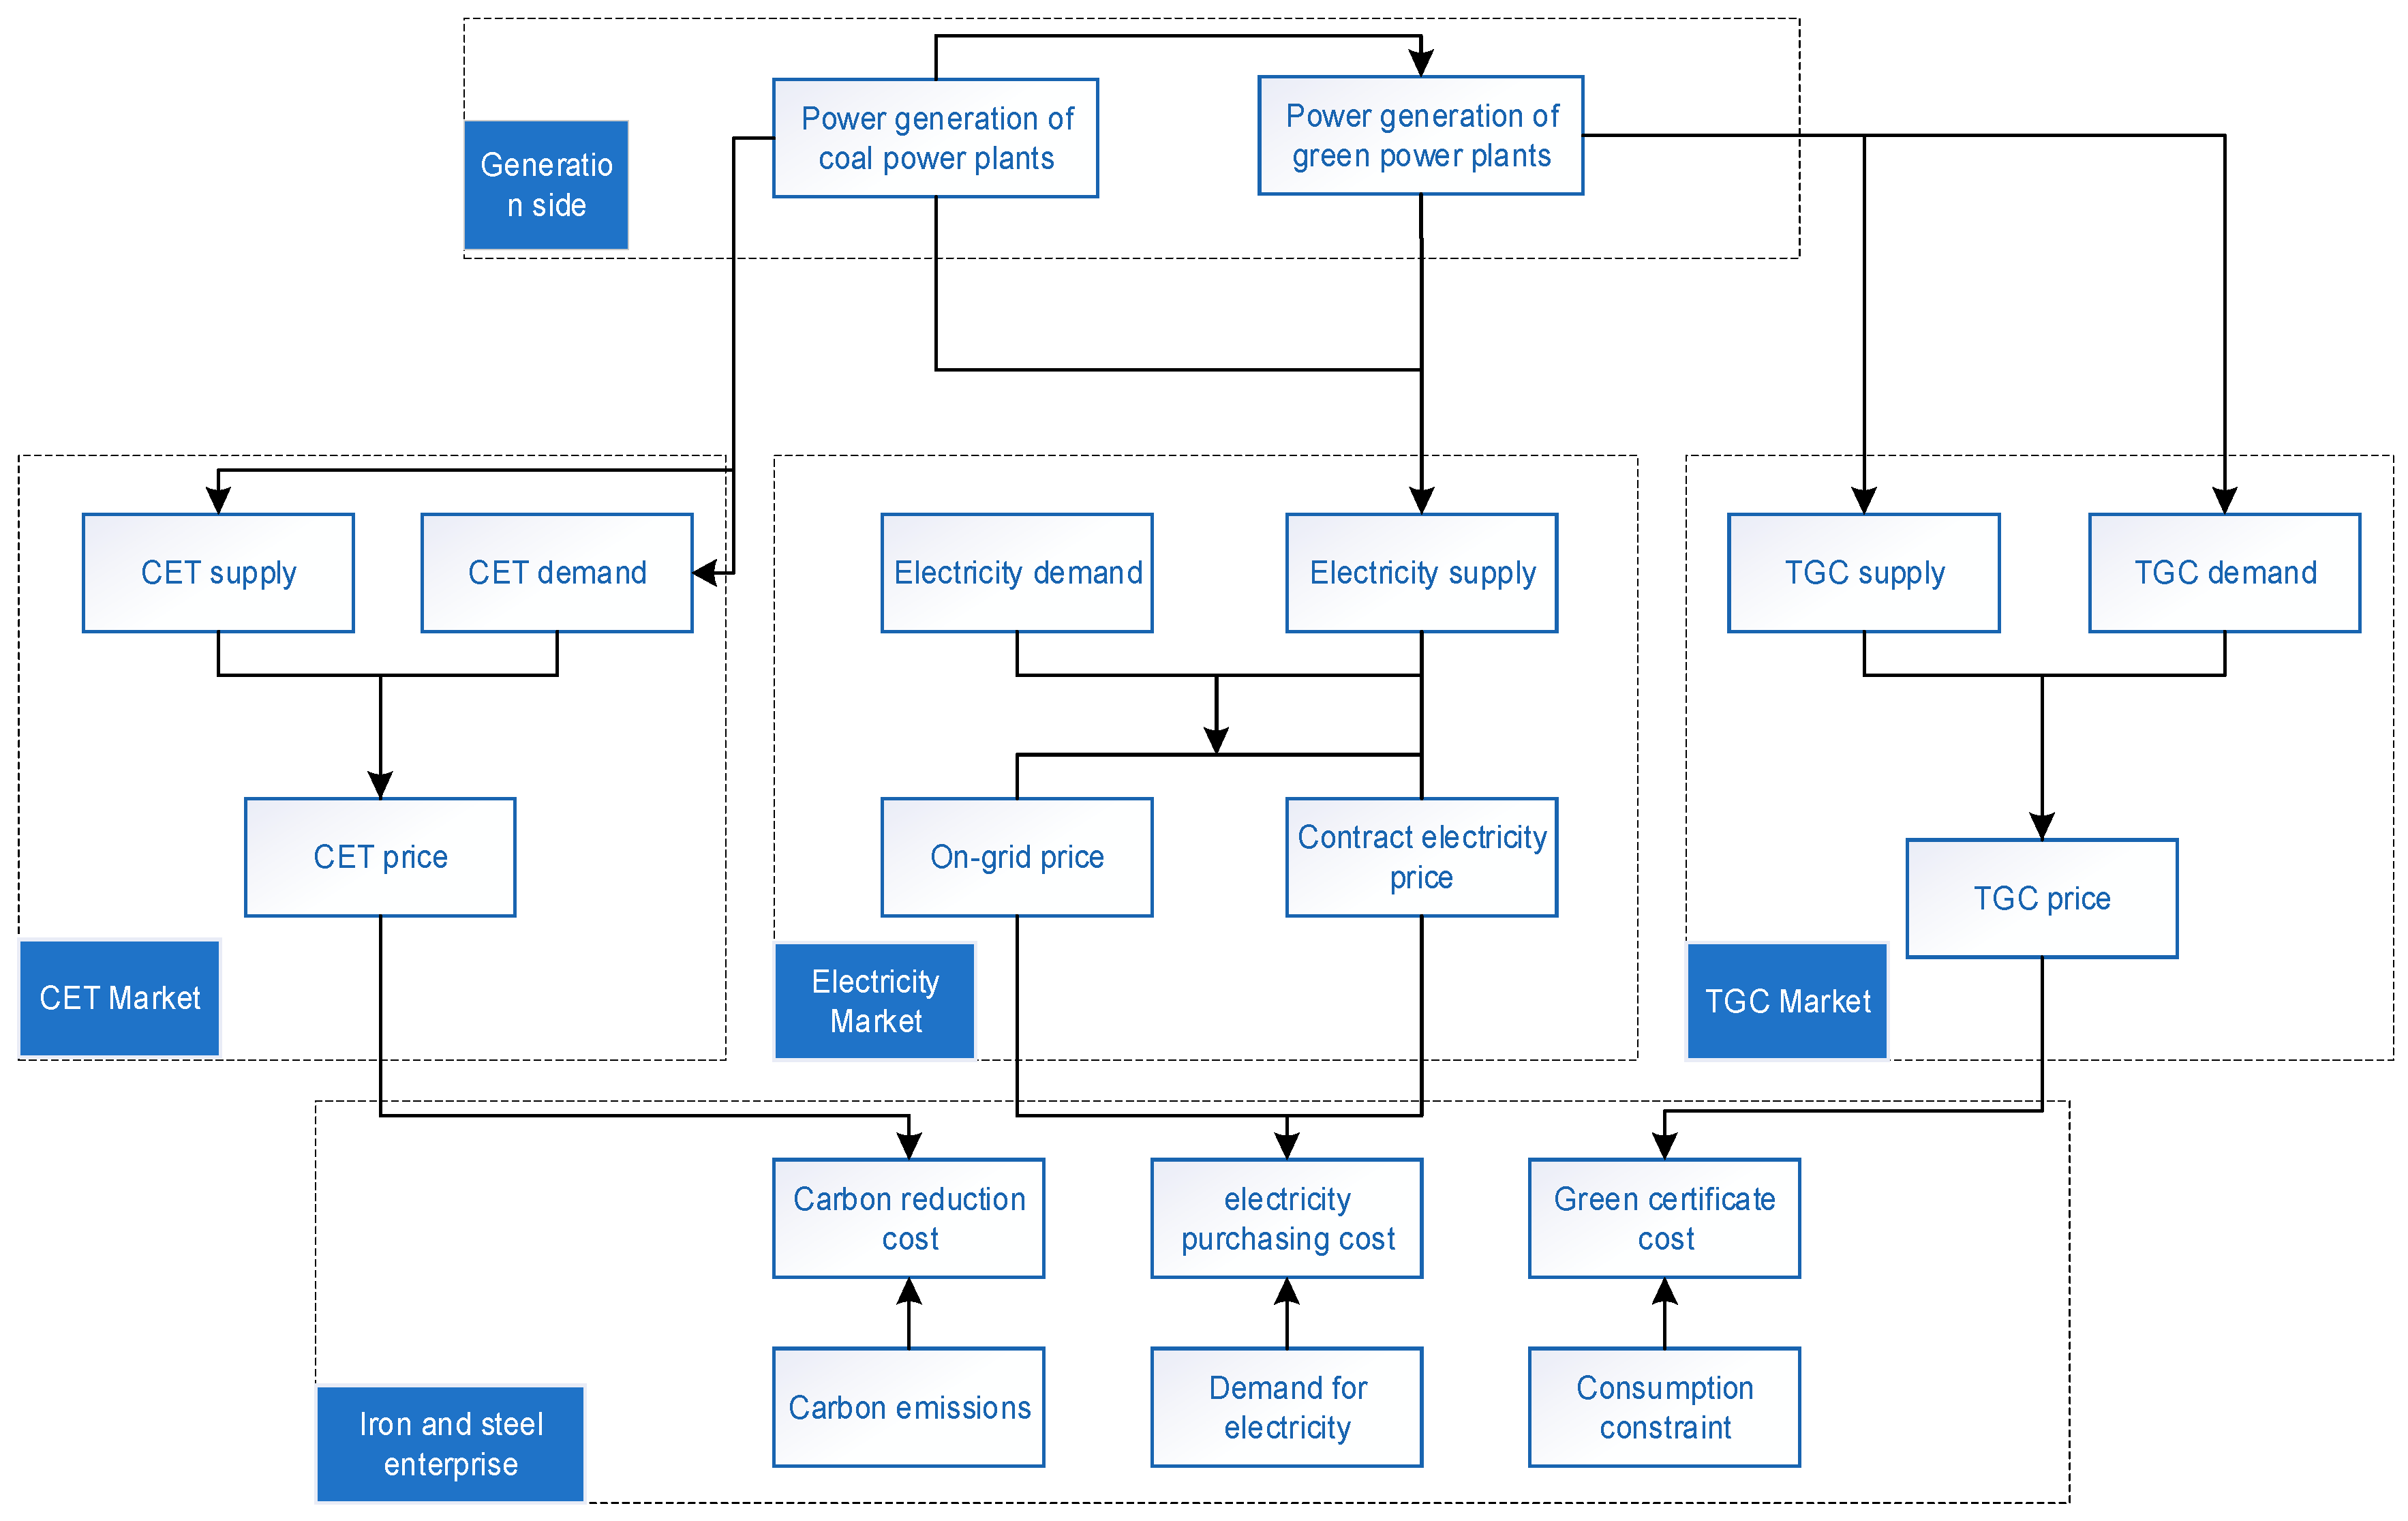
2.1. Theoretical Framework Analysis

The integrated consideration of green certificate trading, carbon market trading, and electricity market trading is a dynamic cyclical process (Figure 1). On the supply side, coal power firms and green electricity firms represent two distinct generation technologies, using coal and renewable energy, respectively, to meet societal electricity demands (Figure 1-Generation side). To promote energy transition, on the one hand, thermal power enterprises will assign carbon emission responsibilities from the supply side. Thermal power generators need to participate in carbon market transactions to meet their own carbon quota obligations, thus generating a demand for carbon allowances. Due to emission reduction technologies, some thermal power enterprises emit fewer carbon emissions, enabling them to utilize surplus carbon allowances for market transactions and realize emission reduction profits. Consequently, these enterprises emerge as the main suppliers of carbon allowances in the carbon trading market (Figure 1, CET market). Electricity generated by renewable energy sources, either directly supplied to key industrial enterprises or self-consumed by enterprises, is calculated as having zero carbon emissions due to its green attributes. On the other hand, bound by the obligation to incorporate renewable energy consumption, grid companies and users (i.e., steel companies) must assume corresponding responsibilities. Renewable electricity generation firms serve as suppliers of green certificates, issuing green certificates based on their generated electricity volume and trading them in the green certificate market. Those unable to fulfill their renewable energy consumption quotas must purchase green certificates to meet their obligations due to the separation of the certificate and electricity (Figure 1, TGC market). Coal power generation and renewable energy generation jointly determine the electricity supply, while all end users collectively determine the societal electricity demand, with the on-grid electricity price being determined based on the supply–demand equilibrium theory (Figure 1, electricity market). Taking a steel enterprise as an example, influenced by production constraints, carbon compliance obligations, and renewable energy consumption constraints, there will be electricity costs, carbon compliance costs, and green certificate costs. Within this multi-market system, changes in supply and demand dynamics affect the trends in carbon, electricity, and green certificate prices, consequently impacting the costs of the steel companies (Figure 1, iron and steel enterprise). Studying how companies participate in multi-market transactions offers insights for formulating future trading strategies, thus facilitating enterprises’ low-carbon transformation.

2.2. Model Design

For analytical purposes, this paper simplifies the electricity, carbon, and green certificate markets, as well as enterprises, respectively. The model retains two types of power generators: thermal and renewable energy power plants, both acting as electricity suppliers. In addition, thermal plants also engage as both suppliers and demanders of CET and as the primary demanders of TGC. Renewable energy power plants are suppliers of TGC, and high-emission steel companies serve as electricity demanders. To ensure scientifically rigorous system dynamics modeling, the following assumptions are proposed:
(1) The electricity, carbon, and green certificate markets are all perfectly competitive, with prices determined by market supply and demand dynamics.
(2) This study is currently focused only on domestic market changes in China, without considering the impacts of cross-border trading, carbon taxes, etc.
(3) The transfer of electricity and TGC across regions is not considered, and both TGC and CET are assumed to have a validity period of one year without the ability to be stored.
(4) Enterprises are required to factor in carbon quotas and simultaneously consider the constraints of renewable energy consumption. They should adhere to the principle of environmental uniqueness, where the environmental benefits of green electricity are solely assessed through green certificates.
(5) The market is characterized by a high degree of transparency to ensure information availability and reliability for all participants.

2.2.1. Electricity Market

The electricity market in this model comprises two segments: the spot market and the medium-and long-term contract electricity market. Large users purchase electricity from both markets according to their electricity needs. Currently, green electricity transactions primarily occur in the medium- and long-term electricity market, satisfying the demands of electricity users to purchase and utilize green electricity, while also providing corresponding certifications for green electricity consumption [28]. When electricity users participate in the spot electricity market, if demand surpasses supply capacity, market forces may respond by increasing electricity prices to balance supply and demand. Excess demand in the electricity market may lead to fluctuations in market prices [29].
A causal loop diagram illustrating the dynamics of the electricity market is presented in Figure 2. It highlights the interconnection between various factors that influence users’ decision-making when participating in market transactions. Factors such as electricity demand, contract proportion, carbon price, spot price, thermal power price, and green power price affect large users’ decision to purchase electricity from the spot market. Among them, carbon price, spot price, thermal power price, and contract proportion exert a negative impact on the volume of spot electricity purchases, while electricity demand and green power price have a positive effect. In this electricity model, large power users bear a portion of the responsibility for carbon emissions, reflected in the net purchased carbon emissions, incurring corresponding carbon emission costs. A higher renewable energy consumption proportion prompts the increased procurement of green power and reduced reliance on thermal power, thereby diminishing the net purchased carbon emissions. Additionally, a higher contract proportion means a smaller volume of spot electricity purchases and potentially elevates the purchase of green power in medium- and long-term contracts, consequently reducing net purchased carbon emissions. When the carbon price is low, users may favor purchasing more thermal power from the spot or medium-and long-term contract market, potentially decreasing their reliance on green power. This, in turn, increases the users’ electricity purchasing demand in the spot electricity market, driving up the spot electricity prices and creating a negative feedback loop [30].
The electricity demand required for enterprise production is related to the production level of the enterprise. The higher the output of enterprise products and the higher the energy consumption per unit of product, the higher the demand for electricity. According to the electricity demand, the power demand can be divided into short-term spot power demand and medium- and long-term power demand. Therefore, the related formula can be expressed as follows:
Q d e m a n d = Q o n - g r i d + Q long
In Equation (1), Qdemand is the total demand of consumers for electricity, Qon-grid represents the on-grid spot electricity demand, and Klong represents the demand of medium- and long-term contract electricity demand.
For enterprises, they can either purchase spot electricity from the spot power market or sign contract volumes for electricity in the medium- and long-term power market to meet their electricity demand [31]. The cost of purchasing electricity from the spot market for enterprises is related to the spot demand and the grid electricity price [32], while in the medium- and long-term trading market, the cost of medium- and long-term power transactions is further related to the demand and price of thermal power and green power [33]. The related costs can be represented as follows:
C o n - g r i d = Q o n - g r i d × P o
C l o n g = b × Q l o n g × P c o a l + ( 1 b ) × Q l o n g × P green
C e l e c t r i c i t y = C o n - g r i d + C l o n g
In Equation (2), Con-grid is the enterprise’s spot power purchase cost and P0 represents the on-grid price. In Equation (3), Clong is the cost of enterprise’s medium- and long-term contract power purchase [34]; Qlong is the demand of medium- and long-term contract electricity; Pcoal and Pgreen represent the medium- and long-term thermal power price and green power price, respectively; and b is medium- and long-term thermal power purchase proportion. In Equation (4), Celectricity is the ET cost, including two variables: the enterprise’s spot power purchase cost and medium- and long-term contract power purchase.
When the proportion of spot demand is a, the electricity trading (ET) cost can be expressed as follows:
C e l e c t r i c i t y = a × Q d e m a n d × P + ( 1 a ) × b × Q d e m a n d × P c o a l + ( 1 a ) × ( 1 b ) × Q d e m a n d × P green

2.2.2. CET Market

Analyzing the structure of the carbon emission rights trading market involves constructing a causal loop that delineates the dynamics at play. For high-emission enterprises, production activities generate corresponding carbon emissions, creating demand for emission allowances. To regulate emissions, the government allocates a specified amount of carbon emission rights to enterprises based on the carbon emissions. However, when an enterprise exhausts its carbon quota, it must purchase additional carbon allowances from the carbon market to meet its emission obligations and reduce carbon compliance risks. As demand for carbon quotas increases in the carbon market, it outstrips the available supply, thereby escalating the price of carbon emission rights [35]. Consequently, the cost of emissions reduction for enterprises rises. When the price reaches a certain level, it begins to impact the enterprise’s decisions regarding carbon emissions. This leads to a reduction in their trading activity in the carbon market, thus forming a causal feedback loop [36], as shown in Figure 3.
For high-energy-consuming enterprises, the production process requires the consumption of a substantial amount of electric power, which in turn generates a significant amount of carbon dioxide. Carbon emission rights are an indispensable production element for their daily operations. If the government distributes emission reduction quotas among all major enterprises uniformly, two scenarios may arise: first, enterprises with high pollution treatment efficiency or low pollution treatment costs can use advanced emission reduction technologies to exceed their emission reduction targets. If they have surplus carbon emission rights, they may choose to sell them to obtain economic compensation. Second, enterprises with low pollution treatment efficiency or high pollution treatment costs will buy the corresponding carbon emission rights to meet the national carbon emission standards and avoid environmental penalties or save on spending for energy-saving technological equipment upgrades [37]. Based on the cost–benefit principle, to maximize profits, enterprises will decide to buy or sell carbon emission rights only when the actual benefits brought by the carbon emission rights exceed the related costs.
According to the calculation method provided by the supplementary data table for the steel production industry, the total amount of carbon dioxide emissions for the enterprise is the sum of the emissions generated from net purchased electricity and other production emissions [38]. Therefore, the relevant formula can be expressed as follows:
C c = P c × ( Q o n - g r i d + a × Q l o n g ) × γ + C b
In Equation (6), Cc is the CET cost; Pc represents the CET price; Cb is the cost of production emissions; and γ is the regional power grid emission factors.

2.2.3. TGC Market

In the future, with the continuous advancement of the renewable energy quota system, the cost advantage that has historically favored thermal power gradually diminishes. This effect becomes particularly pronounced when enterprises heavily rely on thermal power, making it challenging to fulfill their renewable energy consumption obligation. Consequently, a surge in demand for quota indicators emerges. The greater the proportion and consumption of thermal power, the greater the demand for quota indicators. When an enterprise’s renewable energy proportion falls below the government-mandated consumption obligation, the enterprise turns to purchasing green certificates in the market to fulfill its quota requirements. This action drives up the overall market demand for green certificates, thereby further increasing the price of green certificates [39]. As the price of TGC rises, so do the consumption costs for companies, impacting their operational expenses. Ultimately, when the combined cost of thermal power and TGC exceeds that of purchasing green power, enterprises opt to reduce their activity in the TGC, forming a causal feedback loop (Figure 4).
In line with the national “14th Five-Year Plan” requirements to establish and improve the market mechanisms for the consumption of renewable energy electricity, it is important to increase the marketization level of the renewable energy electricity consumption responsibility. By formulating corresponding policies and measures to guide electricity market players to actively participate in fulfilling the responsibility of renewable energy electricity consumption, the market-oriented development of renewable energy electricity consumption can be promoted. Due to the distinctiveness of certificate separation, the main trading cost for enterprises participating in the green certificate market, after deducting the consumption quota for purchasing green electricity, is the cost of purchasing additional green certificates to meet the consumption quota [32]. The relevant formula is as follows:
P T = P T 0 + q p t q s t Δ t
C T = 0 Q d e m a n d × T G C q u o t a Q g r e e n i f Q d e m a n d × β Q g r e e n < 0 i f Q d e m a n d × β Q g r e e n > 0
In Equation (7), PT is the TGC price; PT0 is the initial price of TGC; qpt is the desired purchases of TGC; and qst is the desired sales of TGC. In Equation (8), CT is the total cost; P0 represents the on-grid price; Qgreen is the enterprise’s green power purchases; TGCquota represents the renewable energy consumption quota; and β represents the integration ratio of renewable energy.
Therefore, based on the analysis above, the multi-market simulation model constructed in this paper is shown in Figure 5.

2.3. Data

To make the model as close as possible to the actual market operation process, the model’s minimum step is set to one month, with a total duration of 120 months. According to data from the State Grid Corporation of China, the average on-grid electricity price is established at 0.38 CNY/kWh. The initial prices of CET and TGC are referenced from relevant studies, set at 50 CNY/t and 0.4214 CNY/kWh, respectively [40]. In addition, according to the national policies and the data disclosed by power companies, the long-term electricity prices for thermal power and green power are set at 0.39 CNY/kWh and 0.65 CNY/kWh, respectively. Based on provincial and municipal renewable energy electricity consumption responsibility for 2022, the consumption requirement for non-hydro renewable energy is set at 11.75%. Furthermore, considering the status of the carbon market and the requirements for carbon quota allocation, the 96% carbon quotas are allocated for free. The selection of these parameters is critical for capturing realistic market behavior and enabling a meaningful scenario analysis. The regional power grid emission factor (0.6101 t/MWh) determines the indirect carbon emissions from electricity consumption, while the Power Demand per Unit of Product (550 kWh/t) and Carbon Emission Factor (1.67 tCO2/t) characterize the energy intensity and carbon footprint of steel production. The high Contractual Power Purchase Proportion (95%) reflects current industry practices where enterprises prefer stable long-term electricity arrangements. The equal distribution between green and thermal power (50% each) in medium and long-term contracts establishes a balanced baseline for evaluating different energy structure strategies. The modest Annual Growth Rate (0.91%) represents a conservative projection of industry expansion under current economic and regulatory conditions. Constant parameters crucial to the model are derived from the greenhouse gas emission verification report of a steel enterprise in Jiangsu for the year 2022, as detailed in Table 1.

3. Results

3.1. Simulation Results

This paper aims to investigate the dynamics of companies engaging in the ET, CET, and TGC markets. We first defined the simulation based on Table 1 as the base scenario (scenario 0). The entire simulation step length is divided into three stages: the early stage (Time ≤ 40), the middle stage (40 < Time ≤ 80), and the late stage (80 < Time ≤ 120).
It is observable that electricity prices undergo distinct shifts over time, characterized by phases of “remaining low—rapidly increasing—maintaining a high level” (Figure 6a). In the early stage, the electricity price is mainly affected by government macro-control, resulting in a relatively modest trend. As market liberalization advances during the middle stage, influenced by the interplay of supply and demand, electricity prices exhibit an upward trend. By the late stage, market liberalization reaches maturity, intertwined with carbon and green certificate constraints. Consequently, the electricity price tends to stabilize, driven by price transmission mechanisms across various market segments, and is projected to maintain a high level in the long term due to the model boundary conditions. The trend in the TGC price is similar to the ET, reflecting the growing demand for green certificates as the market expands, driving up prices (Figure 6c).
The overall trajectory of the CET price can be described in three stages: “significant increase—violent fluctuations—maintaining stability”. In the early stage, the carbon market experiences limited carbon allowances. As the demand for carbon allowances continually increases, the supply struggles to keep pace, causing escalating carbon prices. Subsequently, with the development of the carbon market, the supply and demand dynamics lead to pronounced carbon price volatility. In the later stage, as companies reduce the demand for carbon allowances through technological emissions reductions and energy structure adjustments, coupled with stable allowance supplies, the carbon price tends to level off.
Additionally, the electricity and market trading costs mirror the cyclical variation in monthly production (Figure 6d–f). Initially, with a 1:1 proportion of thermal to green power purchase and high proportions of free allowances, users can meet their carbon compliance obligations through these free allowances. Concurrently, low levels of renewable energy consumption alleviate pressure on users.

3.2. Future Scenarios

Enterprises participating in multi-market transactions are mainly influenced by two types of trading strategies: one is the market participant decision-making behavior influenced by the parameters of the CET and TGC systems established by the government; the other is the enterprise’s own trading behavior, which can significantly affect its market participation efficacy. Therefore, this section undertakes a sensitivity analysis, utilizing the enterprise’s market trading behavior under the RPS and CET system, to explore the variations in the enterprise’s market trading costs under synergistic effects. This is mainly achieved through an examination of the impact of changes in contract proportion (scenario A), thermal power proportion (scenario B), and the proportion of free carbon allowances (scenario C) on the costs associated with market transactions. These three scenarios were carefully selected to represent the most critical factors affecting steel enterprises’ market behaviors. Scenario A examines the contract proportion, as it directly influences price stability and risk exposure in electricity procurement. Scenario B focuses on thermal power proportion, because it represents a fundamental trade-off between economic costs and environmental compliance for steel enterprises. Scenario C investigates changes in free carbon allowances, as this policy instrument significantly impacts carbon compliance costs and is expected to undergo substantial adjustments as markets mature. The ranges of [0, 1] for each parameter allow us to comprehensively examine the full spectrum of possible scenarios, from complete absence to the full adoption of each strategy, thereby enabling a robust sensitivity analysis and providing practical guidance for decision-makers. The parameters for these scenarios are set as follows Table 2:

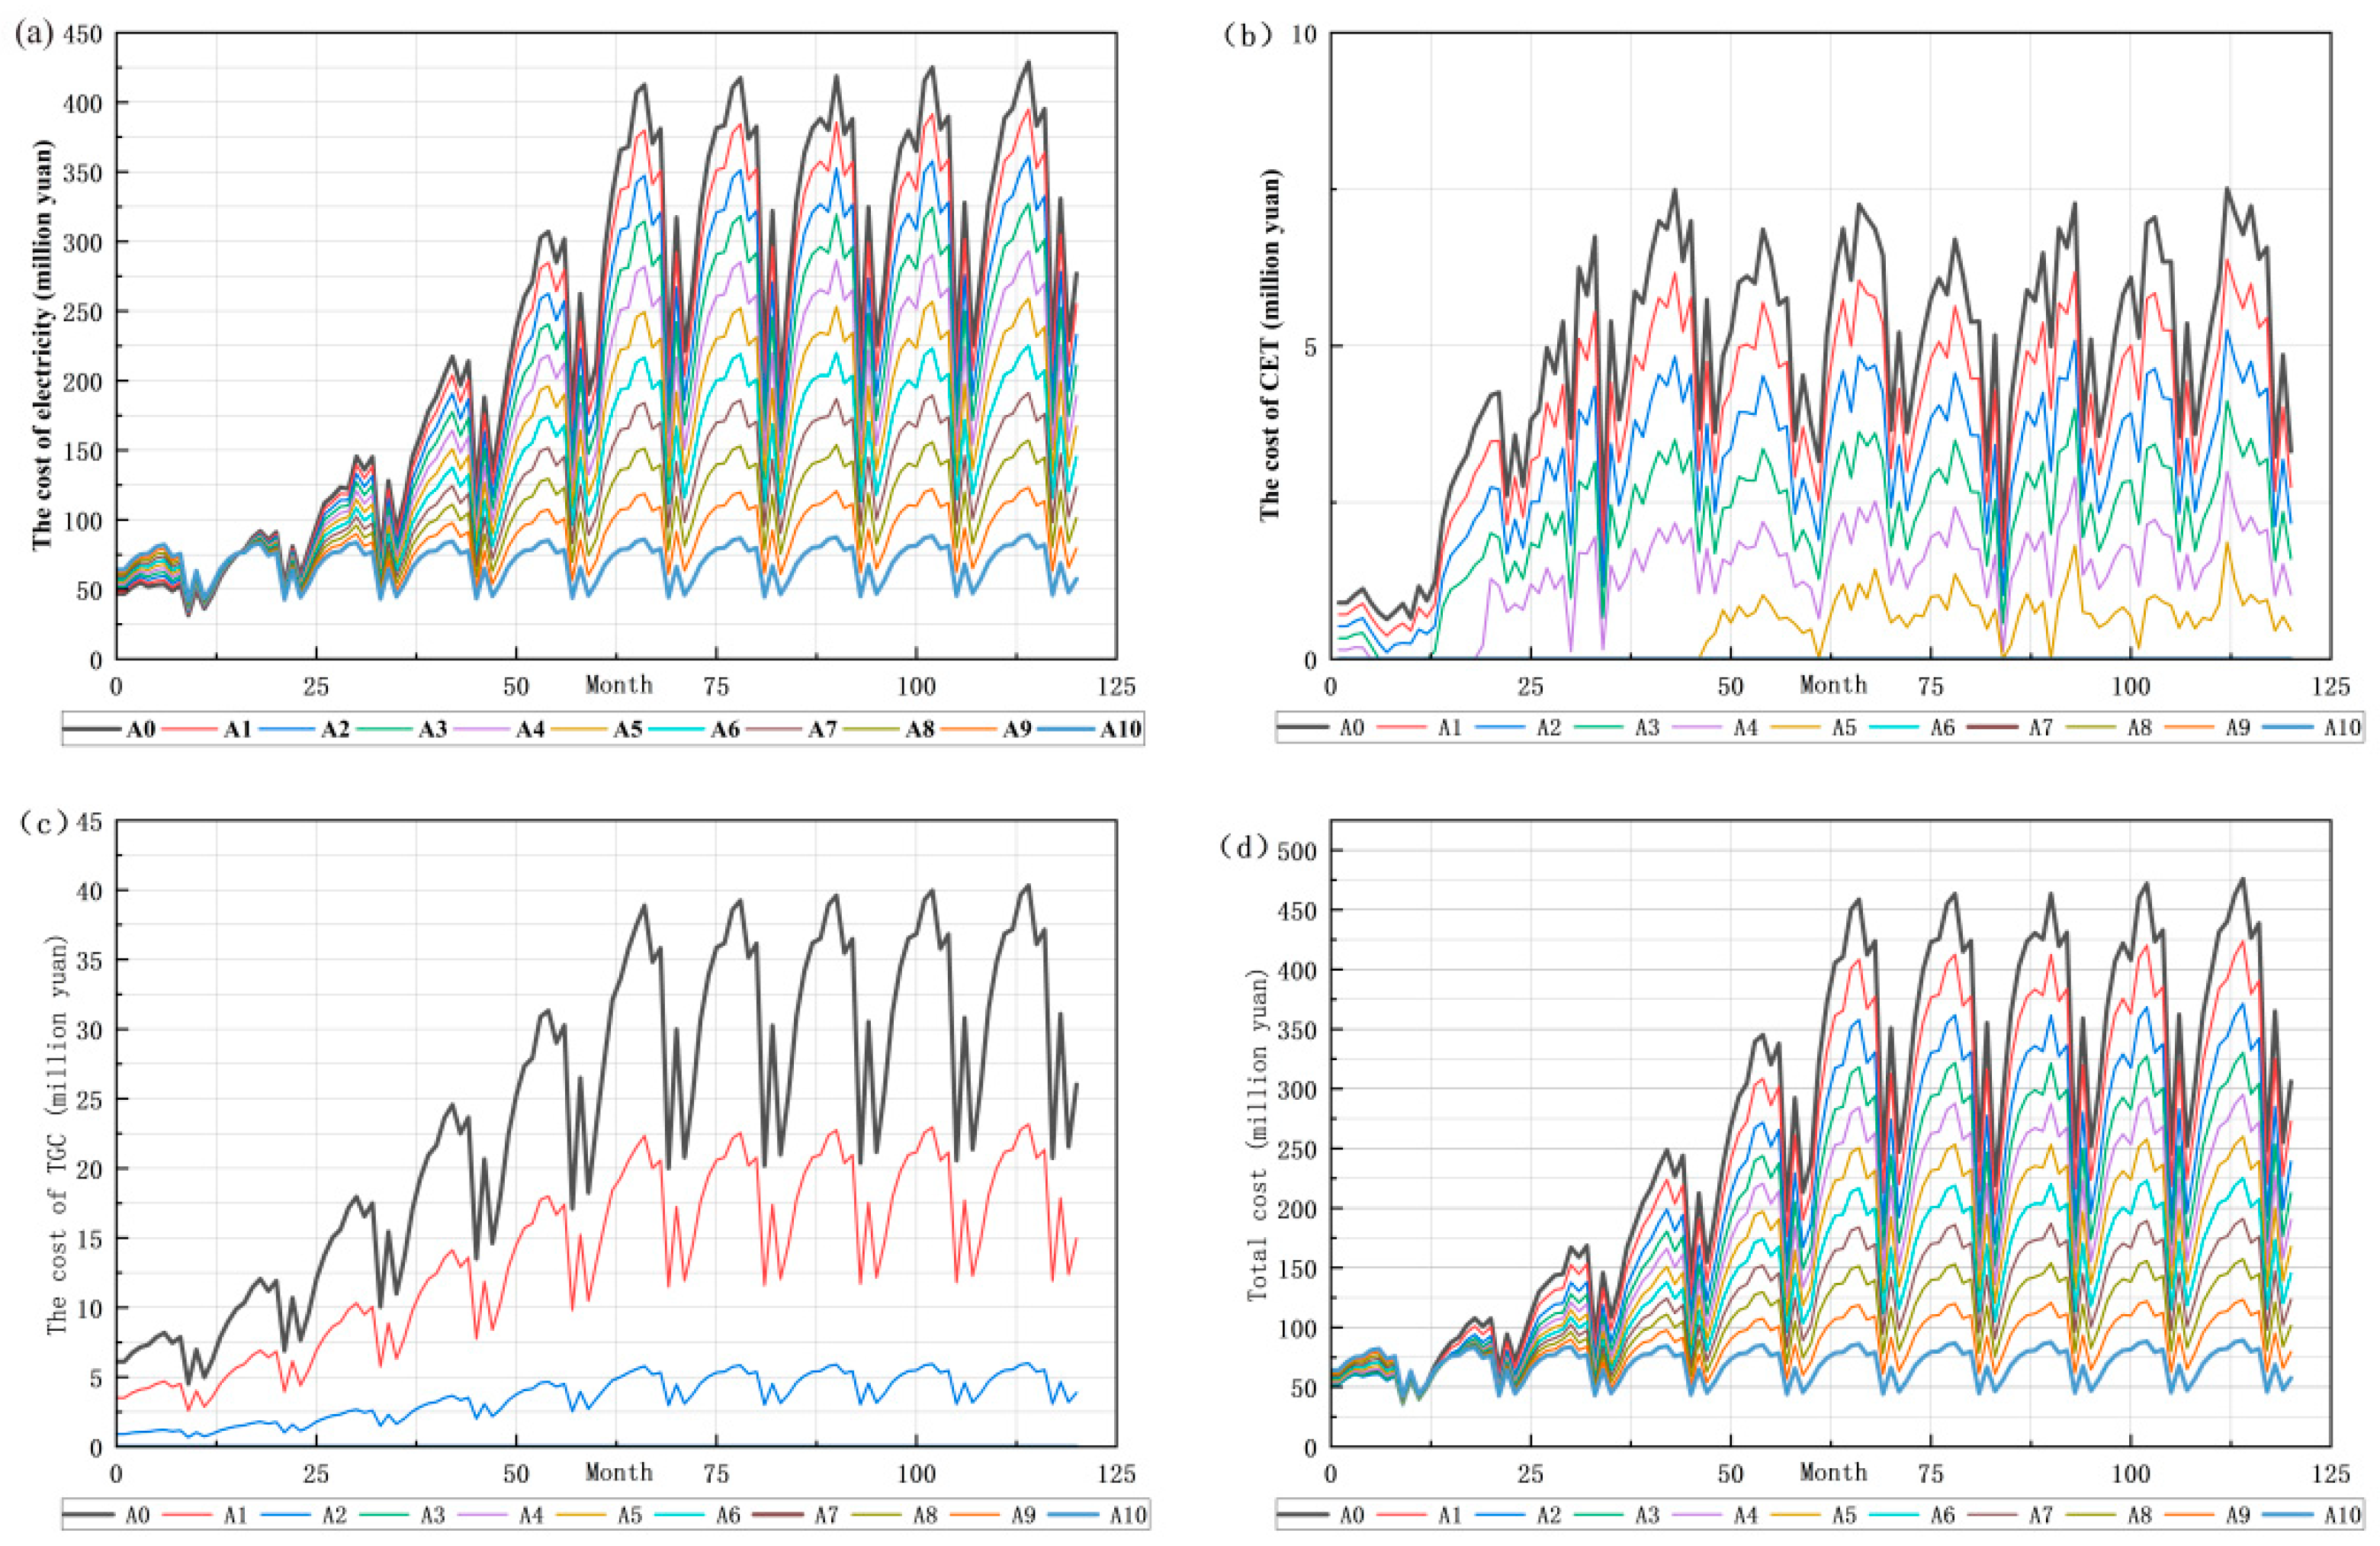
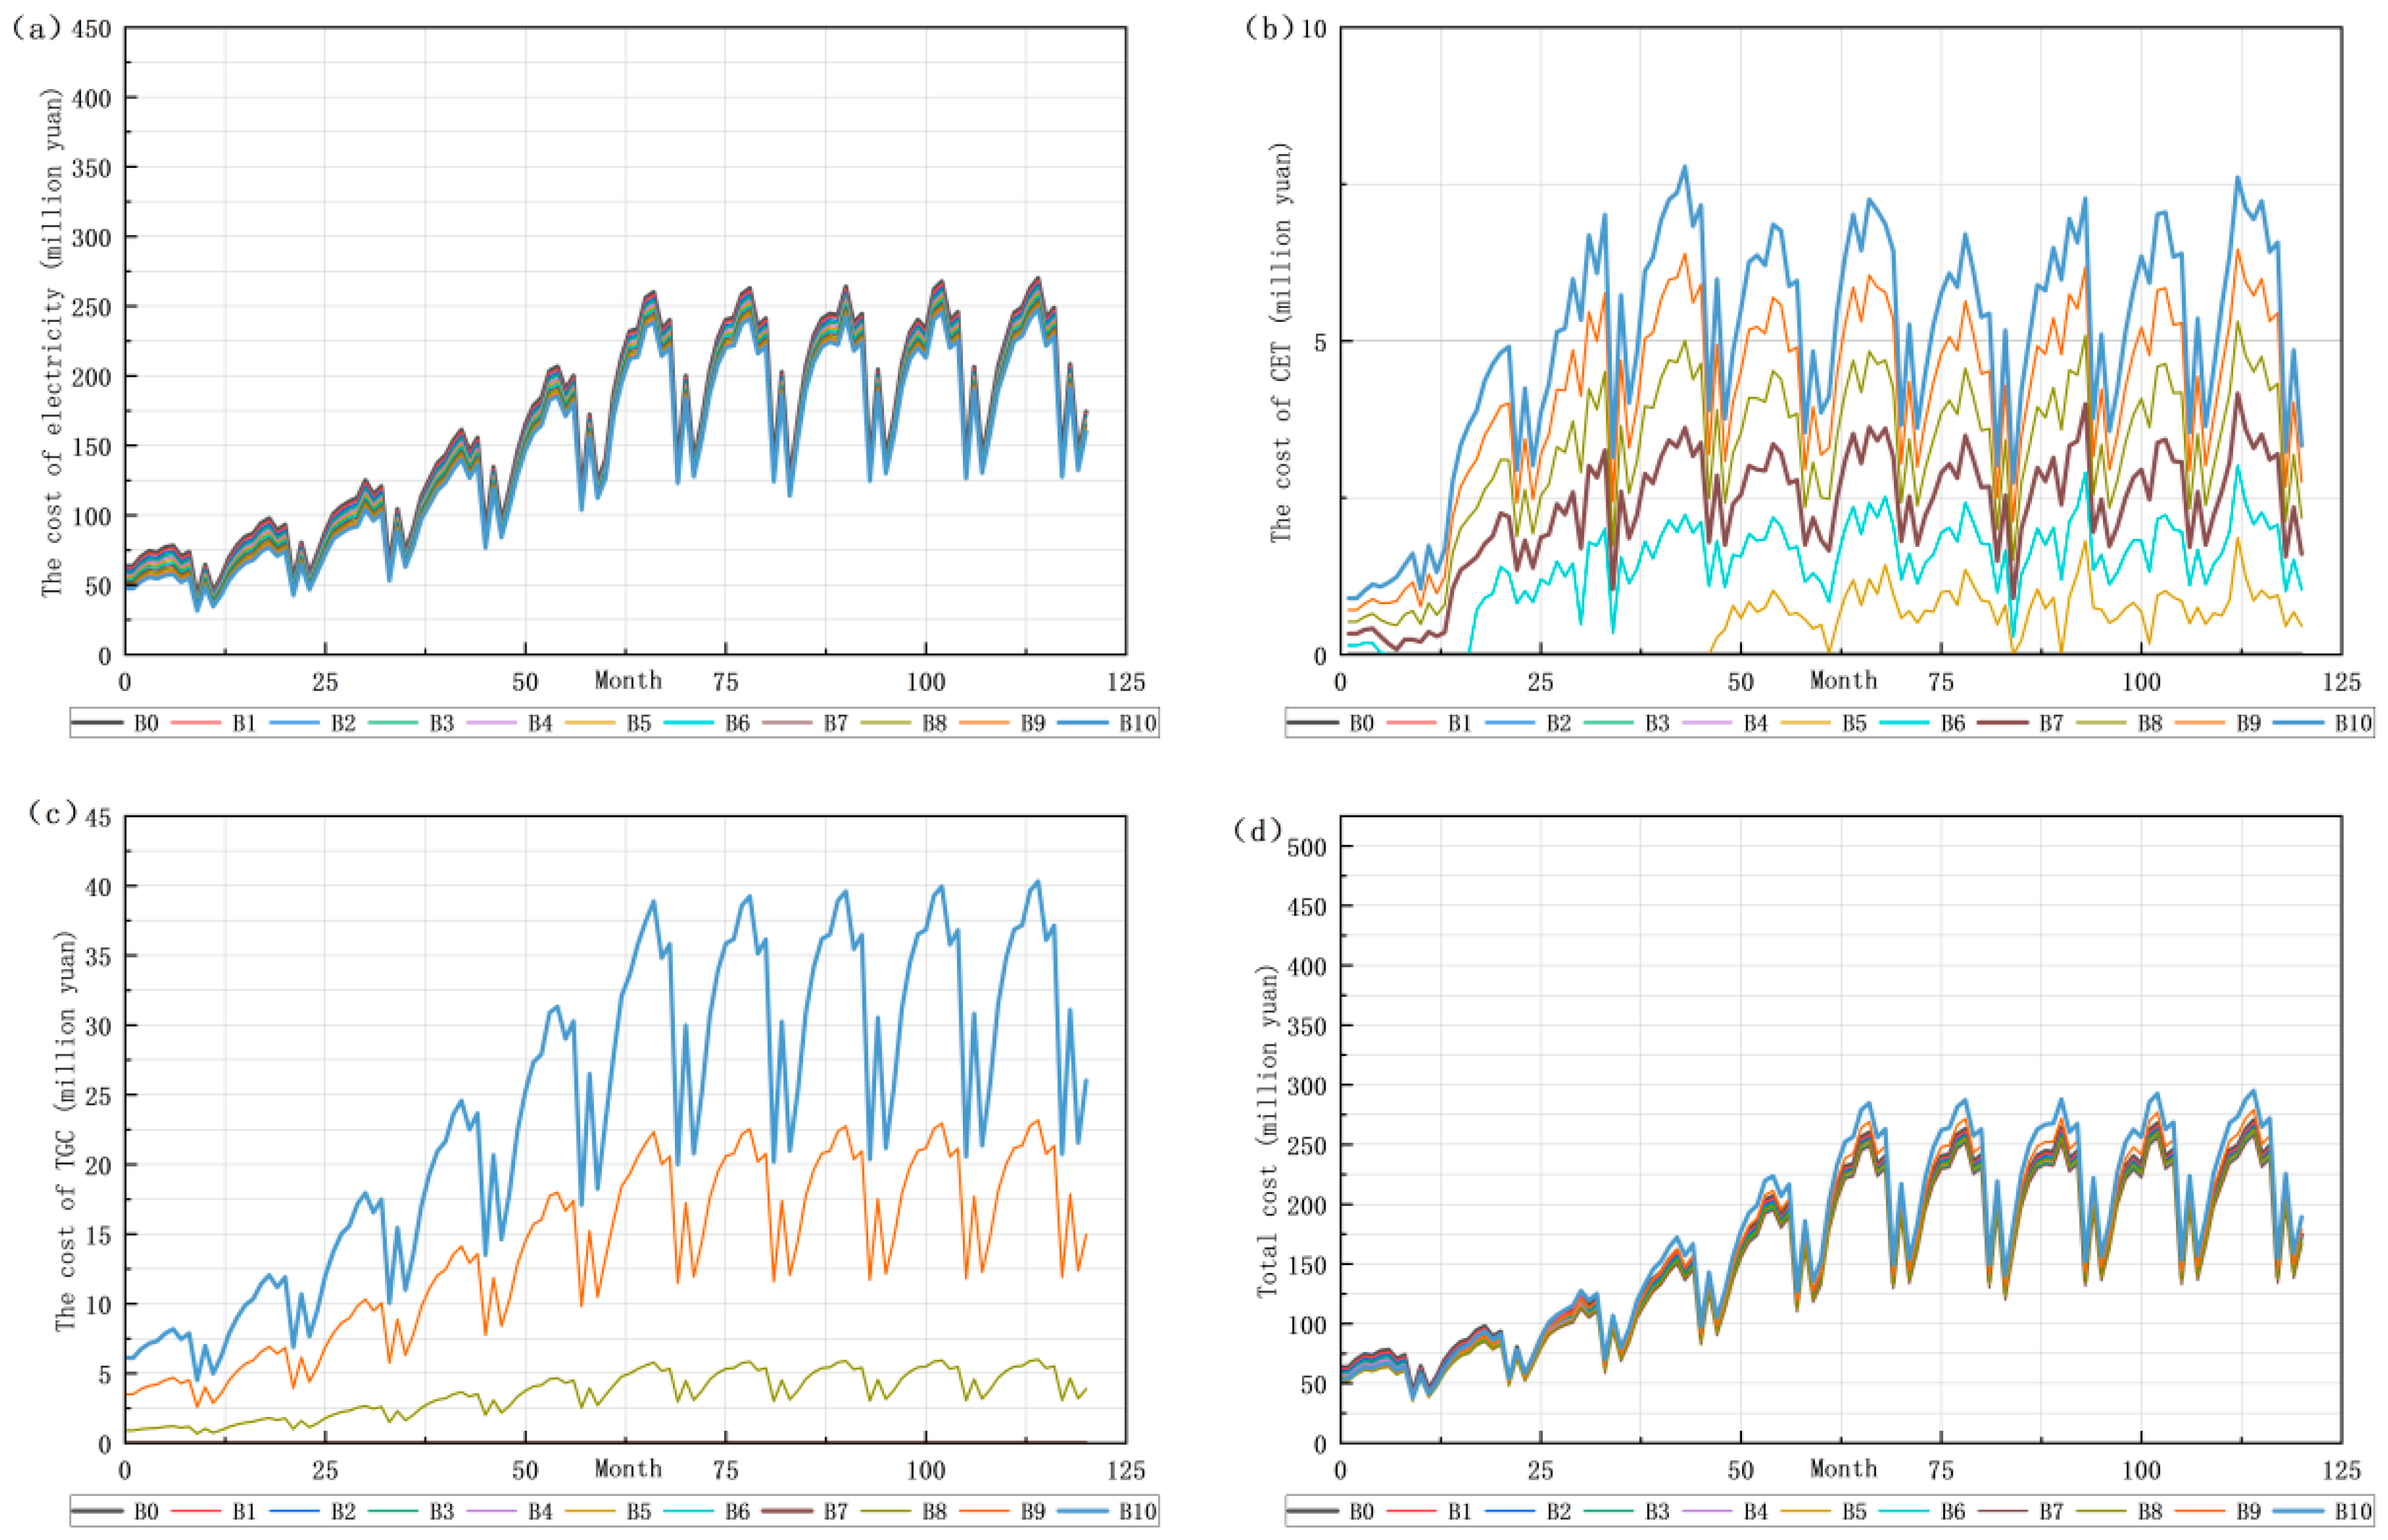
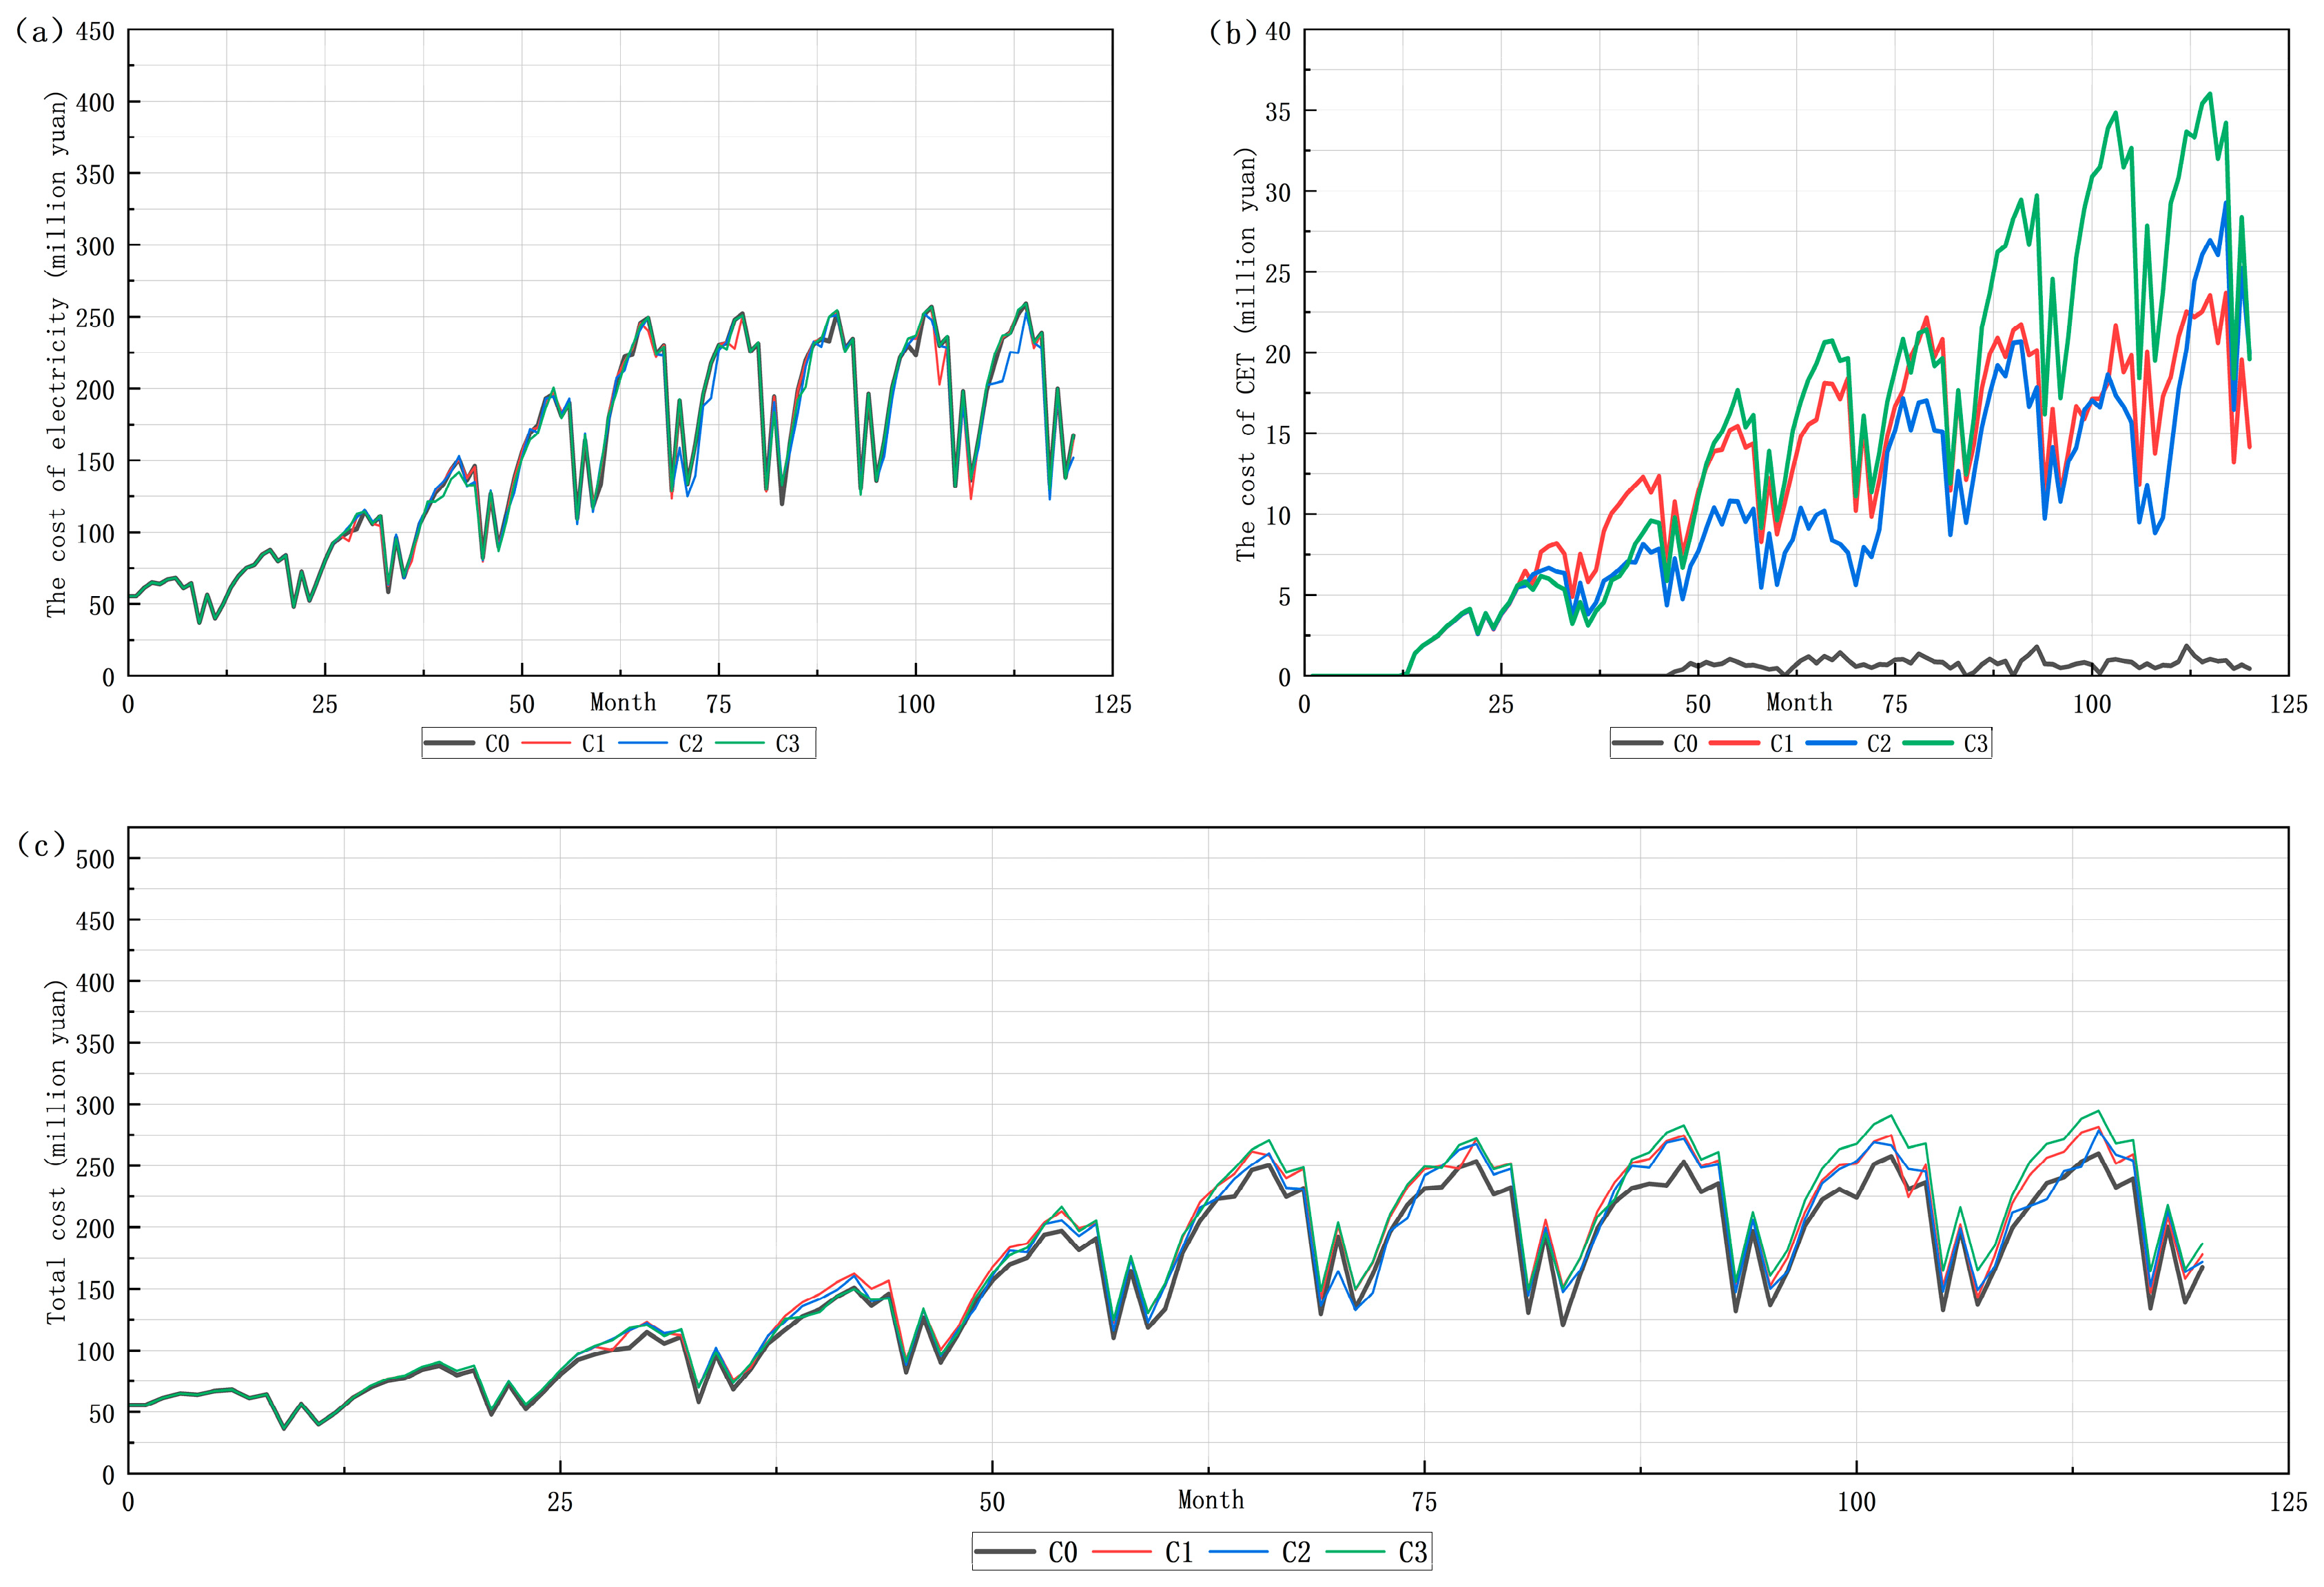
3.2.1. Single Scenario

(1) Transaction contract proportion scenario
The National Development and Reform Commission and the National Energy Administration issued a notice on “Doing a Good Job in the Signing and Performance of Medium- and Long-Term Power Contracts for 2025”, requiring that the proportion of signed electricity volume in medium- and long-term contracts on the demand side should not be less than 80% of the expected annual grid-connected electricity volume from coal-fired power plants in the region after considering the annual balance of electricity consumption and generation. Furthermore, through subsequent contract signing, it is ensured that the proportion of signed electricity volume in medium- and long-term contracts is not less than 90% of the actual grid-connected electricity volume. Based on the above policy requirements, we studied the cost variation trends under different scenarios where the proportion of medium- and long-term contract electricity volume to spot electricity volume for steel enterprises changes from 0% to 100%, with a minimum change ratio of 10%. Therefore, by adjusting the proportion of electricity volume that enterprises participate in the electricity spot market and the medium- and long-term contract market, we set up trading scenario A for changes in medium- and long-term contracts, analyzing the cost variation trends of enterprises under different proportion scenarios. The corresponding scenario models are A0 (0%), A1 (10%), …, A10 (100%), and the relevant results are shown in Figure 7.
The results indicate that the ET cost exhibits a cyclical pattern, in line with production changes in enterprises. Peaks and troughs in the curves under scenario A correspond with the monthly production levels of enterprises. As the proportion of medium- and long-term contracts increases, the variability in the ET cost of businesses in the later stages becomes more pronounced. This may primarily be due to the initially small difference between spot and medium- and long-term electricity prices, meaning adjustments in the proportion of spot to medium- and long-term purchases have a minor impact on the ET cost of a business. Additionally, in the initial phase, due to lower spot prices, increasing the medium- and long-term purchase proportion could even lead to higher purchasing costs. As shown in scenario A0, where the spot proportion of the enterprise is 100%, it is significantly affected by future electricity price changes, placing the subsequent electricity cost at a high position. Conversely, in scenario A10, where the enterprise’s medium- to long-term electricity purchase proportion is 100%, the ET cost primarily responds to the contract prices; hence, the trend in cost changes becomes rather stable.
In terms of the CET cost, it is evident that heightened contract proportion correspond to diminished CET costs for the enterprise. This correlation stems from the inherent preservation of the enterprise’s energy structure, wherein raising the proportion of medium- and long-term contract power purchases increases the purchase of green electricity, thereby reducing net power carbon emissions. As shown in scenarios A6 to A10, once the proportion reaches or exceeds 60%, enterprises can rely on free carbon quotas to meet their obligations, thereby nullifying their CET expenses.
Looking at the TGC cost, only in scenarios A0, A1, and A2 are such costs incurred. This peculiarity arises from the restrictive consumption of renewable energy by enterprises at lower medium- and long-term contract proportions, thereby impeding compliance with renewable energy consumption obligations and consequently incurring TGC costs.
Overall, in the cost associated with market transactions for users, electricity costs are the main expense, followed by CET costs and TGC costs. Early market transactions demonstrate a lack of discernible advantages in medium- and long-term power trading, thus culminating in elevated electricity expenses and overall trading costs. However, in the middle and later stages of market transactions, as spot electricity prices continue to rise and medium- and long-term contract prices increasingly offer a cost advantage, the cost of purchasing electricity is lower. As the contract proportion rises steadily, total enterprise costs initially surge before subsiding, a trend that is highly consistent with the changes in electricity costs.
(2) Green electricity proportion scenario
The price of green electricity is higher than that of the thermal power; purchasing green energy at a high price could exacerbate the cost of electricity for users. Thus, scenario B involves adjusting the proportion of green energy in medium- and long-term contract purchases to analyze cost fluctuations as enterprises engage in a diversified market. Scenario B sets up a trading environment where the proportion of medium- and long-term thermal power contracts changes, allowing for the analysis of the cost trends under different proportions of thermal to green energy. To facilitate the analysis, the proportion of spot to medium- and long-term power purchases in Scenario B is fixed at 0.5. Simultaneously, the proportion of thermal power purchased by the users is increased from 0% to 100%, with increments of 10%. The corresponding scenario modes are B0 (0%), B1 (10%),…, up to B10 (100%).
The results show that, with the proportion of spot purchase and contract purchase remaining constant, the cost of spot purchases remains stable. Therefore, the changes in the cost of electricity purchases under this scenario are primarily driven by the proportion of thermal power to renewable energy. As the proportion of thermal power in the medium and long term continues to increase, the cost of an enterprise’s contract power transactions will decrease slightly. This decline can be attributed to the fact that in the medium- and long-term contract transaction market, the price of thermal power is significantly lower than that of green power. Consequently, increasing the proportion of thermal power will reduce the cost of contract power purchases, albeit with a limited impact on power transaction costs (Figure 8a).
Analyzing the changes in CET costs reveals that the higher the proportion of medium- to long-term contract electricity purchases relative to spot electricity purchases, the greater the costs for enterprises participating in the CET market (Figure 8b). In scenarios B0 to B10, only scenarios B0 to B4 do not incur CET costs. The main reason is the high proportion of green electricity, which has green electricity attributes; therefore, when enterprises calculate their carbon emissions, they do not include indirect carbon emissions, resulting in relatively low indirect carbon emissions for the enterprises. However, as the proportion of coal-fired power increases, the net carbon emissions from electricity purchases by enterprises also rise. When the carbon emissions of an enterprise exceed its free allocation, carbon trading is required, leading to the generation of CET costs.
From the perspective of TGC costs (Figure 8c), under scenarios B0 to B10, TGC costs are only incurred in scenarios B8, B9, and B10. Moreover, the cost of TGC increases significantly as the proportion of thermal power rises. This is primarily because an increased proportion of thermal power leads to a corresponding reduction in the enterprise’s renewable energy consumption. Eventually, when the consumption is unable to meet the demand, the enterprise must purchase green certificates, thus incurring TGC costs.
In summary, the purchase of electricity constitutes the primary cost in the total cost, followed by CET costs and TGC costs. In the early stages of market transactions, changes in an enterprise’s total costs are relatively minor, and an excessively high or low proportion of thermal power cannot guarantee the lowest total cost. However, in the middle and late stages of market transactions, as the proportion of thermal power continues to rise, total costs noticeably increase. Therefore, for enterprises, maintaining a high utilization rate of thermal power will significantly increase the market transaction costs in the later stages. Compared to scenario A, the change in total costs in scenario B is smaller. Therefore, to achieve cost optimization, enterprises need to first determine the appropriate proportion of spot to medium-to-long-term contracts, then optimize their energy structure, and finally propose a trading strategy that takes into consideration both economic and environmental benefits.
(3) Free quota proportion trading scenario
Influenced by emission reduction policies, the future trajectory suggests a further strengthening of carbon emission reduction constraints, amplifying the proportion of carbon emission reduction costs in multiple market transaction costs. Traditional studies on free carbon quotas mostly adopt the method of static assumptions, typically assuming a fixed proportion of free carbon quotas. As the carbon market evolves, the proportion of free quotas will gradually decrease; thus, assuming the proportion of free quotas to change over time is more reasonable. Scenario C is mainly divided into four types of scenarios for discussion: C0 maintains the current proportion of carbon quota without gradual increments over time; C1 decreases the quota proportion to 75% after 10 years; C2 reduces the quota proportion to 50% after 10 years; C3 sets the proportion of free quotas to zero after 10 years. Based on this, the analysis delves into the cost implications for users participating in the multilateral market due to changes in the proportion of free carbon quotas (Figure 9).
The results show that as the carbon quota constraints continue to increase, there are slight changes in the electricity cost of enterprises. The main reason is that the demand for spot electricity is affected by the carbon price, reflecting the conduction effect of carbon price fluctuation on the power demand. In the later stages of market development, as the proportion of free quotas is reduced, the trend in carbon emission reduction costs becomes more distinct, leading to a significant increase in market transaction costs. Simultaneously, stronger carbon quota constraints correspond to a larger growth rate in the enterprise’s CET costs. Under scenario C0, if the market operates with a quota proportion of 96% for ten years, the CET cost will be relatively low, which does not align with the actual situation where carbon quota restrictions are gradually reduced.
Under scenarios C1, C2, and C3, the proportion of free quota decreases to 75%, 50%, and 0 within ten years. In the early stages of market development, the high proportion of free quotas results in the electricity cost being the main component of enterprise market transaction costs; therefore, this leads to relatively lower CET costs in these three scenarios. However, as the quota proportion shrinks, the CET costs of the enterprise gradually increase, eventually becoming the main component of the total costs. In scenarios C1, C2, and C3, the CET costs begin to rise rapidly, and they have a higher growth trend with the quota reduction.
In conclusion, under the premise of maintaining power contract proportions and energy structures, the continuous reduction in the proportion of free quotas poses challenges to meet user’s carbon compliance through carbon trading alone. This is because the CET costs of enterprises outweigh the electricity costs, which is not conducive to the development of the enterprise. As the market evolves, the price advantage of thermal power will gradually diminish, emerging as a primary driver for the increase in enterprises’ CET costs.

3.2.2. Comprehensive Scenario

This study aims to explore scenarios wherein enterprises engage in simultaneous trading across the ET-GET-TGC multivariate markets, namely electricity, carbon, and green certificate coupled markets. In this multi-market coupled trading scenario, users follow the “cost minimization” principle for market trading decisions. Through the price conduction mechanism among markets, users can adjust the transaction volumes of electricity, carbon quota, and green power in a timely manner. Therefore, considering dynamic market coupled trading, users’ total transaction costs are expected to decrease. The main cost of enterprises participating in multi-market transactions is the expense of purchasing electricity, and the allocation of the energy type and electricity demand should aim to minimize the total cost of the enterprise.
Based on the sensitivity analysis results of various influencing factors in Section 3.2.1, the main factors affecting enterprise market transactions can be broadly divided into two aspects. Firstly, the enterprise’s own trading strategy significantly impacts the market transaction cost, by adjusting the proportion of medium- and long-term contracts and the proportion of thermal power contracts. Secondly, external factors such as the national development planning goals, the free carbon quota, and renewable energy consumption constraints, will gradually strengthen the enterprise’s market transaction costs. Therefore, this paper will take into consideration both the enterprise’s trading strategy and policy changes on future market transactions, thus setting up a comprehensive transaction scenario D for enterprises. According to the results of scenario A, it becomes evident that the higher the contract proportion, the lower the user’s market transaction costs. To ensure the safety of enterprise production, the contract proportion is set at 95%, with the remaining 5% of the power being supplemented through the spot market and allocated flexibly. Moreover, scenarios B and C reveal that the changes in the proportion of thermal power contracts will indirectly affect the enterprise’s CET and TGC costs. Therefore, scenario D is further divided into D1, D2, D3, D4, and D5, with thermal power contract proportions set at 0%, 25%, 50%, 75%, and 100%, respectively. Meanwhile, referencing the pace of the European Union’s free quota reductions, the proportion of free quotas is gradually reduced at a rate of 2.2% per year, ultimately reaching 75% after ten years, while the weight of the renewable energy consumption obligation gradually grows to 25% (Figure 10).
In scenario D, as the proportion of thermal power in enterprises continues to increase, the cost of purchasing electricity decreases continuously, while the cost of carbon reduction increases continuously. When the proportion of medium- and long-term thermal power exceeds 75%, it is difficult to meet renewable energy consumption solely through green power purchases, leading to the generation of TGC costs.
Analyzing the trend in total costs reveals that at the initial stage of market development, higher proportions of thermal power correlate with lower enterprise total costs. Throughout the middle stage, enterprises maintain lower total costs in scenario D4. However, in scenario D5, the gradual increase in TGC costs results in a progressive increase in total costs, maintaining a relatively high level in the mid-to-late stage. By the late stage, enterprises still maintain a lower total cost in scenario D4. Nevertheless, at certain troughs, the total cost in the D3 scenario reach the lowest level. As the proportion of thermal power continuously decreases, the total cost gradually decreases as well. At this time, the market is increasingly constrained by the consumption of renewable energy, indicating a decline in market transactions involving thermal power.
Therefore, in the initial stages of market transactions dominated by electricity costs, increasing the purchase of thermal power proves to be beneficial in cost reduction. During the middle stage of market development, ensuring a high proportion of thermal power helps sustain total costs at a lower level. However, total costs may increase with higher carbon prices. In the late stage, gradually decreasing the use of thermal power can effectively keep the total market costs of enterprises at a lower level, given the dramatic fluctuations in carbon prices and the constraints of renewable energy consumption.

4. Discussion

China has proposed numerous policies and measures to achieve its carbon neutrality goal. It is essential to employ both technological advancements and market mechanisms to reduce carbon emissions. Utilizing market instruments (i.e., carbon market and green certificate market) to reduce carbon emissions from high-energy-consuming enterprises is currently one of the most effective measures. Nowadays, the national carbon market trading platform in China has been established, with the power industry being the first batch of pilot industries, and industries such as steel will gradually enter the second batch of pilots [38]. To evaluate the path of carbon reduction in the steel industry through market mechanisms in the future, we employed a system dynamics method to establish a tripartite market coupling model of “ET-CET-TGC” markets. This model aims to analyze the trading behavior of the steel industry after joining the carbon market and green certificate market, as well as the impact on the carbon reduction costs of enterprises.
This study simulates the price transmission mechanisms between the electricity market, carbon market, and green certificate market. The research results indicate that future electricity market prices may show a trend of “initially low and then high”, while carbon market prices may experience “sharp fluctuations” before stabilizing. Additionally, the price fluctuation trend of green certificates will closely follow changes in the carbon market. Therefore, steel companies should adjust their trading strategies at different market price stages to cope with potential market fluctuations and reduce costs. These findings are consistent with those of Chang [40] and Xu [24].
One of the main topics of this article is how the steel industry can meet its carbon emissions commitments and renewable energy consumption responsibilities at a minimal cost when it enters both the carbon market and green certificate market soon. Our model focuses on analyzing the changes in three key parameters in the coupled markets: the proportion of medium- and long-term electricity transactions, the proportion of green electricity, and the ratio of free quotas. We examine their impacts on the cost reduction for enterprises in emissions.
In the current energy consumption landscape, a higher proportion of medium- and long-term electricity contracts correlates with lower market trading costs for enterprises. Adjusting the energy consumption structure of an enterprise reveals that with a higher initial proportion of thermal power, market trading costs decrease initially and increase later. Additionally, a scenario where the proportion of free quotas gradually decreases aligns with future Chinese policies. As the quota ratio diminishes, the CET costs for enterprises gradually rise, eventually becoming the primary component of total costs.
Although this study provides valuable theoretical guidance for the trading strategies of steel enterprises in a multi-market coupling context, there are still certain limitations. First, with the continuous changes in the policy environment, new policy documents may be introduced that could impact market transactions in high-energy-consuming industries such as the steel industry. For example, future policies may impose stricter limits on carbon emissions or readjust carbon quota allocations, which will impose new constraints on the trading behavior of steel enterprises. Therefore, future research should pay more attention to the adaptability and flexibility of steel enterprises in an uncertain policy environment.
Second, the system dynamics model used in this study still has limitations in its modeling boundaries. The current model is based on existing multi-market simulations and does not fully encompass all possible factors that could influence market changes, such as technological innovation and changes in market structure. As research on multi-market coupling deepens, future simulation models could more comprehensively incorporate additional dynamic factors and uncertainties, enhancing the model’s representativeness and practical value. This will help provide more precise decision-making references for steel enterprises and policymakers.

5. Conclusions

This study explored the market trading strategies of steel enterprises in the context of the coupling scenarios of the carbon emission trading market (CET), the electricity market (ET), and the green certificate market (TGC). By adjusting the medium- and long-term electricity trading ratio, the heat and power ratio, and the carbon quota constraints, this paper revealed how steel enterprises can reduce market trading costs by optimizing trading strategies in a multi-market coupling context.
We simulated the synergistic effect among the ET, CET, and TGC markets and specifically analyzed the transmission mechanism of different prices among the three markets. The results show that future electricity prices will show a pattern of “remaining low—rapidly increasing—maintaining a high level”, and carbon prices are expected to demonstrate an overall trend characterized by three stages: “significant increase—violent fluctuations—maintaining stability”. The trend in green certificate prices is essentially like that of the ET. In summary, the main conclusions of this paper are as follows:
First, this study shows that by increasing the proportion of medium- and long-term electricity trading, steel enterprises can effectively reduce market transaction costs, especially in the initial stages. At the same time, as the proportion of thermal power is gradually adjusted, companies can achieve further cost optimization. Specifically, in the early stages of steel enterprises participating in a diversified market, relying on a higher proportion of thermal power helps to reduce costs, while after the market gradually matures, reducing dependence on thermal power can continue to maintain lower transaction costs.
Second, steel companies can reduce future market transaction costs by increasing the proportion of medium-to-long-term contracts and the purchase ratio of green electricity. Moreover, the lower the proportion of free quotas, the more evident the trend in increased costs in the carbon market transactions in the later stages. Overall, for high-energy-consuming steel companies participating in multi-market transactions, increasing the procurement of thermal power in the initial stage proves advantageous in cost reduction. As market development progresses, maintaining a high proportion of thermal power ensures that the total transaction costs remain comparatively low. In the later stage, gradually reducing the reliance on thermal power for enterprises helps sustain lower transaction costs for market engagement.
Finally, as the proportion of carbon quotas gradually decreases, the trading costs for steel companies in the carbon market are gradually rising, becoming an important component of overall costs. Especially in the context of future policies potentially reducing free quotas, steel companies need to closely monitor quota adjustments and flexibly adjust their carbon trading strategies based on market changes to effectively control costs.
In summary, this study offers theoretical support for optimizing market trading strategies of steel enterprises in the context of multi-market coupling. The scientific originality of this research lies in our application of system dynamics modeling to analyze steel enterprise trading behaviors in coupled markets. By focusing on enterprise-level strategies rather than macro-level mechanisms, and by incorporating dynamic market development stages instead of static assumptions, we provide novel insights into how high-energy-consuming industries can optimize their participation across interconnected markets. The findings provide practical insights into transaction behavior for emitting enterprises participating in market transactions. Although the model has certain limitations within the current research framework, as market mechanisms continue to improve and policies gradually evolve in the future, the relevant research findings will provide more scientific decision-making references for the low-carbon transition and sustainable development of the steel industry.

Author Contributions

Conceptualization, W.L. and Z.C.; Methodology, S.X.; Validation, Z.L.; Data curation, Y.W. and X.Z.; Writing—original draft, Z.P.; Writing—review & editing, J.G. All authors have read and agreed to the published version of the manuscript.

Funding

This paper is supported by the Science and Technology Project of State Grid Co., Ltd. (Project No.: 5108-202357061A-1-1-ZN).

Data Availability Statement

The original contributions presented in this study are included in the article. Further inquiries can be directed to the corresponding author.

Conflicts of Interest

Authors: Xiaoxuan Zhang and Song Xue are employed by the State Grid Energy Research Institute; the remaining authors declare that the research was conducted in the absence of any commercial or financial relationships that could be construed as a potential conflict of interest.

References

  1. Zhang, W.; Xu, Y.; Streets, D.G.; Wang, C. Can new-type urbanization realize low-carbon development? A spatiotemporal heterogeneous analysis in 288 cities and 18 urban agglomerations in China. Clean. Prod. 2023, 420, 138426. [Google Scholar] [CrossRef]
  2. Li, X.T.; Wang, J.; Cao, J.L. The Practical Experience of Low-Carbon Economic Development in the European Union and its Implications for China. Intertrade 2023, 62–74. [Google Scholar] [CrossRef]
  3. Georgios, X.; Evelina, T. Empirical testing of the visualizations of climate change mitigation scenarios with citizens: A comparison among Germany, Poland, and France. Glob. Environ. Change 2021, 70, 102324. [Google Scholar]
  4. Habib, M.A.; Nemitallah, M.A.; Afaneh, D.A. Numerical investigation of a hybrid polymeric-ceramic membrane unit for carbon-free oxy-combustion applications. Energy 2018, 147, 362–376. [Google Scholar] [CrossRef]
  5. Zheng, C.; Zhang, Y.F.; Long, L.J. Study on National Principal Energy Consumption Structural Modulation and Optimization in New Era. Coal Geol. China 2021, 33, 49–51. [Google Scholar]
  6. Chen, H.L.; Yang, X.K.; Wang, Z.B. The impact of Digital Economy on the Industrial Carbon Emission intensity and its Spillover Effect. Res. Environ. Sci. 2023, 1–20. [Google Scholar]
  7. Xu, X. Examining the impact of global uncertainty shocks on the digital economy’s role in China’s energy transition and green economic recovery. Econ. Chang. Restruct. 2024, 57, 184. [Google Scholar] [CrossRef]
  8. Feng, T. Price Discovery Function Research on EU Carbon Emission Futures Market. Trade Fair Econ. 2024, 19–22. [Google Scholar]
  9. Bayer, P.; Aklin, M. The European Union Emissions Trading System reduced CO2 emissions despite low prices. Proc. Natl. Acad. Sci. USA 2020, 117, 8804–8812. [Google Scholar] [CrossRef]
  10. Xu, L.; Yang, J. Carbon pricing policies and renewable energy development: Analysis based on cross-country panel data. J. Environ. Manag. 2024, 366, 121784. [Google Scholar] [CrossRef]
  11. Wang, X.P.; Wang, X.P. Research on the Dependence Structure and Risk Spillover Effect Between EU and Domestic Carbon Trading Market. J. Ind. Technol. Econ. 2021, 40, 72–81. [Google Scholar]
  12. Jiang, Y.; Cao, H.; Yang, L.; Fei, F.; Li, J.; Lin, Z. Mechanism Design and lmpact Analysis of Renewable Portfolio Standard. Autom. Electr. Power Syst. 2020, 44, 187–199. [Google Scholar]
  13. Jiang, Y.W.; Chen, W. Review and Prospect of Coupled Electricity-Carbon-Renewable Portfolios Trading. Electr. Power Constr. 2023, 44, 1–13. [Google Scholar]
  14. Huang, C.; Yan, Z.; Chen, S.; Yang, L.; Li, X. Two-stage market clearing approach to mitigate generator collusion in Eastern China electricity market via system dynamics method. IET Gener. Transm. Distrib. 2019, 13, 3346–3353. [Google Scholar] [CrossRef]
  15. Chi, Y.Y.; Zhao, H.; Hu, Y.; Yuan, Y.K.; Pang, Y.X. The impact of allocation methods on carbon emission trading under electricity marketization reform in China: A system dynamics analysis. Energy 2022, 259, 125034. [Google Scholar] [CrossRef]
  16. Chinese National Committee of CIRED. CICED 2022 Conference Proceeding. In Proceedings of the China International Conference on Electricity Distribution (CICED), (2022), Changsha, China, 7–8 September 2022; pp. 1–1825. [Google Scholar]
  17. Xu, W.; Jiang, C.; Jia, K.; Yu, X. Did the "double carbon" policy improve the green total factor productivity of iron and steel enterprises? A quasi-natural experiment based on carbon emission trading pilot. Front. Energy Res. 2023, 11, 1307347. [Google Scholar] [CrossRef]
  18. Zhang, C.; Zhang, X. Climate responsibility optimization model for the cooperative game between steel sector and consumer side in China. J. Clean. Prod. 2022, 370, 133592. [Google Scholar] [CrossRef]
  19. Zhu, X.H.; Li, S.M.; Zeng, A.Q. A review and prospect of research on carbon emissions from the criticametal industry chain under clean energy transition. Resour. Sci. 2023, 45, 1–17. [Google Scholar]
  20. Ewa, C.P.; Anna, S.; Dariusz, S. The Potential and Development of the Geothermal Energy Market in Poland and the Baltic States-Selected Aspects. Energies 2022, 15, 4142. [Google Scholar] [CrossRef]
  21. Yang, S.; Wang, M. Study on the mechanism of green power-carbon market intrinsic coupling and power sector trading strategies. Renew. Sustain. Ener. 2024, 16, 65902. [Google Scholar] [CrossRef]
  22. Gu, Y.; Liu, W.; Wang, B.; Tian, B.; Yang, X.; Pan, C. Analysis and Prediction of Energy, Environmental and Economic Potentials in the Iron and Steel Industry of China. Processes 2023, 11, 3258. [Google Scholar] [CrossRef]
  23. Zhou, S.; Gu, A.; Tong, Q.; Guo, Y.; Wei, X. Multi-scenario simulation on reducing CO2 emissions from China’s major manufacturing industries targeting 2060. Ind. Ecol. 2022, 26, 850–861. [Google Scholar] [CrossRef]
  24. Xu, L.; Zhao, X. The synergistic effect between Renewable Portfolio Standards and carbon emission trading system: A perspective of China. Renew. Energy 2023, 211, 1010–1023. [Google Scholar]
  25. Song, X.H.; Han, J.J.; Zhang, L.; Zhao, C.P.; Wang, P.; Liu, X.Y.; Li, Q.C. Impacts of renewable portfolio standards on multi-market coupling trading of renewable energy in China: A scenario-based system dynamics model. Energy Policy 2021, 159, 112647. [Google Scholar] [CrossRef]
  26. Zhu, B.Z.; Tang, J.J.; Jiang, M.X.; Wang, P. Simulation and regulation of carbon market risk based on system dynamics. Syst. Eng. Theory Pract. 2022, 42, 1859–1872. [Google Scholar]
  27. Zhao, X.G.; Zhang, Y.Z. The System Dynamics (SD) Analysis of the Government and Power Producers’ Evolutionary Game Strategies Based on Carbon Trading (CT) Mechanism: A Case of China. Sustainability 2018, 10, 1150. [Google Scholar] [CrossRef]
  28. Zhao, J.; Zhang, Q.; Zhou, D. Can marketed on-grid price drive the realization of energy transition in China’s power industry under the background of carbon neutrality? Energy 2023, 276, 127556. [Google Scholar] [CrossRef]
  29. Zhao, X.G.; Li, P.L.; Zhou, Y. Which policy can promote renewable energy to achieve grid parity? Feed-in tariff vs. renewable portfolio standards. Renew Energy 2020, 162, 322–333. [Google Scholar]
  30. Ahmed, T.; Bhatti, A.A. Do power sector reforms affect electricity prices in selected Asian countries? Energy Policy 2019, 129, 1253–1260. [Google Scholar] [CrossRef]
  31. Zheng, Y.; Meng, C.; Wang, Z.; Li, C.; Li, Q.; Wang, P.; Yang, Z.; Qing, H.; Wu, Y. Risk Control Optimization Models of Different Power Market Purchasing Combinations of Power Selling Companies. In Proceedings of the 2019 IEEE 3rd Conference on Energy Internet and Energy System Integration (EI2), Changsha, China, 8–10 November 2019; pp. 1–6. [Google Scholar]
  32. Wang, C.; Ni, M.; Shi, Y.; Zhang, L.; Li, W.; Li, X. Optimizing Power Market Clearing with Segmented Electricity Prices: A Bilevel Model. Sustainability 2023, 15, 13575. [Google Scholar] [CrossRef]
  33. Xu, S.; Xu, Q. Optimal pricing decision of tradable green certificate for renewable energy power based on carbon-electricity coupling. Clean. Prod. 2023, 410, 137111. [Google Scholar] [CrossRef]
  34. Yang, H.P.; Chen, X.; Yan, F.F.; Zhang, L. Study on the optimization and management of electricity purchase in Jiangxi province based on the electricity markets. In Proceedings of the 20th International Conference on Computer Supported Cooperative Work in Design (CSCWD), Nanchang, China, 4–6 May 2016; pp. 566–569. [Google Scholar]
  35. Zhang, P.; Cheng, J. The price behavior characteristics of China and Europe carbon emission trading market based on the perspective of time scaling and expected returns. PLoS ONE 2024, 19, e0298265. [Google Scholar] [CrossRef] [PubMed]
  36. Zhang, C.; Zhang, X. Evolutionary game analysis of air pollution co-investment in emission reductions by steel enterprises under carbon quota trading mechanism. J. Environ. Manag. 2022, 317, 115376. [Google Scholar] [CrossRef]
  37. Wang, X.T.; Wu, Z.X.; Yuan, G.D. Carbon Emission Rights Value Assessment Model Construction—A Case Study of Datang International Power Generation Co., Ltd. Financ. Account. Mon. 2020, 37–42. [Google Scholar] [CrossRef]
  38. Zhang, X.; Fan, D. Carbon emission quota allocation of high energy consumption industries in undeveloped areas—A case study of Inner Mongolia Autonomous Region. Heliyon 2022, 8, e11241. [Google Scholar] [CrossRef]
  39. Zhao, X.; Xu, L.; Zhou, Y. How to promote the effective implementation of China’s Renewable Portfolio Standards considering non-neutral technology? Energy 2022, 238, 121748. [Google Scholar]
  40. Chang, X.; Wu, Z.; Wang, J.; Zhang, X.; Zhou, M.; Yu, T.; Wang, Y. The coupling effect of carbon emission trading and tradable green certificates under electricity marketization in China. Renew. Sustain. Energy Rev. 2023, 187, 113750. [Google Scholar] [CrossRef]
Figure 1. Research framework diagram.
Processes 13 00868 g001
Figure 2. System dynamics model of the ET market.
Processes 13 00868 g002
Figure 3. System dynamics model of the CET market.
Processes 13 00868 g003
Figure 4. System dynamics model of the TGC market.
Processes 13 00868 g004
Figure 5. System dynamics model of the enterprise participation in ET-GET-TGC multivariate market. (1) TGC market, (2) steel enterprises, (3) ET market, and (4) TGC market.
Processes 13 00868 g005
Figure 6. Simulation results in the base scenario. (a) ET price; (b) CET price; (c) TGC price; (d) Enterprise production; (e) ET cost; (f) Toatl cost.
Processes 13 00868 g006
Figure 7. Simulation results for scenario A. (a) ET cost, (b) CET cost, (c) TGC cost, and (d) total cost.
Processes 13 00868 g007
Figure 8. Simulation results for scenario B. (a) ET cost, (b) CET cost, (c) TGC cost, and (d) total cost.
Processes 13 00868 g008
Figure 9. Simulation results for scenario C. (a) ET cost, (b) CET cost, and (c) total cost.
Processes 13 00868 g009
Figure 10. Simulation results for scenario D. (a) ET cost, (b) CET cost, (c) TGC cost, and (d) total cost.
Processes 13 00868 g010
Table 1. Initial value settings for variables in the model.
NumbersVariablesInitial ValueUnit
1Regional Power Grid Emission Factor0.6101t/MWh
2Power Demand per Unit of Product 550kWh/t
3Carbon Emission Factor per Unit of Product 1.67tCO2/t
4Contractual Power Purchase Proportion95%
5Mid- and Long-term Green Electricity Purchase Proportion50%
6Mid- to Long-term Thermal Power Purchase Proportion50%
7Annual Growth Rate of Enterprise Output0.91%
Table 2. Multiple scenario settings.
ScenarioParameterParameter TypeAdjustment Range
AMedium and Long-Term Contract Proportion Trading behavior[0, 1]
BThermal Power ProportionTrading behavior[0, 1]
CCarbon Quota Proportion Policy change[0, 1]
Disclaimer/Publisher’s Note: The statements, opinions and data contained in all publications are solely those of the individual author(s) and contributor(s) and not of MDPI and/or the editor(s). MDPI and/or the editor(s) disclaim responsibility for any injury to people or property resulting from any ideas, methods, instructions or products referred to in the content.

