Article

Multistep Kinetics Study on Hydrogen Reduction of 0.25–0.5 mm Iron Oxide Particles

1
China Renewable Energy Engineering Institute, Beijing 100120, China
2
School of Energy and Environmental Engineering, University of Science and Technology Beijing, Beijing 100083, China
*
Author to whom correspondence should be addressed.
Processes 2025, 13(3), 893; https://doi.org/10.3390/pr13030893
Submission received: 13 January 2025 / Revised: 14 March 2025 / Accepted: 17 March 2025 / Published: 18 March 2025
(This article belongs to the Section Particle Processes)

Abstract

:
In this paper, the influence factors on the reduction degree of iron oxide were studied through a direct hydrogen reduction thermogravimetric experiment. The results show that the inlet flow rate and temperature both promote the improvement of the reduction degree, and the higher the inlet flow rate and temperature, the shorter the time required for iron oxide to reach the maximum reduction degree. The entire reduction process of iron oxide can be divided into three stages: the Fe2O3 → Fe3O4 stage, Fe3O4 → FeO stage and FeO → Fe stage. The control mechanism of each stage is based on interfacial chemical reaction, second-order chemical reaction and interfacial chemical reaction, respectively, and the linear fitting degree is good. The final activation energy values of the three stages are 39.696 kJ/mol, 28.129 kJ/mol and 19.110 kJ/mol, respectively.

1. Introduction

In China’s traditional blast furnace ironmaking process, approximately two tons of CO2 are released per ton of pig iron. The utilization of fossil fuels in the iron and steel industry contributes 7% of global CO2 emissions [1]. Due to the large amount of CO2 emissions, there is an urgent need to achieve carbon neutrality. The primary strategy for carbon emission reduction in the steel industry is to focus on substituting green energy for coal [2]. Hydrogen represents the most ideal alternative energy source. Employing hydrogen as a reducing agent, particularly green hydrogen generated from renewable energy to replace the coke typically used in blast furnaces, can significantly reduce carbon emissions and produce green steel [3]. For the industrial implementation of direct reduction technology, understanding the reaction kinetics [4] is crucial, as it is possible to determine the process productivity and reactor design that may be affected.
So far, a substantial number of studies have been conducted on the hydrogen reduction of iron oxides. Qu et al. [5] studied the flash reduction behavior of iron ore powder in an H2 atmosphere through experiments under the high-temperature conditions of 1450–1550 K. They also analyzed the variation pattern of the phase composition during the reduction process of the fine ore. The findings indicated that the flash reduction of hematite powder adhered to the sequential reduction sequence of Fe2O3 → Fe3O4 → FeO → Fe, and the calculated apparent activation energy was 311 kJ/mol. He et al. [6] carried out isothermal thermogravimetric (TG) experiments on iron oxide in the temperature range of 600–1050 °C in a tubular furnace. They determined the morphology and chemical composition of the reduced hematite particles using SEM and XRD. They analyzed the reduction rate during the transformation process and evaluated the overall porosity change as well. Si et al. [7] conducted experimental research on the hydrogen reduction characteristics of titanium concentrate powder via a TG analyzer. They mainly studied the kinetic characteristics of hydrogen reduction of titanium concentrate powder from two aspects, namely the particle size and flow rate of the reaction gas. The results showed that within the temperature range of 600–1250 °C, the apparent activation energy in the reduction process was between 45 and 51 kJ/mol. Under the flow rate of 20–100 mL/min, the apparent activation energy decreased with the increase in the flow rate and reached the minimum value at 40 mL/min. Li et al. [8] adopted the TG–mass spectrometry combined technology to study the reaction kinetics of H2 reduction of iron ore powder under the conditions of 1023–1073 K. The results showed that there was a segmentation phenomenon in the reduction of iron oxides, and both stages conformed to the reaction mechanism of cross-sectional chemical rate control, with the apparent reaction activation energies being 37.40 kJ/mol and 34.97 kJ/mol, respectively. Lin [9] studied the process of low-temperature hydrogen reduction of micro-nano iron oxides. Through thermodynamic analysis and calculation, it was determined that under the condition of a reduction temperature of 300 °C, the reaction of hydrogen reduction of Fe2O3 powder could proceed. Although the reduction was relatively slow, the reaction rate could be enhanced by refining the powder particles. The conditions were as follows: a reduction temperature of 700 °C, a reduction time of 60 min, an iron oxide powder particle size of 0.8 μm and a hydrogen flow rate of 1 L/min.
This paper studies the kinetics of iron oxide particles with a particle size of 0.25–0.5 mm during the hydrogen reduction process through TG experiments. By conducting direct hydrogen reduction thermogravimetric experiments, this paper investigates the influence of inlet flow rate and inlet temperature on the reduction degree. It obtains the control mechanism and kinetic parameters at each stage of the entire reduction process of iron oxide, thus accumulating experience for the direct reduction process.

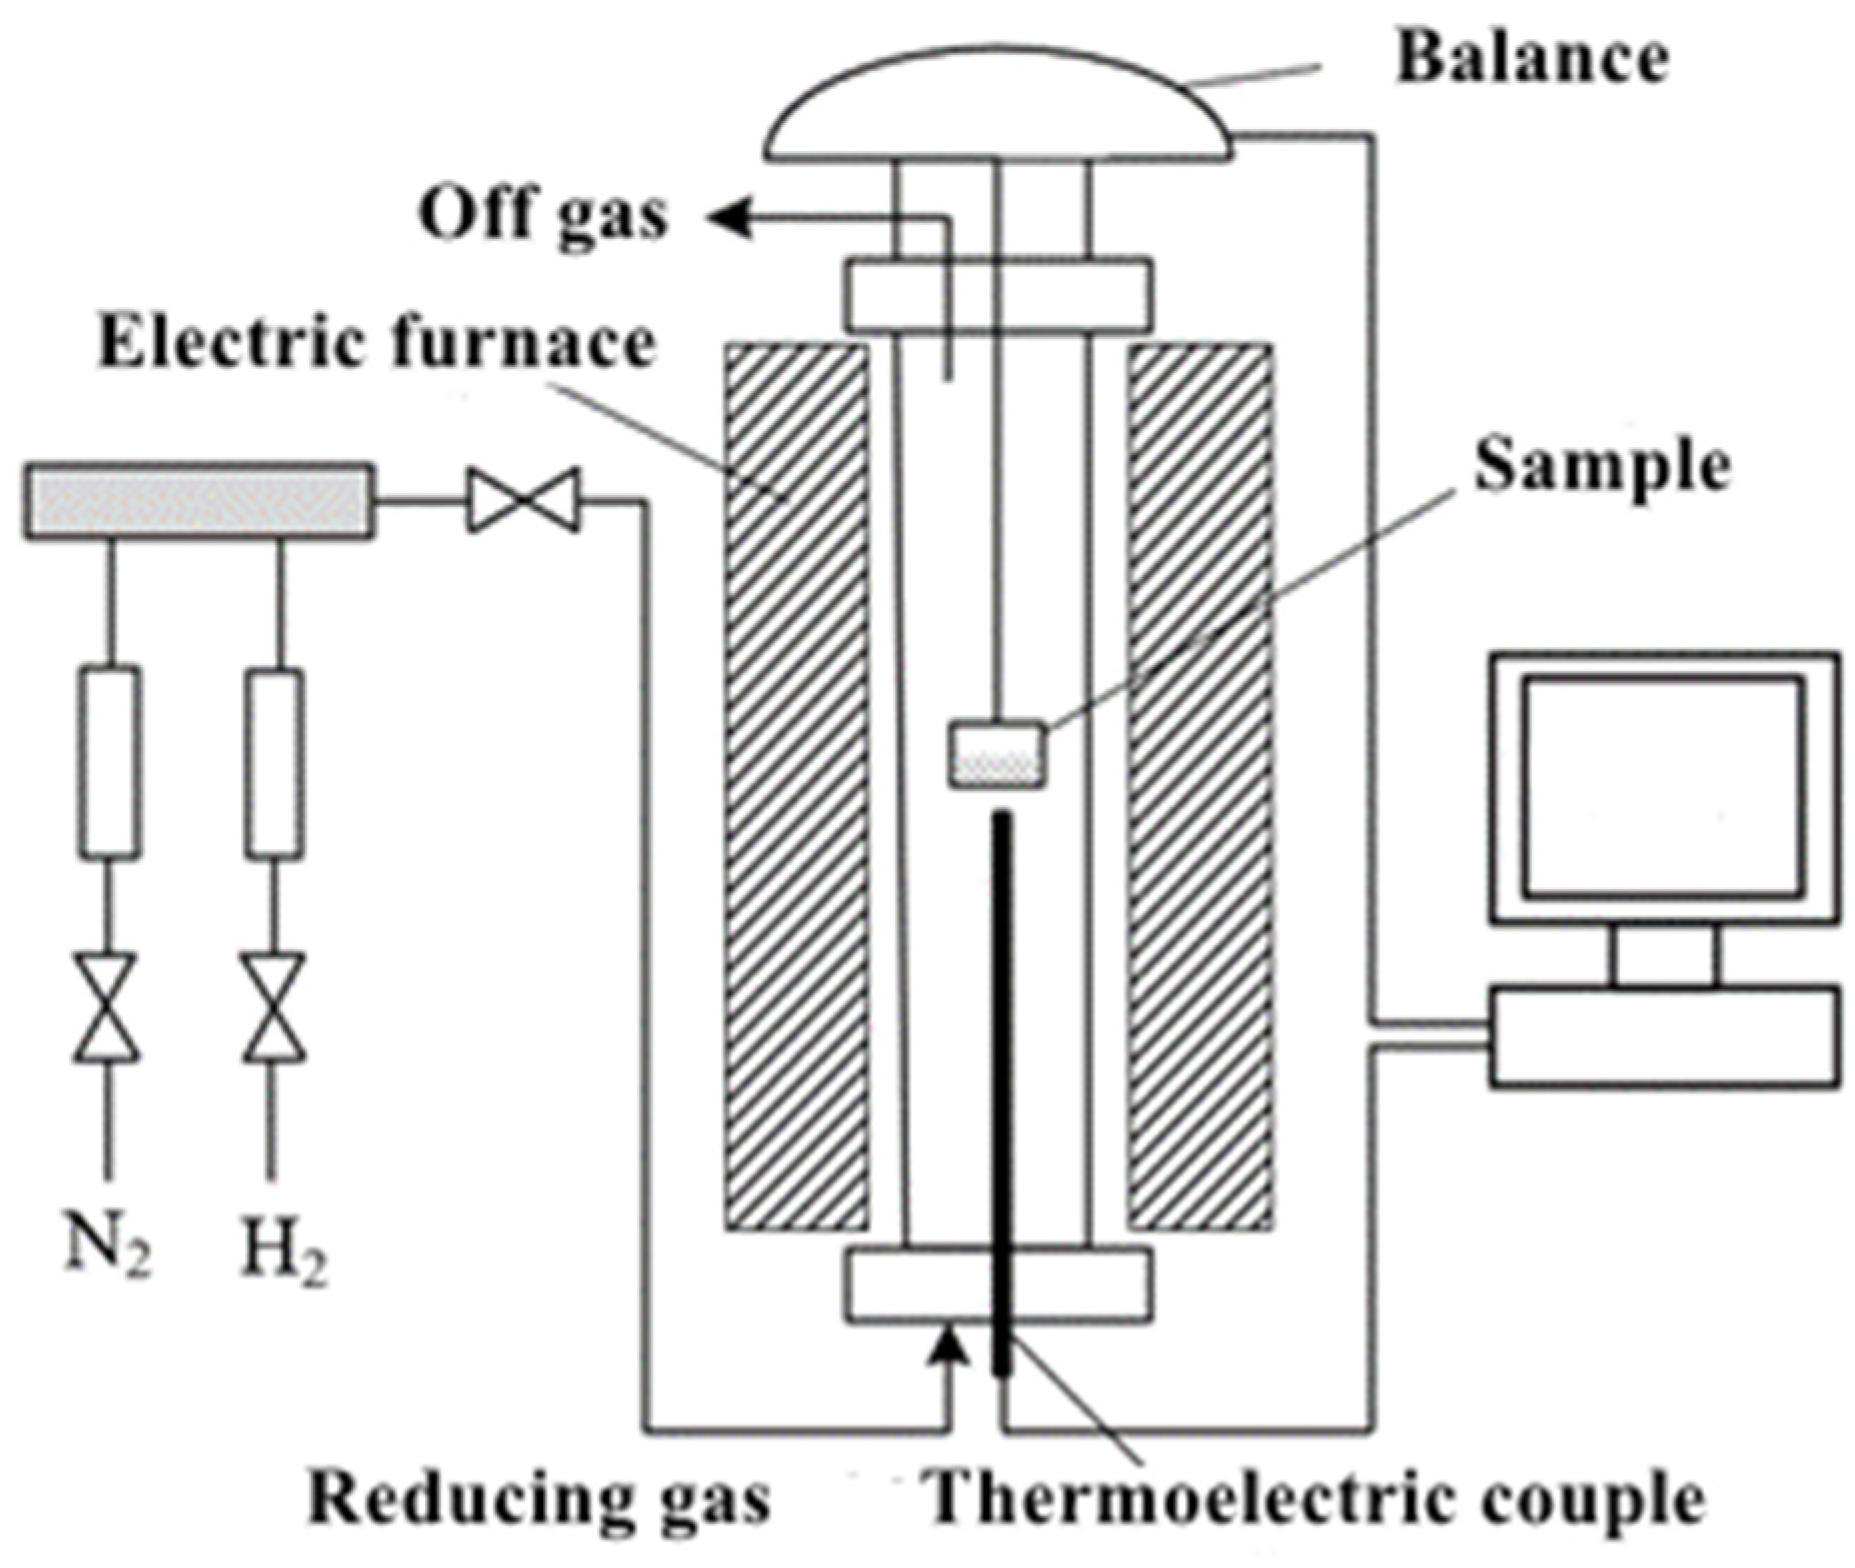
2. Experimental Scheme

The purpose of the experiment is to analyze the influences of factors such as the flow rate and temperature of the reducing gas on the reduction rate and reduction degree, and then to analyze and evaluate the reaction kinetic parameters.
The thermogravimetric method (TG) adopted in the experiment is the most frequently utilized method in kinetic research on iron oxides. It is a technique where the relationship between the mass of a substance and temperature is measured under programmed temperature control. Because the change in mass can be precisely determined by the thermogravimetric method, it is also considered a quantitative analysis method. Information about the thermal stability of iron ore powder and the weight change during the reaction process can be gained by analyzing the thermogravimetric curve. The derivative thermogravimetric method (DTG) is derived from the TG method, with the rate of mass change being continuously recorded as a function of time or temperature. From the DTG curve, the initial reaction temperature, the temperature at which the maximum reaction rate is reached and the final reaction temperature can be precisely obtained, and each stage of the iron oxide reduction reaction process can be differentiated.
The reduction of iron oxides is a process of losing oxygen. When the initial weight of Fe2O3 is set as 100% in the reduction process, its weight changes are in the sequence of Fe2O3 (100%) → Fe3O4 (96.77%) → FeO (90%) → Fe (70%). The reaction mechanism can be inferred based on the weight changes in the samples. The samples used in this experiment are iron concentrates, and the main mineral phase is Fe2O3. For the convenience of calculation, the reduction degree is represented by the weight loss rate in the reaction process.
f = W 0 W t W 0 W = Δ W t Δ W
where f is used to represent the reduction degree, and W 0 ,   W t and W , respectively, denote the masses of the original sample, the sample at time t and the sample when the reaction is completed.
Under the condition of varying gas flow rates, five working condition parameters with gas flow rates of 10 mL/min, 20 mL/min, 40 mL/min, 60 mL/min and 80 mL/min, respectively, were adopted in the experiment. In addition, four temperature working conditions, 873 K, 973 K, 1073 K and 1173 K, were adopted for the reaction temperature.

3. Experimental Process

3.1. Experimental Sample

The experimental samples were provided by Beijing Zhongnuo New Materials Company, Beijing, China, with the Fe2O3 content being 99.95% and the particle size range being 0.25–0.5 mm after crushing and screening. The nitrogen and the mixed gas adopted in the experiment were both provided by Beijing Huanyu Jinghui, Beijing, China. The purity of the nitrogen was 99.99%, and the proportion of both H2 and N2 in the mixed gas was 50%.

3.2. Experimental Method

Figure 1 presents the schematic diagram of the direct hydrogen reduction of iron oxide. The change in sample mass is measured by a thermogravimetric analyzer. The mass range of the test samples for this instrument is within 0.00–0.25 g, with an accuracy of 0.01 mg and a temperature control range between 0 and 1100 °C. The mass change in the samples is recorded every 0.3 s through the settings of the built-in software attached to the instrument. The inlet side of the thermogravimetric analyzer is connected to a glass rotameter gas flowmeter, which is used to control the flow rates of nitrogen and mixed gas. The samples in the experimental process are weighed with an electronic balance. Afterward, the samples are placed into the sample crucible whose inner diameter is 3.5 mm and height is 8 mm.
The mass of the sample used in each experiment is set at 20 ± 0.5 mg. Once the sample has been placed properly, the nitrogen valve is opened and its flow rate is adjusted to 20 mL/min. The air within the thermogravimetric analyzer and the pipelines is exhausted by passing N2 for 20 min. Subsequently, under the nitrogen atmosphere, the temperature is raised to the set temperature at a heating rate of 10 °C/min. Then, the nitrogen valve is closed, the mixed gas valve is opened, it is adjusted to the set flow rate and isothermal reduction is conducted for 1 h. After the reduction is completed, the mixed gas valve is closed, the nitrogen valve is opened and the temperature is cooled down at a rate of 20 °C/min. All the experiments are carried out under isothermal conditions.
The thermogravimetric analyzer measures the mass decrease in the specimen over time in units of milligrams. The degree of reduction α of iron oxide is defined as the ratio of the mass change caused by the removal of oxygen to the total mass change after the completion of the reduction process as follows:
α = m 0 m t m 0 m
where m 0 is the initial mass of the sample, m t is the relational expression of the sample mass changing with time and m is the mass of the sample when it is completely reduced.

4. Experimental Results and Analysis

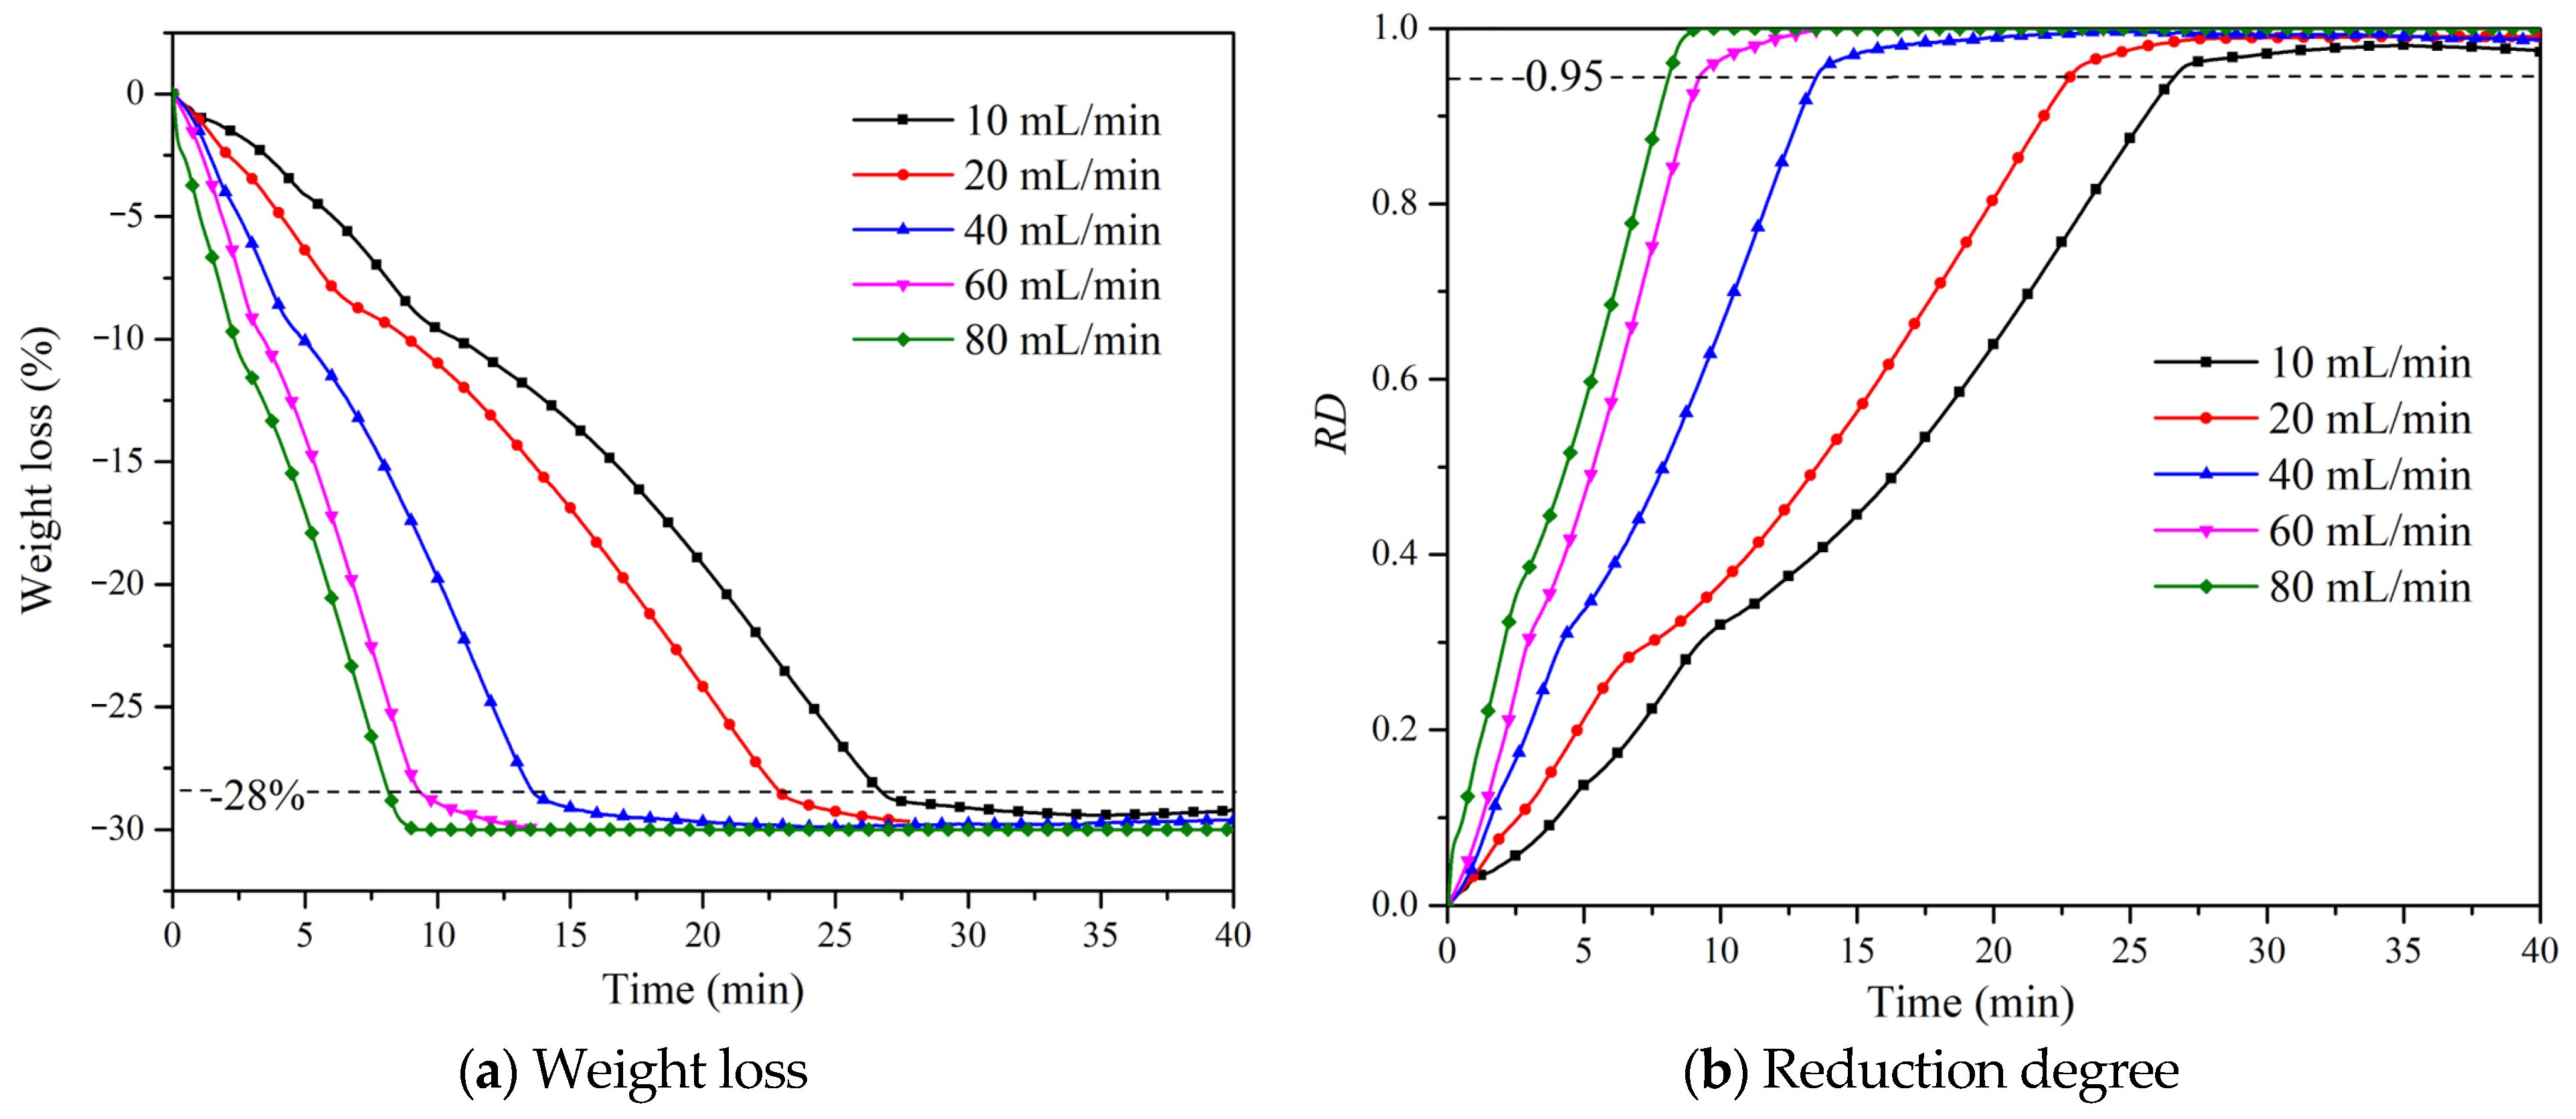
4.1. Effect of Gas Flow on Reduction Degree

The inlet flow rate is regarded as an important operating parameter for controlling the reduction rate. The average concentration of hydrogen in the reaction structure will be increased by increasing the inlet flow rate, thereby enhancing the reaction rate. Figure 2 shows the relationship between the sample’s mass change rate and the reduction degree over time under different reducing gas flow rates. The temperature is set at 1073K, and the particle size ranges from 0.25 to 0.5mm. It can be seen from the figure that the time required to reach the maximum reduction degree will be shortened as the gas flow rate becomes greater. In addition, during the stage of FeO converting to Fe, when the reducing gas flow rate is less than 60 mL/min and the sample mass change rate reaches 28%, the degree of reduction reaches 95%, and the reduction rate will undergo a sharp and sudden change. Similar results were obtained by Wagner et al. [10]. Hematite was reduced by using hydrogen as a reducing agent, and the sudden change in the slope of the rate curve was caused by the transformation from high oxides to low oxides. However, when the flow rate is 80 mL/min, the reduction rate hardly decreases. The reason for this situation is that the diffusion resistance of the gas around the particles is decreased as the gas flow velocity increases.

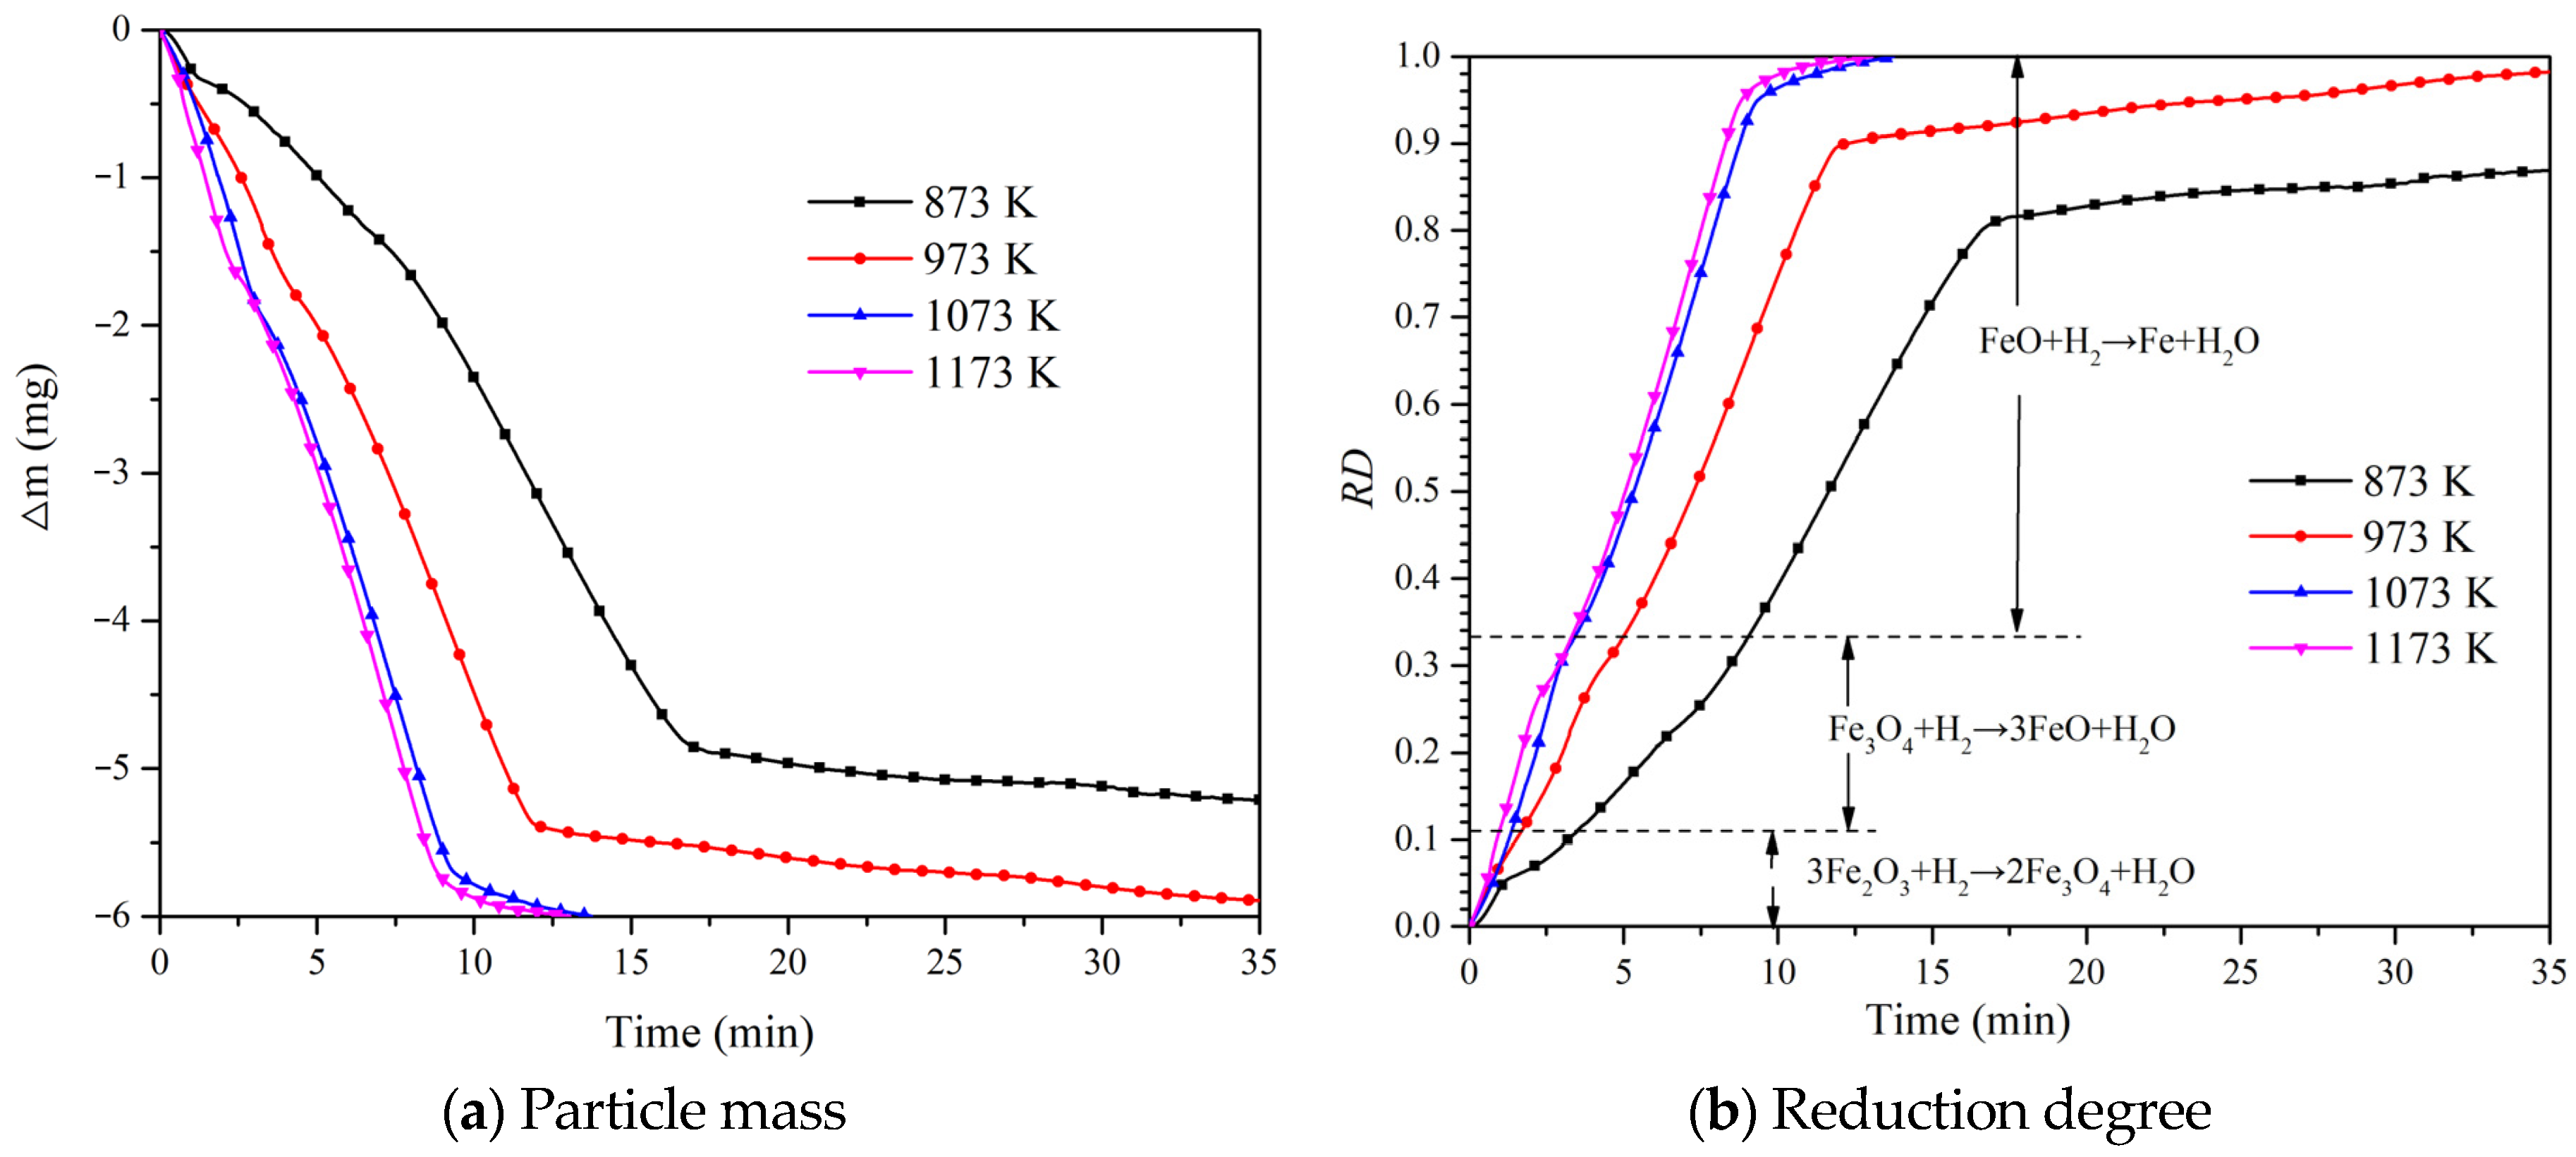
4.2. Effect of Temperature on Reduction Degree

The relationship between the mass change and the reduction degree over time at different temperatures, when the reducing gas flow rate is 60 mL/min, is shown in Figure 3. It can be seen that when the temperature is at 1073 K and 1173 K, the time required for complete reduction is not much different, with the values being 13.7 min and 13.0 min, respectively. In the final stage of reduction, the reduction degree increases slowly. Additionally, when the temperature is at 873 K and 973 K, the time required for the degree of reduction to reach 0.8 is 16.6 min and 10.6 min, respectively. It can also be observed from the figure that when the degree of reduction is above 80%, the reduction rate is gradually decreased.

4.3. Calculation and Evaluation of Apparent Activation Energy

Usually, the apparent activation energy and the reaction rate constant of gas–solid reactions under isothermal conditions are determined by the following formula:
d α d t = k ( T ) f ( α )
where k ( T ) is used to represent the Arrhenius rate constant in which the reduction rate changes with temperature, while f ( α ) is regarded as a mathematical function that depends on the kinetic model used.
According to the Arrhenius formula, the reaction rate constant can be expressed as
k ( T ) = A e E / ( R T )
The logarithm is taken on both sides of Equation (3) to obtain the following formula:
ln d α d t = E R T + ln   A + ln   f ( α )
The method of model fitting is further adopted to analyze the experimental data to obtain the mechanism function f(α) and the pre-exponential factor. According to the integral formula of the gas–solid reaction model,
G ( α ) = 0 α d α f ( α )
The representative kinetic models of G(α) and the corresponding kinetic functions are summarized in Table 1, from which the most probable rate control mechanism of gas–solid reactions can be estimated. These models are usually established based on mechanism assumptions or experiences, and they are divided into phase boundary control models, diffusion models, chemical reaction-based models and nucleation models [11,12].
The linear fitting results of the models within different ranges of the degree of reduction are presented in Figure 4, Figure 5 and Figure 6. Among them, R2 is used to represent the degree of linear fitting, and the higher the value is, the greater the degree of model matching will be. From Figure 4, it can be seen that the model with the highest fitting degree in the first stage is (G(α) = 1 − (1 − α)1/3, R2 = 0.9538–0.9989), and this process is regarded as being controlled by interfacial chemical reactions. Through further linear fitting of lnk(T) and 1/T, the activation energy and the pre-exponential factor values of this process can be obtained, which are 39.696 kJ/mol and 2.804 min⁻¹, respectively.
It can be observed from Figure 5 and Figure 6 that the models that have the highest fitting degrees in the second and third stages are (G(α) = (1 − α)−1 − 1, R2 = 0.9842–0.9992) and (G(α) = [−ln(1 − α)]1/3, R2 = 0.9774–0.9854), respectively. The control mechanisms of the two processes are considered to be due to second-order chemical reactions and interfacial chemical reactions, respectively. The results of the final kinetic parameters are presented in Table 2.
From the above analysis, it can be seen that the reaction model obtained by the model matching method can well describe the process of the gradual reduction of iron oxide by hydrogen. Subsequently, we compared it with the existing literature. Although Piotrowski et al. [13] had a similar temperature range to this study, the control mechanism gradually became diffusion-controlled due to later sintering, causing their apparent activation energy values to be higher than those in this study. Finally, the activation energy result of 58.13 kJ/mol was obtained. In addition, it was also shown by the research of Barde et al. [14] that the activation energy in the second step was higher than that in the third step, which was similar to the results of this paper. The activation energy results of these two stages are 47 kJ/mol and 30 kJ/mol, respectively.

5. Conclusions

In this paper, experimental research on the influencing factors of the degree of reduction of iron oxide is mainly conducted through thermogravimetric experiments on direct hydrogen reduction, and the kinetic parameters of the reaction are obtained. The following conclusions are drawn:
(1)
The improvement of the degree of reduction is promoted by both the inlet flow rate and temperature. Moreover, the time required for iron oxide to reach the maximum degree of reduction will be shortened as the inlet flow rate and temperature become higher.
(2)
The whole process of iron oxide reduction can be divided into three stages, namely the Fe2O3 → Fe3O4 stage, the Fe3O4 → FeO stage and the FeO → Fe stage. The control mechanisms of each stage are, respectively, based on interfacial chemical reactions, second-order chemical reactions and interfacial chemical reactions. All R2 values are greater than 0.94, indicating a good linearity.
(3)
Eventually, the activation energy values for the three stages are obtained as 39.696 kJ/mol, 28.129 kJ/mol and 19.110 kJ/mol, respectively.

Author Contributions

Methodology, J.S. and F.S.; writing—original draft, J.S.; writing—review and editing, F.S. All authors have read and agreed to the published version of the manuscript.

Funding

This research received no external funding.

Data Availability Statement

The original contributions presented in this study are included in the article. Further inquiries can be directed to the corresponding author.

Conflicts of Interest

Author Junlong Si is employed by the China Renewable Energy Engineering Institute. The remaining author declares that the research was conducted in the absence of any commercial or financial relationships that could be construed as a potential conflict of interest.

References

  1. Patisson, F.; Mirgaux, O. Hydrogen Ironmaking: How It Works. Metals 2020, 10, 922. [Google Scholar] [CrossRef]
  2. Bararzadeh Ledari, M.; Khajehpour, H.; Akbarnavasi, H.; Edalati, S. Greening steel industry by hydrogen: Lessons learned for the developing world. Int. J. Hydrogen Energy 2023, 48, 36623–36649. [Google Scholar] [CrossRef]
  3. Wang, R.R.; Zhao, Y.Q.; Babich, A.; Senk, D.; Fan, X.Y. Hydrogen direct reduction (H-DR) in steel industry—An overview of challenges and opportunities. J. Clean. Prod. 2021, 329, 129797. [Google Scholar] [CrossRef]
  4. Guo, L.; Tu, G.; Feng, N.; Di, Y. Non-isothermal Kinetic Analysis of Magnesium Hydroxide Powder Prepared by Electrolysis Method. J. Mater. Metall. 2023, 22, 166–171. [Google Scholar]
  5. Qu, Y.; Luo, Y.; Shi, S.; Zhang, B. Flash Reduction Behavior of Hematite Fine Ore in H2 Atmosphere. J. Mater. Metall. 2019, 18, 79–86. [Google Scholar]
  6. He, J.; Li, K.; Zhang, J.; Conejo, A.N. Reduction Kinetics of Compact Hematite with Hydrogen from 600 to 1050 °C. Metals 2023, 13, 464. [Google Scholar] [CrossRef]
  7. Si, X.; Zhao, E.; Shao, J.; Pang, Z.; Zhang, J.; Huang, Y. Experimental Study on the Hydrogen Reduction Characteristics of Titanium Concentrate Powder by Thermogravimetric Method. Hebei Metall. 2013, 6, 1–4. [Google Scholar]
  8. Li, Y.; Hu, X.; Garg, P.; Mao, X.; Li, K.; Zhang, J. Kinetic Study on Hydrogen Reduction of Iron Ore Powder by Thermogravimetric-Mass Spectrometry. Jiangxi Metall. 2020, 40, 1–5. [Google Scholar]
  9. Lin, C. Mechanism Research on Preparation of Ultra-fine Iron Powder by Low-Temperature Reduction. Ph.D. Thesis, University of Science and Technology Liaoning, Anshan, China, 2017. [Google Scholar]
  10. Wagner, D.; Devisme, O.; Patisson, F.; Ablitzer, D. A Laboratory Study of the Reduction of Iron Oxides by Hydrogen. arXiv 2008, arXiv:0803.2831. [Google Scholar]
  11. Spreitzer, D.; Schenk, J. Reduction of Iron Oxides with Hydrogen—A Review. Steel Res. Int. 2019, 90, 1900108. [Google Scholar] [CrossRef]
  12. Yin, C.; Minakshi, M.; Ralph, D.E.; Jiang, Z. Hydrothermal synthesis of cubic α-Fe2O3 microparticles using glycine: Surface characterization, reaction mechanism and electrochemical activity. J. Alloys Compd. 2011, 509, 9821–9825. [Google Scholar] [CrossRef]
  13. Piotrowski, K.; Mondal, K.; Wiltowski, T.; Dydo, P.; Rizeg, G. Topochemical Approach of Kinetics of the Reduction of Hematite to Wüstite. Chem. Eng. J. 2007, 131, 73–82. [Google Scholar] [CrossRef]
  14. Barde, A.A.; Klausner, J.F.; Mei, R. Solid state reaction kinetics of iron oxide reduction using hydrogen as a reducing agent. Int. J. Hydrogen Energy 2016, 41, 10103–10119. [Google Scholar] [CrossRef]
Figure 1. Schematic diagram of the experimental device.
Processes 13 00893 g001
Figure 2. The change in particle mass and reduction degree by different gas flow rates.
Processes 13 00893 g002
Figure 3. Relationship between temperature and particle mass change and reduction degree change.
Processes 13 00893 g003
Figure 4. The relationship between lnk(T) and 1/T when the reduction degree ranges from 0.01 to 0.11.
Processes 13 00893 g004
Figure 5. The relationship between lnk(T) and 1/T when the reduction degree ranges from 0.12 to 0.34.
Processes 13 00893 g005
Figure 6. The relationship between lnk(T) and 1/T when the reduction degree ranges from 0.35 to 0.9.
Processes 13 00893 g006
Table 1. Control mechanism and G(a) function under different gas–solid reactions.
Model and Control Mechanismf(α)G(α)
3D interface control chemical reaction control3(1 − α)2/31 − (1 − α)1/3
First-order chemical reaction model1 − α−ln(1 − α)
Second-order chemical reaction model(1 − α)2(1 − α)−1 − 1
Third-order chemical reaction model(1 − α)30.5[(1 − α)−2 − 1]
Second-order nucleus formation and growth model2(1 − α)[−ln(1 − α)]1/2[−ln(1 − α)]1/2
Third-order nuclear formation and growth model3(1 − α)[−ln(1 − α)]2/3[−ln(1 − α)]1/3
Table 2. Kinetic parameters of hydrogen reduction of iron oxide particles.
Reaction StageE (kJ/mol)A (min−1)f(α)
Fe2O3 → Fe3O439.6962.8043(1 − α)2/3
Fe3O4 → FeO28.1293.880(1 − α)2
FeO → Fe19.1100.8983(1 − α)[−ln(1 − α)]2/3
Disclaimer/Publisher’s Note: The statements, opinions and data contained in all publications are solely those of the individual author(s) and contributor(s) and not of MDPI and/or the editor(s). MDPI and/or the editor(s) disclaim responsibility for any injury to people or property resulting from any ideas, methods, instructions or products referred to in the content.

