Article

Seed Train Intensification and TFDF-Based Perfusion for MDCK Cell-Based Influenza A Virus Production

1
Max Planck Institute for Dynamics of Complex Technical Systems, 39106 Magdeburg, Germany
2
Bioprocess Engineering, Otto-von-Guericke University, 39106 Magdeburg, Germany
*
Author to whom correspondence should be addressed.
Processes 2025, 13(5), 1286; https://doi.org/10.3390/pr13051286
Submission received: 24 March 2025 / Revised: 15 April 2025 / Accepted: 22 April 2025 / Published: 23 April 2025
(This article belongs to the Section Biological Processes and Systems)

Abstract

:
The production of influenza A virus (IAV) using Madin-Darby Canine Kidney (MDCK) cells is a key strategy for efficient influenza vaccine manufacturing. However, challenges remain in optimizing cell culture processes for higher yield and efficiency. This study aims to evaluate different process intensification strategies on two distinct clonal MDCK suspension cell lines (C59 and C113) for improved IAV production. A semi-perfusion strategy was used to push cells towards high cell density (HCD), achieving up to 17 × 106 C113 cells/mL and 42 × 106 C59 cells/mL, respectively. Next, a Tangential Flow Depth Filtration (TFDF)-based perfusion process with direct harvest during IAV production was established, resulting in high titers and a 10-fold higher space-time yield for C59 and a 4-fold improvement for C113 compared to batch operation. In addition, the suitability of N-1 perfusion was evaluated for batch and intensified fed-batch processes. Cells taken from the N-1 perfusion showed different cell-specific growth rates, but this had no effect on virus titers except for processes started from oxygen-deprived precultures. Finally, comparable virus titers were obtained when the production bioreactor was directly inoculated from an HCD cryovial. Taken together, seed train intensification and TFDF-based perfusion majorly reduced process times and improved IAV production.

1. Introduction

Influenza virus infections still pose a significant public health and economic burden, as annual epidemics cause severe illness and mortality worldwide. Egg-based vaccine production remains popular in the industry. However, cell culture-based approaches are gaining prominence due to their superior scalability, process control, and advantages in vaccine immunogenicity [1]. MDCK cell lines are a known host cell line for influenza vaccine production [2,3], providing a robust system for scaling up virus production with high virus titers for various influenza strains. Although established, moving away from traditional batch processes may facilitate a more cost-effective, high-yield, and time-efficient vaccine manufacturing. For upstream processing, this can be achieved by the implementation of process intensification strategies targeting the cell banking, the inoculum expansion or the (virus) production phase.
While technologies like fed-batch, perfusion, and integrated continuous processing have revolutionized recombinant protein production, their application to virus production is less straightforward. Unlike recombinant proteins, viruses present unique challenges due to their rather short production phases, larger size, and sensitivity toward degradation. Thus, process adaptations are required when implementing technologies across cell culture-based production platforms [4,5].
In perfusion mode, the medium is constantly being exchanged to provide the optimal metabolic environment to prolong the exponential growth phase. Using a cell retention device (CRD), cells are held back in the bioreactor and thus, high cell densities (HCD) can be achieved [6]. This process mode can allow for higher productivity within smaller production footprints and, in some cases, with continuous product recovery, reducing the risk of product degradation. However, significant productivity gains compared to batch processes are required to compensate for the high complexity, dependence on CRDs, and increased media consumption [7,8]. Studies have reported successful influenza virus production in perfusion using membrane-based CRDs like ATF and TFF (alternating/tangential flow filtration), although challenges with virus retention and membrane clogging persist [9,10,11,12,13]. To overcome those issues and to facilitate virus harvesting, CRDs relying on gravity or acoustic waves have been employed [14,15,16]. However, those technologies bring their own unique challenges, and off-the-shelf solutions are rare at industrial scale. A more recent alternative might be tangential flow depth filtration (TFDF), which combines the benefits of TFF and depth filtration. This filter unit with a pore size of 2–5 µm is available for various production scales and promises continuous virus recovery, potentially integrating harvest and clarification into a single step. Its applicability has been shown so far for viral vector production and also for influenza virus production [17,18,19,20].
HCD cryopreservation can be employed to tackle upstream process intensification from the very beginning. Cell banking at 108 cells/mL or in large volumes was shown to minimize the need for labor-intensive cell expansion post-thaw, accelerate process setup, and reduce contamination risks [21,22]. This can be further complemented with seed train intensification strategies, where the inoculum production is optimized by increasing cell densities and reducing the number of propagation steps. One prominent method is N-1 perfusion, where the last seed train bioreactor operates in perfusion mode, achieving HCDs [23]. This allows the inoculation of large production bioreactors with minimal intermediate steps, reducing time and labor. Although rarely touched for virus production, the concept of process intensification for fed-batch cell culture is well-established and widely implemented for mAb production in both scientific research and industrial manufacturing [24,25,26,27]. By implementation of N-1 perfusion seed cultures, a higher initial seeding density (≥1.0 × 10⁷ cells/mL) in fed-batch bioreactors can be achieved, reducing production duration while maintaining final titers and increasing the volumetric productivity. Furthermore, intensified fed-batch (IFB) productions can provide significant advantages over continuous perfusion systems, including reduced perfusion medium requirements, lower raw material costs, and seamless integration into existing fed-batch manufacturing facilities with minimal process modifications [24,28]. Because of that, IFB has less impact on process validation and regulatory changes and might, therefore, be interesting for a virus production setting.
This study comprises several upstream process intensification approaches for a suspension MDCK-based influenza virus production process. We use two cell lines of clonal origin, C59 and C113, with distinct characteristics and show process intensification tailored to each cell line’s needs. We start with a small-scale pretesting in semi-perfusion (SP) mode to explore achievable HCD ranges and identify cell-specific perfusion rates (CSPR). Afterward, we transfer the processes to a 3 L stirred-tank bioreactor (STR) coupled to a TFDF perfusion system. For C59, we additionally evaluated the potential benefit of an intensified seed train (IST) via ATF-based N-1 perfusion on IAV production in batch and IFB mode as well as of a HCD cryopreservation on cell growth and virus production (Figure 1).

2. Materials and Methods

2.1. Cell Culturing

Monoclonal suspension MDCK cell cultures C59 and C113 (Sartorius, Göttingen, Germany) were maintained as previously described [29]. In brief, cells were grown in 4Cell® MDXK CD medium (Sartorius, Germany) with an 8 mM L-glutamine (Sigma-Aldrich, St. Louis, MO, USA) supplementation using non-baffled shake flasks (#431143, Corning, Corning, NY, USA). Cultures were maintained at 37 °C and 5% CO2 atmosphere in a Multitron Pro incubator (Infors AG, Bottmingen, Switzerland) at a shaking frequency of 120 rpm (50 mm throw). Cells were passaged 3 times a week, using viable cell concentrations (VCCs) between 5.0–8.0 × 10⁵ cells/mL for inoculation. VCC, diameter, and viability were determined using a Vi-CELL XR automated cell counter (#731050, Beckman Coulter, Brea, CA, USA).

2.2. Influenza Virus Infection

All infections were carried out with an influenza A virus (IAV) strain A/PR/8/34 H1N1 (Robert Koch Institute, Berlin, Germany). The virus seed was propagated in adherent MDCK cells (ECACC, #84121903) with a final seed virus titer of 9.9 × 10⁷ TCID50/mL. At the time of infection, a complete or half medium exchange was performed, and recombinant trypsin was added to a final concentration of 3% (TrypLE Select Enzyme (10×), #A1217701, ThermoFisher, Karlsruhe, Germany). To maintain the trypsin concentration in perfusion cultures, a trypsin-containing medium was used during all medium replacements post-infection. For infection, the seed virus was diluted in PBS and added at a multiplicity of infection (MOI) of 0.001. In STR cultivations, the temperature was reduced to 33 °C for infection.

2.3. Semi-Perfusion

To mimic perfusion in shake flasks (SF), the medium was manually replaced based on a CSPR-based strategy to maintain sufficient metabolite concentrations (wv 30 mL). After a batch growth phase over 2 d with the abovementioned cultivation conditions, a medium exchange was initiated. In each perfusion step, VCC and metabolite concentrations were determined to calculate the medium exchange volume. For this, the complete culture volume was centrifuged (300× g, 5 min, RT), and the calculated portion was replaced with a pre-warmed, fresh medium. When more than two-thirds of the culture volume had to be replaced, the time interval between perfusion steps was decreased to realize an overall constant CSPR. A constant cell-specific growth rate and CSPR were used to calculate the perfusion volume of each perfusion step or the time interval with fixed perfusion volume, respectively. Equations can be found in previous work [30]. All semi-perfusion experiments were conducted as single replicates.

2.4. TFDF-Based Perfusion

For IAV production in perfusion mode, a 3 L STR (DASGIP, Eppendorf AG, Jülich, Germany) equipped with two 50 mm pitched blade impellers was used. The bioreactor was operated at 37 °C at a pH of 7.4. The dissolved oxygen (DO) concentration was controlled at 50% air saturation by adjusting gas flow rates (3–9 L/h) and oxygen content (21–100%) through an L-drilled hole macrosparger. For HCD cultures (>10.0 × 10⁶ cells/mL), a supplementary oxygen supply (0.5 L/h) via a microsparger was activated manually when the primary DO controller reached its limit. A 30 cm2 TFDF cartridge (pore size 2.0–5.0 µm) connected to the Krosflo TFDF system (Repligen, Waltham, MA, USA) served as the CRD for the perfusion process. An integrated flowmeter maintained the recirculation flow rate at 0.9 L/min. A weight-based control system, synchronized with the permeate flow rate, continuously regulated media addition to maintain the bioreactor volume.
At the time of infection, one reactor volume (RV) was exchanged by temporarily increasing the permeate flow rate to 30 mL/min for the necessary duration. The temperature was shifted to 33 °C. Perfusion was paused for one hour post-infection to allow efficient virus entry into cells. Permeate was collected into ice-cooled polyethylene terephthalate bottles, which were replaced at each sampling point.
The final harvest was performed based on cell viability (assessed by cell count) and biovolume (capacitance signal, Aber Instruments, Aberystwyth, UK). The final harvest consisted of a three-step process: concentration, diafiltration, and a second concentration step, resulting in a 20% increase in the final volume. To prevent membrane clogging and facilitate self-cleaning during the harvest process, a medium was used for diafiltration, and the recirculation rate was increased to 2.1 L/min.

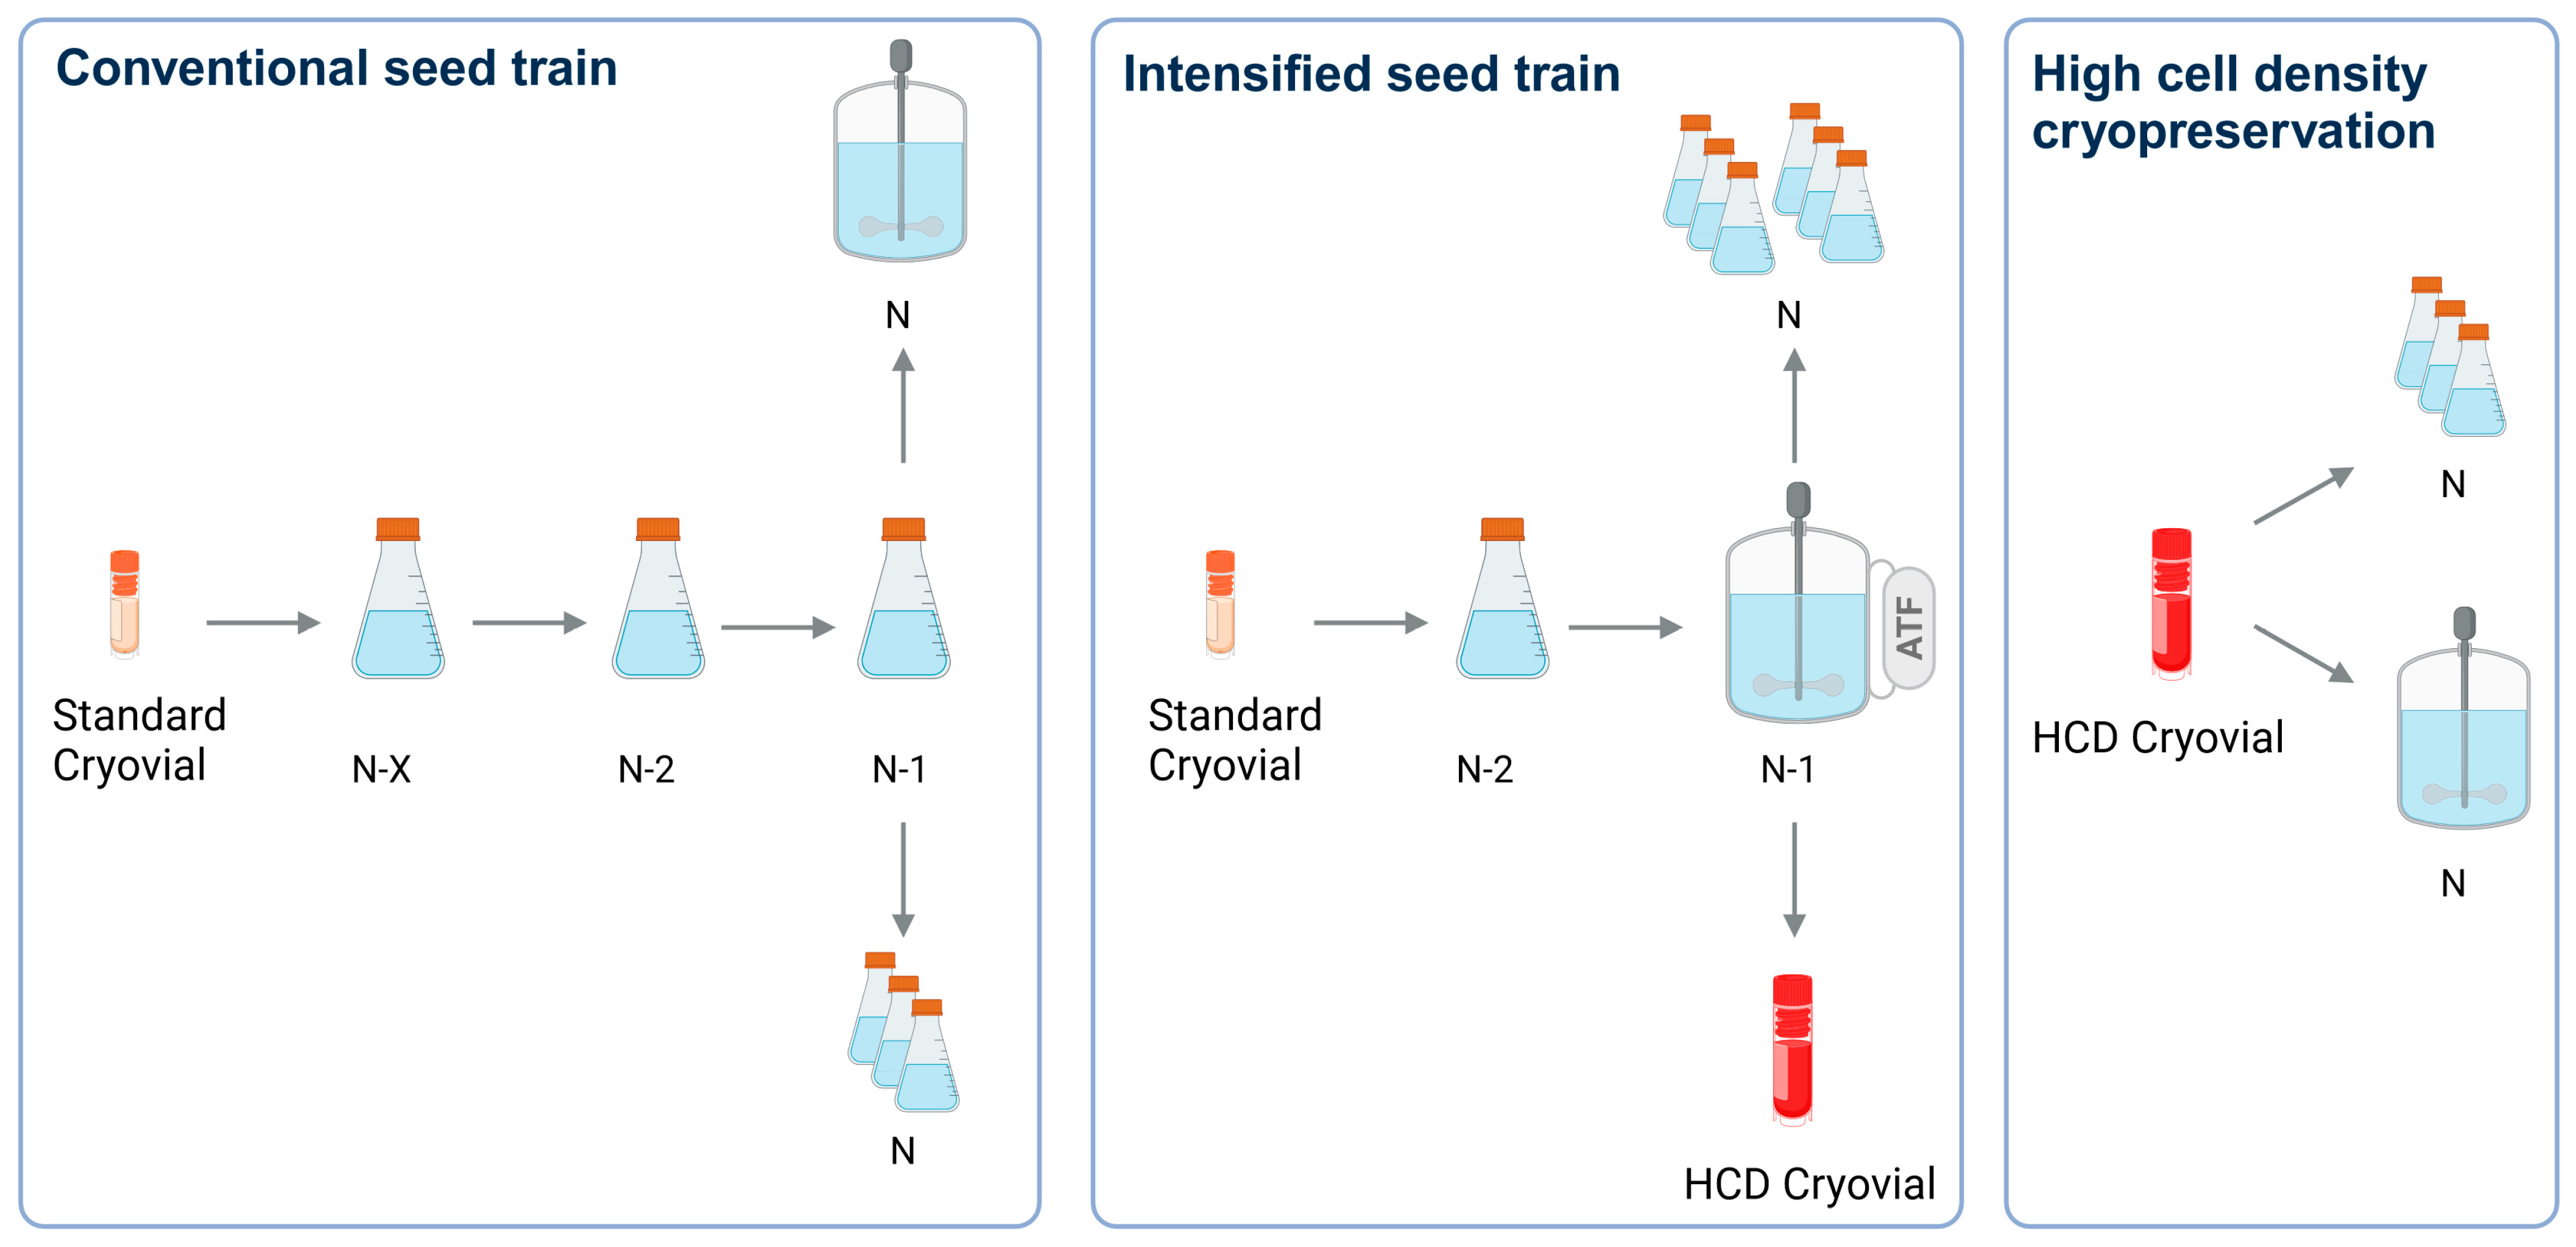
2.5. Seed Train Intensification via N-1 Perfusion

Intensified seed train (IST) perfusion cultivations for the C59 cell line were performed using a 1 L DasGip STR. Bioreactor setup, control strategies, and seeding (wv 600 mL) were identical to TFDF-based perfusion experiments in the 3 L STR. An ATF2 module (Repligen, USA) connected to a hollow-fiber membrane (0.2 µm PES, 65 cm, 0.15 m2, 1 mm lumen, Repligen, USA) was used for cell retention. Perfusion was initiated 2 days post-inoculation once VCC was above 4.0 × 10⁶ cells/mL. Here, the medium was exchanged on a CSPR basis of 200 pL/cell/d. Exchange flow rates of the diaphragm pump were set to 0.9 L/min, and a capacitance probe (Aber Instruments, UK) was used to monitor VCC in real time.
Cell suspension harvested at 10.0, 20.0, 30.0, 40.0, and 60.0 × 10⁶ cells/mL was used to evaluate the impact of seed train cell concentrations on subsequent virus production. For batch experiments, non-baffled shake flasks (wv 30 mL) were inoculated at 0.8 × 10⁶ cells/mL, grown to 4.0 × 10⁶ cells/mL, and subsequently infected. To mimic production conditions, a partial medium exchange was performed by decreasing the wv to 15 mL and filling up with the infection medium. For IFB experiments, cell suspension harvested at 40.0 and 60.0 × 10⁶ cells/mL was used to inoculate non-baffled shake flasks at 10.0 or 20.0 × 10⁶ cells/mL and for direct infection. The addition of concentrated feed with 4Cell® Basic Feed (Sartorius, Germany) and 200 mM L-glutamine (Sigma Aldrich, Darmstadt, Germany) was started 12 h post-infection. The volumes of Basic Feed and L-glutamine varied from 0.2 to 10% (v/v) of the current wv and were based on metabolite levels measured after each sample time point.

2.6. High Cell Density Cryopreservation for Direct Inoculation of a Production Process

5 mL cryovials (Isolab, Eschau, Germany) filled with 52.0 × 10⁶ cells/mL or 93.2 × 10⁶ cells/mL in 4.5 mL fresh medium with 10% (v/v) DMSO were thawed for 1–2 min at 37 °C in a water bath and used to directly inoculate shake flasks (n = 3) or a 1 L STR at 8.0 × 10⁵ cells/mL. In the STR, initial stirring started at 40 rpm and was subsequently increased to 100 rpm 2 h post-inoculation. Cells were grown until 2.3 × 10⁶ cells/mL were reached and then infected following a 2-fold dilution step and a decrease of temperature to 33 °C.

2.7. Analytics

Metabolite concentrations, including lactate, ammonia, glutamine, and glucose, were measured using the Cedex Bio Analyzer (Roche, Rotkreuz, Switzerland). The measurement range for each metabolite was validated prior to analysis, and samples exceeding the range were appropriately diluted. Virus titers in the samples were determined using two established assays. Total influenza virus content was quantified using a hemagglutination assay (HA) as described previously [31]. To measure infectious virus particles, a 50% tissue culture infectious dose (TCID50) assay was used, employing a strain-specific influenza antibody, following the method described by Genzel et al. [26]. The maximum standard deviation for the HA assay was ±0.15 log10(HAU/100 µL), while the TCID50 assay had a dilution error of ±0.3 log. The total virus particle (vir tot) in the supernatant, the cell-specific virus yield (CSVYHA), the volumetric virus productivity (VVPHA), and space-time yield (STYHA) were calculated using equations adapted from previous work [17,29,31]. These calculations were based on the total virus titer, as this is more relevant than the infectious virus titer in the context of an inactivated influenza vaccine.

2.8. Statistical Analysis

All statistical evaluations were carried out using GraphPad Prism V9 (GraphPad Software, La Jolla, CA, USA). The data are presented as mean values ± standard deviation (STD). If applicable, statistical significance was assessed using a one-way ANOVA followed by Dunnett’s multiple comparison test with respect to the control. Statistical difference between groups is denoted by p-values < 0.05: * p values < 0.05, ** p-values < 0.01, *** p-values < 0.001, **** p-values < 0.0001.

3. Results

Various strategies to intensify influenza A virus production in two clonal suspension MDCK cell lines (C59 and C113) were evaluated. Starting with process insights from a semi-perfusion, we set up a perfusion process for both cell lines using TFDF technology. For C59, we additionally performed intensified fed-batch experiments in shake flasks, evaluated the influence of the seed train and explored options for high cell density cell banking and thawing.

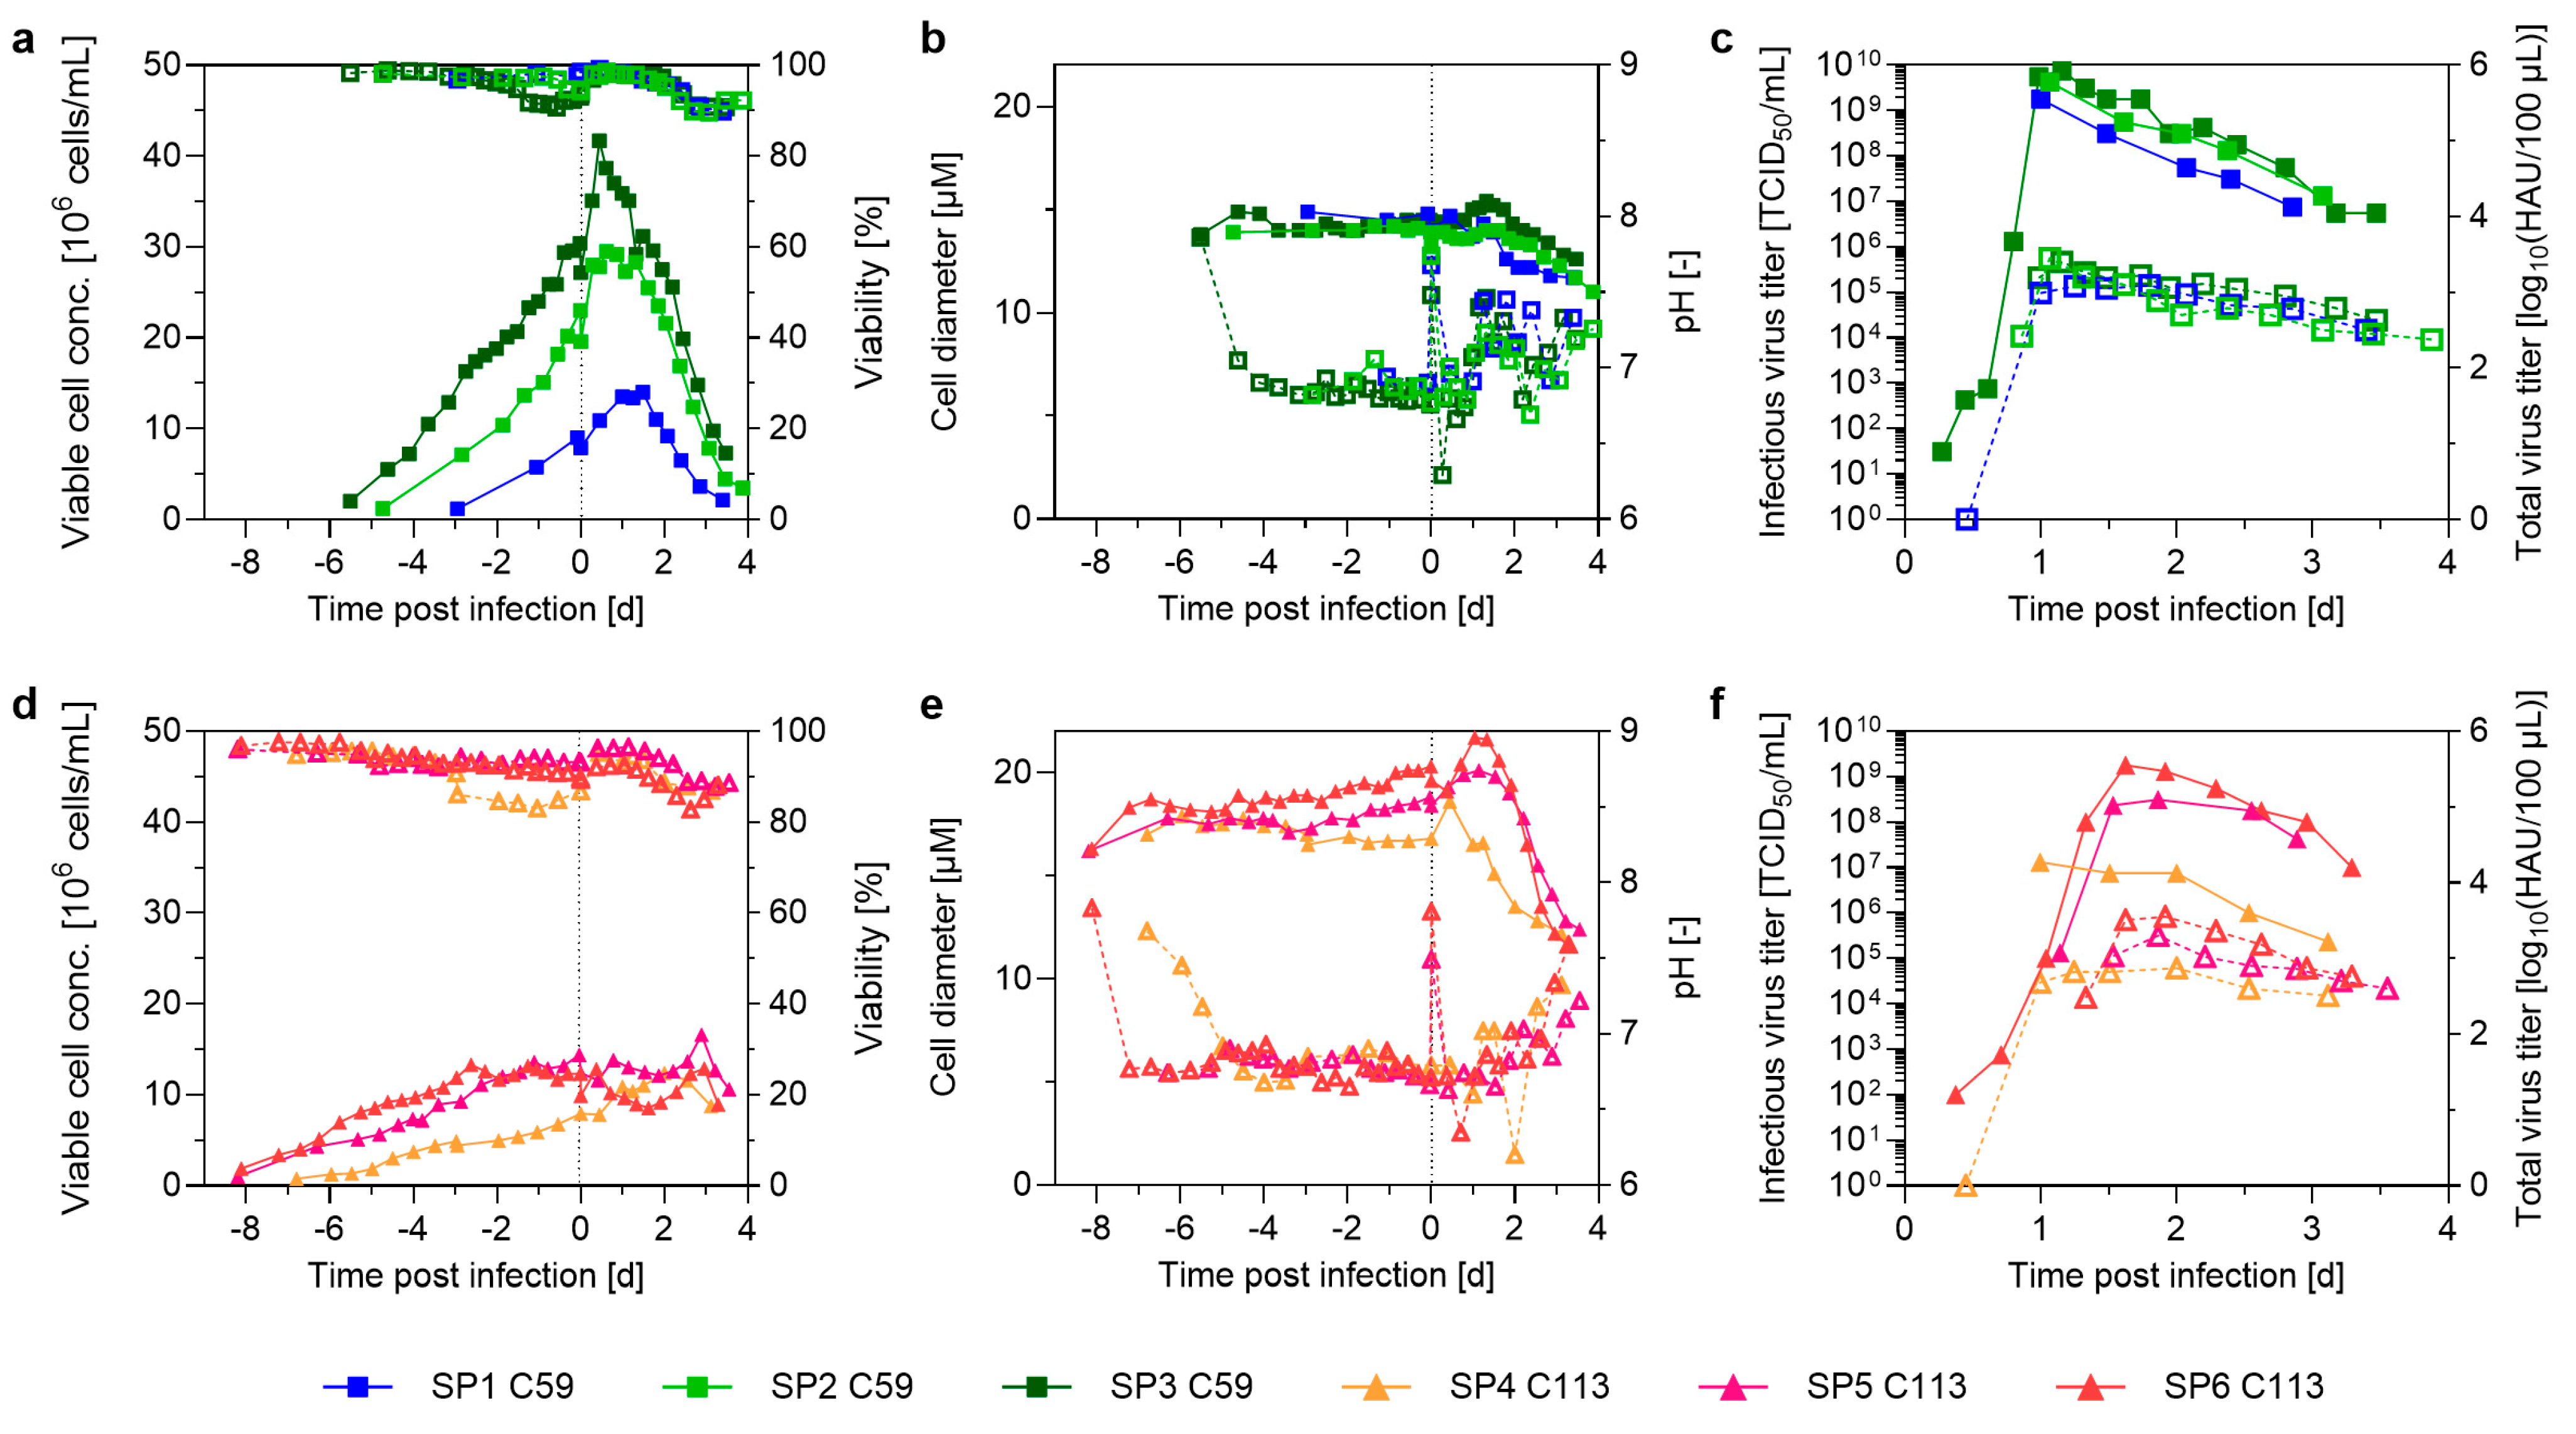
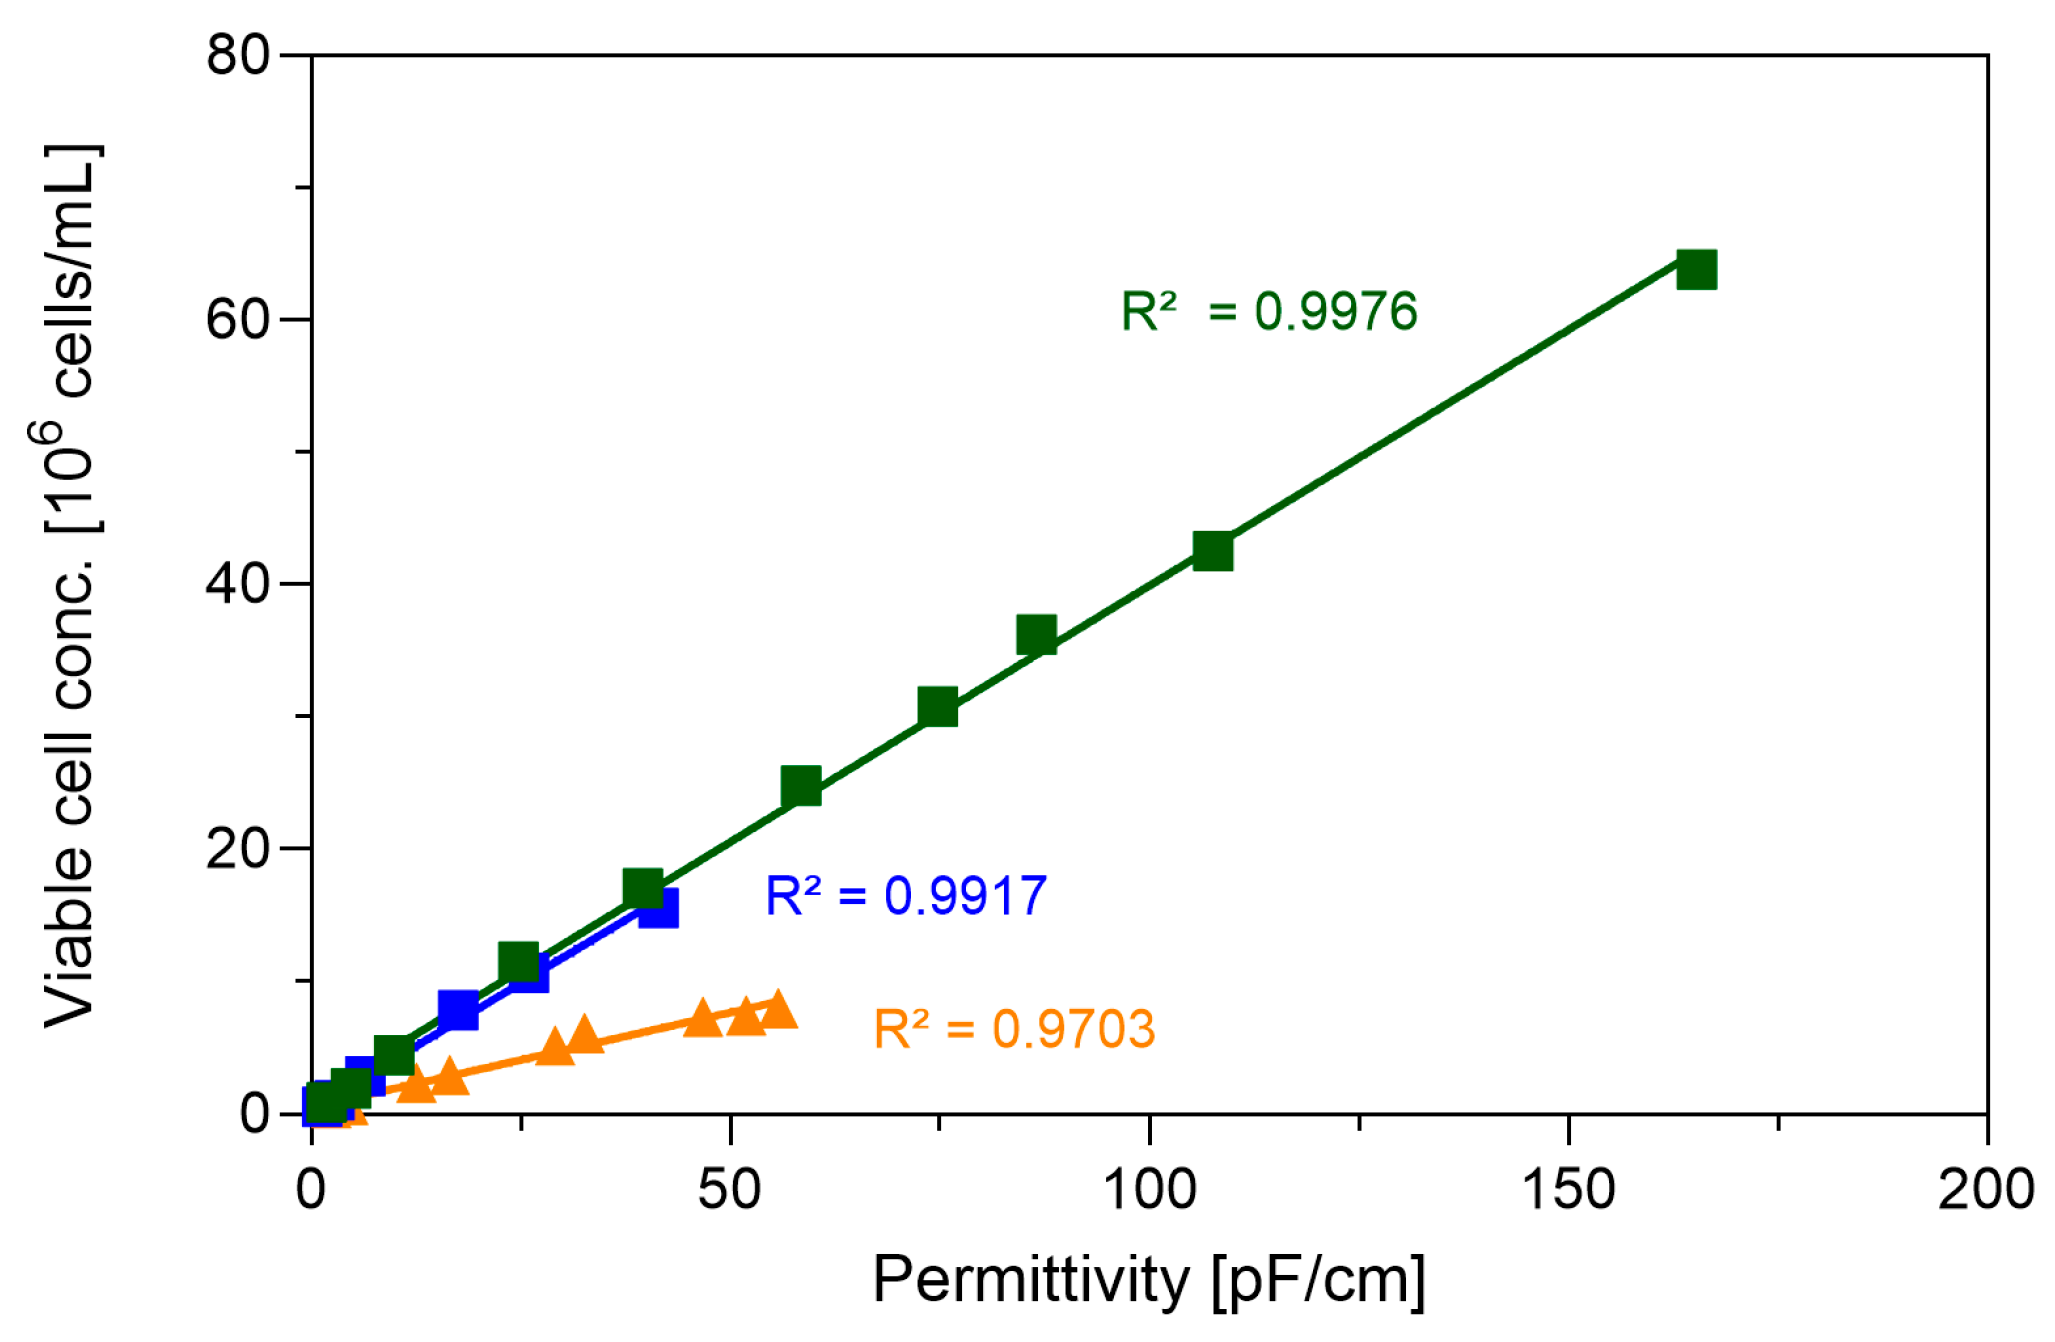
3.1. Pushing Towards High Cell Densities in a Small-Scale Model—Semi-Perfusion in Shake Flasks

In batch mode, cell growth is limited by the depletion of nutrients and conversion into metabolic side-products that adversely impact growth or production. To test whether C59 and C113 can reach HCDs, a SP strategy was employed at a small scale. For that, cells were cultivated in shake flasks, and the medium was partially exchanged every 4–12 h at a rate tailored to the cells’ needs. Based on a previous study with MDCK.Xe.E cells, we first evaluated cell growth using a CSPR of 60 pL/cell/d [30]. Here, both cell lines displayed distinct growth characteristics, with C59 reaching a maximal VCC of 41.0 × 10⁶ cells/mL at a growth rate of 0.038 h−1 and C113 only reaching 13.6 × 10⁶ cells/mL at 0.027 h−1. Although HCDs were achieved, the selected CSPR was not sufficient to maintain key nutrient levels. For C113, a rapid depletion of glucose and glutamine was observed within 96 h of culture duration. In contrast, C59 demonstrated a less demanding nutrient consumption, with glucose remaining available until 180 h and glutamine persisting throughout the whole cultivation period. These findings show a considerable difference in nutrient utilization between the two cell lines, suggesting that C59 has a more efficient metabolic profile, allowing it to maintain growth for a longer duration under the same CSPR conditions.
For IAV production in SP, different seeding cell densities and feed strategies were tested. Besides the growth characteristics, the two cell lines also demonstrated notable differences in virus production (Table 1, Figure A1). The highest total virus titer of 3.6 log10(HAU/100 µL) was observed for C113 when cells were infected at a VCC of 10.0 × 10⁶ cells/mL while using a CSPR of 120 pL/cell/d. To reduce the number of manual interventions, the medium used in this cultivation was supplemented with 12 mM glutamine (instead of 8 mM) and glucose concentration was increased to a final concentration of 70 mM (instead of 40 mM). From that, a CSVY of 7281 vp/cell, a VVP of 7.0 × 10¹¹ vp/L/d, and a STY of 9.3 × 10¹² vp/L/d was reached (Table 1, SP6). The best result for C59 was achieved when infecting at a VCC of 30.0 × 10⁶ cells/mL while using a CSPR of 84 pL/cell/d. Here, the overall highest infectious virus titer of 7.5 × 10⁹ TCID50/mL was achieved. Based on the total virus titer of 3.4 log10(HAU/100 µL), a CSVY of 1166 vp/cell, a VVP of 7.0 × 1111 vp/L/d, and a STY of 1.0 × 10¹³ vp/L/d was determined (Table 1, SP3).

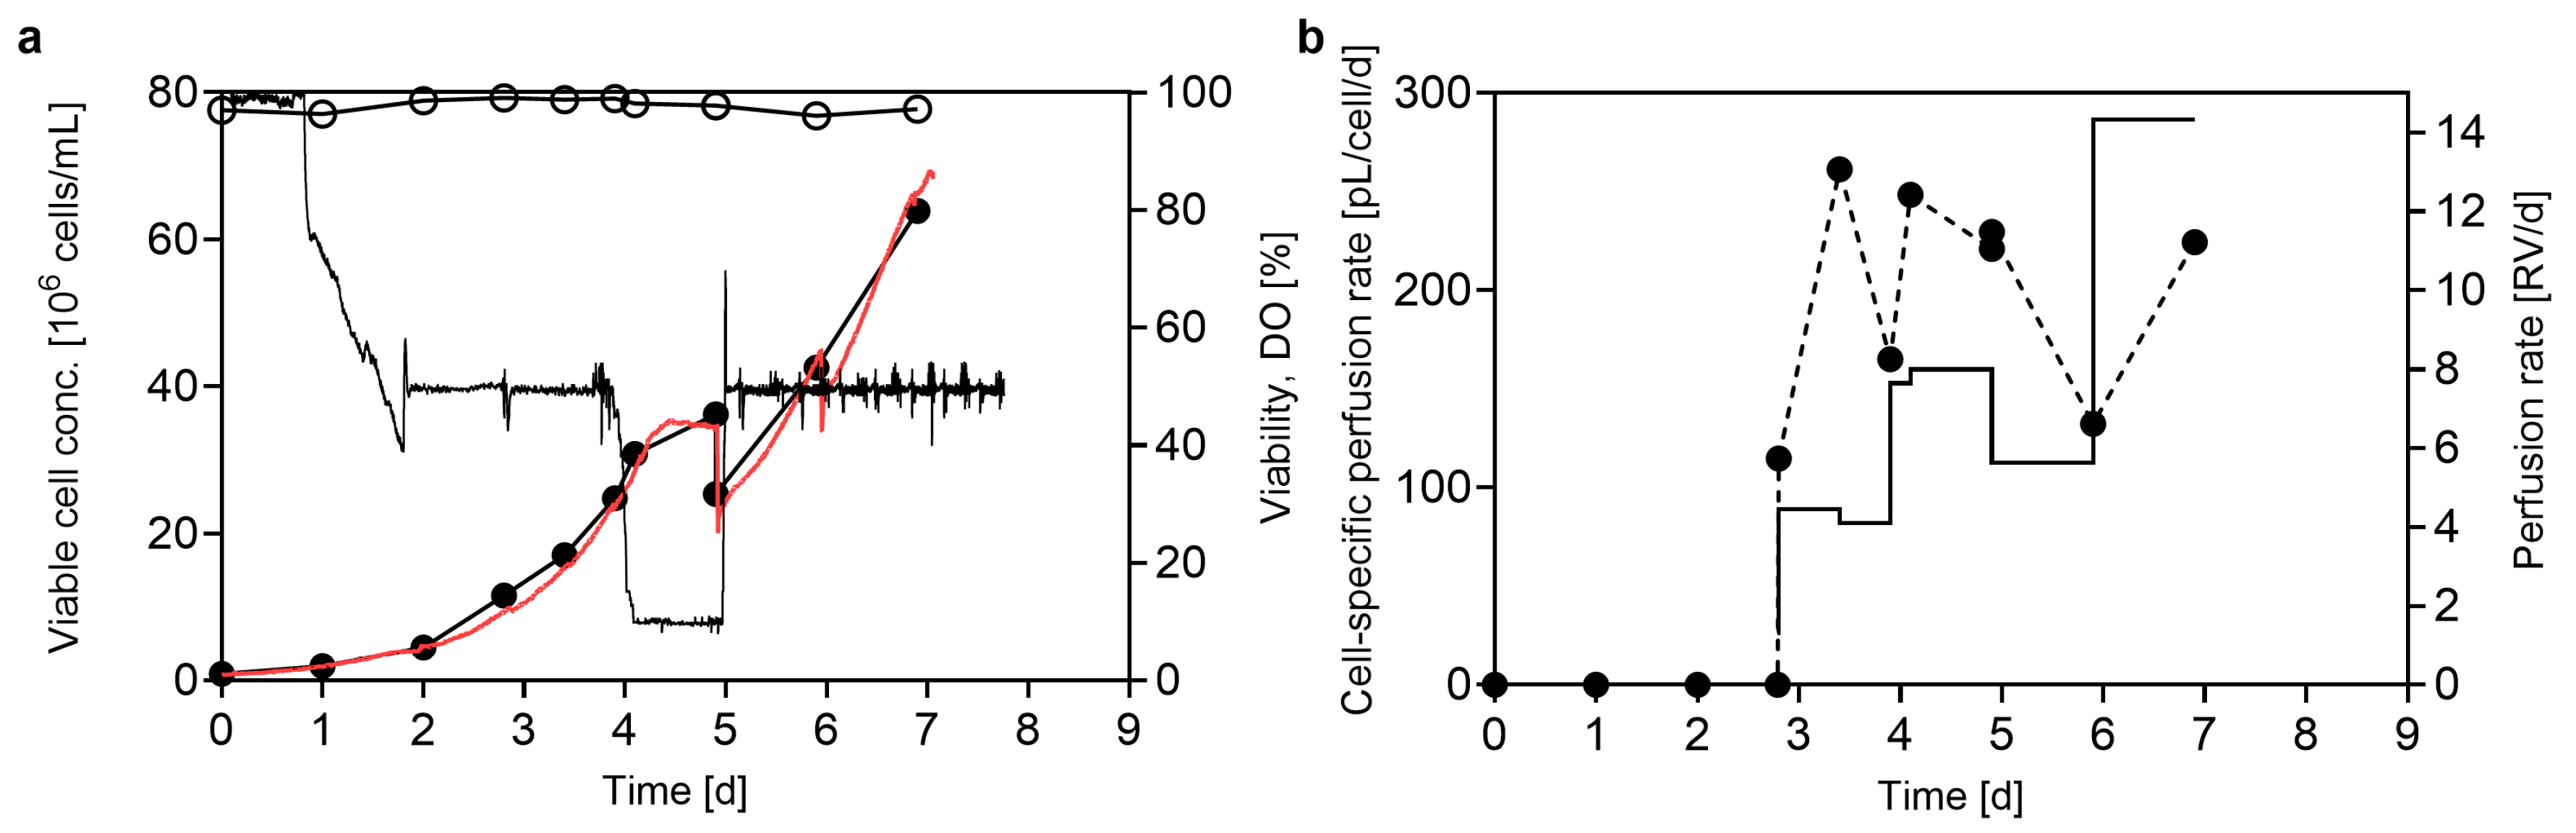
3.2. TFDF-Based Perfusion Setup for IAV Production

Next, a fully controlled perfusion process using a 3-L STR coupled to a TFDF system was established for both cell lines. Cells were inoculated at a VCC of 0.5 × 10⁶ cells/mL and initially grown in batch mode. Perfusion was initiated once key nutrient levels dropped below a critical level. Although the perfusion for C113 was already started after 40 h of culture duration, the used CSPR of 200 pL/cell/d was too low, leading to glucose depletion by −1.5 dpi. In contrast, glutamine levels were maintained above 2.5 mM (Figure A2). To address this, the CSPR was increased to 400 pL/cell/d, which stabilized glucose concentrations above 10 mM. C59 cells consumed fewer nutrients, and perfusion with a CSPR of 190 pL/cell/d was initiated only after 68 h of growth.
A linear correlation between the permittivity signal at 580 Hz and the VCC was observed during the growth phase for both cell lines (Figure A3), allowing real-time monitoring of cell growth throughout cultivation. After 4 d, the growth rate for C113 decreased, indicating stagnated proliferation and the end of the exponential growth phase. Thus, a full medium exchange with the trypsin-containing medium was performed by increasing the permeate flow rate to 30 mL/min for about 1 h. To provide optimal conditions for the following infection, the temperature was shifted to 33 °C. IAV seed virus was added at an MOI of 0.001 to the bioreactors with a VCC of 17.8 × 10⁶ C59 cells/mL and 7.3 × 10⁶ C113 cells/mL (Figure 2a). To allow efficient virus entry into cells, the perfusion was paused for 1 h post-infection (hpi). Then, the perfusion strategy was shifted from a CSPR-based exchange rate towards a maximum of 2 RV/d and samples were taken every 6–12 h (Figure 2c).
At 42 hpi, the infectious virus titer peaked for both cell lines, with C59 reaching an almost 3-fold higher result of 7.8 × 10⁹ TCID50/mL in comparison to 2.8 × 10⁹ TCID50/mL for C113 (Figure 2b, Table 1). Additionally, a slightly higher peak total virus titer of 3.7 log10(HAU/100 µL) was achieved for C59, while C113 reached 3.5 log10(HAU/100 µL).
At 3 dpi, the final harvest was initiated for C59, as VCC and biovolume drastically decreased. Therefore, a three-step process was performed comprising concentration, diafiltration, and a second concentration step. When evaluating productivity metrics for C59, the STY and VVP were still rising at this time point (Figure 2d). Thus, we decided to harvest C113 at 3.5 dpi instead. However, the STY and VVP for C113 peaked already around 2.5 dpi, indicating that an earlier harvest may have been favorable as well.
Considering all virus particles that accumulated within the reactor and collected permeate over time, the same HAacc of 4.1 log10(HAU/100 µL) was achieved for both cell lines. However, as maximum VCCs for C113 were 2.5-fold lower than for C59, the calculation of CSVYHA resulted in high values for C133 of 28,882 vp/cell and 11,506 vp/cell for C59. Over the entire cultivation duration, virus titers in the bioreactor were almost identical to titers in the harvest line, indicating a loss-free virus harvest through the TFDF filter without blocking (transmembrane pressure of 0 psi; Figure 2b).

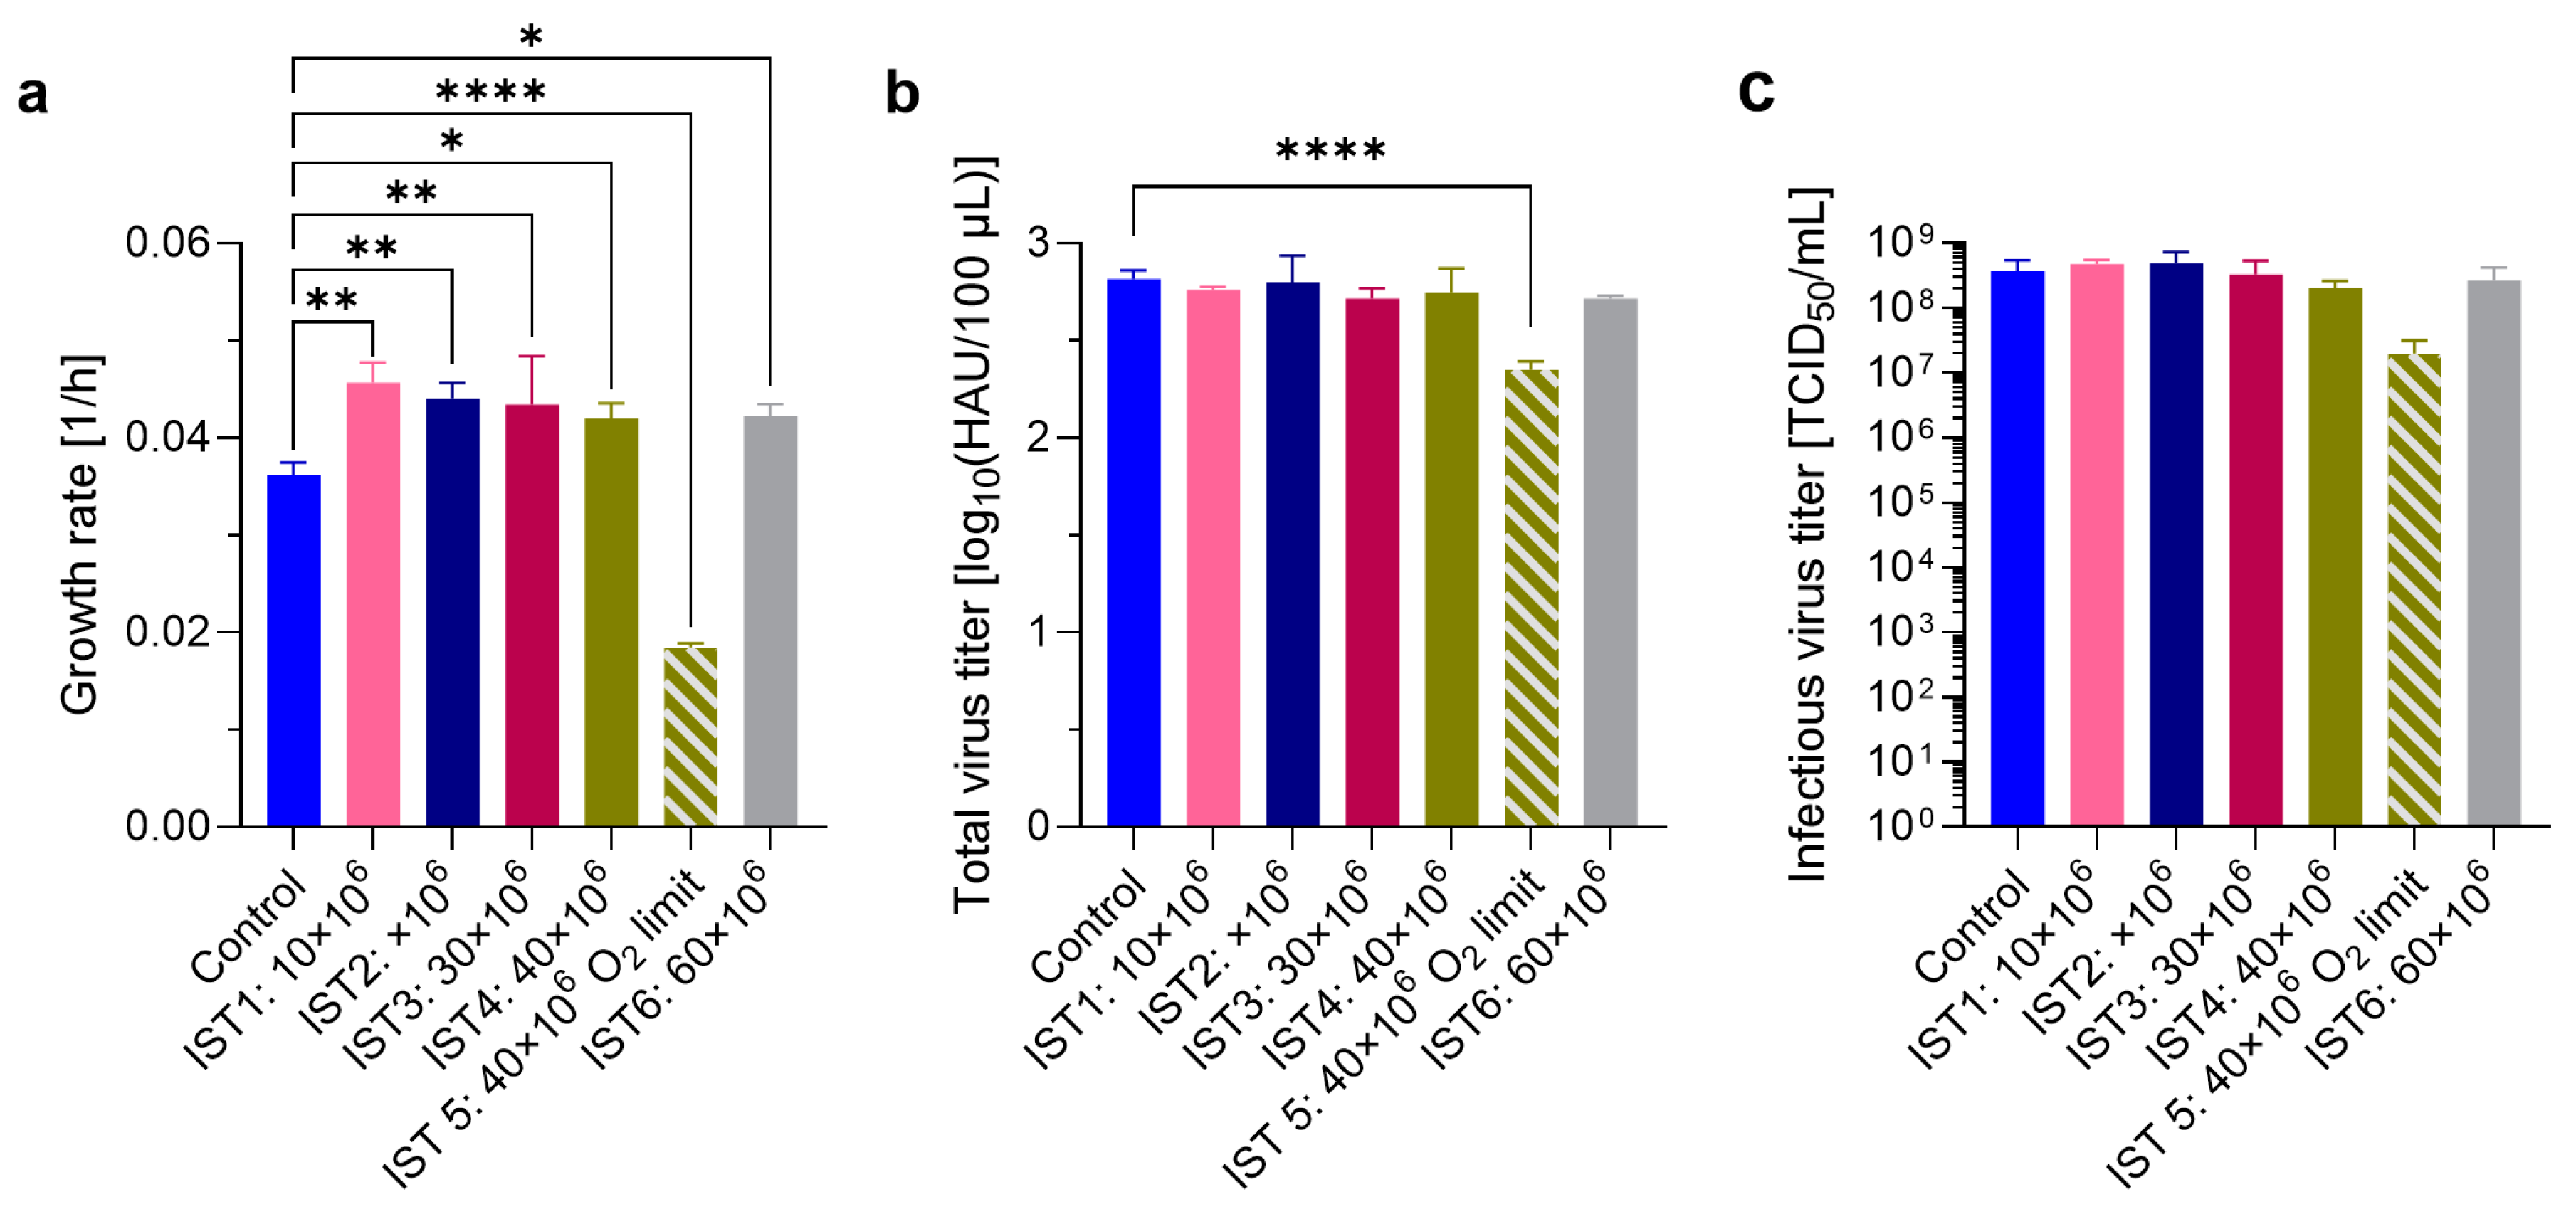
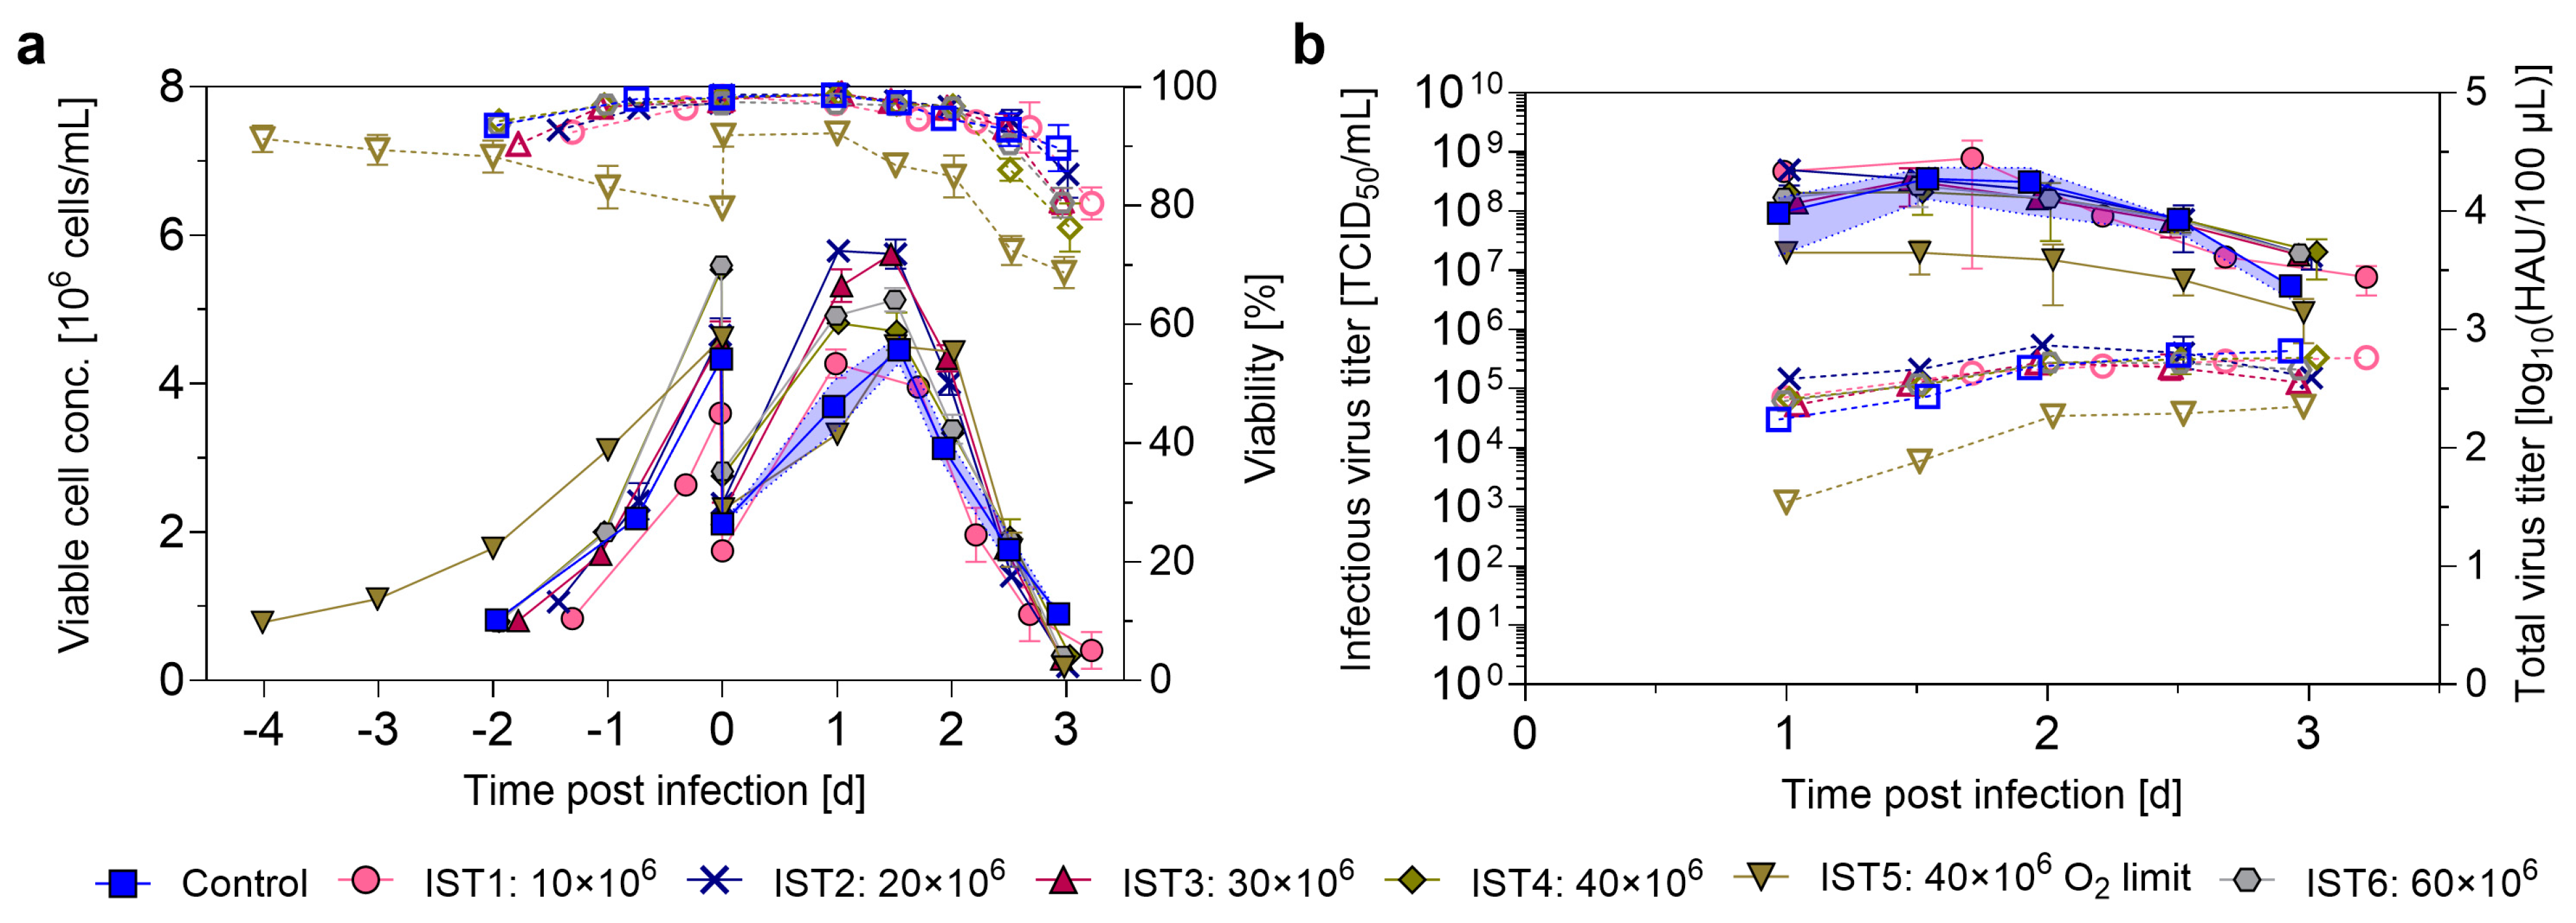
3.3. Intensifying the Seed Train by N-1 Perfusion

To intensify the seed train, we implemented a N-1 perfusion for C59 cell expansion to evaluate how HCD affects the subsequent production run with respect to cell growth and IAV yields. To this end, cells were taken at different VCCs from the N-1 perfusion cultivation to inoculate the N-stage shake flasks to mimic a production run. Additionally, we examined the impact of oxygen limitation as a key stress factor during the HCD seed train.
The N-1 perfusion STR was inoculated with 0.8 × 10⁶ cells/mL, and perfusion was initiated after 2 d once VCC was above 4.0 × 10⁶ cells/mL. Using a CSPR of 200 pL/cell/d, the perfusion rate was progressively increased to a maximum of 14.3 RV/d between days 6–7 to ensure optimal culture conditions (Figure 3b). On day 4, an oxygen limitation was introduced by reducing the DO setpoint to 10% (Figure 3a). This resulted in a sharp decline in the growth rate from 0.035 h−1 for days 0–4 to 0.009 h−1 for days 4–5. After reinstating the DO setpoint of 40%, the growth rate recovered to 0.02 h−1 for the remainder of the cultivation. Despite the oxygen limitation and multiple cell harvests, culture viability remained high, above 97% for the entire cultivation. Cell suspension for inoculating batch and IFB infections were collected on days 2.8, 3.4, 4.1, 5, and 6. A peak VCC of 63.9 × 10⁶ cells/mL was reached at day 7 (Figure 3a), after which the biomass was used for the generation of HCD cryopreserved stocks (Section 3.4).
In the next step, the cell growth behavior and virus production of batch productions inoculated from the N-1 perfusion cultivation were characterized (Figure 4). Batch productions inoculated from a conventional seed train (4.0–6.0 × 10⁶ cells/mL) were used as the positive control. All cultures inoculated from the intensified seed train (IST) showed significantly higher pre-infection growth rates (p > 0.01; Figure A4a), except for those derived from oxygen-limited conditions. In the latter, a significant reduction in cell-specific growth rate (p > 0.0001) was observed, prolonging the growth phase before infection by two days. Post-infection, peak total titer and infectious virus titers, VCCs, and viability trends showed only minor differences across conditions, except for cultures derived from oxygen-limited cells. The lowest total virus titer was observed in the IST3 (2.71 ± 0.05 log10(HAU/100 µL)), while the highest was recorded in the IST2 (2.80 ± 0.14 log10(HAU/100 µL)) (Table 2). Oxygen-limited cells exhibited a significant reduction in virus production, with total virus titers approximately 0.5 log lower than the control (p < 0.0001, Figure A5b). However, the difference in maximum infectious virus titers was not statistically significant for any condition compared to the control (Figure A5c).
Next, we used cells from the N-1 perfusion to inoculate shake flasks at either 10.0 or 20.0 × 10⁶ cells/mL (IFB1 and IFB2) for IAV production using an intensified fed-batch (IFB) strategy. Additionally, cells from the oxygen-limited phase were used at the same cell concentrations (IFB3 and IFB4, respectively). Cells were directly infected, and all cultures were maintained using a fixed feeding strategy with 4Cell® Basic Feed and 200 mM glutamine to prevent glucose and glutamine depletion. While nutrient limitations were successfully avoided, high ammonia and lactate concentrations of up to 7 mM and 24 mM, respectively, were observed in all four conditions (Figure A4). Despite nutrient availability, VCC stagnated in IFB3 and IFB4 post-infection and began to decline at 2 dpi. In contrast, IFB1 and IFB2 exhibited a transient VCC increase for 24 and 12 h, respectively, before declining. Notably, a steeper decline in culture viability was observed in fed-batch cultures infected at lower VCCs (IFB-1 and IFB-3), with cells from oxygen-limited preculture showing lower viabilities at 3 dpi compared to their non-limited counterparts (Figure 5a). IFB1 yielded the highest total and infectious virus titers, reaching 2.94 ± 0.05 log10(HAU/100 µL) and 5.0 ± 2.2 × 10⁸ TCID50/mL, respectively (Figure 5b). However, neither of the IFB strategies led to a statistically significant increase in total or infectious titers compared to the control (shake flask with conventional seed train, Table 2) (Figure A5). No total virus titers were reported for IFB4, as they were below the limit of detection of the HA assay (Figure 5b).

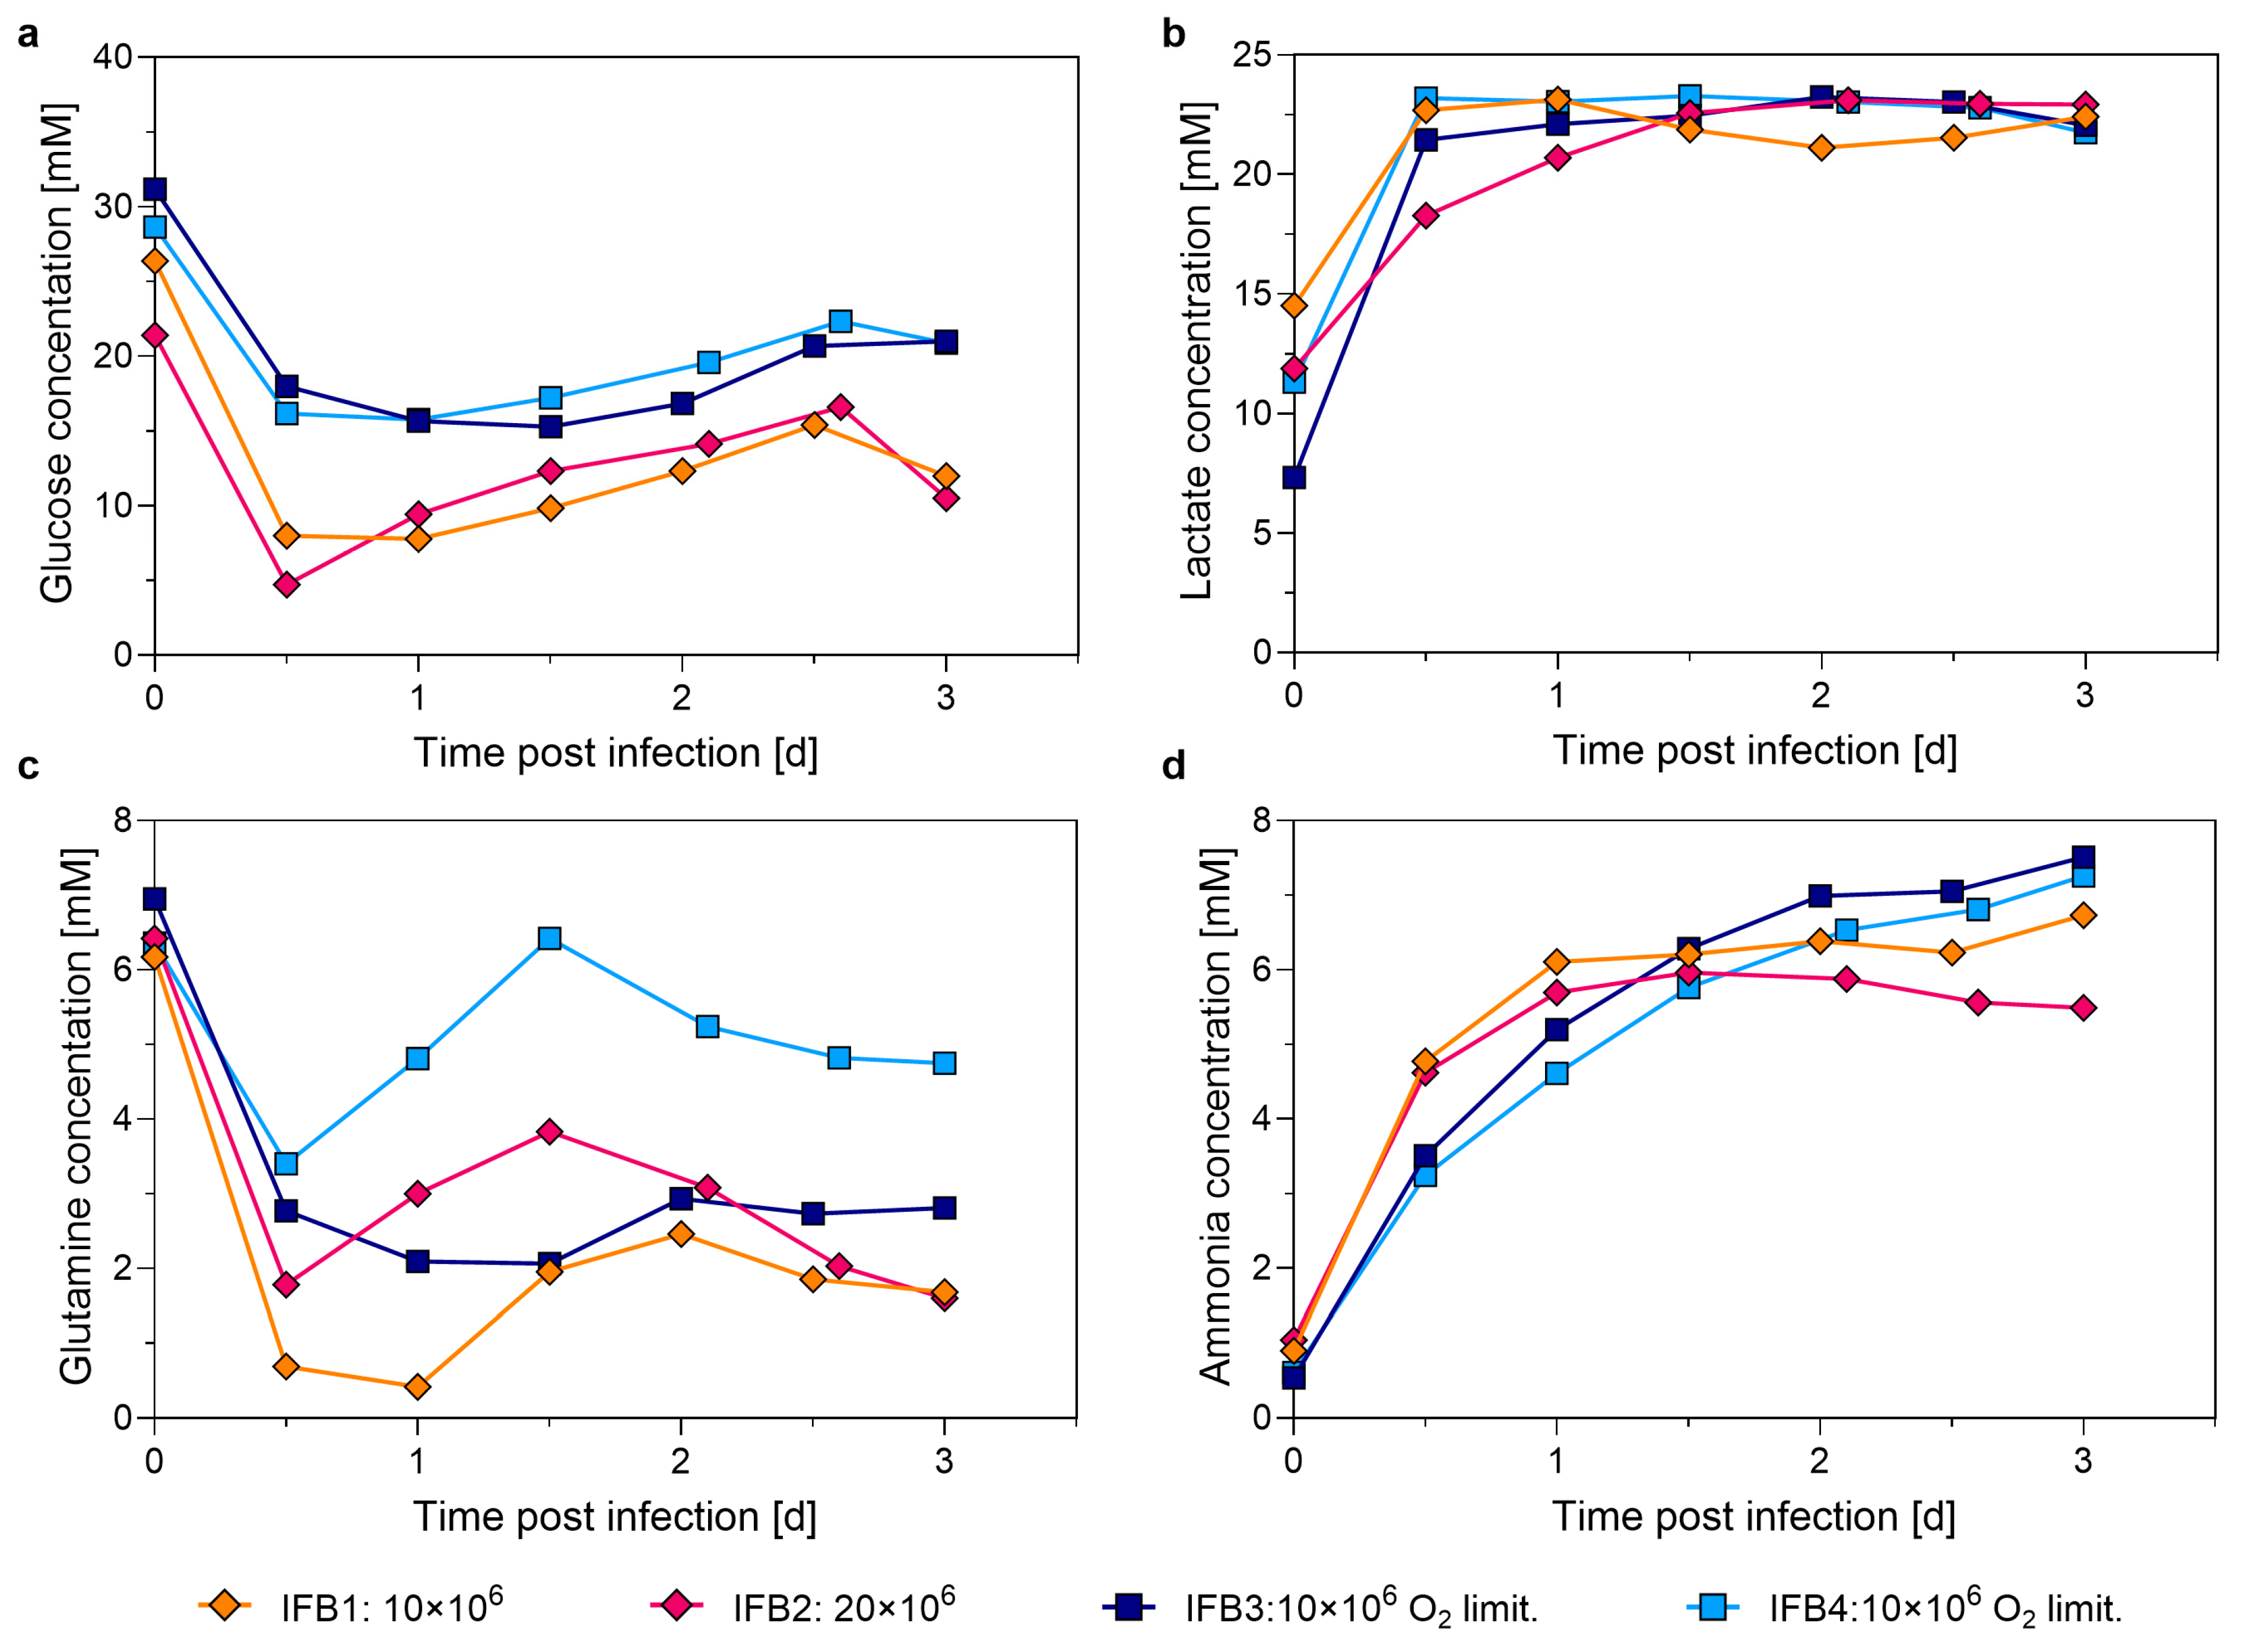
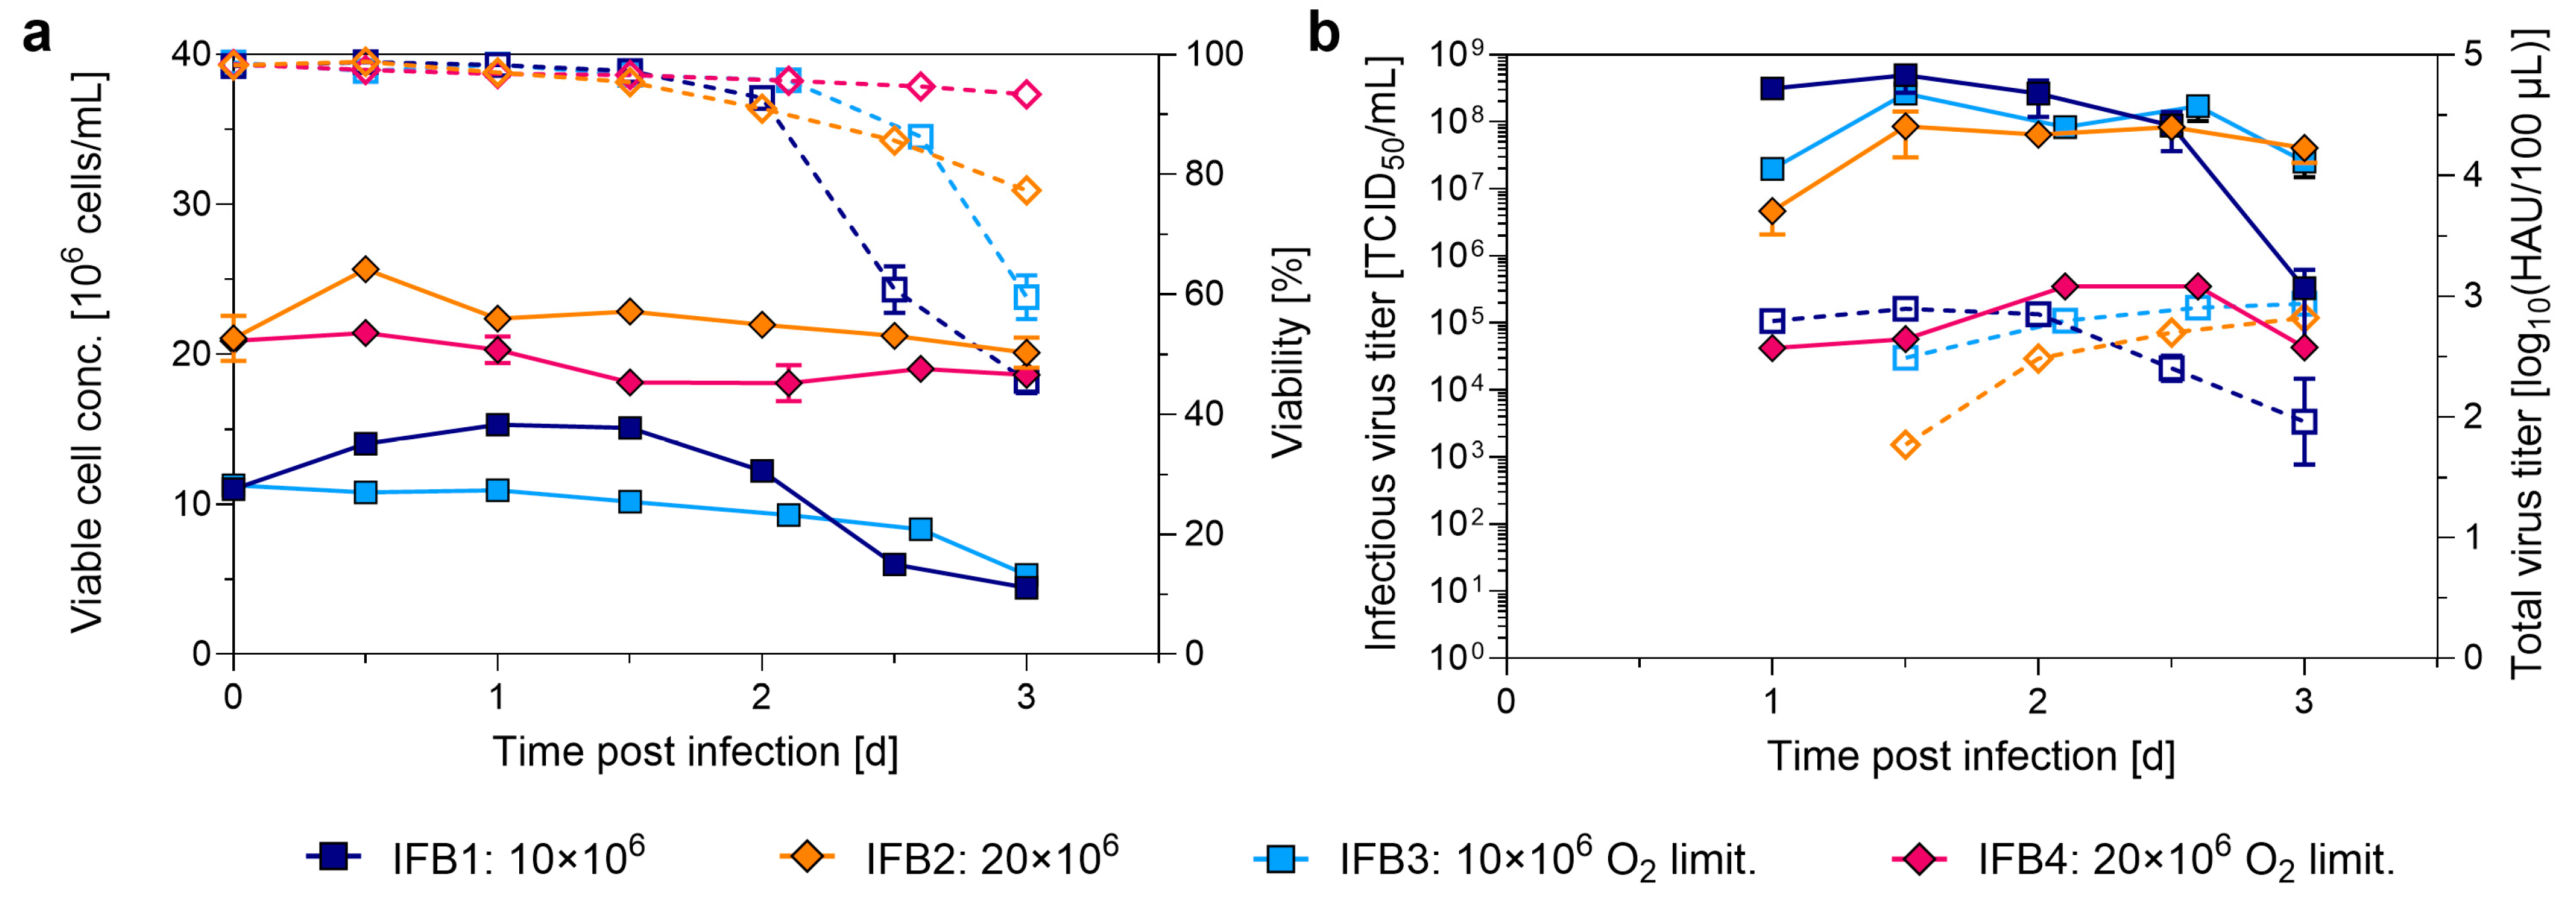
3.4. Testing the Impact of High Cell Density Cryopreservation on Cell Growth and IAV Production

During the N-1 perfusion, C59 cells were taken to generate two HCD cell banks in 5 mL cryovials (HCD1: 52.0 × 10⁶ cells/mL or HCD2: 93.2 × 10⁶ cells/mL). First, HCD1 and HCD2 were thawed and used to directly inoculate shake flasks 8.0 × 10⁵ cells/mL, mimicking the N-stage production. Triplicate experiments were performed using three cryovials from both HCD cell banks and compared to the control infection (Table 2). Shake flasks inoculated from both HCD cell banks exhibited a prolonged lag phase of 1 or 2 d, respectively, with culture viability dropping as low as 60% (Figure 6a). After a 1 d lag phase, HCD1 cells resumed growth but with a 33% lower cell-specific growth rate (0.024 ± 0.001 1/h) compared to the control (0.036 ± 0.001 1/h). In contrast, cells from HCD2 experienced an extended 2 d lag phase, after which their cell-specific growth rate (0.036 ± 0.004 1/h) aligned with that of the control. Upon a partial medium exchange and trypsin addition at the time of infection, viabilities recovered to 90% for both HCD cultures but subsequently declined to 65% by 3 dpi, while VCC remained stagnant (Figure 6a).
Next, using the HCD cell banks as inocula for N-stage production, a 1 L STR (700 mL wv) was inoculated with a starting VCD of 0.8 × 10⁶ cells/mL from a 5 mL cryovial (Figure 6a). Direct thawing in a stirred environment led to a prolonged lag phase of 3 d, longer than that observed in shake flask cultures. Within the first day, viability dropped to 60% post-inoculation before gradually recovering to 80% until infection, as seen before for the shake flasks. Due to the longer lag phase, glucose depletion occurred once the VCC reached 2.3 × 10⁶ cells/mL, necessitating infection at half the VCC compared to previous experiments. Nonetheless, maximum total and infectious virus titers of 2.9 log10(HAU/100 µL) and 4.2 × 10⁸ TCID50/mL were reached (Figure 6b). Compared to the control infection, CSVY was increased by 2.5-fold and similar STY and VVP were reached.

4. Discussion

4.1. Reaching High Cell Densities in a Small-Scale Semi-Perfusion Model

As a first step towards process intensification, a CSPR-based semi-perfusion strategy was applied that allowed us to push both cell lines toward HCDs. By adapting the protocol established by Bissinger et al. for MDCK.Xe.E suspension cells [30], we optimized CSPRs based on the specific metabolic demands and proliferation characteristics of each cell line. While C59 required an increased CSPR of 84 pL/cell/d compared to the MDCK.Xe.E cells with 60 pL/cell/d, C113 showed an even higher demand, requiring up to 120 pL/cell/d using a highly supplemented medium to sustain growth and virus production. In line with previous batch experiments, C59 outperformed C113 in cell growth, reaching a maximum VCC of 41.0 × 10⁶ cells/mL, while C113 peaked at 13.6 × 10⁶ cells/mL. These values represent approximately a threefold increase compared to their standard batch cultures [29], meeting the definition of HCD as described in the literature [32]. Although the exponential growth phase could be prolonged, both cell lines exhibited growth stagnation from day six onwards, ultimately leading to the termination of the experiment on day ten. In contrast, Bissinger et al. reported VCCs for MDCK.Xe.E growing in Xeno-S001S medium that exceeded 60.0 × 10⁶ cells/mL within 7 days [30].
Besides higher VCCs, virus titers could be improved for both cell lines, but CSVYs were about 2-fold lower in the SP experiments compared to batch mode. This may seem to be counterintuitive but could be explained by a HCD effect, describing that more cells do not necessarily produce more virus [9,33,34]. For previous SP experiments using MDCK.Xe.E cells, this problem was not described, and an even higher maximum total virus titer of 4.2 log10(HAU/100 µL) and CSVYs up to 13,600 vp/cell were achieved [30]. Another explanation may be the conditions of the non-controlled culture. Although implementing a semi-perfusion strategy is a common small-scale model to explore HCDs [35,36,37], maintaining a stable culture environment in shake flasks remains challenging. A notable limitation was the persistent pH drop, which fell below 7.0 throughout the cultivation despite frequent medium exchanges. To counteract this, an additional base was introduced for C113. In general, variations of medium temperature, pH and osmolality cannot be omitted using an SP strategy, and this may result in cell stress or negatively impact virus stability.

4.2. Improved IAV Productivity Using a TFDF-Based Perfusion Setup

Building on prior advances in hybrid and intensified processes for influenza virus production [10,18], this study explores the application of a TFDF-based perfusion system to suspension MDCK cells C59 and C113.
Similar to the SP experiments, perfusion allowed for higher VCCs in comparison to the batch benchmark, and similar growth rates were reached. However, required CSPRs in STRs were drastically higher (up to 400 pL/cell/d). Increased shear in stirred systems, combined with high hydrodynamic stress caused by the TFDF system (shear rates of 1700 s−1), could be one explanation for the increased CSPR compared to SP cultures in shake flasks [38]. However, as the cell-specific growth rates were not affected, the different supplementation of the medium (higher glucose and glutamine concentration in SF) is likely to be the primary reason. Based on the lower CSVYs obtained at infections above 30.0 × 10⁶ cells/mL for C59 and 15.0 × 10⁶ cells/mL for C113 in the SP runs, TFDF-based perfusions were infected at lower VCCs of 17.8 × 10⁶ cells/mL and 7.3 × 10⁶ cells/mL, respectively. Both cell lines reached titers that were higher than in batch or SP mode, and for the first time, C59 even outperformed C113 in titers. Moreover, a 10-fold improvement in STY in comparison to a batch process was achieved, indicating a successful first try for this process intensification approach for this cell line. However, for C113, a 4-fold improvement in STY and the highest CSVY ever reported of 28,882 vp/cell was achieved, probably owing to the comparably low VCCs.
In the past, continuous virus harvesting has been challenging when using membrane-based CRDs due to membrane clogging and virus retention [9,10,11]. Using a tubular membrane with about 10 µm pore size in ATF mode, continuous influenza virus harvest has been shown before [39]. However, this technology is not available on a commercial scale. Although concerns around filter fouling and cost exist, TFDF systems are currently available at scales up to 2000 L, making them suitable for clinical and commercial manufacturing. Importantly, the short duration of influenza virus production processes (typically 2–4 days) due to the lytic nature of the virus significantly reduces the risk of membrane clogging compared to longer-lasting processes such as continuous monoclonal antibody production, which can extend over several weeks. In our study, no filter fouling or performance decline was observed within the 3-day virus production window. Here, our findings are in line with a previous study of IAV production in HEK293SF cells and viral vector production in perfusion [17,18,19,20,40].
Despite these successes, the potential for further process refinements is given. The growth phase showed nutrient limitations, particularly for C113, where glucose depletion occurred despite early perfusion onset. Additionally, while perfusion helped maintain stable conditions, C113 experienced stagnated proliferation after four days at lower VCCs in comparison to the SP experiments, necessitating process interventions such as higher oxygen supply, media optimization, or additional nutrient supplementation as for SP in shake flasks. Compared to ATF perfusions of MDCK.Xe.E cells infected above 40.0 × 10⁶ cells/mL, lower maximum total virus titers were reached, but STYs and VVPs were similar, despite significantly higher medium usage (200–400 pL/cell/d compared to 60 pL/cell/d) [10]. Moreover, the STY and VVP suggested that a later harvest for C59 could have further increased overall productivity, which was not true for C113, highlighting the need for refined timing strategies. Clearly, a limitation of this study is that we only conducted single-run experiments, mainly due to the high cost of media and TFDF filters in an academic setting. As such, the present work should be considered a proof-of-concept that can hopefully encourage more in-depth evaluation.
While continuous virus harvesting is essential for thermosensitive products that require high infectivity (e.g., live-attenuated IAV vaccines), it is less critical for inactivated IAV vaccines. A thorough evaluation is necessary to weigh the benefits of integrated clarification, such as eliminating the need for depth filtration, against the challenges of increased harvest volumes for downstream processing. The use of traditional 0.2 µm membranes, which retain the virus within the bioreactor [9], could be advantageous by concentrating the product in situ, potentially removing the need for a separate concentration step later in the process. The available literature data on various suspension MDCK cell lines growing in various media might inspire further process optimization towards still higher VCCs and higher virus titers. Moreover, additional optimization of perfusion rates, infection timing, and cell-specific productivity will be essential to maximize process efficiency across different cell lines.
Overall, our findings demonstrate the feasibility of TFDF-based perfusion for IAV manufacturing. By enabling high cell densities, stable cultivation, and continuous virus recovery, this approach paves the way for improved large-scale vaccine production. However, a comprehensive cost and risk assessment would be necessary to fully evaluate whether the productivity gains and facility efficiency justify such an implementation over established batch processes.

4.3. Evaluation of Seed Train Intensification by N-1 Perfusion

During inoculum production, perfusion processes are used to maintain cells in seed-train bioreactors in continuous exponential growth, reaching densities above 108 cells/mL. This approach replaces multiple seed train steps with a single bioreactor, making the process more efficient. Notably, the final bioreactor before production, the so-called N-1 bioreactor, is often operated in perfusion mode, a strategy widely known as N-1 perfusion [23]. This method simplifies the workflow and allows direct inoculation of large production bioreactors from compact perfusion systems, improving efficiency and scalability. Batch cultivations were used as N-stage processes to evaluate the impact of HCD conditions in the N-1 perfusion stage on virus titers. Conventional seed trains in SFs at low cell concentrations served as controls. The results indicated that neither an extended post-thaw cell age of 7 d nor the increased VCC did affect cell growth, as similar cell-specific growth rates, peak VCCs, and viabilities were observed. Additionally, infectious and total virus titers remained unchanged. The introduction of cellular stress typically reduces growth but can enhance productivity and increase cell diameter. Several studies have reported increased specific productivity after cell enlargement following the induction of hypothermia [41], cell cycle arrest [42], hyperosmotic stress [43], CO2 limitation, pH shifts, and macronutrient alterations [44]. Here, we directly assessed the impact of oxygen by maintaining the DO setpoint at 10% as a simple and reproducible process modification to enhance virus titers. Oxygen depletion led to a significant reduction in cell size compared to the control (p < 0.0001) and resulted in drastically lower virus titers. Previous studies suggest that IAV induces the glycolytic pathway, thereby promoting efficient viral replication [45]. However, this effect was observed only during the infection phase. Upon restoring the DO setpoint to 40%, both cell size and virus titers recovered to levels comparable to the control production. This suggests a degree of robustness in the N-1 perfusion process, as similar virus titers were achieved after reinstating normal conditions following a stress event. Moreover, cells continued to grow, and with a peak VCC of 63.9 × 10⁶ cells/mL at day 7, we even achieved the highest number ever reported for a suspension MDCK cell line.
Overall, none of the IFB strategies resulted in a significant improvement in virus titers compared to batch production. This may be due to the accumulation of inhibitory by-products such as ammonia or suboptimal feeding strategies using a non-optimized feed that warrants further optimization. However, STY and VVP increased by 2.3–3-fold and 1.9–2.1-fold, respectively. While dynamic feeding strategies effectively prevented metabolite depletion, lactate and ammonia accumulated to high levels. Elevated ammonia and lactate concentrations are known to negatively impact virus productivity and cell growth [46], which was reflected in a 70% decrease in CSVY. These findings suggest that direct inoculation at the target VCC for infection (2.0 × 10⁶ cells/mL) could help achieve comparable virus titers to control infections [29] while enhancing STY and VVP through a significantly shortened process duration. Additionally, the development of concentrated feed media tailored for virus production could be a crucial step toward optimizing fed-batch processes.

4.4. Implementation of High Cell Density Cryopreservation for IAV Production

HCD cryopreservation is a strategy used to freeze large volumes of cells at elevated viable cell densities. This approach minimizes the need for extensive cell proliferation steps after thawing, reducing labor and time during inoculum production. Compared to traditional HCD cryopreservation strategies that aim to reduce seed train unit operations, we wanted to investigate whether direct inoculation of a N-stage bioreactor without any seed train is feasible.
With our attempt, we were able to set up an IAV production process in SFs and STR directly inoculated from HCD cryovials. Considering IAV production, similar titers and even slightly improved yields were achieved with our approach. However, a prolonged lag phase and significant viability drop were observed. In the STR, the lag phase was even one day longer, which might be caused by a higher shear stress in comparison to SFs [47,48]. To reduce shear stress on the cells, it may be beneficial to maintain a reduced agitation speed for the first days of cell growth instead of 2 h only. Alternatively, using a wave or orbitally shaken bioreactor for production might be another option [22,49] when a maximum wv of 2500 L is sufficient.
To protect cells from ice crystal formation during the freezing process, we used DMSO, which is considered the gold standard used as a cryoprotectant. However, its toxicity, potential to cause epigenetic alterations and negative effects on certain cell types are well known. Thus, trying a different cryoprotectant, e.g., polyampholytes, that were shown to improve post-thaw outcomes [50], could be another possibility to improve the freeze and thaw process further. Additionally, long-term storage stability studies should be performed to confirm viability over extended periods.
Despite a 2.5-day longer production process when starting from HCD cryopreservation, this strategy would shorten total production times (seed train + production) by more than 50% (7 d shake flask + 4 d N-1 seed train). Thus, preserving cells at higher viable densities can allow the production process to scale up more quickly upon thawing, accelerating the overall timeline and ensuring a more consistent and reliable supply of cells for downstream production. Ultimately, this can reduce process costs and increase flexibility to react to changing demands.

5. Conclusions

Process intensification can target various stages of a process. In this study, we implemented multiple upstream process intensification strategies for cell culture-based IAV production. To this end, we used two clonal suspension MDCK cell lines, C59 and C113, each with unique characteristics. By tailoring process intensification techniques to the specific needs of each cell line, we successfully optimized HCD ranges, identified CSPRs, and refined process conditions through semi-perfusion pretesting and 3 L bioreactor experiments using TFDF technology. In the latter case, STY could be improved 4-fold for C113 and 10-fold for C59, demonstrating the benefits of a fully controlled perfusion process combined with continuous virus harvesting. Furthermore, the impact of seed train intensification for the C59 cell line via N-1 perfusion was evaluated for batch and intensified fed-batch production processes. Lastly, we investigated the application of HCD cryopreservation for direct inoculation of N-stage production, a method that has the potential to significantly reduce process times. Overall, the findings of our study demonstrate that process intensification can improve virus yields and concomitantly reduce process times, thereby contributing to a more efficient process.

Author Contributions

Conceptualization, T.Z. and Y.G.; methodology, T.Z. and S.G.; investigation, T.Z., E.W. and S.G.; resources, U.R.; data curation, T.Z.; writing—original draft preparation, T.Z.; writing—review and editing, T.Z., E.W., S.G., U.R. and Y.G.; visualization, T.Z.; supervision, Y.G.; project administration, T.Z. and Y.G. All authors have read and agreed to the published version of the manuscript.

Funding

This research received no external funding.

Data Availability Statement

Data is available from the corresponding author upon reasonable request.

Acknowledgments

The authors would like to thank Corina Siewert for her excellent technical support in cell culture handling and assay execution. We highly appreciate the technical advice given by Béla Brühlmann and would like to thank Sandra Klausing, Kristin Thiele and Rachel Legmann for their support. Moreover, we would like to thank Sartorius Stedim Biotech GmbH for providing the suspension cell lines and the cell culture medium, as well as Repligen for providing the TFDF system.

Conflicts of Interest

The authors declare no conflicts of interest.

Abbreviations

The following abbreviations are used in this manuscript:
ATFAlternating tangential flow filtration
BBatch
CSPRCell-specific perfusion rate
CSVYCell-specific virus yield
DODissolved oxygen
dpiDays post-infection
HCDHigh cell density
hpiHours post-infection
IAVInfluenza A virus
IFBIntensified fed-batch
ISTIntensified seed train
MOIMultiplicity of infection
PRPerfusion rate
RVReactor volume
SPSemi-perfusion
STRStirred-tank reactor
STYSpace-time yield
TFDFTangential flow depth filtration
TFFTangential flow filtration
TOITime of infection
VCCViable cell concentration
VVPVolumetric virus productivity
wvWorking volume

Appendix A

Figure A1. IAV production using C59 ((ac), squares) and C113 ((df), triangles) cells at HCD in shake flasks using a semi-perfusion strategy. (a,d) Viable cell count (solid line, full symbols) and viability (dashed line, empty symbols); (b,e) cell diameter and pH value; (c,f) infectious and total virus titer. The left y-axis has solid lines with full symbols, and the right y-axis has dashed lines and empty symbols. The vertical line indicates the time of infection.
Processes 13 01286 g0a1
Figure A2. Concentrations of key metabolites during IAV production using TFDF-based perfusion in a 3 L STR. The cells were inoculated at a VCC of 0.5 × 10⁶ cells/mL, and perfusion was initiated for C113 cells (orange triangles) after 40 h and for C59 cells (blue squares) after 68 h of batch growth phase, respectively. Prior to infection, the medium was completely replaced with a trypsin-containing medium (3%) and the temperature was reduced to 33 °C. C113 cells were infected at a VCC of 7.3 × 10⁶ cells/mL and C59 cells at 17.8 × 10⁶ cells/mL with a multiplicity of infection of 0.001. Levels of (a) glucose, (b) lactate, (c) glutamine, and (d) ammonia. The vertical line indicates the time of infection.
Processes 13 01286 g0a2
Figure A3. Linear regression of single-frequency permittivity and viable cell concentration during the cell growth phase for TFDF-based perfusion (C59, blue squares; C113, orange triangles) and ATF perfusion for N-1 seed train intensification (C59, green squares).
Processes 13 01286 g0a3
Figure A4. The impact on C59 cell growth and virus titers for an intensified seed train via N-1 perfusion. (a) Growth, (b) total and (c) infectious virus titer. At different VCCs, cells were taken from the N-1 perfusion STR to inoculate production shake flasks at 0.8 × 10⁶ cells/mL. Batch productions inoculated from a conventional seed train (4.0–6.0 × 10⁶ cells/mL) were used as a positive control. When a target density of 4.0 × 10⁶ cells/mL was reached, cells were 2-fold diluted and infected with IAV at an MOI of 0.001. A one-way ANOVA followed by Dunnett’s multiple comparison tests was conducted to investigate (a) the growth following inoculation, (b) total virus titer, and (c) infectious virus titer post-infection. Statistical difference between groups is denoted by p-values < 0.05: * p values < 0.05, ** p-values < 0.01, **** p-values < 0.0001. Values are shown as mean ± STD. All cultivations were carried out as biological triplicates (n = 3).
Processes 13 01286 g0a4
Figure A5. Concentrations of key metabolites during the intensified fed-batch (IFB) using C59 cells. Cells were taken from the N-1 perfusion STR to inoculate shake flasks at 10.0 or 20.0 × 10⁶ cells/mL, with or without oxygen limitation. The cells were directly infected with IAV at an MOI of 0.001. Levels of (a) glucose, (b) lactate, (c) glutamine, and (d) ammonia were determined over the course of the entire process.
Processes 13 01286 g0a5

References

  1. Zinnecker, T.; Reichl, U.; Genzel, Y. Innovations in cell culture-based influenza vaccine manufacturing—From static cultures to high cell density cultivations. Hum. Vaccin. Immunother. 2024, 20, 2373521. [Google Scholar] [CrossRef] [PubMed]
  2. Groner, A.; Vorlop, J. Animal Cells and Processes for the Replication of Influenza Viruses. CA2250714C, 6 November 2008. [Google Scholar]
  3. Gregersen, J.P.; Schmitt, H.J.; Trusheim, H.; Broker, M. Safety of MDCK cell culture-based influenza vaccines. Future Microbiol. 2011, 6, 143–152. [Google Scholar] [CrossRef]
  4. Pelz, L.; Göbel, S.; Jaen, K.; Reichl, U.; Genzel, Y. Upstream processing for viral vaccines—General aspects. In Bioprocessing of Viral Vaccines; Kamen, A., Cervera, L., Eds.; Taylor & Francis: Abingdon, UK, 2023; pp. 79–136. [Google Scholar]
  5. Göbel, S.; Pelz, L.; Reichl, U.; Genzel, Y. Upstream processing for viral vaccines—Process intensification. In Bioprocessing of Viral Vaccines; Kamen, A., Cervera, L., Eds.; Taylor & Francis: Abingdon, UK, 2023; pp. 137–174. [Google Scholar]
  6. Chotteau, V. Perfusion Processes. In Animal Cell Culture; Al-Rubeai, M., Ed.; Cell Engineering; Springer: Berlin/Heidelberg, Germany, 2015; pp. 407–443. [Google Scholar]
  7. Konstantinov, K.B.; Cooney, C.L. White Paper on Continuous Bioprocessing May 20–21 2014 Continuous Manufacturing Symposium. J. Pharm. Sci. 2015, 104, 813–820. [Google Scholar] [CrossRef] [PubMed]
  8. Langer, E.S.; Rader, R.A. Continuous bioprocessing and perfusion: Wider adoption coming as bioprocessing matures. Bioprocess. J. 2014, 13, 50–55. [Google Scholar] [CrossRef]
  9. Genzel, Y.; Vogel, T.; Buck, J.; Behrendt, I.; Ramirez, D.V.; Schiedner, G.; Jordan, I.; Reichl, U. High cell density cultivations by alternating tangential flow (ATF) perfusion for influenza A virus production using suspension cells. Vaccine 2014, 32, 2770–2781. [Google Scholar] [CrossRef]
  10. Wu, Y.; Bissinger, T.; Genzel, Y.; Liu, X.; Reichl, U.; Tan, W.S. High cell density perfusion process for high yield of influenza A virus production using MDCK suspension cells. Appl. Microbiol. Biotechnol. 2021, 105, 1421–1434. [Google Scholar] [CrossRef]
  11. Vazquez-Ramirez, D.; Jordan, I.; Sandig, V.; Genzel, Y.; Reichl, U. High titer MVA and influenza A virus production using a hybrid fed-batch/perfusion strategy with an ATF system. Appl. Microbiol. Biotechnol. 2019, 103, 3025–3035. [Google Scholar] [CrossRef]
  12. Granicher, G.; Coronel, J.; Pralow, A.; Marichal-Gallardo, P.; Wolff, M.; Rapp, E.; Karlas, A.; Sandig, V.; Genzel, Y.; Reichl, U. Efficient influenza A virus production in high cell density using the novel porcine suspension cell line PBG.PK2.1. Vaccine 2019, 37, 7019–7028. [Google Scholar] [CrossRef]
  13. Coronel, J.; Behrendt, I.; Burgin, T.; Anderlei, T.; Sandig, V.; Reichl, U.; Genzel, Y. Influenza A virus production in a single-use orbital shaken bioreactor with ATF or TFF perfusion systems. Vaccine 2019, 37, 7011–7018. [Google Scholar] [CrossRef]
  14. Petiot, E.; Jacob, D.; Lanthier, S.; Lohr, V.; Ansorge, S.; Kamen, A.A. Metabolic and kinetic analyses of influenza production in perfusion HEK293 cell culture. BMC Biotechnol. 2011, 11, 84. [Google Scholar] [CrossRef]
  15. Coronel, J.; Granicher, G.; Sandig, V.; Noll, T.; Genzel, Y.; Reichl, U. Application of an Inclined Settler for Cell Culture-Based Influenza A Virus Production in Perfusion Mode. Front. Bioeng. Biotechnol. 2020, 8, 672. [Google Scholar] [CrossRef] [PubMed]
  16. Granicher, G.; Coronel, J.; Trampler, F.; Jordan, I.; Genzel, Y.; Reichl, U. Performance of an acoustic settler versus a hollow fiber-based ATF technology for influenza virus production in perfusion. Appl. Microbiol. Biotechnol. 2020, 104, 4877–4888. [Google Scholar] [CrossRef]
  17. Gobel, S.; Pelz, L.; Silva, C.A.T.; Bruhlmann, B.; Hill, C.; Altomonte, J.; Kamen, A.; Reichl, U.; Genzel, Y. Production of recombinant vesicular stomatitis virus-based vectors by tangential flow depth filtration. Appl. Microbiol. Biotechnol. 2024, 108, 240. [Google Scholar] [CrossRef] [PubMed]
  18. Silva, C.A.T.; Kamen, A.A.; Henry, O. Intensified Influenza Virus Production in Suspension HEK293SF Cell Cultures Operated in Fed-Batch or Perfusion with Continuous Harvest. Vaccines 2023, 11, 1819. [Google Scholar] [CrossRef]
  19. Tran, M.Y.; Kamen, A.A. Production of Lentiviral Vectors Using a HEK-293 Producer Cell Line and Advanced Perfusion Processing. Front. Bioeng. Biotechnol. 2022, 10, 887716. [Google Scholar] [CrossRef] [PubMed]
  20. Mendes, J.P.; Fernandes, B.; Pineda, E.; Kudugunti, S.; Bransby, M.; Gantier, R.; Peixoto, C.; Alves, P.M.; Roldao, A.; Silva, R.J.S. AAV process intensification by perfusion bioreaction and integrated clarification. Front. Bioeng. Biotechnol. 2022, 10, 1020174. [Google Scholar] [CrossRef]
  21. Tao, Y.; Shih, J.; Sinacore, M.; Ryll, T.; Yusuf-Makagiansar, H. Development and implementation of a perfusion-based high cell density cell banking process. Biotechnol. Prog. 2011, 27, 824–829. [Google Scholar] [CrossRef]
  22. Müller, J.; Ott, V.; Eibl, D.; Eibl, R. Seed Train Intensification Using an Ultra-High Cell Density Cell Banking Process. Processes 2022, 10, 911. [Google Scholar] [CrossRef]
  23. Woodgate, J.M. Perfusion N-1 Culture—Opportunities for Process Intensification. In Biopharmaceutical Processing; ScienceDirect: Amsterdam, The Netherlands, 2018; pp. 755–768. [Google Scholar]
  24. Müller, J.; Ott, V.; Weiss, N.; Neubauer, P.; Eibl, D.; Eibl, R. Process Intensification Using a One-Step Inoculum Production and High-Seeded Fed-Batch Processes. Chem. Ing. Tech. 2022, 94, 1977–1984. [Google Scholar] [CrossRef]
  25. Jordan, M.; Mac Kinnon, N.; Monchois, V.; Stettler, M.; Broly, H. Intensification of large-scale cell culture processes. Curr. Opin. Chem. Eng. 2018, 22, 253–257. [Google Scholar] [CrossRef]
  26. Xu, J.; Rehmann, M.S.; Xu, M.; Zheng, S.; Hill, C.; He, Q.; Borys, M.C.; Li, Z.J. Development of an intensified fed-batch production platform with doubled titers using N-1 perfusion seed for cell culture manufacturing. Bioresour. Bioprocess. 2020, 7, 17. [Google Scholar] [CrossRef]
  27. Yongky, A.; Xu, J.; Tian, J.; Oliveira, C.; Zhao, J.; McFarland, K.; Borys, M.C.; Li, Z.J. Process intensification in fed-batch production bioreactors using non-perfusion seed cultures. MAbs 2019, 11, 1502–1514. [Google Scholar] [CrossRef]
  28. Stepper, L.; Filser, F.A.; Fischer, S.; Schaub, J.; Gorr, I.; Voges, R. Pre-stage perfusion and ultra-high seeding cell density in CHO fed-batch culture: A case study for process intensification guided by systems biotechnology. Bioprocess. Biosyst. Eng. 2020, 43, 1431–1443. [Google Scholar] [CrossRef] [PubMed]
  29. Zinnecker, T.; Badri, N.; Araujo, D.; Thiele, K.; Reichl, U.; Genzel, Y. From single-cell cloning to high-yield influenza virus production—Implementing advanced technologies in vaccine process development. Eng. Life Sci. 2024, 24. [Google Scholar] [CrossRef] [PubMed]
  30. Bissinger, T.; Fritsch, J.; Mihut, A.; Wu, Y.; Liu, X.; Genzel, Y.; Tan, W.S.; Reichl, U. Semi-perfusion cultures of suspension MDCK cells enable high cell concentrations and efficient influenza A virus production. Vaccine 2019, 37, 7003–7010. [Google Scholar] [CrossRef]
  31. Kalbfuss, B.; Knochlein, A.; Krober, T.; Reichl, U. Monitoring influenza virus content in vaccine production: Precise assays for the quantitation of hemagglutination and neuraminidase activity. Biologicals 2008, 36, 145–161. [Google Scholar] [CrossRef]
  32. Lavado-García, J.; Pérez-Rubio, P.; Cervera, L.; Gòdia, F. The cell density effect in animal cell-based bioprocessing: Questions, insights and perspectives. Biotechnol. Adv. 2022, 60, 108017. [Google Scholar] [CrossRef]
  33. Wohlpart, D.; Kirwan, D.; Gainer, J. Effects of cell density and glucose and glutamine levels on the respiration rates of hybridoma cells. Biotechnol. Bioeng. 1990, 36, 630–635. [Google Scholar] [CrossRef]
  34. Henry, O.; Dormond, E.; Perrier, M.; Kamen, A. Insights into adenoviral vector production kinetics in acoustic filter-based perfusion cultures. Biotechnol. Bioeng. 2004, 86, 765–774. [Google Scholar] [CrossRef]
  35. Vazquez-Ramirez, D.; Genzel, Y.; Jordan, I.; Sandig, V.; Reichl, U. High-cell-density cultivations to increase MVA virus production. Vaccine 2018, 36, 3124–3133. [Google Scholar] [CrossRef]
  36. Nikolay, A.; Bissinger, T.; Gränicher, G.; Wu, Y.; Genzel, Y.; Reichl, U. Perfusion Control for High Cell Density Cultivation and Viral Vaccine Production. In Animal Cell Biotechnology, 4th ed.; Pörtner, R., Ed.; Methods in Molecular Biology; Springer Protocols: Berlin/Heidelberg, Germany, 2020; pp. 141–168. [Google Scholar]
  37. Janoschek, S.; Schulze, M.; Zijlstra, G.; Greller, G.; Matuszczyk, J. A protocol to transfer a fed-batch platform process into semi-perfusion mode: The benefit of automated small-scale bioreactors compared to shake flasks as scale-down model. Biotechnol. Prog. 2019, 35, e2757. [Google Scholar] [CrossRef] [PubMed]
  38. Zhan, C.; Bidkhori, G.; Schwarz, H.; Malm, M.; Mebrahtu, A.; Field, R.; Sellick, C.; Hatton, D.; Varley, P.; Mardinoglu, A.; et al. Low Shear Stress Increases Recombinant Protein Production and High Shear Stress Increases Apoptosis in Human Cells. iScience 2020, 23, 101653. [Google Scholar] [CrossRef]
  39. Hein, M.D.; Chawla, A.; Cattaneo, M.; Kupke, S.Y.; Genzel, Y.; Reichl, U. Cell culture-based production of defective interfering influenza A virus particles in perfusion mode using an alternating tangential flow filtration system. Appl. Microbiol. Biotechnol. 2021, 105, 7251–7264. [Google Scholar] [CrossRef] [PubMed]
  40. Tona, R.M.; Shah, R.; Middaugh, K.; Steve, J.; Marques, J.; Roszell, B.R.; Jung, C. Process intensification for lentiviral vector manufacturing using tangential flow depth filtration. Mol. Ther. Methods Clin. Dev. 2023, 29, 93–107. [Google Scholar] [CrossRef] [PubMed]
  41. Martinez, V.S.; Buchsteiner, M.; Gray, P.; Nielsen, L.K.; Quek, L.E. Dynamic metabolic flux analysis using B-splines to study the effects of temperature shift on CHO cell metabolism. Metab. Eng. Commun. 2015, 2, 46–57. [Google Scholar] [CrossRef]
  42. Martens, D.; Pan, X.; Wijffels, R.; Dalm, C. The relevance of cell size in a CHO fed batch process: Metabolic and transcriptomic characterization. In Proceedings of the Cell Culture Engineering XVI, Tampa, FL, USA, 6–11 May 2018. [Google Scholar]
  43. Kiehl, T.R.; Shen, D.; Khattak, S.F.; Jian Li, Z.; Sharfstein, S.T. Observations of cell size dynamics under osmotic stress. Cytom. A 2011, 79, 560–569. [Google Scholar] [CrossRef]
  44. Schellenberg, J.; Nagraik, T.; Wohlenberg, O.J.; Ruhl, S.; Bahnemann, J.; Scheper, T.; Solle, D. Stress-induced increase of monoclonal antibody production in CHO cells. Eng. Life Sci. 2022, 22, 427–436. [Google Scholar] [CrossRef]
  45. Ren, L.; Zhang, W.; Han, P.; Zhang, J.; Zhu, Y.; Meng, X.; Zhang, J.; Hu, Y.; Yi, Z.; Wang, R. Influenza A virus (H1N1) triggers a hypoxic response by stabilizing hypoxia-inducible factor-1alpha via inhibition of proteasome. Virology 2019, 530, 51–58. [Google Scholar] [CrossRef]
  46. Schneider, M.; Marison, I.W.; von Stockar, U. The importance of ammonia in mammalian cell culture. J. Biotechnol. 1996, 46, 161–185. [Google Scholar] [CrossRef]
  47. Sieck, J.B.; Budach, W.E.; Suemeghy, Z.; Leist, C.; Villiger, T.K.; Morbidelli, M.; Soos, M. Adaptation for survival: Phenotype and transcriptome response of CHO cells to elevated stress induced by agitation and sparging. J. Biotechnol. 2014, 189, 94–103. [Google Scholar] [CrossRef]
  48. Godoy-Silva, R.; Chalmers, J.J.; Casnocha, S.A.; Bass, L.A.; Ma, N. Physiological responses of CHO cells to repetitive hydrodynamic stress. Biotechnol. Bioeng. 2009, 103, 1103–1117. [Google Scholar] [CrossRef] [PubMed]
  49. Monteil, D.T.; Juvet, V.; Paz, J.; Moniatte, M.; Baldi, L.; Hacker, D.L.; Wurm, F.M. A comparison of orbitally-shaken and stirred-tank bioreactors: pH modulation and bioreactor type affect CHO cell growth and protein glycosylation. Biotechnol. Prog. 2016, 32, 1174–1180. [Google Scholar] [CrossRef] [PubMed]
  50. Murray, K.A.; Gibson, M.I. Post-Thaw Culture and Measurement of Total Cell Recovery Is Crucial in the Evaluation of New Macromolecular Cryoprotectants. Biomacromolecules 2020, 21, 2864–2873. [Google Scholar] [CrossRef] [PubMed]
Figure 1. Schematic overview depicting three different seed train strategies used in this study: a conventional seed train, an intensified seed train using N-1 perfusion and high cell density cryopreservation for direct use in production.
Processes 13 01286 g001
Figure 2. IAV production in perfusion mode using a 3-L STR coupled to a TFDF system with a filter pore size of 2–5 μm. Cells were inoculated at a VCC of 0.5 × 10⁶ cells/mL, and perfusion was initiated after 40 h and 68 h of batch growth for C113 cells (orange triangles) and C59 cells (blue squares), respectively. Prior to infection, the medium was completely replaced with a trypsin-containing medium (3%) and the temperature was lowered to 33 °C. C59 cells were infected at a VCC of 17.8 × 10⁶ cells/mL and C113 cells at 7.3 × 10⁶ cells/mL with a multiplicity of infection of 0.001; perfusion was paused for 1–2 h. (a) Viable cell concentration (full symbols) and viability (empty symbols). Single-frequency permittivity data were modeled to fit cell growth prior to infection (dotted line). The spike at 12 hpi can be attributed to a temporary loss of the permittivity signal overnight. The vertical line in (a,c) indicates the time of infection. (b) Infectious (solid lines) and total virus titers were measured (dashed lines) inside the bioreactor (full symbols) and in the permeate line (empty symbols). (c) Cell-specific perfusion rate (full symbols) and perfusion rate (dashed lines). (d) Space-time yield (empty symbols) and volumetric virus productivity (full symbols) based on the total virus titer. The data shown are from single-run experiments (n = 1).
Processes 13 01286 g002
Figure 3. N-1 perfusion for C59 seed train intensification in a 1 L STR coupled to an ATF2 system for cell retention. The STR was inoculated with 0.8 × 10⁶ cells/mL, and perfusion was initiated after day 2 with an increasing perfusion rate. Oxygen limitation was introduced on day 4. After reinstating the DO setpoint, the cells continued to grow. At different VCCs, cells were taken from the STR to inoculate production shake flasks or for HCD cryopreservation. (a) Offline viable cell concentration (black circles), viability (empty circles), DO (black line), and online viable cell concentration from capacitance sensor (red line). (b) Cell-specific perfusion rate (black circles) and perfusion rate (black line). The data shown are from single-run experiments (n = 1).
Processes 13 01286 g003
Figure 4. Evaluation of IAV batch production for C59 cells following a seed train intensification strategy via N-1 perfusion. At varying VCCs, cells were taken from the N-1 perfusion STR to inoculate production shake flasks at 0.8 × 10⁶ cells/mL. For the control, shake flasks were inoculated from a conventional seed train grown up to 4.0–6.0 × 10⁶ cells/mL. When a VCC > 4.0 × 10⁶ cells/mL was reached, cells were 2-fold diluted and infected with IAV at a MOI of 0.001. (a) Viable cell concentration (full symbols, solid line) and cell viability (empty symbols, dashed line), (b) infectious (full symbols, solid line) and total virus titer (empty symbols, dashed line). Values are shown as mean ± STD and the blue shadow indicates a 2-sigma deviation from the control. All cultivations were carried out as biological triplicates (n = 3).
Processes 13 01286 g004
Figure 5. Intensified fed-batch for C59 cells. Cells were taken from the N-1 perfusion STR to inoculate shake flasks at 10.0 or 20.0 × 10⁶ cells/mL, with or without oxygen limitation. The cells were directly infected with IAV at a MOI of 0.001. Nutrients were replenished using 4Cell® Basic Feed or a highly concentrated glutamine stock (200 mM). (a) Viable cell concentration (full symbols, solid line) and cell viability (empty symbols, dashed line), (b) infectious (full symbols, solid line) and total (empty symbols, dashed line) virus titer. Values are shown as mean ± STD. All cultivations were carried out as biological triplicates (n = 3).
Processes 13 01286 g005
Figure 6. Evaluation of HCD cryopreservation for direct inoculation of an IAV production for C59 cells. Two HCD cell banks (HCD1: 52.0 × 10⁶ cells/mL; HCD2: 93.2 × 10⁶ cells/mL) were generated from the N-1 perfusion cultivation. HCD cryovials were thawed and directly used for IAV production in three SFs or one 1 L STR (700 mL wv). When a VCC > 4.0 × 10⁶ cells/mL was reached, the cells were 2-fold diluted and infected with IAV at an MOI of 0.001. In the STR, glucose was depleted, and infection was initiated at 2.3 × 10⁶ cells/mL. (a) Viable cell concentration (full symbols, solid line) and cell viability (empty symbols, dashed line), (b) infectious (full symbols, solid line) and total (empty symbols, dashed line) virus titer during batch infections. Values are shown as mean ± STD. All cultivations were carried out as biological triplicates (n = 3).
Processes 13 01286 g006
Table 1. Comparison of IAV production using C59 and C113 cells for different production modes.
ExperimentB1B2SP1SP2SP3SP4SP5SP6TFDF1TFDF2
Cell lineC59C113C59C59C59C113C113C113C59C113
VCCmax
[106 cells/mL]
4.93.114.029.541.712.416.613.320.18.2
HAmax [log10(HAU/100 µL)]3.03.33.13.53.42.873.33.63.73.5
HAacc [log10(HAU/100 µL)]3.03.33.43.73.93.23.63.84.14.1
TCID50,max
[108 TCID50/mL]
10.013.017.842.275.00.13.217.878.127.7
vir totHA
[1011 vp]
1062501618208162830003060
CSVYHA
[vp/cell]
390014,68017551949116622183148728111,50628,882
wv
[mL]
55055030303030303013001300
STYHA
[1012 vp/L/d]
3.27.611.111.110.03.15.29.332.730.5
VVPHA
[1012 vp/L/d]
3.27.63.31.40.70.60.50.73.72.3
Batch, B; semi-perfusion, SP; tangential flow depth filtration, TFDF; maximum, max; viable cell concentration, VCC; hemagglutination assay, HA; tissue culture infectious dose 50, TCID50; total virus particles, vir tot; vp, virus particles; cell-specific virus yield, CSVY; working volume, wv; space-time yield, STY; volumetric virus productivity, VVP. Values from B1 and B2 are results from STR cultivations from a previous study [1]. SP experiments were carried out in shake flasks. All cultivations are results from a single run (n = 1).
Table 2. Overview of the intensified IAV production using C59 cells for a N-1 perfusion preculture.
ExperimentControlIST1IST2IST3IST4IST5IST6IFB1IFB2IFB3IFB4
VCC N-1/Inoc.
[106 cells/mL]
1020304040
O2 lim.
60102010
O2 lim.
20
O2 lim.
VCCmax
[106 cells/mL]
4.5
±0.1
4.3
±0.2
5.9
±0.1
5.7
±0.1
4.8
±0.1
4.5
±0.1
5.1
±0.2
15.3
±0.2
25.7
±0.2
11.4
±0.4
21.4
±0.4
HAmax
[log10(HAU/100 µL)]
2.8
±0.1
2.8
±0.1
2.9
±0.1
2.7
±0.1
2.8
±0.1
2.6
±0.1
2.7
±0.1
2.9
±0.1
3.0
±0.3
2.9
±0.1
n.d.
TCID50,max
[108 TCID50/mL]
3.5
±2.0
4.7
±0.8
5.0
±2.3
3.3
±2.1
2.1
±1.2
0.2
±0.1
2.7
±1.5
5.3
±2.0
1.0
±0.3
2.6
±0.5
<0.1
 
vir totHA
[1011 vp]
4.1
±0.4
3.6
±0.2
4.8
±0.5
3.3
±0.4
3.8
±0.9
1.4
±0.1
3.3
±0.2
4.7
±0.7
7.3
±1.2
5.4
±0.7
n.d.
CSVYHA
[vp/cell]
3024
±393
2805
±209
2740
±296
1896
±261
2287
±519
1015
±77
1972
±106
1009
±173
743
±373
1575
±238
n.d.
wv
[mL]
3030303030303030
+7
30
+13.5
30
+7
30
+13.2
STYHA
[1012 vp/L/d]
2.8
±0.3
2.6
±0.1
3.6
±0.4
2.3
±0.3
2.6
±0.6
0.7
±0.1
2.2
±0.1
5.2
±0.8
8.2
±2.8
6.0
±0.8
n.d.
VVPHA
[1012 vp/L/d]
2.8
±0.3
2.6
±0.1
3.6
±0.4
2.3
±0.3
2.6
±0.6
0.7
±0.1
2.2
±0.1
4.3
±0.7
5.7
±2.7
4.8
±0.6
n.d.
Intensified seed train, IST; intensified fed-batch, IFB; oxygen limited, O2 lim.; maximum, max; viable cell concentration, VCC; hemagglutination assay, HA; tissue culture infectious dose, TCID50; total virus particles, vir tot; vp, virus particles; cell-specific virus yield, CSVY; working volume, wv; space-time yield, STY; volumetric virus productivity, VVP; not detected, n.d.. All cultivations are results from a biological triplicate (n = 3), values shown as mean ± STD.
Disclaimer/Publisher’s Note: The statements, opinions and data contained in all publications are solely those of the individual author(s) and contributor(s) and not of MDPI and/or the editor(s). MDPI and/or the editor(s) disclaim responsibility for any injury to people or property resulting from any ideas, methods, instructions or products referred to in the content.

