Article

Evolution Characteristics of Roof Stress in Horizontal Segmental Mining of Steeply Inclined Coal Seams

by
Guojun Zhang
1,2,3,*,
Yong Zhang
3,
Shigen Fu
1,2 and
Mingbo Chi
1,2,3,*
1
Institute of Mine Safety Technology, China Academy of Safety Science and Technology, Beijing 100012, China
2
Key Laboratory of Non-Coal Mine Safety Risk Monitoring and Early Warning, National Mine Safety Administration, Beijing 100012, China
3
School of Energy and Mining Engineering, China University of Mining and Technology (Beijing), Beijing 100083, China
*
Authors to whom correspondence should be addressed.
Processes 2025, 13(5), 1317; https://doi.org/10.3390/pr13051317
Submission received: 4 March 2025 / Revised: 16 April 2025 / Accepted: 22 April 2025 / Published: 25 April 2025
(This article belongs to the Topic Advances in Coal Mine Disaster Prevention Technology)

Abstract

:
Steeply inclined coal seams, characterized by their significant inclination angles and complex storage conditions, are globally recognized as challenging seams to mine. An orthogonal test was conducted to study the influence of four key factors, including burial depth, inclination angle, lateral pressure coefficient, and maximum horizontal principal stress direction angle, on the force on the top slab of the sharply inclined extra-thick coal seam. The research findings indicate the following: The normal stress in the hollow area above the working face increases with greater burial depth, and the normal stress in the mining hollow area above the working face increases with an increase in the lateral pressure coefficient. Within the range of 4 m from the top edge of the seam, the normal stress distribution is approximately linear, and the influence of each factor on the average value of normal stress is in the following order: inclination angle > depth of burial > angle between the maximum horizontal principal stress and the strike angle of the seam > lateral pressure coefficient; outside the range of 4 m from the top edge of the seam, the distribution of normal stress is approximately linear, and the influence of each factor on the average value of normal stress is in the following order: angle between the maximum horizontal principal stress and the strike of the formation > inclination angle > depth of burial > lateral pressure coefficient.

1. Introduction

Steeply inclined coal seams, characterized by their significant inclination angles and complex storage conditions, are globally recognized as challenging to mine [1]. Although such seams account for only about 5% of national coal reserves [2], they typically comprise high-quality coking coals, oil-rich coals, and other scarce coal types [3]. Safe and efficient extraction of these seams is crucial for achieving sustainable, efficient, and environmentally friendly coal-mining practices, as well as fostering the high-quality development of the national economy.
Since the 1970s, countries such as the Soviet Union, France, and Germany have undertaken research into mining technologies, mechanical equipment, and rock control techniques, achieving notable progress. Post-2000, however, major Western coal-mining nations have largely ceased mining such seams, leading to a decline in related research [4,5]. In China, since the 1980s, numerous institutional enterprises have conducted extensive studies in various mines, including the Lushuidong Coal Mine in Sichuan [6], the Dongxia Coal Mine of the Huating Coal Group in Gansu [7], the Xinjiang Coking Coal Group [8], and the Adaohai Coal Mine [9,10]. These studies have explored diverse mining methods under varying conditions in steeply inclined coal seams, such as heading longwall integrated mining, integrated release mining, large mining height mining, and large-section high-level segmental roof coal mining. Mining steeply inclined coal seams introduces complexities influenced by the “gravity-inclination” effect, resulting in more intricate stress transfer modes and spatial patterns of surrounding rock under mining-induced unloading when compared to near-horizontal seams. This makes controlling chain disasters in the mining field particularly challenging. Numerous scholars have explored the movement laws of surrounding rocks and disaster prevention in the context of the horizontal segmental mining of steeply inclined seams. For instance, Yang [11] developed a three-dimensional coal wall model to analyze the damage caused by support pressure, identifying coal wall flake gang sizes to be influenced by unit shape, size, and friction angle. They also established a mechanical model for supports under dynamic loading conditions, deriving critical force equations for tipping and sliding limit states. Similarly, Lu [12] constructed a realistic geological model to examine the spatial and temporal distribution of micro-seismic activities in order to determine events that are concentrated in key coal seam areas.
Additional insights include the discovery of Xiong et al. [13] regarding a prismatic cone-shaped coal wall destruction pattern related to seam inclination and coal body nature, the observation of Xie [14] with respect to time-dependent damage characteristics in roadways with asymmetric stress distributions, and Yan’s [15] classification of ground surface deformation zones. Li [16] has pointed out that, due to their special geometric shape and geological conditions, the roof structures in steeply inclined coal seams are prone to instability and collapse. They further explored the factors affecting the stability of the roof, such as the angle of inclination of the coal seam, the lithology of the roof, the mining technology, and the distribution of ground stress. Kong [17] analyzed the “coal wall–brace–roof” interaction system under steeply inclined seam storage conditions, while He [18] focused on the key impacts of certain layers on roof stability. Wang [19] comprehensively analyzed support stability factors, while Cui [20] examined the mechanisms of mining disasters such as roof collapses and landslides.
Using the FLAC3D version 5.0 finite element numerical simulation software, this study conducted nine numerical simulation experiments across three levels, examining four factors: burial depth, inclination angle, lateral pressure coefficient, and maximum horizontal principal stress direction angle. The experiments aimed to uncover normal stress distribution patterns on the roof rock layer’s top slab in terms of both inclination and direction across different advance distances and segments of the working face. The results of this study highlight how these factors influence the stress distribution in the roof, providing insights into the complex dynamics of steeply inclined coal seam mining.

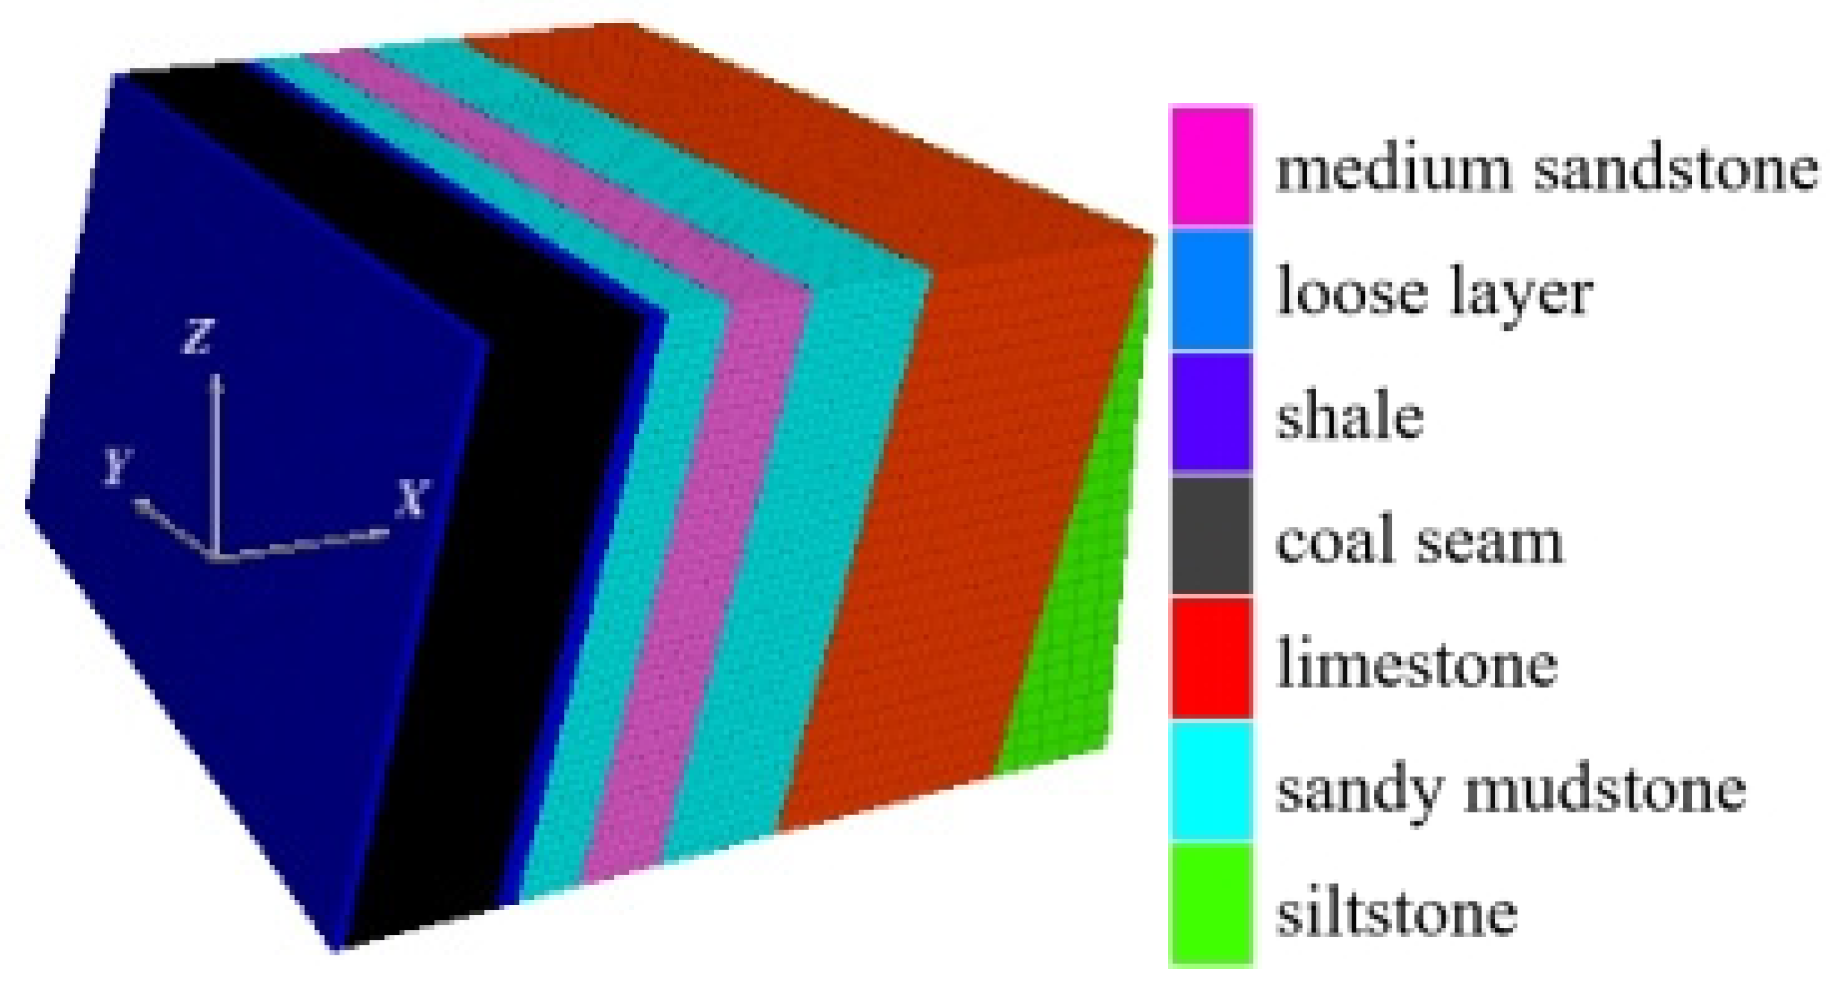
2. Overview of the Coal Mine

This work takes the Adaohai Mine as the research engineering background, which is located on the southern margin of Daqingshan Coalfield of the Yinshan Mountains, at a distance of 15 km from Salazi Station and 7 km from the Beijing–Tibet highway in Inner Mongolia, China. The topography of Adaohai Mine is very complicated, with steep cliffs, high mountains, deep valleys, and V-shaped gully development. The average dip angle of the coal seams in this mine is 75°, with a maximum of 86°. The average thickness of the coal seams is 26 m, and the height of the subsections is 16 m, as shown in Figure 1.

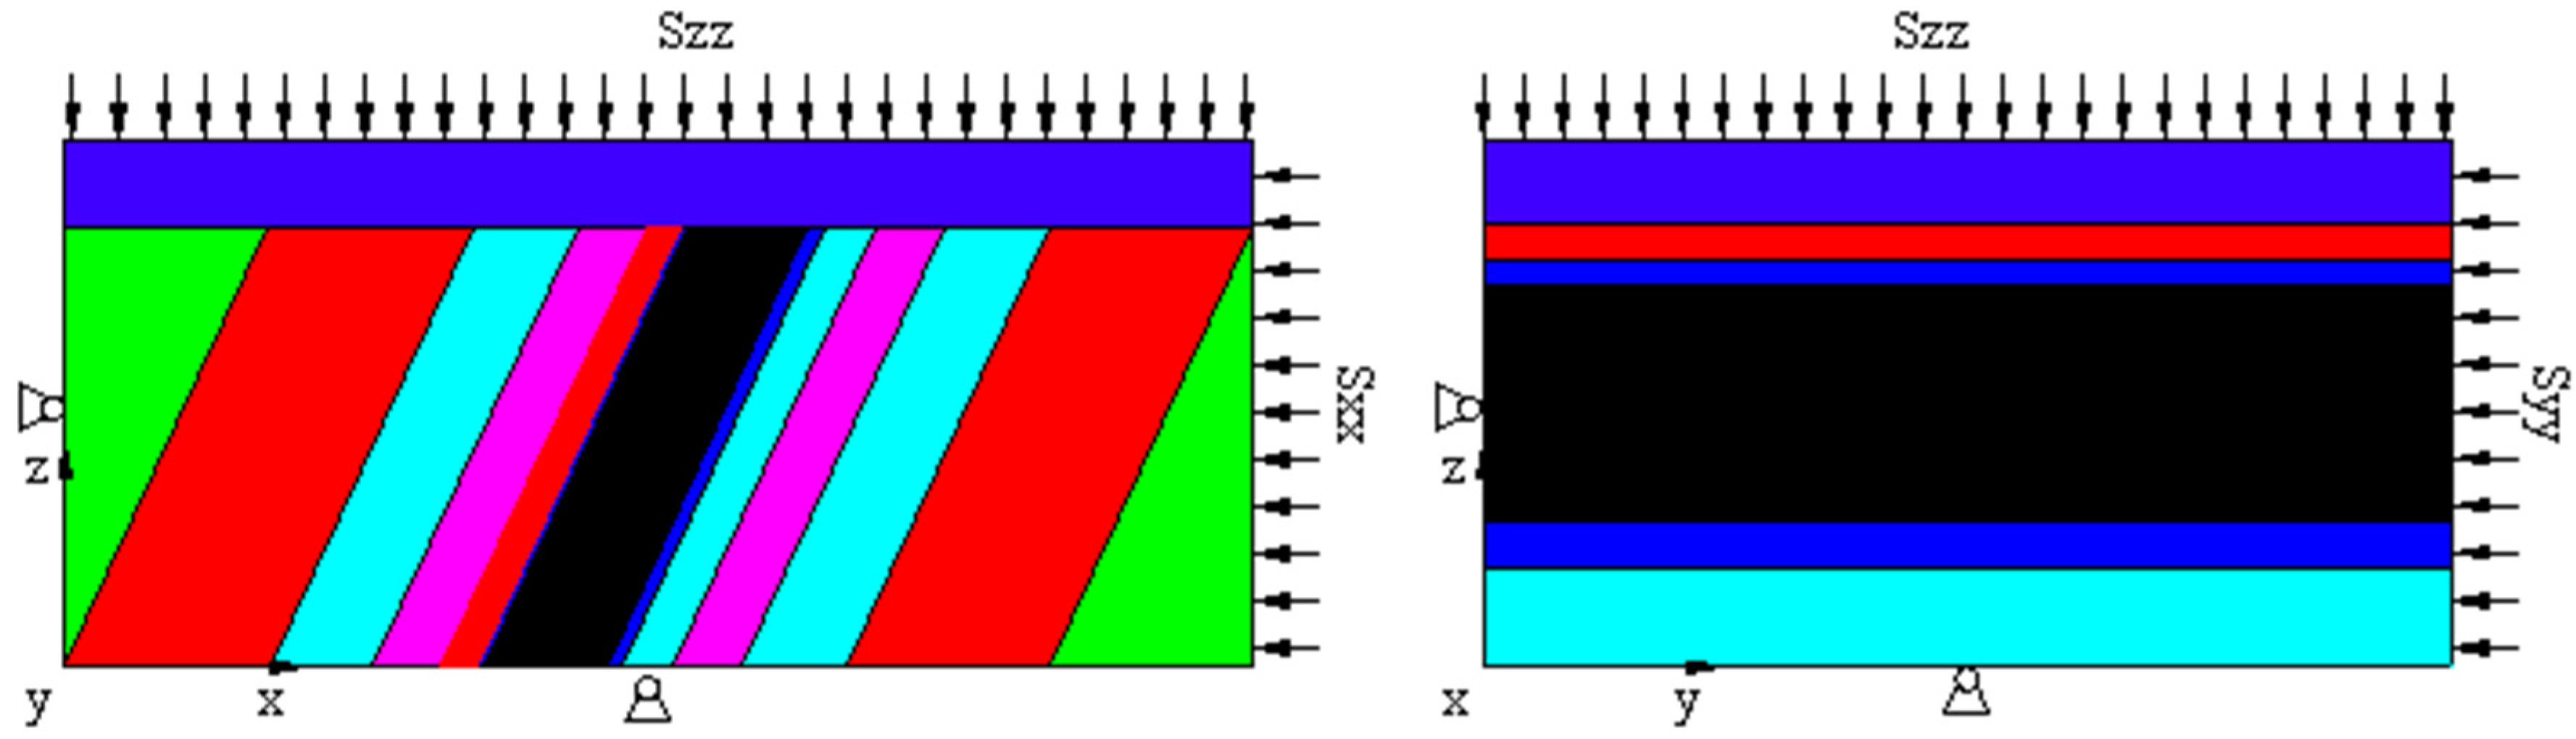
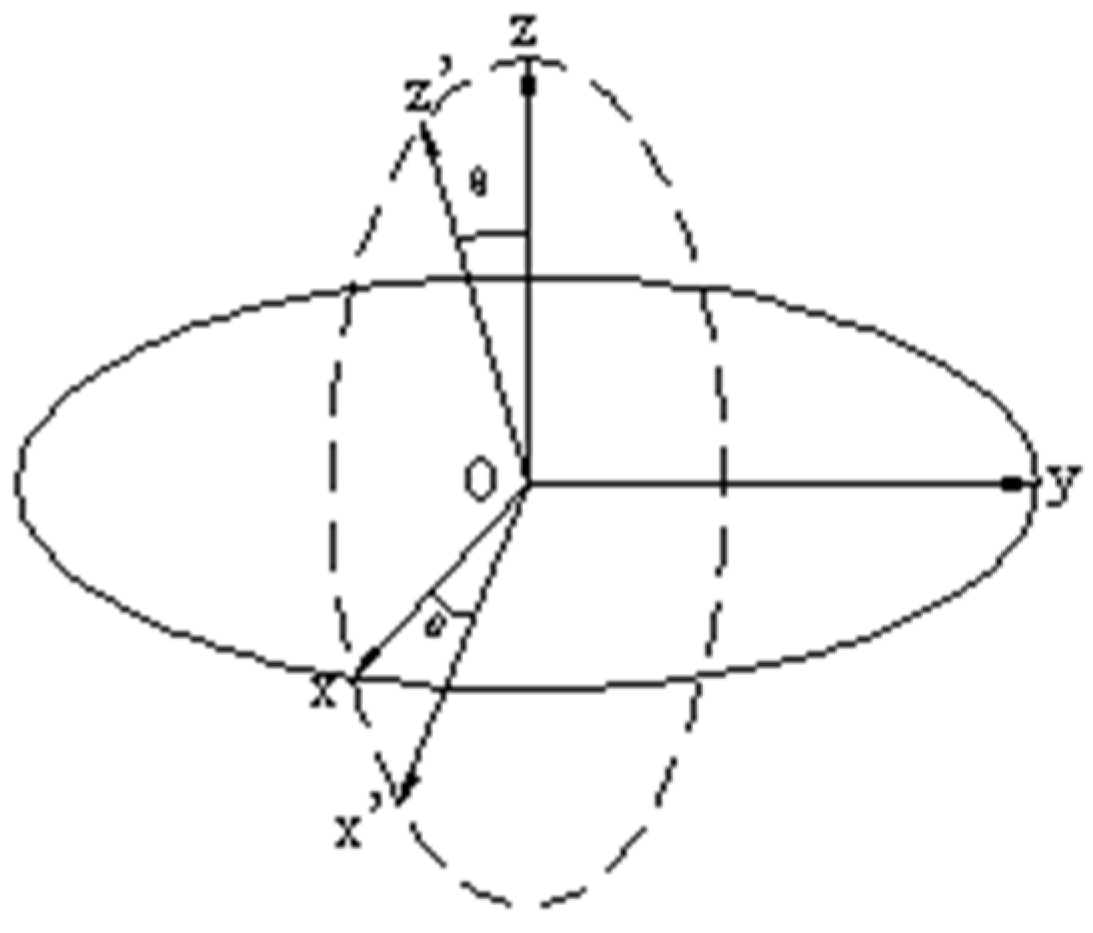
3. Orthogonal Test Modeling

Orthogonal test analysis is primarily employed in multi-factor optimization experiments. This method leverages the principles of mathematical statistics and orthogonality to select a representative combination of tests from a large dataset. Utilizing orthogonal experimental tables for rational test arrangement, optimal experimental results can be achieved with minimal test runs. This experimental design method is particularly effective in determining the primary and secondary relationships among influencing factors and analyzing how test indices change at different levels of each factor. Direct comparison and intuitive analysis methods are the primary applications of orthogonal testing.
As the manifestation of force is typically continuous, FLAC3D finite element simulation is well suited for simulating the stress state of surrounding rock during coal seam mining. Combined with actual geological data from the Adaohai Coal Mine, it is evident that numerous coal and rock seams (especially the direct top) consist of two or more rock seams with distinct lithologies. Coal and rock seams with similar mechanical properties and smaller thicknesses can be grouped together during model establishment. A FLAC3D model of the horizontal segmented integrated mining process was employed to simulate the coal seam and replicate the stress environment of the roof plate. In this structural model, the Mohr–Coulomb failure criterion is employed in the stress analysis.
To better analyze the influences of different factors on the stress distribution of the coal seam roof while minimizing the number of tests, this study adopted the orthogonal test method. The simulation analysis involved four factors (each with three levels): burial depth, maximum horizontal principal stress angle, lateral pressure coefficient, and inclination.
Burial depth: As the burial depth increases, the weight of the overlying rock layer increases, leading to an increase in vertical stress; the horizontal stress also changes accordingly. Moreover, the temperature, humidity, and other environmental conditions that the geologic body is subject to will differ, where these factors affect the mechanical properties of the geologic material, which, in turn, will indirectly affect the stress distribution.
Maximum horizontal principal stress angle: This angle determines the direction of the maximum horizontal principal stress, which is often directionally determined by the mechanical properties of materials such as rocks. Different angles of maximum horizontal principal stresses lead to different forms of stress distribution within the object under the same external force.
Lateral pressure coefficient: This reflects the relative magnitude of horizontal stresses in relation to vertical stresses. In many geomechanical problems and engineering scenarios, the lateral pressure coefficient directly affects the ratio of horizontal to vertical loads on a structure.
Inclination: In this context, inclination usually refers to the inclination of the level of the body or the inclination of the structural surface. A change in inclination will change the path and distribution of stresses inside the geoid. Under different inclinations, the stress components caused by gravity and other external forces inside the geoid will differ, and the inclination will also affect the mechanical behavior of the structural surface (e.g., its shear strength).
The specific simulation experiments are detailed in Table 1.
To comprehensively and objectively analyze the stress environment of the roof slab during the segmented mining process at the Adaohai Mine, models with varying coal seam inclinations were developed. These models (as illustrated in Figure 2) incorporate different rock seam inclinations, and their dimensions are detailed in Table 2.
Integrating actual geological data from the Adaohai Mine and the lithology of the coal seam’s top and bottom plates, the model was simplified into 13 distinct coal and rock seams. The material properties for numerical simulations were based on field drilling data; in particular, cores were obtained via drilling, and the drilled cores were brought back to the laboratory for uniaxial compression, triaxial compression, Brazilian disc, and elastic wave testing to obtain the basic mechanical parameters used in the numerical simulations. All of the nine test groups employed the Mohr–Coulomb model. The thicknesses of these seams and their mechanical parameters are detailed in Table 3.
Vertical stress was applied to the upper part of the model to simulate the roof plate’s stress environment during coal seam mining with varying burial depths. By adjusting the boundary conditions in the x and y directions, the stress environment of the roof plate under different horizontal principal stresses and lateral pressure coefficients was modeled.
According to the experiment, the vertical stress is positively correlated with the burial depth, according to the equation ‘σH = γH’, where the gravity γ was experimentally determined as 2.5 × 10⁴ N/m3, and according to the maximum principal stress and its azimuth calculation, the formula for the material mechanics is as follows:
σ 1 = 1 2 σ x + σ y + 1 2 σ x σ y 2 + 4 τ x y 2 σ 2 = 1 2 σ x + σ y 1 2 ( σ x σ y ) 2 + 4 τ x y 2 α 0 = 1 2 arctan 2 τ x y σ x σ y
where σ1 and σ2 are the maximum and minimum horizontal principal stresses in the plane; σx and σy are the stresses in the x and y directions, respectively; τxy is the shear stress in the plane; and a0 is the angle representing the direction of maximum horizontal principal stress.
As the boundary conditions need to be imposed on the boundary during the simulation process and, in most cases, the principal stresses as well as the direction angles are known, it is necessary to back-calculate σx and σy acting on the model boundary from the principal stresses (σ1, σ2) and the direction angle a0; therefore, a transformation based on Equation (1) is required:
σ x = σ 1 cos 2 α 0 + σ 2 sin 2 α 0 σ y = σ 1 sin 2 α 0 + σ 2 cos 2 α 0
The transverse pressure coefficient determines the relative magnitude of the horizontal stress in relation to the vertical stress. When the transverse pressure coefficient increases, this means that the horizontal stress increases relative to the vertical stress. This can lead to changes in the distribution of stresses around structures such as underground caverns and tunnels. The concentration of stresses in the horizontal direction may increase, making the walls of the cavern more susceptible to shear or tensile damage and thus affecting the stability of the structure. A change in the transverse pressure coefficient has a significant effect on the results—as such, it is one of the parameters of interest in many rock mechanics and geoengineering problems—and the exact degree of its influence needs to be quantitatively analyzed through numerical simulation, physical experiments, and on-site monitoring in conjunction with specific engineering or geological problems through a variety of means. In most cases, the difference between the maximum horizontal principal stress σ1 and the minimum horizontal principal stress σ2 is large. Through an assessment of the results of the geostress tests in 13 mines (see Table 4), the average σ1/σ2 value was set as 1.84 in the experiment.
As the model size and the number of cell nodes are positively correlated with the time and memory required for model calculation, the simulation process under different burial depth conditions was realized by applying the corresponding stresses at the upper boundary of the model, in order to minimize the calculation time and memory required to guarantee the accuracy of the simulation. Simulation of the direction of the main stresses with different lateral pressure coefficients and different maximum levels was realized by adjusting the boundary conditions in the model. Different maximum horizontal principal stress angles and lateral pressure coefficients were realized by adjusting the boundary conditions of the model, where the stress boundary conditions were set according to Equation (2). Mesh sensitivity analysis requires multiple simulations to be run, allowing for the calculation of the results under different mesh densities, which significantly increases computational time and resource consumption. Due to limited computational resources, mesh sensitivity analysis was not carried out. To complete this study with the limited computational resources available, a validated meshing method was used here. The material properties used in numerical simulations were based on field drilling data, as described above. To adjust the boundary conditions in the model in order to realize the simulation of different lateral pressure coefficients and different directions of the maximum level of principal stresses, the stress boundary conditions were applied on two adjacent sides and the displacement boundary conditions on the other sides. The simulation boundary conditions obtained using the orthogonal test method are shown in Table 5.
To better illustrate the imposition of the model boundary conditions, the 75° model is used as an example to apply the stresses Szz, Sxx, and Syy, as well as the fixed displacements, to the different surfaces that sit tangent to the vertical y-axis and the middle of the x-axis, as shown in Figure 3.
After the initial equilibrium of the model was achieved, excavation of the upper and lower subsections was carried out, where each subsection was excavated for up to 80 m. A boundary influence zone of 60 m was left at the two ends of the working face in the advance direction. Excavation of the working face was carried out sequentially, with 4 m of excavation at each time. Excavation of the upper subsections at 20 m, 40 m, and 80 m, as well as the lower subsections at 20 m, 40 m, and 80 m, could not be analyzed due to the limitations of this study. Therefore, only some of the experimental results of the simulation process were analyzed, that is, 40 m and 80 m in the upper section and 20 m, 40 m, and 80 m in the lower section.
In the simulation, it was ensured that the maximum unbalanced force coefficient of the model was less than 10–5 after each opening by setting the maximum unbalanced force coefficient to 10–5, allowing for full consideration of the redistribution of rock stress after excavation.

4. Analyzing the Stress of the Roof Through Numerical Simulation

4.1. Processing Simulation Result Data

The stresses (i.e., Sxx, Syy, Szz, Sxy, Sxz, Sxz) in each unit of the coal seam roof mudstone during the simulation were extracted along the inclination direction of the rock formation, as shown in Figure 4, where the stresses in the rock formation were derived along the coordinate axes.
According to the conversion relationship between the stress state at the same point before and after the different coordinate transformations used in elastodynamics, the stress of each unit was converted to the stress value in the spatial right-angled coordinate system Ox′y′z′, with the x′-axis being the inclination direction of the rock formation, the y′-axis being the strike direction of the formation, and the z′-axis being the perpendicular direction of the formation, which is obtained by rotating θ along the y-axis on the basis of the original coordinate system Oxyz. Considering the y′z′ stress value in the Ox′y′z′ coordinate system, as shown in Figure 5, the stress relationship under the two coordinate systems is given as follows:
σ x = σ x cos 2 θ + σ z sin 2 θ τ x z sin 2 θ σ z = σ x sin 2 θ + σ z cos 2 θ + τ x z sin 2 θ τ x y = τ y z sin θ + τ x y cos θ τ y z = τ y z cos θ + τ x y sin θ τ x z = σ x σ z sin θ cos θ + τ x z cos 2 θ
here the value for the extraction zone in Equation (3) is the stress value in the rotated coordinate system Ox′y′z′, the right-hand side of Equation (3) denotes the stress value in the original coordinate system Oxyz, and θ is the angle at which the coordinate system is rotated along the y-axis.
The top plate stresses in the partial range of the nine models in the above orthogonal tests were derived and transformed using Equation (3), that is, the stresses in the top plate cells of the nine models (Sxx, Syy, Szz, Sxy, Sxz, Sxz) were transformed into stresses in the normal direction in the Ox′y′z′ coordinate system, as well as the tangential stresses.

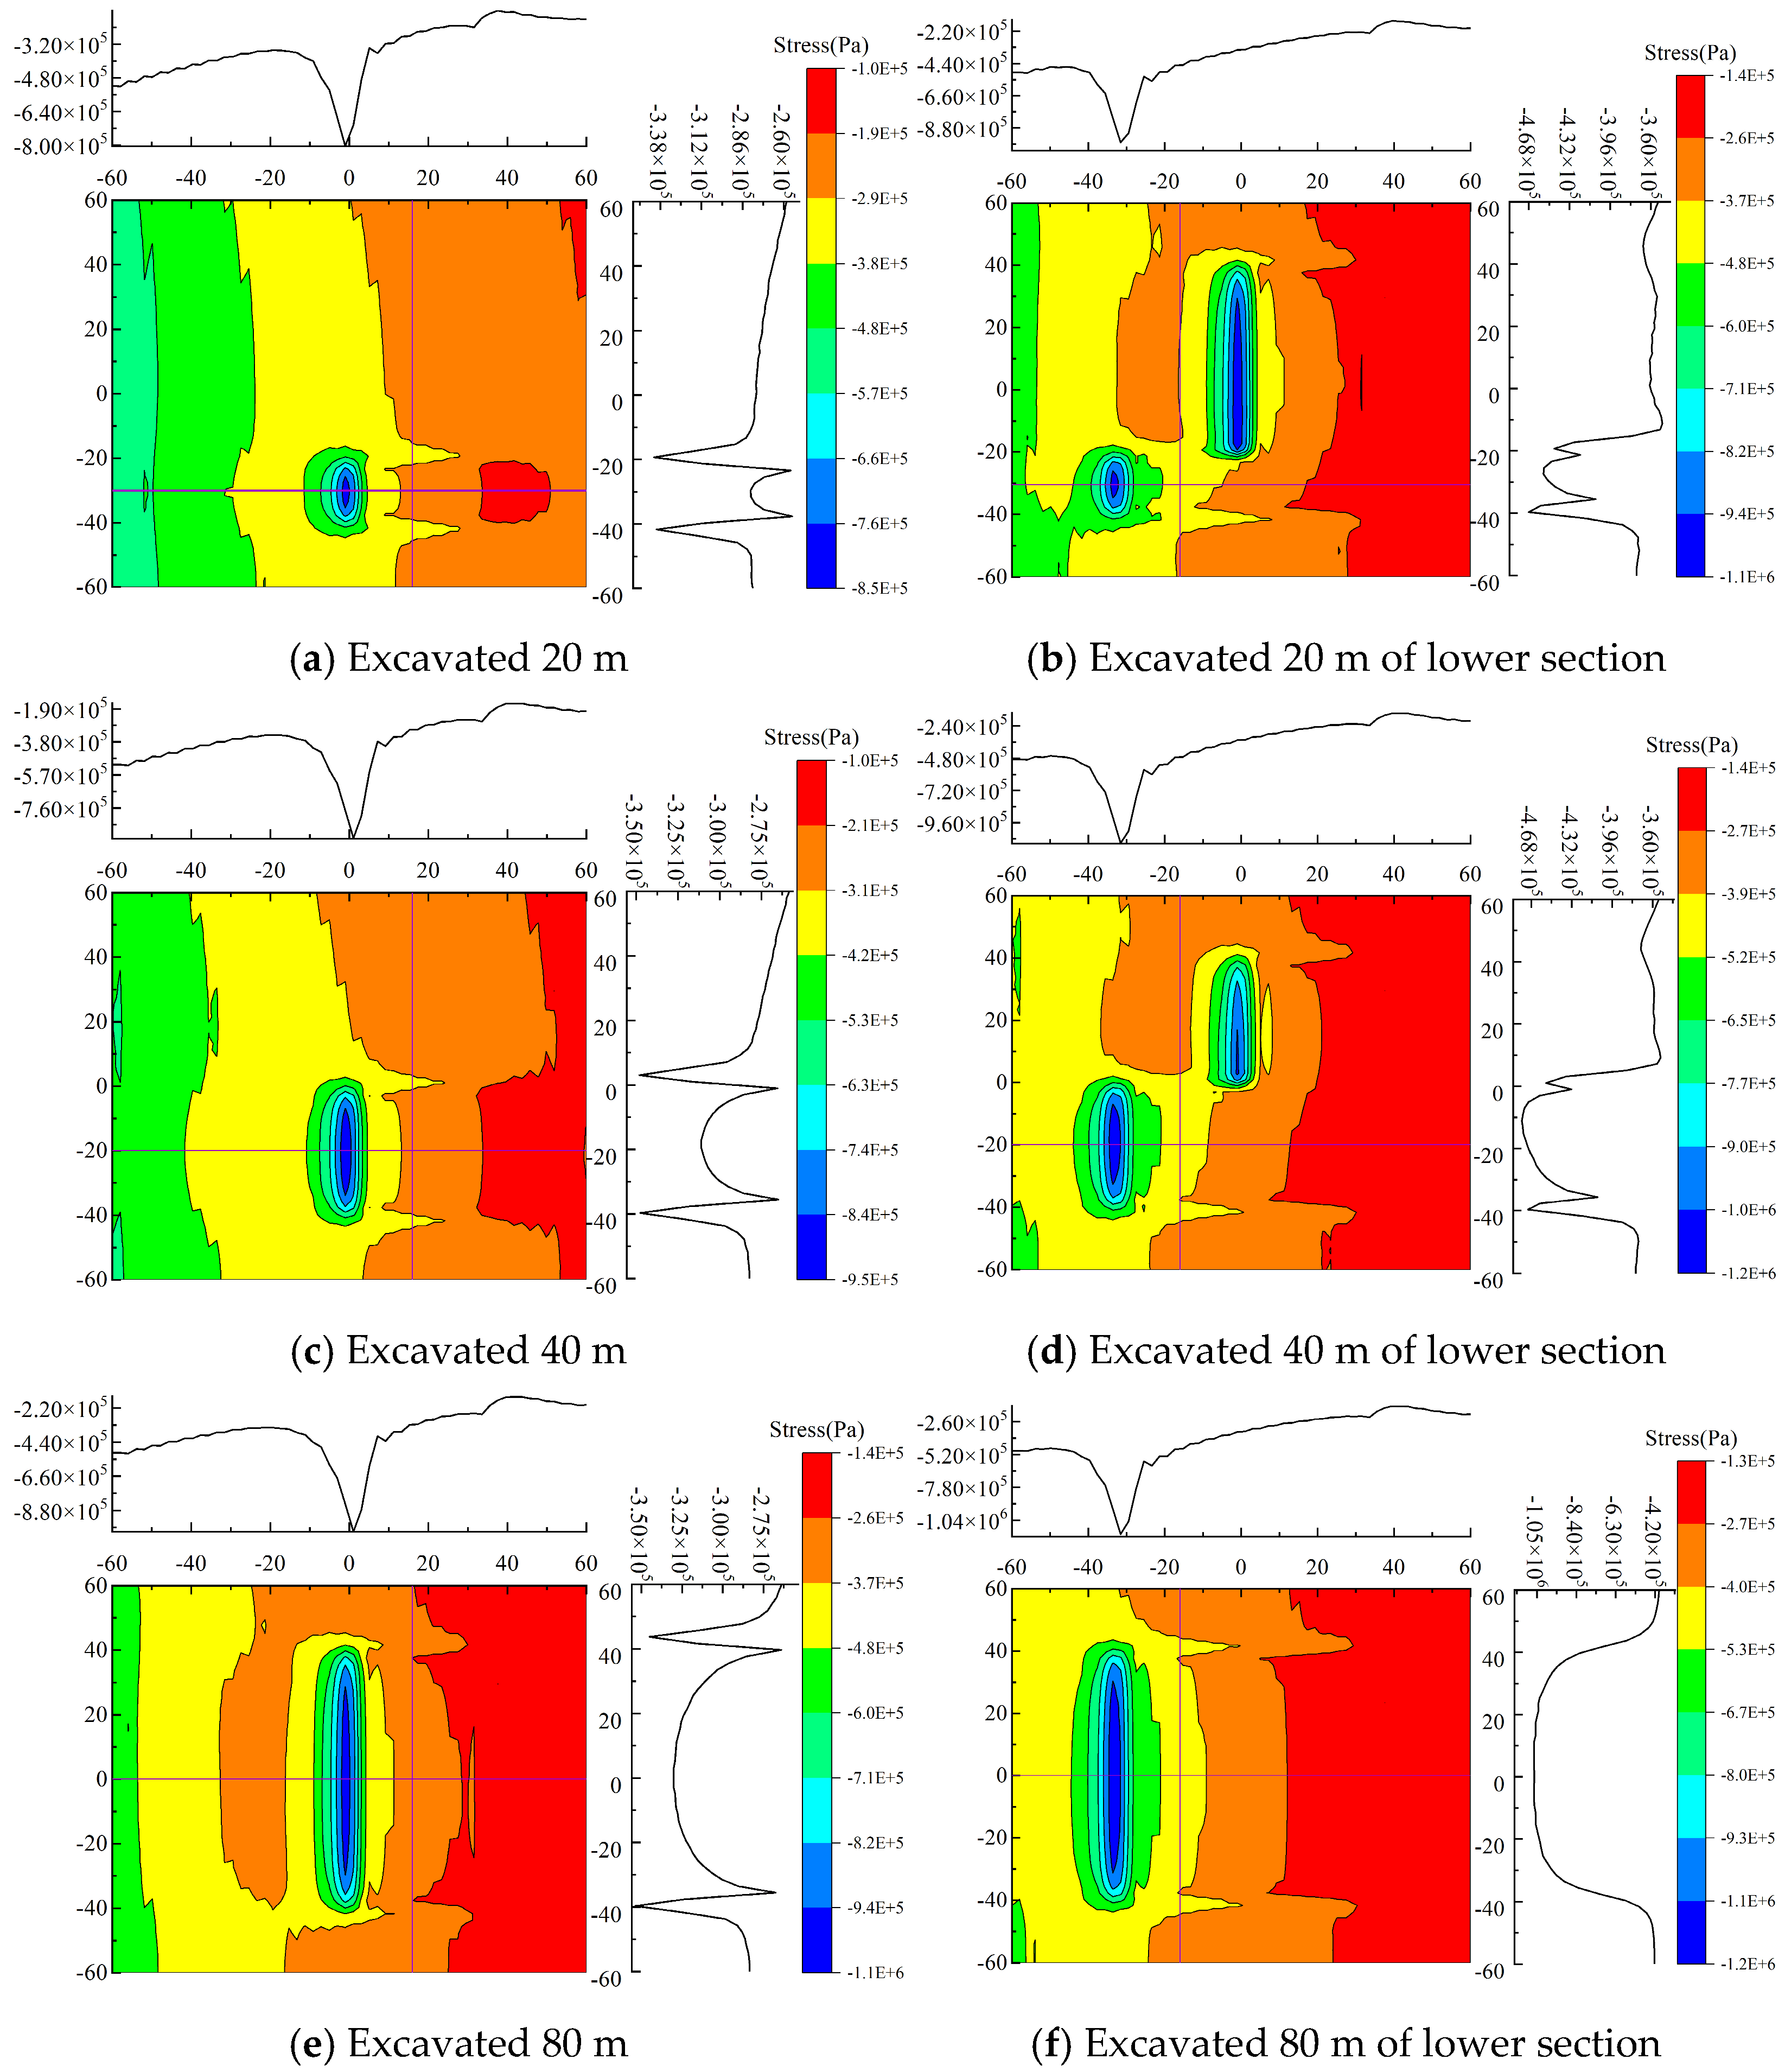
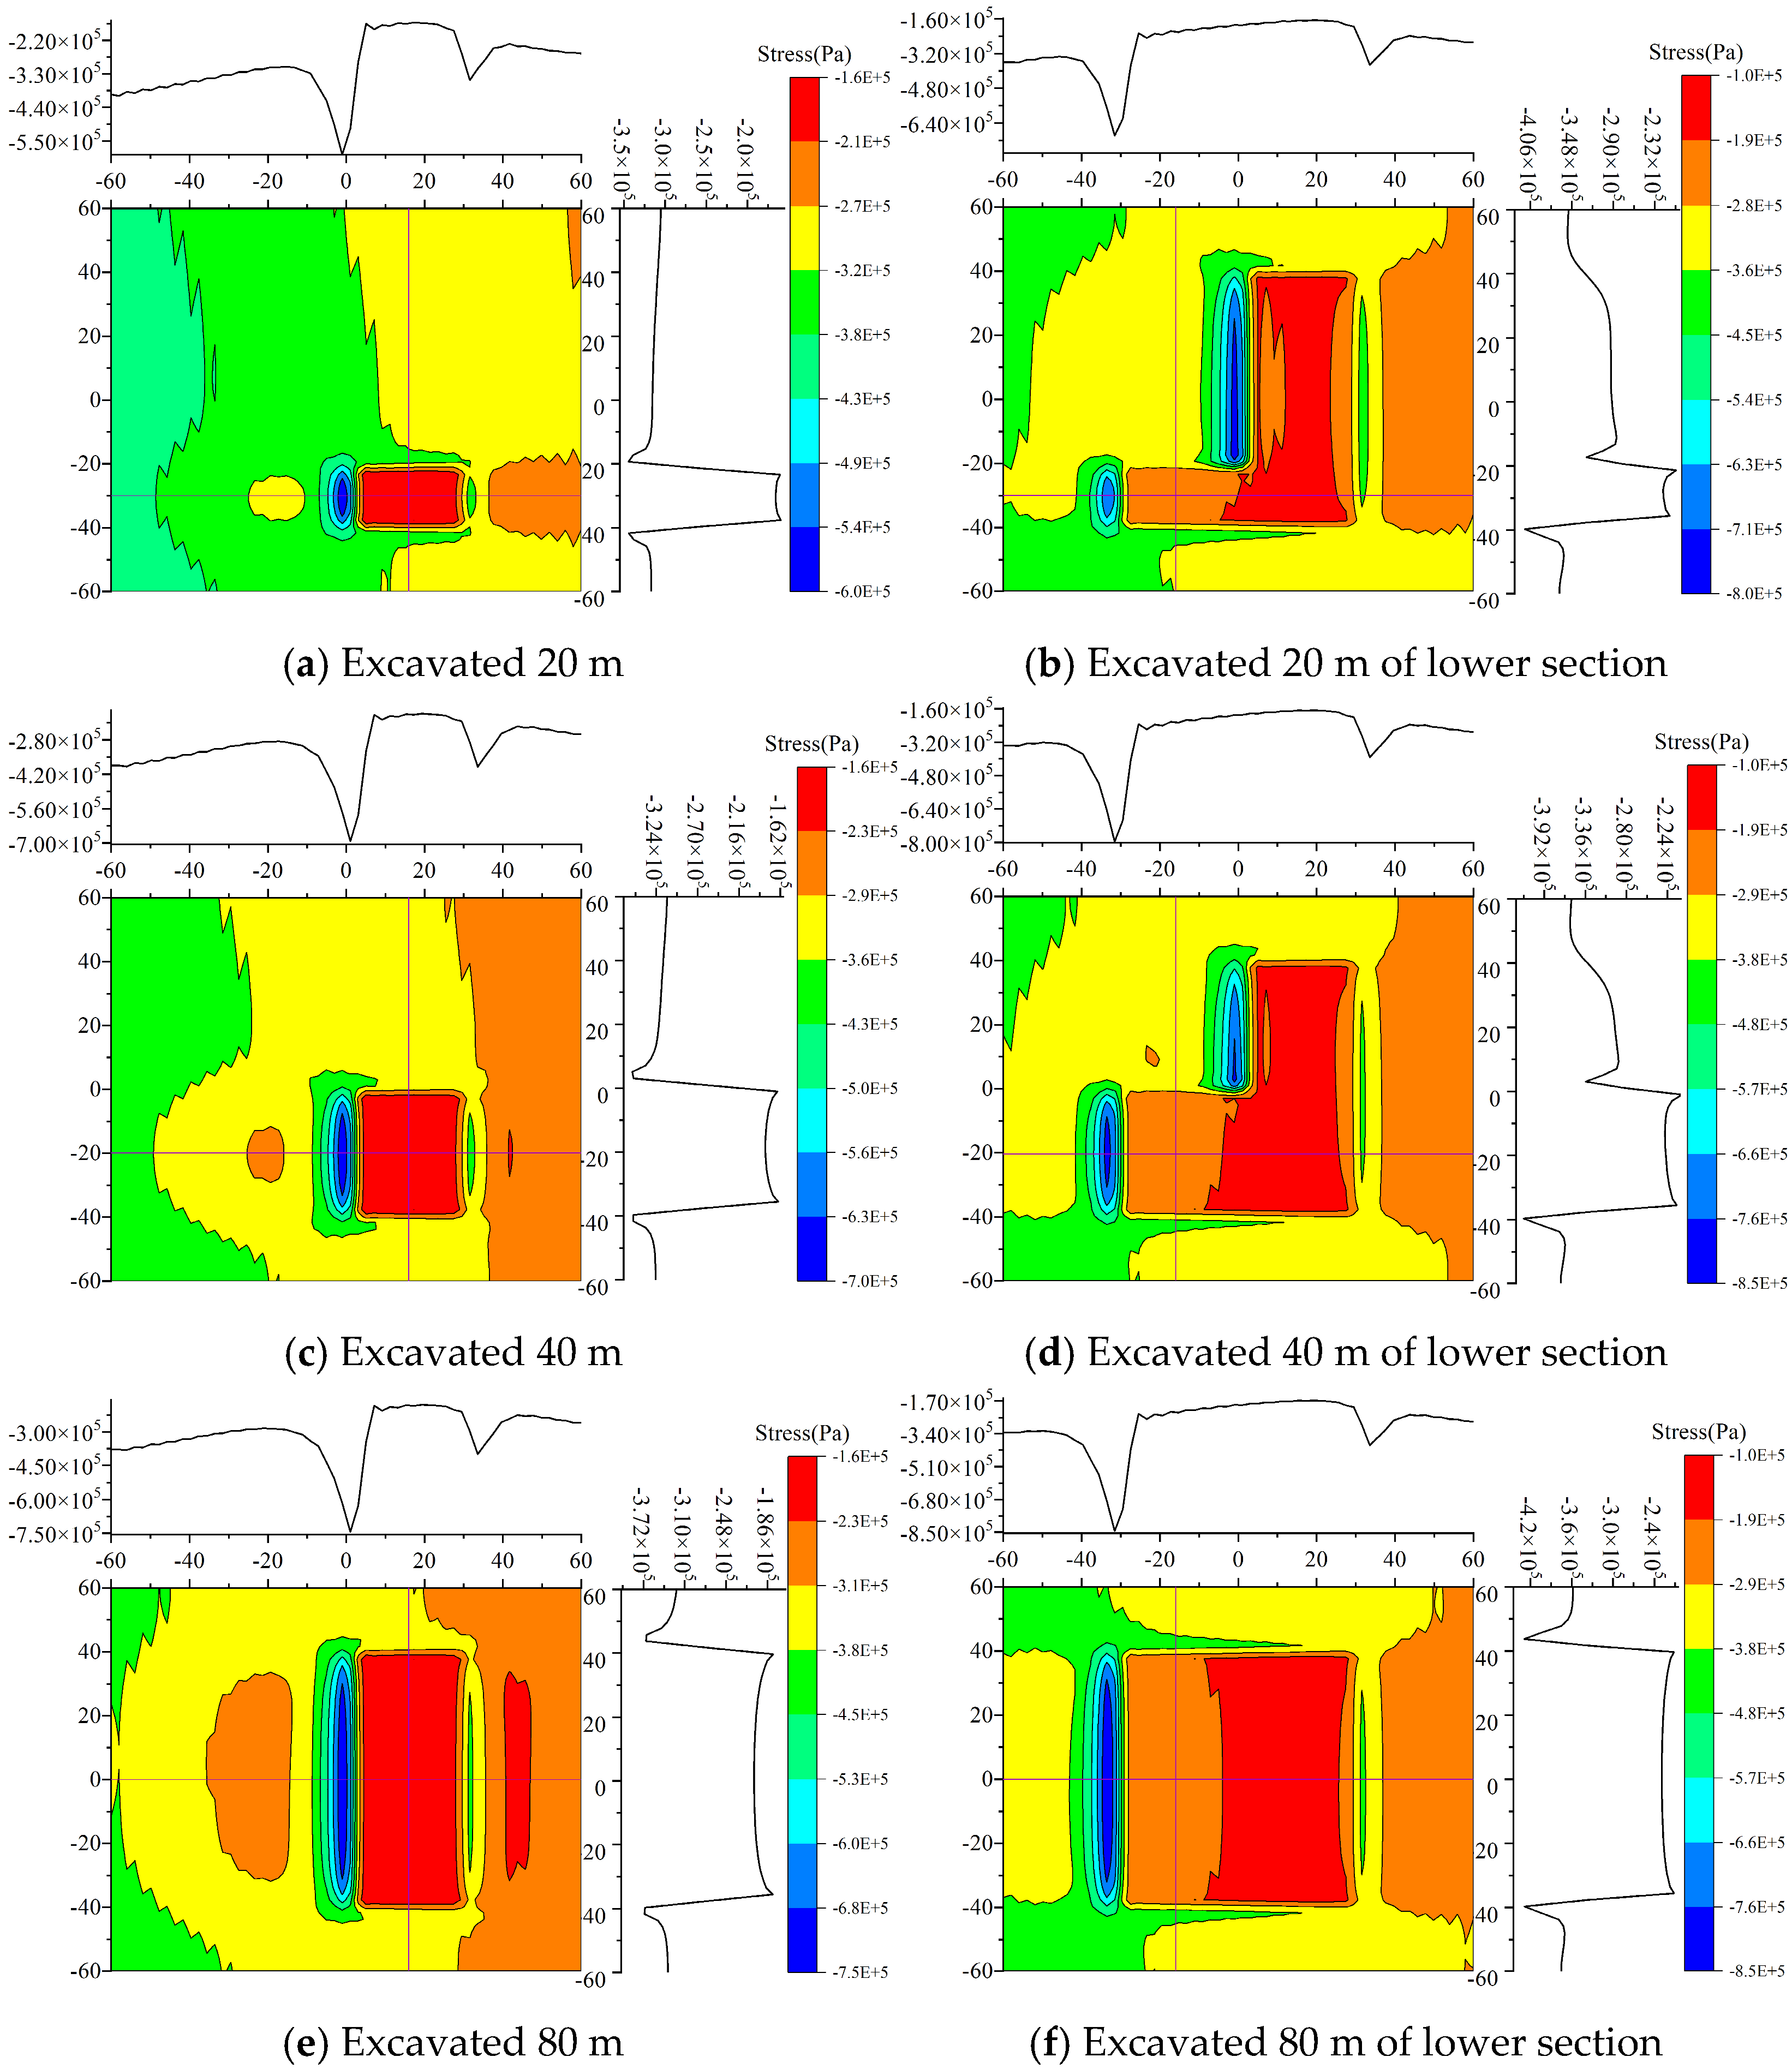
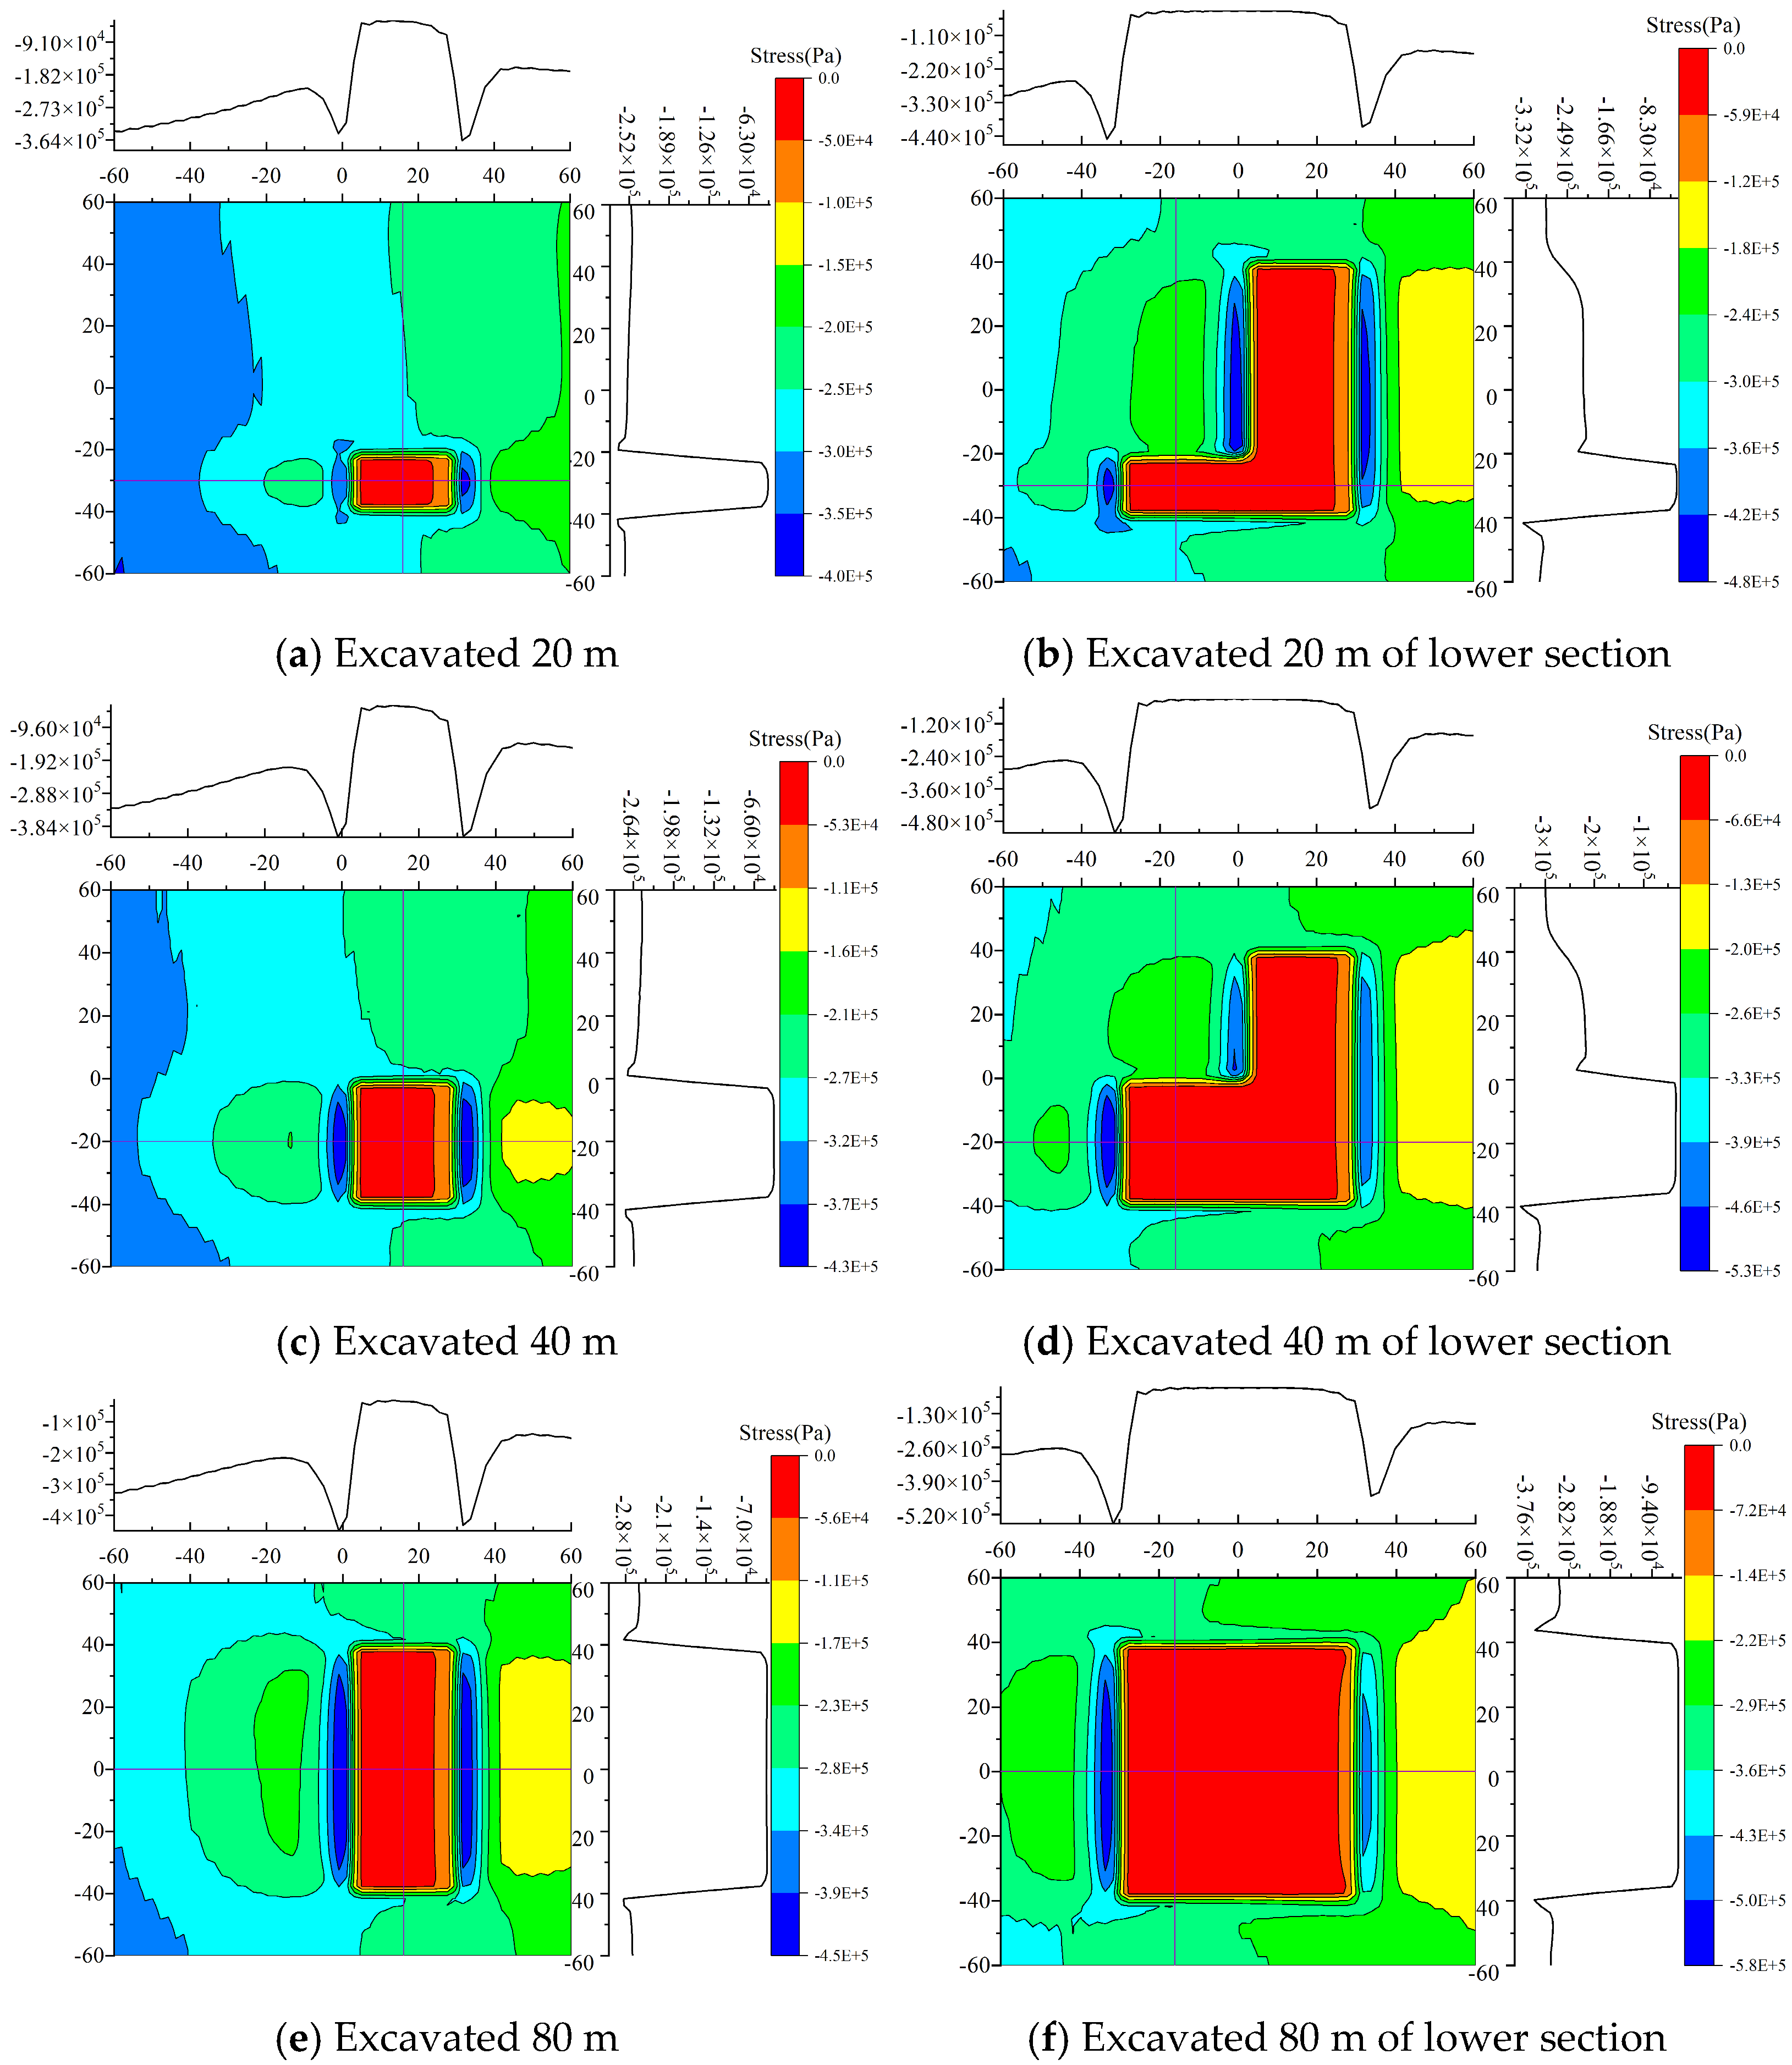
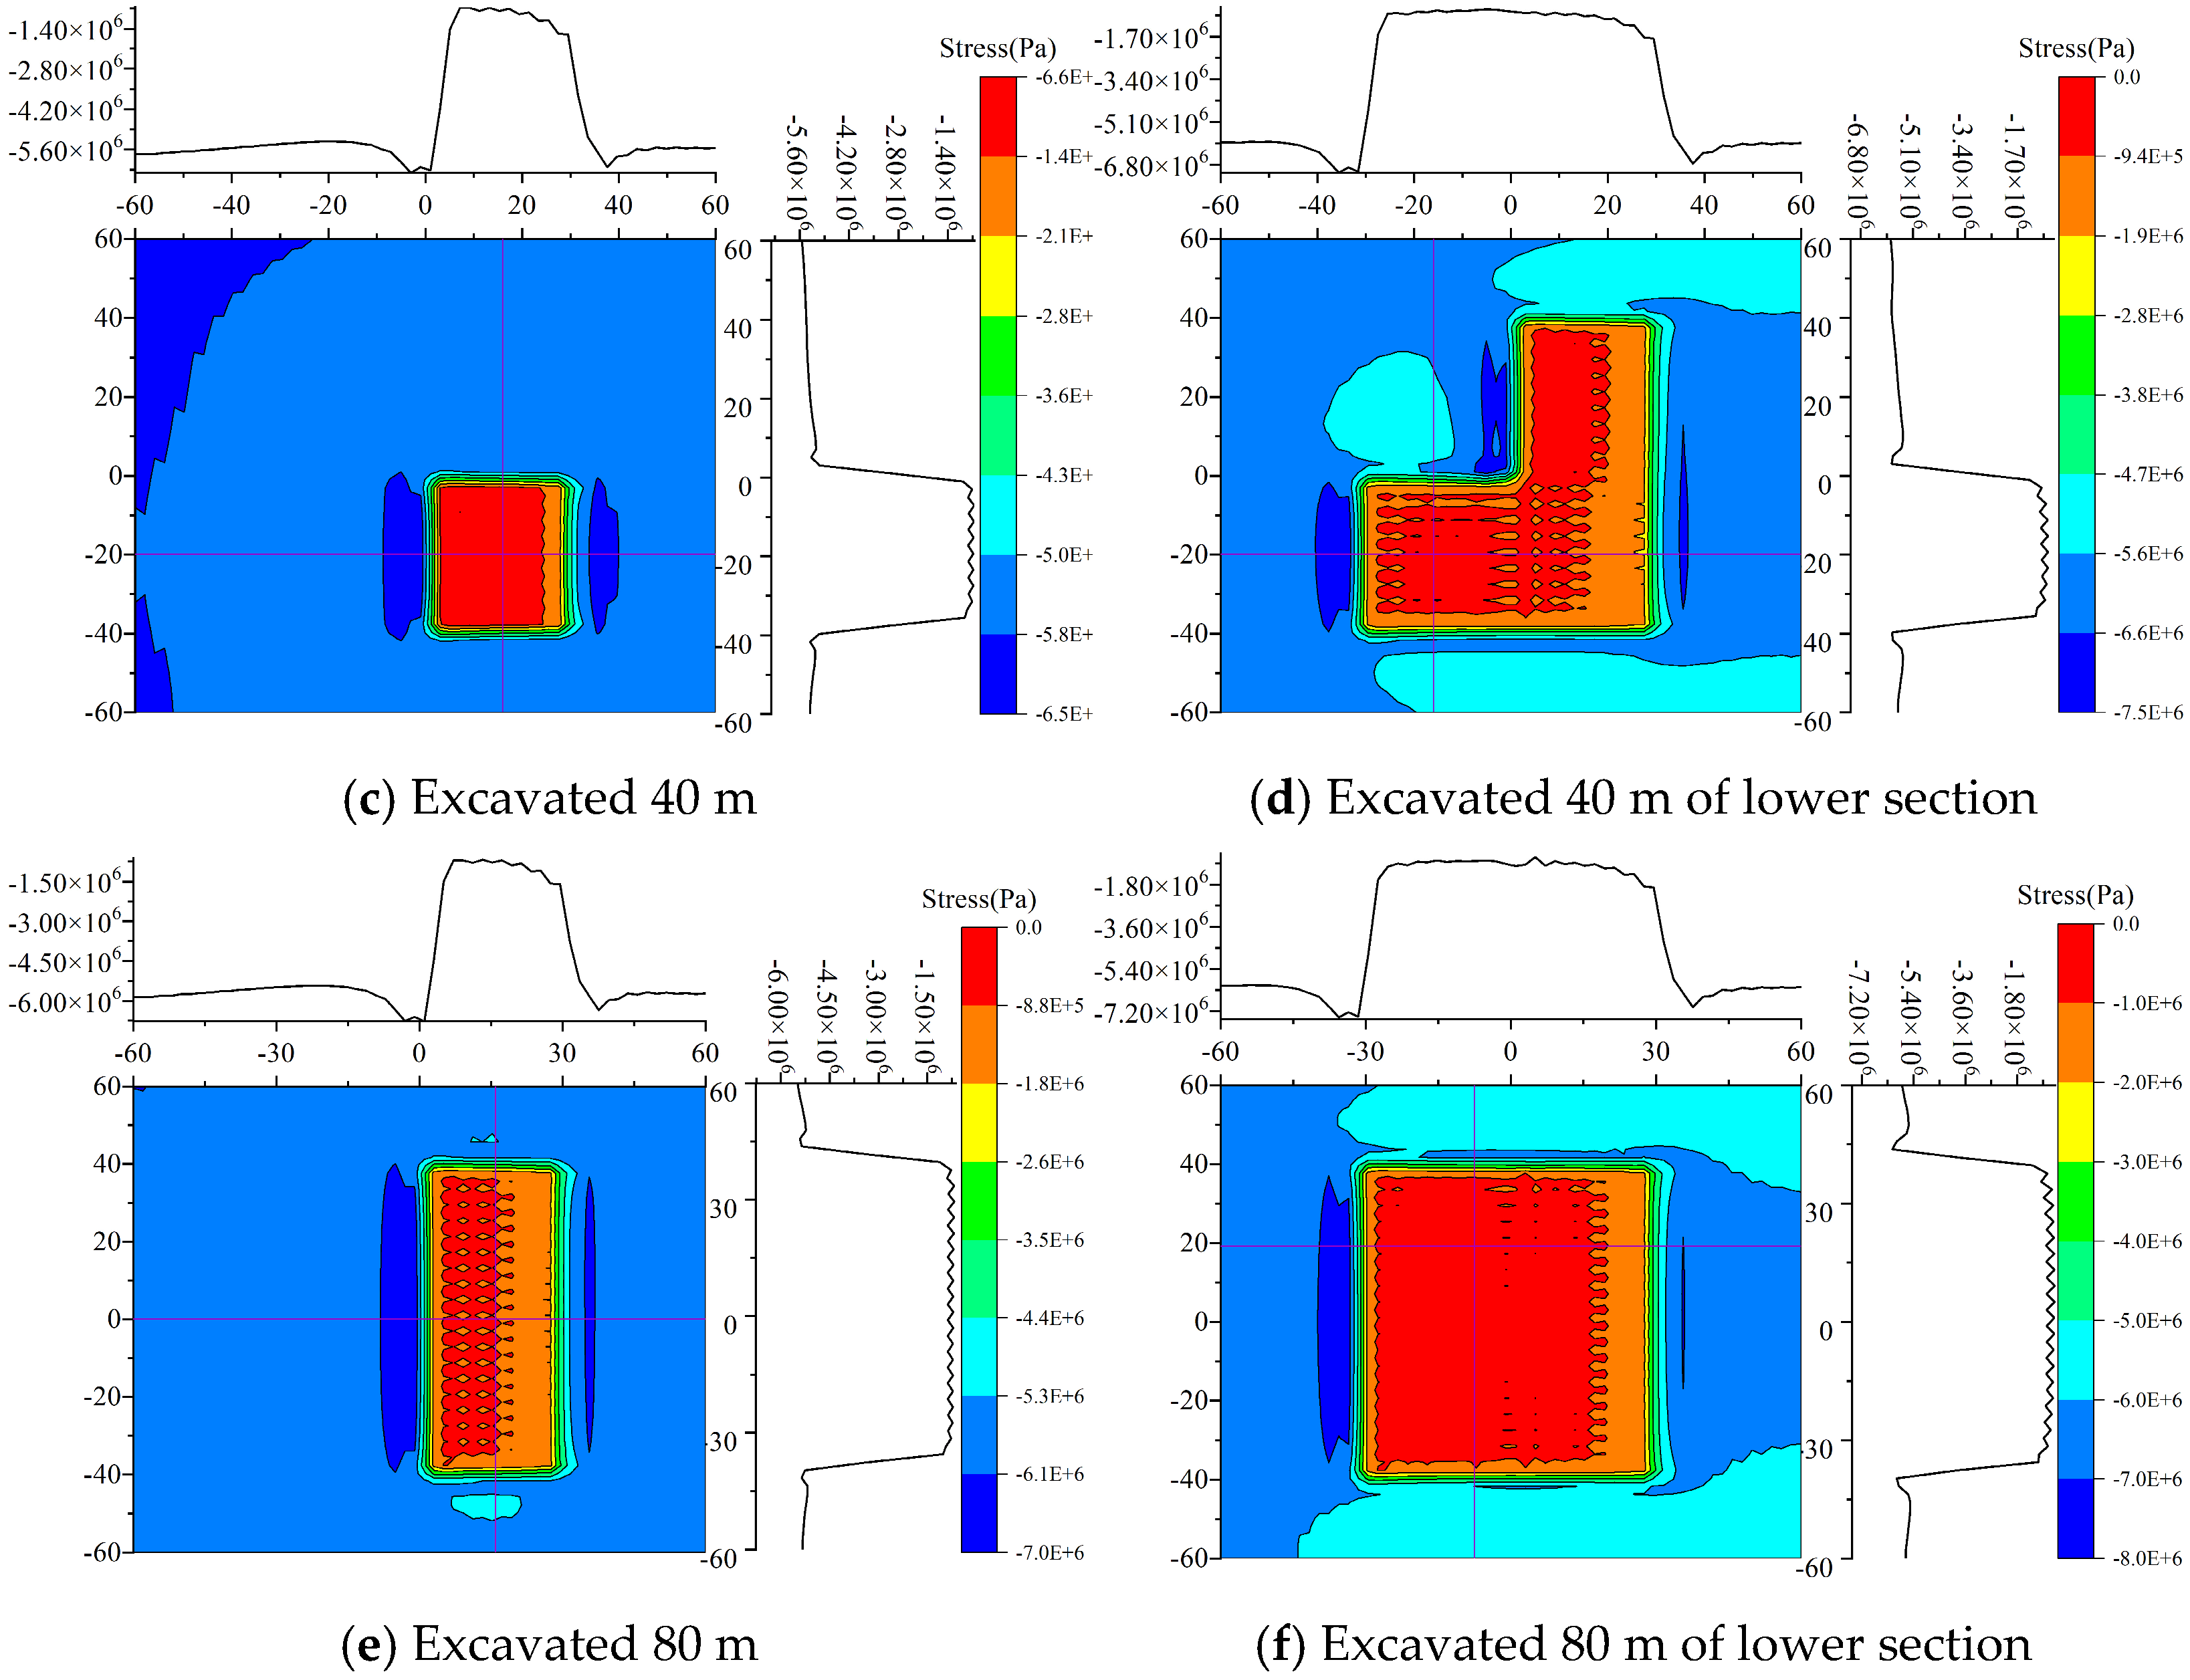
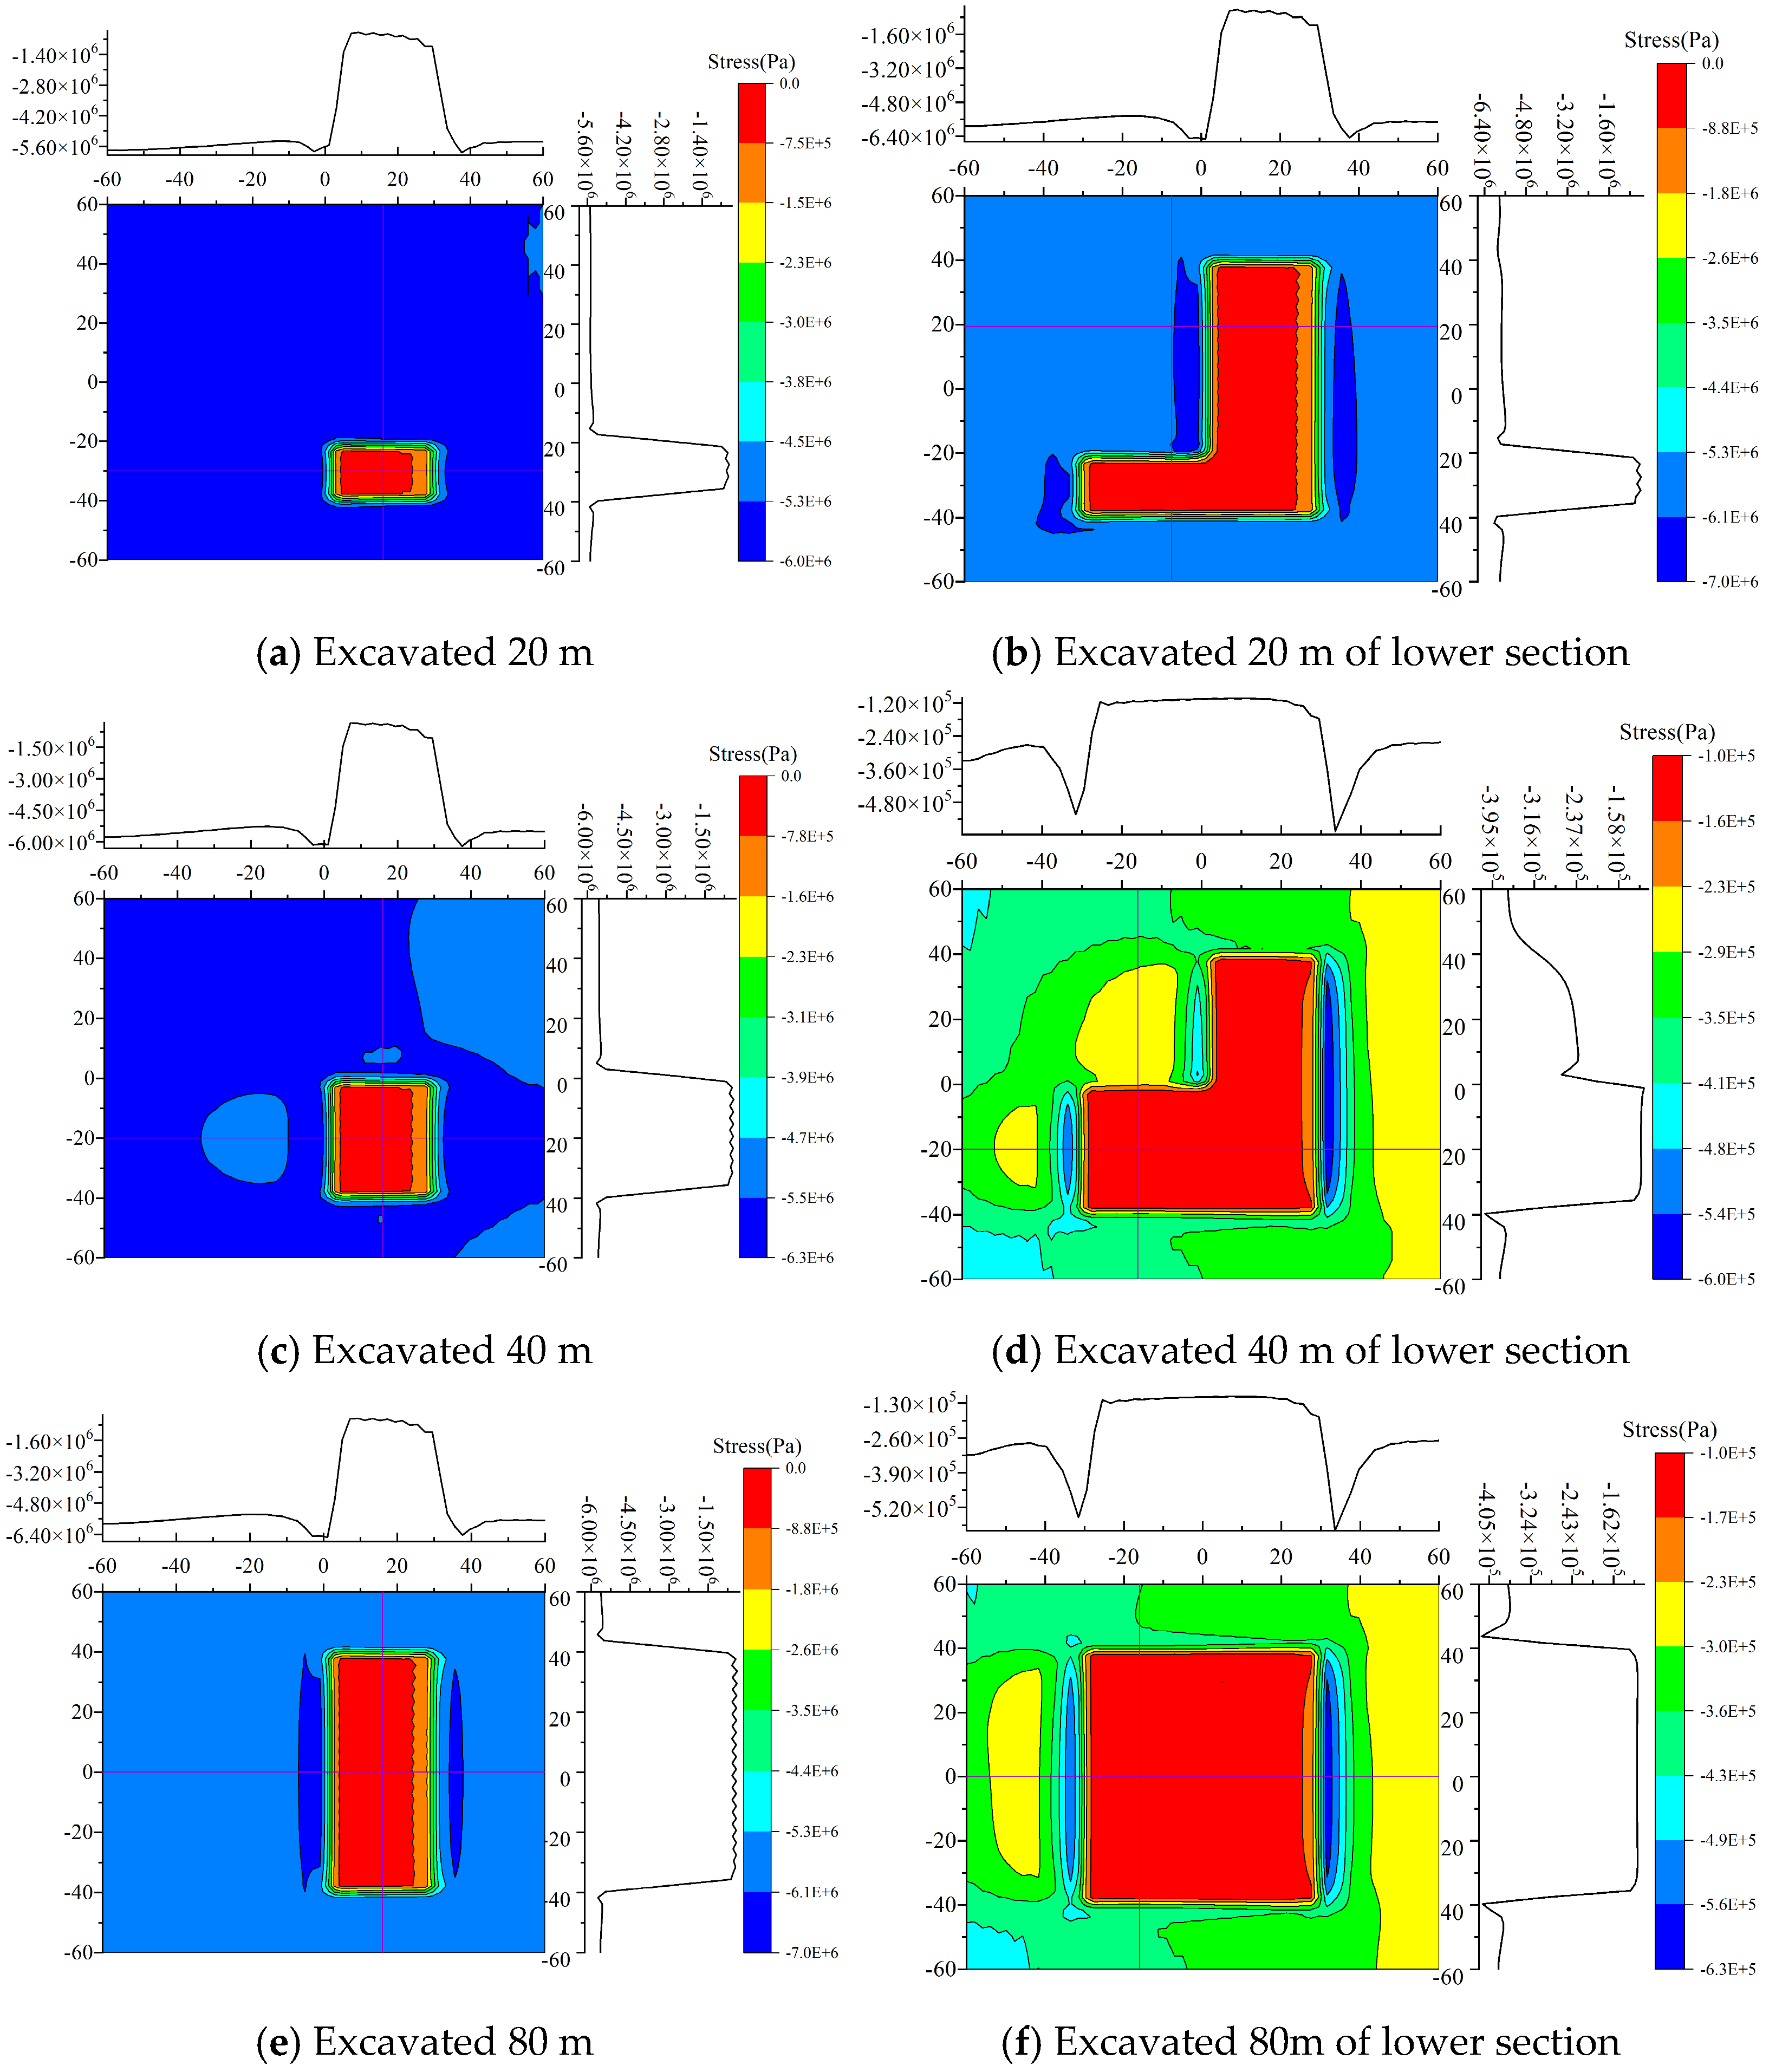
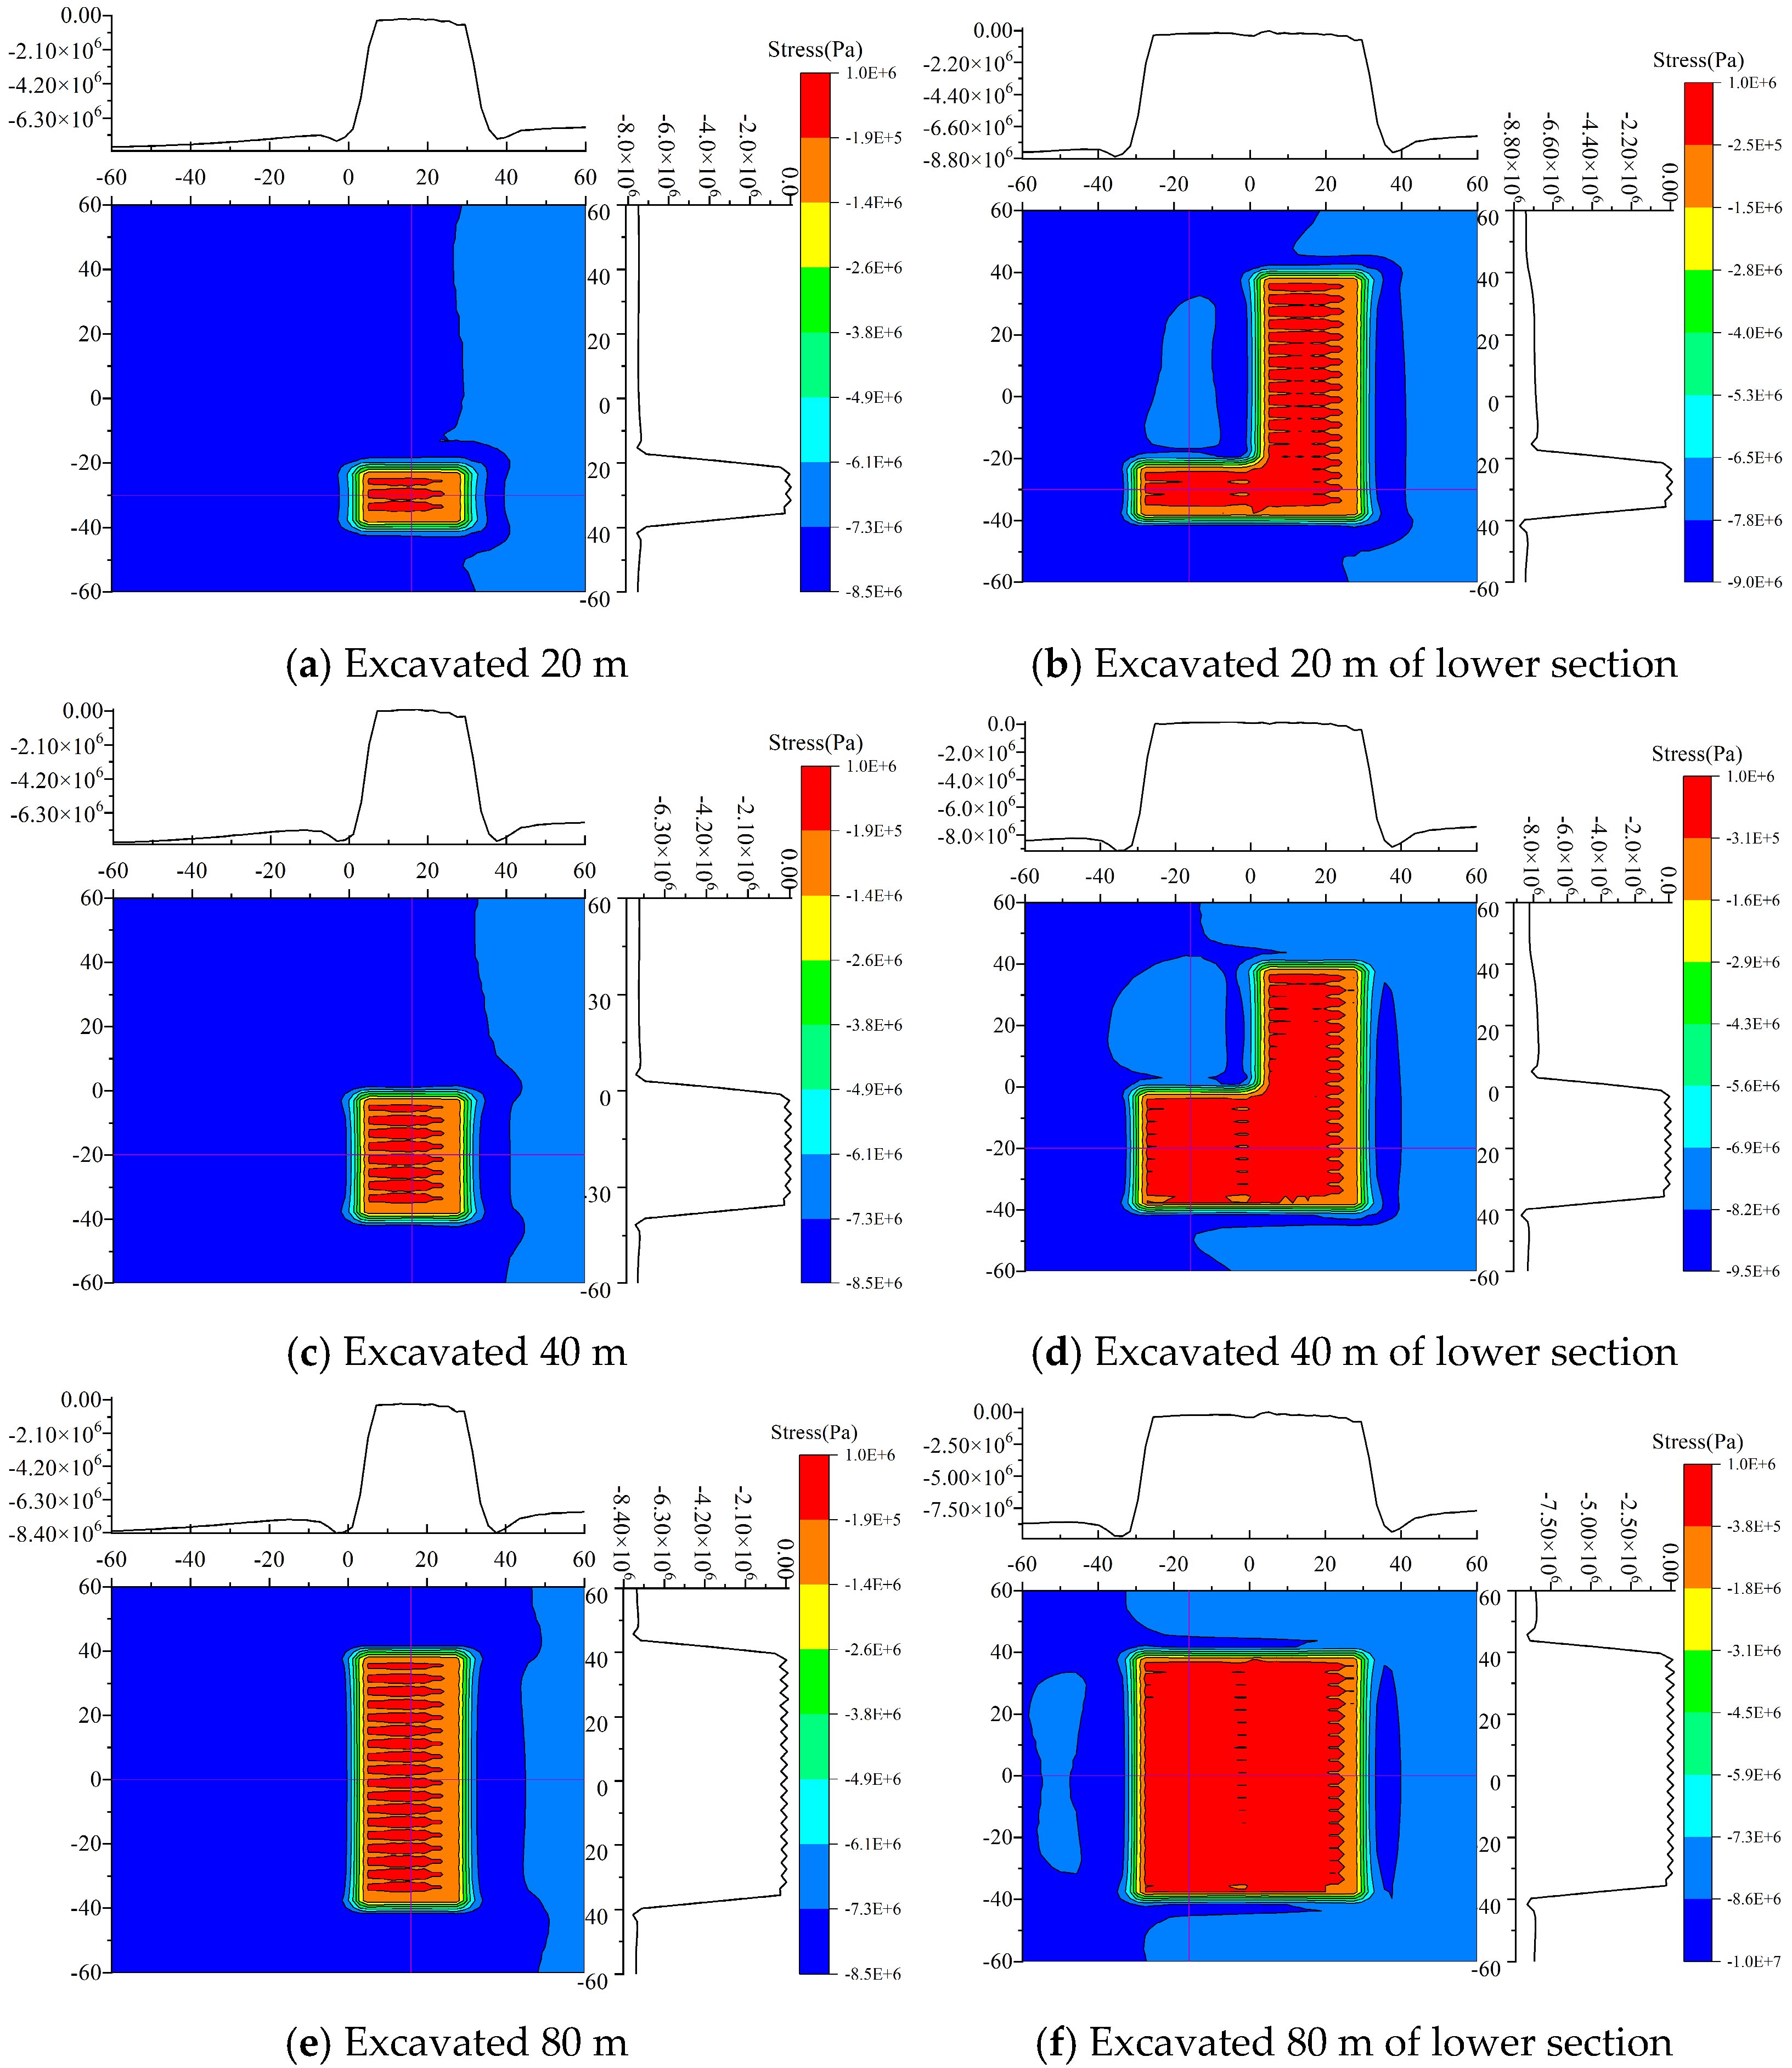
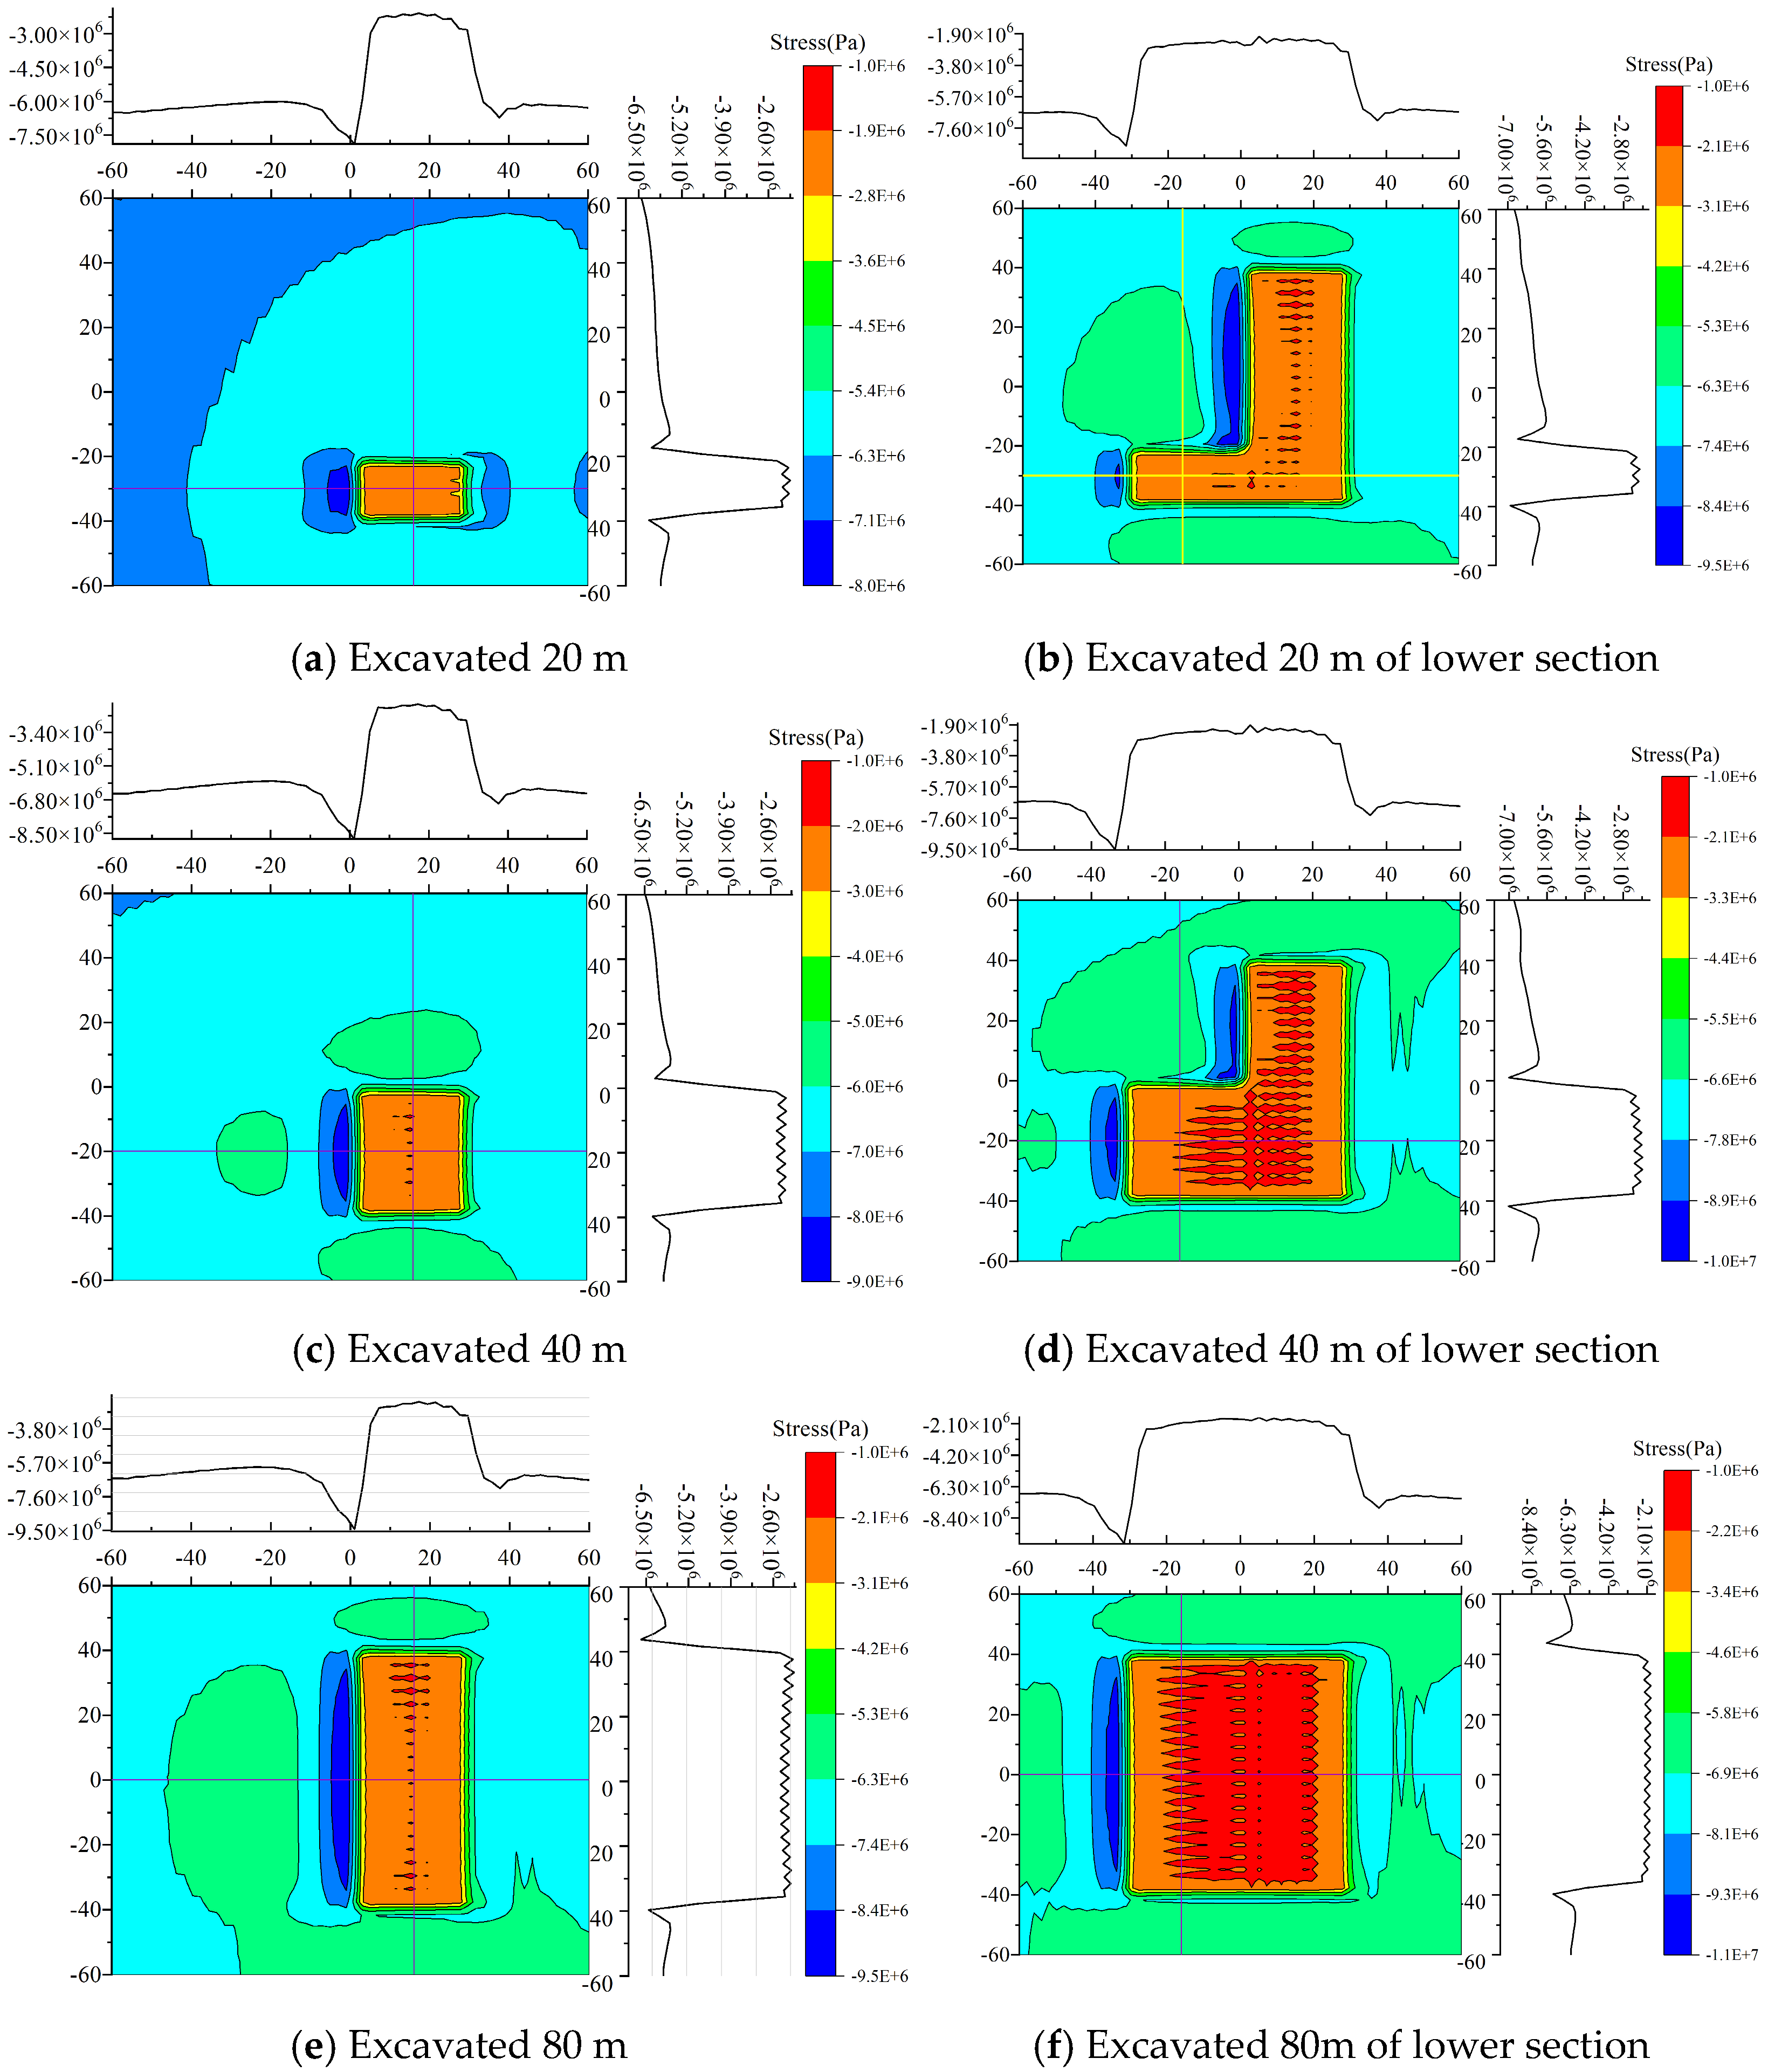
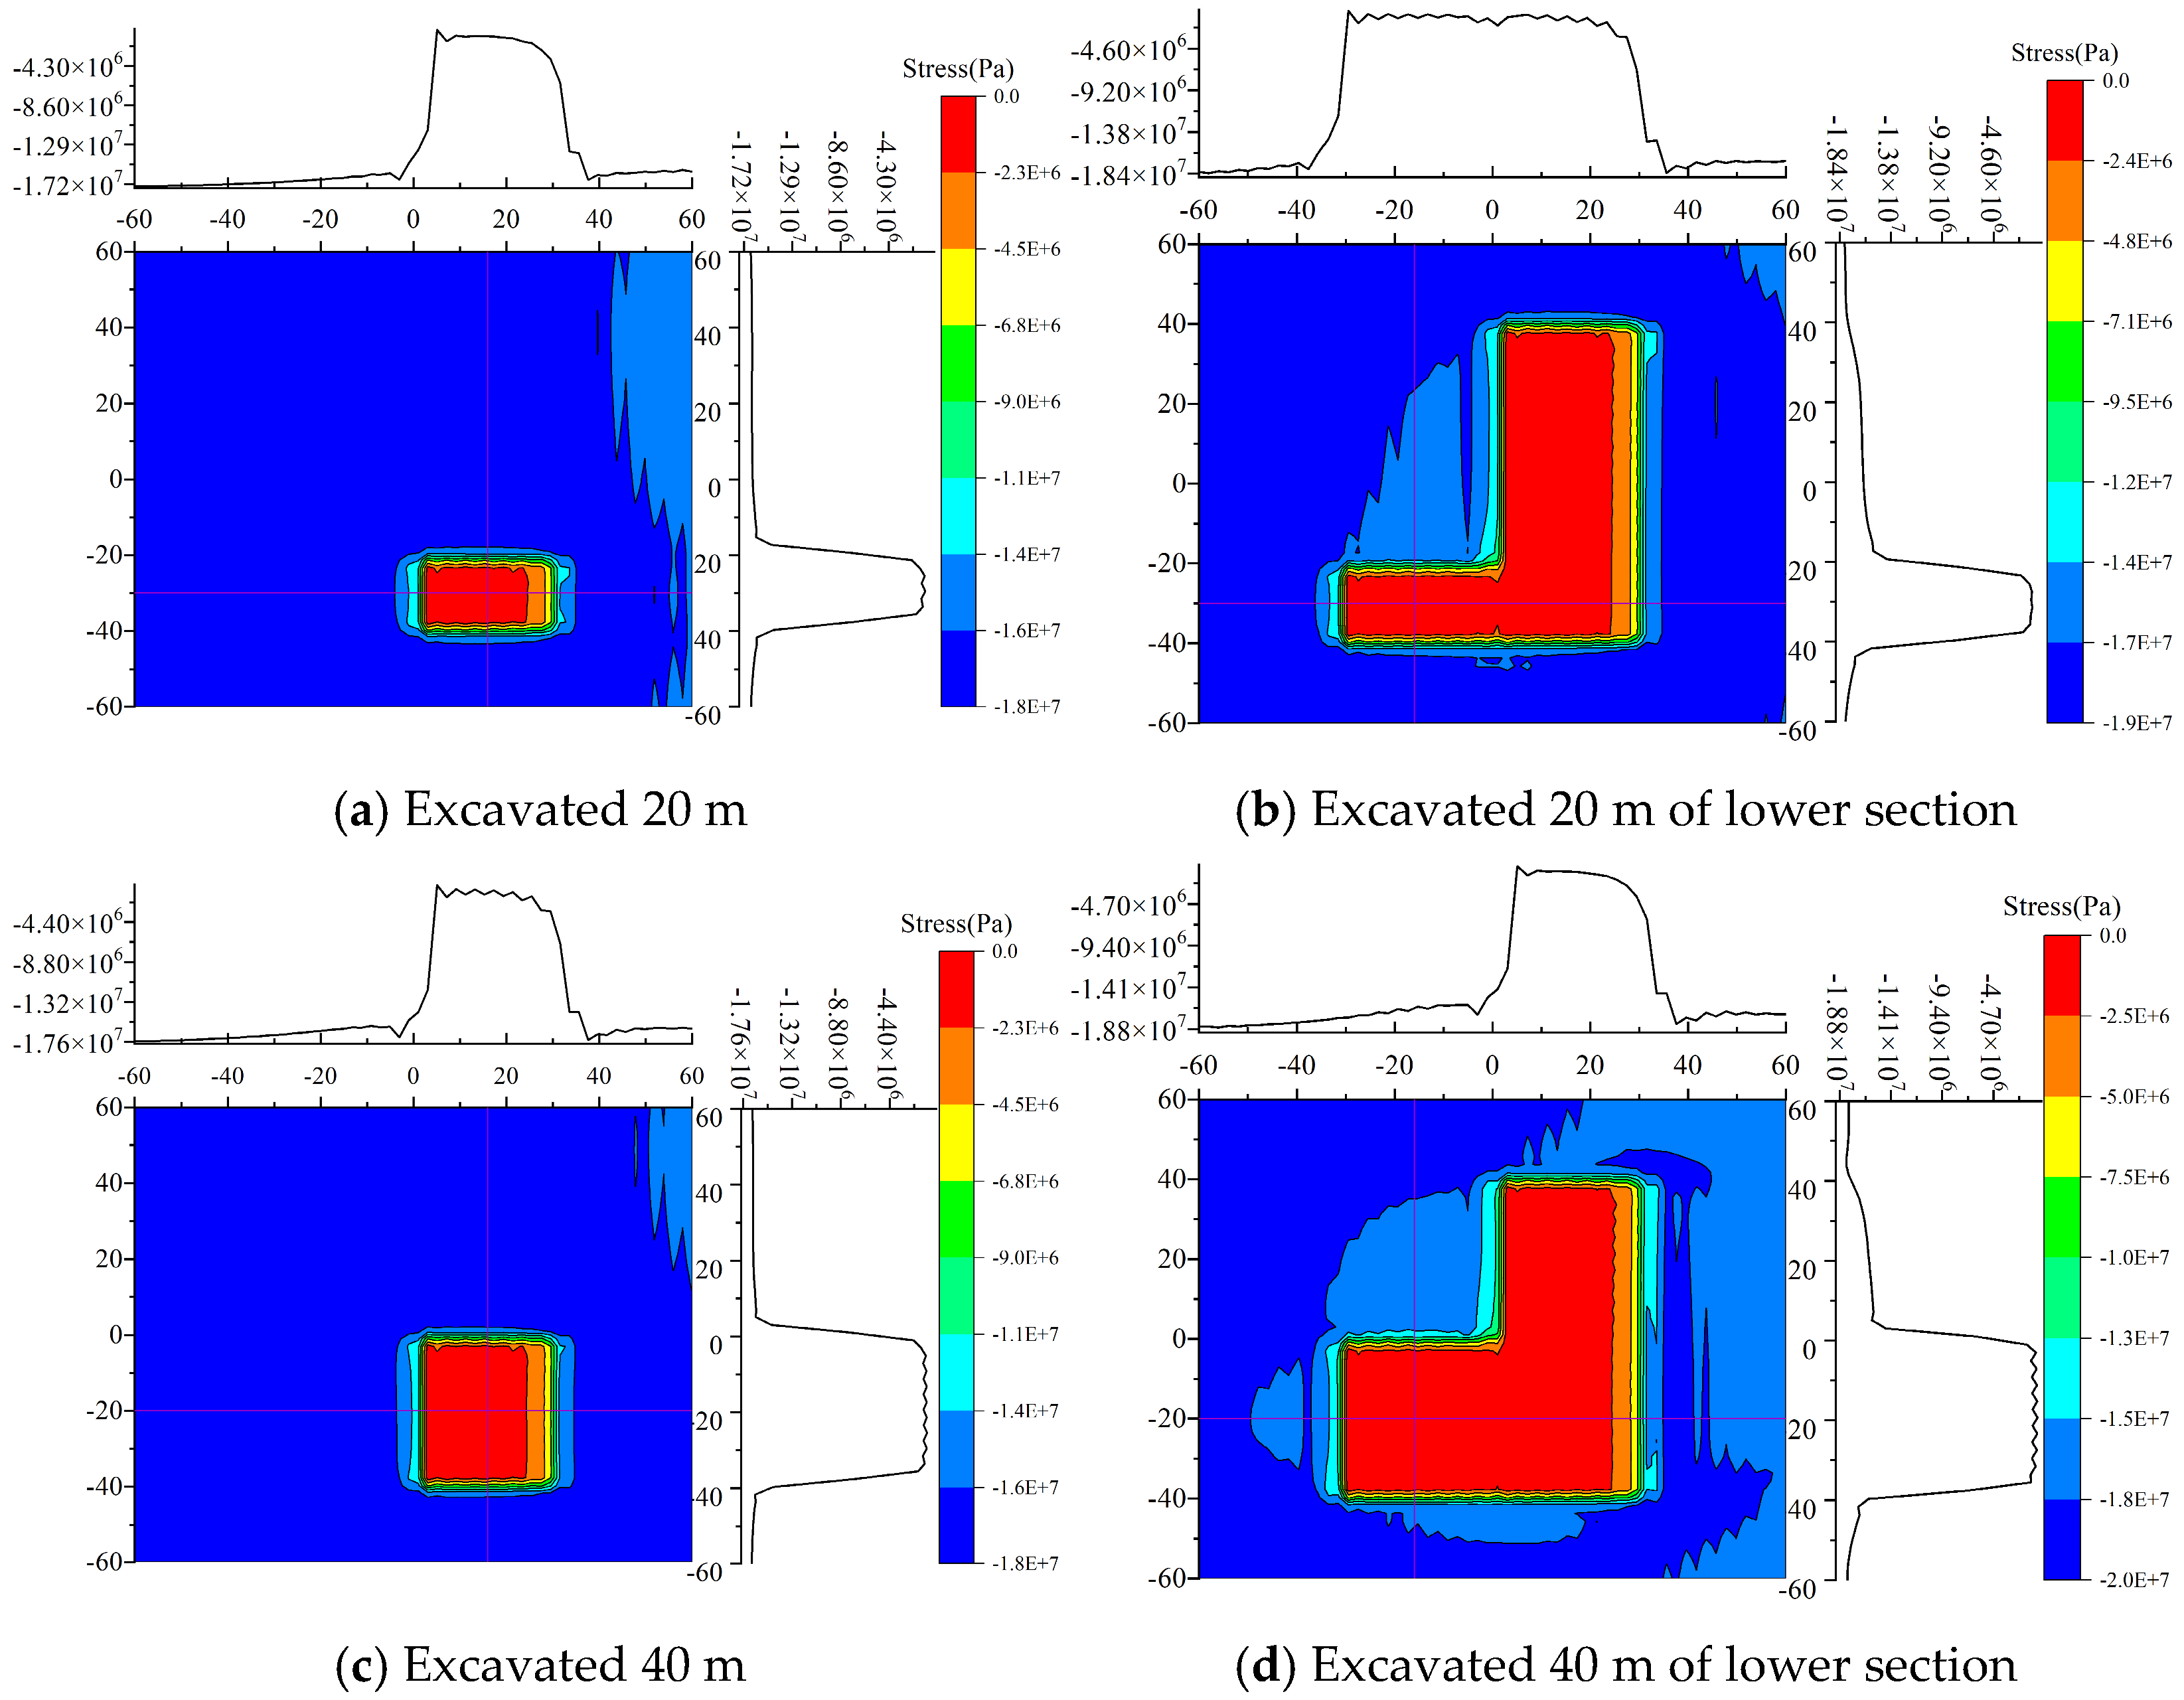
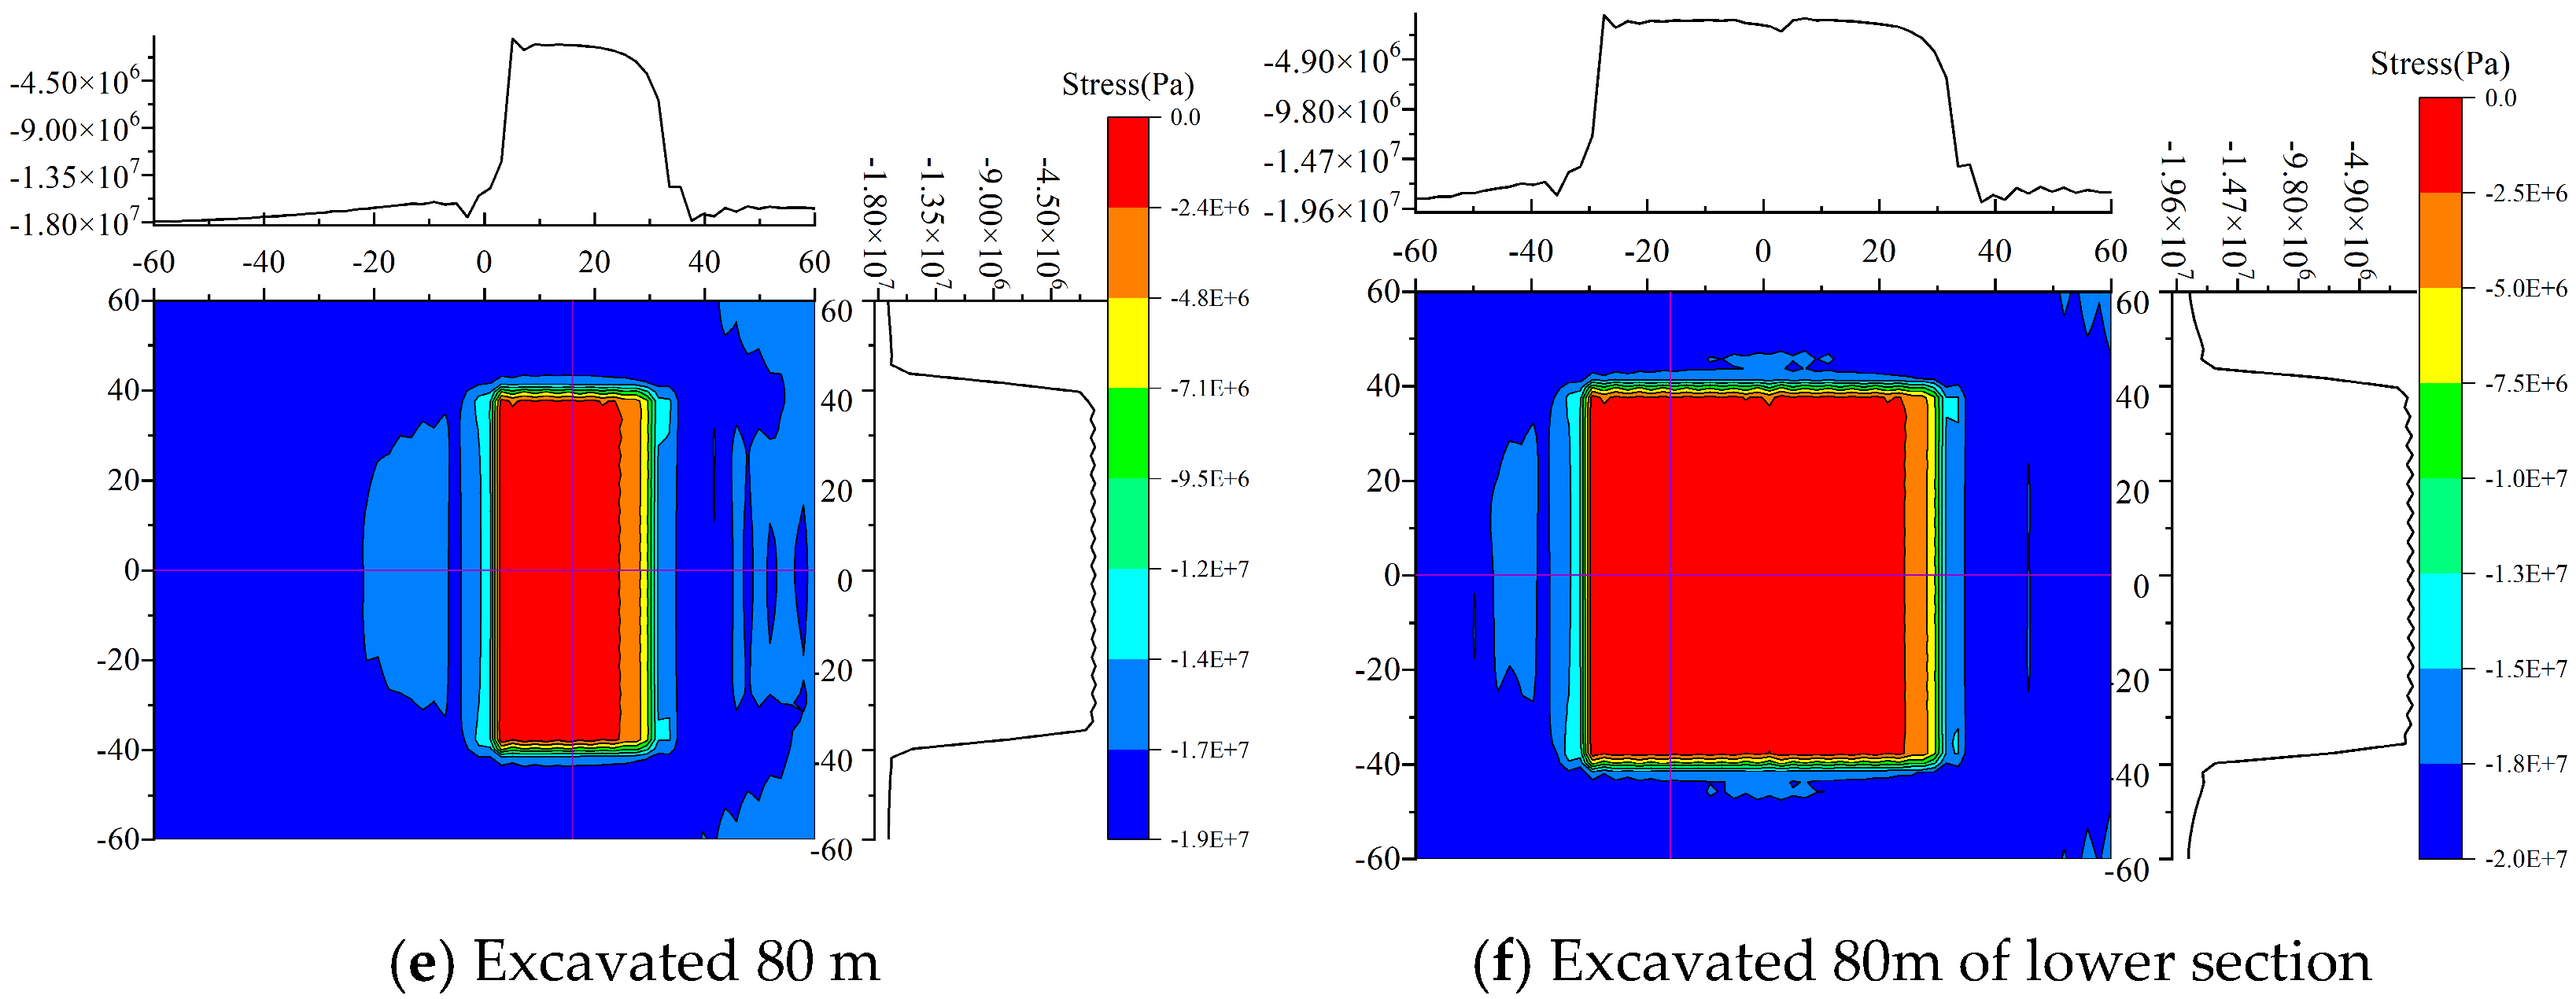
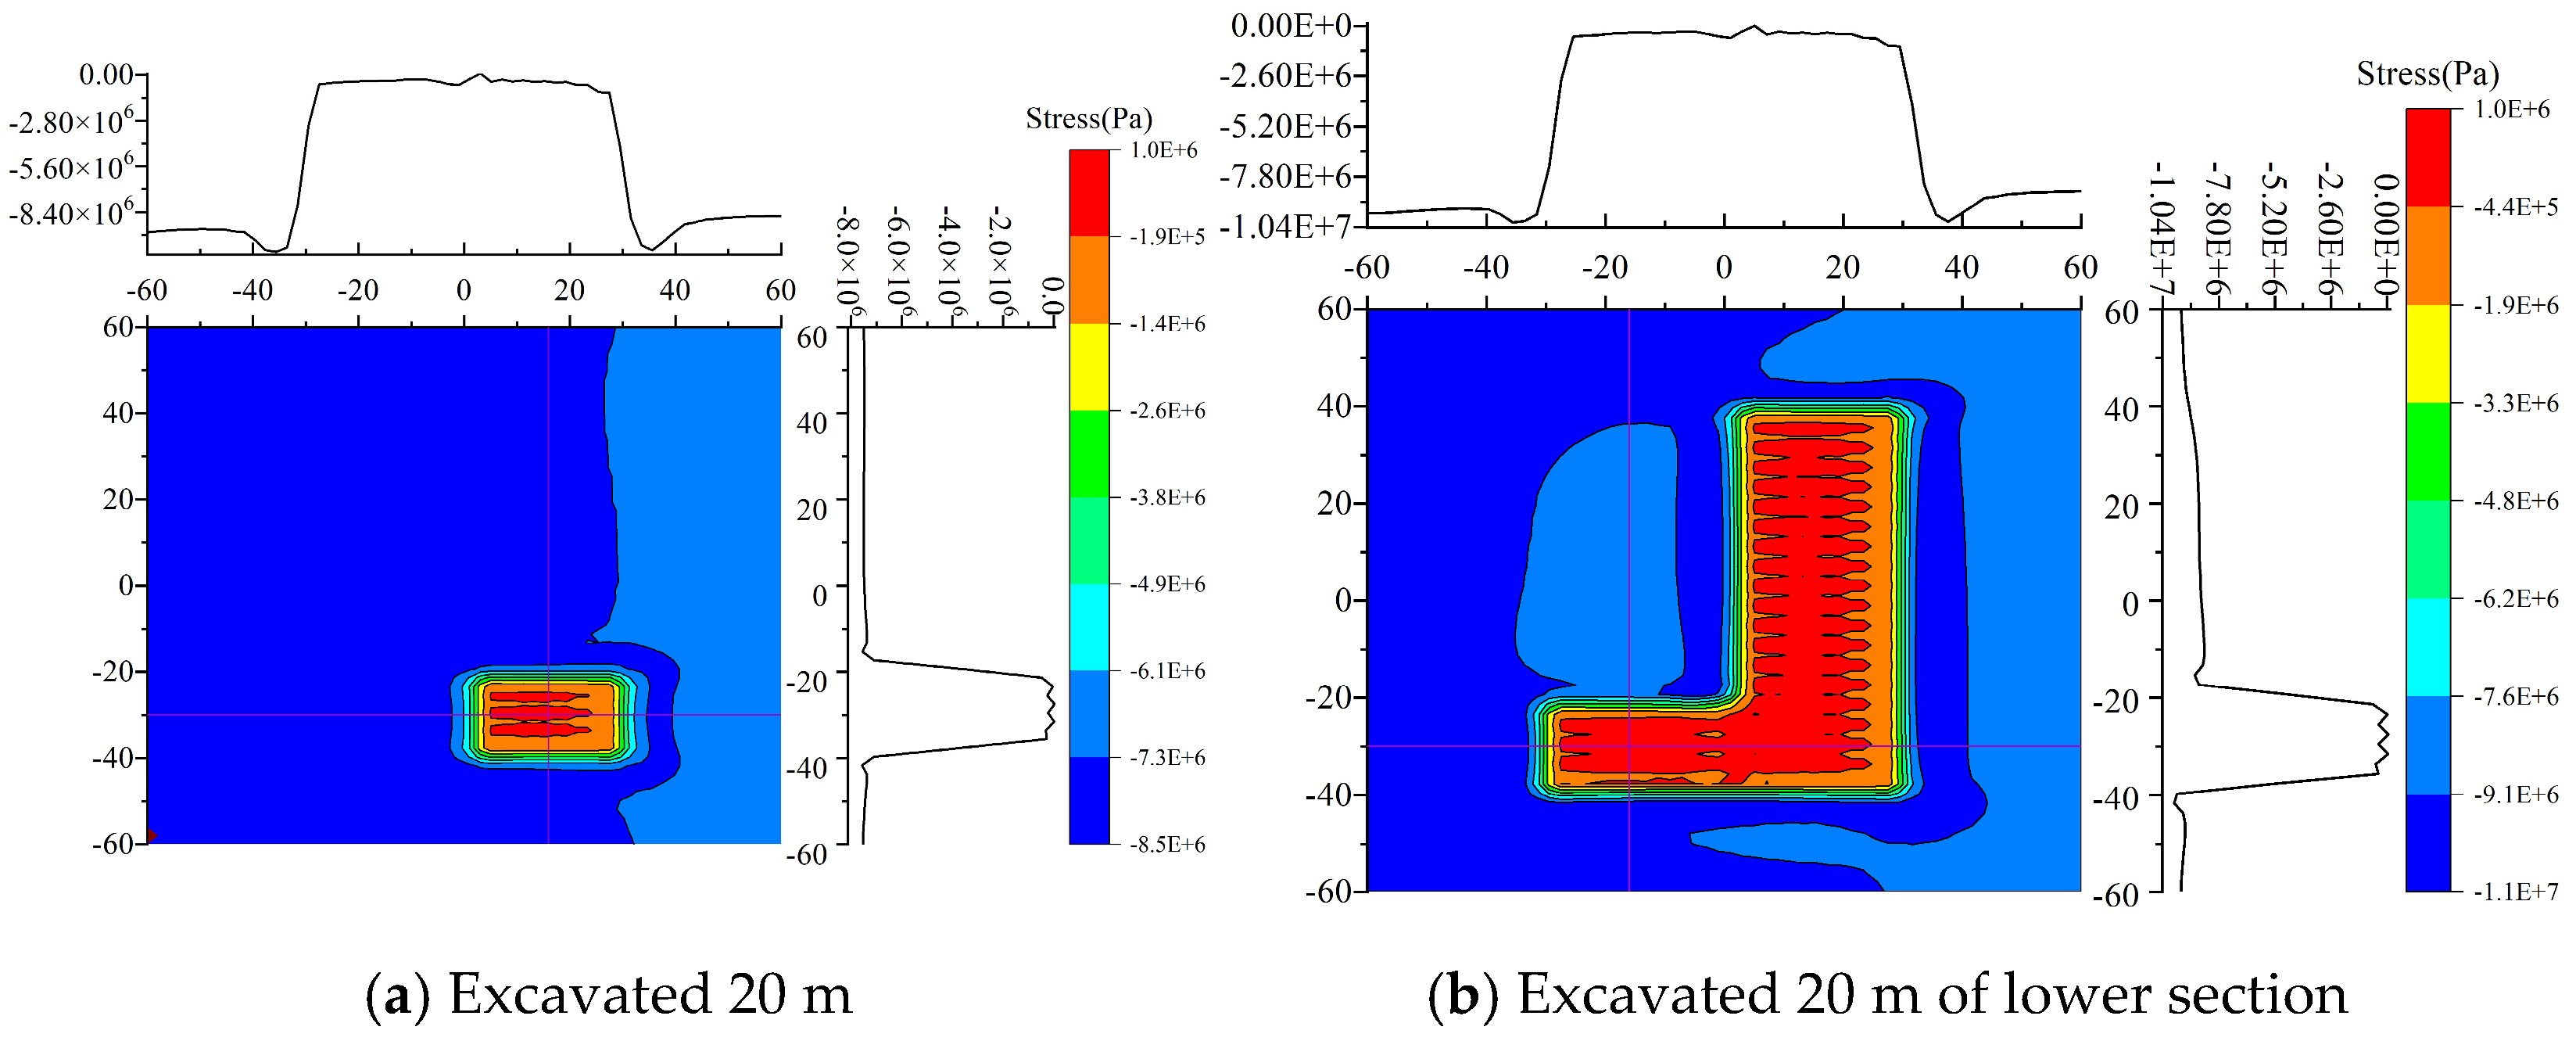
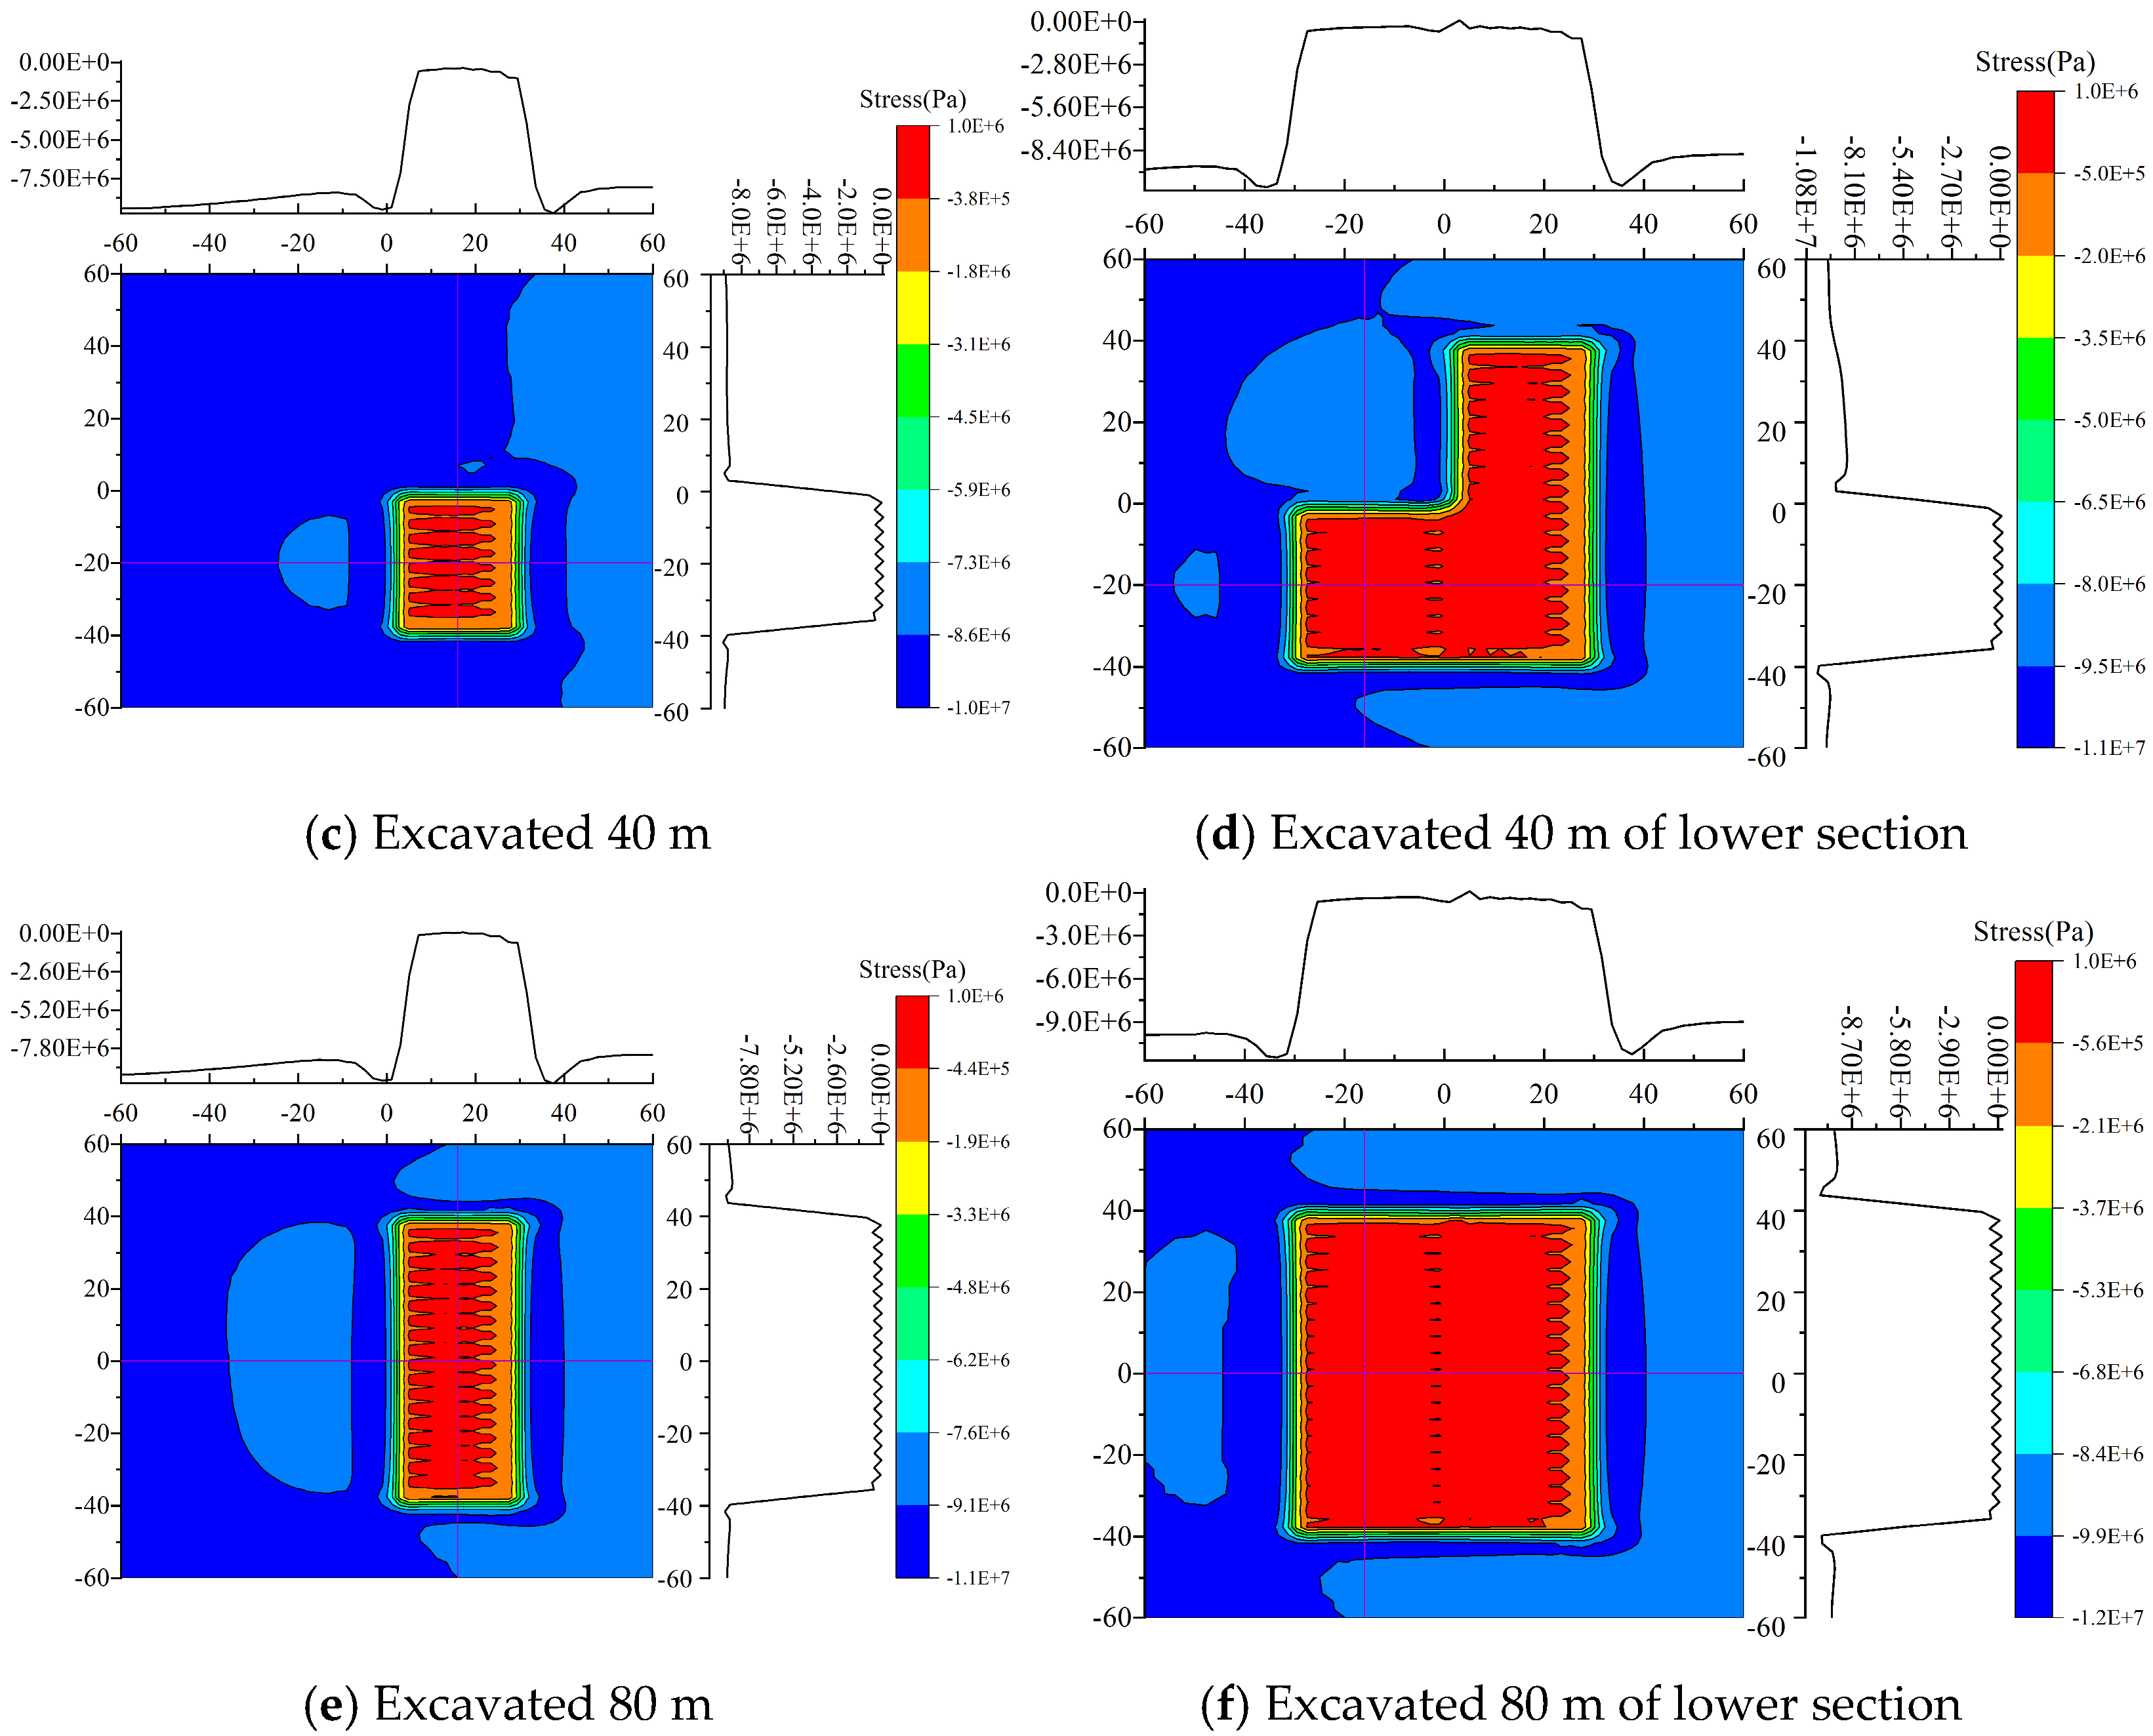
4.2. Analysis of Simulation Results

The above nine groups of numerical simulation data were processed, where the data processing method described above was used to convert the roof plate force into principal stress parallel to the normal direction of the roof plate, allowing us to plot the distribution of the normal stress of the roof plate at different working face advance distances in the first subsection as well as the next subsection, as shown in Figure 6, Figure 7, Figure 8, Figure 9, Figure 10, Figure 11, Figure 12, Figure 13 and Figure 14.
Test 1 simulated the conditions of a coal bed inclination angle of 65°, burial depth of 100 m, and lateral pressure coefficient of 1, in which the direction of maximum horizontal principal stress was consistent with the direction of the coal bed strike (angle of 0°). The associated simulation results are shown in Figure 6.
Figure 6 shows that, from the direction of rock inclination, the normal stress distribution of the roof plate above the mining area is similar to a hyperbola when mining the upper section. The normal stress of the rock layer above the roof plate decreases gradually as the layer level increases. Normal stress shows an obvious gradient change, and a clear stress concentration phenomenon is produced at its lower end. When mining in the lower section, the degree of stress in the lower end of the upper section, which originally produces stress concentration, decreases, and the final overall distribution still looks similar to a hyperbola. From the rock direction, most areas on the working face are approximately horizontal, being only 4.4 m away from the coal wall of the mining area. The overall distribution remains approximately hyperbolic, and the stress distribution has little relationship with the advance distance of the working face. From the direction of the rock strata, most of the areas of the roof of the working face are approximately horizontal, and elevated stress only occurs at about 4 m from the coal wall of the mining area, with the stress value decreasing away from the coal wall of the mining area, eventually tending to a lower value of the approximate level.
In test 2, the conditions of a coal bed inclination angle of 75°, burial depth of 100 m, and lateral pressure coefficient of 1.25 were simulated, in which the direction of maximum horizontal principal stress made an angle of 45° with coal bed strike direction. The simulation results are shown in Figure 7.
From the normal stress distribution presented in Figure 7, it can be seen that, in the direction of rock stratum inclination, when mining the upper section, the normal stress distribution of the roof plate above the mining area decreases with increasing distance from the lower end within the range of 4 m, in an approximately linear manner, and decreases with increasing distance from the upper end within the range of 2 m. The distribution of the stresses within the range of 4 m from the lower end to within the range of 2 m to the upper end is approximately linear, the stress distribution within the range of 4 m from the lower end to the upper end is approximately horizontal (which can be regarded as the mean value), and the stress distribution characteristics do not change much with the advance distance of the working face and the mining stratum. In the direction of the rock strata, most of the areas of the roof of the working face are approximately horizontal, and the phenomenon of elevated stress only occurs in the range of 8 m from the coal wall of the hollow area. This value decreases as the distance from the coal wall of the hollow area increases, finally reaching a low value close to that of an approximately horizontal area.
In test 3, the conditions of a coal bed inclination angle of 85°, burial depth of 100 m, and lateral pressure coefficient of 1.5 were simulated, in which the direction of maximum horizontal principal stress formed an angle of 90° with the coal bed strike direction. The simulation results are shown in Figure 8.
From the normal stress distribution in Figure 8, it can be seen that in the direction of rock stratum inclination, when mining the upper section, the normal stress distribution of the roof plate above the mining area decreases with an increase in distance from the lower end within the range of 4 m, in an approximately linear manner, and decreases with an increase in the distance from the upper end within the range of 2 m. The distribution of stresses within the range of 4 m from the lower end to the upper end is approximately horizontal (which can be regarded as the mean value). Similarly, in the range of 4 m from the lower end to 2 m from the upper end, the stress distribution is also approximately horizontal, and the stress distribution characteristics do not change much with the advance distance of the working face and the mining layer. In the direction of the rock strata, most of the areas of the roof of the working face are approximately horizontal, and the phenomenon of elevated stress only occurs in the range of 8 m from the coal wall of the mining area, with its value decreasing with distance from the coal wall of the mining area, ultimately tending toward the approximate level of the lower value.
Analyzing the distribution characteristics of normal stress in the inclined and strike directions of the rock layer above the mining zone obtained in tests 1 to 3, it can be seen that the normal stresses in tests 2 and 3 differed only in the magnitudes of the maximum and minimum values, with their distribution patterns being similar. The maximum value of normal stress at the end of the layer and in the part of the middle was approximately the average value and then decreased with an increase in the inclination angle of the rock layer. The stress cloud diagrams in the inclined direction all showed an obvious stress transformation gradient, indicating that the stress gradient was higher in the inclined direction. The gradient of stress transformation indicated that, in the case of shallow burial, the self-gravitational stress of the rock formation has a greater influence on the normal stress distribution of the rock formation.
In test 4, the conditions of a coal bed inclination angle of 65°, burial depth of 300 m, and lateral pressure coefficient of 1.5 were simulated, in which the direction of maximum horizontal principal stress made an angle of 45° with the direction of the coal bed strike. The simulation results are shown in Figure 9.
From the normal stress distribution in Figure 9, it can be seen that, in the direction of inclination of the rock layer, the normal stress on the top plate of the rock layer in the process of mining the upper part is approximately “spoon-type”, and when mining the lower part of the segment, the range of the “spoon belly” is enlarged, that is, the normal stress is larger at one end while, in the middle part, it is approximately horizontal (and so can be regarded as a uniform load), and the overall normal stress gradient does not change significantly with an increase in the advance distance of the working face. Meanwhile, in the part above the upper end, the area of increased normal stress decreases with increasing advance distance of the working face. In the rock strike direction, the majority of the top plate of the working face is approximately horizontal, and only in the middle part of the working face does the normal stress increase. In the direction of the rock strata, most of the top plate of the working face is approximately horizontal, and the phenomenon of stress increase only occurs in the range of about 8 m from the coal wall of the hollow area. The stress value decreases with distance from the coal wall of the hollow area and eventually tends to come close to a lower average value; furthermore, the upper and lower segments present basically the same distribution law.
In test 5, the conditions of a coal bed inclination angle of 75°, burial depth of 300 m, and lateral pressure coefficient of 1 were simulated, in which the direction of maximum horizontal principal stress formed an angle of 90° with the coal bed strike direction. The simulation results are shown in Figure 10.
Observing the normal stress distribution in Figure 10, it can be seen that—whether considering the rock stratum direction or inclination—in the direction of rock stratum inclination, the normal stress of the rock stratum top plate in the process of mining the subsection presents an “L-shaped” pattern, that is, in the lower part to the upper part of the rock stratum, the normal stress of the rock stratum top plate first reduces and then slowly increases. In the rock stratum direction, most areas of the working face top plate are approximately horizontal, and the stress increases only in the range of about 8 m from the coal wall to the mining hollow area. In the rock stratum direction, most areas of the working face roof are approximately horizontal, and elevated stress is only observed in the range of about 8 m from the coal wall of the mining area, where its value decreases with distance from the coal wall to the mining area, eventually tending to the lower value of the average level. As seen above, the upper and lower segments present the same distribution pattern.
In test 6, the conditions of a coal bed inclination angle of 85°, burial depth of 300 m, and lateral pressure coefficient of 1.25 were simulated, in which the direction of maximum horizontal principal stress was consistent with the coal bed strike direction (i.e., an angle of 0°). The simulation results are shown in Figure 11.
Observing the normal stress distribution in Figure 11, we can see that—whether considering the rock stratum direction or inclination—in the direction of rock stratum inclination, the normal stress of the rock stratum top plate in the process of mining the subsection presents an approximately “L-type” pattern, similar to that described above. In the direction of the rock layer, most areas of the working face roof are approximately horizontal, and the stress increases only in the range of about 8 m from the coal wall of the mining area, with the stress value decreasing with the distance from the coal wall to the mining area, eventually converging to a lower value at an average level. Again, the distribution patterns for the upper and lower segments are basically the same.
Comparing and analyzing the characteristics of the normal stress distribution in the roof rock layer above the mining airspace area in tests 4–6, the following conclusions were determined: in the strike direction, the effects of mining in the segments in the mining airspace areas on the distribution of normal stress were basically the same, presenting a trend of gradual increase with an increase in the angle of inclination of the coal seam; however, in the range of 4 m from the lower part of the upper part of the range, the stress appeared to be approximately at the average level in the simulation. This value decreased with an increase in the dip angle of the coal seam, and the stress distribution characteristics in the process of mining the lower section were basically the same as those observed for the upper section. There was no obvious gradient of stress transformation in the obtained stress cloud map, indicating that the self-gravitational stress of the rock stratum has no effect on the distribution of the normal stress of the stratum in the case of shallow burying. In the direction of the strike, the normal stress on the rock stratum’s top plate presents an approximately “U-shaped” pattern, while the stress distribution above the mining area is approximately horizontal with a small constant value; the size of this value is negatively correlated with the inclination angle of the rock stratum (i.e., it decreases with an increase in the inclination angle of the rock stratum).
In test 7, the conditions of a coal bed inclination angle of 65°, burial depth of 500 m, and lateral pressure coefficient of 1.25 were simulated, in which the direction of maximum horizontal principal stress formed an angle of 90° with the coal bed strike direction. The simulation results are shown in Figure 12.
From the normal stress distribution in Figure 12, it can be seen that, in the rock layer inclination direction, when mining the upper section, the normal stress distribution of the roof plate above the mining zone decreases with increasing distance from the lower end within a range of 4 m, with an approximately linear trend; furthermore, the normal stress distribution decreases with an increase in the distance from the upper end within the range of 2 m (which is also approximately linear), and the stress distribution in the range of 2 m from the lower end to the upper end approximates a horizontal state (which can be regarded as the mean value) and changes little with the advance distance of the working face and the mining level. The stress distribution in the range of 4 m from the lower end to 2 m from the upper end is also approximately horizontal (which can be regarded as the mean value), and the stress distribution characteristics do not change much with the advance distance of the working face and the mining layer position. The overall normal stress cloud map shows an obvious stress gradient: in the direction of the rock strata, most of the areas of the roof plate of the working face present approximately horizontal stress distributions, and the stress elevation phenomenon only occurs in the range of 8 m from the coal wall of the hollow area, with the value decreasing eventually with greater distance from the coal wall of the hollow area, finally tending to a lower average level.
In test 8, the conditions of a coal bed inclination angle of 75°, burial depth of 500 m, and lateral pressure coefficient of 1.5 were simulated, in which the direction of maximum horizontal principal stress was consistent with the coal bed strike direction (i.e., angle of 0°). The simulation results are shown in Figure 13.
From the normal stress distribution in Figure 13, it can be seen that, in the direction of inclination of the rock layer, the normal stress on the top plate of the rock layer in the process of mining the upper section presents an approximately “spoon-type” pattern. When mining the lower section, the range of the “spoon belly” is enlarged, that is, the end shows larger normal stress, while the distribution in the middle part is approximately horizontal (and thus can be regarded as a uniform load), with the overall normal stress gradient not significantly changing. In the lower part below the end, the stress at a distance of about 10 m from the working face does not change significantly, while in the upper part of the upper end, the normal stress increases with increasing distance from the working face and then decreases. The overall normal stress maps do not show a significant change in the stress gradient. In the direction of the rock strata, most of the areas of the working face roof are approximately horizontal, and only in the range of about 8 m from the coal wall of the mining area does the stress increase phenomenon occur. The stress value decreases as the distance from the coal wall of the mining area decreases, eventually tending to a lower average level. The distribution patterns for the upper and lower segments are basically the same.
In test 9, the conditions of a coal bed inclination angle of 85°, burial depth of 500 m, and lateral pressure coefficient of 1 were simulated, in which the direction of maximum horizontal principal stress made an angle of 45° with the coal bed strike direction. The simulation results are shown in Figure 14.
From the normal stress distribution in Figure 14, it can be seen that in the direction of inclination of the rock layer, the normal stress on the top plate of the rock layer in the process of mining the upper part of the segmentation presents a “spoon-type” pattern and, when mining the lower part of the segmentation, the range of the “spoon belly” is enlarged, that is, the normal stress is higher in the end part while, in the middle part, it is approximately horizontal (and thus can be regarded as a uniform load), and the overall normal stress gradient does not change significantly. In the lower part of the lower end of the following part, the stress increases up to about 10 m with an increase in the advance distance of the working face, although the change in stress is not significant. In the upper part of the upper end, the normal stress increases in the area of the working face with an increase in the advance distance of the working face, with the stress gradient presenting an increasing trend. The overall normal stress maps indicate obvious stress gradient changes; in the direction of the rock strata, most of the areas of the working face roof are approximately horizontal, and in the range of about 8 m from the coal wall of the mining area, the phenomenon of elevated stress occurs. The stress value decreases as the distance from the coal wall of the mining area decreases, eventually tending to be close to a lower average level. As mentioned above, the upper and lower segments present distribution patterns that are basically the same.
Comparing and analyzing the characteristics of normal stress distribution in the roof rock layer above the mining airspace area in tests 7–9, it was found that in the strike direction, the distribution of normal stress is basically the same in the process of mining in the segments of these mining airspace areas. With an increase in the angle of inclination of the coal seam, the stress presents a gradually increasing trend; however, in the range of 4 m from the lower part of the upper part of the range, the stress appears to remain at approximately the average level in the simulation and changes with the coal seam inclination angle. In the process of mining the lower section, the characteristics of the stress distribution are basically the same as those for the upper section. In comparison, the overall normal stress cloud map for test 7 showed a more obvious change and directionality of the stress gradient; test 9 also showed certain changes in this gradient, while test 8 basically did not show any obvious changes in the stress gradient, suggesting that the stress gradient changes with a burial depth of 500 m or greater. This indicates that changes in the stress gradient are not necessarily related to the inclination angle of the rock layer when the burial depth is greater than 500 m. The normal stress distribution in the top plate of the rock layer was approximately “U”-shaped, while that above the mining area was approximately a horizontal line with a small constant value, where the size of this value was negatively correlated with the inclination angle of the rock layer (i.e., it decreases with an increase in the inclination angle of the rock layer).

4.3. Comparative Analysis of Rock Tilt Directions

In order to better analyze the influences of burial depth, inclination angle, lateral pressure coefficient, and the angle of maximum principal stress on the distribution of normal stress on the roofs of rock seams during the mining of steeply inclined extra-thick coal seams, the results of the orthogonal tests were summarized. The normal stress on the roof of rock seams above the mine openings was determined in the rock seam inclination direction, and the distribution of normal stress on the roof of the inclined seams in the direction of inclination is presented in Figure 15. In the figure, the range of horizontal coordinates from 0 to 32 indicates the top plate of the upper section working face, horizontal coordinates from −32 to 0 indicate the range of the top plate of the lower section working face, and the vertical coordinates denote the normal stress values.
Analyzing the distribution of normal stress in the top plate in the inclination direction as shown in Figure 15, considering the effects of the above four influencing factors on the distribution of normal stress in the inclination direction of the top rock layer, the following conclusion was reached.
Regarding the angle between the maximum principal stress direction and the direction of the rock layer, the normal stress of the roof plate in the mining hollow area above the working face did not change significantly with a change in this angle.
Analyzing the characteristics of the stress distribution in the inclination direction of the rock layer and the distribution law, it was finally concluded that, regardless of whether the upper or lower section was mined, in the 4 m of the working face roof from the lower end (upper section 0–8, lower section −32 to −24) the normal stress decreases sharply, and the length and the inclination direction of the rock layer do not have a strong effect on this relationship. In the other parts of the roof plate, the stress change is moderate, and the overall stress in these parts can be approximated by the average value.

4.4. Comparative Analysis of Rock Strike Directions

The normal stress distribution pattern of the roof plate above the working face along the pushing direction of the working face is shown in Figure 16.
As can be seen from Figure 16, when the working face advances 20 m, the normal stress of the roof slab above the test 1–3 working faces is approximately horizontal, with its value decreasing gradually; meanwhile, the stress in tests 4–9 decreases gradually in the range of 6 m from the coal wall to the working face in the hollow area, finally reaching its lowest value at the −34 coordinate. It approximately presents a mean distribution of the whole, with an increase in the inclination angle of the seam leading to decreased stress and an increase in the burial depth increasing the stresses. When the working face is advanced 40 m, the normal stress of the roof slab above the working face in tests 1–3 attains an approximately average level, with the value gradually decreasing; however, the stress value increases with the increasing advance distance of the working face. Similar to the above, the stress gradually decreased and eventually reached the lowest value at the −34 coordinate in the range of 6 m from the coal wall in the mining hollow area of the working face in tests 4–9, with the value increasing with greater advance distance of the working face. In particular, when the working face was advanced to 80 m, the normal stress of the rocky roof slab of the working face reached the lowest value at the −34 coordinate in the associated figures. When the working face was advanced to 80 m, the changing characteristics of normal stress on the top plate of the rock face were basically the same as when the working face was advanced to 40 m. When mining the lower part of the coal seam, the normal stress distribution of the rock stratum roof above the working face was basically the same as when mining the upper part.
Stress in the rock stratum direction generally increases with increasing the advance distance of the working face, decreases with an increasing coal bed inclination angle, and decreases with an increasing burial depth. When the stress distribution is horizontal in the shallow part (100 m), there is a certain high-stress area near the coal wall at the back of the mining area, with an overall approximately local load presenting obvious local stress elevation in the middle part (300–500 m), which is mainly concentrated in the range of 6 m (Figure 13, coordinate axis −40 to −34) of the coal wall in the mining hollow area of the working face. The area with elevated stress does not increase with an increase in the advance distance of the working face, and it can be considered that the distribution range of this area is not related to the advance distance of the working face; meanwhile, the change in normal stress in the remaining parts tends to be moderate, and it can be approximately considered that the load is evenly distributed.

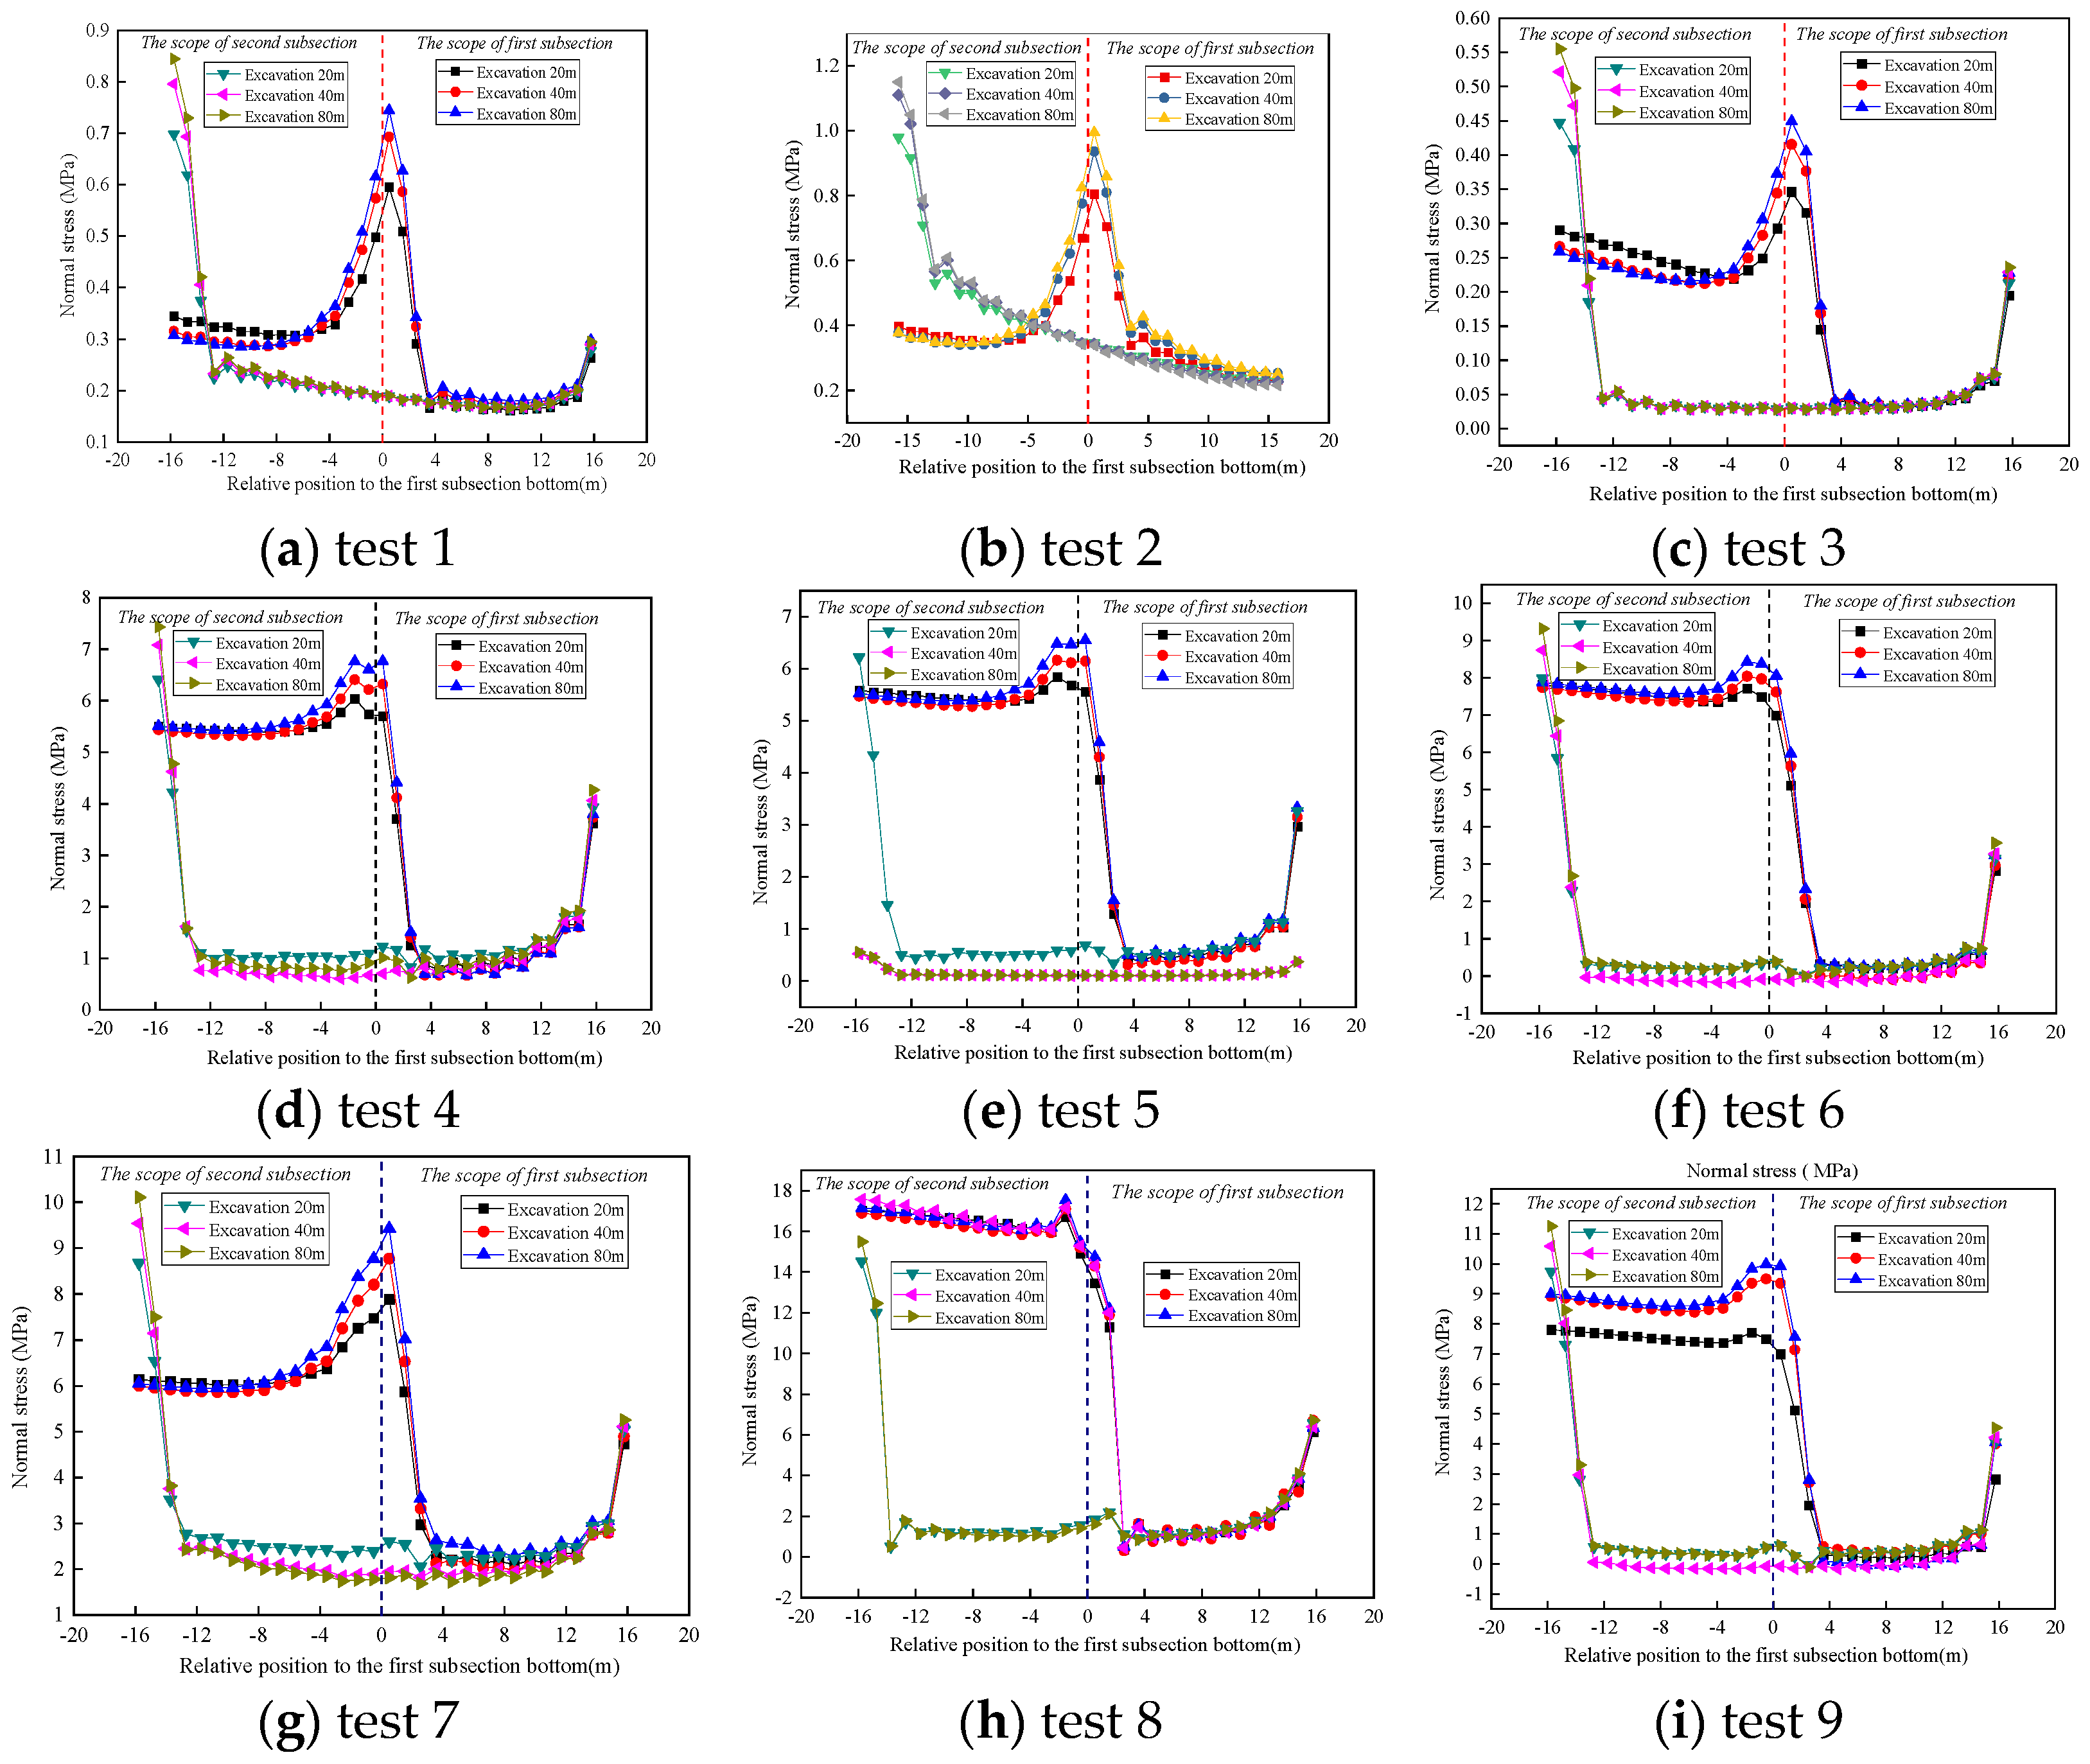
5. Orthogonal Analysis of Normal Stresses in the Top Rock Layer

Through preliminary analysis of the previous nine groups of tests, the normal stresses in the rock roof above the mining area can be divided into two parts: one part is the edge of the stress increase area, the range of which is about 4 m from the edge of the range, and the other part is the smooth part, with approximately average stress values. For the two parts of the rock roof, the average normal stresses and the sizes of areas corresponding to different advance distances of the working face are given in Table 6.
In order to more fully study the burial depth, inclination, lateral pressure coefficient, and the maximum principal stress direction of the rock strata on the roof normal stress effect during steeply inclined extra-thick coal seam segmental mining, considering the relationships between the four factors mentioned above determined through the orthogonal analysis, we derived the weights of the four influencing factors in the experimental analysis. The results are shown in Table 7.
According to the orthogonal test results in Table 7, it can be seen that considering the range of about 4 m from the edge of the roof plate, the factors affecting the top plate normal stress distribution are (from high to low) inclination angle > burial depth > angle between the maximum horizontal principal stress and the direction of the rock strata > lateral pressure coefficient. Meanwhile, for the smooth (approximately average) horizontal distribution, the factors affecting the value of the maximum horizontal principal stress in the direction of the rock strata are (from high to low) the angle between the maximum horizontal principal stress and the direction of the rock strata > inclination angle > burial depth > lateral pressure coefficient.

6. Discussion

In this work, FLAC3D finite element numerical simulation software was employed to investigate the effects of different burial depths, inclination angles, lateral pressure coefficients, and the direction angle of the maximum horizontal principal stress on the normal stress distribution of the roof slab. Applying a three-level L9(34) orthogonal numerical simulation experimental design, the characteristics of horizontal segmental mining in steeply inclined extra-thick coal seams were systematically examined. This approach offers several advantages; for example, it efficiently reduces the number of experiments required while allowing for a comprehensive analysis of the interactions among various factors. This dual benefit provides crucial data support and a theoretical foundation for understanding the stress distribution in steeply inclined coal seams. The research findings were further enhanced by converting the roof stress into a specific coordinate system, revealing the normal stress distribution patterns of the roof rock layer under different working wall advance distances and segmentation scenarios. These insights directly inform mining practices, aiding in the optimization of parameters such as segmentation height and advance distance. Such optimizations aim to enhance the efficiency of mining, mitigate roof disaster risks, and ensure the safe and efficient operation of mines. The methodology, which combines orthogonal experimental design with numerical simulation, exemplifies the efficiency and comprehensiveness of multi-factor and multi-level experimental design. This approach not only offers a scientific framework for addressing coal seam mining challenges under complex geological conditions but also serves as a valuable reference for multi-factor optimization problems in other fields. Innovatively, this study proposed a method to convert stress into a normal stress distribution within a specific coordinate system, addressing the complexity of the stress distribution in steeply inclined coal seams. This novel approach provides fresh perspectives and technical references for subsequent research endeavors. Overall, this research holds significant value in both theoretical and practical domains. It also showcases methodological and innovative advancements, offering robust scientific support and technical guidance for the safe and efficient extraction of steeply inclined extra-thick coal seams. Research on stress distribution patterns provides valuable insights that can be directly applied to enhance safety in the mining context in several ways:
(1)
Identifying High-Risk Zones: By understanding stress distributions, mining engineers can identify areas with high stress concentration, which are more prone to rock bursts, collapses, or other failures. This allows for targeted monitoring and reinforcement in these zones to prevent accidents.
(2)
Optimizing Mine Design: The findings can inform the design of mine layouts, including the placement of tunnels, pillars, and extraction sequences. By avoiding high-stress areas or redistributing stress more evenly, the risk of structural failures can be minimized.
(3)
Support System Design: knowledge of stress patterns helps to design more effective support systems, such as rock bolts, shotcrete, or steel arches, which are tailored to the specific stress conditions of different areas within the mine.
(4)
Predicting and Mitigating Hazards: Stress distribution data can be used to predict potential hazards, including rock bursts or ground subsidence. Early warning systems and preventive measures, such as controlled blasting or stress relief techniques, can be implemented to mitigate these risks.
(5)
Improving Worker Safety Protocols: by mapping stress patterns, mining operators can develop safer work practices, such as restricting access to high-stress areas during critical periods or scheduling maintenance activities when stress levels are lower.
(6)
Enhancing Monitoring Systems: The research results can guide the deployment of advanced monitoring technologies, such as micro-seismic sensors or stress meters, in order to continuously track stress changes and provide real-time data for decision making.
While this research presented stress distribution patterns, the practical application of the reported findings requires collaboration between researchers, engineers, and safety professionals to translate them into actionable strategies. Through the integration of this knowledge into mining operations, safety can be significantly improved, reducing the likelihood of accidents and ensuring a safer working environment for miners.

7. Conclusions

Utilizing the orthogonal test method, this study analyzed four factors (each at three levels) affecting the normal stress of the roof of the working face (i.e., inclination angle, burial depth, the angle between the maximum horizontal principal stress and the direction of the rock formation, and the lateral pressure coefficient). The gravity scale system data obtained through simulation were converted into normal stress under the rock formation normal direction coordinate system. The results of the analysis revealed the following:
(1)
The normal stress distribution is approximately linear within 4 m of the top edge of the rock formation. The influences of the factors on the mean values are, in descending order, inclination angle > burial depth > angle between the maximum horizontal principal stress and the strike of the formation > lateral pressure coefficient.
(2)
In other parts of the top plate of the formation, the normal stresses are approximately uniformly distributed. The four influencing factors on these mean values are, in descending order, angle between the maximum horizontal principal stress and the strike of the formation > inclination angle > burial depth > lateral pressure coefficient.
(3)
During mining of the upper section, the normal stress in the hollow area above the working face increases with greater burial depth. In the lower section, the stress distribution characteristics are similar to those of the upper section; however, the rate of change in the normal stress within the range from −32 to −24 in the coordinate axis gradually increases, while it tends to flatten in the range from−24 to 0. Regarding coal seam inclination, the normal stress in the hollow area decreases as the inclination increases during upper-section mining, with the rate of change in the lower part (−32 to −24 on the axes) increasing and the stress in other regions (−24 to 0) approaching a flat distribution. During lower-section mining, although the normal stress increases in the range of −32 to −24, the stress distribution in other regions (−24 to 0) also tends to flatten. Overall, the characteristics of stress distribution during lower-section mining are similar to those for the upper section.
(4)
The normal stress in the mining hollow area above the working face increases with an increase in the lateral pressure coefficient. This study provided new insights into the distribution pattern of normal stresses on the roof of the working face and clarified the order of importance of each influencing factor.

Author Contributions

G.Z., methodology, investigation, writing—original draft, conceptualization, formal analysis, and writing—review and editing. Y.Z., investigation and writing—original draft. S.F., writing—original draft, conceptualization, and formal analysis. M.C., funding acquisition and writing—review and editing. All authors have read and agreed to the published version of the manuscript.

Funding

This research was supported by the National Natural Science Foundation of China (52374139), the Special Funds Program for Basic Research Operating Expenses of China Academy of Safety Science and Technology (2023JBKY14), and the National Science and Technology Major Project (2024ZD1004505).

Data Availability Statement

The data used to support the findings in this study are available from the corresponding author upon request.

Conflicts of Interest

The authors declare that they have no known competing financial interests or personal relationships that could have appeared to influence the work reported in this paper.

References

  1. Wang, H.; Jiao, J.; Wu, Y.; Jiang, B.; Luo, S.; Wang, T. Mining stress evolution law of surrounding rock in short wall fully mechanized caving stope of steeply inclined coal seam. J. Min. Saf. Eng. 2024, 41, 462–471. [Google Scholar] [CrossRef]
  2. Wang, J.; Yang, S.; Liu, S.; Liu, J.; Zhang, J. Technology status and fluidized mining conception for steeply inclined coal seams. Coal Sci. Technol. 2022, 50, 48–59. [Google Scholar]
  3. Wu, Y.P.; Liu, K.Z.; Yuan, D.F.; Jie, P.D.; Wang, G.W. Research progress on the safe and efficient mining technology of steeply dipping seam. J. China Coal Soc. 2014, 39, 1611–1618. [Google Scholar] [CrossRef]
  4. Ross, C.; Conover, D.; Baine, J. Highwall mining of thick, steeply dipping coal: A case study in geotechnical design and recovery optimization. Int. J. Min. Sci. Technol. 2019, 29, 777–780. [Google Scholar] [CrossRef]
  5. Jawed, M.; Sinha, R.K. Design of rhombus coal pillars and support for roadway stability and mechanizing loading of face coal using SDLs in a steeply inclined thin coal seam: A technical feasibility study. Arab. J. Geosci. 2018, 11, 415. [Google Scholar] [CrossRef]
  6. Xie, P.; Zhang, Y.; Wu, Y.; Huang, B.; Feng, K.; Chen, X. Experimental study on roof fracture and gangue filling in pitching oblique mining area of steeply dipping medium thick coal seam. J. Min. Saf. Eng. 2023, 40, 534–542. [Google Scholar] [CrossRef]
  7. Wu, Y.; Huangfu, J.; Xie, P.; Hu, B.; Liu, K. Mechanism of instability of section coal pillar in steeply dipping seam based on large-scale strata control technology. J. China Coal Soc. 2018, 43, 3062–3071. [Google Scholar]
  8. Xie, P.S.; Zhang, Y.Y.; Zhang, Y.L.; Chen, J.J.; Zhang, X.B.; Duan, J.J. Instability law of the coal-rock interbedded roof and its influence on supports in large mining height working face with steeply dipping coal seam. J. China Coal Soc. 2021, 46, 344–356. [Google Scholar] [CrossRef]
  9. Zhang, G.; Zhang, Y. The immediate roof first fractures of suberect and extremely thick coal. J. China Coal Soc. 2018, 43, 1220–1229. [Google Scholar] [CrossRef]
  10. Zhang, G.; Li, Q.; Xu, Z.; Zhang, Y. Roof fractures of near-vertical and extremely thick coal seams in horizontally grouped top-coal drawing method based on the theory of a thin plate. Sustainability 2022, 14, 10285. [Google Scholar] [CrossRef]
  11. Yang, S.; Li, Q.; Yue, H.; Yang, S.; Liu, F. Study on coal wall spalling characteristics and stability control of steeply inclined coal seam mining face. Comput. Part. Mech. 2025, 1–22. [Google Scholar] [CrossRef]
  12. Lu, A.; Song, D.; Li, Z.; He, X.; Zhou, C.; Qiu, L. Numerical Simulation Study on Microseismic Characteristics and Rockburst Hazard Prediction in Deep Mining of Steeply Inclined Coal Seams. Rock Mech. Rock Eng. 2024, 58, 2465–2486. [Google Scholar] [CrossRef]
  13. Xiong, Y.; Kong, D.; Song, G.; He, Y. Failure mechanism and 3D physical modeling test of coal face pyramid sliding in steeply inclined working face: A case study. Eng. Fail. Anal. 2024, 159, 108064. [Google Scholar] [CrossRef]
  14. Xie, Z.; Wang, J.; Zhang, N.; Guo, F.; He, Z.; Xiang, Z.; Zhang, C. Study on Time-Dependent Failure Mechanisms and CBAG Differential Support Technology of Roadway in Steeply Inclined Coal Seam. Processes 2023, 11, 866. [Google Scholar] [CrossRef]
  15. Yan, Y.; Zhang, Y.; Zhu, Y.; Cai, J.; Wang, J. Quantitative Study on the Law of Surface Subsidence Zoning in Steeply Inclined Extra-Thick Coal Seam Mining. Sustainability 2022, 14, 6758. [Google Scholar] [CrossRef]
  16. Kong, D.; Xiong, Y.; Cheng, Z.; Wang, N.; Wu, G.; Liu, Y. Stability analysis of coal face based on coal face-support-roof system in steeply inclined coal seam. Geomech. Eng. 2021, 25, 233–243. [Google Scholar] [CrossRef]
  17. He, S.Q.; Song, D.Z.; Li, Z.L.; He, X.Q.; Chen, J.Q.; Li, D.H.; Tian, X.H. Precursor of Spatio-temporal Evolution Law of MS and AE Activities for Rock Burst Warning in Steeply Inclined and Extremely Thick Coal Seams Under Caving Mining Conditions. Rock Mech. Rock Eng. 2019, 52, 2415–2435. [Google Scholar] [CrossRef]
  18. Li, X.; Wang, Z.; Zhang, J. Stability of roof structure and its control in steeply inclined coal seams. Int. J. Min. Sci. Technol. 2017, 27, 359–364. [Google Scholar] [CrossRef]
  19. Wang, J.-A.; Jiao, J.-L. Criteria of support stability in mining of steeply inclined thick coal seam. Int. J. Rock Mech. Min. Sci. 2016, 82, 22–35. [Google Scholar] [CrossRef]
  20. Feng, C.; Lei, Z.; Chen, J.; Chang, B.; Yang, Y.; Li, C.; Jia, C. Research on Reducing Mining-Induced Disasters by Filling in Steeply Inclined Thick Coal Seams. Sustainability 2019, 11, 5802. [Google Scholar] [CrossRef]
Figure 1. The three-dimensional spatial distribution of Adaohai Mine.
Processes 13 01317 g001
Figure 2. The model of different strata dip angles.
Processes 13 01317 g002
Figure 3. The schematic diagram of boundary condition.
Processes 13 01317 g003
Figure 4. The location of export data.
Processes 13 01317 g004
Figure 5. The diagram of coordinate rotation.
Processes 13 01317 g005
Figure 6. The normal stress distribution of the roof in test 1.
Processes 13 01317 g006
Figure 7. The normal stress distribution of the roof in test 2.
Processes 13 01317 g007
Figure 8. The normal stress distribution of the roof in test 3.
Processes 13 01317 g008
Figure 9. The normal stress distribution of the roof in test 4.
Processes 13 01317 g009aProcesses 13 01317 g009b
Figure 10. The normal stress distribution of the roof in test 5.
Processes 13 01317 g010
Figure 11. The normal stress distribution of the roof in test 6.
Processes 13 01317 g011
Figure 12. The normal stress distribution of the roof in test 7.
Processes 13 01317 g012
Figure 13. The normal stress distribution of the roof in test 8.
Processes 13 01317 g013aProcesses 13 01317 g013b
Figure 14. The normal stress distribution of the roof in test 9.
Processes 13 01317 g014aProcesses 13 01317 g014b
Figure 15. The normal stress distribution of the immediate roof in the direction of dip.
Processes 13 01317 g015
Figure 16. The normal stress distribution of the immediate roof in the direction of dd.
Processes 13 01317 g016
Table 1. The scheme of orthogonal design for FLAC3D numerical simulation.
TestDepth (m)Dip of a Coal Seam (°)Lateral Pressure CoefficientAngle Between Maximum Principal Stress and Coal Seam Strike (°)
11006510
2100751.2545
3100851.590
4300651.545
530075190
6300851.250
7500651.2590
8500751.50
950085145
Table 2. Model size, number of cells, and number of nodes for different dip of a coal seam values.
Dip of a Coal Seam/°Lengths/mWidth/mHeight/mNumber of UnitsNumber of Nodes
65277200120553,750586,921
75257200120516,250550,685
85239200120515,000549,155
Table 3. Primary mechanical parameters of the coal or rock stratum.
NO.LithologyThickness/mDensity Kg/m3Bulk Modulus/GPaShear Modulus/GPaFriction Angle/degree (°)Cohesion/MPaTensile Strength/GPa
1Loose layer2021007.03.525°5.51.6
2Sandy mudstoneVariable26008.16.036°18.83.5
3Mudstone4824702.62.038°4.51.0
4Sandy mudstone2424508.16.036°18.83.5
5Medium sandstone16243010.96.931°39.55.1
6Sandstone826004.93.730°27.26.1
7Mudstone224302.62.038°4.51.0
8Coal seam2813301.20.828°4.20.9
9Mudstone424002.62.038°4.51.0
10Sandstone1224504.93.730°27.26.1
11Medium sandstone16265010.96.931°39.55.1
12Sandy mudstone2425008.16.036°18.83.5
13Coarse sandstone48250012.59.435°35.63.5
Table 4. The geostress of field measurement case in China.
NO.Geostress Test LocationDepth/mσ1/MPaσ2/MPaσH/MPaσ1/σ2
1Stone gate at +1126 m level of Adohai Mine367.518.0310.99.251.95
2Winch chamber at +1228 m level of Adohai Mine206.912.266.846.271.96
3Roadway 2–106b2 of Xinzhi Mine60014.78.5317.031.72
4Roadway 2–1022 of Ganhe Mine46116.188.38111.93
5Railroad track end in the second mining area of Ganhe Mine52914.787.9212.771.87
6Roadway 10–2151 of Tuanbai Mine339.275.327.81.74
7Return lane 310 of Tuanbai Mine40512.376.79.671.8
8System roadway 10–1021 of Huipodi Mine367.99.324.998.771.87
9East first mining area railroad track of Huipodi Mine355.110.325.578.331.85
10East five mining area two link alley of Huipodi Mine2717.384.846.281.52
11Lane 1051, central part of the yard of Pangpang Mine4909.635.112.261.89
12Lane 1092 at 560 m of Pangpang Mine59211.686.1614.81.90
13Rubber wheelbarrow alley of Changping Mine348.110.815.68.71.93
14Explosives magazine return airway of Changping Mine336.38.855.158.411.72
15First contact lane exit of Changping Mine343.99.644.998.61.93
Table 5. The boundary condition of numerical model.
NO.Lower z-DirectionUpper z-Directionx-Negative Directionx-Positive Directiony-Negative Directiony-Positive Direction
Szz/MpaSxx/MpaSxx/MpaSyy/MpaSyy/Mpa
1Fixed0.25Fixed0.32Fixed0.18
2Fixed0.25Fixed0.31Fixed0.31
3Fixed0.25Fixed0.27Fixed0.48
4Fixed5.25Fixed7.88Fixed7.88
5Fixed5.25Fixed6.78Fixed3.72
6Fixed5.25Fixed8.47Fixed4.65
7Fixed10.25Fixed9.09Fixed16.54
8Fixed10.25Fixed19.85Fixed10.90
9Fixed10.25Fixed10.25Fixed10.25
Table 6. The normal average vertical stress.
NO.Location of Statistics Mean Normal Corresponding Force (Mpa)
Excavation Distance of the Upper SectionDistance of Excavation in the Lower Section
204080204080
1Mean value of the edge portion0.730.840.890.810.900.92
Smoothed section mean0.300.330.340.450.340.33
2Mean value of the edge portion0.530.620.660.500.550.58
Smoothed section mean0.180.190.200.220.190.19
3Mean value of the edge portion0.320.380.410.300.340.36
Smoothed section mean0.050.050.060.030.030.03
4Mean value of the edge portion5.045.525.872.883.123.18
Smoothed section mean0.660.620.751.040.710.96
5Mean value of the edge portion5.055.555.932.910.330.35
Smoothed section mean1.090.991.000.510.110.11
6Mean value of the edge portion6.537.077.474.064.414.76
Smoothed section mean0.450.210.530.22−0.090.29
7Mean value of the edge portion7.087.848.415.035.455.65
Smoothed section mean2.372.312.632.521.931.82
8Mean value of the edge portion13.2213.8014.146.2517.396.49
Smoothed section mean1.471.501.541.2613.861.71
9Mean value of the edge portion6.538.679.165.065.495.88
Smoothed section mean0.450.730.340.39−0.100.48
Table 7. The result of orthogonal design.
ClassificationsDepthInclination AngleLateral Pressure CoefficientAngle of Principal StressDepthInclination AngleLateral Pressure CoefficientAngle of Principal Stress
ExcavationUpper Section Excavation 20 mLower Section Excavation 20 m
K11.5812.8412.3120.481.618.738.7811.12
K216.6218.8114.1512.119.859.659.598.44
K326.8345.0318.5812.4416.3427.799.438.23
k10.534.284.106.830.542.912.933.71
k25.546.274.724.043.283.223.202.81
k38.9415.016.194.155.459.263.142.74
R
(Level)
8.42
(2)
10.73
(1)
2.09
(4)
2.68
(3)
4.91
(2)
6.36
(1)
0.27
(3)
0.96
(3)
K1′0.537.011.842.220.706.631.341.93
K2′2.202.752.999.221.771.992.958.36
K3′4.280.942.183.514.160.642.343.06
k1′0.182.340.610.740.232.210.450.64
k2′0.730.921.003.070.590.660.982.79
k3′1.430.310.731.171.390.210.781.02
R’
(Level)
1.25
(3)
2.02
(2)
0.39
(4)
2.34
(1)
1.16
(3)
2.00
(2)
0.54
(4)
2.14
(1)
ExcavationUpper section excavation 40 mLower section excavation 40 m
K11.8414.2015.0621.711.799.476.7222.70
K218.1519.9615.5314.817.8718.2710.419.17
K330.3050.2819.7013.7728.3337.9820.856.12
k10.614.735.027.240.603.162.247.57
k26.056.655.184.942.626.093.473.06
k310.1016.766.574.599.4412.666.952.04
R
(Level)
9.49
(2)
12.03
(1)
1.55
(4)
2.65
(3)
8.85
(2)
9.51
(1)
4.71
(4)
5.53
(3)
K1′0.576.932.052.030.5516.960.3414.11
K2′1.812.682.718.750.7214.162.0217.70
K3′4.540.992.173.3515.69-0.1714.612.06
k1′0.192.310.680.680.185.650.114.70
k2′0.600.890.902.920.244.720.675.90
k3′1.510.330.721.125.23-0.064.870.69
R′
(Level)
1.32
(3)
1.98
(2)
0.22
(4)
2.24
(1)
5.04
(3)
5.71
(2)
0.56
(4)
1.20
(1)
ExcavationUpper section excavation 80 mLower section excavation 80 m
K11.9615.1715.9822.501.859.757.1412.17
K219.2720.7316.5415.698.297.4110.999.64
K331.7052.9320.4214.7418.0228.1710.036.36
k11.9615.1715.9822.500.623.252.384.06
k219.2720.7316.5415.692.762.473.663.21
k331.7052.9320.4214.746.019.393.342.12
R
(Level)
29.74
(2)
37.77
(1)
4.44
(4)
7.76
(3)
5.39
(2)
6.14
(1)
1.28
(4)
1.94
(3)
K1′0.607.381.672.410.555.920.922.33
K2′2.282.743.369.671.352.012.307.28
K3′4.510.922.353.684.020.802.701.96
k1′0.607.381.672.410.181.970.310.78
k2′2.282.743.369.670.450.670.772.43
k3′4.510.922.353.681.340.270.900.65
R’
(Level)
3.91
(3)
6.46
(2)
1.68
(4)
7.26
(1)
1.16
(3)
1.71
(2)
0.46
(4)
1.65
(1)
Notes: K1, K2, K3 are the sum of data of a factor at a certain level within 4 m from the edge; K1′, K2′, K3′ are the sums of the test data of a factor at a certain level within 4 m from the edge; k1′, k2′, k3′ are the mean values of experimental data of a factor at a certain level within 4 m from the edge; k1′, k2′, k3′ are the mean values of the test data of a factor at a level outside the range of 4 m from the edge; R is the extreme value of a factor within 4 m from the edge; R′ is the extreme difference value of a factor 4 m away from the edge; level is the sequential number of each factor.
Disclaimer/Publisher’s Note: The statements, opinions and data contained in all publications are solely those of the individual author(s) and contributor(s) and not of MDPI and/or the editor(s). MDPI and/or the editor(s) disclaim responsibility for any injury to people or property resulting from any ideas, methods, instructions or products referred to in the content.

