Article

Structural Characterization of Low-Rank Coals in the Ningdong Coalfield Under the Control of the First Coalification Jump

1
School of Resources and Earth Science, China University of Mining & Technology, Xuzhou 221116, China
2
Ningxia Hui Autonomous Region Bureau of Coal Geology, Yinchuan 750002, China
3
School of Construction Management, Jiangsu Vocational Institute of Architectural Technology, Xuzhou 221116, China
*
Author to whom correspondence should be addressed.
Processes 2025, 13(7), 1996; https://doi.org/10.3390/pr13071996
Submission received: 8 May 2025 / Revised: 17 June 2025 / Accepted: 21 June 2025 / Published: 24 June 2025

Abstract

The first coalification jump (FCJ) has a significant effect on changes in the microstructural properties of coal and plays a crucial role in understanding the efficient utilization of low-rank coal. One lignite (QSY-2), two subbituminous (MHJ-10 and YCW-2), and three high-volatile A-grade bituminous coals (YX-12, JF-18, and HY-5) from the Ningdong coalfield were selected for research, avoiding the influence of regional geology. The evolution characteristics of the microstructures before and after the FCJ were investigated via spectroscopic experiments. The complex and unstable molecular structure of low-rank coal gradually decomposes and polymerizes at 350 °C. The aliphatic structure shows a V-shaped change trend as metamorphism increases. The inflection point is around an Ro of 0.6%. Demethylation and polymerization occur simultaneously during the FCJ. The reconnection of benzene substances with the aromatic ring increases the density of aromatic rings in the YCW-2 sample, significantly enhancing its aromaticity. The removal of oxygen-containing functional groups, especially methoxy and carbonyl groups, provides the possibility for the formation of CH4 and CO2 during the metamorphosis of lignite to subbituminous coal. Furthermore, high temperatures result in a loss of moisture content during the FCJ, which is the primary factor leading to a reduction in the hydroxyl content in coal. The selected samples are primarily composed of organic matter, with low levels of heteroatoms in the coal. It is preliminarily determined that coalification is not significantly affected. This study provides a theoretical foundation for investigating the molecular structure evolution of low-rank coal during the FCJ.

1. Introduction

The diversity and heterogeneity of the macromolecular structure network of coal are key factors affecting its scientific utilization. This complex network comprises diverse organic structural units of varying sizes, including both covalent and noncovalent bonds [1,2]. It features dense aromatic rings, hydrogen-bonded aromatic clusters, and heteroatoms [3]. The complex molecular network results in the diversity and heterogeneity of coal molecular structures. Coalification significantly influences the evolution of the molecular structure of coal. During coalification, the molecular structure and pore structure of coal exhibit both gradual and abrupt changes [4]. Coalification jumps are generally considered to be more crucial for changes in the microstructure of coal [5]. Moreover, the molecular structure of coal determines its chemical reaction characteristics during processes such as gasification, liquefaction, pyrolysis, and combustion [5,6,7]. Therefore, studying the evolution of the macromolecular structure of coal before and after a coalification jump is highly important for the efficient utilization of coal.
The efficient utilization of lignite and low-rank bituminous coal has gradually become a focus of research due to increasing energy demand. Low-rank coal accounts for 55% of the total coal reserves in China [8,9]. Lignite makes up 18% of the world’s coal reserves and plays a significant role in the energy supply [10]. Low-rank coal typically has a low calorific value, leading to poor combustion efficiency. However, the higher yield of tar and other chemical products provides feasibility for its clean utilization through conversion [11]. The gasification and liquefaction of low-rank coal involve changes in the molecular structure of the coal. Generally, the microstructure likely undergoes approximately six stages of coalification during the transformation of low-rank lignite into high-rank anthracite [12,13]. The first coalification jump (FCJ) occurs near a maximum reflectance of vitrinite (Ro) of 0.5–0.6%. The intense reaction between the aliphatic and aromatic structures in coal is considered an external manifestation of the FCJ [5,14]. Notably, the molecular structure changes in low-rank coal occur primarily during this period. Conducting characterization studies on the microstructural changes in low-rank coal before and after the FCJ is crucial for understanding the evolution mechanism of the molecular structure in detail.
The molecular structure of coal is usually studied via spectroscopic methods. Raman spectroscopy is a commonly used method. It can be used to study the microcrystalline structure and degree of disorder of coal [2,4]. The increase in coal metamorphism is reflected in the G peak by a gradual narrowing of its width and a gradual shift in its center to the right, whereas the D peak is reflected by the center of the peak moving to the left. However, this pattern does not seem to apply to coal with lower metamorphism. The structural arrangement of low-rank coal is diverse, resulting in the positions of the G and D peaks in its Raman spectra not shifting regularly with increasing metamorphic grade [2,15,16]. FTIR provides some assistance in understanding the microstructure of coal as well. This method provides insights into the functional groups within coal structures at the molecular level by identifying the vibration characteristics linked to specific chemical bonds [3,17,18]. The detection of defunctionalized C=O groups via FTIR is a clear indicator of the metamorphism of lignite into high-volatile bituminous coal [1,2]. As the degree of metamorphism increases, the content of C=O functional groups in coal gradually decreases. There is a noticeable change in the carbon framework structure of coal during the metamorphic process from low-rank coal to high-rank coal. It is accompanied by bitumenization, aromatization, and cyclization. 13C NMR and FTIR experiments provide consistent characterization of the skeletal carbon structure [19]. Notably, 13C NMR can extract 12 carbon skeleton parameters, which is more conducive to quantitative evaluation [20]. The quantitative analysis of the separation of aliphatic functional groups and side chains caused by bitumenization can be conducted on the basis of skeletal parameters [4]. Combining the features of the aforementioned technologies better facilitates the characterization of the evolution process of coal molecular structures.
A significant factor influencing the changes in the microstructural properties of coal is a marked jump during the coalification process [5]. The transformation of lignite to subbituminous coal, known as the FCJ, is accompanied by the decomposition of oxygen functional groups and aliphatic side chains, as well as the formation of methane [9,14,21]. Some studies suggest that CH4 is the product resulting from the removal of side chains during this period [22,23,24]. Furthermore, H2O, CO2, and benzene are considered products of FCJ [25]. CO2 is the result of carbonyl removal, whereas benzene is believed to be the product of the breakage of aliphatic bridge bonds [9]. The FCJ is believed to occur at low temperatures (<400 °C) in TGA experiments and is also the most significant in terms of reaction [9,12]. The evolution characteristics of the coal molecular structure during the FCJ are highly diverse across different regions. Yanzhou subbituminous coal (Ro is 0.62%) removes carbonyl functional groups more quickly than Shenhua coal (Ro is 0.52%) [9]. The Shenhua subbituminous does not appear to have been affected by the FCJ, which tends to occur around an Ro of 0.6%. However, another study reported opposite results. The aliphatic side-chain structure of the subbituminous coal from the Wulanmulun Mine (Ro is 0.51%) was removed at a faster rate than that of the Hengyi Mine (Ro is 0.62%) during the FCJ [4]. Clearly, the evolution mechanism of microstructures is, to a certain extent, influenced by regional geological characteristics. The specific stage at which the FCJ occurs under different geological conditions remains controversial. The Ningdong coalfield is rich in lignite and bituminous coal, with relatively minor variations in regional geological characteristics. Studying changes in the microscopic structure of coal before and after the FCJ can serve as a criterion for evaluating the period during which this jump occurred. Meanwhile, investigating the evolution of coal molecular structures before and after the FCJ within the same region can promote the efficient utilization of low-rank coal.
The purpose of this study was to investigate the evolution of the microstructure before and after the addition of the FCJ. Six samples from different coal ranks were collected from the Ningdong coalfield to minimize the impact of regional geology on the analysis. A series of experiments, such as 13C NMR, FTIR, and Raman, were carried out on the samples. These experiments provided data for evaluating the carbon skeleton structure, functional groups, and microcrystalline structure. Furthermore, information on the nitrogen and sulfur in coal was obtained through XPS experiments. This study provides a theoretical foundation for the evolution of microstructures before and after FCJs under the same geological conditions. Additionally, it helps in understanding the chemical structural characteristics of low-rank coal and provides references for its efficient application.

2. Materials and Methods

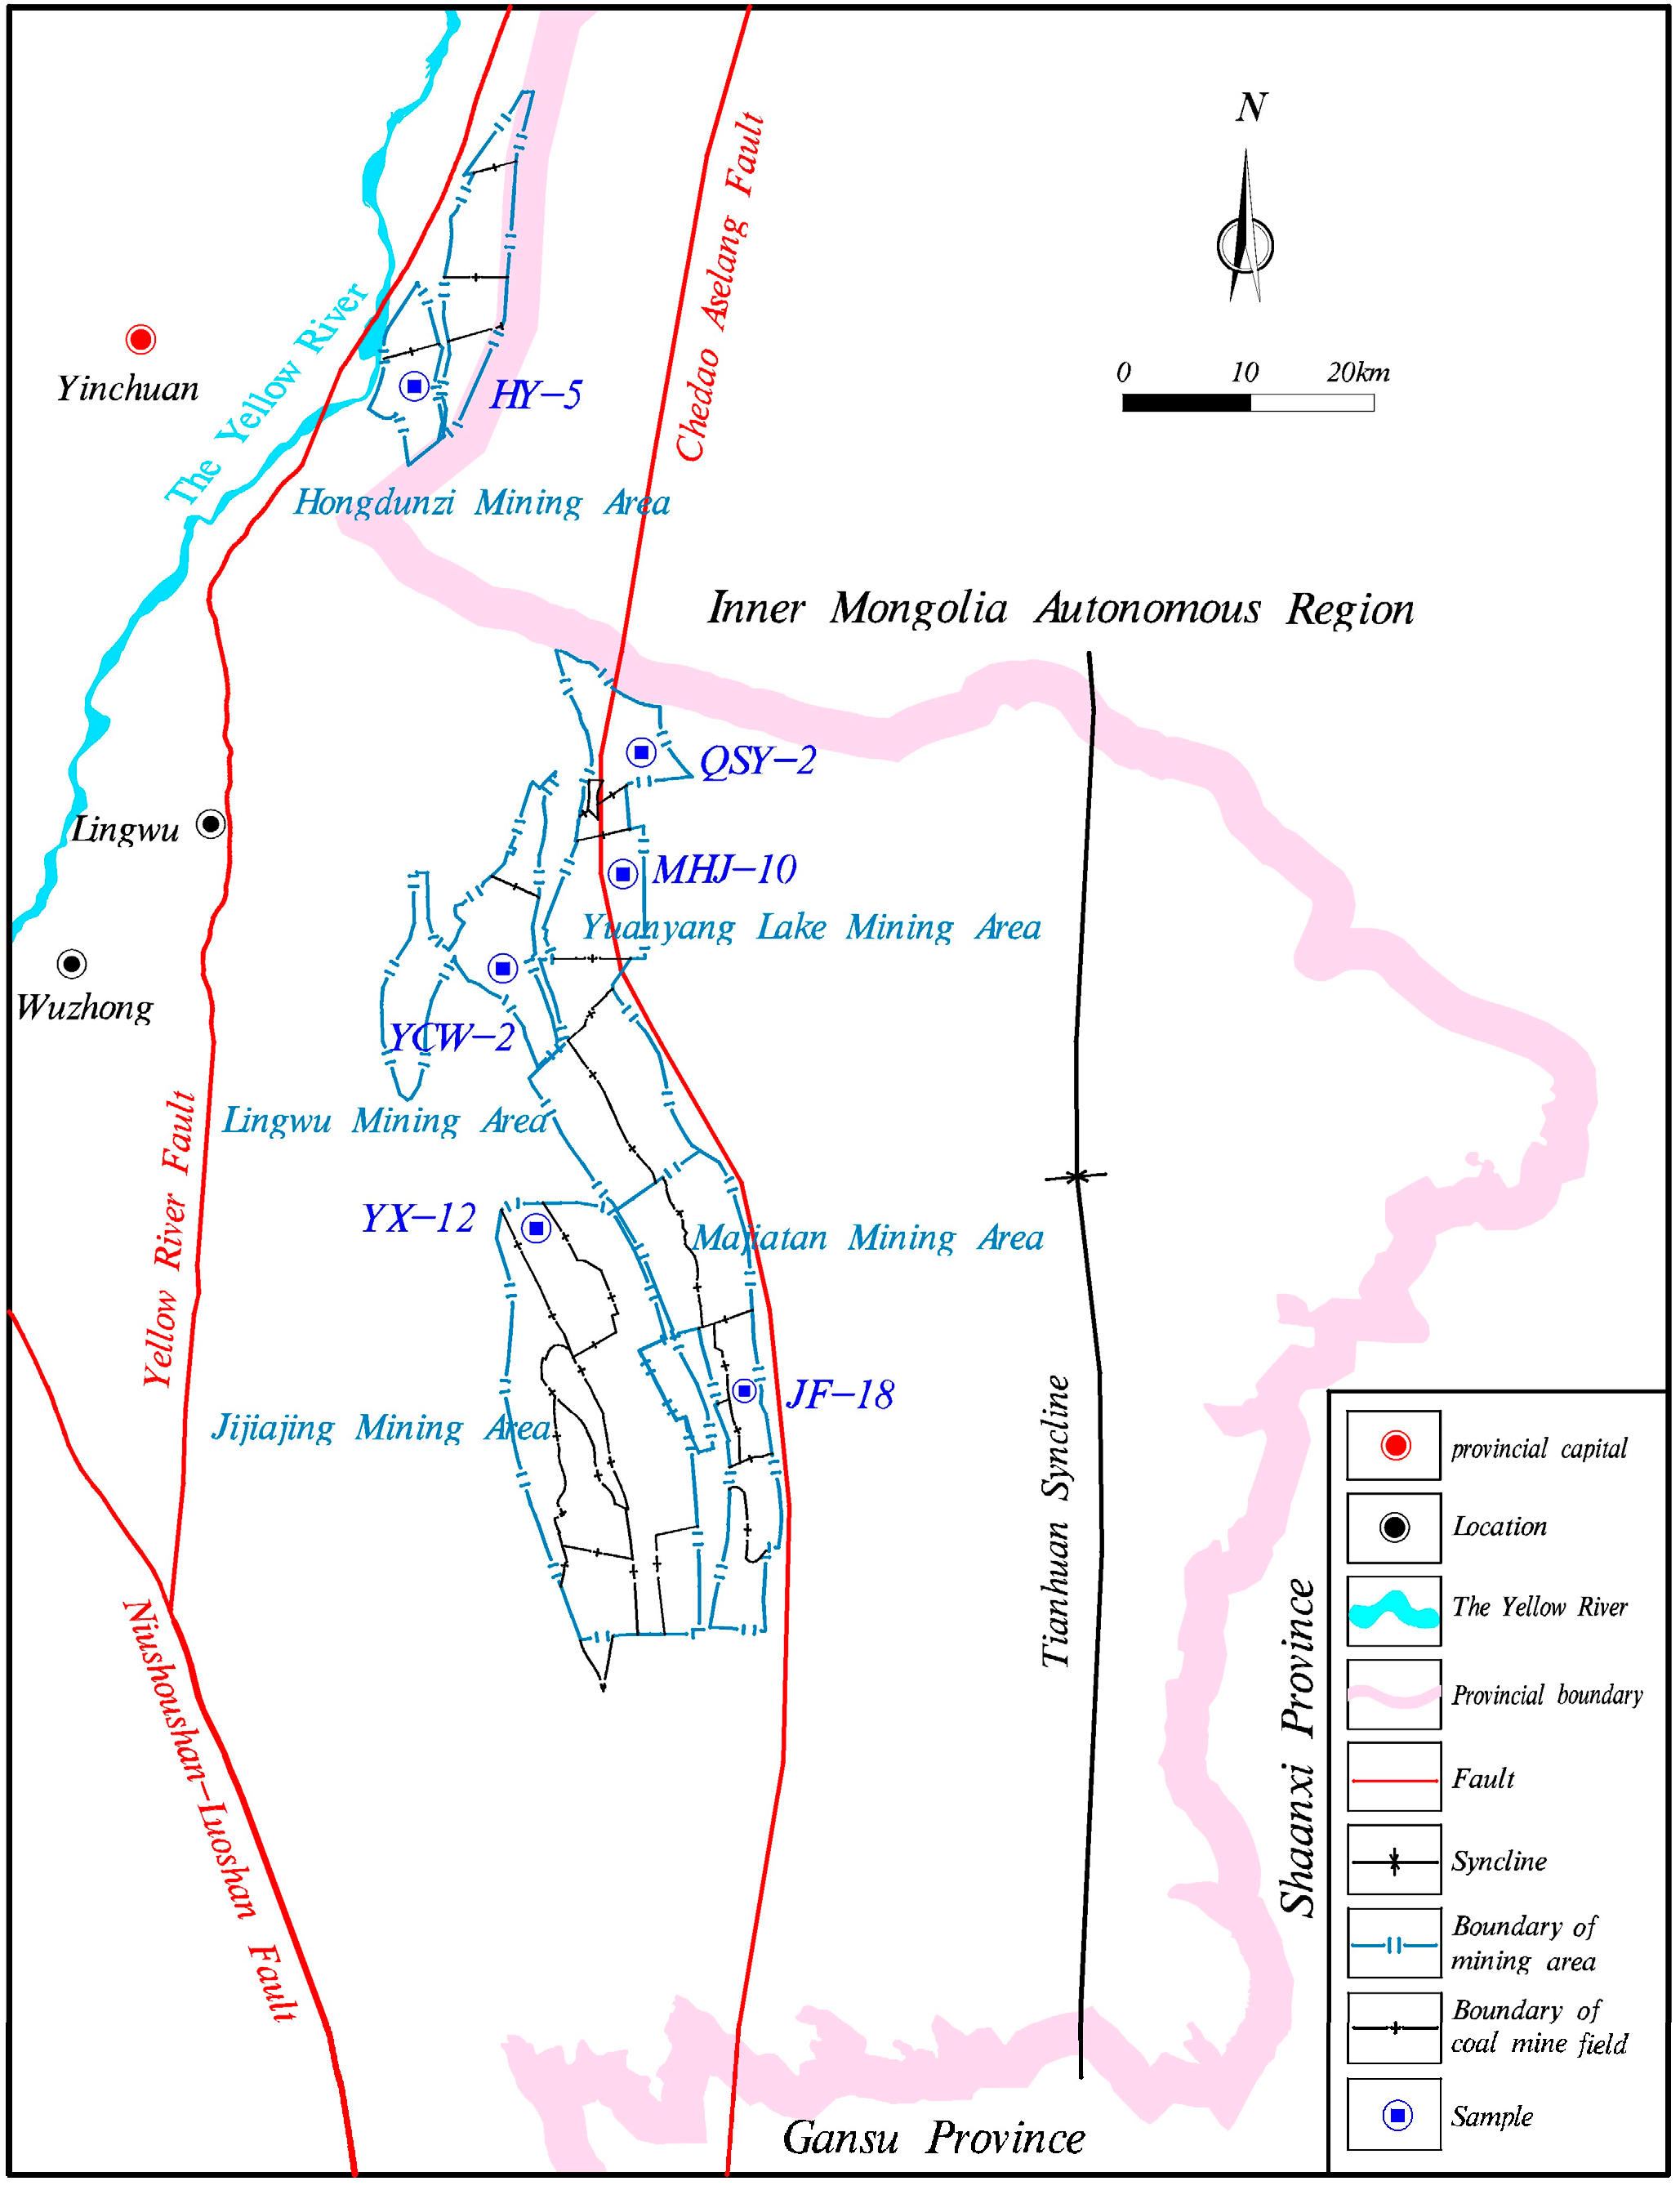
2.1. Coal Sampling and Preparation

Six samples were collected for this research from Ningdong Coalfield, Ningxia, China (Figure 1). These samples were taken from the No. 2 coal seam of the Qingshuiying Coal Mine (QSY-2), the No. 2 coal seam of the Yangchangwan Coal Mine (YCW-2), the No. 10 coal seam of the Meihuajing Coal Mine (MHJ-10), the No. 18 coal seam of the Jinfeng Coal Mine (JF-18), the No. 5 coal seam of the Hongyi Coal Mine (HY-5), and the No. 12 coal seam of the Yinxing Coal Mine (YX-12). Sample collection was carried out strictly according to the National Standards GB/T 19222-2003 “Sampling of coal petrology”, with block samples collected from fresh working faces and placed into sample bags [26]. The sample was crushed to a size of 0.425 mm to 1 mm and used for maximum vitrinite reflectance experiments and microscopic component analysis. The above experiments were conducted according to the National Standards GB/T 6948-2008 “Method of determining microscopically the reflectance of vitrinite in coal” and GB/T 8899-2013 “Determination of maceral group composition and minerals in coal” [27,28]. The samples were crushed to a size of less than 0.075 mm for 13C NMR, FTIR, Raman, and XPS experiments. The crushed sample was placed in a vacuum oven at 80 °C for 12 h to remove moisture from the coal [2,19]. Notably, this temperature does not affect the surface chemical properties of the sample [29,30].

2.2. 13C NMR Experiments

Six samples were analyzed on a high-resolution Bruker advance III 600 MHz spectrometer producted by Bruker Corporation in PA, USA. During the experiment, a 4 mm magic angle spinning (MAS) probe producted by Bruker Corporation in PA, USA was used to record the 13C NMR spectrum at a rotation rate of 10 kHz. The spectra based on magic angle conversion recordings show magic angle rotation sidebands at 60 ppm, 200 ppm, etc. Therefore, cross-polarization (CP) and total sideband suppression (TOSS) techniques were applied to eliminate the sideband effect. The CP and TOSS techniques were conducted with a contact duration of 2 ms and a recycling delay of 3 seconds [19].

2.3. FTIR Experiments

Six samples were analyzed on Nicolet is5 infrared spectrometers producted by Mettler-Toledo in PA, USA. The powder sample was preprocessed via the KBr pellet method. Approximately 0.5 g of the sample was placed into an experimental mold, and a pressure of 20 MPa was applied to the mold for 60 s under vacuum conditions to obtain a thin sample slice [31]. Subsequently, the experimental environment was set up such that the spectrum was scanned 32 times in the range of 4000–400 cm−1 with a resolution of 4 cm−1.

2.4. Raman Experiments

The Raman experiment with the six samples was conducted via a Senterra Confocal Raman microspectrometer producted by Mettler-Toledo in PA, USA, featuring a spectral range of 4500–45 cm−1. The excitation wavelength was 532 nanometers, the power was 20 mW, the scanning time was 2 s, the cumulative count was 10 times, and the resolution was 9–18 cm−1. The Raman spectrometer features a density filter to prevent the thermal decomposition of samples [2].

2.5. XPS Experiments

XPS experiments with the six samples were conducted on an ultrahigh vacuum system via an ESCALAB250 Xi surface analysis instrument producted by Eaton Chemical Equipment Laboratory in PA, USA. The experimental setup involves a monochromatic aluminum anode target with a source gun type and a beam spot size of 900 μm. The samples were scanned 30 times under standard conditions to analyze their surface elements and determine their distribution in detail. To account for the physical displacement of the nonconductive sample during testing, the binding energy position must be adjusted on the basis of the main C1s peak at 284.8 eV.

2.6. Spectrum Deconvolution

In spectroscopy experiments, detecting functional groups in coal can be challenging because of overlapping absorption peaks caused by different functional groups [32,33]. Earlier studies frequently employed peak fitting methods to analyze spectra [2,34]. This method enables the identification of various element types, chemical bond distributions, and the precise location, bandwidth, and relative intensity of necessary functional groups within the spectrum. This study utilized Peakfit 4.12 software to analyze the experimental spectra. The findings allow for the quantitative assessment of atomic functional groups and chemical bond information within the spectra.

3. Results and Discussion

3.1. Coal Conventional Characteristics

Table 1 shows the results of the maximum reflectance of vitrinite (Ro) experiments and microscopic component analysis for the six samples. The Ro values of the six samples range between 0.44% and 0.74%. Three coal ranks can be classified on the basis of the values of Ro [35]. QSY-2 is lignite. MHJ-10 and YCW-2 are subbituminous. YX-12, JF-18, and HY-5 are high-volatile bituminous coals (HVBs). Notably, the FCJ occurred within this range [12,21,35].
Microscopic component analysis revealed that the selected samples were primarily composed of organic components, with contents exceeding 90%. Notably, the QSY-2, MHJ-10, and HY-5 samples have a high proportion of vitrinite, followed by inertinite, with a lower amount of exinite. In samples YCW-2, YX-12, and JF-18, inertinite is the dominant component, followed by vitrinite, whereas the content of exinite remains the lowest. The contents of vitrinite, inertinite, and exinite have a significant impact on its efficiency/effectiveness. Coals with a high vitrinite content usually have higher volatile matter and porosity and higher combustion performance. High inertinite content coal has lower volatile matter, and its combustion performance is relatively poor compared with coal with a high vitrinite content. The content of exinite in coal is usually small, and its combustion efficiency is generally considered to be between vitrinite and inertinite. Therefore, it can be preliminarily judged that the combustion performance of QSY-2, MHI-10, and HY-5 is better than the other samples. The content of inorganic components in the six samples was relatively low, with clay minerals being predominant. Additionally, the selected samples contained sulfides primarily in the form of pyrite, carbonates mainly as calcite, and quartz as the primary silicate mineral.

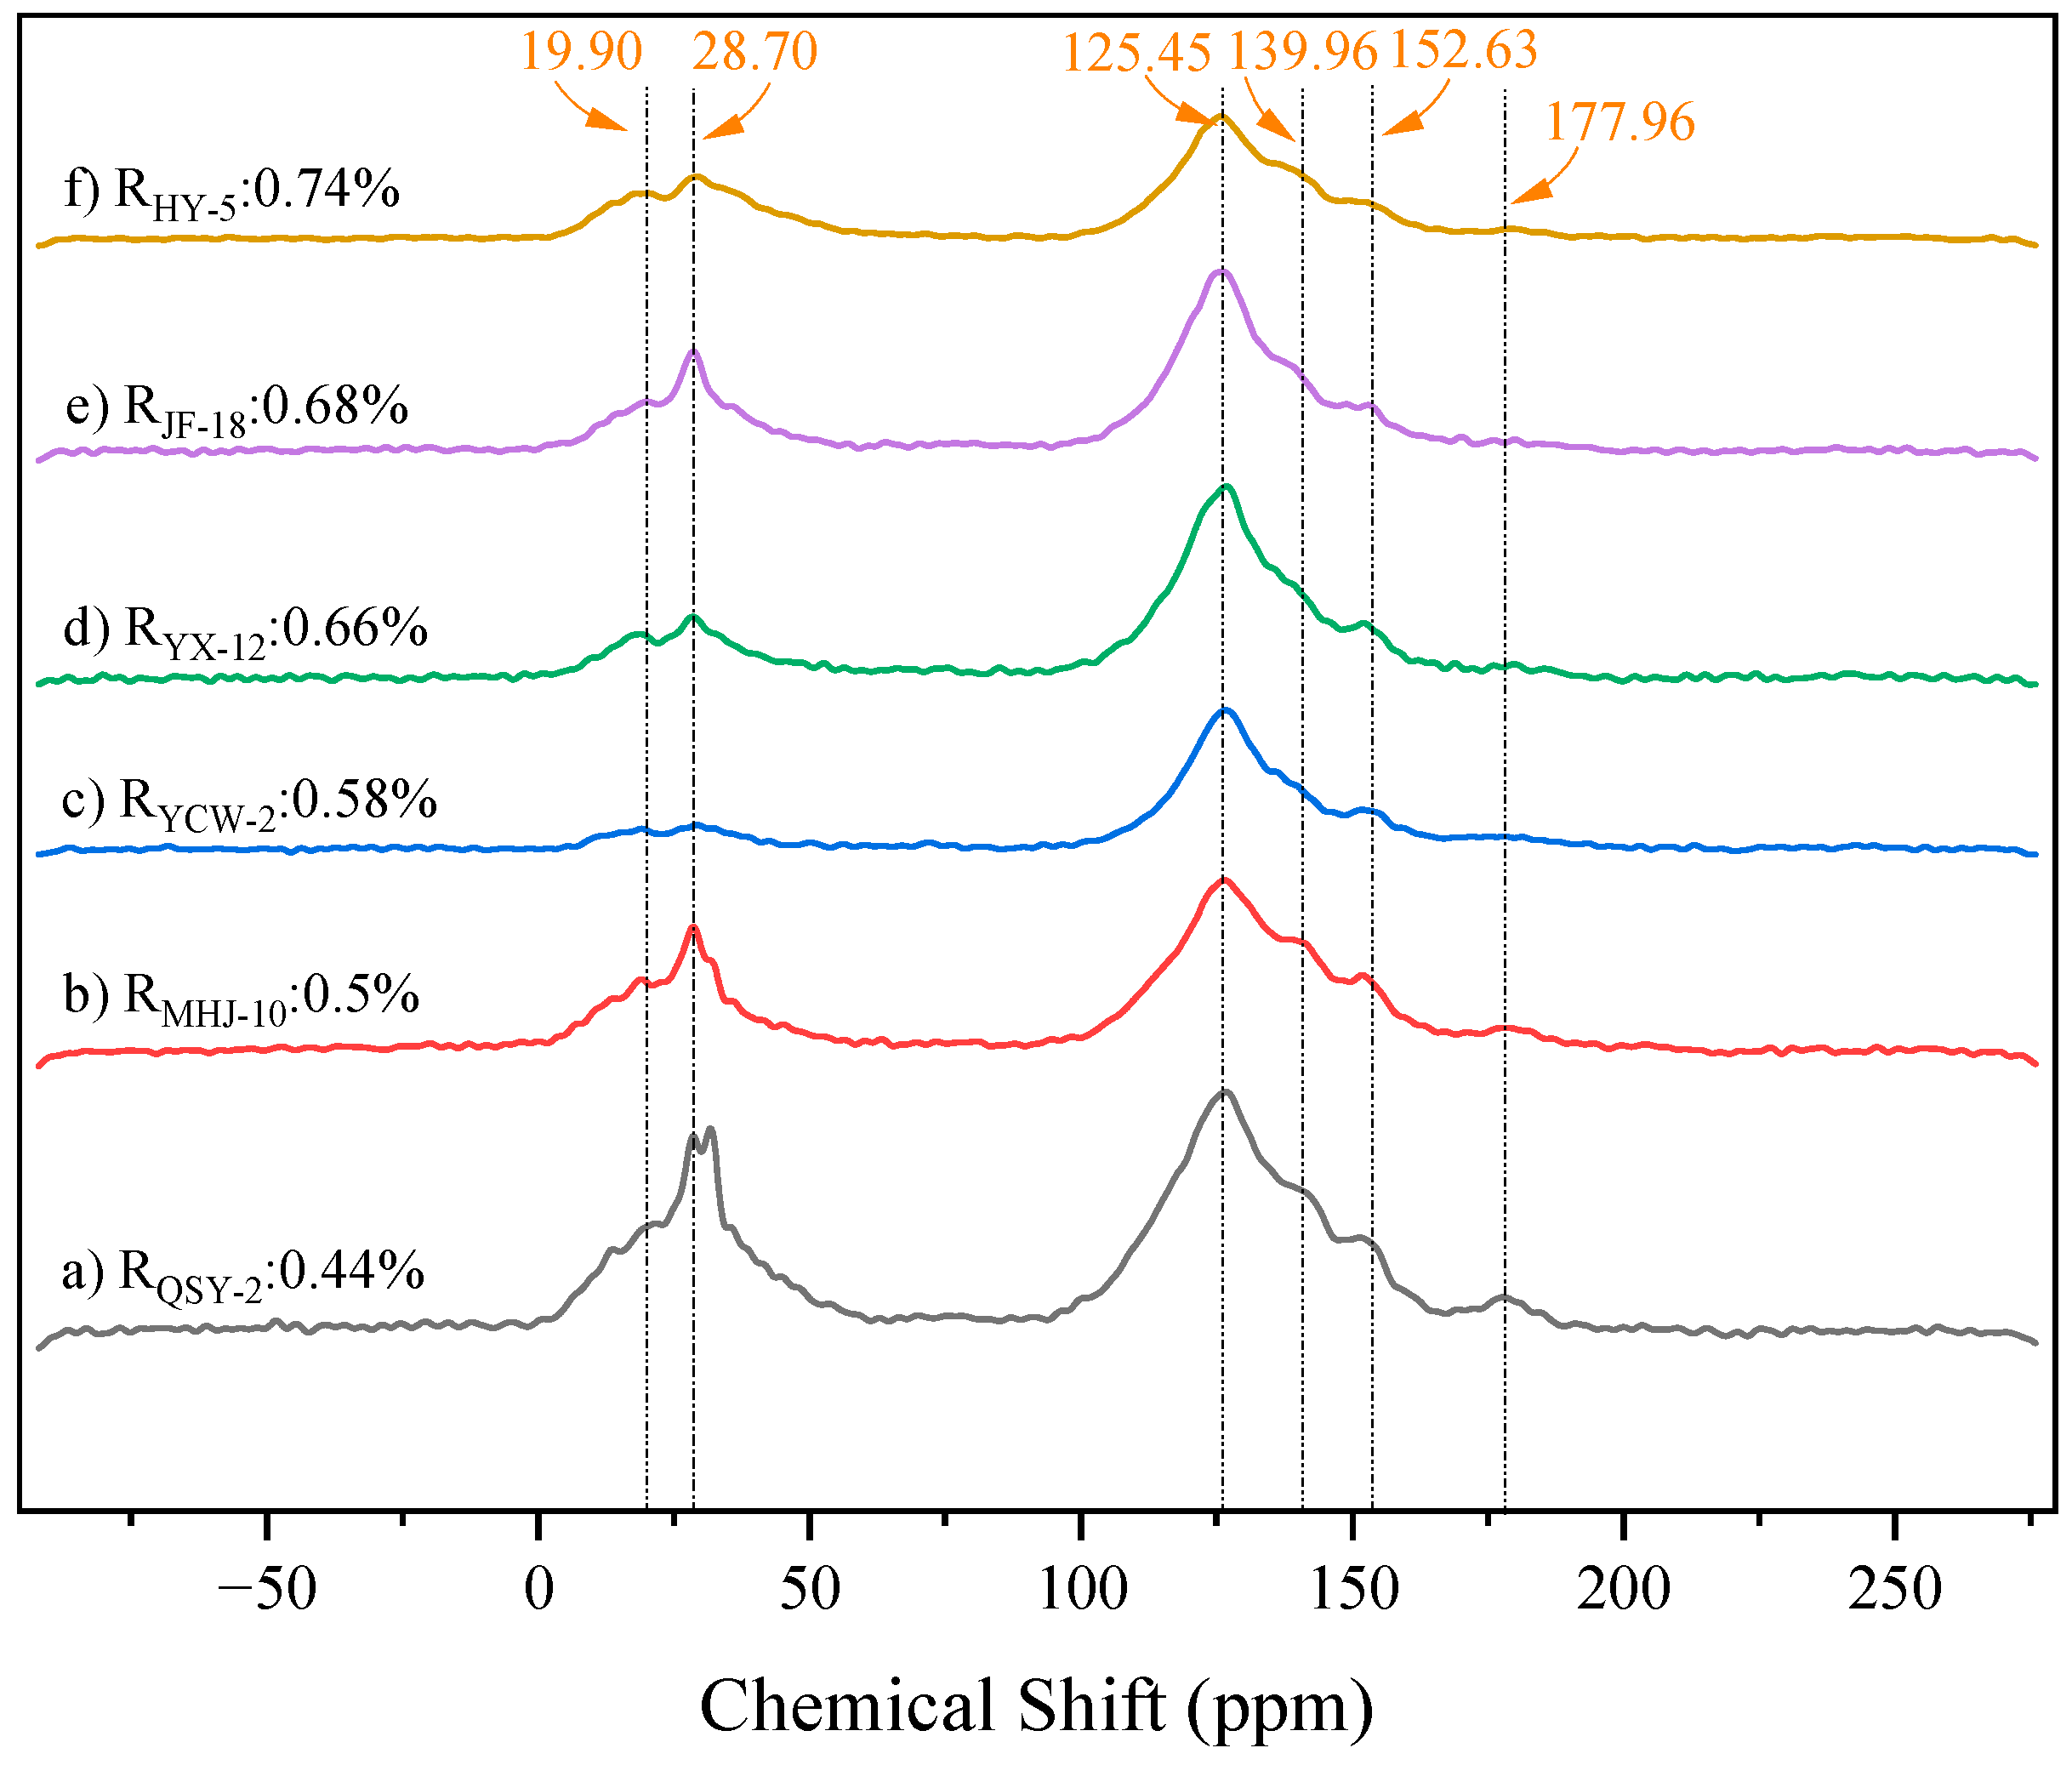
3.2. 13C NMR Characteristics

3.2.1. Forms of Carbon in Samples

Figure 2 displays the combined 13C NMR spectra of the six samples. The samples are arranged in the diagram according to their degree of metamorphism, with positions moving from bottom to top indicating an increase in metamorphic grade. Prominent peaks are distinctly located in the 0–50 ppm and 100–165 ppm regions of the spectrum. Notably, the 0–50 ppm range corresponds to the aliphatic carbon region, whereas the 100–165 ppm range corresponds to the aromatic carbon region [19]. Therefore, the C skeleton structure of the selected sample was determined to be primarily composed of aromatic and aliphatic carbon. No significant carboxyl carbon peak was found at approximately 200 ppm in the spectrum, indicating a scarcity of carboxyl functional groups.
In the aliphatic region, the area of the aliphatic peaks clearly decreases with increasing metamorphism, indicating that coal with a relatively high degree of metamorphism contains less aliphatic carbon. Notably, YCW-2 has significantly fewer aliphatic peak areas than the other five samples do, which may be related to FCJ [12]. A similar phenomenon was verified in the FTIR experiments (Section 3.3.1). Moreover, YX-12 and JF-18 were also affected by FCJ, resulting in relatively lower contents of aliphatic compounds than HY-5. Previous studies have shown that it corresponds to the FCJ when the degree of coalification is approximately 0.6%. At this point, aliphatic functional groups and side chains begin to detach from the aromatic rings, forming volatile substances that are dominated by CH4 [21,35].
All the samples exhibit prominent peaks at approximately 19.90 ppm and 28.70 ppm, which correspond to aliphatic methyl and methylene groups, respectively [34,36]. Moreover, the intensity of the methylene peak is much greater than that of the methyl peak. It can be inferred that low-rank coal contains significantly more methylene groups than methyl groups, with aliphatic side chains predominantly in the form of cycloalkanes and long-chain alkanes, characterized by longer side chains and fewer branches. As the degree of metamorphism increased, the intensity of the peak representing methylene gradually decreased, whereas the intensity of the peak representing methyl gradually increased. This finding indicates that methylene is removed from the aromatic ring at a faster rate than methyl [37]. This phenomenon can be attributed to the transformation of the hydrogenated methylene structure to the aromatic ring [38]. The aromatic-like structures produced by pyrolysis and their associated aliphatic side-chain carbons aggregate to form polycyclic aromatic systems during metamorphism [39].
In the aromatic region, with increasing metamorphic grade, the peak near 152.63 ppm gradually decreases in intensity. This peak is attributed to alkyl-substituted aryl carbons, indicating that the degree of alkylation of aromatics increases with increasing metamorphic grades [33,36]. Moreover, as metamorphism increases, the peak width near the chemical shift of 125.45 ppm gradually increases, indicating an increase in the proportion of protonated aromatic carbon within the aromatic structure, thus enhancing the aromaticity of the coal. The peak near 177.19 ppm is attributed to carboxyl carbon. As the degree of metamorphism increases, the height of this peak gradually decreases, indicating that the coal metamorphism process involves deoxygenation and the enrichment of carbon [33].

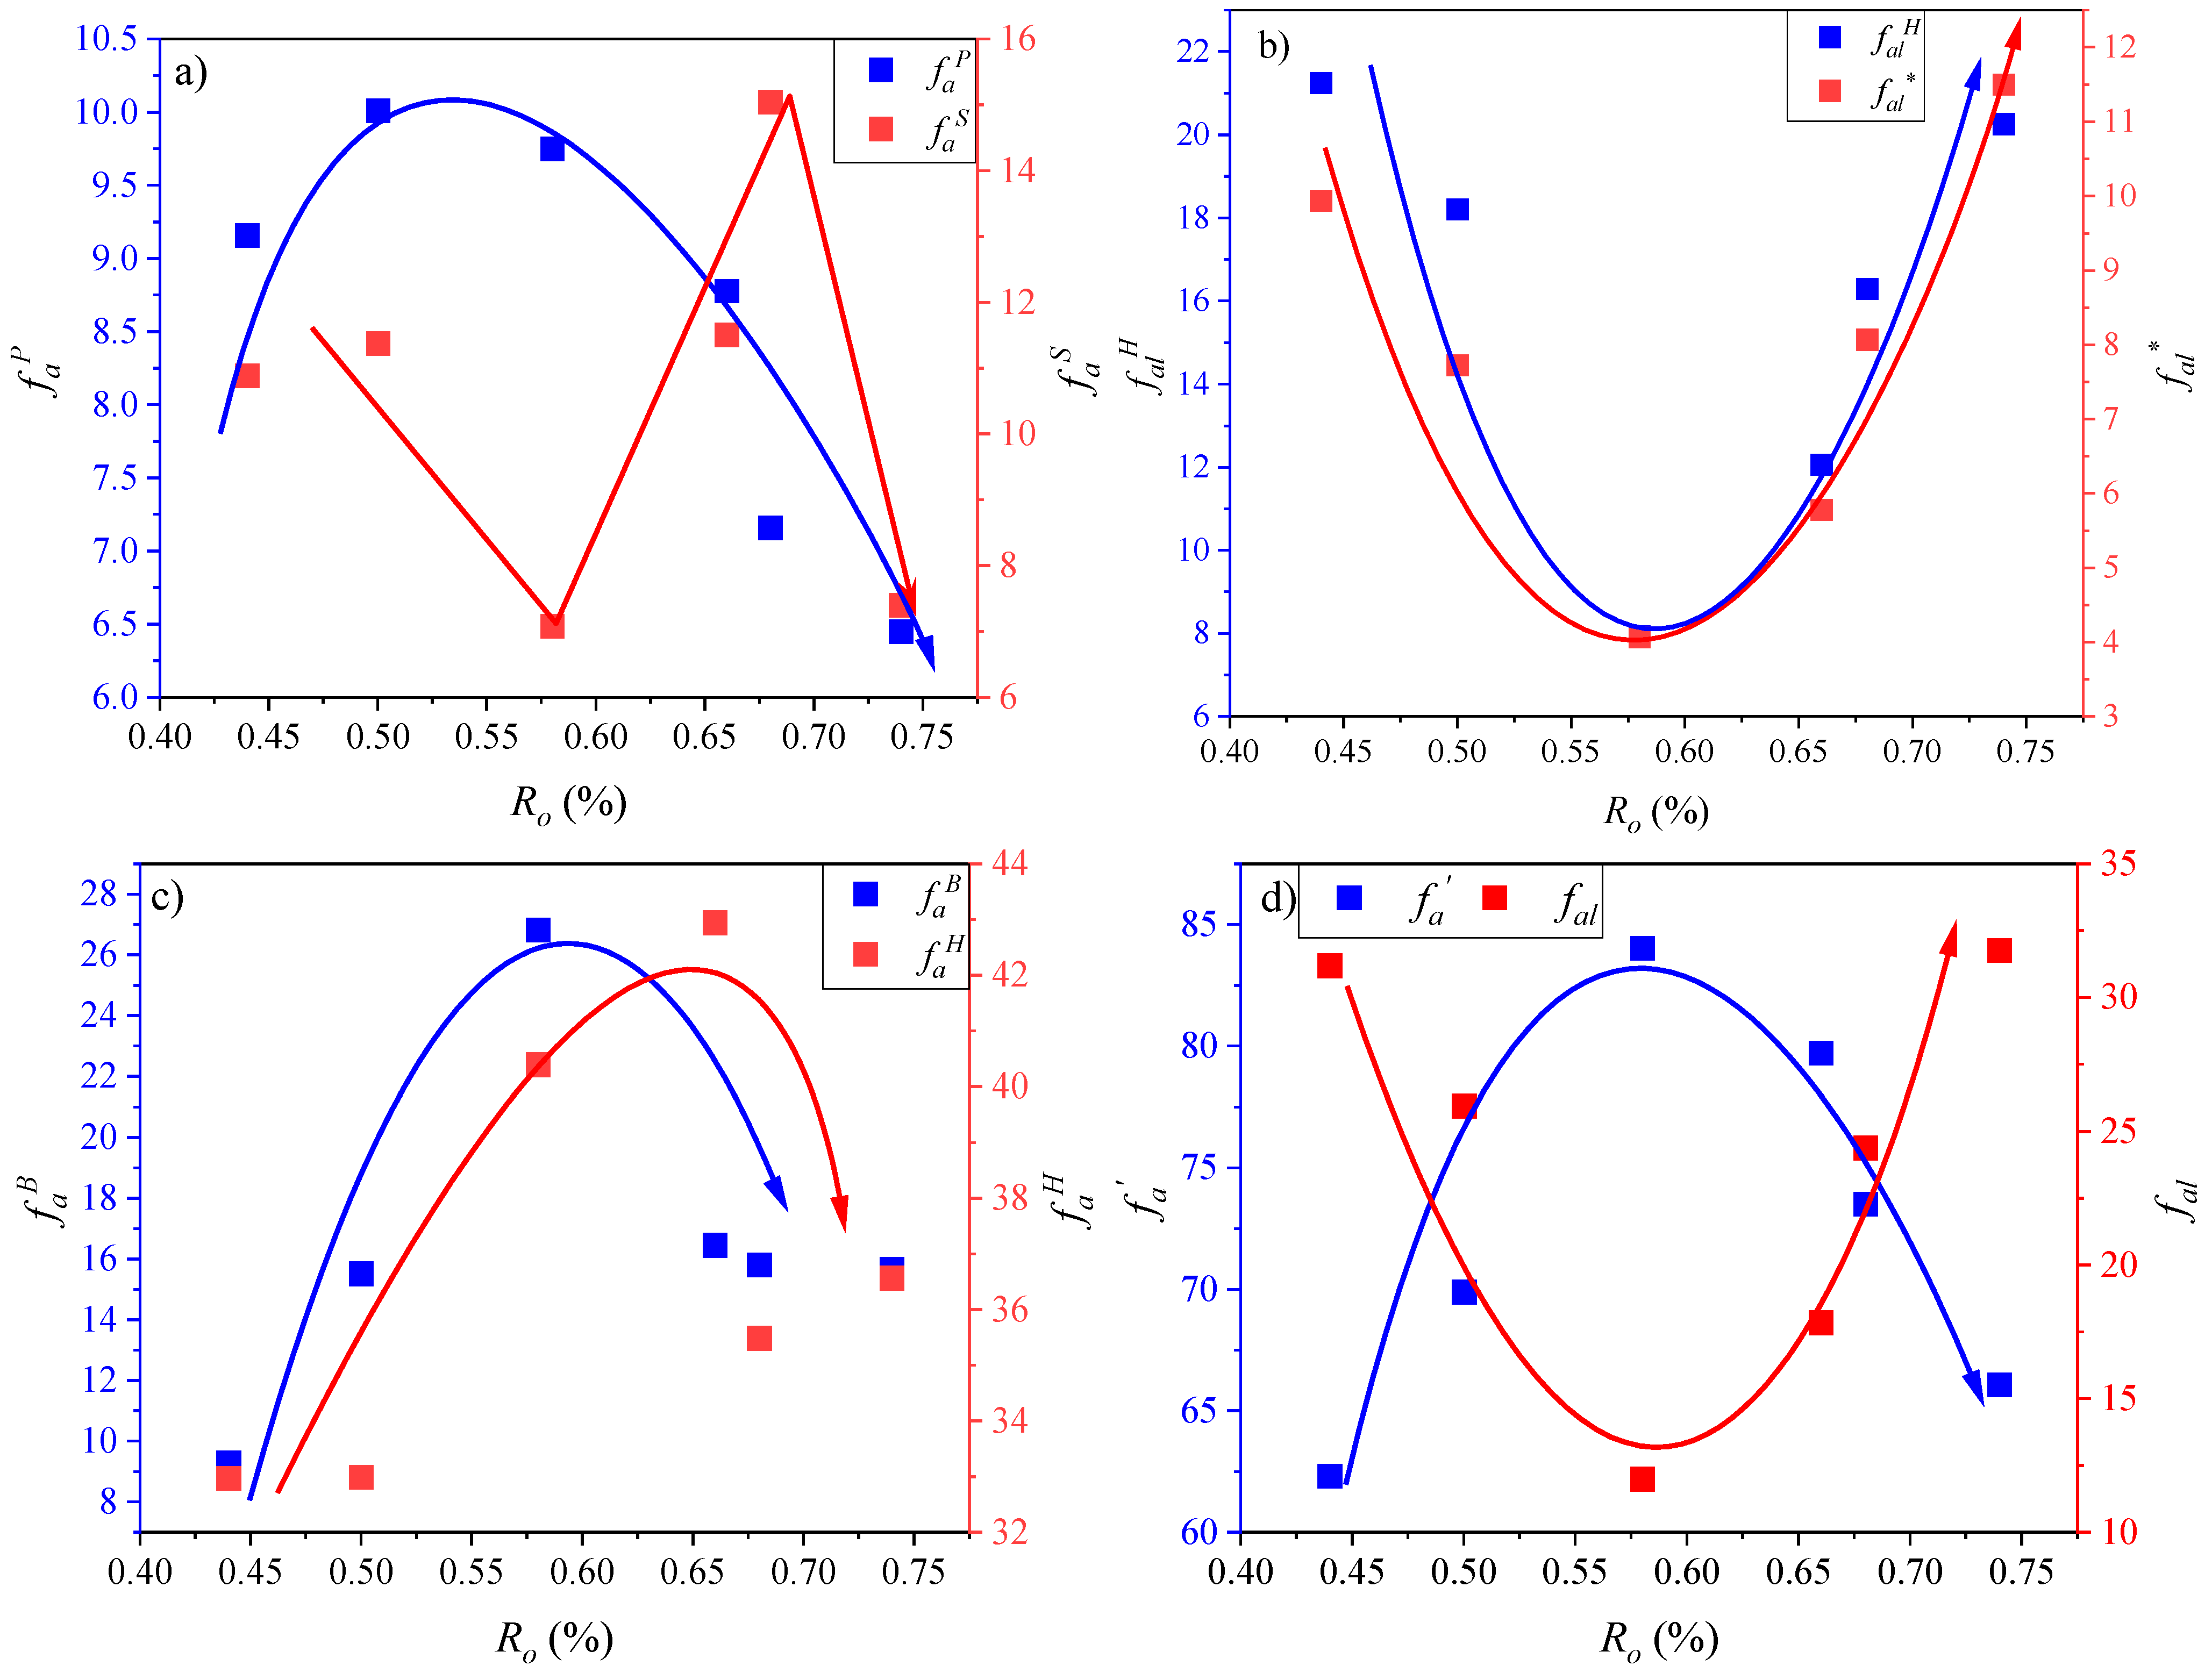
3.2.2. Structural Parameter Calculation

PeakFit 4.12 software was used to deconvolute the 13C NMR spectra to further study the carbon skeleton structure of coal and obtain the relative contents of different carbon structures. The peak fitting results are shown in Figure 3. On the basis of the research by Solum et al., 12 structural parameters of carbon atoms were calculated [20,40]. Additionally, the ratio of aromatic bridge carbons to peripheral carbons (XBP) in the carbon framework was determined [32]. Table 2 provides a statistical summary of the aforementioned data.
X B P = f a B / ( f a H + f a S + f a P )
The contents of carboxyl and carbonyl carbon are relatively low in the six samples, with proportions generally less than 5%, indicating that coal contains few carboxyl and carbonyl carbons, which is consistent with the above analysis. This study has plotted scatter diagrams of the carbon skeletal parameters against Ro to intuitively explore the changes in the macromolecular structure of coal during metamorphism (Figure 4).
The faP initially increases but then decreases as coal metamorphism progresses (Figure 4a). After the FCJ, the rate at which faP decreases accelerates. This may be due primarily to oxygen substituents in coal being removed from the aromatic rings through demethylation and dihydroxylation reactions and being replaced by carbon or hydrogen substituents [33]. The faS decreases gradually through the aromatization of the alkyl side chains as metamorphism progresses (Figure 4a) [41]. However, YCW-2 achieved the minimum value of faS, which may have been influenced by the FCJ. As metamorphism increases, the values of falH and fal* show the same V-shaped trend, with the lowest point occurring at the FCJ (Figure 4b). This finding indicates that the content of methyl and methylene groups in coal reaches its minimum at the FCJ point. The aliphatic functional groups and side chains begin to detach from the aromatic rings, forming volatile substances that are primarily dominated by CH4. This is consistent with the above analysis.
Figure 4c illustrates the relationship between faH and faB with respect to Ro. The samples YCW-2 and YX-12, which have a degree of metamorphism near the FCJ, contain significantly greater amounts of faH than the other samples do. Moreover, the contents of faB and XBP in the YCW-2 sample are significantly greater than those in the other samples. This finding indicates that during the FCJ, the aliphatic side chains connecting the aromatic lamellae of coal break apart. Then, the small aromatic clusters condense together to form a less uniformly oriented structure, with an increase in bridge bonds between the aromatic lamellae, thereby enhancing the aromaticity of the coal. To further substantiate the aforementioned results, the relationships among fa, fal, and Ro are shown in Figure 4d. The fa content of YCW-2 was significantly greater than that of the other samples, whereas its fal content was markedly lower than that of the other samples. This finding indicates that during the FCJ, the removal of aliphatic structures and the aggregation of aromatic sheets significantly enhanced the aromaticity of the coal molecular structure. This further verifies the aforementioned findings.

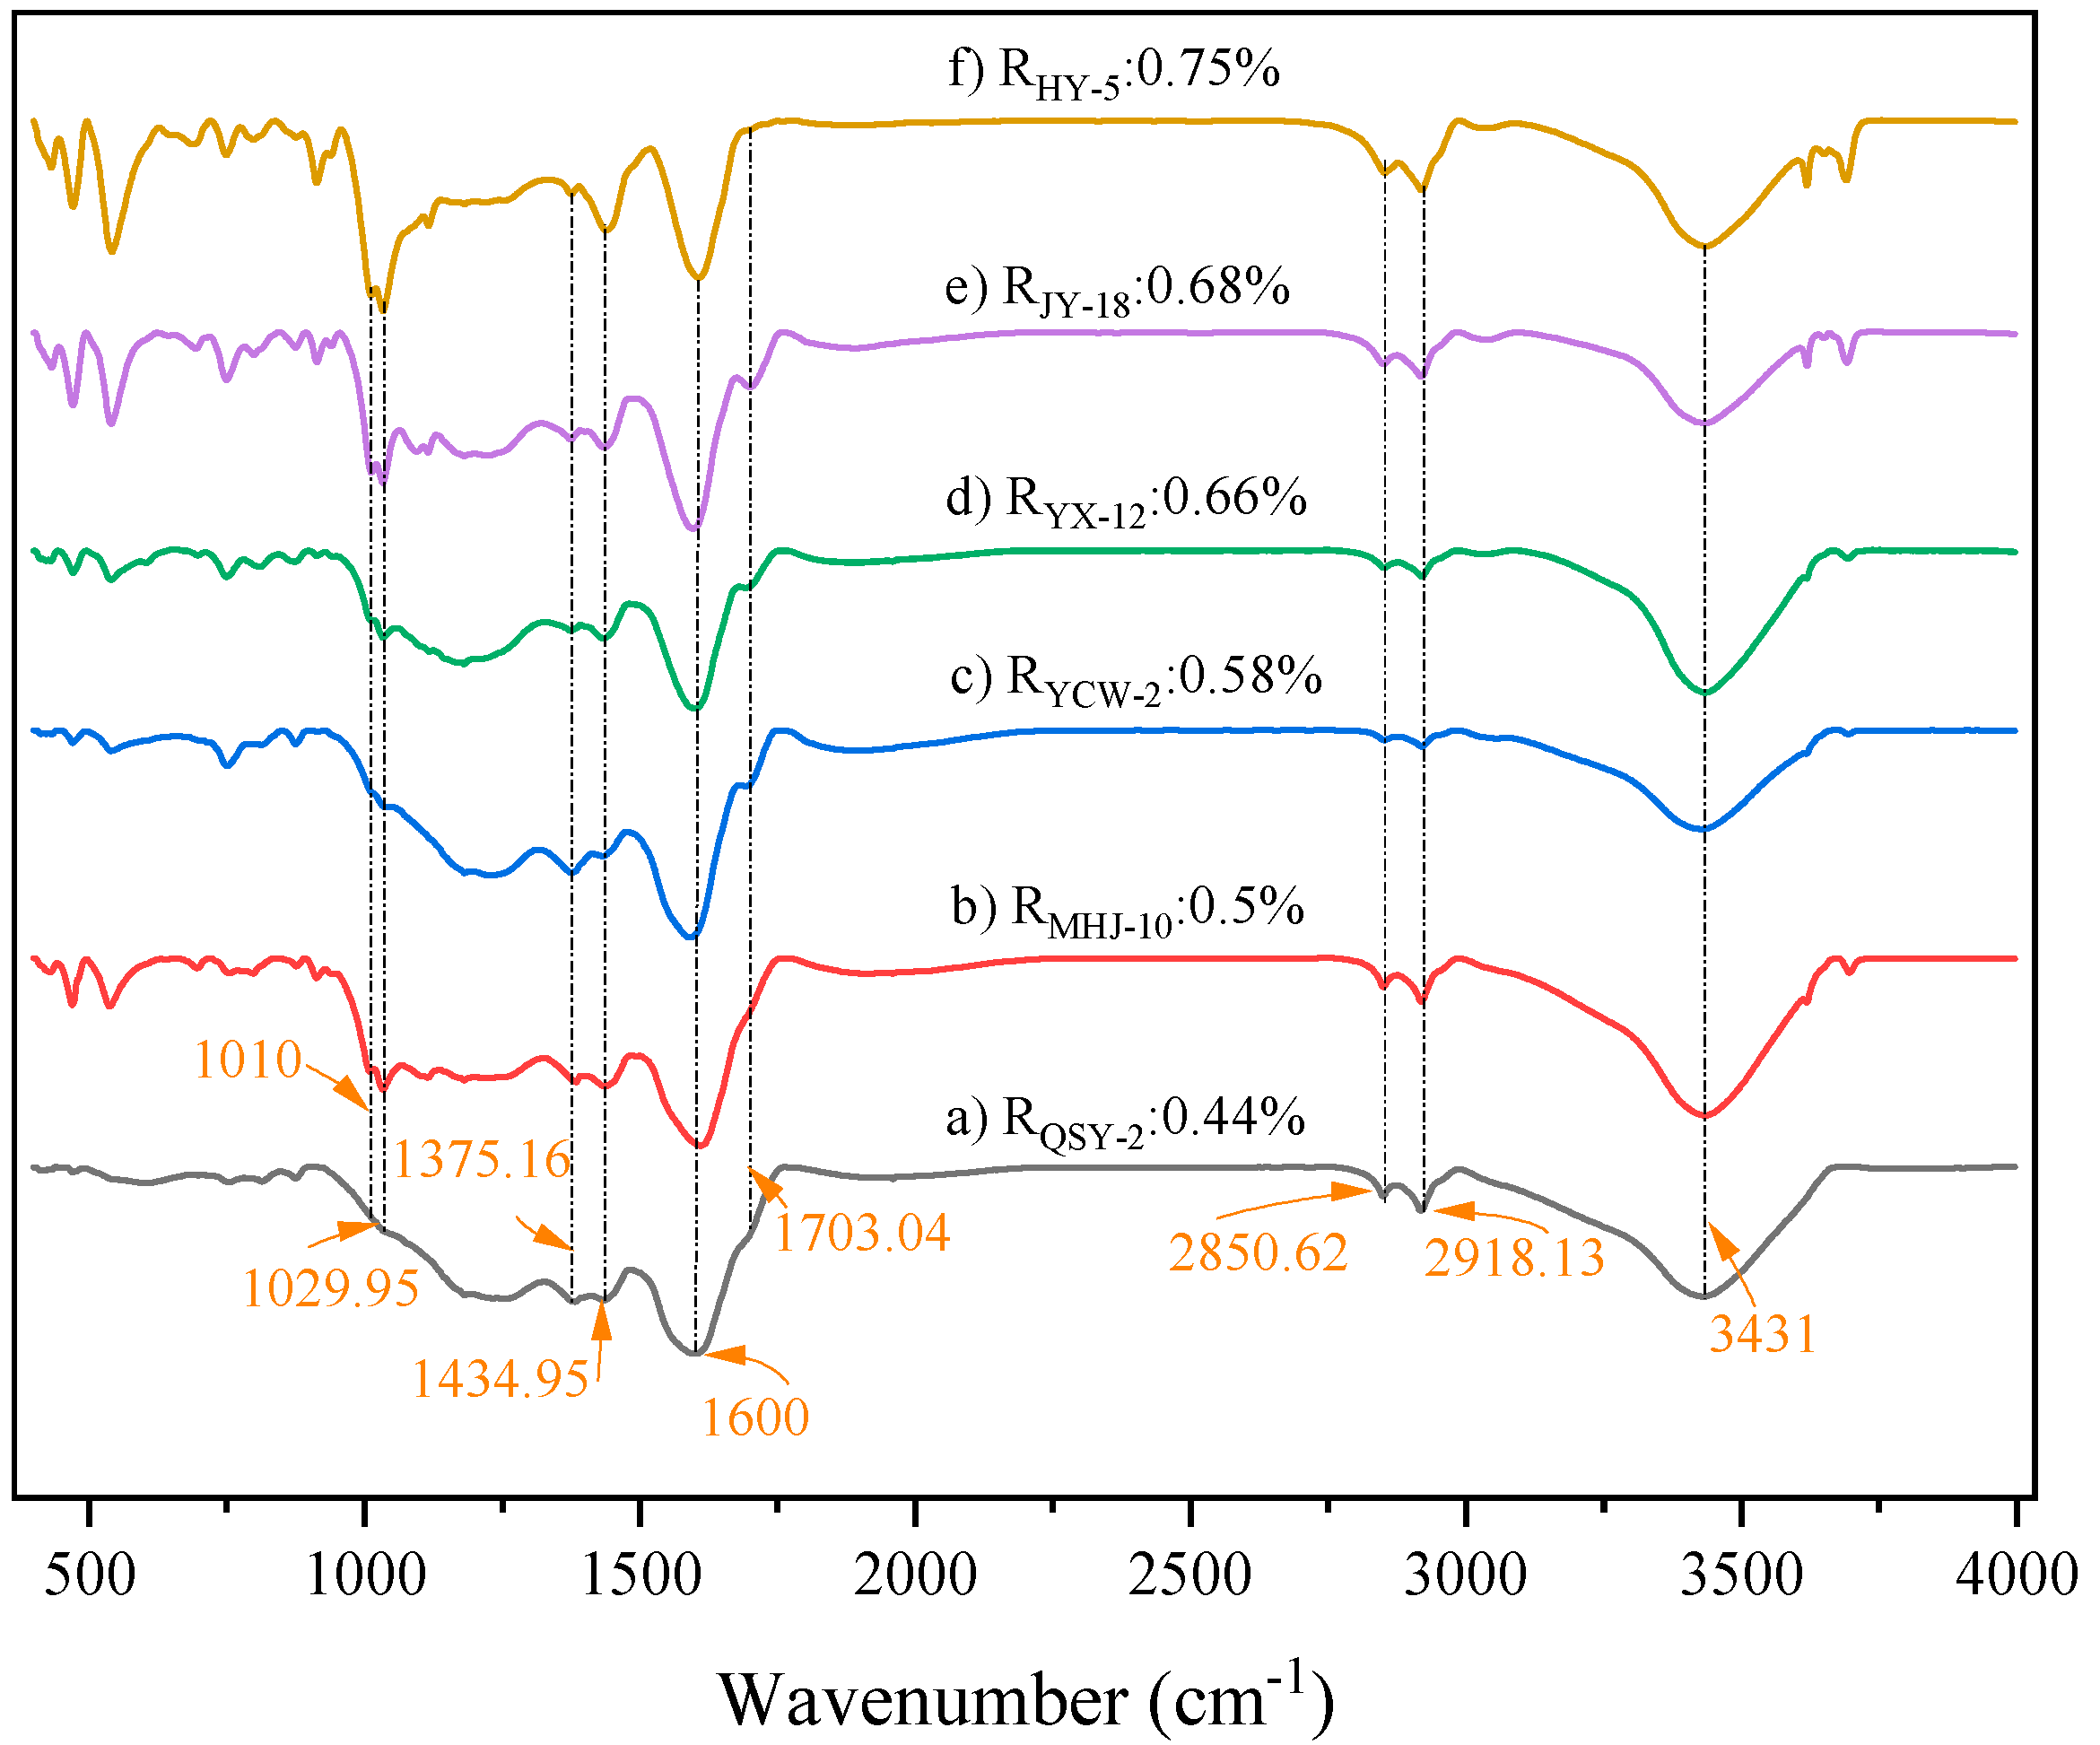
3.3. FTIR Characteristics

Figure 5 shows the FTIR spectra of the six samples after background subtraction. The six curves exhibit similar absorption peak characteristics at the same wavenumber, indicating that the selected samples have structurally similar but different quantities of surface structures and functional groups [2,19]. The FTIR spectrum of coal is typically divided into four regions: the hydroxyl functional group absorption region (3700–3120 cm−1), the aliphatic structure absorption region (3000–2800 cm−1), the oxygen-containing functional group region (1800–1000 cm−1), and the aromatic structure region (900–700 cm−1, out of plane bend) [42]. In addition, the aromatic C-H (sp2) vibration frequency appears in the range of 3000–3120 cm−1.
In the region of the hydroxyl functional group structure, all selected samples exhibit a distinct peak near 3431 cm−1, which corresponds to hydrogen bonds formed by self-associated hydroxyl groups [43]. Notably, previous researchers in this area have used peak fitting technology to identify five additional types of hydroxyl groups [44]. However, since this region contains only one distinct hydroxyl peak, the hydroxyl groups in the selected samples predominantly exist in self-associated forms, with other types of hydroxyl groups being negligible. Therefore, further peak fitting for this region is unnecessary for this study. The intensity of the hydroxyl peak in the YCW-2 sample is significantly lower than that in the other samples, indicating that its hydroxyl concentration has been affected by the FCJ, leading to the removal of many hydroxyl groups. Previous studies suggest that during the FCJ, the reduction in moisture and the cellulose content in coal may be the cause of the decrease in the hydroxyl content [12].
Two distinct absorption peaks exist in the aliphatic structure region. These are the peaks for the asymmetric methylene (-CH2-) stretching vibration near wavenumber 2918.13 cm−1 and the symmetric methylene (-CH2-) stretching vibration near wavenumber 2850.62 cm−1 [45]. The area of the aliphatic side chain absorption region in the YCW-2 sample was smaller than that in the other samples, indicating that many aliphatic functional groups were removed during the FCJ. This is consistent with the results of the 13C NMR experiments.
In the oxygen-containing functional group region, aromatic C=C stretching vibrations are observed at approximately 1600 cm−1. The asymmetric deformation vibration of the alkyl group CH2CH3 appears near 1434.95 cm−1. Furthermore, the stretching vibration peak of the aromatic C=O functional group appears near 1703.04 cm−1, providing basic information about the carbonyl group [36,43]. Samples JY-18 and HY-5 exhibit two distinct peaks near wavenumbers of 1010 cm−1 and 1029.95 cm−1, which may be attributed to the stretching vibrations of ash and alkyl ethers [43,44]. The aromatic region (900–700 cm−1) provides information about the carbon skeleton structure in coal. It has already been characterized on the basis of 13C NMR experiments. Therefore, this area will not be further analyzed.

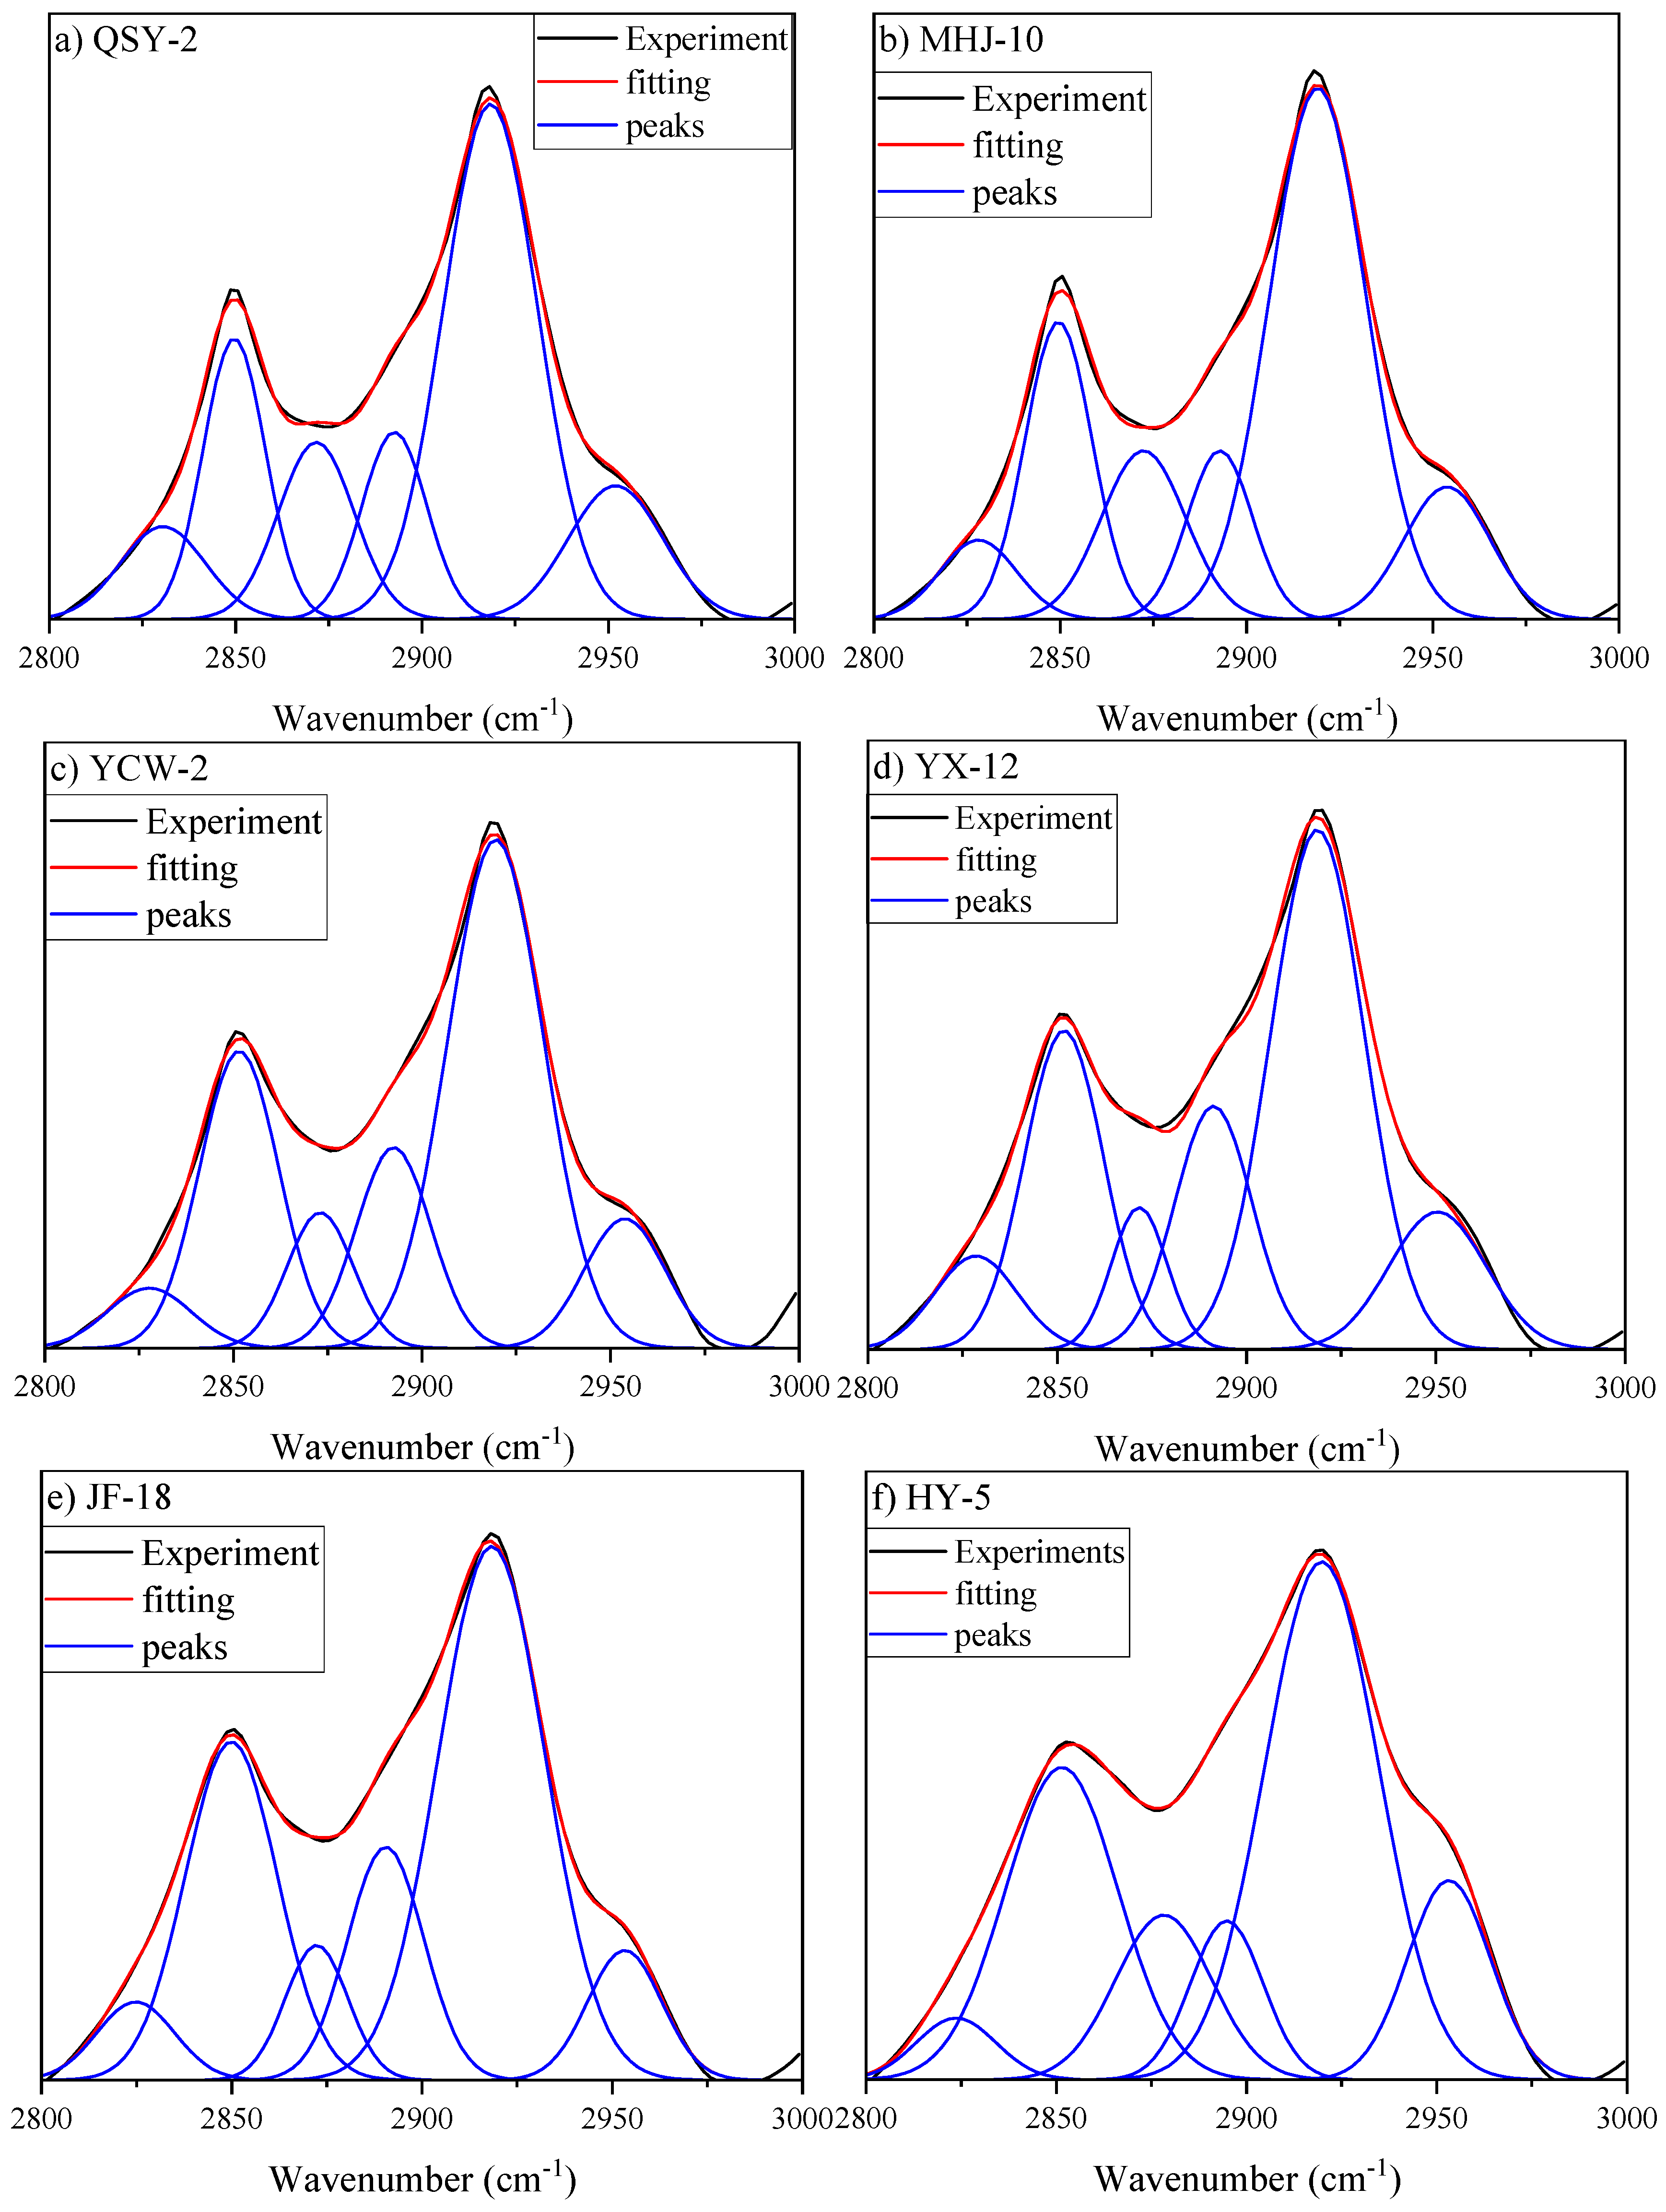
3.3.1. Aliphatic Structure Absorption Region

This study used peak fitting technology to deconvolute the absorption region of aliphatic structures. Figure 6 shows the results of peak deconvolution, revealing that each sample can be separated into approximately six subpeaks. Table 3 lists the assignments and proportions of each subpeak. Section 3.2 of this study demonstrates that during the FCJ, the content of aliphatic components decreases, whereas that of aromatic components increases. The FTIR parameter “I” reflects the ratio of the area of the out-of-plane deformation vibration of aromatic C-H to the stretching vibration of aliphatic C-H [2,46]. It can characterize the relative abundance of aromatic and aliphatic structures in coal.
I = A 900 700 / A 3000 2800
where A900–700 indicates the absorption peak area of aromatic C-H, with a wavenumber range of 900 cm−1 to 700 cm−1; A3000–2800 indicates the aliphatic area, with a wavenumber range of 3000 cm−1 to 2800 cm−1.
Figure 7a shows the relationship between the peak areas of the aliphatic compounds (A3000–2800) and Ro. In the range of Ro from 0.44% to 0.75%, the area of the aliphatic peaks shows a V-shaped trend, with the inflection point located at sample YCW-2, indicating the minimum aliphatic content at this point. Notably, this V-shaped trend between the aliphatic structure and Ro was also observed in Section 3.2.2, demonstrating the significant impact of the FCJ on the molecular structure of coal. Figure 7b shows the correlation between I and Ro. It can be observed that I exhibits a clear inverted V-shaped correlation with Ro, reaching its maximum value in sample YCW-2. This finding indicates that in YCW-2, the abundance of aromatic compounds reaches its maximum, whereas the abundance of aliphatic compounds reaches its minimum. In other words, after the FCJ, a large amount of the aliphatic structure is lost, while the aromatic structure may form dense aromatic rings due to polymerization. The higher XBP value in YCW-2 (Table 2) fully supports this result.
The relative contents of the symmetric and asymmetric methylene stretching vibrations (Sym. R2CH2, Asym. R2CH2) within the chosen samples exhibited minimal fluctuations in aliphatic compounds, consistently maintaining levels of approximately 25% and 43%, respectively. This consistency suggests a notable degree of stability in the structure and composition of these compounds. The relative content of symmetric and asymmetric methyl groups slightly decreases during the FCJ. This finding indicates that the content of methyl groups is significantly affected compared with that of methylene groups during the FCJ. However, this result differs slightly from the analysis in Section 3.2.1. Notably, methylene exhibits a relatively stable change trend as coal metamorphism increases, which may be due to its relatively simple structural form. Furthermore, within the range of Ro from 0.44% to 0.75%, the relative content of methylene accounts for approximately 65%, which is significantly greater than that of the methyl and methylene groups. This finding indicates that in the selected samples, the aliphatic side chains predominantly take the form of cycloalkanes and long-chain alkanes, with longer side chains and fewer branches. This is consistent with the analysis in Section 3.2.

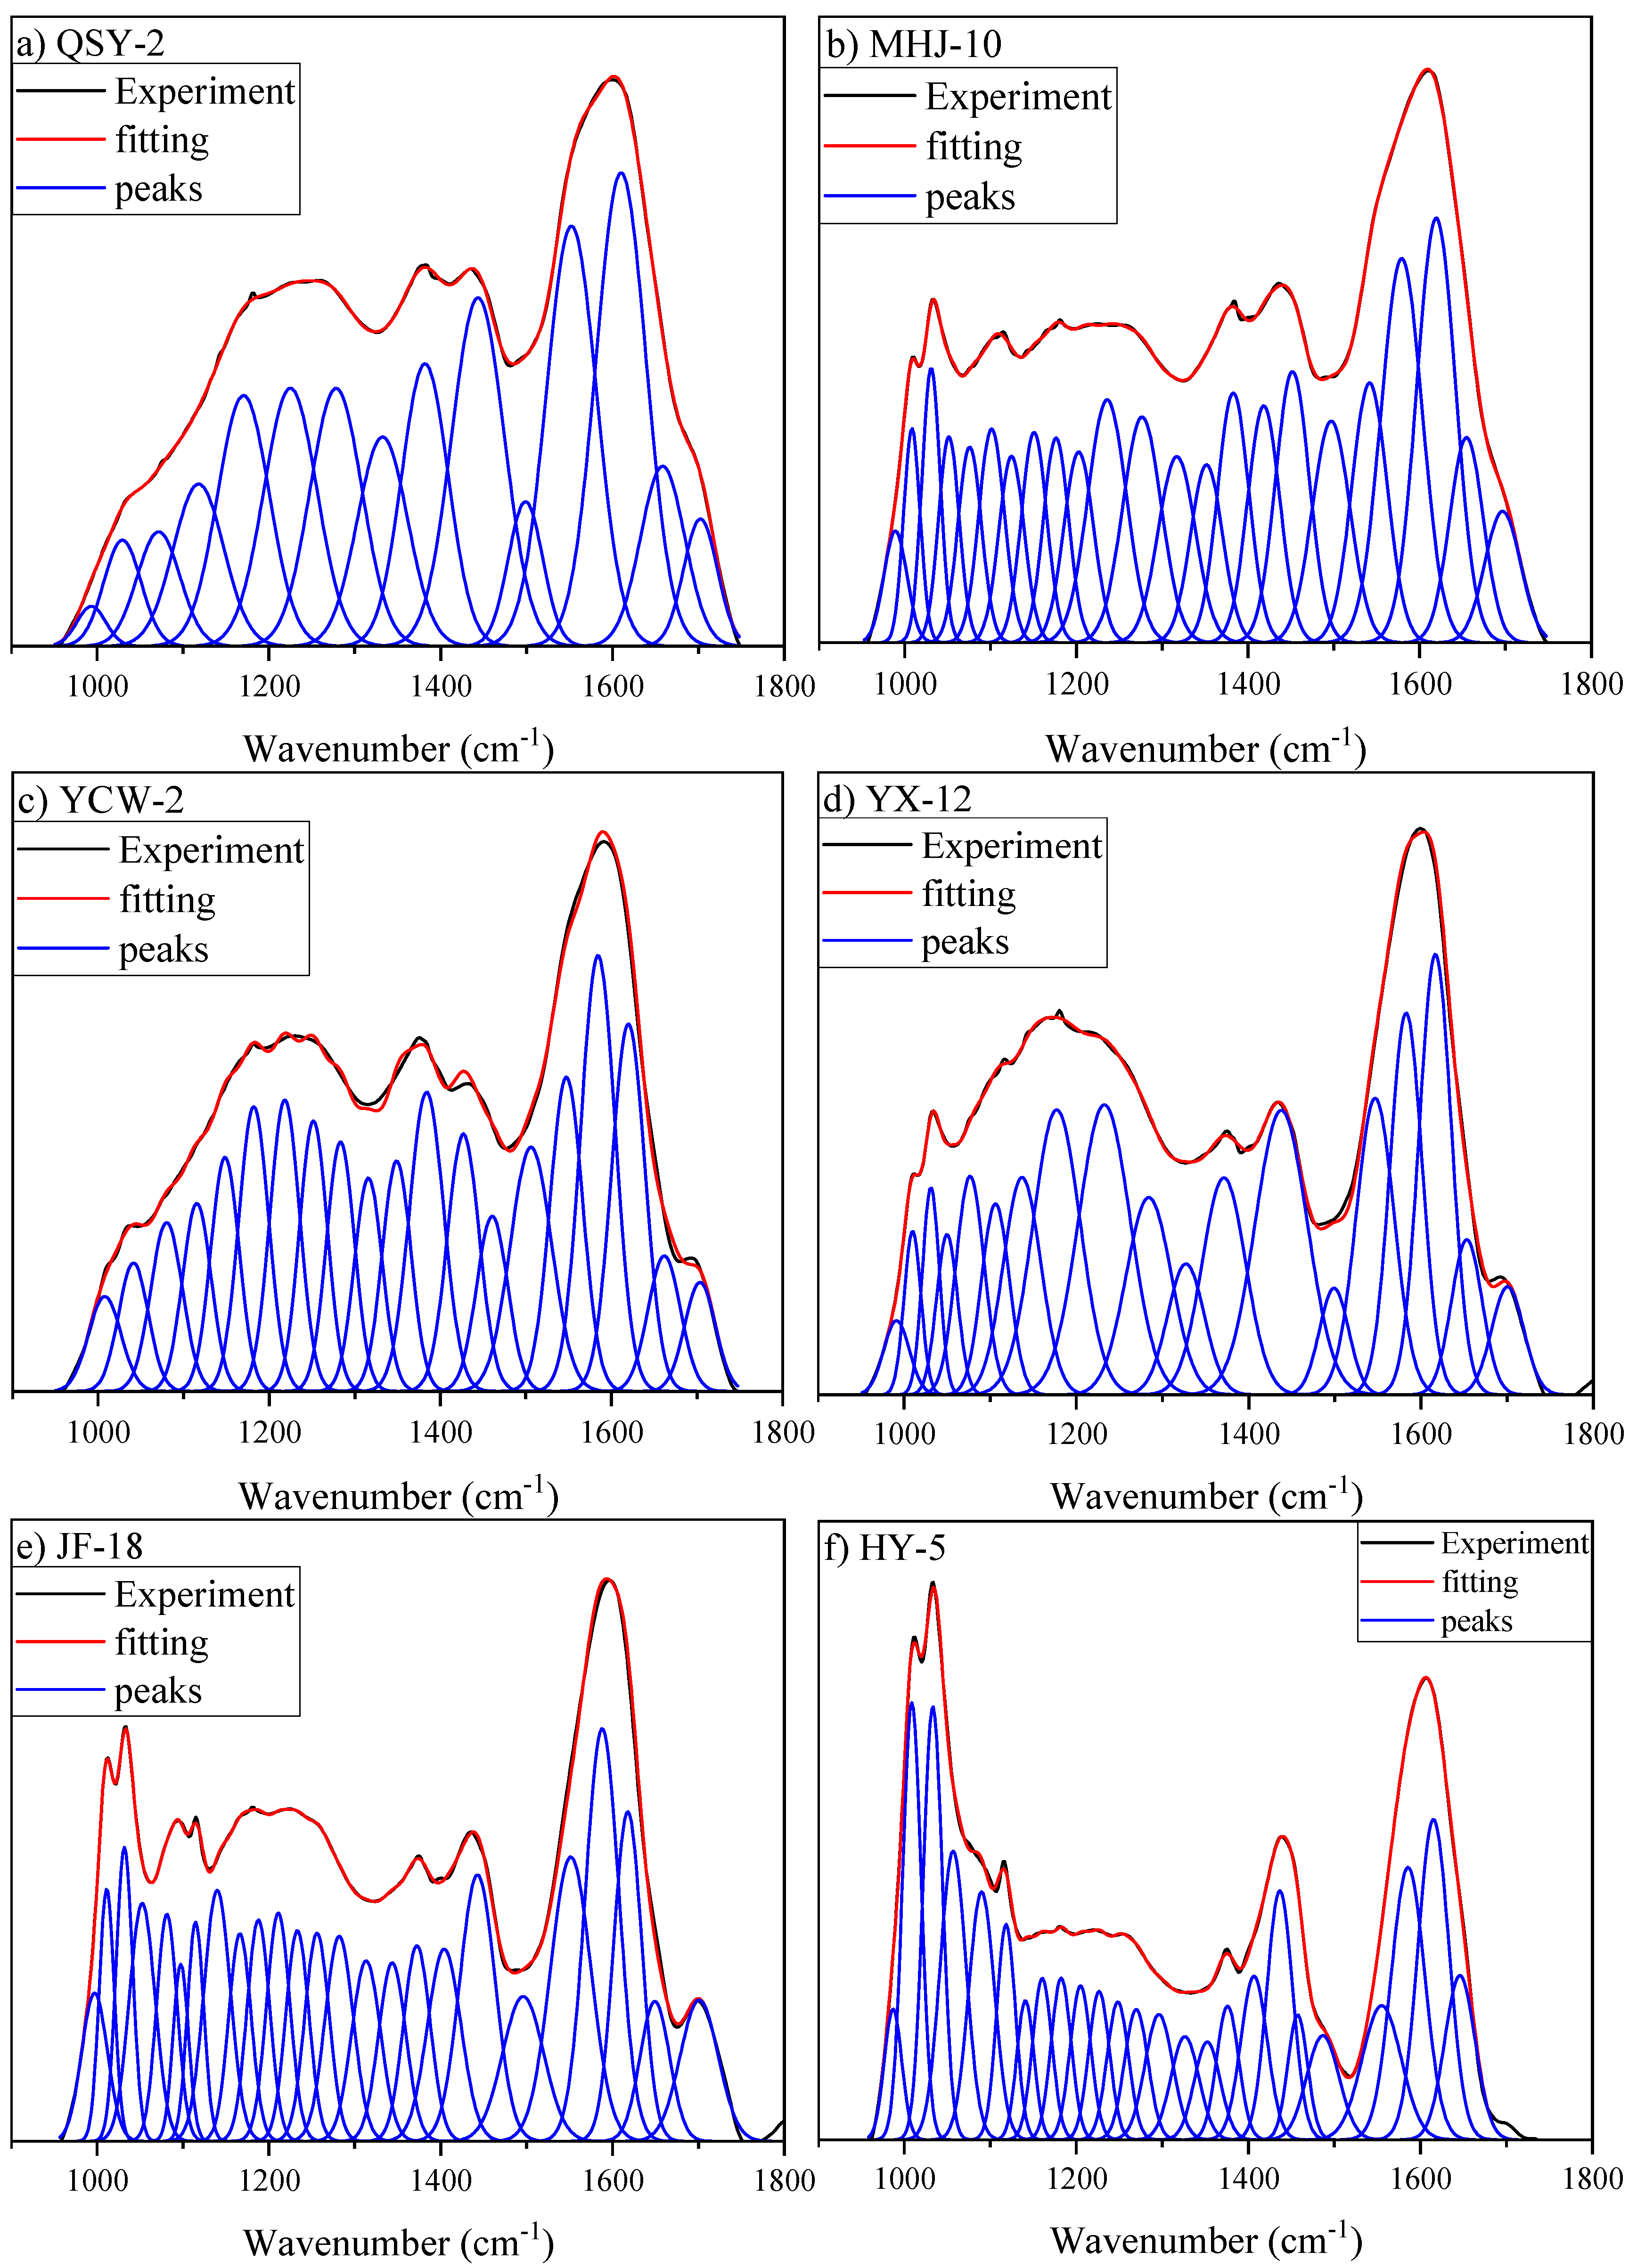
3.3.2. Oxygen-Containing Functional Group Region

Figure 8 shows the peak fitting results for the region with oxygen-containing functional groups. On the basis of previous studies, the peak assignments were determined according to the positions of the subpeaks (Table 4) [43,44,47]. The peak near 1000 cm−1 is attributed to ash [43]. It reflects the content of clay minerals in coal [8]. The samples QSY-2, YCW-2, and YX-12 have relatively low ash contents of 0.71%, 2.08%, and 3.18%, respectively. The lower ash content indicates that the mineral content in the aforementioned samples is relatively low. The samples MHJ-10, JF-18, and HY-5 have relatively high clay mineral contents (Table 1). The ash content in the three samples is also relatively high (Table 4), which is consistent with the results of curve fitting. The oxygen atoms in coal exist mainly in the form of oxygen-containing functional groups, including methoxy, carboxyl, carbonyl, hydroxyl, and ether oxygen groups [32]. Carbonyl compounds were found in all the samples, with the highest relative content observed in QSY-2, which had the lowest degree of metamorphism. During the metamorphosis of lignite into subbituminous coal, the carbonyl content decreases from 19.54% to 14.34%. The reduction in carbonyl content may be related to the production of CO2 [9,14]. The release of CO2 is considered one of the indicators of the FCJ [9]. The reduction in carbonyl content in YCW-2 (Ro is 0.58%) may have led to this result.
Methoxy groups typically appear in coal with lower degrees of metamorphism and are completely removed from aromatic rings when the metamorphic degree increases to an Ro of 0.99% [19]. Notably, in the study of Section 3.2.2, only a small amount of methoxy, specifically falO, was found in the QSY-2 sample, with a relative content of 2.47%. However, in the FTIR experiment, no methoxy groups were found in the QSY-2 sample, which may be due to the low content in the sample. Furthermore, the removal of methoxy groups may be directly related to the formation of methane [13]. During the transformation of lignite into subbituminous coal, the methoxy groups may have already been converted to methane. The contents of alkyl ethers and aryl ethers in the selected samples range from 2.43% to 13.67%, whereas the content of phenolic hydroxyl groups is between 25.51% and 34.29%. This indicates that in coal with a relatively low degree of alteration, phenolic hydroxyl groups are the primary form of oxygen atoms. Furthermore, the relative content of phenolic hydroxyl groups in the YCW-2 sample was significantly lower than that in the other samples. This finding indicates that during the FCJ, hydroxyl groups are removed from the aromatic rings, which is consistent with the aforementioned results.

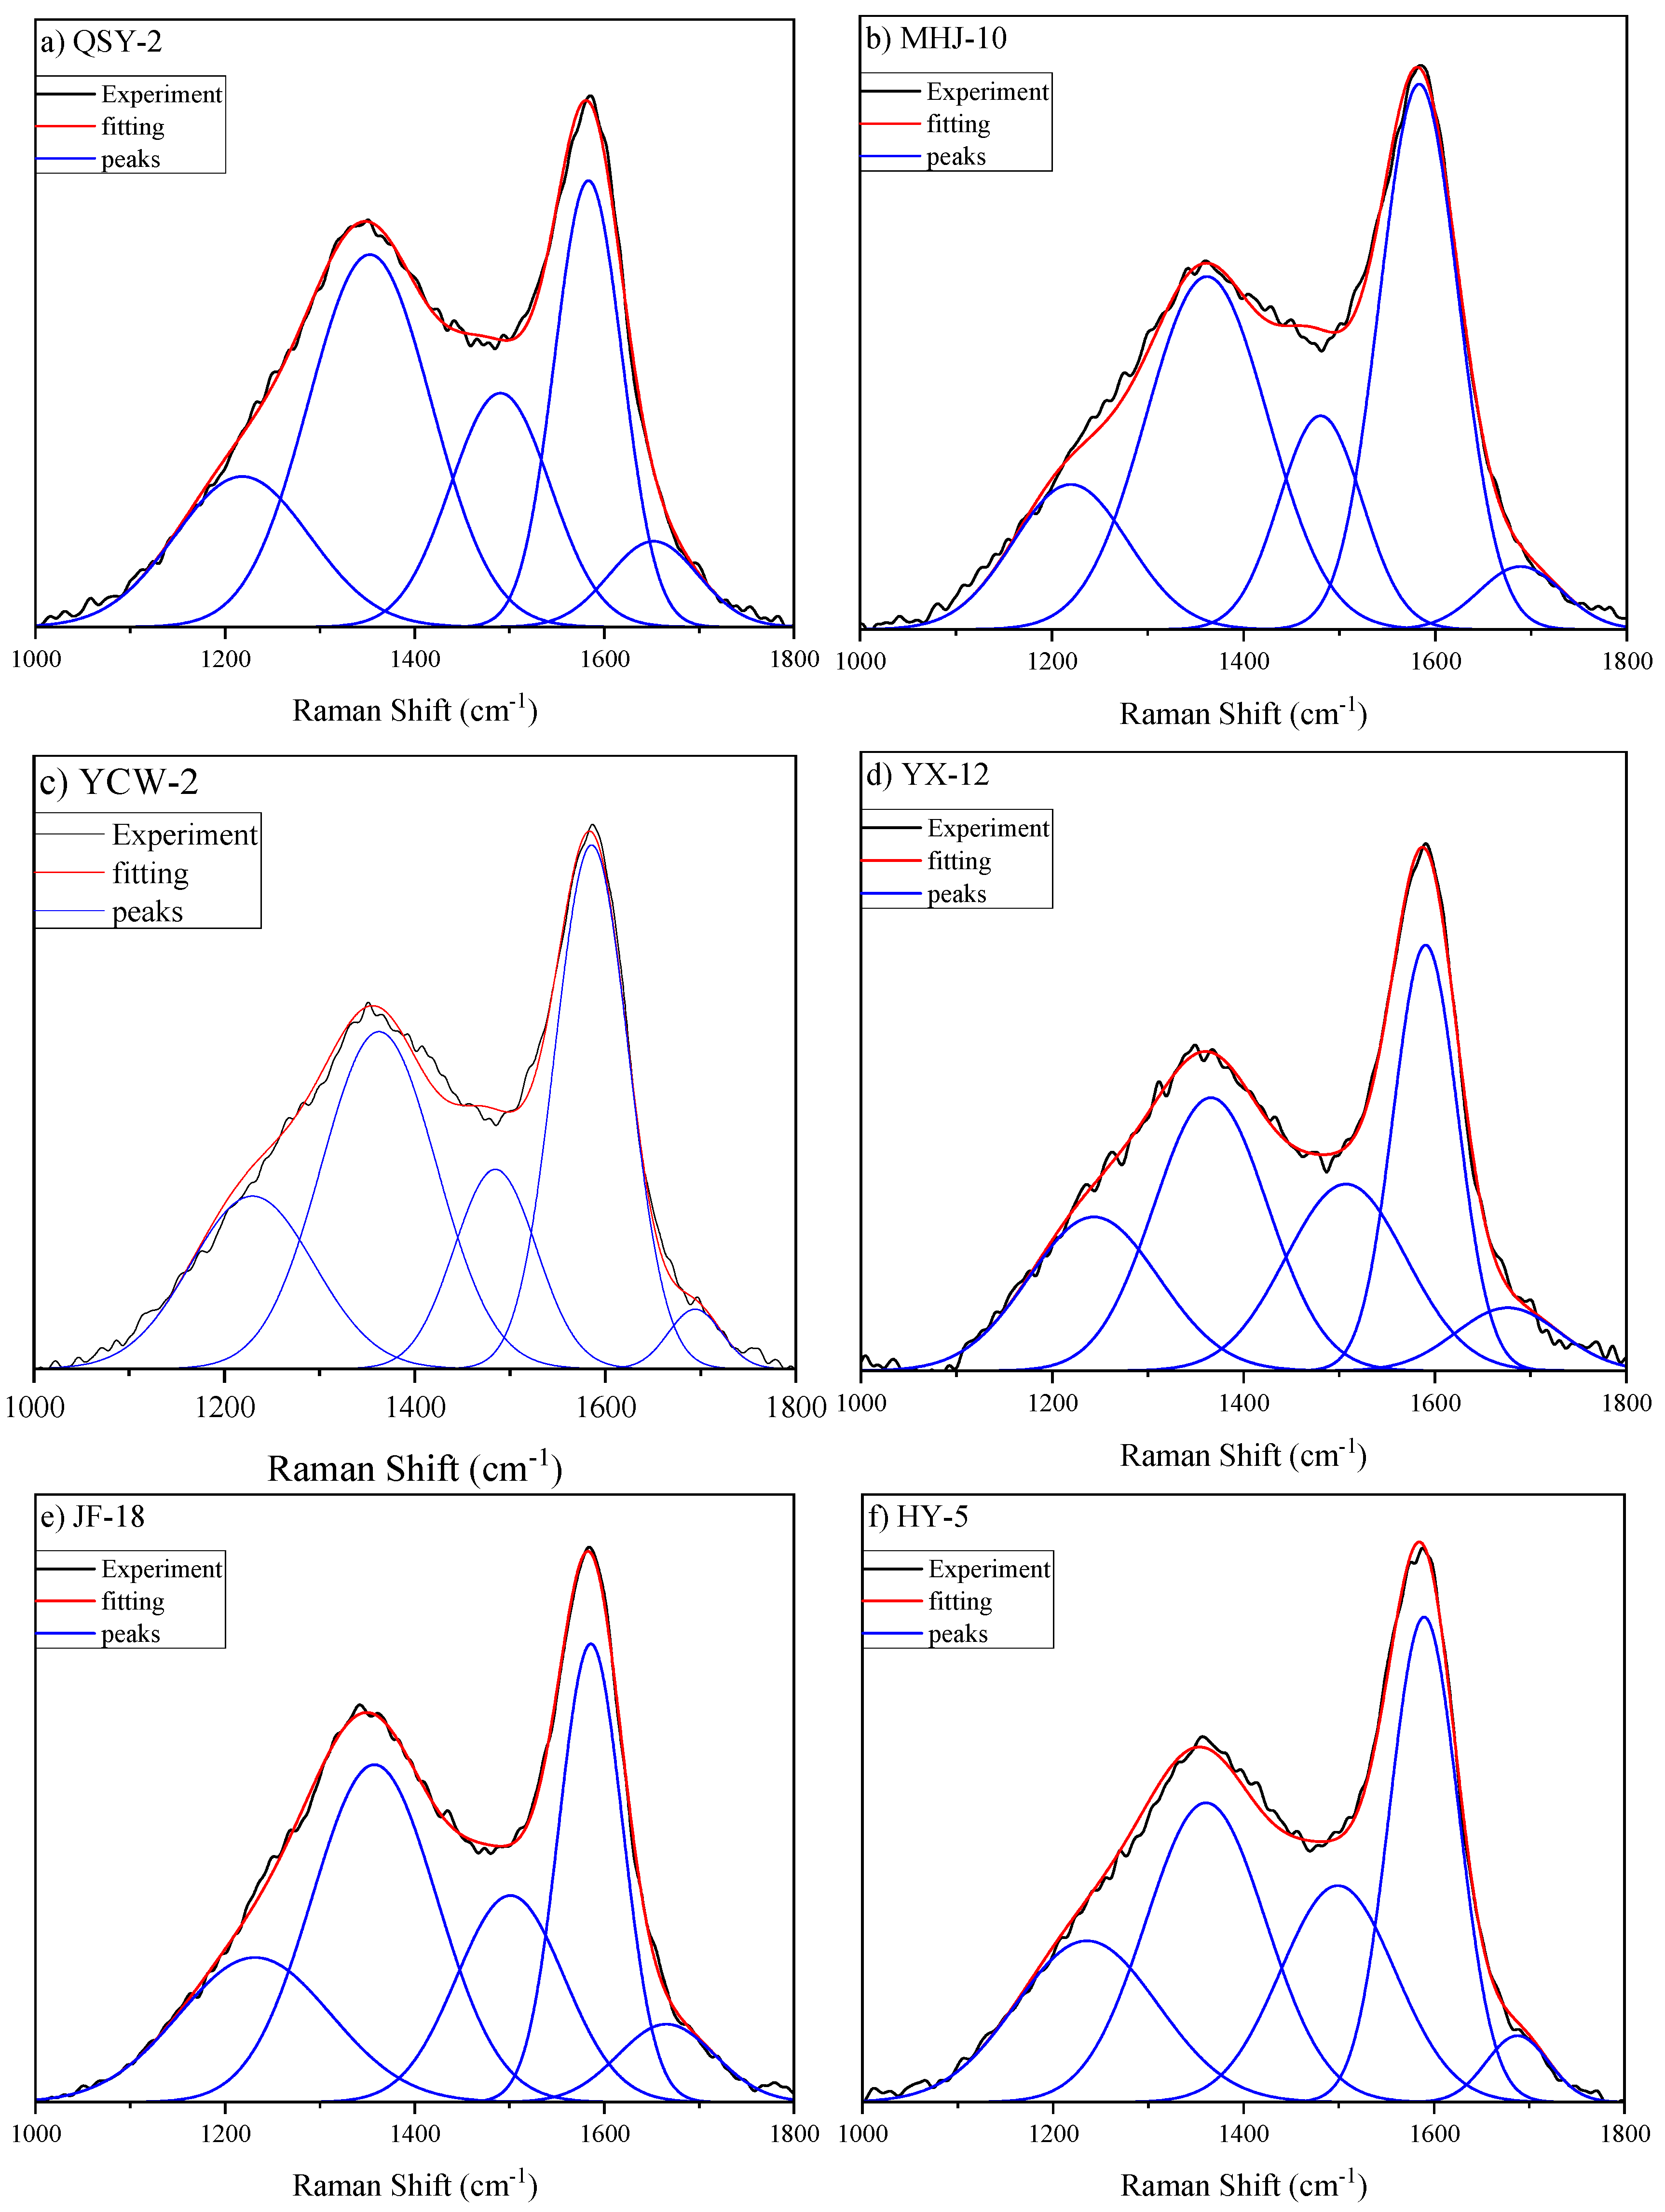
3.4. Raman Characteristics

Raman spectroscopy experiments can be used to assess the order of coal structures [2]. The Raman spectrum can be divided into a primary module (1000–1800 cm−1) and a secondary module (2300–3000 cm−1) [48]. The primary module mainly characterizes the orderliness of two-dimensional coal structures, whereas the secondary module can better reflect the graphitization process of coal and the three-dimensional orderliness of the hexagonal graphite formed during this process. In the study of coal molecular structure, the primary module of Raman spectra is commonly analyzed. The primary module can be divided into five main peaks, namely, peaks G, D1, D2, D3, and D4, on the basis of peak fitting technology. Peak G is associated primarily with the C=C stretching vibrations within aromatic rings in the plane. Peak D1 is related mainly to disorder in sp2 carbon networks. Peak D2 is associated primarily with disordered sp2 carbon. Peak D3 is related to amorphous carbon. Peak D4 is associated with sp3 or C-C and C=C stretching vibrations [4,49].
Figure 9 shows the Raman spectra of the six samples. In the range of Raman shifts from 1000 cm−1 to 1800 cm−1, there are two distinct peaks. These are the D1 peak at a Raman shift of 1336–1350 cm−1 and the G peak at a Raman shift of 1585–1590 cm−1. The peak height of G is significantly greater than that of D1, but its width is noticeably narrower than that of D1. As the degree of metamorphism increases, the G peak gradually shifts to regions of greater Raman shift, whereas the D1 peak shifts to regions of lower Raman shift, indicating that the metamorphic process involves the evolution of the coal molecular structure from disordered to ordered [50]. The difference between peak positions, specifically the difference in Raman shifts between peaks G and D1, is correlated with metamorphism. The greater the peak difference is, the greater the degree of metamorphism. Therefore, the peak difference is used to characterize the maturity of coal and shale.
The peak-fitting results of the primary module of the Raman spectra are shown in Figure 10. The positions of each subpeak and the peak position differences are listed in Table 5. In theory, as coal metamorphism approaches that of graphite, its Raman spectrum shows only one characteristic peak, the G peak. Its Raman spectrum includes both prominent G and D1 peaks when the degree of coal graphitization is low, typically located near the Raman shift of 1355 cm−1 [51]. All the samples exhibit distinct D1 and G peaks. As metamorphism intensifies, the deconvoluted G peak tends to shift towards greater displacement. Notably, the position of peak D1 remains relatively stable at a Raman shift of 1360 cm−1. For all samples except QSY-2, the peak position difference increases monotonically with increasing metamorphic degree. This indicates that as the metamorphic degree increases, the order of its macromolecular structure increases [2]. Notably, the peak position difference of the QSY-2 sample is significantly greater than that of the other samples. This illustrates the distinctions between the evolutionary processes of macromolecular structures in coal and those of its chemical structures. In low metamorphic degree coal, the diversity in structural arrangement leads to a scattered peak position difference in its Raman spectra rather than a linear peak. This phenomenon of discrete peak differences in low metamorphic coal is also reflected in the studies by Rodrigues et al. and He et al. [2,16].
The increasing difference in the Raman peak positions for the samples, with the exception of lignite, appears to reflect the characteristics of microstructure order evolution. However, this appears to lead to conclusions that contradict the analysis in Section 3.2 and Section 3.3. The molecular structure of YCW-2 appears denser and more ordered due to the removal of functional groups from the aliphatic side chains during the FCJ. This seems very interesting. Perhaps the application of Raman experiments in the characterization of low-rank coal still needs to be considered. These results are consistent with the findings of Liu [15].

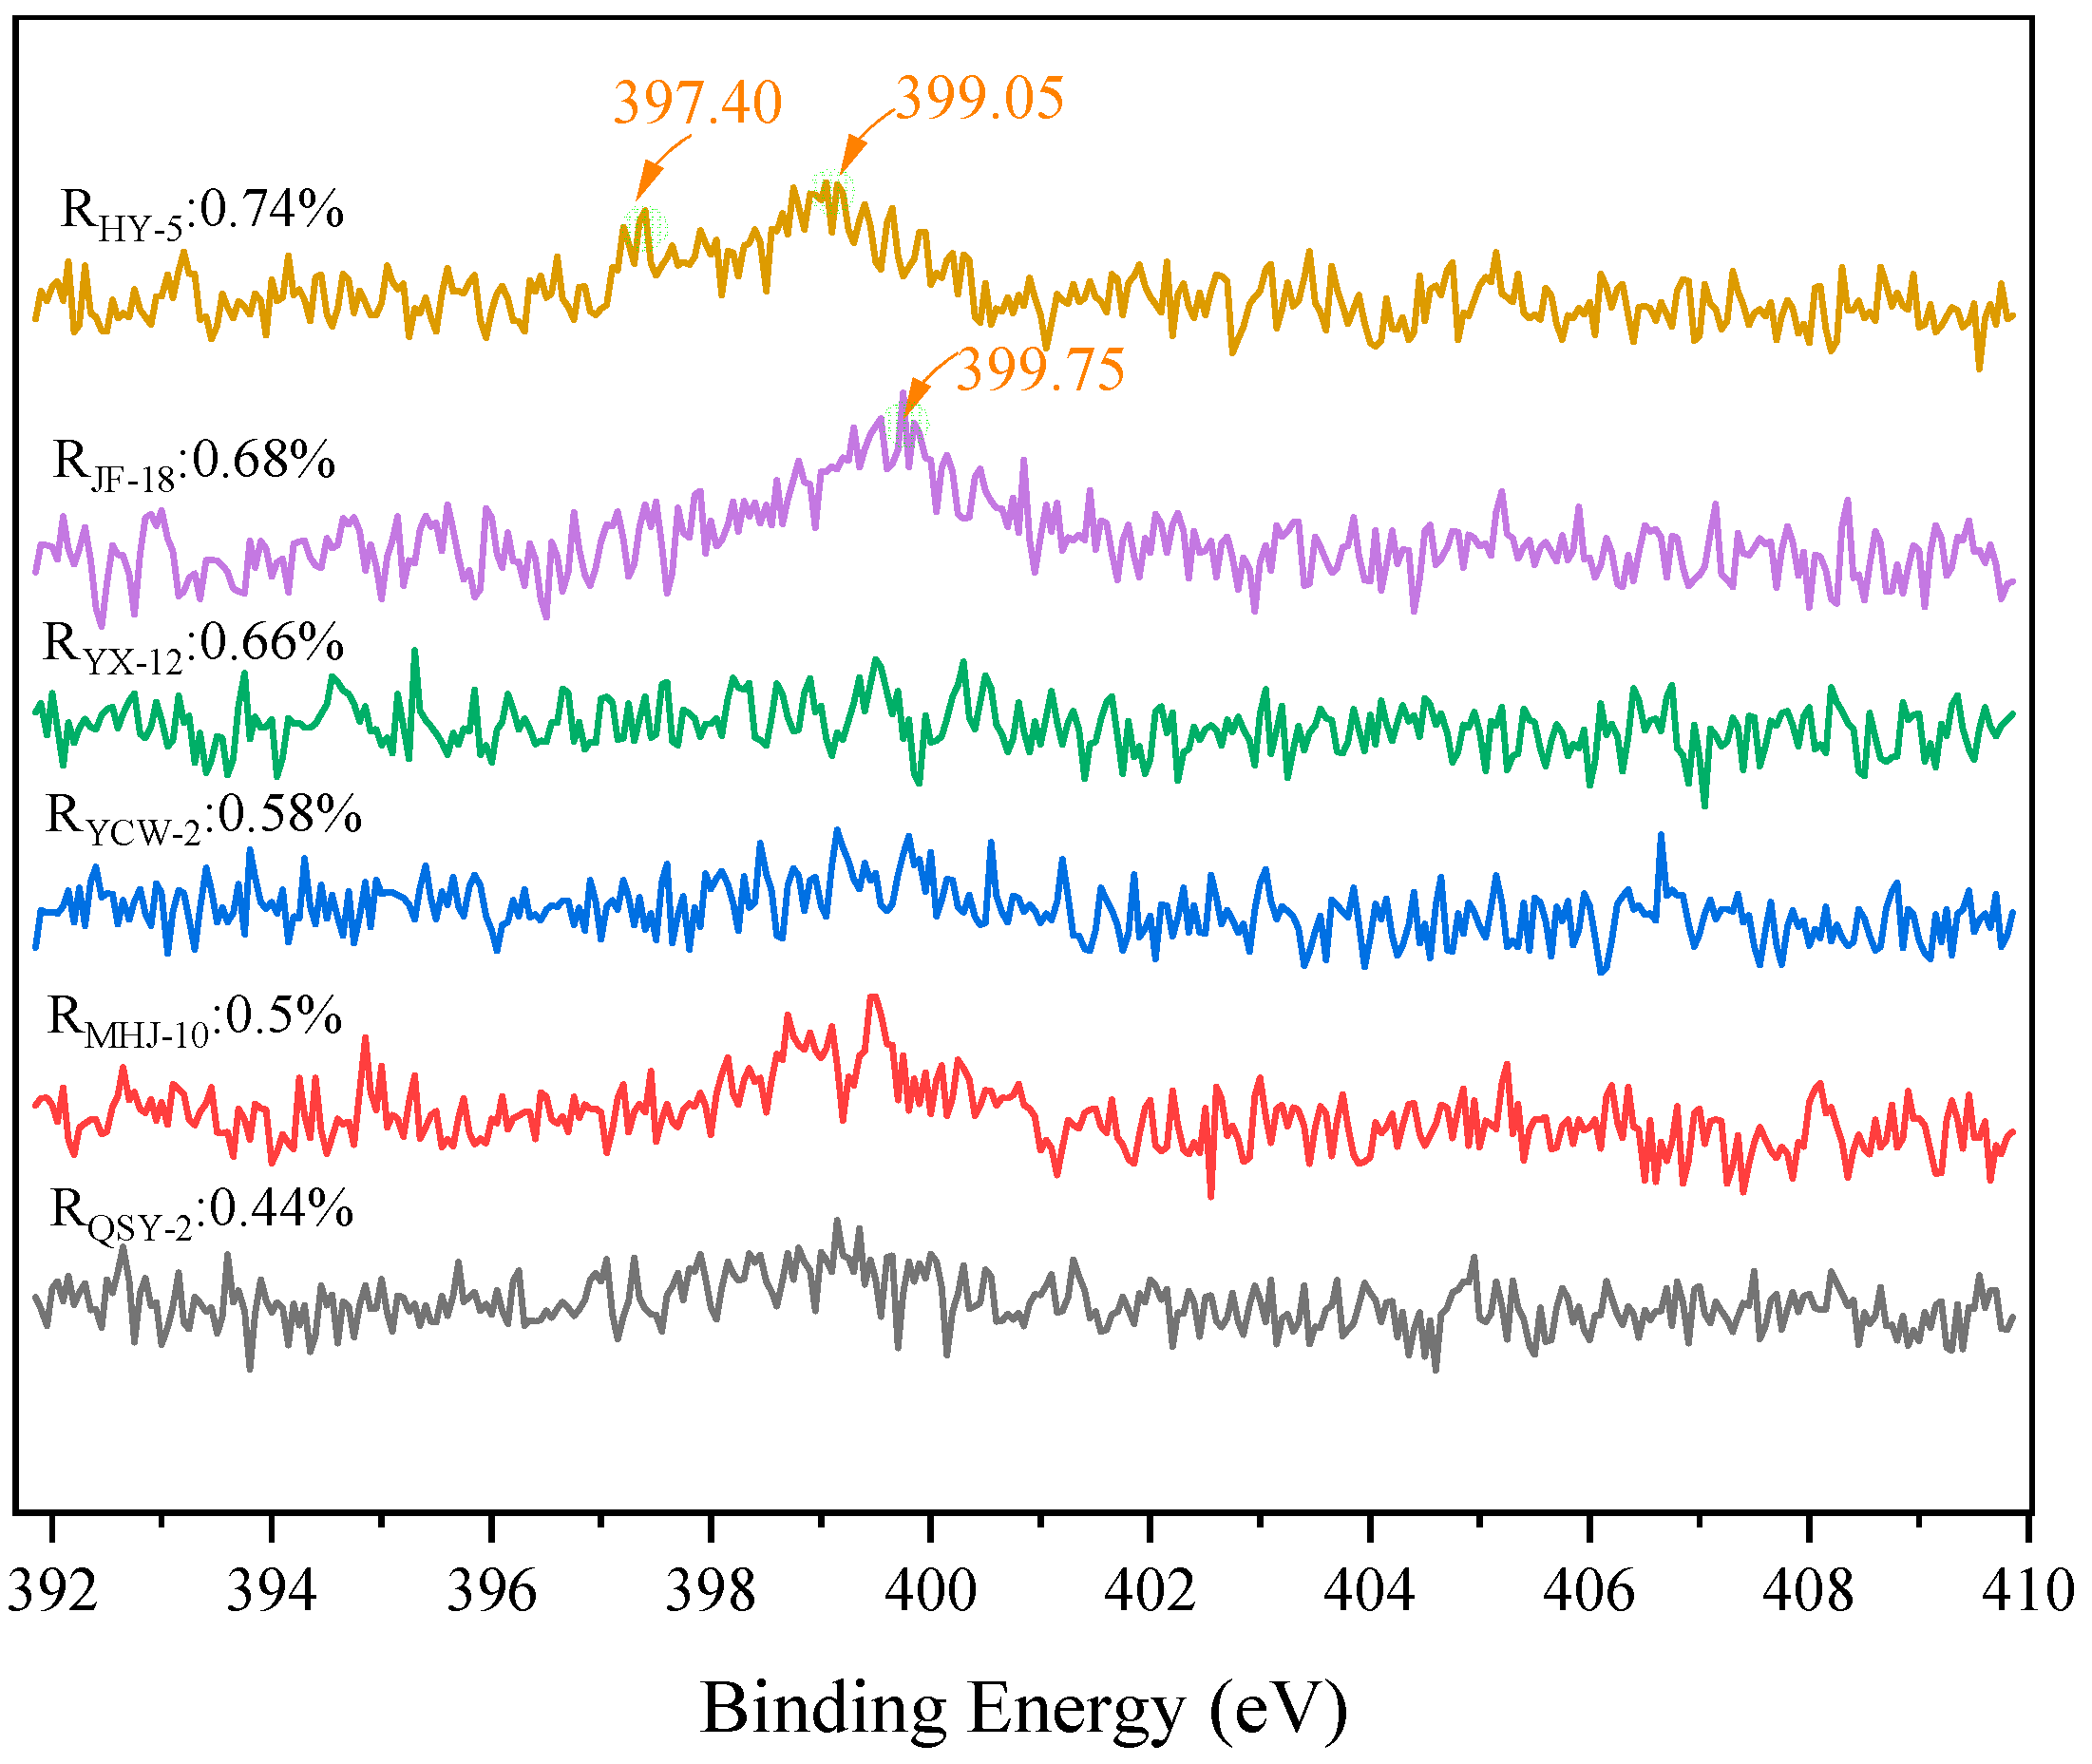
3.5. XPS Characteristics

XPS experiments can be used to analyze the chemical states of elements and the relative contents of various chemical states [31]. The analysis of the distribution states of C, O, N, S, etc., in coal can be achieved via this technology. The relative proportions of the elemental contents in the coal samples are shown in Table 6. The metamorphosis of coal is a process of carbon enrichment and deoxygenation. The relative contents of C in the selected samples are all less than 80%, whereas that of O is greater than 20%, indicating that the degree of metamorphism of the selected samples is relatively low. Notably, XPS experiments cannot accurately provide information on the percentage of each element in coal, but they can reflect the relative content of that element. Si has a limited distribution in coal, and its occurrence may be related to the inorganic minerals in coal. No Al or Cl was detected, indicating that their concentrations in the selected samples were relatively low. The Na element is present only in the HY-5 sample, with its relative content being extremely low and negligible. Furthermore, the content of S in the selected samples is relatively low, reaching a negligible level. Compared with the other samples, the JF-18 and HY-5 samples presented relatively high nitrogen contents. The N contents in the QSY-2, MHJ-10, YCW-2, and YX-12 samples are less than 0.5%, which can be disregarded.

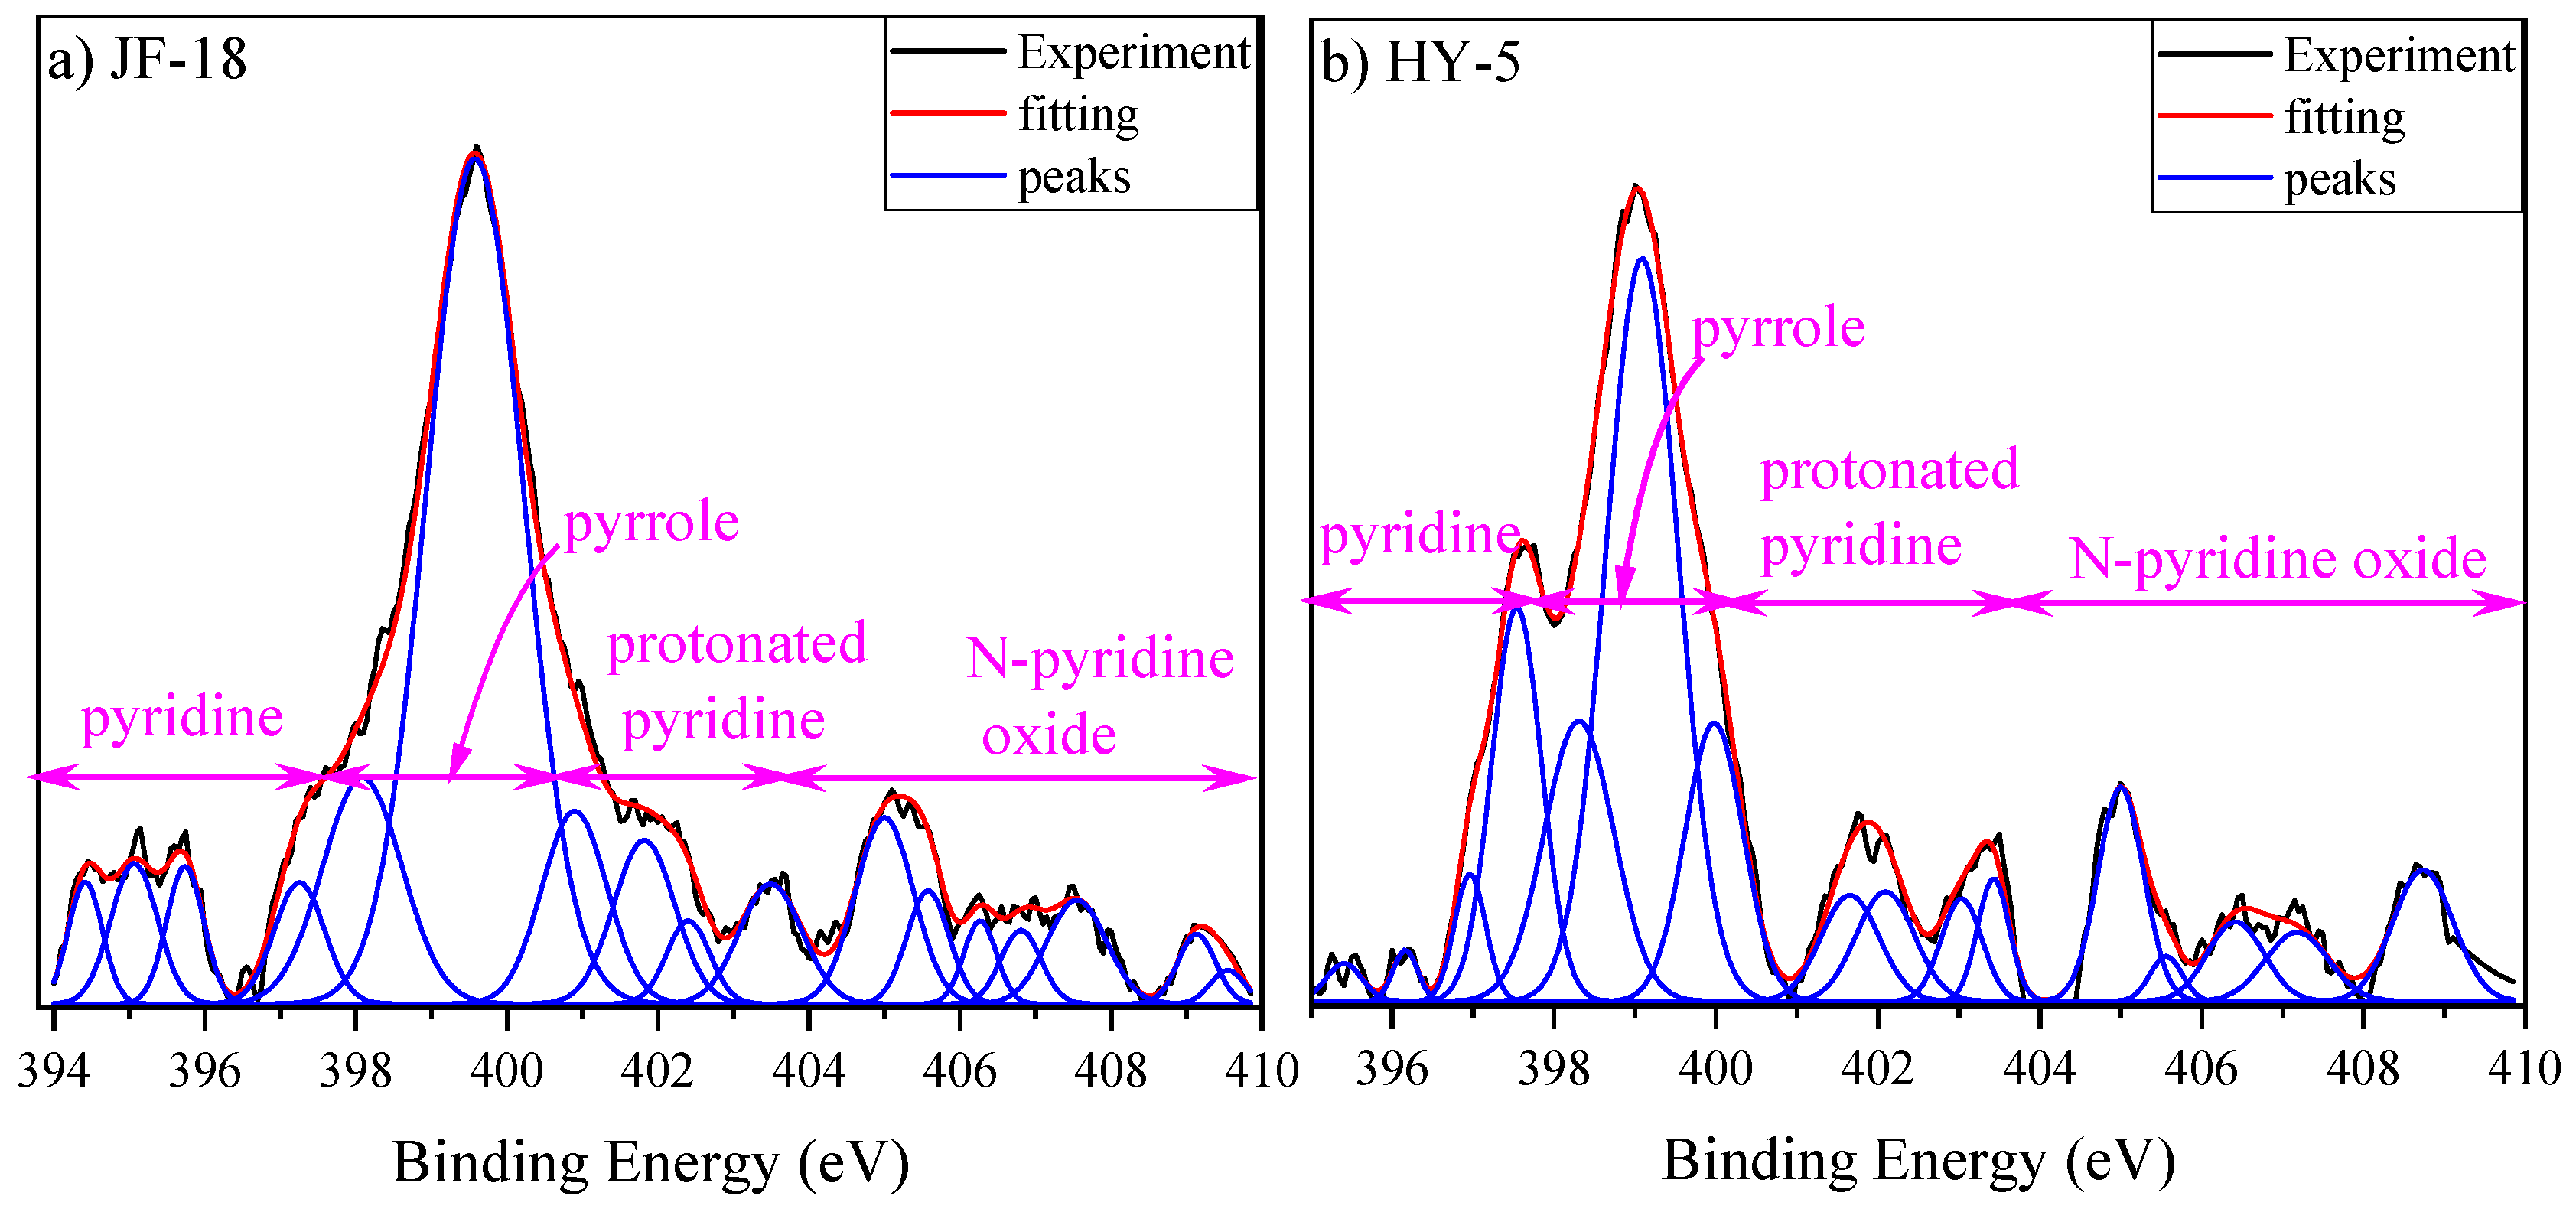
Nitrogen Atomic Structure

The forms of C and O in coal are often obtained through more accurate experiments, such as 13C NMR and FTIR. Therefore, previous studies have mostly used XPS experiments to understand the presence of N and S in coal. The nitrogen in coal almost entirely exists in the form of organic nitrogen. It typically forms ring and chain compounds with carbon and hydrogen atoms, incorporating pyrrole and pyridine. Figure 11 shows the XPS spectra of N for the six samples. Apart from those of the HY-5 and JF-18 samples, the curves of the other samples show no obvious vibration peaks. This is due to the lower N content in the sample.
There are two distinct peaks located at 397.40 eV and 399.05 eV in the HY-5 sample, which are attributed to pyridine and pyrrole, respectively [19,31]. JF-18 shows a distinct peak that corresponds to pyrrole. Clearly, the vibration peaks characteristic of pyrrole occupy a greater proportion in both samples. Figure 12 shows the peak fitting of nitrogen in the JF-18 and HY-5 samples. The curve-fitting attributes and relative area ratios are listed in Table 7. The content of pyrrole in both samples was above 50%, indicating that the N in the selected samples mainly existed in the form of pyrrole. This is consistent with the above analysis.

3.6. Implications of the FCJ for the Molecular Structure

The FCJ has a noticeable effect on the molecular structure of coal [12,14]. The aliphatic structures clearly respond to these changes. Both the FTIR and 13C NMR experimental results confirmed this finding. Lignite and subbituminous coal have complex molecular structures characterized by longer aliphatic side chains and abundant oxygen-containing functional groups. This significantly reduced the stability of its microstructure. The FCJ occurs at approximately 350 °C [12]. Higher temperatures supply the energy required to eliminate moisture, long-chain aliphatic structures, and oxygen-rich functional groups [21]. The moisture in coal provides a source of hydrogen bonds [43,47]. The reduction in the hydrogen bond content in YCW-2 compared with that in the other samples confirms this result. Furthermore, the reduction in long-chain aliphatic functional groups in coal significantly enhances the order of its molecular structure. To some extent, XBP represents the size of aromatic rings in coal. The XBP of the YCW-2 (0.47) sample is significantly greater than that of the other samples (Table 2), indicating that YCW-2 has relatively dense aromatic rings. Benzene can also form independently when long-chain aliphatic groups fall off, according to pyrolysis experiments [9]. This provides the possibility for the condensation polymerization of aromatic rings, leading to the presence of dense aromatic rings in YCW-2. The FTIR parameter “I” fully confirmed the possibility of aromatic ring condensation during the FCJ process for YCW-2.
QSY-2 contains a rich variety of oxygen-containing functional groups, but as coal metamorphism increases, the types and amounts of these groups noticeably decrease. In particular, methoxy groups were used. Methoxy groups and aliphatic side chains in coal are removed from the aromatic ring through a demethylation reaction [41]. This might be the main reason for methane production [23,24,25]. Unfortunately, we were unable to conduct relevant work in this study to further validate the reasonableness of the results. Notably, the FCJ of coal appears to be unaffected by heteroatomic functional groups. This could be due to two factors: (1) the content of heteroatoms in coal is relatively low; and (2) heteroatoms, particularly pyrrolic nitrogen, are part of the aromatic conjugated system in the large molecular structure of coal, making them relatively stable during coalification.

4. Conclusions

Here, spectroscopic experiments were conducted to study the microstructural evolution characteristics of six samples from the Ningdong coalfield before and after the FCJ. The removal process of aliphatic side chains and oxygen-containing functional groups and the polymerization process of aromatic rings were analyzed. Furthermore, the production processes of CO2, H2O, and CH4 are discussed. The main conclusions of this study are as follows:
(1)
Low-rank coals have a complex and unstable chemical structure, and the high-temperature environment provided by the FCJ facilitates abrupt changes in their microstructure. The long-chain aliphatic structure and oxygen-containing functional groups gradually detach from the aromatic ring, providing the possibility for the formation of CH4 and CO2.
(2)
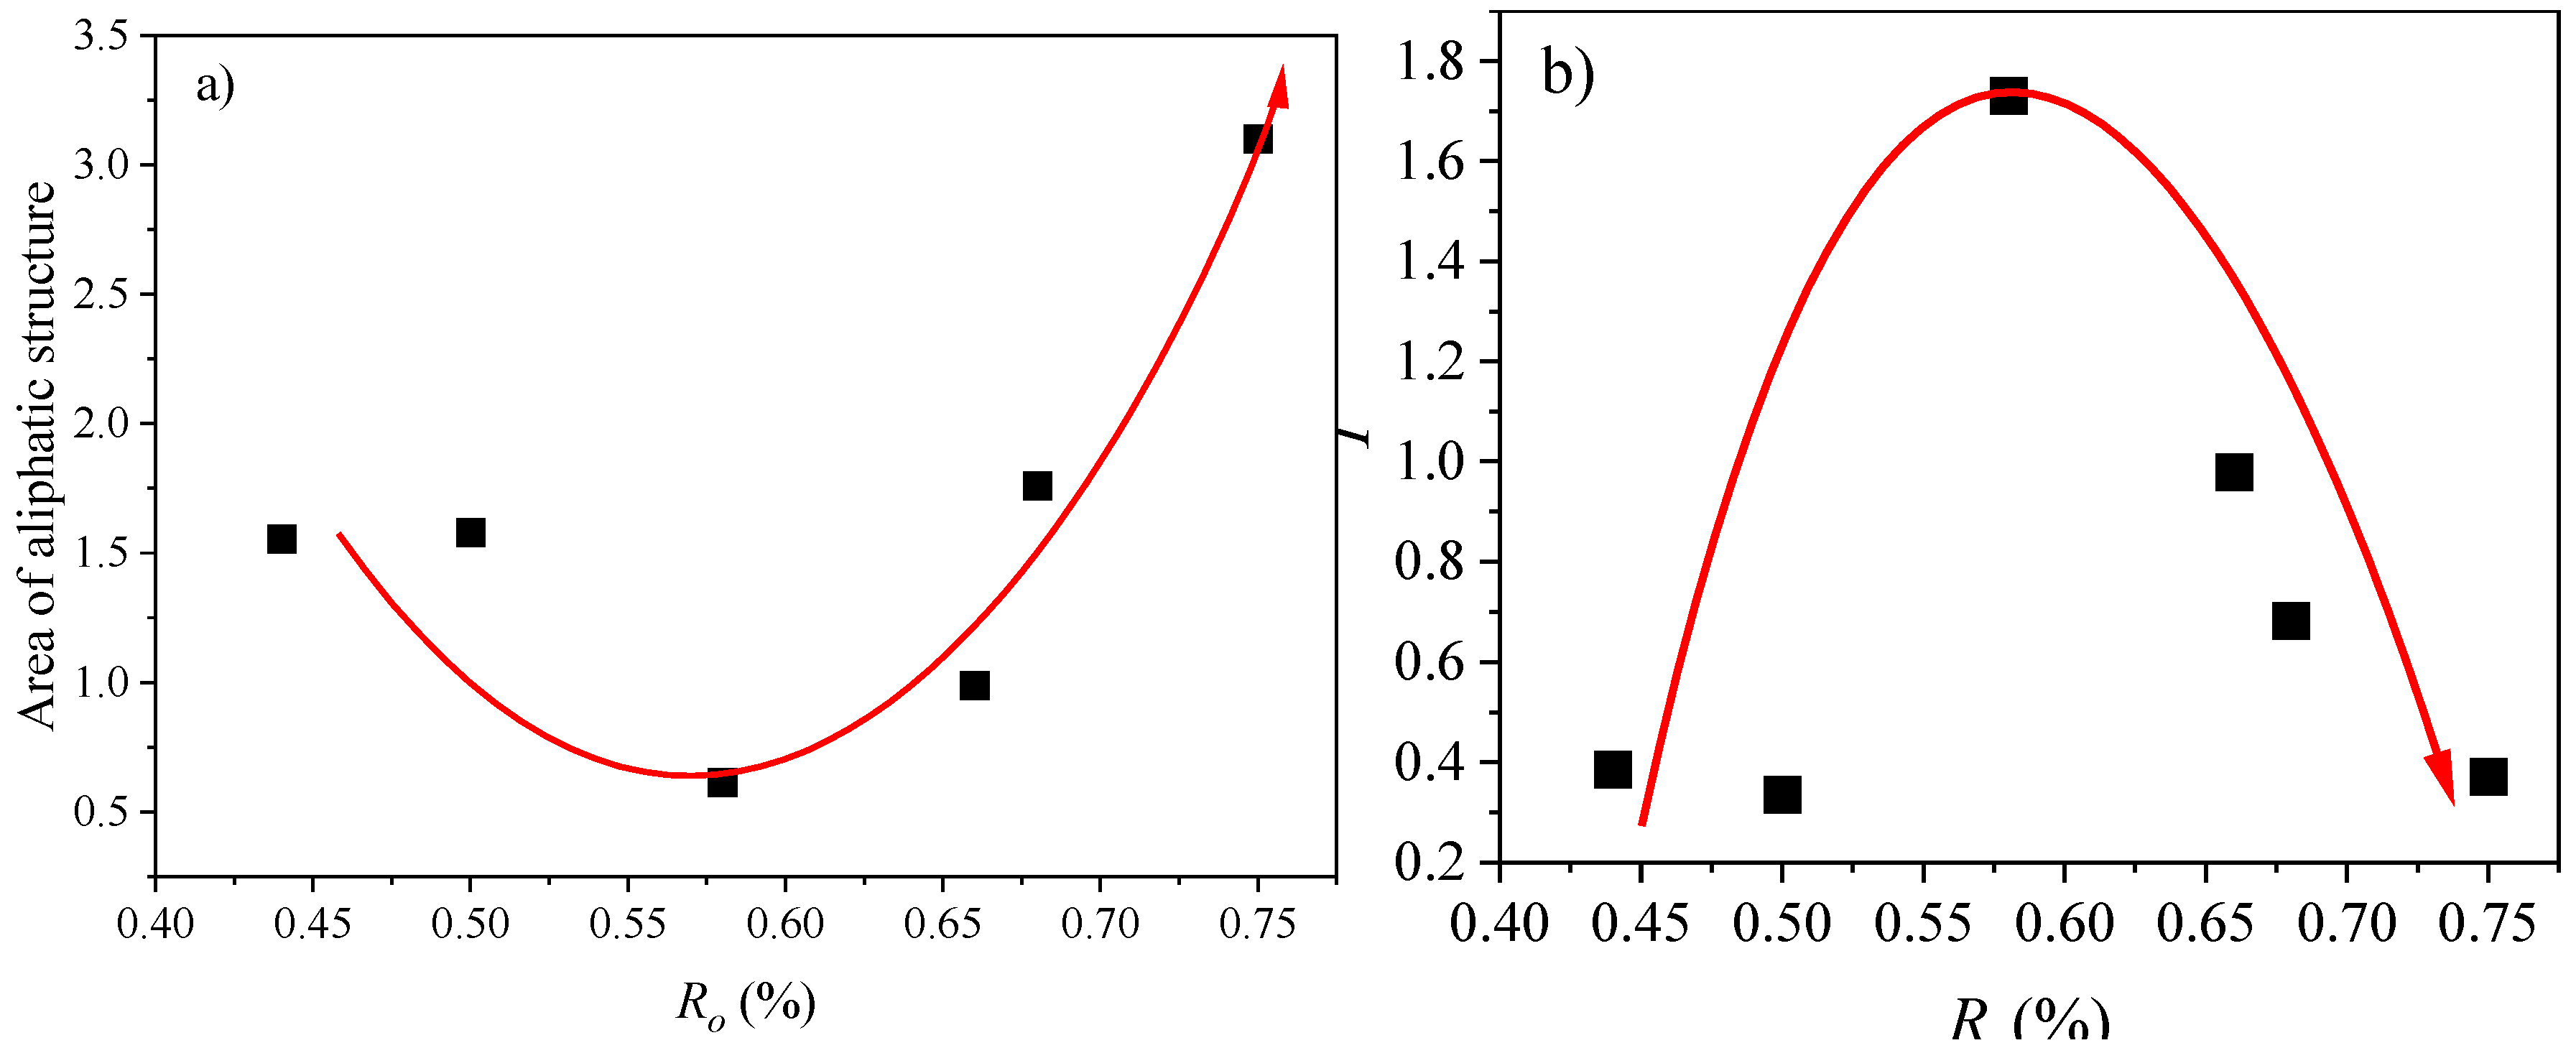
Demethylation produces benzene substances that gradually form dense aromatic rings through condensation polymerization, significantly enhancing the aromaticity of YCW-2. The aliphatic structural evolution follows a V-shaped trend, with an inflection point at approximately 0.6% as the degree of coal metamorphism increases.
(3)
The impact of the FCJ on heteroatomic functional groups is almost negligible. Additionally, the peak position difference in the Raman spectra shows a discrete distribution related to the degree of metamorphism. The feasibility of applying Raman spectroscopy to the study of low-rank coal still needs to be verified.

Author Contributions

Methodology, X.Z.; Software, B.W.; Investigation, X.L. and Z.Z.; Data curation, Y.L.; Writing—original draft, X.J.; Writing—review & editing, B.G.; Visualization, C.W. All authors have read and agreed to the published version of the manuscript.

Funding

This research was funded by the Natural Science Foundation of Ningxia (No. 2023AAC03783, No. 2023AAC05062), the Special Project for Geological Development of Ningxia in 2023 (No. 640000233000000011005), the Key Research and Development Program Project of Ningxia (No. 2024BEG02038), and the Ningxia Unconventional Natural Gas Exploration and Development Innovation Team (No. 2022BSB03105).

Data Availability Statement

The original contributions presented in this study are included in the article. Further inquiries can be directed to the corresponding author.

Acknowledgments

The authors are sincerely grateful to the Editor and the Anonymous Reviewers for their constructive and careful comments on the manuscript.

Conflicts of Interest

The authors declare no conflict of interest.

References

  1. Shang, F.; Tang, X.; Hu, Q.; Wang, Y.; Meng, X.; Zhu, Y. Chemical structure transformations in kerogen from longmaxi shales in response to tectonic stress as investigated by HRTEM, FTIR, and 13C NMR. Energy Fuels 2021, 35, 19496–19506. [Google Scholar] [CrossRef]
  2. He, X.; Liu, X.; Nie, B.; Song, D. FTIR and Raman spectroscopy characterization of functional groups in various rank coals. Fuel 2017, 206, 555–563. [Google Scholar] [CrossRef]
  3. Baysal, M.; Yürüm, A.; Yıldız, B.; Yürüm, Y. Structure of some western Anatolia coals investigated by FTIR, Raman, 13C solid state NMR spectroscopy and X-ray diffraction. Int. J. Coal Geol. 2016, 163, 166–176. [Google Scholar] [CrossRef]
  4. Liu, T.; Lin, B.; Sang, S.; Yang, W.; Liu, T.; Liu, S.; Zheng, S.; Wang, T. Control Mechanisms of Macromolecular Compositions and Structures of Coals on the Evolution of Nanopores during Coalification. Energy Fuels 2024, 38, 13002–13018. [Google Scholar] [CrossRef]
  5. Adsul, T.; Ghosh, S.; Ojha, A.; Bhattacharyya, S.; Varma, A.K. Spectral narratives of microstructural restyling and their controls on hydrocarbon generation potential from coal. Int. J. Coal Sci. Technol. 2023, 10, 33. [Google Scholar]
  6. Jiang, J.; Yang, W.; Cheng, Y.; Liu, Z.; Zhang, Q.; Zhao, K. Molecular structure characterization of middle-high rank coal via XRD, Raman and FTIR spectroscopy: Implications for coalification. Fuel 2019, 239, 559–572. [Google Scholar] [CrossRef]
  7. Yao, P.; Zhang, J.; Lv, D.; Vandeginste, V.; Chang, X.; Zhang, X.; Wang, D.; Han, S.; Liu, Y. Effect of water occurrence in coal reservoirs on the production capacity of coalbed methane by using NMR simulation technology and production capacity simulation. Geoenergy Sci. Eng. 2024, 243, 213353. [Google Scholar] [CrossRef]
  8. Yao, N.; Cao, J.; Pang, X.; Zhao, F.; Cai, S.; Xu, M.; An, J.; Xu, X.; Yin, J. Research progress in catalytic reforming of low rank coal pyrolysis volatiles. Chem. Ind. Eng. Prog. 2024, 43, 2279–2293. (In Chinese) [Google Scholar]
  9. Li, M.; Zeng, F.; Zhao, Y.; Liang, H.; Xiang, J. Structural evolution around first coalification jump revealed by TG/MS and FTIR. Energy Sources Part A Recovery Util. Environ. Eff. 2017, 39, 562–569. [Google Scholar] [CrossRef]
  10. Kapusta, K.; Wiatowski, M.; Stańczyk, K. An experimental ex-situ study of the suitability of a high moisture ortho-lignite for underground coal gasification (UCG) process. Fuel 2016, 179, 150–155. [Google Scholar] [CrossRef]
  11. Ding, J.; Wu, C.; Gao, B.; Zhang, S.; Zhang, J.; Tan, K. Research on the underground gasification of lignite through an oxygen enrichment process: Insights from experimental study and Aspen Plus process model. RSC Adv. 2024, 14, 36398–36409. [Google Scholar] [CrossRef] [PubMed]
  12. Bustin, R.M.; Guo, Y. Abrupt changes (jumps) in reflectance values and chemical compositions of artificial charcoals and inertinite in coals. Int. J. Coal Geol. 1999, 38, 237–260. [Google Scholar] [CrossRef]
  13. Li, W.; Zhu, Y.; Wang, G.; Jiang, B. Characterization of coalification jumps during high rank coal chemical structure evolution. Fuel 2016, 185, 298–304. [Google Scholar] [CrossRef]
  14. Xin, F.; Xu, H.; Tang, D.; Cao, C. Differences in accumulation patterns of low-rank coalbed methane in China under the control of the first coalification jump. Fuel 2022, 324, 124657. [Google Scholar] [CrossRef]
  15. Liu, Y. Effect of Coal Vitrinite Macromolecular Structure Evolution on Methane Adsorption Capacity at Molecular Level; China University of Mining and Technology: Xuzhou, China, 2019. (In Chinese) [Google Scholar]
  16. Rodrigues, S.; Suárez-Ruiz, I.; Marques, M.; Camean, I.; Flores, D. Microstructural evolution of high temperature treated anthracites of different rank. Int. J. Coal Geol. 2011, 87, 204–211. [Google Scholar] [CrossRef]
  17. Hower, J.C.; Taulbee, D.N.; Rimmer, S.M.; Morrell, L.G. Petrographic and Geochemical Anatomy of Lithotypes from the Blue Gem Coal Bed, Southeastern Kentucky. Energy Fuels 1994, 8, 719–728. [Google Scholar] [CrossRef]
  18. Chen, Y.; Mastalerz, M.; Schimmelmann, A. Characterization of chemical functional groups in macerals across different coal ranks via micro-FTIR spectroscopy. Int. J. Coal Geol. 2012, 104, 22–33. [Google Scholar] [CrossRef]
  19. Gao, B.; Wu, C.; Song, Y.; Zhou, D.; Niu, Q.; Zhou, H.; Jiang, X. Structural characterization of high fidelity for bituminous and semi-anthracite: Insights from spectral analysis and modeling. Fuel 2022, 315, 123183. [Google Scholar] [CrossRef]
  20. Solum, M.S.; Sarofim, A.F.; Pugmire, R.J.; Fletcher, T.H.; Zhang, H. 13C NMR Analysis of Soot Produced from Model Compounds and a Coal. Energy Fuels 2001, 15, 961–971. [Google Scholar] [CrossRef]
  21. Tao, S.; Chen, S.; Tang, D.; Zhao, X.; Xu, H.; Li, S. Material composition, pore structure and adsorption capacity of low-rank coals around the first coalification jump: A case of eastern Junggar Basin, China. Fuel 2018, 211, 804–815. [Google Scholar] [CrossRef]
  22. Lloyd, M.K.; Trembath-Reichert, E.; Dawson, K.S.; Feakins, S.J.; Mastalerz, M.; Orphan, V.J.; Sessions, A.L.; Eiler, J.M. Methoxyl stable isotopic constraints on the origins and limits of coal-bed methane. Science 2021, 374, 894–897. [Google Scholar] [CrossRef] [PubMed]
  23. Mayumi, D.; Mochimaru, H.; Tamaki, H.; Yamamoto, K.; Yoshioka, H.; Suzuki, Y.; Kamagata, Y.; Sakata, S. Methane production from coal by a single methanogen. Science 2016, 354, 222–225. [Google Scholar] [CrossRef]
  24. Hoffmann, K.; Huculak-Mączka, M. The utilization possibility of waste lignite as a raw material in the process of obtaining humic acids preparations. Pol. J. Chem. Technol. 2012, 14, 1–6. [Google Scholar] [CrossRef]
  25. Singh, A.L.; Singh, P.K.; Singh, M.P. Biomethanization of coal to obtain clean coal energy: A review. Energy Explor. Exploit. 2012, 30, 837–852. [Google Scholar] [CrossRef]
  26. GB/T 19222-2003; Sampling of Coal Petrology. China Coal Industry Association: Xi’an, China, 2003.
  27. GB/T 6948-2008; Method of Determining Microscopically the Reflectance of Vitrinite in Coal. China Coal Industry Association: Xi’an, China, 2009.
  28. GB/T 8899-2013; Determination of Maceral Group Composition and Minerals in Coal. China Coal Industry Association: Xi’an, China, 2014.
  29. Solomon, P.R.; Carangelo, R.M. FTIR analaysis of coal. 1. Techniques and determination of hydroxyl concentrations. Fuel 1981, 61, 663–669. [Google Scholar] [CrossRef]
  30. Lu, Y.; Liu, D.; Cai, Y.; Li, Q.; Zhou, Y. Spontaneous imbibition in coal with in-situ dynamic micro-CT imaging. J. Pet. Sci. Eng. 2022, 208, 109296. [Google Scholar] [CrossRef]
  31. Ping, A.; Xia, W.; Peng, Y.; Xie, G. Construction of bituminous coal vitrinite and inertinite molecular assisted by 13C NMR, FTIR and XPS. J. Mol. Struct. 2020, 1222, 128959. [Google Scholar] [CrossRef]
  32. Cui, X.; Yan, H.; Zhao, P.; Yang, Y.; Xie, Y. Modeling of molecular and properties of anthracite base on structural accuracy identification methods. J. Mol. Struct. 2019, 1183, 313–323. [Google Scholar] [CrossRef]
  33. Liu, J.; Luo, L.; Ma, J.; Zhang, H.; Jiang, X. Chemical Properties of Superfine Pulverized Coal Particles. 3. Nuclear Magnetic Resonance Analysis of Carbon Structural Features. Energy Fuels 2016, 30, 6321–6329. [Google Scholar] [CrossRef]
  34. Li, Z.; Wei, X.; Yan, H.; Zong, Z. Insight into the structural features of Zhaotong lignite using multiple techniques. Fuel 2015, 153, 176–182. [Google Scholar] [CrossRef]
  35. Zhou, S.; Liu, D.; Karpyn, Z.T.; Cai, Y.; Yao, Y. Effect of coalification jumps on petrophysical properties of various metamorphic coals from different coalfields in China. J. Nat. Gas Sci. Eng. 2018, 60, 63–76. [Google Scholar] [CrossRef]
  36. Wang, S.; Tang, Y.; Schobert, H.H.; Guo, Y.N.; Su, Y. FTIR and 13C NMR Investigation of Coal Component of Late Permian Coals from Southern China. Energy Fuels 2011, 25, 5672–5677. [Google Scholar] [CrossRef]
  37. Wang, S.; Griffiths, P.R. Resolution enhancement of diffuse reflectance i.r. spectra of coals by Fourier self-deconvolution. Fuel 1985, 64, 229–236. [Google Scholar] [CrossRef]
  38. Liu, X.; Song, D.; He, X.; Nie, B.; Wang, L. Insight into the macromolecular structural differences between hard coal and deformed soft coal. Fuel 2019, 245, 188–197. [Google Scholar] [CrossRef]
  39. Hatcher, P.G.; Clifford, D.J. The organic geochemistry of coal: From plant materials to coal. Org. Geochem. 1997, 27, 251–274. [Google Scholar] [CrossRef]
  40. Solum, M.S.; Pugmire, R.J.; Grant, D.M. 13C solid-state NMR of argonne premium coals. Energy Fuels 1989, 3, 187–193. [Google Scholar] [CrossRef]
  41. Erdenetsogt, B.; Lee, I.; Lee, S.K.; Ko, Y.; Bat-Erdene, D. Solid-state C-13 CP/MAS NMR study of Baganuur coal, Mongolia: Oxygen-loss during coalification from lignite to subbituminous rank. Int. J. Coal Geol. 2010, 82, 37–44. [Google Scholar] [CrossRef]
  42. Olcay Mert, Asgar Kayan, Synthesis of silyliminophenolate zirconium compounds and their catalytic activity over lactide/epoxide. Appl. Catal. A Gen. 2013, 464, 322–331.
  43. Hao, P.; Meng, Y.; Zeng, F.; Yan, T.; Xu, G. Quantitative study of chemical structures of different rank coals based on infrared spectroscopy. Spectrosc. Spectr. Anal. 2020, 40, 787–792. (In Chinese) [Google Scholar]
  44. Liang, H.; Wang, G.; Zeng, F.; Li, M.; Xiang, J. Effect of demineralization on lignite structure from Yinmin coalfield by FTIR investigation. J. Fuel Chem. Technol. 2014, 42, 129–137. (In Chinese) [Google Scholar]
  45. Okolo, G.N.; Neomagus, H.W.J.P.; Everson, R.C.; Roberts, M.J.; Bunt, J.R.; Sakurovs, R.; Mathews, J.P. Chemical-structural properties of South African bituminous coals: Insights from wide angle XRD-carbon fraction analysis, ATR-FTIR, solid state 13C NMR, and HRTEM techniques. Fuel 2015, 158, 779–792. [Google Scholar] [CrossRef]
  46. Zhou, H.; Wu, C.; Pan, J.; Wang, Z.; Niu, Q.; Du, M. Research on Molecular Structure Characteristics of Vitrinite and Inertinite from Bituminous Coal with FTIR, Micro-Raman, and XRD Spectroscopy. Energy Fuels 2021, 35, 1322–1335. [Google Scholar] [CrossRef]
  47. Liang, C.; Liang, W.; Li, W. Functional groups of different coal ranks based on infrared spectroscopy. Coal Sci. Technol. 2020, 48, 182–186. (In Chinese) [Google Scholar]
  48. Wang, C.; Zeng, F.; Li, C.; Xu, Q.; Chen, P. Insight into the molecular structural evolution of a series of medium-rank coals from China by XRD, Raman and FTIR. J. Mol. Struct. 2024, 1303, 137616. [Google Scholar] [CrossRef]
  49. Morga, R. Micro-Raman spectroscopy of carbonized semifusinite and fusinite. Int. J. Coal Geol. 2011, 87, 253–267. [Google Scholar] [CrossRef]
  50. Liu, Y.; Zhu, Y.; Chen, S.; Wang, Y.; Song, Y. Evaluation of Spatial Alignment of Kerogen in Shale Using High-Resolution Transmission Electron Microscopy, Raman Spectroscopy, and Fourier Transform Infrared. Energy Fuels 2018, 32, 10616–10627. [Google Scholar] [CrossRef]
  51. Ulyanova, E.V.; Molchanov, A.N.; Prokhorov, I.Y.; Grinyov, V.G. Fine structure of Raman spectra in coals of different rank. Int. J. Coal Geol. 2014, 121, 37–43. [Google Scholar] [CrossRef]
Figure 1. Sample locations in Ningxia province, China.
Processes 13 01996 g001
Figure 2. 13C NMR spectra of six samples.
Processes 13 01996 g002
Figure 3. Curve-fitted 13C NMR spectra of the six samples.
Processes 13 01996 g003
Figure 4. Analysis of the relationships between Ro and parameters derived from 13C NMR: (a) faP and faS vs. Ro; (b) falH and fal* vs. Ro; (c) faB and faH vs. Ro; (d) fa and fal vs. Ro.
Processes 13 01996 g004
Figure 5. FTIR spectra of six samples.
Processes 13 01996 g005
Figure 6. Curve-fitted aliphatic structure absorption region of the six samples.
Processes 13 01996 g006
Figure 7. Analysis of the relationship between Ro and the area derived from FTIR: (a) correlation between the aliphatic structure area and Ro and (b) correlation between I and Ro.
Processes 13 01996 g007
Figure 8. Curve-fitted oxygen-containing functional group regions of the six samples.
Processes 13 01996 g008
Figure 9. Raman spectra of six samples.
Processes 13 01996 g009
Figure 10. Curve-fitted Raman primary module spectra of the six samples.
Processes 13 01996 g010
Figure 11. XPS spectra of N for six samples.
Processes 13 01996 g011
Figure 12. Curve-fitted N content in the XPS spectra of the two samples.
Processes 13 01996 g012
Table 1. Results of the maximum reflectance experiments and microscopic component analysis.
SampleRo (%)Demineralized Base (%)Containing Mineral Base (%)Standard Deviation
(%)
VitriniteInertiniteExiniteTOCClaySulfideCarbonateSilicon OxideOther
QSY-20.4481.6216.811.5796.980.762.26---0.029
MHJ-100.578.8518.512.6494.594.58-0.83--0.038
YCW-20.582.8795.901.2393.491.530.384.60--0.039
YX-120.6626.1372.731.1495.660.363.98---0.034
JF-180.6821.6973.894.4295.043.820.380.380.38-0.041
HY-50.7477.8213.588.6090.958.23-0.82--0.032
Note: TOC is total organic matter.
Table 2. Structure parameters obtained from the 13C NMR spectra of the samples.
SamplefacfaPfaSfaBfaHfalOfalHfal*faNfafafalXBP
QSY-24.019.1610.899.3032.972.4721.259.9429.3562.3266.3431.190.18
MHJ-104.1610.0111.3815.5232.990.0018.217.7336.9169.9074.0625.940.29
YCW-23.979.757.0826.8240.390.007.934.0743.6484.0388.0012.000.47
YX-122.458.7811.5116.4642.940.0012.075.7836.7579.7082.1517.850.26
JF-182.117.1615.0415.8235.490.0016.308.0738.0273.5175.6224.380.27
HY-52.156.457.4015.6736.570.0020.2611.5029.5166.0868.2431.760.31
Note: fac represents the content of carbonyl and carboxyl carbon; faP represents the content of phenolic hydroxyl or ether oxygen-bonded carbon; faS represents the content of alkyl-substituted aromatic carbon; faB represents the content of aromatic bridged carbon; faH represents the content of protonated aromatic carbon; falO represents the content of oxygen-bonded carbon; falH represents the content of methylene and methine carbon; fal* represents the content of aliphatic methyl and aromatic methyl carbon; faN represents the content of aprotic aromatic carbon; fa represents the content of aromatic nucleus carbon; fa represents the total content of aromatic carbon; and fal represents the total content of aliphatic carbon.
Table 3. Peak assignments and content of each component for the selected samples (%).
AssignmentQSY-2MHJ-10YCW-2YX-12JF-18HY-5
Sym. R2CH222.6422.7725.5526.9328.5228.01
Sym. RCH311.9612.418.006.506.4911.11
R3CH10.859.6413.3915.4213.678.07
Asym. R2CH243.2845.2043.6940.1443.9541.21
Asym. RCH311.279.989.3711.007.3811.60
Table 4. Absorption peaks in regions containing oxygen functional groups and proportions of the selected samples (%).
AttributionQSY-2MHJ-10YCW-2YX-12JF-18HY-5
Ash0.713.742.083.185.138.98
Alkyl ether C-O2.435.662.584.687.3913.67
Aryl ether C-O8.069.1011.777.8211.919.02
Phenol OH31.2128.7725.5134.2927.5525.94
Sym. CH38.104.8111.446.483.542.56
α-CH2 angular vibration11.274.675.5510.094.359.34
CH3CH2 asymmetric deformation vibration3.085.613.672.136.365.08
Aromatic C=C12.9520.4223.8616.0621.1412.50
Conjugated C=O vibration19.5414.3411.2712.909.0112.90
C=O stretching vibration2.652.872.272.373.620.00
Table 5. Central positions of each subpeak and the position differences.
SampleSubpeak Center PositionDifference
(G-D1)
D4D1D3GD2
QSY-21218.091352.681490.471583.261652.00230.58
MHJ-101219.761361.841480.361583.161688.97221.32
YCW-21229.501362.431484.531585.671694.28223.24
YX-121243.511365.901507.041590.321676.24224.42
JF-181231.561357.491500.951585.781665.46228.29
HY-51235.501360.501499.001589.501687.52229.00
Table 6. Proportion of each element in coal.
SampleElemental Proportion (%)
C1sO1sN1sNa1sSi2pAl2pCl2pS2p
QSY-275.8421.80.46/1.77//0.14
MHJ-1073.9723.340.39/2.3///
YCW-276.8321.65//1.52///
YX-1275.5222.710.28/1.48///
JF-1874.6722.111.33/1.89///
HY-574.6321.451.40.252.23//0.05
Table 7. Attribution and relative area ratios of the N element curve-fitting results.
AttributionRelative Area Ratio (%)
PyridinePyrroleProtonated PyridineN-Pyridine Oxide
JF-1811.7453.6517.9916.62
HY-515.9854.4612.5517.01
Disclaimer/Publisher’s Note: The statements, opinions and data contained in all publications are solely those of the individual author(s) and contributor(s) and not of MDPI and/or the editor(s). MDPI and/or the editor(s) disclaim responsibility for any injury to people or property resulting from any ideas, methods, instructions or products referred to in the content.

