Article

Analysis of Sand Production Mechanisms in Tight Gas Reservoirs: A Case Study from the Wenxing Gas Area, Northwestern Sichuan Basin

1
Northwest Sichuan Division of PetroChina Southwest Oil & Gas Field Company, Jiangyou 621700, China
2
State Key Laboratory of Oil and Gas Reservoir Geology and Exploitation, Southwest Petroleum University, Chengdu 610500, China
3
Exploration and Development Research Institute, Sinopec Southwest Oil & Gas Company, Chengdu 610041, China
*
Author to whom correspondence should be addressed.
Processes 2025, 13(7), 2278; https://doi.org/10.3390/pr13072278
Submission received: 9 June 2025 / Revised: 4 July 2025 / Accepted: 10 July 2025 / Published: 17 July 2025
(This article belongs to the Special Issue Advances in Enhancing Unconventional Oil/Gas Recovery, 2nd Edition)

Abstract

In tight sandstone gas reservoirs, proppant flowback severely limits stable gas production. This study uses laboratory flowback experiments and field analyses of the ShaXimiao tight sandstone in the Wenxing gas area to investigate the mechanisms controlling sand production. The experiments show that displacing fluid viscosity significantly affects the critical sand-flow velocity: with high-viscous slickwater (5 mPa·s), the critical velocity is 66% lower than with low-viscous formation water (1.15 mPa·s). The critical velocity for coated proppant is three times that of the mixed quartz sand and coated proppant. If the confining pressure is maintained, but the flow rate is further increased after the proppant flowback, a second instance of sand production can be observed. X-ray diffraction (XRD) tests were conducted for sand produced from practical wells to help find the sand production reasons. Based on experimental and field data analysis, sand production in Well X-1 primarily results from proppant detachment during rapid shut-in/open cycling operations, while in Well X-2, it originates from proppant crushing. The risk of formation sand production is low for both wells (the volumetric fraction of calcite tested from the produced sands is smaller than 0.5%). These findings highlight the importance of fluid viscosity, proppant consolidation, and pressure management in controlling sand production.

1. Introduction

Unconventional oil and gas resources are widely distributed across the globe and have become a vital area for future hydrocarbon exploration. The tight sandstone gas reservoirs in the Sichuan Basin is a typical example of China’s unconventional resources. Significant breakthroughs have recently been made in clastic formations such as the Upper Triassic Xujiahe Formation and the Middle Jurassic Shaximiao Formation, demonstrating great exploration potential. In hydraulically fractured gas wells, high production rates and flow velocities often lead to proppant flowback, which can damage the reservoir, impair well performance, and even cause equipment failure. Accumulated proppant at the wellbore may bury the gas-bearing zone and hinder production. Compared to shale gas wells, tight gas wells typically exhibit simpler bi-wing fracture geometries and higher initial production rates, making them more susceptible to severe sand production issues [1]. The accumulated proppant at the bottom of the well can bury the gas-bearing formation, obstructing gas flow and hindering sustained production. Hydraulic fracturing is an effective method for enhancing production, but proppant flowback during well cleanup and production remains a potential challenge that affects field performance. These include insufficient closure stress during fracturing design, which may lead to weak proppant embedment, and overly aggressive initial production rates that exceed the critical flow velocity. Both conditions can reduce fracture stability and increase the likelihood of proppant mobilization during early production [2].
Proppant flowback has attracted increasing attention in recent years due to its impact on fracture conductivity, production performance, and operational costs. Numerical simulations have provided valuable insights into both particle-scale interactions and field-scale behavior. Coupled computational fluid dynamics–discrete element method (CFD-DEM) simulations have clarified how proppant particle properties and secondary flow channels influence the critical flowback velocity by altering local hydrodynamics [3]. New modeling approaches incorporating tracer transport behavior and equivalent conductivity have improved representations of fracture complexity, especially in multi-cluster systems [4]. Further simulation results indicate that the proppant pack continues to bear closure stress even under natural or forced shut-in conditions, which impacts long-term stability [5]. Studies have also introduced modified drag coefficient correlations that account for wall effects on particle movement in bidirectional flows [6]. Thermal–hydraulic–mechanical coupling models have been applied to assess the impact of closure stress, fluid viscosity, and flowback rate, suggesting that maintaining fluid viscosity below 20 mPa·s and fracture flow rate under 240 m3/d can mitigate proppant flowback [7]. Particle-bridging-based analytical frameworks have offered predictive tools to evaluate arch formation and pack mobilization [8]. Numerical modeling techniques are increasingly used to simulate proppant behavior under complex flow and stress conditions. For example, by using coupled hydraulic–mechanical simulation, the problems of fracture redirection and flowback control in coalbed methane wells were analyzed, thereby providing reference suggestions for the placement strategy of proppants at the field scale [9]. Recent modeling efforts have introduced continuum-based frameworks to simulate proppant transport in fractures, incorporating effects such as settling, hindered migration, and bed erosion [10]. Integrated approaches have also been proposed to couple flowback velocity, settling behavior, and pressure control to maintain flow rates below critical thresholds [11]. In complex fracturing scenarios, coupled mechanical–fluid models have been used to predict fracture geometry evolution and proppant distribution across single- and multi-well systems [12]. Discrete element method (DEM)-based models have further demonstrated that higher confining stress and proppant cohesion enhance pack integrity and reduce flowback risk [13].
Experimental studies have complemented simulations by replicating flowback processes under controlled conditions. Modified American Petroleum Institute (API) conductivity cells have been used to quantify the effects of closure pressure, flow rate, and fluid rheology on proppant retention in both steel and natural rock fractures [14]. Parallel-plate and visual fracture models have demonstrated how geometry, pack structure, and fluid properties affect flowback behavior, with observations showing that increased fiber concentration and optimal fiber length significantly raise the critical flowback velocity [15]. Experiments using custom-built flow cells have emphasized the importance of early-stage flow control to prevent rapid pack destabilization [16]. Triaxial and large-scale flowback simulations have revealed that higher closure pressure, when not matched by sufficient tail-in proppant or fiber support, can trigger sand production [17]. Furthermore, recent experiments have confirmed that using a higher ratio of coarse tail-in proppant helps resist mobilization under high-stress conditions [18]. Large-scale visual fracture simulators have also been developed to study the influence of pumping rate, particle size, viscosity, and fracture geometry, with results validating the application of hydraulic similarity principles in conductivity prediction [19].
Key influencing factors have been identified through both modeling and laboratory work. The onset of proppant flowback is mainly governed by fluid drag overcoming interparticle friction and wall constraints, a threshold typically described as the critical flowback velocity [20]. Closure pressure has a dual effect: while moderate increases improve pack stability, excessive closure may lead to grain crushing or embedment, resulting in fines migration and pack degradation [21]. Geometric parameters, particularly the width-to-diameter (w/d) ratio, play a central role—the proppant usually is stable when the w/d is less than 2.5 [22]. Proppant properties such as sphericity, angularity, and resin coating strongly influence resistance to flowback, with angular or coated materials offering greater mechanical interlocking. Additionally, low-viscosity fluids, optimized fiber-reinforced systems, and tailored pumping schemes can all enhance pack cohesion and mitigate early-stage mobilization [23].
In tight gas formations, fracture conductivity is highly sensitive to proppant type and closure stress, particularly due to the crushing and embedment of sand under high-stress conditions [24]. To balance cost and conductivity, hybrid designs combining sand and ceramic proppants are often employed, with injection sequences adjusted based on stress profiles along the fracture [25]. Several empirical and semi-empirical models have been proposed to predict fracture conductivity, yet most focus on uniform proppant types and do not account for time-dependent crushing or mixed-material behavior [26]. Recent laboratory studies have proposed empirical models that relate the optimal sand-to-ceramic ratio to closure stress conditions, providing a useful reference for designing fracturing strategies in tight gas formations with varying reservoir depths [27].
Though many numerical and experimental works on proppant flowback have been conducted, direct analysis of field wells with theoretical studies is still lacking. In this work, different kinds of experiments, such as flowback tests and X-ray diffraction (XRD) tests for produced sand, were conducted to analyze the causes of sand production for practical wells. Wells such as WQ201, GQ1, and W1 all experienced varying degrees of sand production during the production stages, and the reasons were systematically analyzed. Such a systematic, multi-factor analysis of sand-producing wells can help better understand the sand production behavior, as well as optimize production strategies.
In contrast to previous studies, which primarily focused on single-variable assessments of critical sand production velocity, this work incorporated a combination of factors, including confining pressure, fluid viscosity, reservoir lithology, and proppant placement method, to systematically examine their coupled effects. Notably, under sustained confining pressure displacement, a secondary proppant flowback phenomenon was observed following the initial critical velocity threshold—an effect that has rarely been emphasized in earlier experimental investigations.
Furthermore, to bridge laboratory findings with field-scale behavior, a series of XRD analyses were conducted on sand samples collected at different production stages. These results enabled the differentiation between sand produced due to mechanical crushing and that caused by operational factors such as frequent shut-in and restart cycles. The derived empirical model showed good agreement with actual field data, confirming the dependence of critical flow velocity on in situ effective stress conditions. Compared with existing literature, this integrated experimental–field approach offers a more comprehensive understanding of the mechanisms driving sand production in tight gas reservoirs.

2. Experimental Methodology

2.1. Sample Preparation and Experimental Parameters

The 1st, 4th, and 5th sand bodies of the Sha-1 Member in the Zitong Block, Sichuan Basin, are buried at depths of 2800 to 4500 m. The measured formation pressure is 33.31 MPa, with a pressure coefficient of 1.19 and an average reservoir temperature of 82.46 °C, indicating a normal-pressure, normal-temperature gas reservoir. To replicate the formation conditions in the laboratory, core samples from the Wenxing gas area and corresponding outcrop rocks were cut, split, and polished into API-style conductivity plates. Because the causes of field sand production are unclear and difficult to observe directly, laboratory experiments using API-standard rock plates under simulated reservoir conditions were conducted to investigate key influencing factors. The effects of confining pressure, rock-plate type, displacing fluid viscosity, and proppant placement method on the critical sand production velocity were systematically evaluated. The experimental workflow is illustrated in Figure 1. The reservoir conditions used in the experiment, including depth, porosity, permeability, etc., are summarized in Table 1. The test utilized an API cell with dimensions of 17.78 cm (length) × 3.81 cm (width) × 2.5 cm (thickness), as illustrated in Figure 2a. The corresponding API conductivity cell provides a flow area of 64.52 cm2. The main minerals in the outcrop rocks are quartz, accounting for 69.9–77%, with a relatively high content of clay at 22–26.7%. The content of carbonate minerals is mainly around 3%, while the content of feldspar is no more than 1%.
For the tight gas reservoir of the Sha-1 Member, field data from fracturing and flowback operations were collected to design experimental parameters under various influencing factors:
(1) Two types of proppants were used: 40/70-mesh coated quartz sand and 70/140-mesh quartz sand proppant, with average particle sizes of 0.32 mm and 0.16 mm, respectively (Figure 2b and Table 2).
(2) To investigate the effects of closure stress on proppant flowback, the experiments were conducted under three different closure pressures: 20, 40, and 60 MPa.
(3) The proppant placement concentration was set at 5 kg/m2, based on average field fracturing parameters.
(4) The average viscosity of field flowback fluid was measured to be 1.05 mPa·s. A synthetic displacement fluid was prepared in the lab based on the ion concentration data from the Wenxing gas area, to replicate the in situ fracture fluid conditions.
In addition, a type I slickwater with a viscosity of 5 mPa·s was used for comparison in the high-viscosity displacement experiments. The two fluids used in the tests—slickwater and formation water—have distinct rheological characteristics that affect proppant transport and flowback behavior. Slickwater is a non-Newtonian, shear-thinning fluid, whereas formation water behaves as a Newtonian fluid with constant viscosity. The basic properties of both fluids, including viscosity and density, are summarized in Table 3 for clarity and comparison.

2.2. Experimental Conditions and Procedures

Comparative experiments on critical sand production velocity were conducted using API cells. A fixed overburden pressure was applied according to the test design, with constant confining pressure maintained. The applied overburden pressure was set in the vertical downward direction, consistent with the minimum principal stress in the reservoir. All tests were performed at room temperature. The API cell was subjected to constant-rate displacement. Confining pressures of 20, 40, and 60 MPa were applied in the tests, based on typical ranges of effective stress derived from the difference between reservoir pore pressure and minimum principal stress. These levels simulate field-representative closure conditions for evaluating proppant stability. Once stabilized, the flow rate was increased step by step at fixed intervals. After each increment, the flow was maintained for the same duration before proceeding. To ensure consistency in experimental results, each flow rate increment was maintained for the same duration, allowing the proppant to stabilize and avoiding flow-induced disturbances. The flow rate was increased in increments of 0.5 mL/min to ensure a reliable determination of the critical sand production velocity. This increment was selected as a compromise between resolution and experimental efficiency. Although smaller increments (e.g., 0.1 mL/min) could provide finer resolution, they would significantly extend the test duration. The chosen increment allows sufficient sensitivity while remaining within the practical capabilities of the experimental pump system.
The process continued until significant sand production was observed, at which point the corresponding flow rate was defined as the critical sand production velocity for the API cell. During the experiment, the pressure differential across the displacement pump was monitored, and an electronic scale was used to continuously record the mass of the sand-laden fluid at the outlet. The onset of large-scale sand production was identified by a sharp increase in the mass curve.
A series of proppant flowback experiments were conducted using various combinations of closure pressure, API cell type, proppant grain size, placement method, and flowback fluid viscosity, in order to evaluate their effects on proppant transport. The experimental procedure was as follows:
(1)
The split API cells were installed into the flow chamber. Quartz sand proppant with different mesh sizes was placed between the plates at a concentration of 5 kg/m2 to form an initial propped fracture. A hydraulic press was used to apply the target closure stress, and the fracture width was recorded once the pressure stabilized.
(2)
The heaters on the preheater, intermediate container, and flow chamber were turned on. The system was heated to the target test temperature and maintained under constant thermal conditions.
(3)
A constant-rate, constant-pressure pump was started at an initial flow rate of 5 mL/min to inject preheated flowback fluid from the intermediate container into the flow chamber, fully saturating the API cells and proppant pack.
(4)
The outlet valve of the chamber was opened, and the proppant filter was removed to collect any proppant particles forced out by the applied pressure.
(5)
The injection rate was gradually increased in steps of 0.5 mL/min until proppant flowback was observed at the outlet. The flow rate was then stabilized until no additional flowback occurred.
(6)
The real-time weight of the sand-laden fluid was recorded using data acquisition software. By subtracting the known fluid mass, the change in sand mass versus displacement rate was obtained.
(7)
The critical sand production rate was converted into a critical sand production velocity using a defined equation.

3. Results and Discussion

3.1. Experimental Results and Analysis

Flowback experiments were conducted under simulated reservoir conditions to systematically investigate how displacing fluid viscosity, API cell lithology, and proppant placement method affect the critical sand production velocity. API cells were used for the conductivity experiments, and the measured critical flow rates were converted into critical sand production velocities within the fracture using the following equation [19]:
v g = Q 10 6 × 60 × w d 1000
where vg is the critical sand production velocity, m/s. Q is the volumetric flow rate of fluid, mL/min; w is the width of API cell, m; and d is the fracture aperture, mm.
A summary of the critical sand production velocities measured under various conditions is presented in Table 4 to support the above analysis. Based on logarithmic fitting of the experimental data under varying confining pressures, a quantitative relationship between critical sand production velocity and effective stress was established, as expressed in Equation (2). A logarithmic fit of the initial critical sand production velocity under varying confining pressures yielded the following empirical equation. This expression enables rapid estimation of the critical water production velocity under different downhole stress conditions and serves as a foundation for calculating field-scale critical production rates. The effective stress σn′ used in Equation (2) corresponds to the applied confining pressure and was derived by correlating it with the measured critical flow velocity under each test condition.
v l = f ( σ n ) = 0.0081 ln ( σ n ) 0.0234
where σn′ is the effective stress differential in the reservoir, MPa; and vl is the critical water production velocity.
An analysis of the data in Figure 3a shows that both reducing the confining pressure and increasing the viscosity of the displacing fluid significantly reduce the critical sand production velocity in fractures. For the outcrop API cell at 60 MPa confining pressure, the critical velocity was 0.0034 m/s using 1.15 mPa·s formation water but increased to 0.0101 m/s with 5 mPa·s slickwater due to enhanced viscous drag resisting proppant dislodgement. Meanwhile, at 40 MPa, the formation API cell exhibited 13.6% higher critical velocity than the outcrop sample, attributable to its greater surface roughness and authigenic cementation that strengthened mechanical anchoring.
The proppant placement experiments demonstrated that coated proppant offers the best sand control performance. The critical velocity for pure coated sand reached 0.0027 m/s, which is three times higher than that of mixed placement. In addition, the sand production mass exhibited a nonlinear increase with flow rate. Figure 3b illustrates the variation in critical sanding velocity under different sand packing configurations. Three packing types were compared: hybrid packing (4:1 sand to coated sand mixture), layered packing (4:1, with coated sand forming a surface barrier), and pure coated sand. The results show a clear increasing trend in critical sanding velocity from hybrid to layered to fully coated configurations. This indicates that the use of resin-coated sand—whether partially or fully—enhances the stability of the proppant bed and raises the velocity threshold for flowback initiation. The layered structure appears to provide a moderate strengthening effect, while fully coated sand offers the most resistance to destabilization (Figure 4). During the experiment, coated sand partially agglomerated upon contact with formation water and consolidated under overburden pressure. This consolidation effectively blocked and restrained the migration of uncoated quartz proppant at the fracture front, which is one of the key reasons for the higher critical sand production velocity observed.
It was also observed that as the displacement rate increased during the experiment, a significant volume of proppant particles was mobilized once the flow rate reached the critical threshold specific to the API cell under given conditions. This stage was accompanied by a drop in confining pressure, which was caused by the internal stress redistribution resulting from proppant migration. As the displacement rate continued to increase, a portion of the compacted proppant was once again mobilized by the fluid, indicating that the flow rate had reached or exceeded a new critical velocity under the modified conditions. We consider this to be a secondary sand production phenomenon. The onset of secondary sand production in the tests was identified by a distinct steepening in the slope of the cumulative sand mass curve (Figure 5). This sharp increase indicates the destabilization of the proppant bed and the re-initiation of sand flowback under continuous flow conditions. It should be noted that the timing of sand observed at the outlet may not perfectly coincide with the actual moment of proppant detachment within the fracture. The use of real-time measurement tools can help minimize this lag and improve the accuracy in identifying the critical flow velocity associated with secondary sand production.

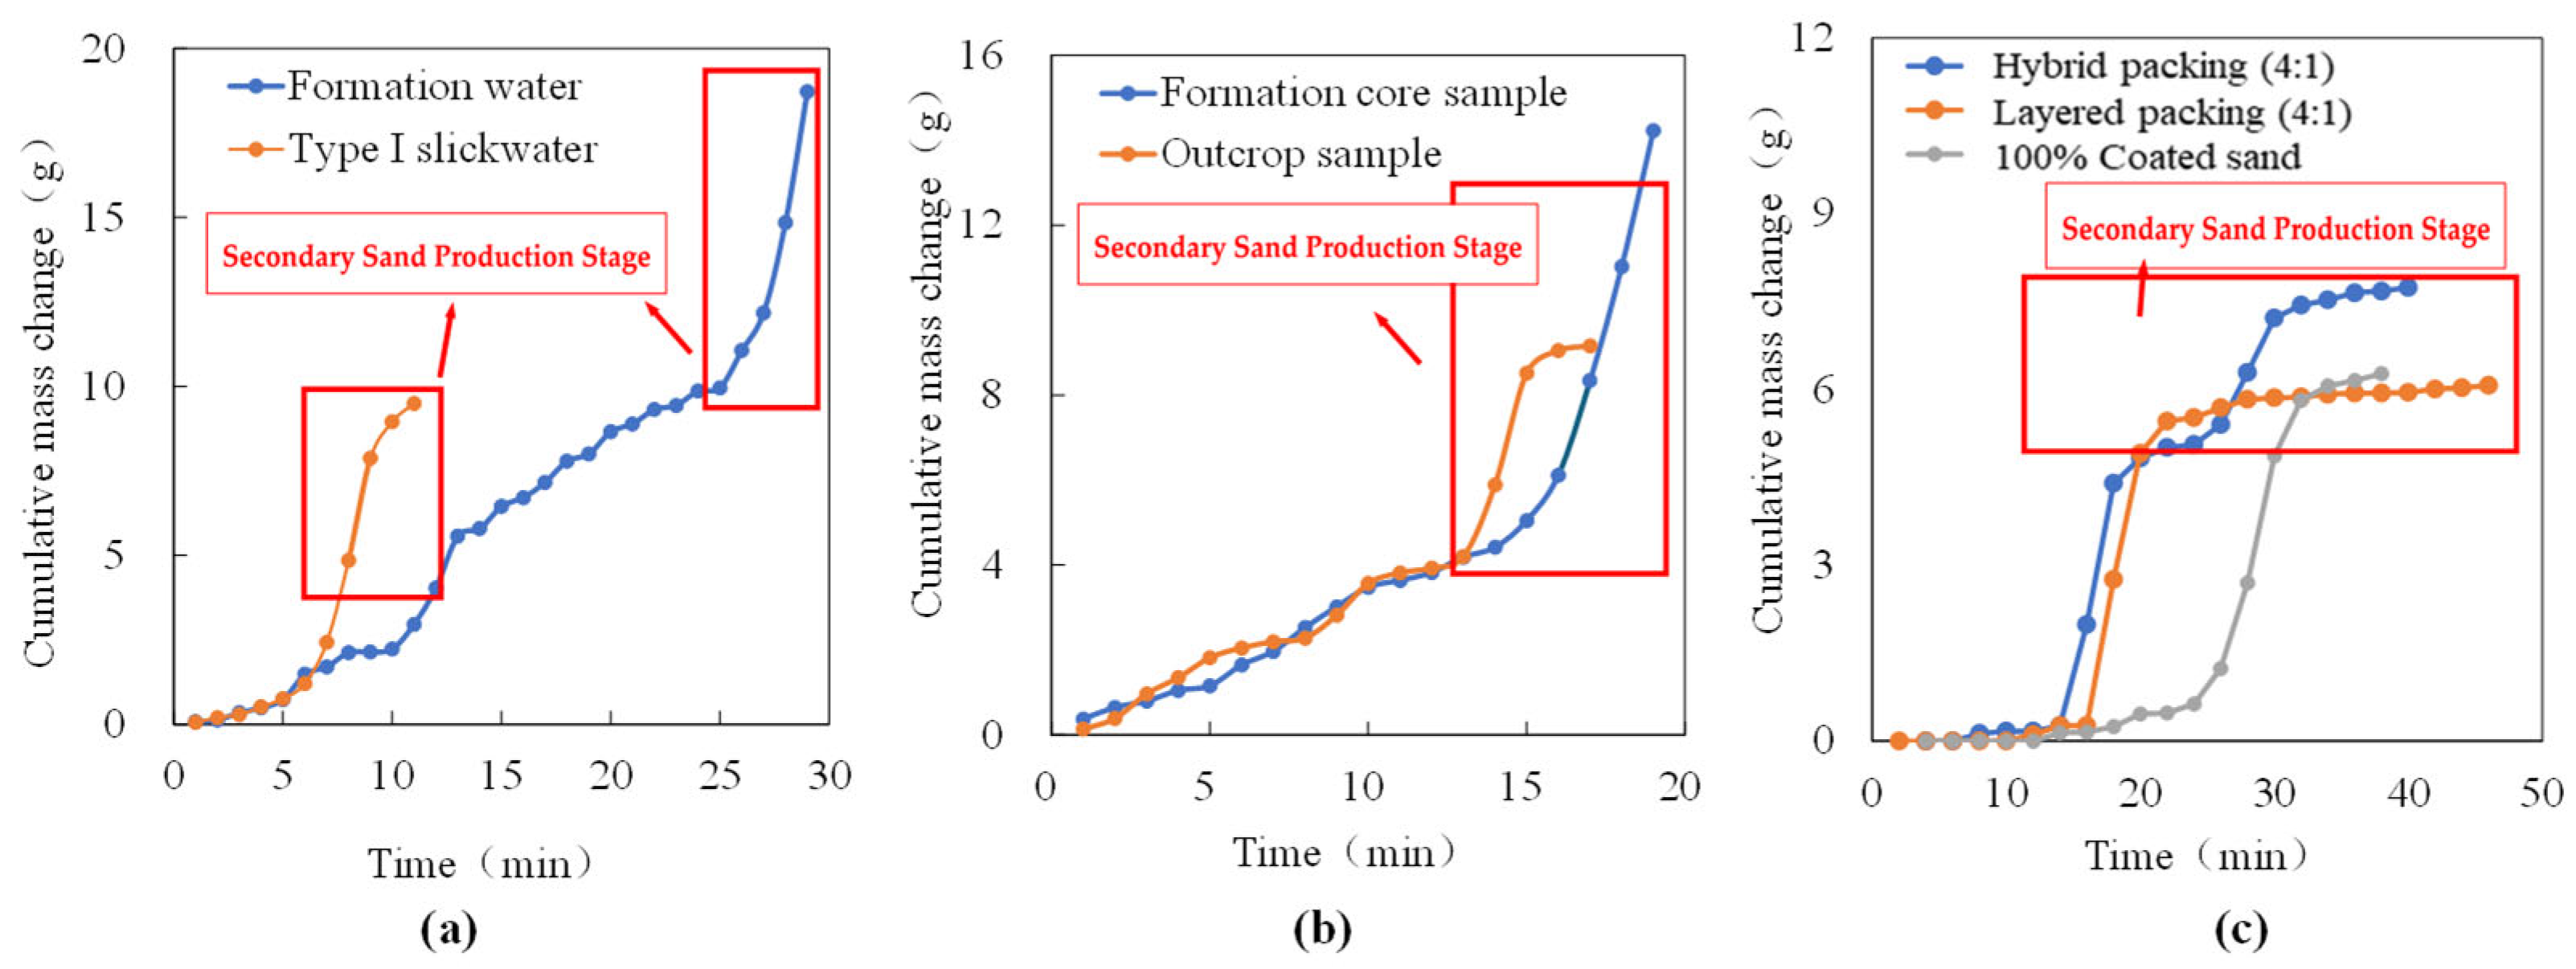
3.2. Mechanism of Secondary Sand Production

As mentioned above, in the proppant displacement experiments, a secondary sand production phenomenon was observed. The cumulative sand mass curve exhibited two sharp increases over time. When the displacement rate approached the critical threshold, the initial sand production surge was significantly greater than the subsequent one. This behavior can be attributed to several key mechanisms [28]:
During the experiment, as the displacement rate increased, a substantial quantity of proppant began to be mobilized once the flow rate exceeded the critical sand production threshold of the API cell. This stage was accompanied by a reduction in confining pressure, caused by internal stress redistribution as the proppant was removed. To simulate in situ reservoir conditions and maintain test consistency, manual pressure was applied to stabilize the confining stress. During this period, the fracture aperture near the outlet of the core gradually narrowed under the applied pressure, leading to the reconsolidation of the remaining proppant and the formation of a new mechanically stable structure. However, as the displacement rate continued to rise, a portion of the compacted proppant was again mobilized by the fluid. This indicates that the flow rate had reached or exceeded a new critical threshold under the altered stress conditions.
Figure 6 provides a schematic of the sand production process. Figure 6a shows the initial uniform distribution of proppant particles. Figure 6b,c depict the early-stage migration of loosely packed proppant as the displacing fluid is introduced. Once the flow rate reaches the critical threshold, a large volume of proppant is mobilized from the cylindrical core, accompanied by a drop in confining pressure. Figure 6d shows the narrowing of the fracture aperture and re-compaction of proppant under manually restored confining pressure. Figure 6e,f illustrate the remobilization of partially compacted proppant as the flow rate continues to rise, indicating a second phase of sand production.

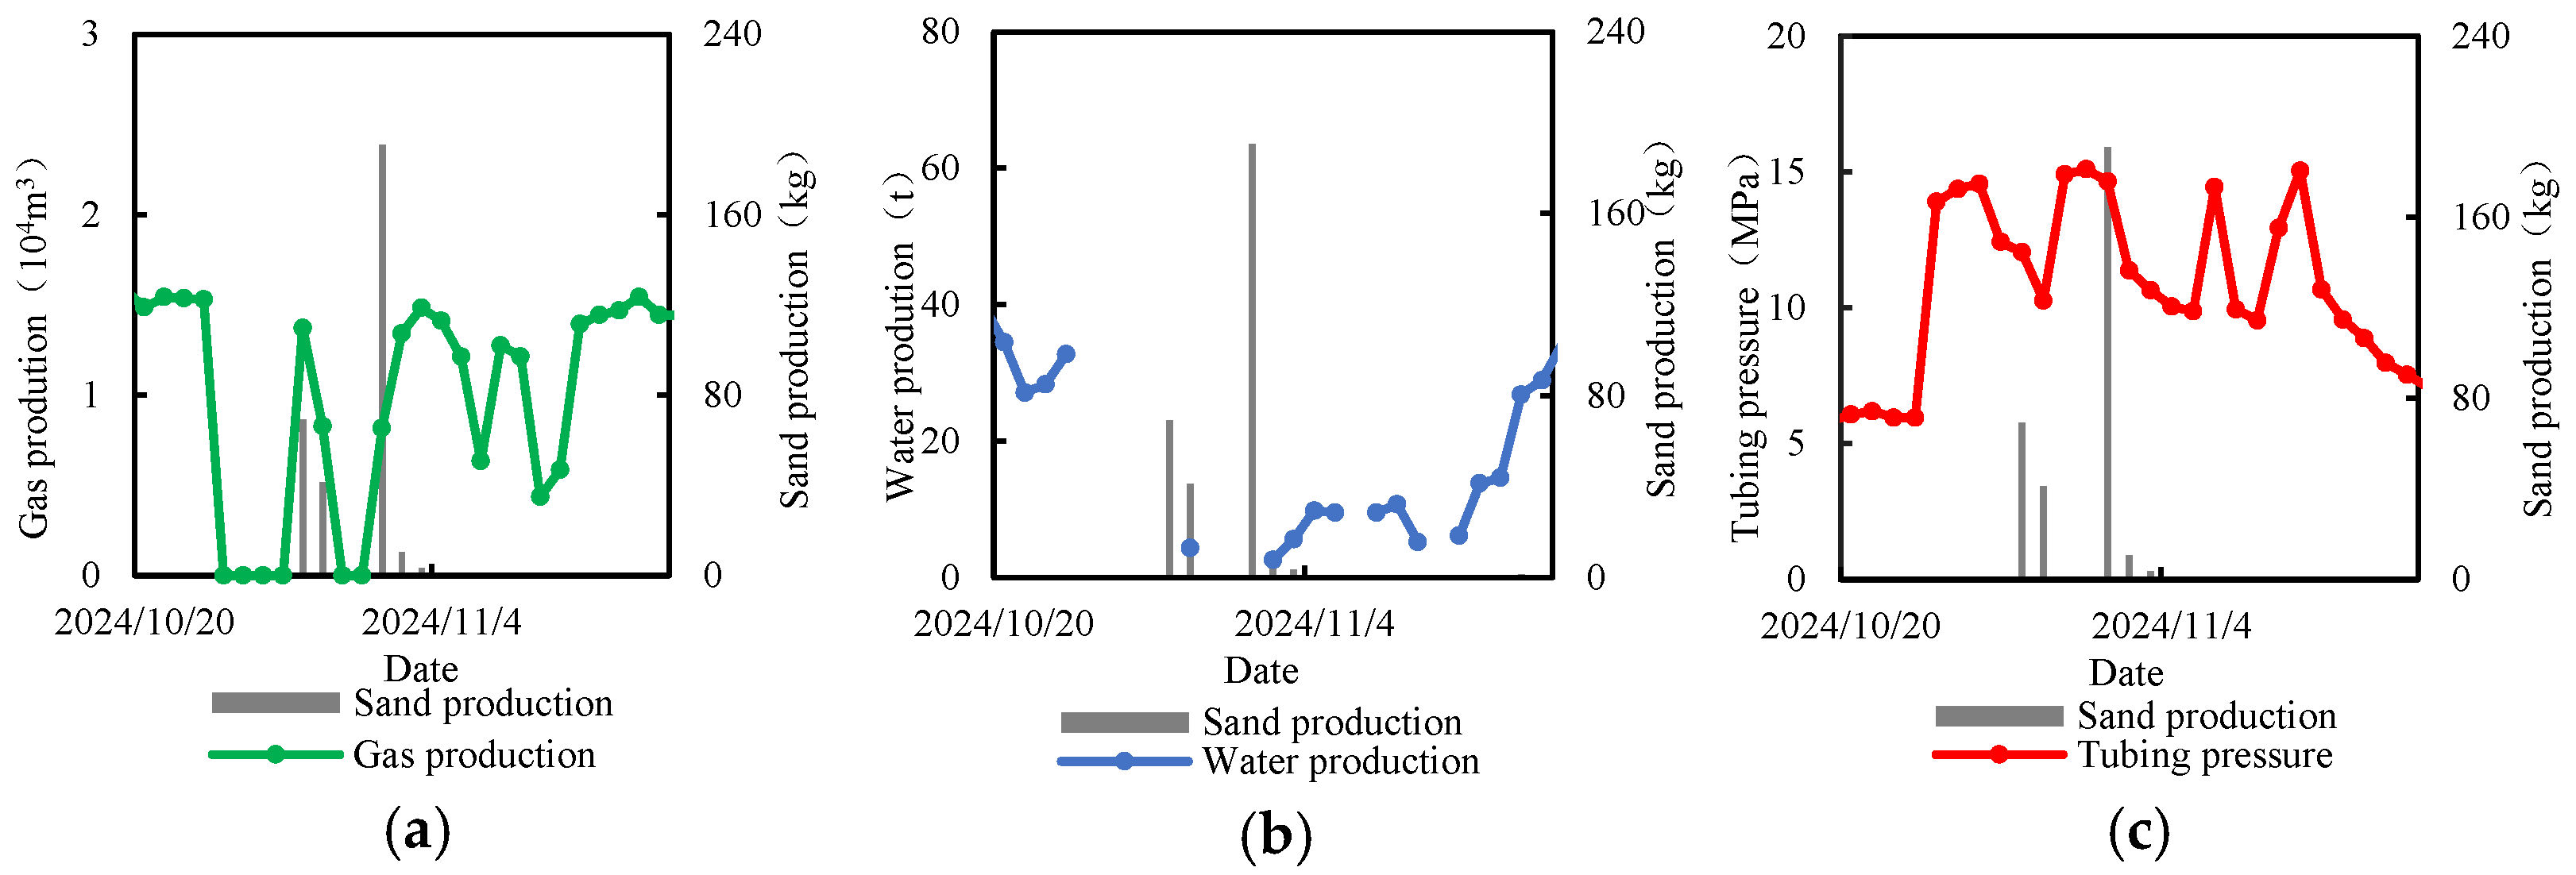
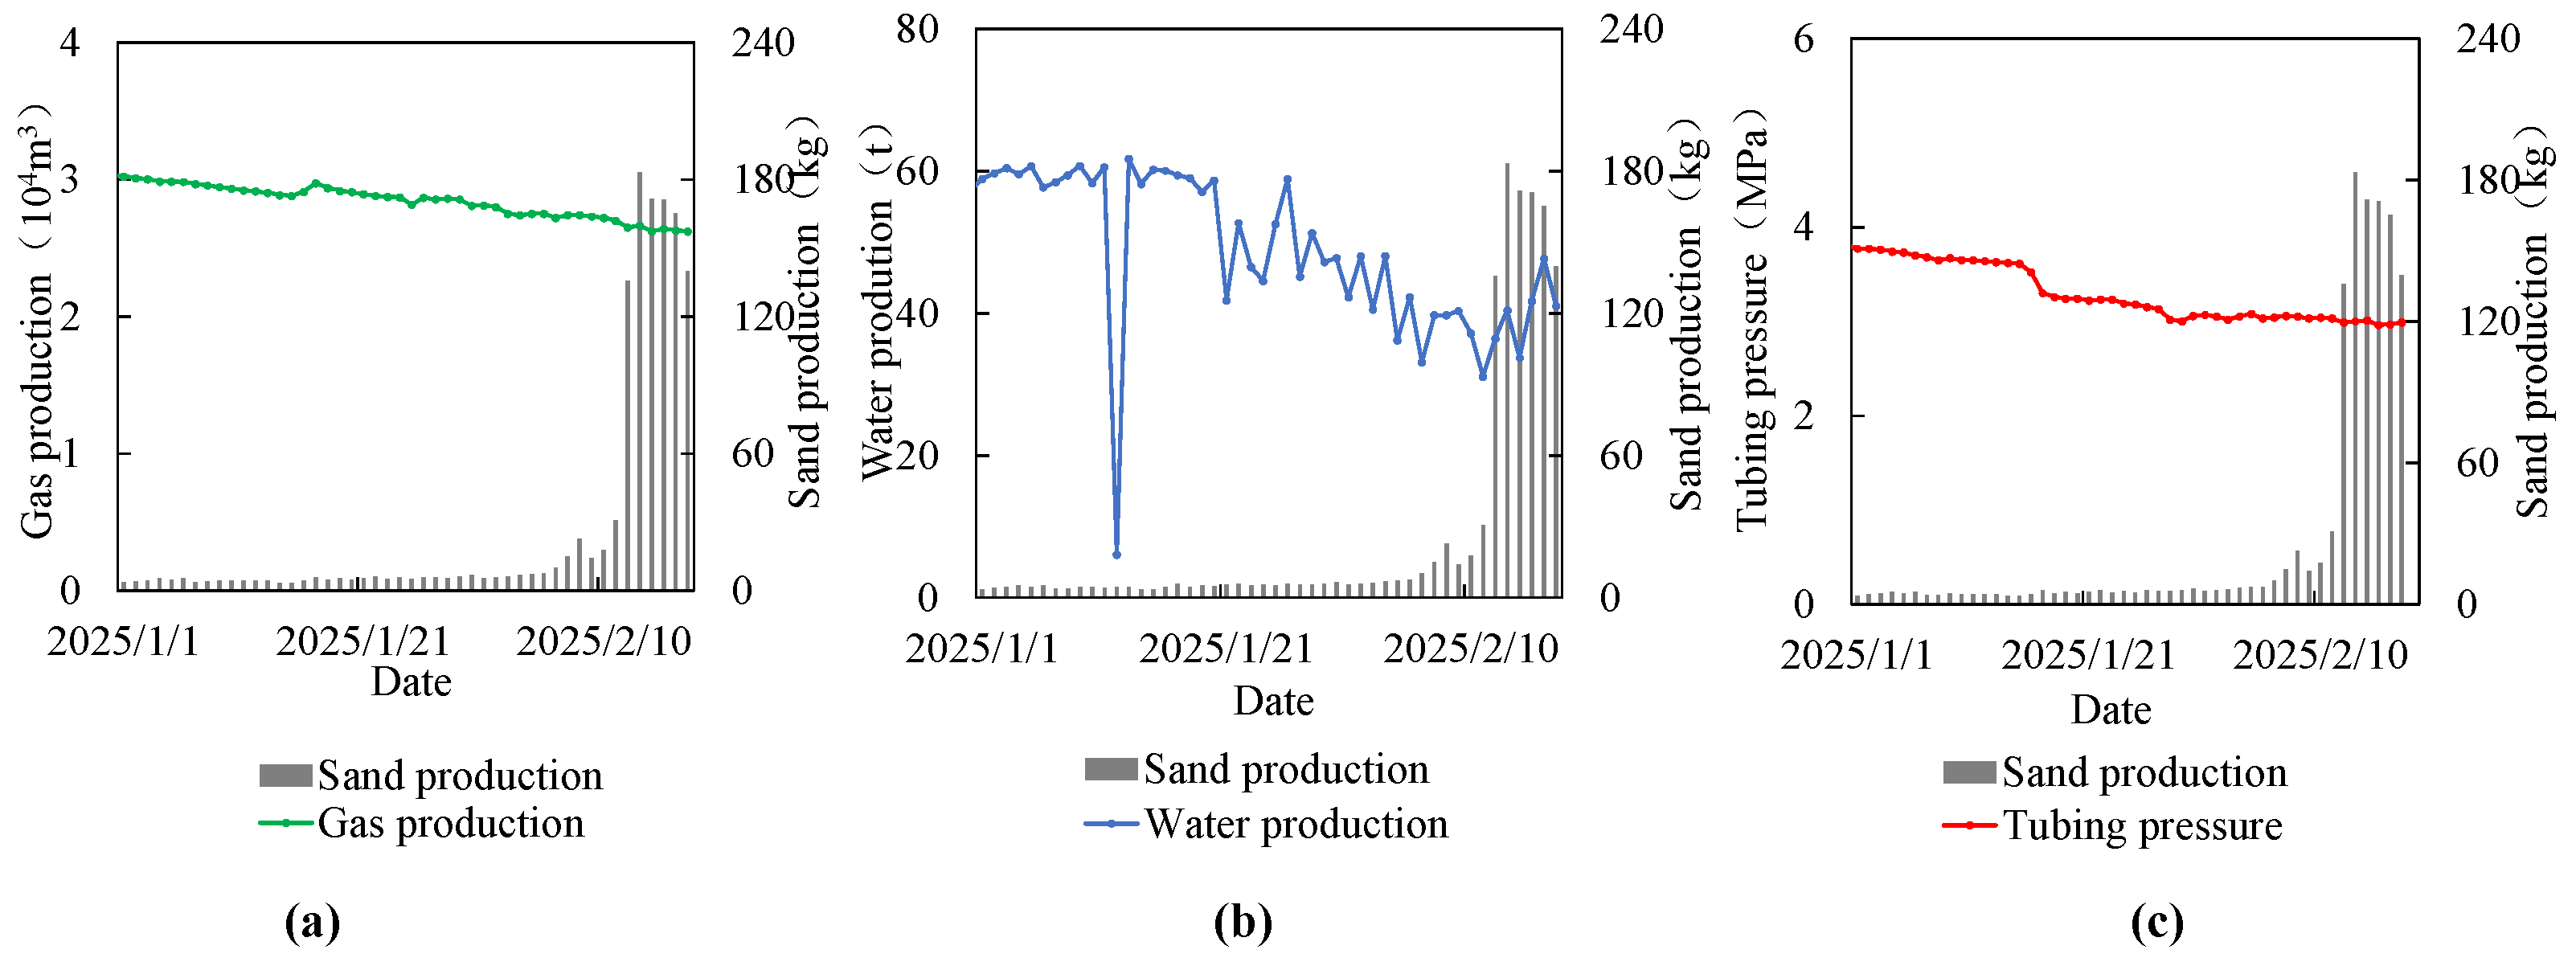
3.3. Analysis of Sand Production Mechanisms in Field Wells

To further investigate the mineralogical origin of sand production, XRD analysis was performed on sand samples collected from two production wells. The tests were conducted using a SmartLab SE multi-functional high-precision diffractometer (Rigaku Corporation, Tokyo, Japan), which enables accurate phase identification and quantitative mineral analysis. The results were used to compare the composition of the produced sand with that of the in situ formation, providing key insights into whether the sand originated from formation breakdown or proppant flowback. This mineralogical evidence supports the subsequent interpretation of the causes and mechanisms of sand production observed in the field.
The tight gas reservoir in the northwestern Zitong Block is mainly hosted in the Sha-1 Member, characterized by deltaic deposition. The formation displays evident heterogeneity in its petrophysical properties. In this area, the Shaximiao Formation reservoir rocks predominantly consist of medium- to fine-grained lithic feldspathic sandstones and feldspathic lithic sandstones. Minor lithologies include feldspathic sandstones, silty mudstones, and silty claystones. The quartz content in the dominant sandstone types typically ranges from 40% to 65%, while feldspar accounts for 15% to 30%, primarily plagioclase. Potassium feldspar and calcite are present in small amounts, each contributing less than 10% (Figure 7).
Sand production has been observed to varying degrees across several wells in the production block, though its underlying causes remain poorly understood. In this study, two typical hydraulically fractured horizontal wells, X-1 and X-2, from the Sha-1 Member were selected for analysis of sand production mechanisms and estimation of critical production thresholds.
The proppant flowback samples from Well X-1, collected in April and June 2024, showed that fine particles sized 140 to 200 mesh consistently accounted for less than 4% of the total mass, indicating minimal proppant degradation (Figure 8). In June, the proportion of coarse particles in the 40 to 70 mesh range increased significantly. Mineralogical analysis revealed the presence of 12.5% calcite—which was not part of the original proppant—along with 18.8% plagioclase and 33.9% potassium feldspar. These results suggest that rock fragments from the formation near the wellbore were mobilized and entered the return flow. In addition, a slight rise in the proportion of medium-sized particles (70 to 140 mesh) further indicates partial proppant crushing during production.
Proppant analysis from Well X-2 (Figure 9) revealed a consistent dominance of quartz sand (>90%) with negligible impurities—less than 1% clay and feldspar, and only 0.4% calcite—indicating minimal formation rock involvement. Between April and October 2024, the proportion of 70/140 mesh particles increased by 15%, while finer 140–200 mesh fractions dropped by 20%, suggesting that the loss of 40/70 mesh coated proppant near the well weakened fracture support, promoting the crushing of smaller particles. By January 2025, ultra-fine sand (>140 mesh) made up 78% of the return sample, with quartz purity over 98%, pointing to continued mechanical breakdown during production.

3.4. Analysis of Sand Production Factors

As illustrated in Figure 8a, sand production from Well X-1 primarily consisted of intact quartz proppant with minor amounts of formation debris, indicating limited proppant breakage. Figure 10c highlights that repeated shut-in cycles during production testing led to pressure fluctuations. During shut-in periods, formation pressure gradually increased, loosening the proppant pack. When the well was reopened, the sudden drop in bottomhole pressure created an imbalance that triggered proppant mobilization. These operational cycles may induce sand migration even when the flow rate remains below the critical threshold, as loosened proppant within pores and fractures can be displaced by minor fluid disturbances.
As shown in Figure 9, the analysis of sand samples from Well X-2 at different time intervals revealed a notable decrease in the 40/70 mesh fraction and an increase in the 140/200 mesh particles, indicating continuous proppant crushing in the fractures surrounding Well X-2 during production. Formation data for X-2 show that the minimum principal stress in the formation ranges from 66.96 to 85.66 MPa. The effective stress, calculated as the difference between the minimum principal stress and the pore pressure, was estimated to range from 38.76 to 43.83 MPa—above the compressive strength of quartz proppant (35 MPa). As a result, the quartz proppant undergoes crushing and size reduction during production, weakening its resistance to fluid drag, which leads to significant sand production. In contrast, coated quartz proppant exhibits lower breakage and remains largely intact within the formation. Despite relatively stable wellhead pressure and consistent gas production, a sudden surge in proppant flowback occurred, as shown in Figure 11.

3.5. Critical Sand Production Velocity Model

Following the physical simulation and experimental study of critical sand production velocity in fractures, a predictive model was developed to estimate critical sand production velocity and output based on actual well parameters, with the aim of applying these findings to field-scale risk assessment. Using Well X-1 as a case study, the equivalent critical sand production velocity and corresponding gas output were estimated through the following steps, incorporating wellbore geometry and fracturing data.
Bottomhole flowing pressure (Pw) was obtained through production data inversion. Combined with initial pore pressure (P0) and minimum principal stress (Shmin0), the normal effective stress applied on the fracture surface (σn′) was calculated. During the production process, the original minimum horizontal stress is the stress applied normal to the fracture. According to the poroelasticity theory in sedimentary rocks, the decrease in minimum horizontal stress is approximately 0.5~0.7 of the pore pressure changes [29]. Thus, the total stress applied on the fracture is estimated using
σ n = S hmin 0 β ( P 0 P w )
where Shmin0 is the minimum horizontal principal stress, MPa; σn is fracture total stress, MPa; β is the formation pressure coefficient, taken as 0.7; Pw is the bottomhole flowing pressure, MPa; and P0 is the initial pore pressure, MPa.
Once the critical sand production velocity vl is determined, it can be used in combination with field parameters—such as wellbore diameter, number of fracturing stages, number of clusters per stage, and fracture width—to estimate the corresponding critical water and gas production rates per unit time by assuming that the fluid is equally produced from all fractures. The equations for liquid and gas production rate are as follows:
Q l = π v l d wellbore w f N stage N cluster
Q g = π v l d wellbore w f N stage N cluster P f μ g P atm
where Ql is the critical water production rate, t/d; Qg is the critical gas production rate, 104 m3/d; dwellbore is the wellbore diameter, m; wf is the fracture aperture, m; Ncluster is the number of perforation clusters; Nstage is the number of fractures per cluster; Pf is the formation pressure, MPa; μg is the gas viscosity, mPa·s; and Patm is the atmospheric pressure, MPa.
To account for the impact of gas–liquid multiphase flow on critical sand production velocity, an effective viscosity model was introduced. The mixed-phase viscosity μm was calculated using volume-fraction-weighted averaging of gas and liquid phases. Based on the experimental findings, the coupling effect between viscosity and single-phase velocity was incorporated to estimate the critical gas-phase velocity under multiphase conditions [30].
v e = f x f v
where ve is the equivalent critical sand production velocity under gas–liquid flow, m/s; xf is the volume fraction of a single phase; and v is the critical velocity for single-phase flow, m/s.
The proposed model offers both theoretical and methodological support for calculating the critical flow rate and output of Well X-1 under field conditions. By incorporating actual reservoir properties, fracturing scale, and production data, this approach enables the quantitative evaluation and early warning of potential sand production events.

4. Discussion

Based on the experimental model of critical sand production velocity and the assumption of fully open perforations, a field-scale application was conducted using actual bottomhole pressure data from Well X-1 and the fitted relationship between critical sand production velocity and confining pressure (Figure 12). A comparison with historical production data confirmed that the model accurately defines the sand production threshold. When daily gas production exceeds this limit, the fluid velocity within fractures increases, enhancing proppant erosion and resulting in significant proppant migration.
As shown in Figure 13, the actual equivalent flow velocity of Well X-1 closely follows the trend of the modeled critical velocity throughout the monitoring period. Notably, periods in which the actual velocity exceeds the critical threshold correspond to clear increases in sand production, demonstrating the model’s strong capability for field-level identification and prediction of sand risk. For example, from late October to early November 2024, a rapid rise in production rate pushed flow velocity above the modeled threshold, followed by a marked increase in sand production. Conversely, when flow velocity remained below the critical value, sand production significantly declined or ceased altogether, further validating the effectiveness of the threshold in constraining fracture stability. Overall, the correlation between the critical velocity curve and sand production behavior was strong, indicating that the proposed model not only reflects the underlying physical mechanisms of proppant transport within fractures, but also provides a reliable boundary reference for dynamic field operation and sand control management.
Although the laboratory-scale API cell tests represent a simplified model of fracture systems, the occurrence of secondary sand production observed under controlled conditions provides meaningful insights into field-scale phenomena. In practice, many gas wells experience renewed sand production after an initial period of stability, which is often attributed to operational cycles such as shut-in and restart. The delayed but sustained sand flow observed in the lab corresponds well with this behavior, indicating that the mechanisms captured in the experiment—particularly proppant bed instability under varying flow regimes—are relevant to actual field scenarios. This suggests that the critical velocity thresholds derived from controlled tests may serve as a reference for evaluating sand control risks during dynamic production phases.

5. Conclusions

This study investigated the critical sand production velocity under varying displacement fluid viscosities, closure stresses, and proppant placement methods using API conductivity cells to simulate the fracture environments of tight gas reservoirs. The experimental results revealed several key findings:
(1)
The displacement fluid viscosity significantly influences proppant flowback. When using high-viscosity slickwater (5 mPa·s), the critical sand production velocity decreased by 66% compared to formation water (1.15 mPa·s), indicating that increased viscosity helps stabilize the proppant pack.
(2)
Compared to mixed placement, pure coated proppant raised the critical velocity by nearly threefold, mainly due to enhanced proppant consolidation and interlocking under closure stress.
(3)
Excessive increases in flow rate after surpassing the critical threshold may lead to secondary sand production, especially in compacted proppant beds, which highlights the importance of flowback rate control during well cleanup.
(4)
Field cases from wells X-1 and X-2 in the Wenxing gas area showed that proppant detachment and crushing are the dominant causes of sand production, respectively. Model calculations matched field observations, validating the experimental findings and providing a practical reference for optimizing flowback strategies.
Overall, this research emphasizes the significance of fluid design, proppant selection, and operational management in mitigating early-stage sand production in tight gas wells. The findings offer theoretical and practical guidance for improving post-fracturing performance and reducing equipment erosion and operational risks in similar reservoir settings.

Author Contributions

Q.L. and X.Z. designed this study and wrote the manuscript; C.D. and K.D. conducted experiments; S.X. and H.T. analyzed the data; J.L. and R.S. revised the paper. All authors have read and agreed to the published version of the manuscript.

Funding

This research was funded by PetroChina Southwest Oil and Gas field Company.

Data Availability Statement

The data presented in this study are available on request from the corresponding author.

Conflicts of Interest

Author Kaixiang Di was employed by the Sinopec Southwest Oil & Gas Company. The remaining authors declare that the research was conducted in the absence of any commercial or financial relationships that could be construed as a potential conflict of interest.

References

  1. Liu, C.W. Research on Proppant Flowback and Control in Fracturing Gas Well Production. Master’s Thesis, Southwest Petroleum University, Chengdu, China, 2018. [Google Scholar]
  2. Lv, M.K.; Guo, T.K.; Chen, M.J.; Jia, X.; Yang, R.; Jia, H.; Qu, Z. Numerical Simulation of Proppant Transport and Backflow in Unconventional Reservoir Hydraulic Fractures Based on CFD-DEM. In Proceedings of the Geomechanics Symposium, Golden, CO, USA, 23 June 2024. [Google Scholar] [CrossRef]
  3. Zhang, K.S.; Chen, B.C.; Wu, Y.; Ma, X.X.; Mou, C.G.; Wang, W.X.; He, F.Y.; Wang, H.; Lv, Y.J. DEM-CFD Simulation of Proppant Particles Scoured by Fracturing Fluid Backflow. J. Eng. Thermophys. 2023, 44, 1009–1014. [Google Scholar]
  4. Li, D. Research on Productivity Prediction Based on Fracturing Tracer Flowback Law. Master’s Thesis, China University of Petroleum (East China), Qingdao, China, 2021. [Google Scholar]
  5. Wijaya, N.; Sheng, J. Effects of Imbibition and Compaction during Well Shut-in on Ultimate Shale Oil Recovery: A Numerical Study. SPE Reserv. Eval. Eng. 2021, 24, 859–873. [Google Scholar] [CrossRef]
  6. Liu, B.; Yao, J.; Sun, H.; Zhang, L. Effects of Natural Fracture Reopening on Proppant Transport in Supercritical CO2 Fracturing: A CFD-DEM Study. Geoenergy Sci. Eng. 2024, 238, 212906. [Google Scholar] [CrossRef]
  7. Cao, G.S.; Bai, Y.J.; Du, T.; Yang, T.; Yan, H. Study on Proppant Backflow Based on Finite Element Simulation. Xinjiang Pet. Geol. 2019, 40, 218–222. [Google Scholar] [CrossRef]
  8. Garagash, I.A.; Osiptsov, A.A.; Boronin, S.A. Dynamic Bridging of Proppant Particles in a Hydraulic Fracture. Int. J. Eng. Sci. 2019, 135, 86–101. [Google Scholar] [CrossRef]
  9. He, J.Y.; Okere, C.J.; Su, G.D.; Hu, P.; Zhang, L.; Xiong, W.; Li, Z. Formation Damage Mitigation Mechanism for Coalbed Methane Wells via Refracturing with Fuzzy-Ball Fluid as Temporary Blocking Agents. J. Nat. Gas Sci. Eng. 2021, 90, 103956. [Google Scholar] [CrossRef]
  10. Huang, J.; Hao, Y.; Settgast, R.R.; White, J.A.; Mateen, K.; Gross, H. Validation and Application of a Three-Dimensional Model for Simulating Proppant Transport and Fracture Conductivity. Rock Mech. Rock Eng. 2023, 56, 7091–7113. [Google Scholar] [CrossRef]
  11. Qu, Z.Q.; Wang, J.W.; Guo, T.K.; Shen, L.; Liao, H.; Liu, X.; Fan, J.; Hao, T. Optimization on Fracturing Fluid Flowback Model After Hydraulic Fracturing in Oil Well. J. Pet. Sci. Eng. 2021, 204, 108703. [Google Scholar] [CrossRef]
  12. Yang, P.; Zhang, S.C.; Zou, Y.S.; Zhong, A.; Yang, F.; Zhu, D.; Chen, M. Numerical Simulation of Integrated Three-Dimensional Hydraulic Fracture Propagation and Proppant Transport in Multi-Well Pad Fracturing. Comput. Geotech. 2024, 167, 106075. [Google Scholar] [CrossRef]
  13. Shor, R.J.; Sharma, M.M. Reducing Proppant Flowback from Fractures: Factors Affecting the Maximum Flowback Rate. In Proceedings of the SPE Hydraulic Fracturing Technology Conference, The Woodlands, TX, USA, 4 February 2014. [Google Scholar] [CrossRef]
  14. Guo, T.; Tang, S.; Liu, S.; Liu, X.; Xu, J.; Qi, N.; Rui, Z. Physical Simulation of Hydraulic Fracturing of Large-sized Tight Sandstone Outcrops. SPE J. 2021, 26, 372–393. [Google Scholar] [CrossRef]
  15. Zhao, Z.; He, Y.; Guo, J.; Liu, Z.; Zhou, X.; Zhang, R. Research on The Flowback Mechanism of Fiber-controlled Proppant Based on Fiber Strength Force. Phys. Fluids 2024, 36, 053319. [Google Scholar] [CrossRef]
  16. Wang, L.; Wen, H.; Zhang, S.C.; Ma, X.F.; Mou, J.Y. Experimental Research on Proppant Backflow Influenced by Effective Closure Pressure. Xinjiang Oil Gas 2020, 16, 54–58+7. [Google Scholar] [CrossRef]
  17. McLennan, J.; Walton, I.; Moore, J.; Brinton, D.; Lund, J. Proppant Backflow: Mechanical and Flow Considerations. Geothermics 2015, 57, 224–237. [Google Scholar] [CrossRef]
  18. Wu, T.; Song, M.M.; Yuan, X. Variation Laws of Proppant Backflow and Fracture Conductivity of Flowback After Fracturing in Shale Reservoir. Pet. Geol. Oilfield Dev. Daqing 2025, 44, 167–174. [Google Scholar] [CrossRef]
  19. Guo, J.C.; Tang, T.; Zhang, T.; Zhou, H.Y.; Liu, Y.X.; Li, M.F.; Yang, R.Y. Migration and Distribution Laws of Proppant in Multi-scale Fractures during Deep Shale Fracturing. Nat. Gas Ind. 2024, 44, 1–11. [Google Scholar] [CrossRef]
  20. Goel, N.; Shah, S.N. Experimental Investigation of Proppant Flowback Phenomena Using a Large Scale Fracturing Simulator. In Proceedings of the SPE Annual Technical Conference and Exhibition, Houston, TX, USA, 3 October 1999. [Google Scholar] [CrossRef]
  21. Guo, T.; Wang, Y.; Chen, M.; Qu, Z.; Tang, S.; Wen, D. Multi-stage and Multi-well Fracturing and Induced Stress Evaluation: An Experiment Study. Geoenergy Sci. Eng. 2023, 230, 212271. [Google Scholar] [CrossRef]
  22. Potapenko, D.; Theuveny, B.; Williams, R.; Moncada, K.; Campos, M.; Spesivtsev, P.; Willberg, D. State of the Art of Flow Management for Frac Plug Drillout and Flowback. In Proceedings of the SPE Annual Technical Conference and Exhibition, Calgary, AB, Canada, 23 September 2019. [Google Scholar] [CrossRef]
  23. Yin, H.C.; Xu, L.J.; Lyu, Z.Y.; Pang, J.; Tang, W.; Chen, Y.Y. Prediction Method of Critical Sand Production Rate from Shale Gas Wells. Spec. Oil Gas Reserv. 2023, 30, 135–140. [Google Scholar] [CrossRef]
  24. Zhang, F.S.; Zhu, H.Y.; Zhou, H.G.; Guo, J.; Huang, B. Discrete-Element-Method/Computational-Fluid-Dynamics Coupling Simulation of Proppant Embedment and Fracture Conductivity After Hydraulic Fracturing. SPE J. 2017, 22, 632–644. [Google Scholar] [CrossRef]
  25. Maity, D.; Ciezobka, J. An Interpretation of Proppant Transport Within the Stimulated Rock Volume at the Hydraulic-Fracturing Test Site in the Permian Basin. SPE Res. Eval. Eng. 2019, 22, 477–491. [Google Scholar] [CrossRef]
  26. Li, K.; Gao, Y.; Lyu, Y.; Wang, M. New mathematical models for calculating proppant embedment and fracture conductivity. SPE J. 2015, 20, 496–507. [Google Scholar] [CrossRef]
  27. Liang, X.Y.; Zhou, F.J.; Liang, T.B.; Huang, Y.; Wei, D.; Ma, S. The Effect of Combined Proppants upon the Fracture Conductivity in Tight Gas Reservoirs. Energy Rep. 2020, 6, 879–884. [Google Scholar] [CrossRef]
  28. Qi, Z.L.; Jiao, G.Y. Method to Predict Proppant Flowback in Fractured Gas Well. Procedia Environ. Sci. 2012, 12, 325–332. [Google Scholar] [CrossRef]
  29. Zoback, M.D. Reservoir Geomechanics; Cambridge University Press: Cambridge, UK, 2007. [Google Scholar] [CrossRef]
  30. Tang, H.; Winterfeld, P.H.; Wu, Y.S.; Huang, Z.-Q.; Di, Y.; Pan, Z.; Zhang, J. Integrated Simulation of Multi-stage Hydraulic Fracturing in Unconventional Reservoirs. J. Nat. Gas Sci. Eng. 2016, 36, 875–892. [Google Scholar] [CrossRef]
Figure 1. API conductivity test flowchart.
Processes 13 02278 g001
Figure 2. Experimental materials: (a) API cell; (b) proppants used in the experiment.
Processes 13 02278 g002
Figure 3. Experimental results of critical sand production flow velocity under various test conditions: (a) varying confining pressures (20–60 MPa); (b) different proppant placement configurations.
Processes 13 02278 g003
Figure 4. Proppant placement and distribution: (a) 4:1 mixed quartz/coated sand; (b) 4:1 layered placement; (c) pure coated sand; (d) mixed placement after test; (e) layered placement after test; (f) pure coated sand after test.
Processes 13 02278 g004
Figure 5. Sand production mass versus time under different conditions: (a) fluid viscosity comparison; (b) lithology comparison; (c) proppant placement method comparison.
Processes 13 02278 g005
Figure 6. Mechanism of secondary sand production: (af) temporal displacement process of proppant within the API cell.
Processes 13 02278 g006
Figure 7. Mineral content distribution by zone in the reservoirs of the Wenxing gas area.
Processes 13 02278 g007
Figure 8. Particle size distribution and mineral composition of the produced sand at different production stages in Well X-1: (a) mass fraction; (b) quartz; (c) K-feldspar.
Processes 13 02278 g008
Figure 9. Particle size distribution and mineral composition of the produced sand at different production stages in Well X-2: (a) mass fraction; (b) quartz; (c) K-feldspar.
Processes 13 02278 g009
Figure 10. Production and sand production timing statistics of Well X-1: (a) daily gas production; (b) daily water production; (c) tubing pressure.
Processes 13 02278 g010
Figure 11. Production and sand production timing statistics of Well X-2: (a) daily gas production; (b) daily water production; (c) tubing pressure.
Processes 13 02278 g011
Figure 12. Critical sand production fitting for Well X-1: (a) daily gas production volume; (b) gas production rate.
Processes 13 02278 g012
Figure 13. Critical sanding equivalent velocity of Well X-1.
Processes 13 02278 g013
Table 1. Reservoir conditions.
Well IDHorizonSUTop (m)Base (m)Net Pay (m)POR (%)PERM (mD)InterpretationGas Class
X-1Sha-14#2881.82905.115.68.20.350Pay ZoneII
Sha-15#2965.72989.21.27.30.247Marginal PayIII
Sha-11#3078.73097.913.58.30.237Pay ZoneII
X-2Sha-15#2929.42933.93.69.30.360Marginal PayIII
Sha-14# total2961.04055.6816.48.10.205Pay ZoneII
“#” Represents stratigraphic unit.
Table 2. Experimental proppant parameters.
Proppant TypesMeshRoundnessSphericityCrush Resistance Pressure (MPa)Apparent Density (g/cm3)Crush Rate
Quartz Sand Proppant70/1400.700.70352.62≤9%
Coated Quartz Sand Proppant40/700.700.80522.57≤9%
Table 3. Experimental fluid parameters.
Fluid TypeViscosity (mPa·s)PHDensity (g/cm3)
Slickwater5.06.81.01
Formation water1.158.31.02
Table 4. Experimental results.
Confining Pressure (MPa)Fluid Viscosity (mPa·s)Core TypePacking MethodCritical Velocity (m/s)
601.15Formation coreHybrid packing (4:1)0.0034
5Formation coreHybrid packing (4:1)0.0101
401.15Outcrop coreHybrid packing (4:1)0.0075
1.15Formation coreHybrid packing (4:1)0.0066
201.15Formation coreHybrid packing (4:1)0.0009
1.15Formation coreLayered packing (4:1)0.0017
1.15Formation core100% Coated sand0.0027
Disclaimer/Publisher’s Note: The statements, opinions and data contained in all publications are solely those of the individual author(s) and contributor(s) and not of MDPI and/or the editor(s). MDPI and/or the editor(s) disclaim responsibility for any injury to people or property resulting from any ideas, methods, instructions or products referred to in the content.

